Embed Size (px)
Citation preview

Diagnosis of Transitional Zone Prostate Cancer at
Multiparametric Prostate MRI: Pearls, Pitfalls and Mimics
Jinxing Yu, MD; Ann S. Fulcher, MD; Sarah G. Winks, MD; Mary A. Turner, MD; Ryan D. Clayton, MD; Michael
Brooks; Sean Li
Virginia Commonwealth UniversityRichmond, Virginia

Learning Objectives/Aims
Demonstrate important MR features of prostate cancer (PCa) of the transitional zone (TZ) at multiparametric MR (mp-MRI)
Discuss PCa mimics and other imaging pitfalls in the diagnosis of PCa of the TZ
Present pathologically proven examples
Emphasize MR imaging clues that may help to distinguish PCa of the TZ from its mimics
Introduction
Up to 30% of PCa may occur in the TZ TZ PCa substantially contributes to morbidity and mortality
from PCa
Many of the current clinical screening methods for PCa, such as PSA testing and TRUS-guided prostate biopsy, lack sensitivity and specificity TRUS-guided biopsy is particularly limited for diagnosis of PCa
in the TZ
In the past, MR imaging was considered inadequate in the evaluation of PCa of TZ
With recent advances in prostate mp-MRI, the accuracy in diagnosing TZ cancer has improved significantly

However, there are many diagnostic challenges we still encounter in our daily practice that compromise the accuracy of the diagnosis
These diagnostic challenges include PCa mimics and other imaging pitfalls such as:
Chronic prostatitis
Hypertrophic nodule in the TZ
Normal central zone displaced into the TZ
Hypertrophy of the anterior fibromuscular stroma
Well-defined PCa of the TZ
PCa arising from a hypertrophic nodule
PCa with high T2 signal intensity
PCa with normal ADC, DWI or DCE
Introduction

Outline
Pitfalls in the Diagnosis of PCa of the TZA. Well-defined PCa of the TZ
B. PCa arising from a hypertrophic nodule
C. PCa with high T2 signal intensity
D. PCa with normal ADC, DWI or DCE
Conclusion
Key Features of PCa of the TZ at mp-MRI (Pearls)
• MR Features of PCa Mimics with Clues for Differentiation from PCa
A. Chronic prostatitis
B. Hypertrophic nodule in the TZ
C. Normal central zone
displaced into the TZ
D. Hypertrophy of the anterior
fibromuscular stroma

I. Key Features of PCa of the TZ at Mp-MRI
Prostate cancer of the TZ is more challenging to detect and to diagnose because the MR signal intensity characteristics of the normal TZ and carcinoma often overlap
T2WI is the single most important sequence of mp-MRI in the diagnosis (Fig. 1 and 2 A)
The imaging features of TZ carcinoma (Fig. 1 and 2 A) at T2WI include Homogeneously low signal intensity Ill-defined margins Amorphous or lenticular shape Absence of a capsule Invasion of the anterior fibromuscular stroma Extension to the opposite side (Fig. 1 A)

I. Key Features of PCa of the TZ at Mp-MRI
Additional characteristic features of TZ carcinoma at mp-MRI include Diffusion restriction on DWI and ADC map (Fig. 1 B and Fig.
2 B, C) Usually necessary for the diagnosis
Asymmetric, rapid contrast wash-in and -out relative to the opposite side (Fig. 1 C and Fig. 2 D) Very helpful for the diagnosis
PCa of the TZ
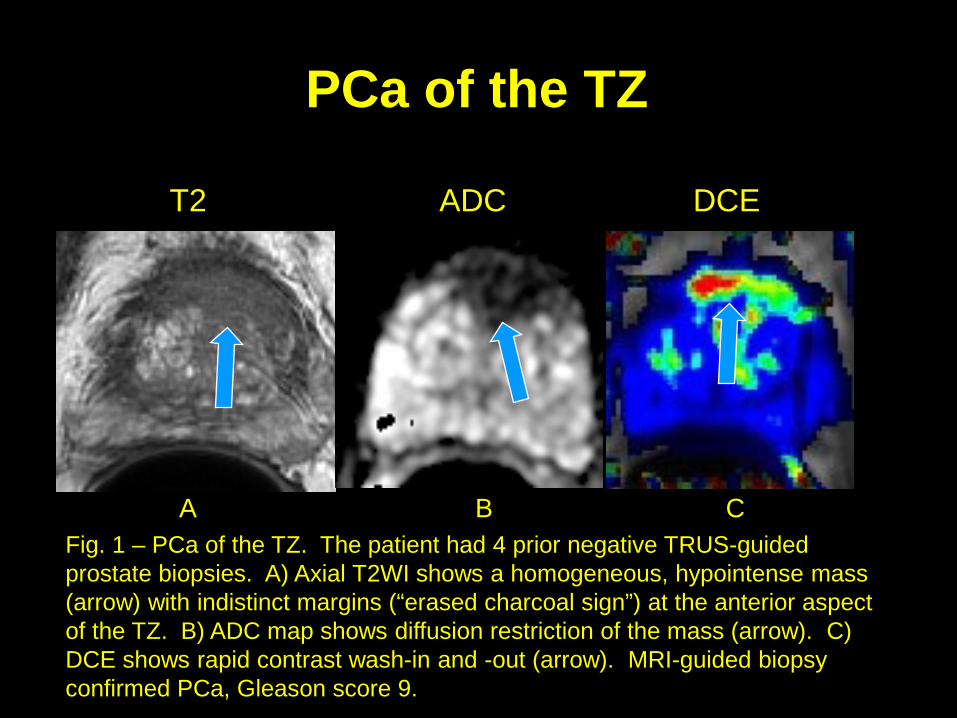
Fig. 1 – PCa of the TZ. The patient had 4 prior negative TRUS-guided prostate biopsies. A) Axial T2WI shows a homogeneous, hypointense mass (arrow) with indistinct margins (“erased charcoal sign”) at the anterior aspect of the TZ. B) ADC map shows diffusion restriction of the mass (arrow). C) DCE shows rapid contrast wash-in and -out (arrow). MRI-guided biopsy confirmed PCa, Gleason score 9.
A B C
T2 ADC DCE

PCa of the TZ
Fig. 4 – PCa in the right TZ. The patient had 5 prior negative TRUS-guided prostate biopsies. A) Axial T2WI shows a homogeneous, hypointense mass (arrow) with indistinct margins at the anterior aspect of the right TZ resulting in asymmetric contour (curved arrow). B) and C) DWI (b=1000) and ADC map show severe diffusion restriction of the mass (arrow). D) DCE shows contrast wash-in and -out of the mass (arrow). MRI-guided biopsy confirmed PCa, Gleason score 9.
A B C D
T2 DWI b=1000 ADC DCE

II. MR Features of PCa Mimics with Clues for Differentiation from PCa
A. Chronic Prostatitis
As in the peripheral zone (PZ), chronic prostatitis is common in the TZ
Chronic prostatitis in the TZ may present as diffuse or focal T2 hypointensity with diffusion restriction and abnormal enhancement, mimicking PCa (Fig. 3)
Key clues for differentiation from PCa include: Lack of mass effect or contour deformity by low T2 signal
region (geographic appearance) (Fig. 3 A)
Mild abnormality on DWI and ADC map (Fig. 3 C)
Relatively mild abnormal enhancement on DCE

A. Chronic Prostatitis
Axial T2 Coronal T2 ADC
Fig. 3 – Prostatitis in the left TZ mimicking PCa. A) and B) Axial and coronal T2WI show a hypointense area in the left TZ (arrow) at the base. C) ADC map shows the area with mildly low ADC value (arrow). MRI/US fusion-guided biopsy confirmed inflammation.
A B C

II. MR Features of PCa Mimics with Clues for Differentiation from PCa
B. Hypertrophic Nodule in the TZ
Hypertrophic nodules are present in the TZ in the majority of patients undergoing prostate MRI
Some of these nodules (stromal nodules) may demonstrate homogeneous T2 hypointensity, low ADC value and rapid contrast wash-in and -out, mimicking PCa (Fig. 4)
Key clues for differentiation from PCa include: Well-defined contour (Fig. 4 A)
Small internal foci of high T2 signal intensity
Mild diffusion restriction
Symmetric enhancement relative to the opposite side (Fig. 4 C)
T2 signal intensity lower than typically expected for PCa

B. Hypertrophic Nodule in the TZ
T2 DWI B=1000 DCE
Fig. 4 – Hypertrophic nodule in the right TZ mimicking PCa. A) Axial T2WI shows a hypointense nodule in the right TZ (arrow). B) DWI shows associated diffusion restriction (arrow). C) DCE demonstrates rapid contrast wash-in and -out of the area (arrow). Curved arrow indicates a similar enhancement in the left central gland. MRI/US-fusion guided biopsy confirmed benignity.
A B C
II. MR Features of PCa Mimics with Clues for Differentiation from PCa
C. Normal Displaced Central Zone
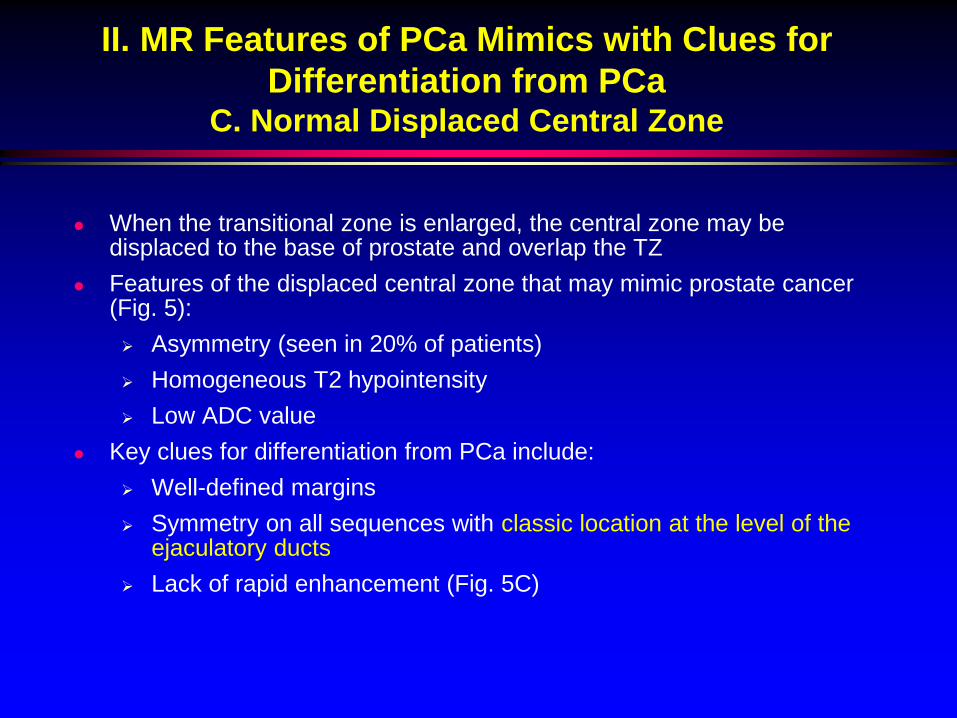
When the transitional zone is enlarged, the central zone may be displaced to the base of prostate and overlap the TZ
Features of the displaced central zone that may mimic prostate cancer (Fig. 5): Asymmetry (seen in 20% of patients) Homogeneous T2 hypointensity Low ADC value
Key clues for differentiation from PCa include: Well-defined margins Symmetry on all sequences with classic location at the level of the
ejaculatory ducts Lack of rapid enhancement (Fig. 5C)

Normal Displaced Central ZoneT2 Axial ADC DCE
A B C
Figure 5 - Displaced central zone at the right base TZ mimicking PCa. The patient had an elevated PSA of 7.2. A) Axial T2WI shows a hypointense area at the right base TZ (arrow) laterally at the level of the ejaculatory ducts (curved arrow). B) ADC map shows low ADC value in the area (arrow). C) DCE shows no significant contrast enhancement of the area (arrow). MRI/US-fusion guided biopsy confirmed normal prostate tissue.

II. MR Features of PCa Mimics with Clues for Differentiation from PCa
D. Hypertrophic Fibromuscular Stroma
• The anterior fibromuscular stroma is a band of fibromuscular tissue in the anterior aspect of the prostate
• The anterior fibromuscular stroma may be hypertrophic with low T2 signal intensity and diffusion restriction Asymmetry of the stroma may mimic PCa (Fig. 6)
• Key clues for differentiation from PCa include: Continuity with the anterior fibromuscular stroma
Location at or near the midline
Very low T2 signal intensity (Fig. 6 A)
Lack of enhancement

D. Hypertrophic Fibromuscular Stroma
Fig. 6. – Asymmetric and hypertrophic fibromuscular stroma mimicking PCa. The patient had elevated an PSA of 11. A) and B) Axial and coronal T2WI demonstrate a very low T2 soft tissue mass in the right anterior aspect of the TZ (arrow) off the midline. C) ADC map shows diffusion restriction (arrow) of the mass. C) DCE shows no enhancement of the mass. MRI guided biopsy confirmed benign fibromuscular stroma.
A B C D
Axial T2 Coronal T2 ADC DCE

III. Pitfalls in the Diagnosis of PCa of the TZA. Well-defined PCa of the TZ
Up to 50% of PCa of the TZ may present atypically on T2WI
In approximately 15% patients, PCa of the TZ may have well-defined margins in addition to diffusion restriction and abnormal enhancement due to compressed surrounding normal prostate tissue (Fig. 7)
Imaging clues for accurate diagnosis include: Featureless lesion (“erased charcoal sign”) Partially irregular margins on T2WI and ADC map Severe diffusion restriction on both DWI and ADC map (Fig. 7 B
and C) Increased enhancement relative to opposite side

A. Well-defined PCa of the TZ
Fig. 7 – PCa with well-defined margins. The patient had an elevated PSA of 5.9. A) Axial T2WI shows a homogeneous, hypointense mass (arrow) with well-defined margins (capsule) at the left TZ mimicking a benign nodule. B) and C) DWI (b=1000) and ADC map show severe diffusion restriction of the mass (arrow). D) DCE shows rapid contrast wash-in and -out of the mass (arrow). MRI/US fusion-guided biopsy confirmed PCa, Gleason score 9.
A B C D
T2 DWI b=1000 ADC DCE
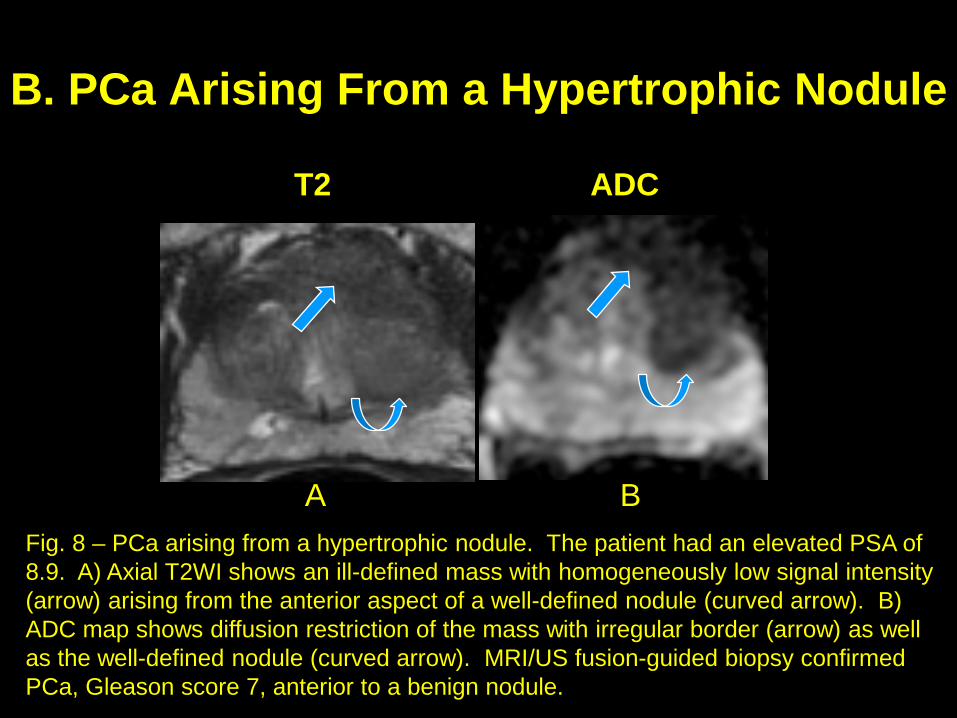
III. Pitfalls in the Diagnosis of PCa of the TZB. PCa arising from a hypertrophic nodule
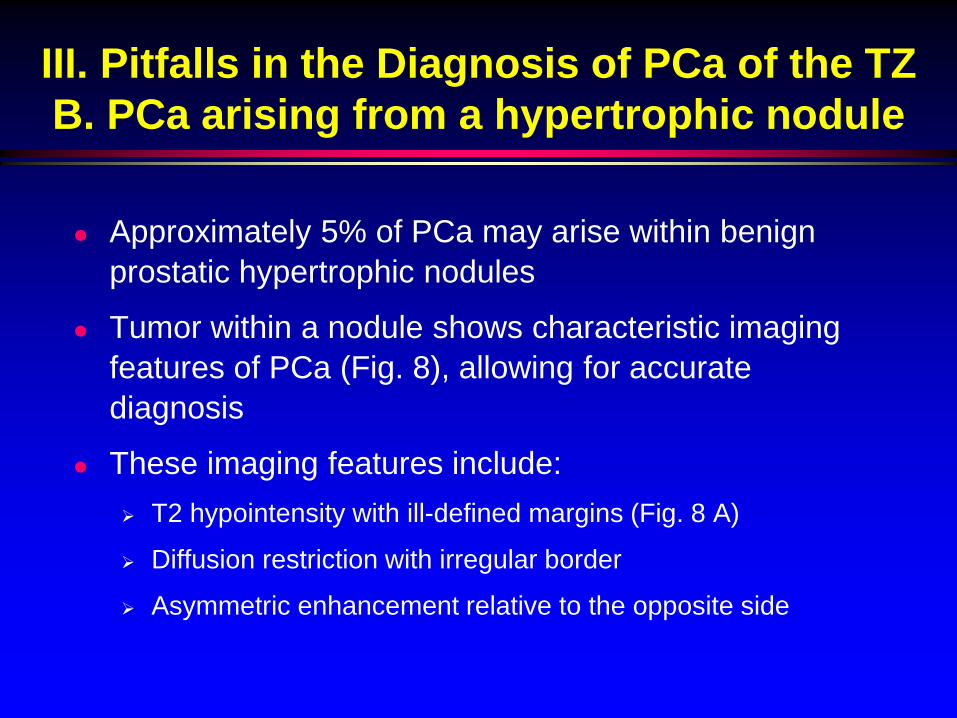
Approximately 5% of PCa may arise within benign prostatic hypertrophic nodules
Tumor within a nodule shows characteristic imaging features of PCa (Fig. 8), allowing for accurate diagnosis
These imaging features include: T2 hypointensity with ill-defined margins (Fig. 8 A)
Diffusion restriction with irregular border
Asymmetric enhancement relative to the opposite side
B. PCa Arising From a Hypertrophic Nodule
Fig. 8 – PCa arising from a hypertrophic nodule. The patient had an elevated PSA of 8.9. A) Axial T2WI shows an ill-defined mass with homogeneously low signal intensity (arrow) arising from the anterior aspect of a well-defined nodule (curved arrow). B) ADC map shows diffusion restriction of the mass with irregular border (arrow) as well as the well-defined nodule (curved arrow). MRI/US fusion-guided biopsy confirmed PCa, Gleason score 7, anterior to a benign nodule.
A B
T2 ADC

III. Pitfalls in the Diagnosis of PCa of the TZC. PCa with high T2 signal intensity
PCa typically presents as a T2 hypointense mass in the TZ
However, the T2 signal intensity of PCa in the TZ may sometimes be high rather than low (due to edema of the tumor) (Fig. 9)
In such cases, other characteristic imaging features of PCa are usually present, allowing for accurate diagnosis

C. PCa with High T2 Signal Intensity
Fig. 9 – PCa with high T2 signal intensity. The patient had an elevated PSA of 8. A) Axial T2WI shows a homogeneous mass (arrow) at the right apex with increased T2 signal relative to that of left apex (P). B) ADC map shows diffusion restriction of the mass (arrow). C) DCE shows rapid contrast wash-in and -out of the mass (arrow). Surgery confirmed PCa, Gleason score 8.
A B C
T2 ADC DCE
P
III. Pitfalls in the Diagnosis of PCa of the TZD. PCa with normal ADC, DWI or DCE
T2WI is the dominant sequence for diagnosis of PCa of the TZ
However, if the abnormality is only identified on T2WI without associated diffusion restriction, PCa is often not present (Fig. 10)
In addition to abnormalities on T2WI, diffusion restriction, seen either on ADC map or DWI, is often necessary to make the diagnosis of PCa (Fig. 11)
Abnormal DCE is not necessary for the diagnosis of PCa (Fig. 11 D) but increases confidence in the diagnosis of PCa

D. Area with abnormal T2 and DCE but mild abnormality on ADC – not PCa
Fig. 10 – Hypertrophic nodule, not PCa. The patient had an elevated PSA of 25. A) Axial T2WI shows a homogeneous, hypointense lesion (arrow) with ill-defined margins at the right TZ mimicking PCa. B) ADC map shows only milddiffusion restriction of the nodule (arrow), and DWI is normal (not shown). C) DCE shows rapid contrast wash-in and -out of the nodule (arrow). MRI/US fusion-guided biopsy confirmed benignity.
A B C
T2 ADC DCE

D. PCa with abnormal ADC but normal DWI and DCE
Fig. 11 – PCa only seen on T2 and ADC map. The patient had an elevated PSA of 7.5. A) Axial T2WI shows a homogeneous, hypointense mass (arrow) with ill-defined margins in the left TZ. B) ADC map shows diffusion restriction of the mass (arrow). C) and D) DWI and DCE show normal appearance of the mass (arrow). MRI/US fusion-guided biopsy confirmed PCa, Gleason score 7.
A B C D
T2 ADC DWI b=1000 DCE

IV. Conclusion
Difficulty in achieving high accuracy in the diagnosis of PCa in the TZ is well known due to the described PCa mimics and other imaging pitfalls
Mp-MRI has been proven to be accurate in prostate imaging Combining all diagnostic information from T2WI, DWI and DCE is important
for accurate diagnosis
Knowledge of and attention to the imaging features of PCa mimics and other imaging pitfalls can allow for definitive diagnosis or narrowed differential diagnosis
Accurate diagnosis is important for clinical management and will avoid unnecessary intervention

References
Oto A, Kayhan A, Jiang Y, et al. Prostate cancer: differentiation of central gland cancer from benign prostatic hyperplasia by using diffusion weighted and dynamic contrast-enhanced MR imaging. Radiology 2010; 257:715-723.
Yu J, Fulcher AS, Turner MA, Cockrell CH, Cote EP, Wallace TJ. Prostate cancer and its mimics at multiparametric prostate MRI. Br J Radiol. 2014; 87(1037):20130659. doi:10.1259/bjr.20130659.
Akin O, Sala E, Moskowitz CS, et al. Transition zone prostate cancers: features, detection, localization, and staging at endorectal MR imaging. Radiology 2006; 239:784-792.
Yoshizako T, Wada A, Hayashi T, et al. Usefulness of diffusion-weighted imaging and dynamic contrast-enhanced magnetic resonance imaging in the diagnosis of prostate transition-zone cancer. Acta Radiol 2008; 49(10):1207-1213.
Noworolski SM, Vigneron DB, Chen AP, Kurhanewicz J. Dynamic contrast-enhanced MRI and MR diffusion imaging to distinguish between glandular and stromal prostatic tissues. Magn Reson Imaging 2008; 26(8):1071-1080.