Embed Size (px)
Citation preview
Diabetes Mellitus II(Acute and chronic complications, long-
term treatment); Hypoglycemia
National Centre for Diabetes Care
Semmelweis University Faculty of Medicine,1st Department of Medicine
Budapest, 9th October, 2017
Ádám Gy. Tabák

Critical states in diabetes
o Hypoglycemia
o Diabetic ketoacidosis
o Hyperosmolar hyperglycemic state
o Lactic acidosis
Critical states in diabetes
o Hypoglycemia
o Diabetic ketoacidosis
o Hyperosmolar hyperglycemic state
o Lactic acidosis
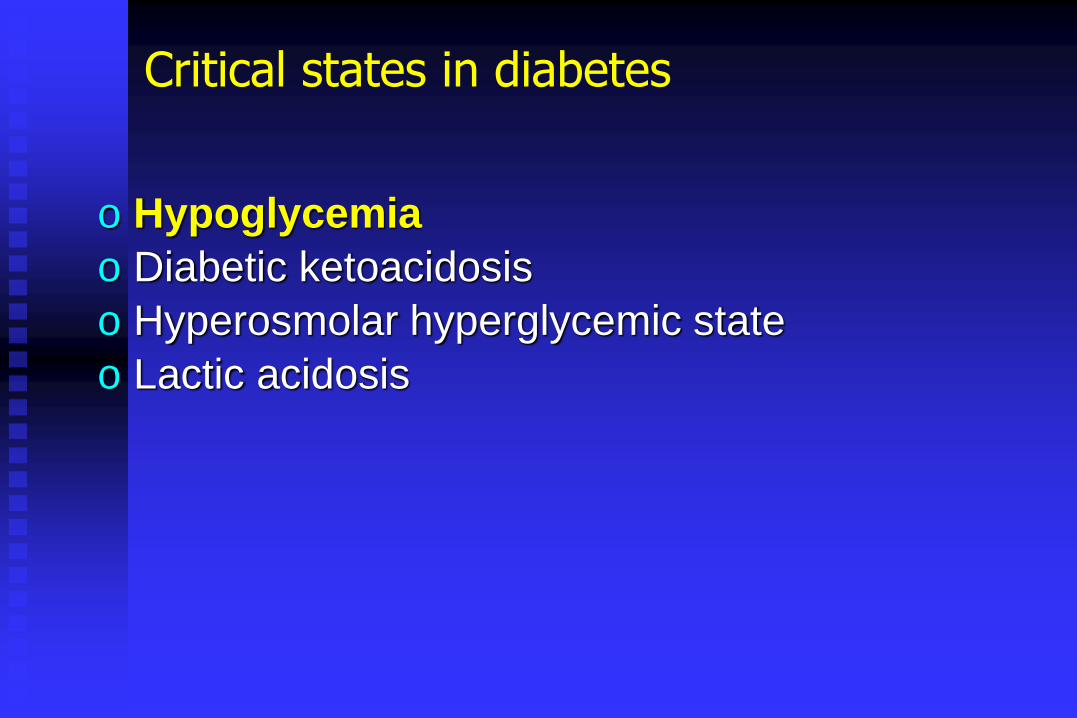
Hypoglycemia – definition
o Blood glucose content fals < 3 mmol/l (the blood glucose value that could be reached during an extended fasting in healthy subjects)
o If the blood glucose is < 3 mmol/l and no symptoms are present – biochemical hypoglycemia

Hypoglycemia – autonomic symptoms
o palpitations
o tremor
o anxiety
o sweating
o hunger
o nausea
o paresthesia

Hypoglycemia – symptoms of neuroglycopenia
o decreased mental concentration
o headache
o weakness
o fatigue
o drowsiness
o heat sensation
o shivers, cold sensation, chills
o blurred vision, dizziness
o aggression
o disorientation
o convulsion
o coma

Hypoglycemia – frequency
o Severe hypoglycemia with loss of consciousness -10% (third party help is required 2-25% / yr)
o Conventional insulin treatment – mild - 1 / week(severe - 10% / year)
o Intensive insulin treatment – mild - 2 / week(severe - 25% / year)
o Sulfanilurea – mild - 20% / 6 months (severe – 0.2-4.2% /yr, 4-10% deaths)

Healthy
Insulin
(4.6 ± 0.2 mmol/l)
Blood glucose Blood glucose
glukagon
(3.8 ± 0.1 mmol/l)
adrenalin
(3.8 ± 0.1 mmol/l)
(glucose uptake in the brain -3.7 mmol/l)
growth hormone (3.7 ± 0.1 mmol/l)cortisol (3.2 ± 0.2 mmol/l)
(symptoms – 3.0 mmol/l; neuroglykopenia -2.7 mmol/l)
glucose autoregulation
(<2.8 >1.7 mmol/l)
other hormones,
neurtransmitters, other substrates
No / inadequate
insulin
Blood glucose Blood glucose
glukagon
adrenalin
?
DM1T
Counterregulatory response in healthy people and in type 1 diabetes

Type 1 diabetes patients are prone to hypoglycemia
o Insulin autoregulation is lost – the decrease of injected insulin is related to insulin pharmacokinetics
o The production of counterregulatory hormones is disturbed
o After 2 years glucagon response is decreased/absent
o Cathecolamin secretion is decreased
o Secretion of growth hormone and cortisol is decreased
o Neuroglycopenic symptoms are decreased/lost
o Repeat hypoglycemic events could cause hypoglycemia unawarness

Risk factors of hypoglycemic events
o Insulin overdose (timing, type of insulin)
o Carbohydrate intake (lower carbohydrate content/ skipped meal)
o Increased glucose utilisation (physical activity)
o Decreased endogenous glucose production (alcohol consumption, drugs)
o Increase insulin sensitivity (intensive insulin secretion, hypothyreoidism)
o Decreased insulin excretion (renal failure)
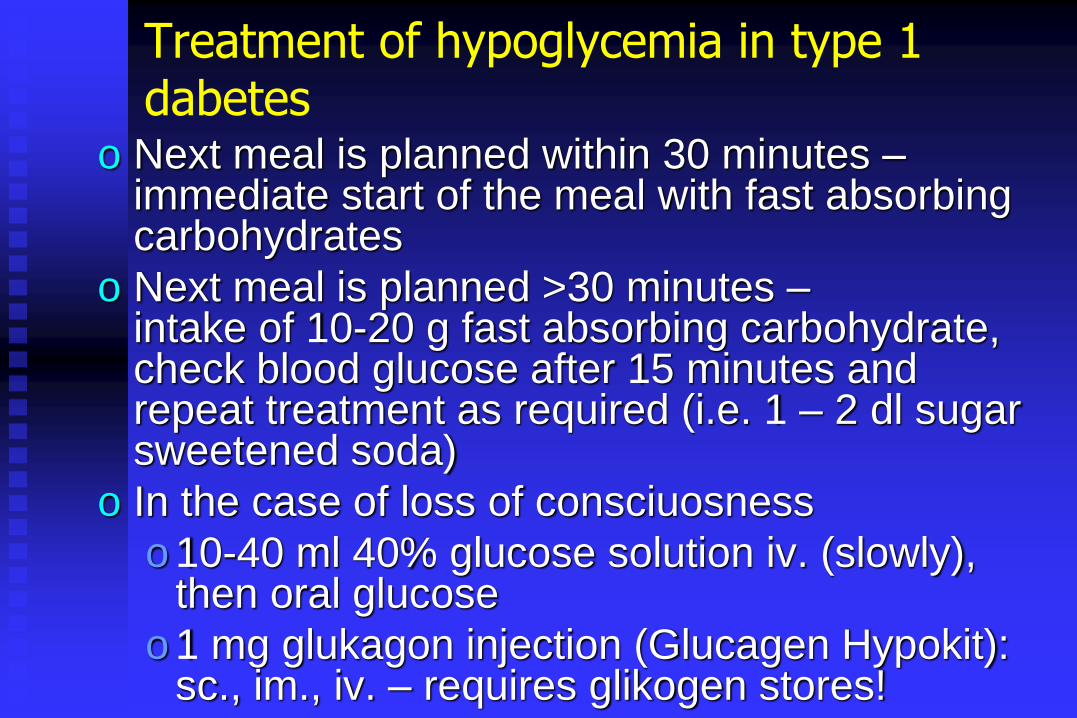
Treatment of hypoglycemia in type 1 dabetes
o Next meal is planned within 30 minutes –immediate start of the meal with fast absorbing carbohydrates
o Next meal is planned >30 minutes –intake of 10-20 g fast absorbing carbohydrate, check blood glucose after 15 minutes and repeat treatment as required (i.e. 1 – 2 dl sugar sweetened soda)
o In the case of loss of consciuosness
o 10-40 ml 40% glucose solution iv. (slowly), then oral glucose
o 1 mg glukagon injection (Glucagen Hypokit): sc., im., iv. – requires glikogen stores!

Treatment of hypoglycemia in type 2 diabetes
o If it is related to insulin treatment – as in T1DM
o Oral agent that can cause hypoglycemia (SU, glinid)
o continuous oral feeding
o acarbose treatment- glucose!
o loss of consciousness 10-40 ml 40% glucose solution iv. (slowly) then 5% glucose solution for an extended time period with oral feeding!
o glukagont is not recommended! – it can induce repeated events
o diazoxide, steroid

Critical states in diabetes
o Hypoglycemia
o Diabetic ketoacidosis
o Hyperosmolar hyperglycemic state
o Lactic acidosis
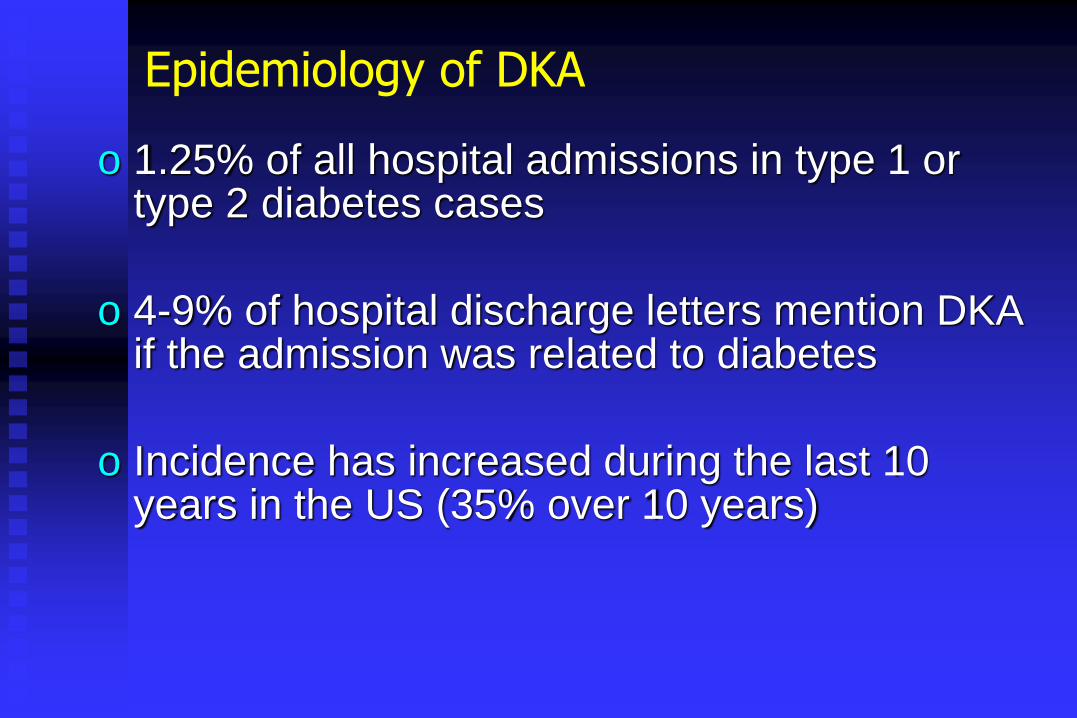
Epidemiology of DKA
o 1.25% of all hospital admissions in type 1 or type 2 diabetes cases
o 4-9% of hospital discharge letters mention DKA if the admission was related to diabetes
o Incidence has increased during the last 10 years in the US (35% over 10 years)

Epidemiology of DKA
o Prognosis
o in hospital mortality of DKA< 5 %, most recently <1%
o the most frequent cause of death among children and adolescents with T1DM
o most important prognostic factors
oolder age
osevere underlying / triggering illness
osevere hypothermia

Biochemical causes of ketosis
o Glucose deficiency (fasting ketosis): normal glucose
o Absolute or relative insulin deficiency: elevated glucose
o Counterregulatory hormones / insulin(stress-related ketosis – alcohol induced ketoacidosis)
elevated/normal/decreased glucose

Pathogenesis of DKA
Kitabchi AE et al Diabetes Care 32:1335-1343, 2009

Causes of DKA
o Insulin deficiency(skipped injection, newly manifested diabetes, pump treatment – tube obstruction)
o Acute stress(AMI, stroke, infection, premenstrual period, acute pancreatitis)
o Illicit drugs(cocaine, „disco-drugs”: ecstasy)
o Non-compliance

Diagnosis of DKA
o elevated blood glucose, usually >13.9 mmol/l
o arterial blood pH < 7.35
o plasma bicarbonate < 15 mmol/l
o increased anion-gap (Se Na – [Se Cl + Se bicarbonate])
o se ketone bodies > 5 mmol/l
o elevated amylase levels
o elevated serum creatinine (spurious due to ketone bodies)
o non-specific elevation of WBC count (10 000-15 000/μl)

Clinical picture
o dry, warm skin, decreased skin turgoro polyuria, polydypsia, weight losso abdominal pain and tenderness
(differentiate from acute abdomen!)o Kussmaul-breathing – smell of aceton
(fruitlike)o symptoms of dehydration
(elevated heart rate, hypotension, decreased blood flow)
o normal or decreased body temperature
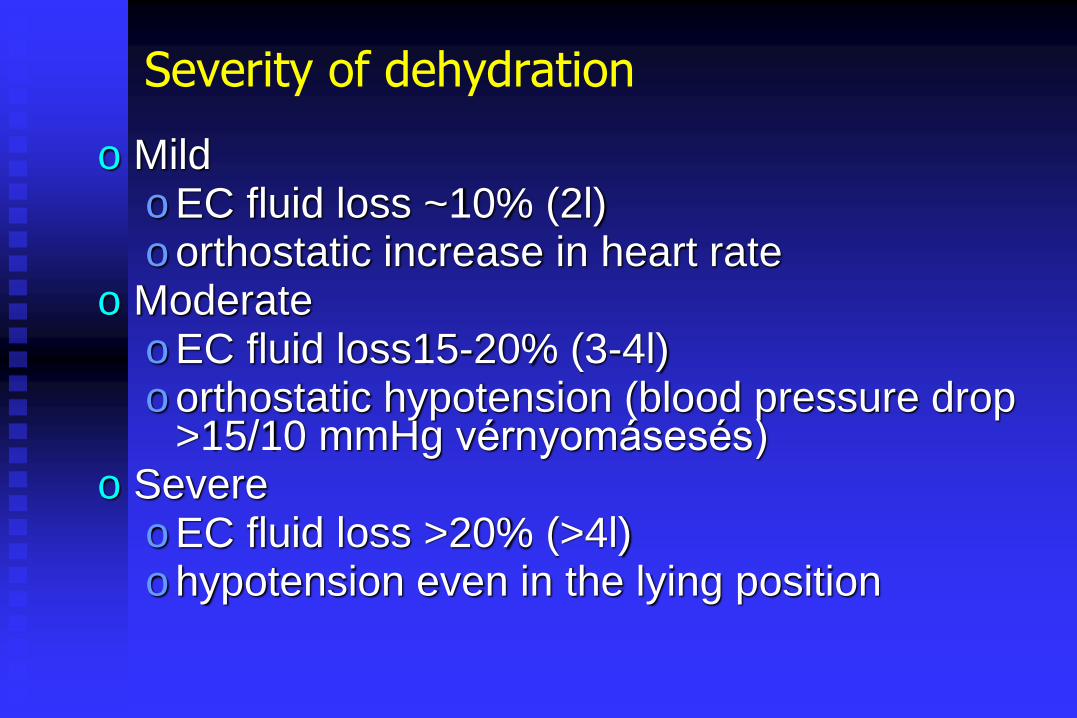
Severity of dehydration
o Mildo EC fluid loss ~10% (2l)o orthostatic increase in heart rate
o Moderateo EC fluid loss15-20% (3-4l)o orthostatic hypotension (blood pressure drop
>15/10 mmHg vérnyomásesés)o Severe
o EC fluid loss >20% (>4l)o hypotension even in the lying position

Symptoms of DKA
o acute dilatative gastritis, erosive gastritis
o hematemesis, coffee-ground emesis
o cerebral edema
o Lethargy, somnolence, coma with or without neurological symptoms
o hyperkalemia cardiac arrest
o hipokalemia arrhytmia
o fever

Differential diagnosis of DKA
Kitabchi AE et al Diabetes Care 24:131-153, 2001

Basic aspects of DKA treatment
o fluid
o ions(Na, K, Cl, PO3)
o insulin
o pH-correction
o antibiotics (skin test)
o cardiac support
o prevention of thromboembolic events
o secure iv. access
o urinary catheter
o nasogastric tube
infusion pump! / iv bolus
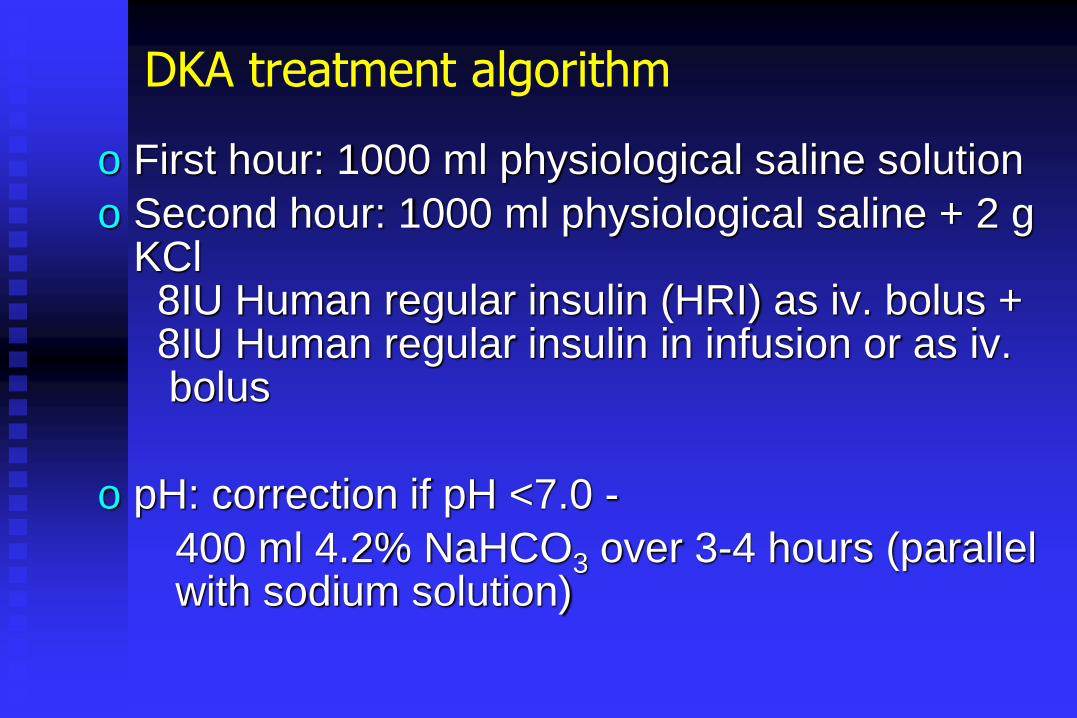
DKA treatment algorithm
o First hour: 1000 ml physiological saline solution
o Second hour: 1000 ml physiological saline + 2 g KCl8IU Human regular insulin (HRI) as iv. bolus + 8IU Human regular insulin in infusion or as iv.bolus
o pH: correction if pH <7.0 -
400 ml 4.2% NaHCO3 over 3-4 hours (parallel with sodium solution)
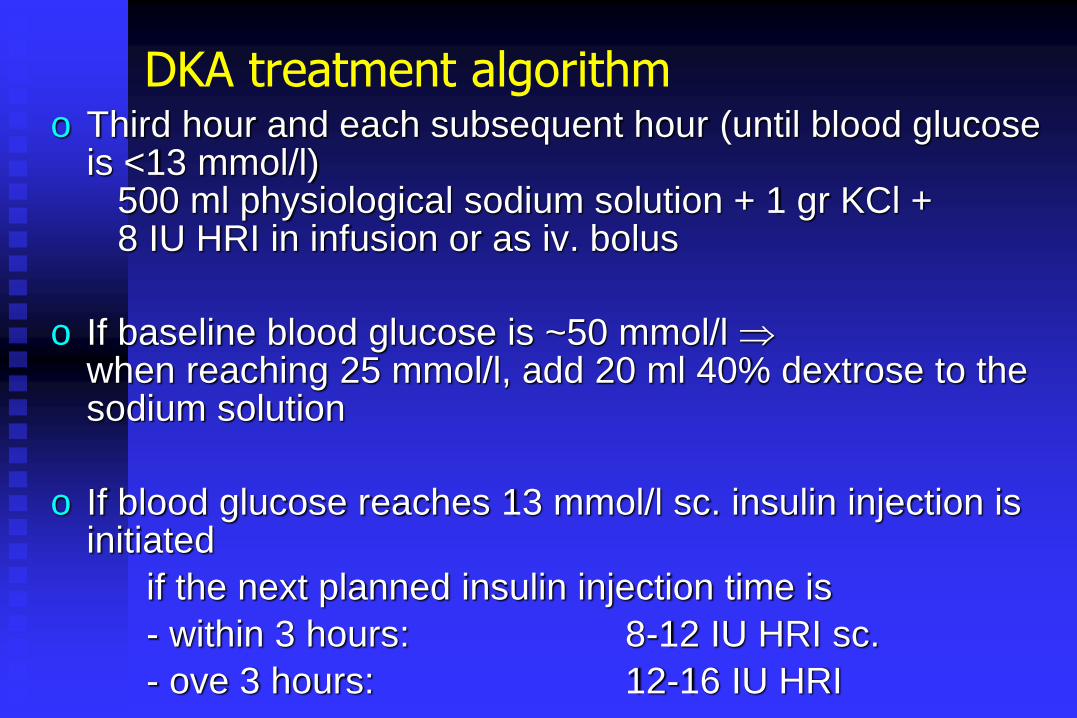
DKA treatment algorithmo Third hour and each subsequent hour (until blood glucose
is <13 mmol/l)500 ml physiological sodium solution + 1 gr KCl +8 IU HRI in infusion or as iv. bolus
o If baseline blood glucose is ~50 mmol/l when reaching 25 mmol/l, add 20 ml 40% dextrose to the sodium solution
o If blood glucose reaches 13 mmol/l sc. insulin injection is initiated
if the next planned insulin injection time is
- within 3 hours: 8-12 IU HRI sc.
- ove 3 hours: 12-16 IU HRI

Insulin treatment regimen following a DKA
5 times daily human regular insulin:
o 6.00: if blood glucose <7 mmol/l: 20 IU sc .
7-9 mmol/l: 24 IU sc.
>9 mmol/l : 28 IU sc.
o 12.00 :10-12 IU sc.
o 17.00 :16-20 IU sc.
o 22.00 :10-12 IU sc.
o 03.00 : 3-6 IU sc.
Recommended diet: 6.30 30g, 9.00 20g,12.15 50g, 14.45 20g, 17.15 40g, 19.45 20g, 22.15 15g CH

Critical states in diabetes
o Hypoglycemia
o Diabetic ketoacidosis
o Hyperosmolar hyperglycemic state
o Lactic acidosis

The epidemiology of HHS
o Mentioned on the discharge letter of hospitalised diabetic patients in <1%
o Mortality 15-20%
o Most important prognostic factors
oolder age
osevere underlying / triggering illness
osevere hypothermia

Pathophysiology of HHS
o not yet fully explored
o underlying abnormalities:
o excessive hyperglycemia in the extracellular space
o increased hepatic glucose production
o decreased peripheral glucose utilisation
o although intrecellular, intramitochondrial processes are disturbed, the level of ketone bodies is not elevated,because absolute insulin deficiency is not present and the level of counterregulatory hormones is less pronounced thus free fatty acid mobilisation is limited

Pathogenesis of HHS
o Early stages elevated sodium levelso hyperglycemia and hyperlipidemia cause
pseudohypernatremiao In later stages intracellular hyperhydration
develops that causes truly elevated sodiumlevelso osmotic diuresis related to hyperglycemia
causes water loss that worsens sodium levelso Mental status:
early stages cerebral dehydration causes confusion that temporarily improves then cerebral edema develops and mental status deteriorates to coma

Causes of HHS
o acute illness
o excessive intake of sugar sweetened beverages
o certain drugs (antipsychotics, steroids)

Diagnosis
o Blood glucose >40 mmol/l
o Osmolality >340 mosmol/l
Calculation of osmolality:Se osmolality (mosmol/l) = (SeNa + SeK(mmol/l))X2 + blood glucose (mmol/l) +urea (mmol/l)
BUN is also elevated due to prerenal asotemia
Spuriously elevated amylase and transaminases
o Effective osmolality >320 mosmol/l
(SeNa + SeK (mmol/l))X2 + blood glucose (mmol/l)

Clinical picture of HHS
o slow development of signs and symptoms
o extreme hyperglycemia may develop
o polyuria, polydypsia
o slowly worsening mental status
o progressive signs of dehydration
o prerenal uremia
o convulsions may develop

Therapy of HHS
o No clear cut recommendation
o Insulin treatment: similarly to DKA
o slow continuous decrease of blood glucose is recommended (4-5 mmol/l per hour)
o aim to reach 14 mmol/l during the first day
o after successful treatment some patients will not require insulin treatment

Outlineo Microvascular diabetes complications
o Retinopathyo Neuropathy
oautonomicosensory
o Nephropathyo Prevention of microvascular complications
o Macrovascular diabetes complicationso Ischemic heart diseaseo Strokeo Heart failureo Periferal vascular disease

Clinical Impact of Diabetes Mellitus
Diabetes
The leading cause of new cases of end stage renal
disease
A 2- to 4-fold
increase in cardio-
vascular mortality
The leading cause of new
cases of blindness in
working-aged adults
The leading cause of
nontraumatic lower
extremity amputations

Microvascular complications

Diabetic retinopathy

Retinopathy in Adults not Known to Have Diabetes Rationale for Diagnostic Criteria for DiabetesGlycemic Values in Deciles of Populations
Report of the Expert Committee on the Diagnosis and Classification of Diabetes Mellitus. Diabetes Care 1999;22(Supp 1):S5-S19.
FPG
2hPG
HbA1c
Ret
inop
ath
y (
%)
15
10
5
0
US (NHANES III)
42- 87- 90- 93- 96- 98- 101- 104- 109- 120-
34- 75- 86- 94- 102- 112- 120- 133- 154- 195-
3.3- 4.9- 5.1- 5.2- 5.4- 5.5- 5.6- 5.7- 5.9- 6.2-
FPG (mg/dL)
2hPG (mg/dL)
HbA1c (%)
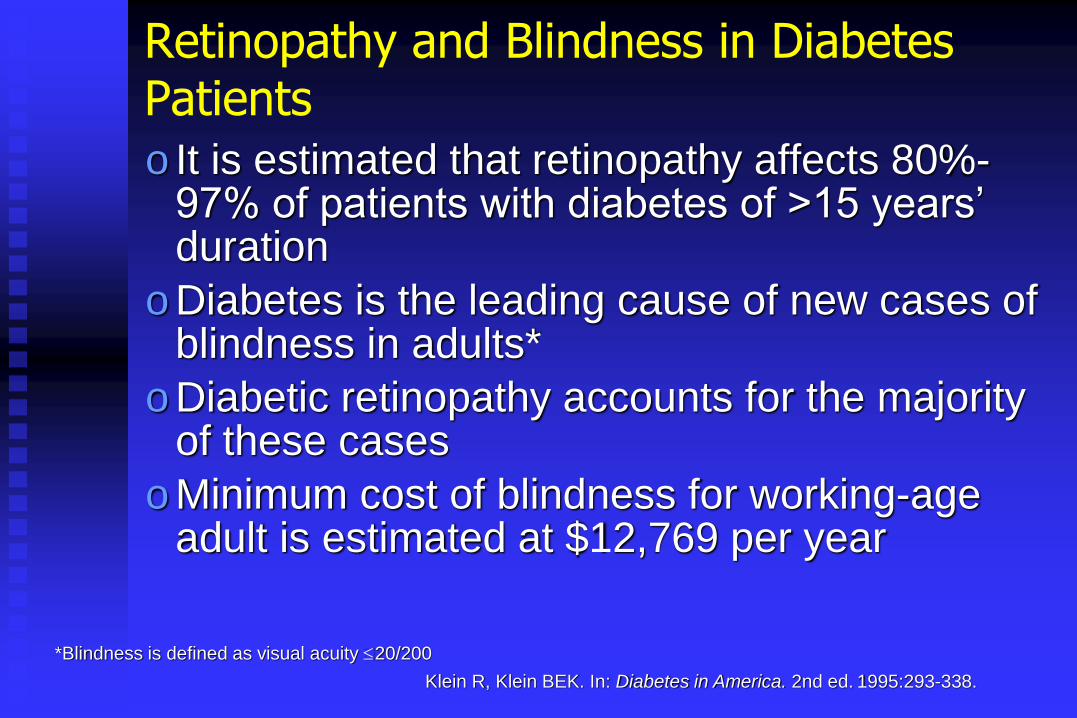
Retinopathy and Blindness in Diabetes Patients
o It is estimated that retinopathy affects 80%-97% of patients with diabetes of >15 years’ duration
o Diabetes is the leading cause of new cases of blindness in adults*
o Diabetic retinopathy accounts for the majority of these cases
o Minimum cost of blindness for working-age adult is estimated at $12,769 per year
Klein R, Klein BEK. In: Diabetes in America. 2nd ed. 1995:293-338.
*Blindness is defined as visual acuity 20/200

Diabetic retinopathy
None Non-Proliferative Proliferative
Mild Moderate Severe
ETDRS: Early Treatment Diabetic Retinopathy Study

Maculopathy
Diabetic maculopathy
None Maculopathy(hard exsudate)
Mild Moderate Severe

44
• Retinal thickening in the area around the
fovea within 500 microns
• Hard exsudates in the area around the
fovea within 500 microns with oedema
• Retinal thickening at least one papilla in
diameter around the fovea within 1
papilla distance
Definition of „clinically significant”
macula oedema (ETDRS)
ETDRS: Early Treatment Diabetic Retinopathy Study
45
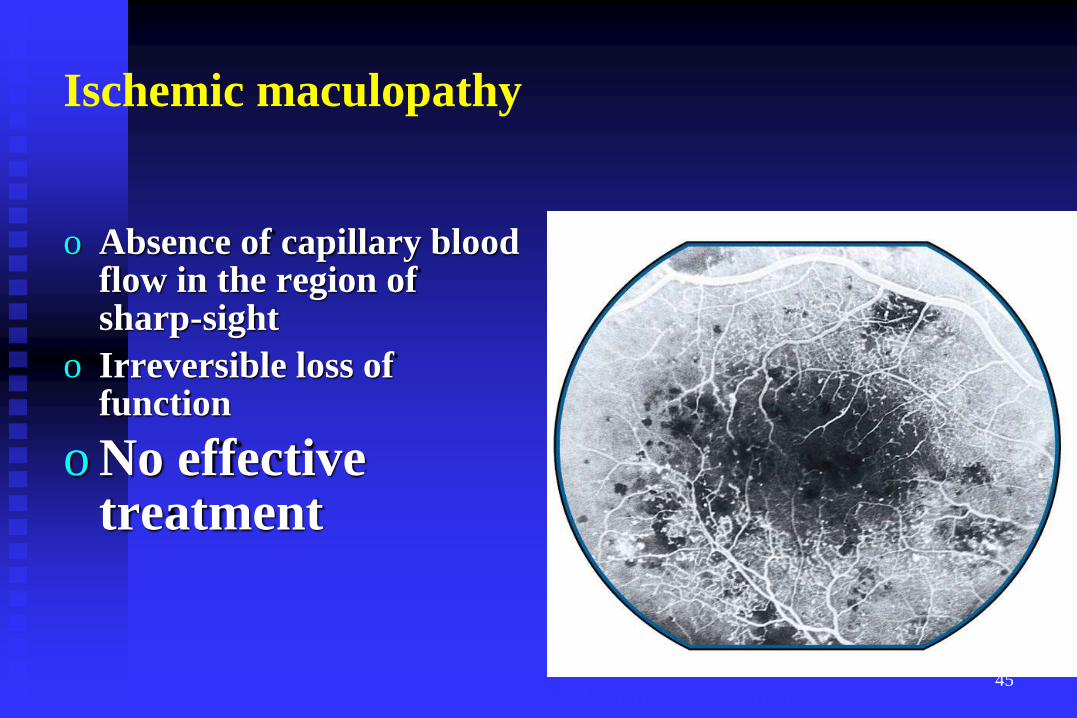
Ischemic maculopathy
o Absence of capillary blood flow in the region of sharp-sight
o Irreversible loss of function
o No effective treatment
(Fluorescein angiographia)


Diabetic neuropathy

Sensory neuropathy

Foot Ulcers and Amputations in Diabetes Patients
o >50% of lower limb amputations in the US
o 67,000/yr (1993 -1995)
o Foot ulcers occur in 15% of diabetes patients over a lifetime
o Cost of diabetes-related amputation: $27,000
National Diabetes Fact Sheet. November 1, 1997:1-8.
Reiber GE et al. In: Diabetes in America. 2nd ed. 1995:409-428.
Boulton AJM et al. Lancet 2005; 366: 1719-1724.
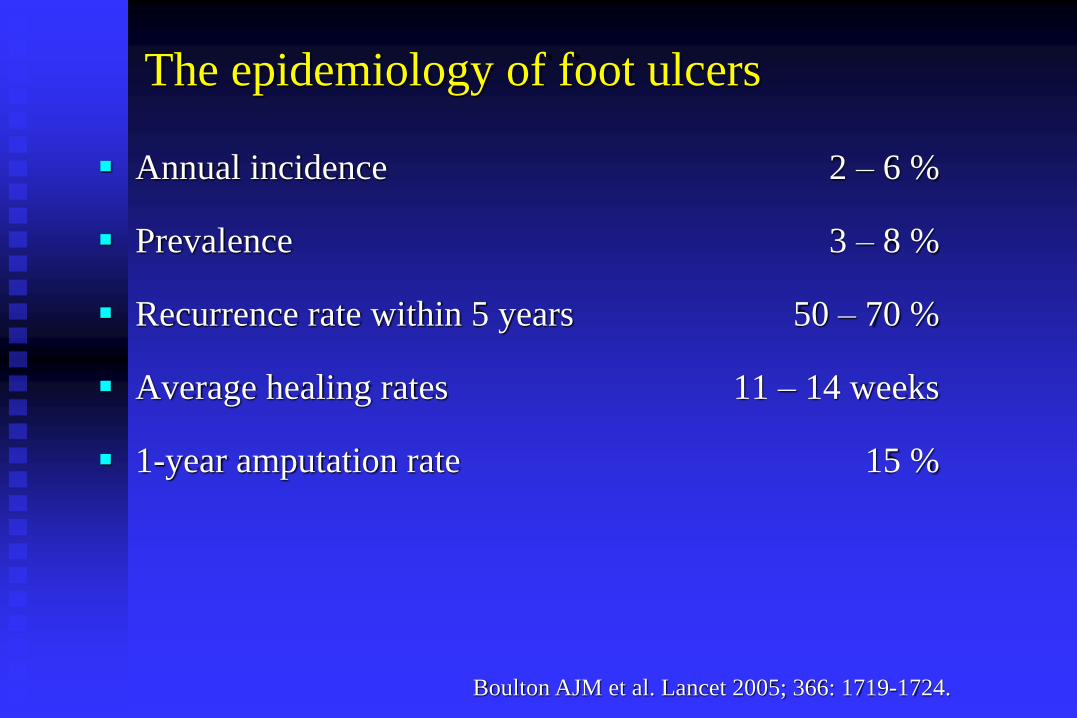
The epidemiology of foot ulcers
Annual incidence 2 – 6 %
Prevalence 3 – 8 %
Recurrence rate within 5 years 50 – 70 %
Average healing rates 11 – 14 weeks
1-year amputation rate 15 %

Relationship Between Hyperglycemia and Neuropathyo Slowly progressive disease preferentially affecting the
long axons
o 30% to 40% of all diabetics are symptomatic
o 60% have neuropathy (symptomatic or asymptomatic)
o Peripheral symptoms:
o numbness/tingling in the feet, cramps, sensitivity/ insensitivity to touch, loss of balance/coordination
o Autonomic symptoms:
o urinary incontinence, loss of sexual response, gastric stasis, orthostatic hypotension
o Exact etiology unknown
Diabetic Neuropathy. July 1995 (updated 1996). NIDDK publication NIH 93-3185.
Vinik AI et al. In: Diabetes Mellitus. 1996:737-751.

“Positive“ Symptoms
• Persistent burning or dull pain
• Paroxysmal electric, shooting, stabbing pain
• Dysesthesias (painful paresthesias)
• Evoked pain (hyperalgesia, allodynia)
• Numbness
“Negative“ Symptoms (deficits)
• Hypoalgesia, analgesia
• Hypoesthesia, anesthesia
• Thermal, vibration, pressure sensation, reflexes
A paradox of diabetic neuropathy
Hyperalgesia Allodynia
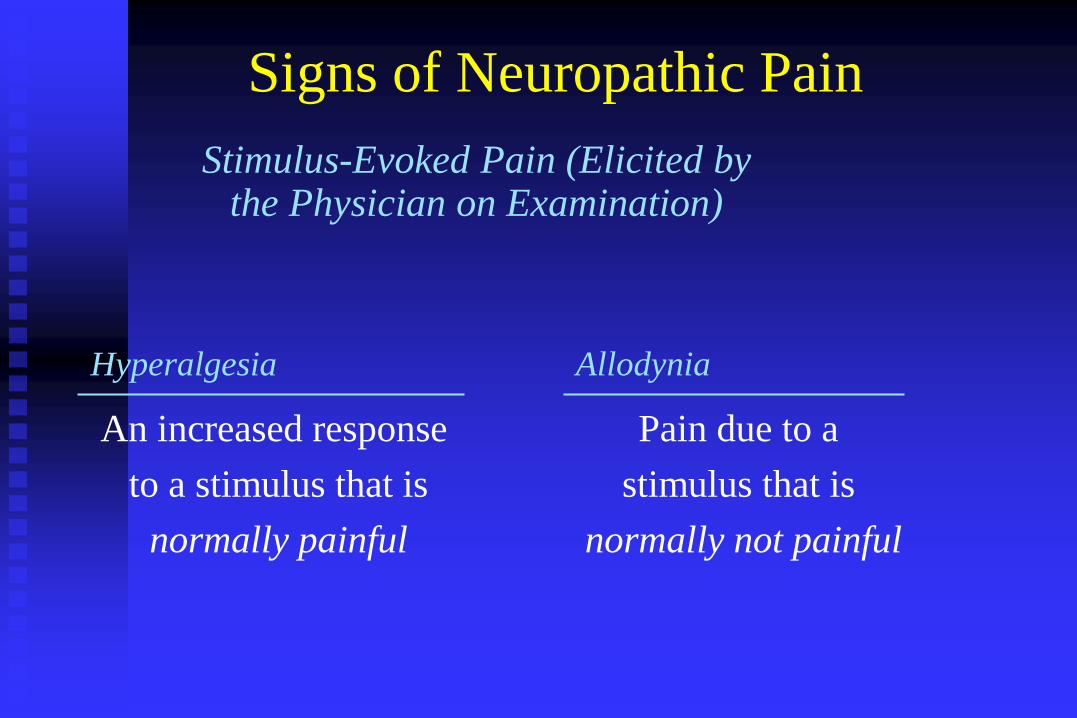
Signs of Neuropathic Pain
An increased response
to a stimulus that is
normally painful
Pain due to a
stimulus that is
normally not painful
Stimulus-Evoked Pain (Elicited bythe Physician on Examination)
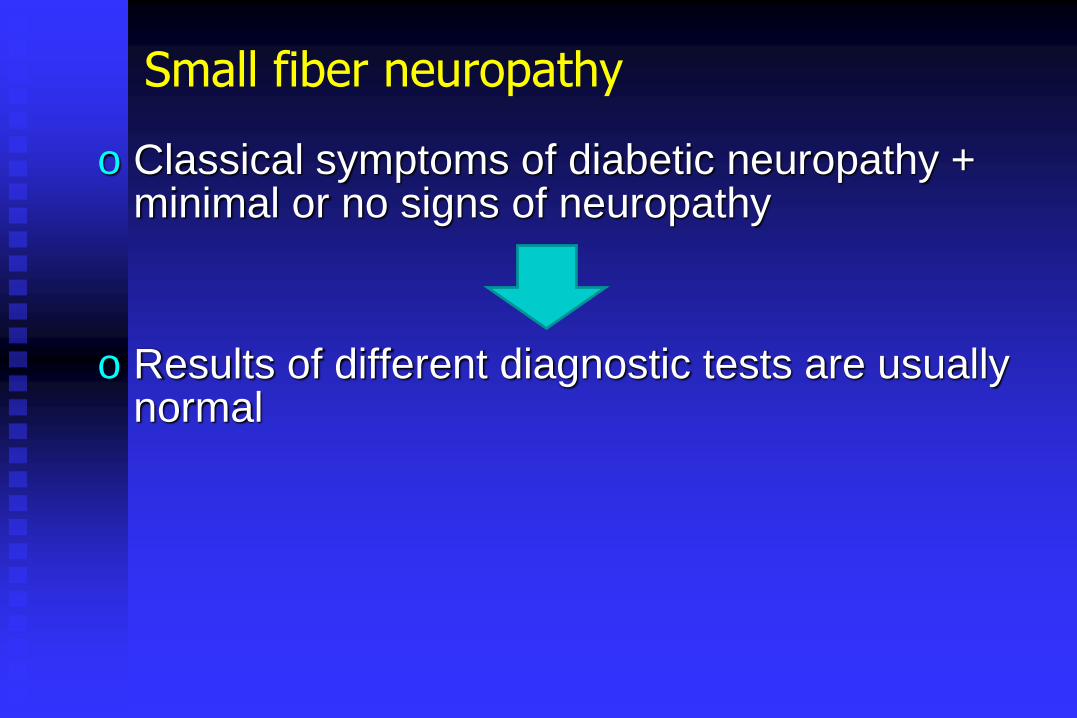
Small fiber neuropathy
o Classical symptoms of diabetic neuropathy + minimal or no signs of neuropathy
o Results of different diagnostic tests are usually normal
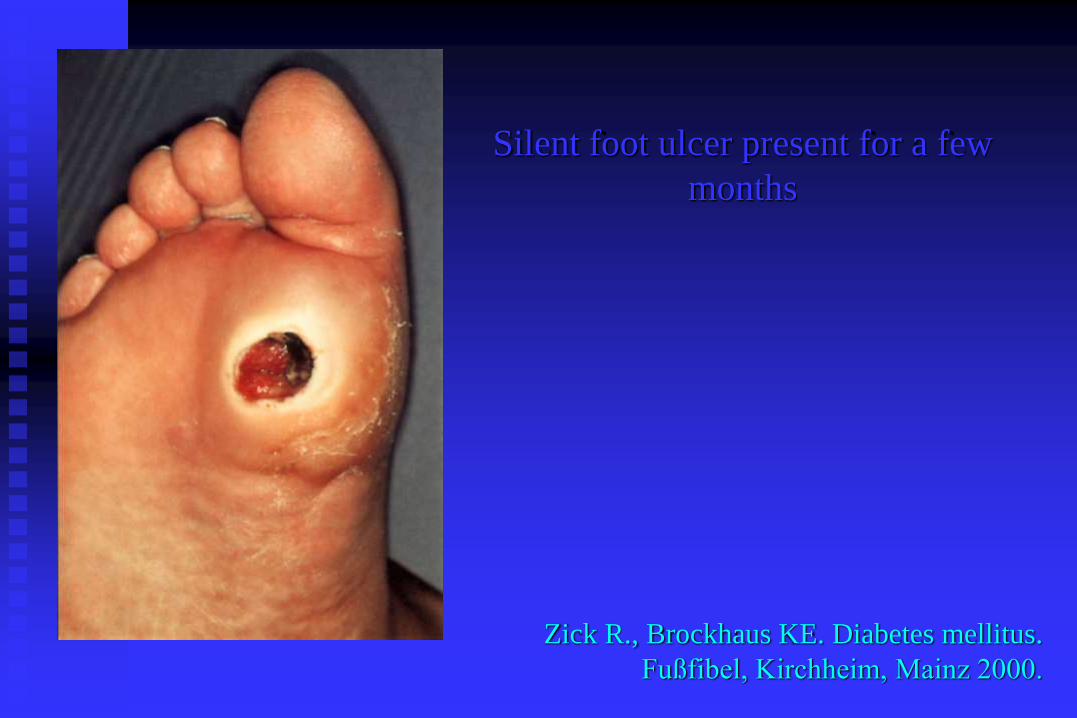
Silent foot ulcer present for a few
months
Zick R., Brockhaus KE. Diabetes mellitus.
Fußfibel, Kirchheim, Mainz 2000.


Autonomic neuropathy

Ziegler D. Diabetes Metab Rev 1994; 10: 339-383.
6%
29%
0
10
20
30
40
50
n=708 n=495
Morta
lity
(%
)
Autonomic neuropathy
– +
The natural history of autonomic neuropathy in diabetesMortality rates after 5.8 years of follow-up (metaanalysis)

Painless or silent myocardial infarction
should always be suspected in every diabetic patients suffering from
o acute heart failure / pulmonary oedema
o collapse
o vomiting
o ketoacidosis of unknown origin / unexplained hyperglycaemia
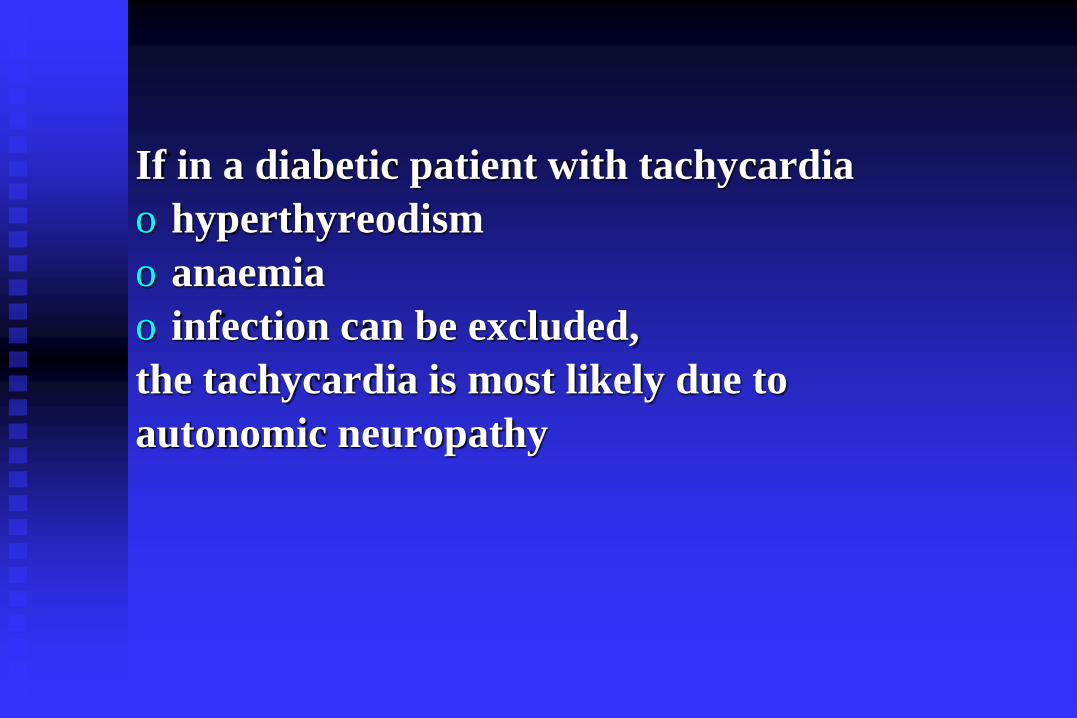
If in a diabetic patient with tachycardia
o hyperthyreodism
o anaemia
o infection can be excluded,
the tachycardia is most likely due to
autonomic neuropathy

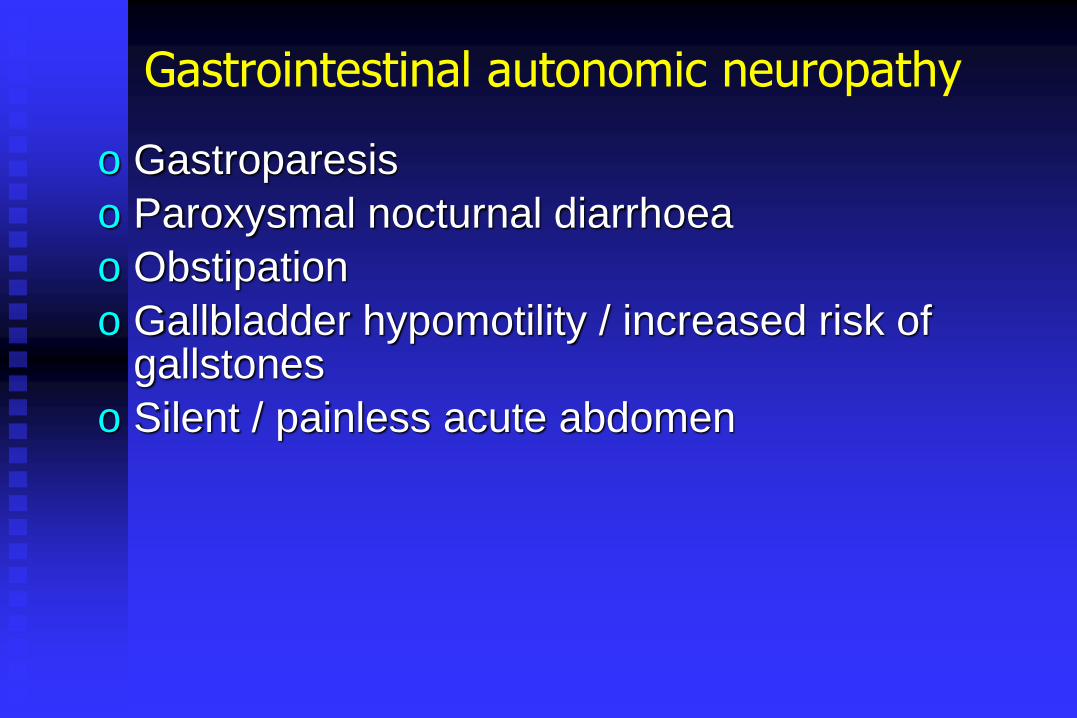
Gastrointestinal autonomic neuropathy
o Gastroparesis
o Paroxysmal nocturnal diarrhoea
o Obstipation
o Gallbladder hypomotility / increased risk of gallstones
o Silent / painless acute abdomen

Symptomatic
treatment
Pathogenetically
oriented treatment
The aim of pathogenetically oriented treatment is to
slow down, stop, or even reverse the progression of
neuropathy

Choices of pathogenetically oriented therapy of neuropathy in diabetes mellitus
o Optimal glycaemic control
o Management of risk factors
o Aldose – reductase inhibitors
o Benfotiamin
o Alpha-lipoic acid

*All criteria have to be fulfilled
Treatment of symptomatic diabetic polyneuropathy with α-lipoic acid: a meta-analysis
Included trials in the meta-analysis
o Randomised, double-masked trial
o Placebo-controlled, parallel-group trial
o ALA infusion 600 mg iv per day
o Duration of iv treatment – 3 weeks, weekends excepted
o Daily assessment of Total Symptom Score (TSS), weekends excepted
o Diabetic patients with symptomatic polyneuropathy
Ziegler D et al. Diabet Med 2004; 21: 114-121
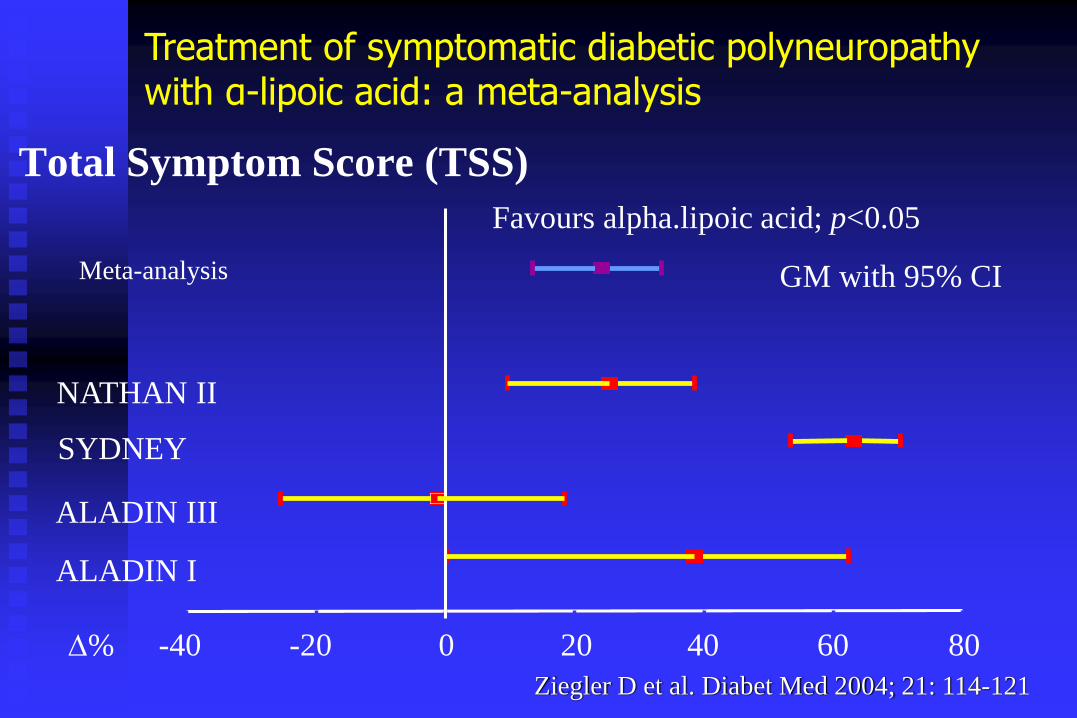
Total Symptom Score (TSS)
ALADIN I
ALADIN III
SYDNEY
NATHAN II
Meta-analysis
-40 -20 0 20 40 60 80
GM with 95% CI
%
Favours alpha.lipoic acid; p<0.05
Treatment of symptomatic diabetic polyneuropathy with α-lipoic acid: a meta-analysis
Ziegler D et al. Diabet Med 2004; 21: 114-121

Treatment-Painful neuropathyGeneral MeasuresImprove glycaemic control
Exclude or treat other contributory factors
•Alcohol excess
•Vitamin B12 deficiency/Folate
•Uraemia
Simple analgesia-NSAID/Paracetamol
Explanation, empathy and reassurance
Choose drugs according to dominant symptoms
Burning pain
Tricyclics
Anticonvulsants
Duloxetine
Lancinating pain
Tricyclics
Anticonvulsants
Duloxetine
Other symptomsAllodynia
•Plastic film
•Leg cradle at night
Restless legs
•Ropinirole
Painful Cramps
•Quinine sulphate


Diabetic nephropathy
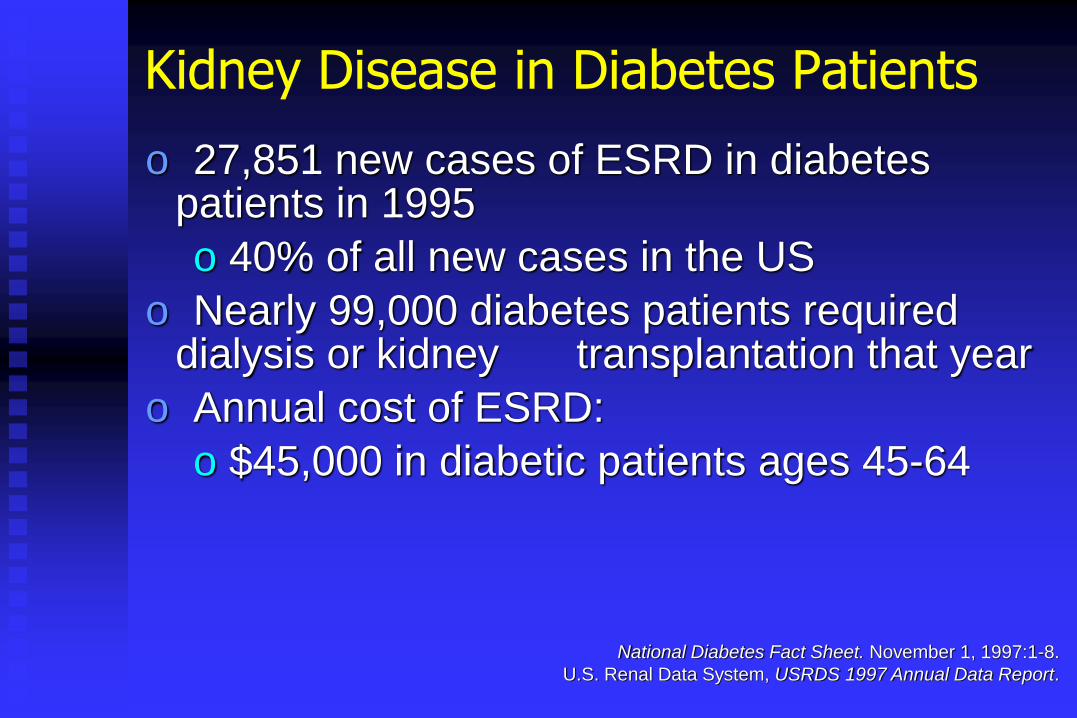
Kidney Disease in Diabetes Patients
o 27,851 new cases of ESRD in diabetes patients in 1995
o 40% of all new cases in the US
o Nearly 99,000 diabetes patients required dialysis or kidney transplantation that year
o Annual cost of ESRD:
o $45,000 in diabetic patients ages 45-64
National Diabetes Fact Sheet. November 1, 1997:1-8.
U.S. Renal Data System, USRDS 1997 Annual Data Report.

0
5
10
15
20
25
30
1980 1990 1997 2000
international
hungarian
The proportion diabetes among ethiological
factors of end-stage renal disesase
%
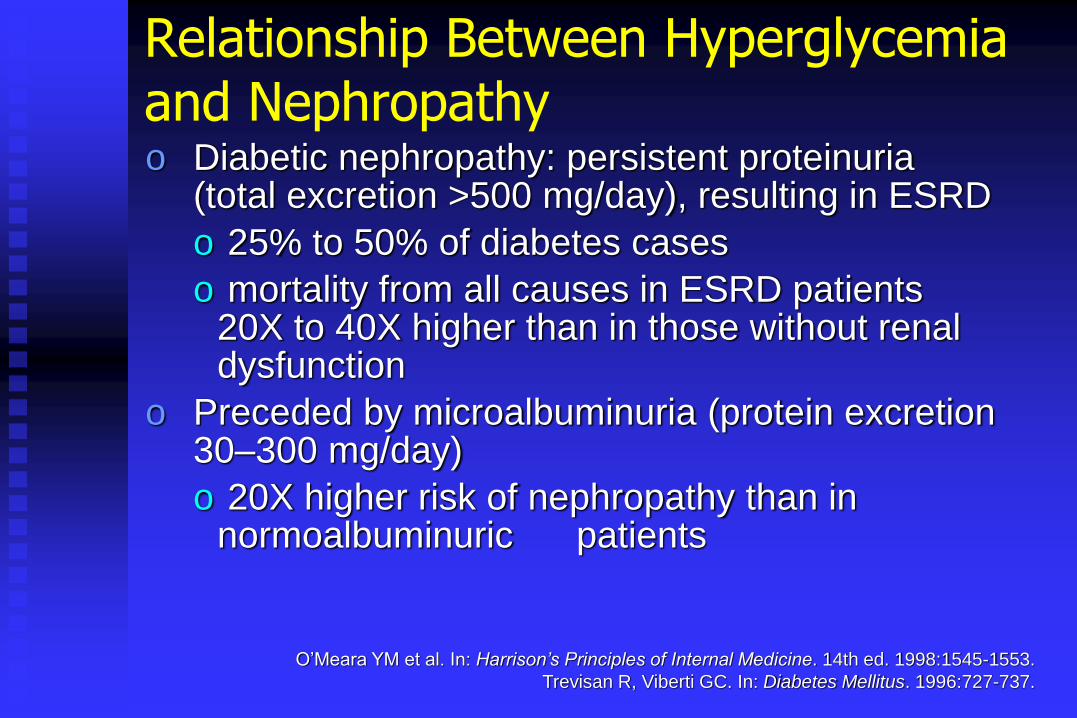
Relationship Between Hyperglycemia and Nephropathyo Diabetic nephropathy: persistent proteinuria
(total excretion >500 mg/day), resulting in ESRD
o 25% to 50% of diabetes cases
o mortality from all causes in ESRD patients 20X to 40X higher than in those without renal dysfunction
o Preceded by microalbuminuria (protein excretion 30–300 mg/day)
o 20X higher risk of nephropathy than in normoalbuminuric patients
O’Meara YM et al. In: Harrison’s Principles of Internal Medicine. 14th ed. 1998:1545-1553.
Trevisan R, Viberti GC. In: Diabetes Mellitus. 1996:727-737.

Diabetic nephropathy– clinical symptoms
o No specific clinical symptoms
o Progression of nephropathy is characterized by decrease of glomerular filtration rate (GFR), development of proteinuria (microalbuminuria followed by macroalbuminuria), and hypertension
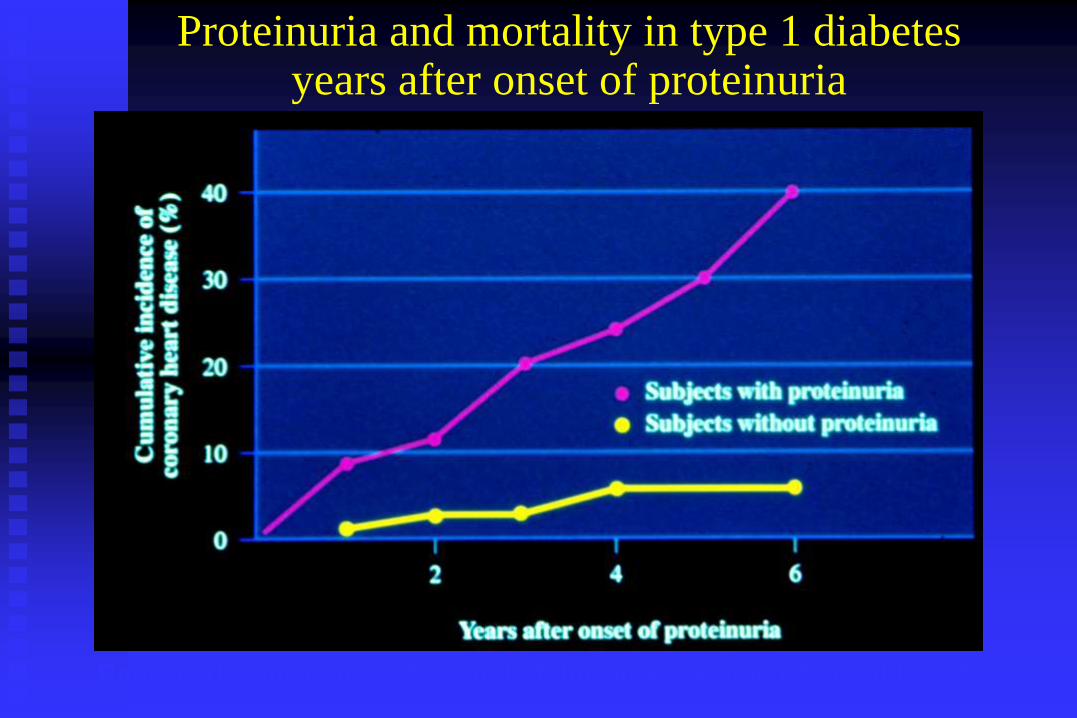
Proteinuria and mortality in type 1 diabetes years after onset of proteinuria
Reprinted from Jemsen T., Borch-Johnson K., Kofoed-Evevoldsen A., Deckert T.
Diabetologia 30: 144-8; 1987.

Prevalence of cardiovascular diseases in 40-year-old
patients with type 1 diabetes onset in child-hood
Sarti et al. Diabetologia 1998; 41: A350.
4%2%
7%
13%
20%
43%
0
10
20
30
40
50
ischaemic heart disease stroke total cardiovascular
diseases
without diabetic nephropathy
with diabetic nephropathy
n=5148; follow-up: 10-24 years

End-Stage
Progression
Initiation
“At Risk”
Cardiovascular
disease
CHF
Arteriosclerotic
cardiovascular
disease events
Coronary artery disease
Left ventricular hypertrophy
Elderly,
DM, BP
Chronic Renal
disease
ESRD
Chronic renal
insufficiency ( GFR)
Albuminuria
Proteinuria
Elderly,
DM, BP
Adapted from Sarnak and Levey, Am J Kidney Dis 2000;35:S117–31.
Cardiovascular and renal disease continuum
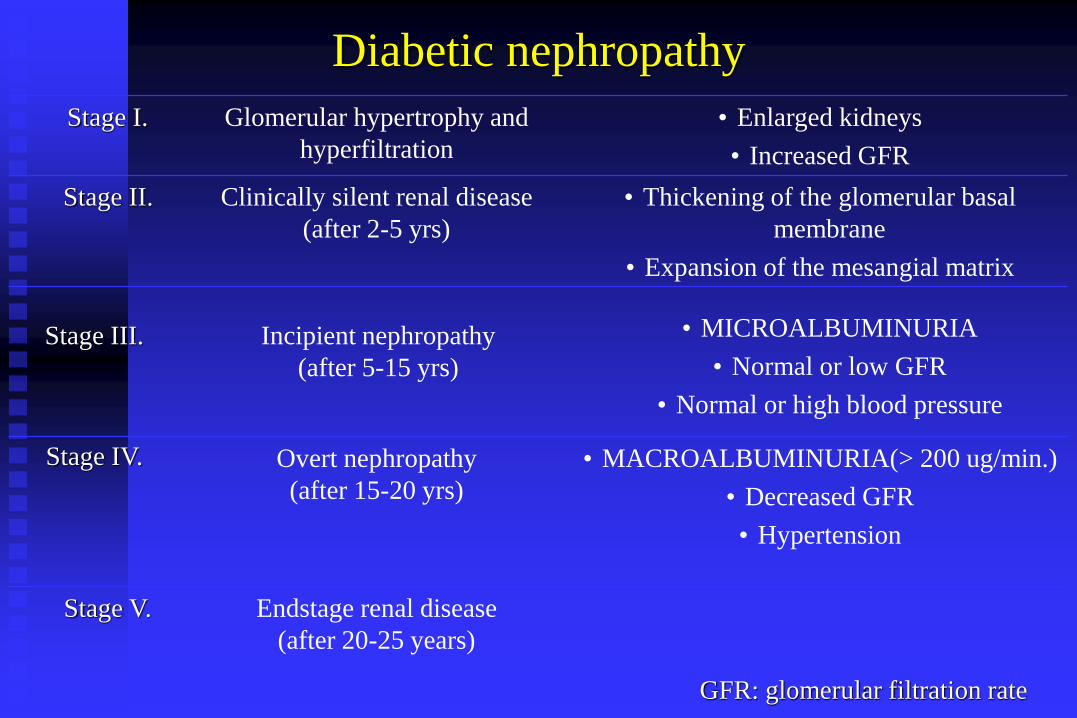
Stage III.
Diabetic nephropathy
Stage V.
Stage IV.
Stage II.
Stage I.
Endstage renal disease
(after 20-25 years)
• MACROALBUMINURIA(> 200 ug/min.)
• Decreased GFR
• Hypertension
Overt nephropathy
(after 15-20 yrs)
• MICROALBUMINURIA
• Normal or low GFR
• Normal or high blood pressure
Incipient nephropathy
(after 5-15 yrs)
• Thickening of the glomerular basal
membrane
• Expansion of the mesangial matrix
Clinically silent renal disease
(after 2-5 yrs)
• Enlarged kidneys
• Increased GFR
Glomerular hypertrophy and
hyperfiltration
GFR: glomerular filtration rate

20-200 mg/min
or
30-300 mg/24 hours
Microalbuminuria
Urinary albumin excretion:

Proteinuria
o It’s generally accepted that diabetic nephropathy is the cause of the proteinuria, if
o Duration of diabetes is > 10 years
o Diabetic retinopathy is present
o No other causes of proteinuria indicated by clinical data

Prevention of microvascular disease
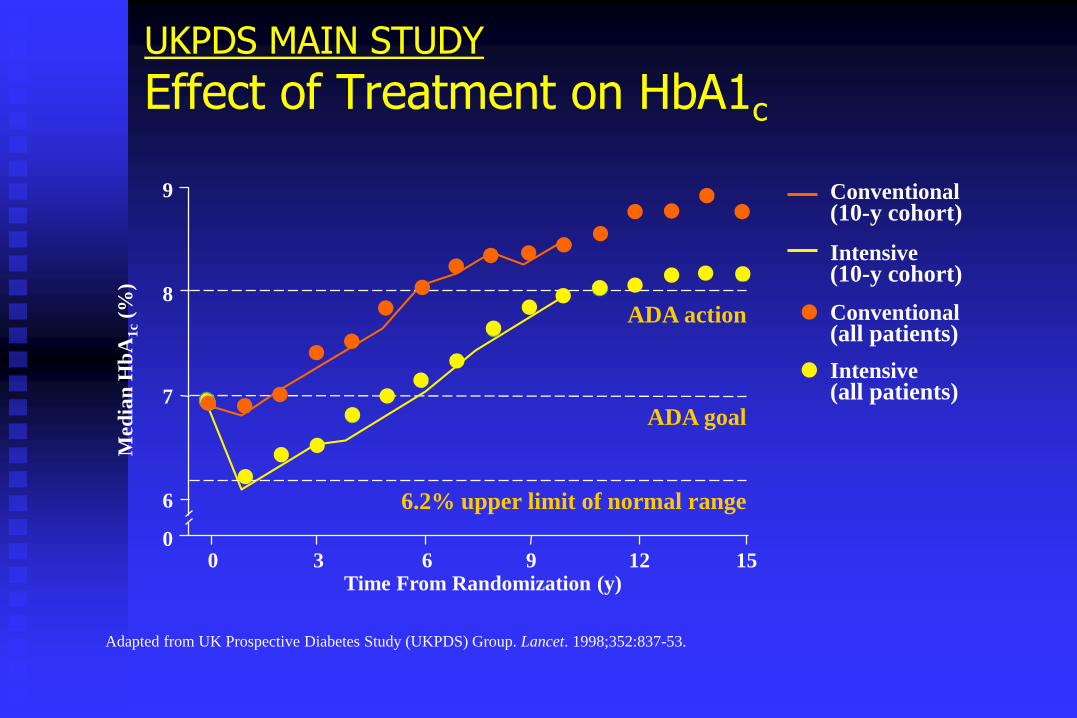
UKPDS MAIN STUDY
Effect of Treatment on HbA1c
Adapted from UK Prospective Diabetes Study (UKPDS) Group. Lancet. 1998;352:837-53.
Conventional(10-y cohort)
9
8
7
6
00 3 6
6.2% upper limit of normal range
ADA goal
ADA action
9 12 15Time From Randomization (y)
Intensive(all patients)
Conventional(all patients)
Intensive(10-y cohort)
Med
ian
Hb
A1
c(%
)
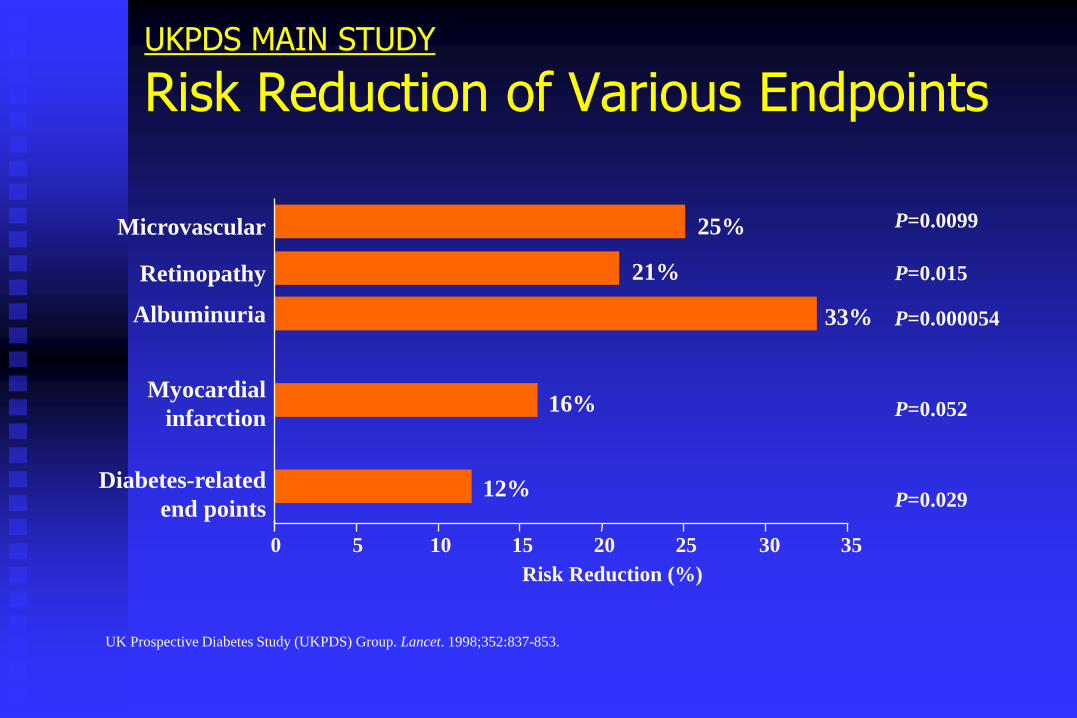
UKPDS MAIN STUDY
Risk Reduction of Various Endpoints
UK Prospective Diabetes Study (UKPDS) Group. Lancet. 1998;352:837-853.
Risk Reduction (%)
P=0.000054
P=0.015
P=0.052
P=0.0099
P=0.029
0 5 10 15 20 25 30 35
Diabetes-related
end points
Myocardial
infarction
Albuminuria
Retinopathy
Microvascular 25%
21%
16%
33%
12%

UKPDS HYPERTENSION SUBSTUDY
Risk-Reduction of Microvascular Endpoints
UK Prospective Study Group. Tight blood pressure control and risk of macrovascular and microvascular complications in type 2 diabetes:
UKPDS 38. BMJ 1998;317:703-13.
Years from Randomization
0
Pati
ents
Wit
h E
ven
ts (
%)
20
1 2 3 4 5 6 7 8 9
10
0
Less Tight Control
Tight Control
Risk-Reduction 37%P=0.0092

Macrovascular complications
Framingham Heart Study 30-Year Follow-Up:CVD Events in Patients With Diabetes (Ages 35-64)
109
20
11
9 63819
3*
30
0
2
4
6
8
10
Age-adjusted annual rate/1,000
Men Women
Total CVD CHD Cardiac
failure
Intermittent
claudication
Stroke
Risk
ratio
P<0.001 for all values except *P<0.05.
Wilson PWF, Kannel WB. In: Hyperglycemia, Diabetes and Vascular Disease.
Ruderman N et al, eds. Oxford; 1992.

UKPDS HYPERTENSION SUBSTUDY
Risk-Reduction of Stroke
UK Prospective Study Group. Tight blood pressure control and risk of macrovascular and microvascular complications in type 2 diabetes:
UKPDS 38. BMJ 1998;317:703-13.
0
Pati
ents
Wit
h E
ven
ts (
%)
20
1 2 3 4 5 6 7 8 9
10
0
Years from Randomization
Risk-Reduction 44%P=0.013
Less Tight Control
Tight Control

UKPDS HYPERTENSION SUBSTUDY
Diabetes-Related Deaths
UK Prospective Study Group. Tight blood pressure control and risk of macrovascular and microvascular complications in type 2 diabetes:
UKPDS 38. BMJ 1998;317:703-13.
Years from Randomization
0
Mo
rta
lity
(%
)40
1 2 3 4 5 6 7 8 9
20
0
30
10
Less Tight Control
Tight Control
Risk-Reduction 32%P=0.019
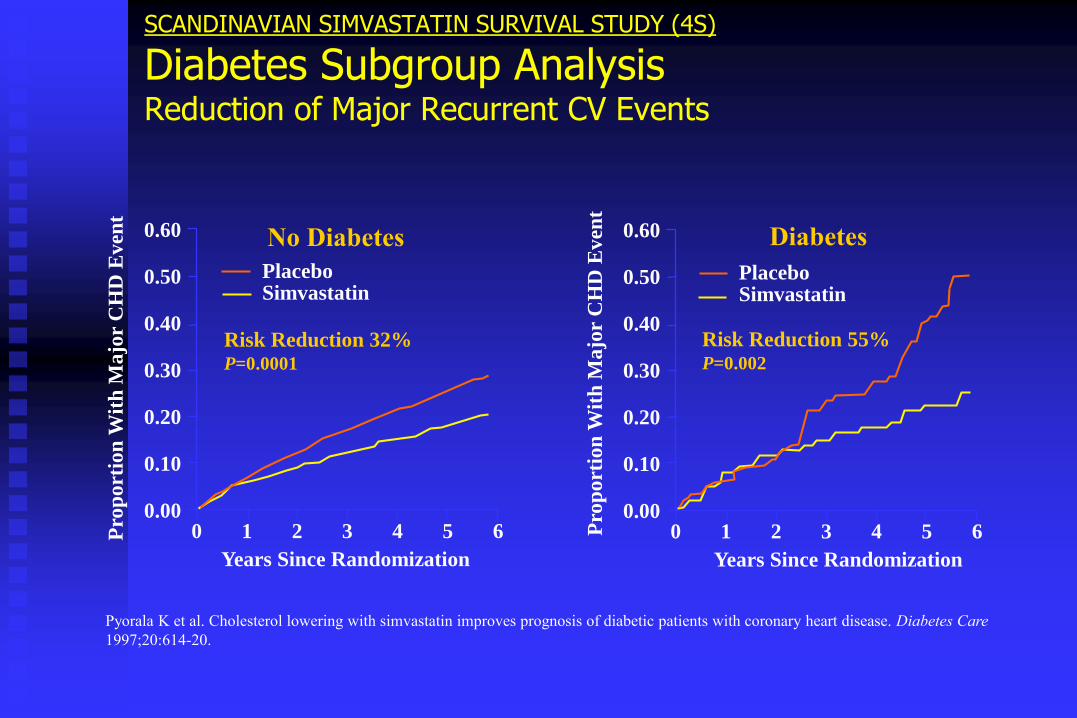
SCANDINAVIAN SIMVASTATIN SURVIVAL STUDY (4S)
Diabetes Subgroup AnalysisReduction of Major Recurrent CV Events
Pyorala K et al. Cholesterol lowering with simvastatin improves prognosis of diabetic patients with coronary heart disease. Diabetes Care
1997;20:614-20.
Years Since Randomization
Pro
po
rtio
n W
ith
Ma
jor
CH
D E
ven
t
0.60
0
0.50
0.40
0.30
0.20
0.10
0.001 2 3 4 5 6
Placebo Simvastatin
Diabetes
Years Since Randomization
Pro
po
rtio
n W
ith
Ma
jor
CH
D E
ven
t
0.60
0
0.50
0.40
0.30
0.20
0.10
0.001 2 3 4 5 6
No Diabetes
Placebo Simvastatin
Risk Reduction 32%P=0.0001
Risk Reduction 55%P=0.002


CV Risk-Reduction With Antiplatelet TherapyHigh-Risk PatientsDiabetes Subgroup Meta-analysis
Antiplatelet Trialists Collaboration. Collaborative overview of randomized trials of antiplatelet therapy I: prevention of death, myocardial
infarction, and stroke by prolonged antiplatelet therapy in various categories of patient. BMJ 1994;308:71-2.
No Diabetes Diabetes
n 21,197 21,136
Vascular eventsControl 16.4% 22.3%
Antiplatelet Rx(usually ASA) 12.8% 18.5%
Risk Reduction 28% 21%


Multifactorial treatment of type 2 diabetes – Steno-2
n = 160, DM2T, Gaede P et al. N Engl J Med 348:383-393, 2003
Intenzív
Konvencionális
<4.5 mmol/l <1.7 mmol/l

Multifactorial treatment of type 2 diabetes – Steno-2
n = 160, DM2T, Gaede P et al. N Engl J Med 348:383-393, 2003
Mikrovaszkuláris szövődmények Makrovaszkuláris szövődmények
RR 0.47 (95% CI 0.22-0.74, P=0.01)

Outlineo The effect of glycemic treatment on
complicationso microvascular diseaseo macrovascular disease
o Pathophysiology of hyperglycemiao Treatment targetso Selecting the right treatmento Non-pharmacological therapyo Pharmacological therapyo Treatment algorithm
The effect of glycemic treatment on complications
o Microvascular disease
o Macrovascular disease

KUMAMOTO STUDY
The effect of intensive therapy on HbA1c
Ohkubo Y, et al. Diab Res Clin Pract 1995;28:103-17.
Conventional
Intensive
Years
9
0
Hb
A1
c(%
)12
11
10
8
6
5
7
1 2 3 4 5 6
2.3%
HbA1c
target: fasting< 7.8, pp < 11.1 mmol/l
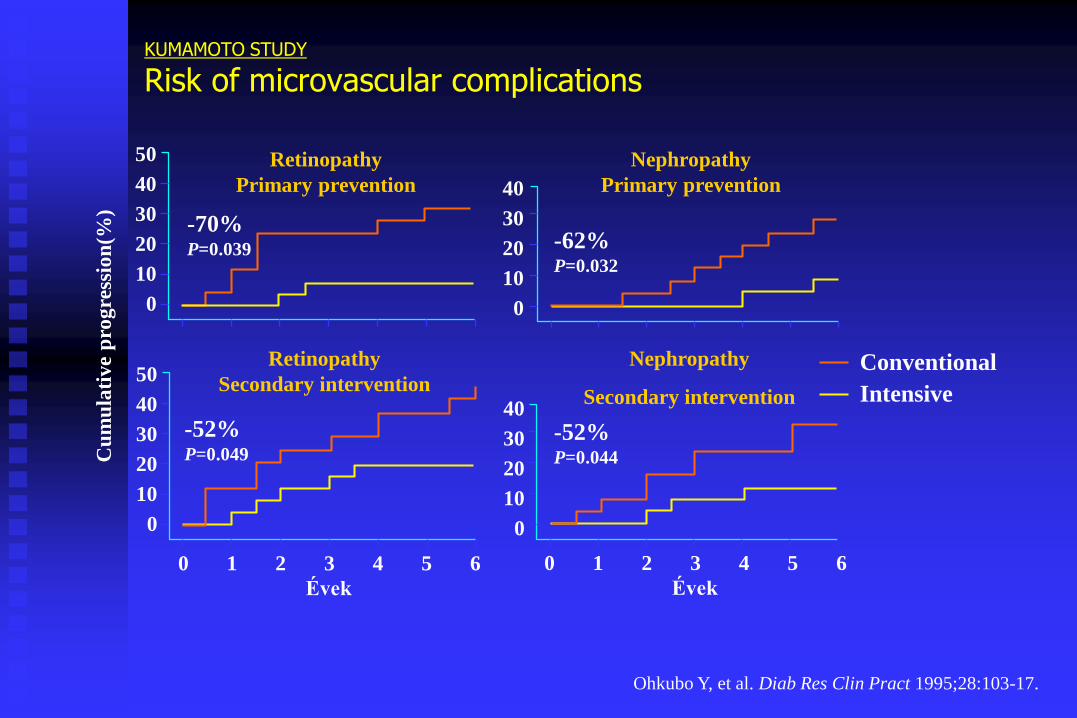
KUMAMOTO STUDY
Risk of microvascular complicationsC
um
ula
tiv
e p
rog
ress
ion
(%)
50
40
30
20
10
0
50
40
30
20
10
0
40
30
20
10
0
40
30
20
10
0
Évek
0 1 2 3 4 5 6
Évek
0 1 2 3 4 5 6
Retinopathy
Primary prevention
Nephropathy
Primary prevention
Retinopathy
Secondary intervention
Nephropathy
Secondary intervention
-62%P=0.032
-70%P=0.039
-52%P=0.049
-52%P=0.044
Conventional
Intensive
Ohkubo Y, et al. Diab Res Clin Pract 1995;28:103-17.
Turner RC, et al. JAMA 1999;281:2005–2012.
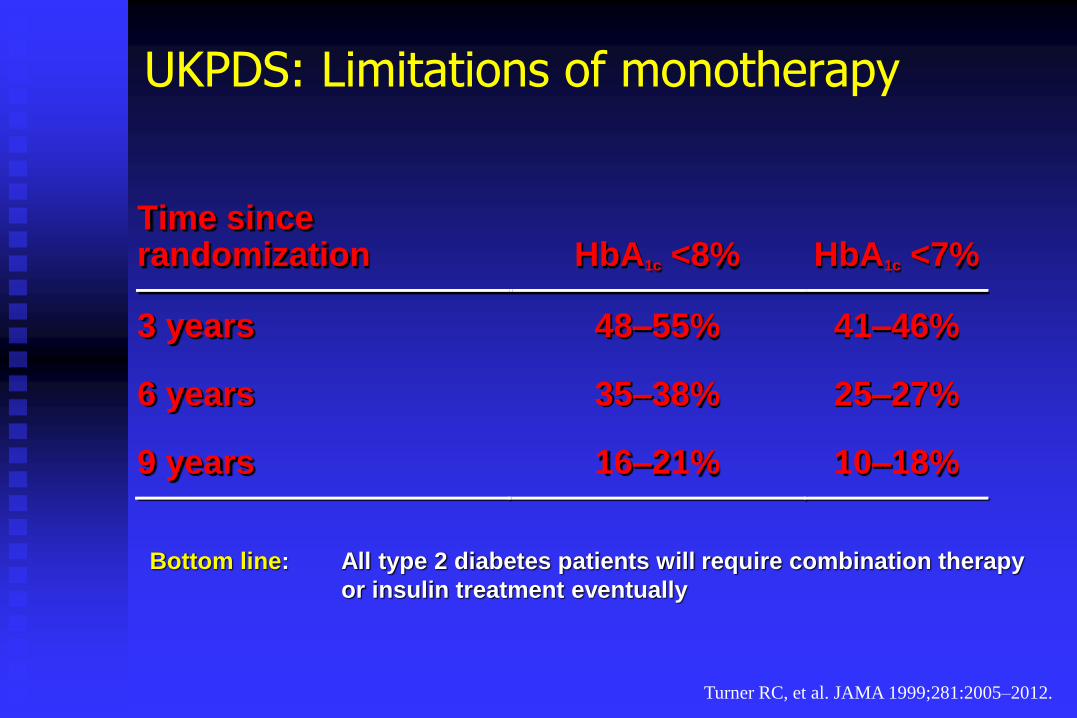
Time since randomization
HbA1c <8%
HbA1c <7%
3 years 48–55% 41–46%
6 years 35–38% 25–27%
9 years 16–21% 10–18%
Bottom line: All type 2 diabetes patients will require combination therapy
or insulin treatment eventually
UKPDS: Limitations of monotherapy

DCCT Research Group, N Eng J Med 1993;329;977-986
DCCT/EDC Research Group, JAMA 2002;287:2563-2569.
HbA1c values in the DCCT and EDIC studies
n=1441, 3-4x injections/day, SMBG ≥ 4x/day
Fasting/preprandial target: 3.9-6.7 mmol/l
Postprandial target < 10 mmol/l

Risk of macrovascular complications in the DCCT/EDIC studies
Risk Reduction 42% (9-63%)
Log-Rank P=0,02Risk Reduction 57% (12-79%)
Log-Rank P=0,02
DCCT/EDC Research Group, NEJM 2005; 353:2643-2653.

Summary
o Intensive treatment (aiming at an HbA1c<7%) significantly reduces the risk of microvascularcomplications
o There is no glycemic threshold, all reduction in HbA1c are effective
o Type 2 diabetes is a progressive disease, eventually all patients will require combination therapy
o Among type 1 diabetes patients intensive glycemic control reduces the risk of macrovascular complications

Summary
o Type 2 diabetes is a heterogeneous disease
oOne extreme is predominant insulin resistance with relative insulin deficiency
oThe other extreme is predominant insulin secretory failure sometimes with mild insulin resistance
ADA: Diabetes Care: 20, 1183-1197; 1997
ADA. Diabetes Care 30 (Suppl 1):S4-S41; 2007
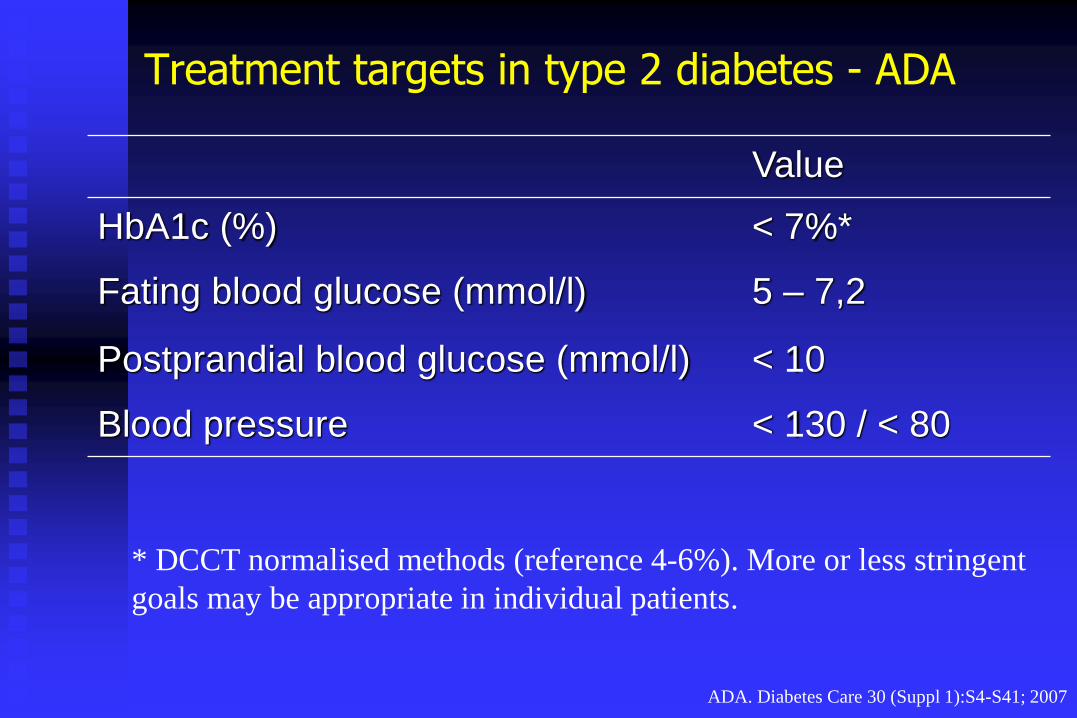
Treatment targets in type 2 diabetes - ADA
Value
HbA1c (%) < 7%*
Fating blood glucose (mmol/l) 5 – 7,2
Postprandial blood glucose (mmol/l) < 10
Blood pressure < 130 / < 80
* DCCT normalised methods (reference 4-6%). More or less stringent
goals may be appropriate in individual patients.

Selecting the right glycemic treatment
o Blood glucose lowering effect
o Side effects
o Nonglycemic effects
o weight,
o blood pressure,
o lipids,
o insulin sensitivity,
o β-cell function
o Cost of therapy

Nathan DM et al. Diabetes Care 29:1963-1972
Nonpharmacological therapy
Results
Glycemic effectiveness 1-2% (HbA1c)
Side effects Rare
Nonglycemic effects Beneficial
Cost Cheapest
CommentEffectiveness decreases after 1 year

The role of diet (medical nutrition therapy)
o Dietary advice is not prohibitive any more
o Diabetes patients in general should follow
current dietary guidelines aimed at the general
population
o However the freedom to choose does not equal
mean that certain rules related to timing and
carbohydrate content should not be followed

Medical nutrition therapy recommendations
Component Recommendation
Carbohydrate*
saccharose
45-60%
< 10%
Protein 0,8 g/ttkg
Fat
saturated fat
trans fat
cis-fat*
unsaturated fats
< 10%
minimal
10-25%
< 10%
Sodium < 6 g
Alcohol 1-3 E (15-45 g)
* 60-70% of total calories should come from carbohydrates and cis-fats
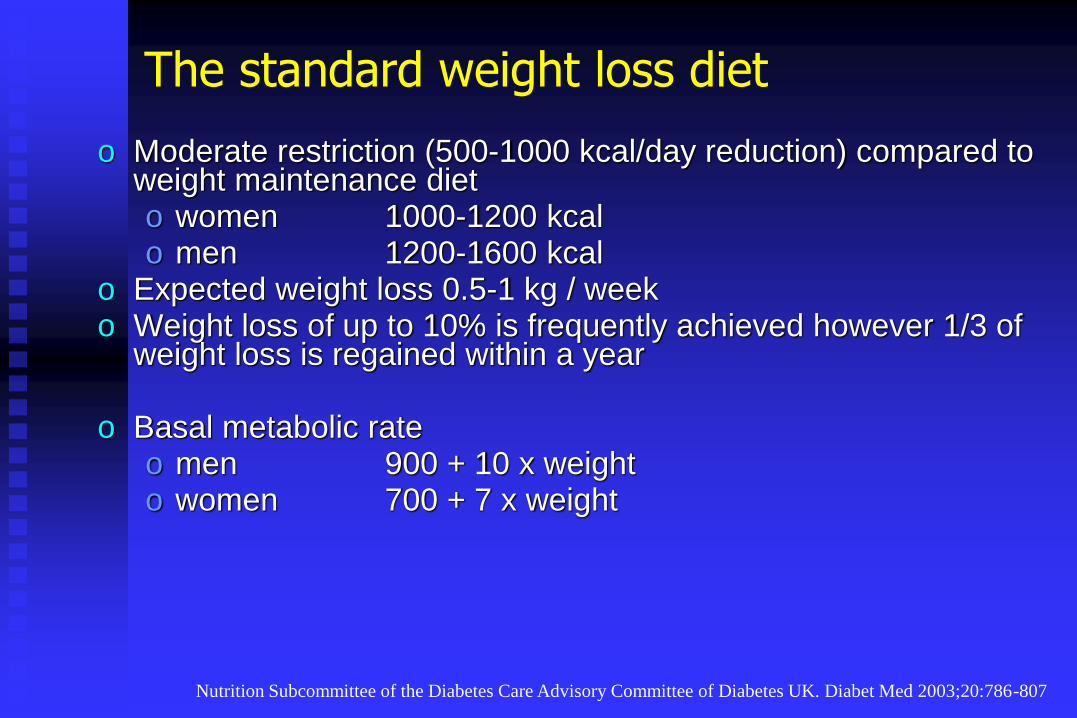
The standard weight loss diet
o Moderate restriction (500-1000 kcal/day reduction) compared to weight maintenance dieto women 1000-1200 kcalo men 1200-1600 kcal
o Expected weight loss 0.5-1 kg / weeko Weight loss of up to 10% is frequently achieved however 1/3 of
weight loss is regained within a year
o Basal metabolic rateo men 900 + 10 x weighto women 700 + 7 x weight
Nutrition Subcommittee of the Diabetes Care Advisory Committee of Diabetes UK. Diabet Med 2003;20:786-807

Nathan DM et al. Diabetes Care 29:1963-1972
Metformin
Results
Glycemic effect 1,5% (HbA1c)
Side effecgtsGI side effects
Lactic acidosis (extremely rare)
Nonglycemic effects Weight neutral
Cost Cheap

Effects of metformin treatment
Intensive therapy with metformin in obese diabetes patients - UKPDS
o Metformin monotherapy compared to other intensive treatmentso More effectively reduced the risk of all diabetes
related endpoints, diabetes related mortality, and all-cause mortality compred to sulfanylureas (SU) and insulin
o Less weight gain and hypoglycemia compared to SU and insulin
o No difference on microvascular risk compared to other intensive treatments
o In combination with SUo Increased mortality compared to SU monotherapy
(this was not confirmed later)
UKPDS Group. Lancet 352:854-865, 1998

ADA/EASD: Titration of Metformin

ADA/EASD: Titration of Metformin (cont’d)
Nathan DM et al. Diabetes Care 29:1963-1972
-glucosidase inhibitors
Results
Glycemic effects 0,5-0,8% (HbA1c)
Side effectsGI symptoms
3x/day
Nonglycemic effects Weight neutral
Cost Relative expensive
Acarbose effectively reduces postprandial glucose

Favours FavoursCV event p Acarbose Placebo
Coronary mortality 0.4368
Myocardial infarction 0.0120
Angina 0.3883
Heart failure 0.2251
Revascularisation 0.6784
Peripheral vascular disease 0.4558
Stroke/cerebrovascular event 0.5269
Any of the above CV events 0.0061
Acarbose reduces cardiovascular risk in type 2 diabetes
CV - cardiovascularHanefeld M et al. Eur Heart J 2004
Meta-analysis: 7 double blind, placebo controlled study; n=2,180 T2DM
0 0.5 1.0 1.5 2.0
Nathan DM et al. Diabetes Care 29:1963-1972
Glitazones
Results
Glycemic effect 0,5-1,4% (HbA1c)
Side effects
Fluid retention,weight gain,osteoporosisCV side effects (?)
Nonglycemic effectsBeneficial effect on lipids, antiinflammatory effects
Cost Expensive

Summaryo Glitazones seems to be most effective in early stages
of type 2 diabetes considering their beneficial effects on insulin secretion and their side effects
o In overweight diabetes patients in combination with maximally tolerated dose of metformin in combination
o In case of metformin intolerance (side effects) or contrainidcation (e.g. renal failure) glitazones could be given as monotherapy
o Individualised treatment is recommended based on effectiveness and risks

Nathan DM et al. Diabetes Care 29:1963-1972
Sulfanilureas
Results
Glycemic effects 1,5% (HbA1c)
Side effectsWeight gain
Hypoglycemia
Nonglycemic effects Lot of experience
Cost Very cheap

The sulfanilurea receptor
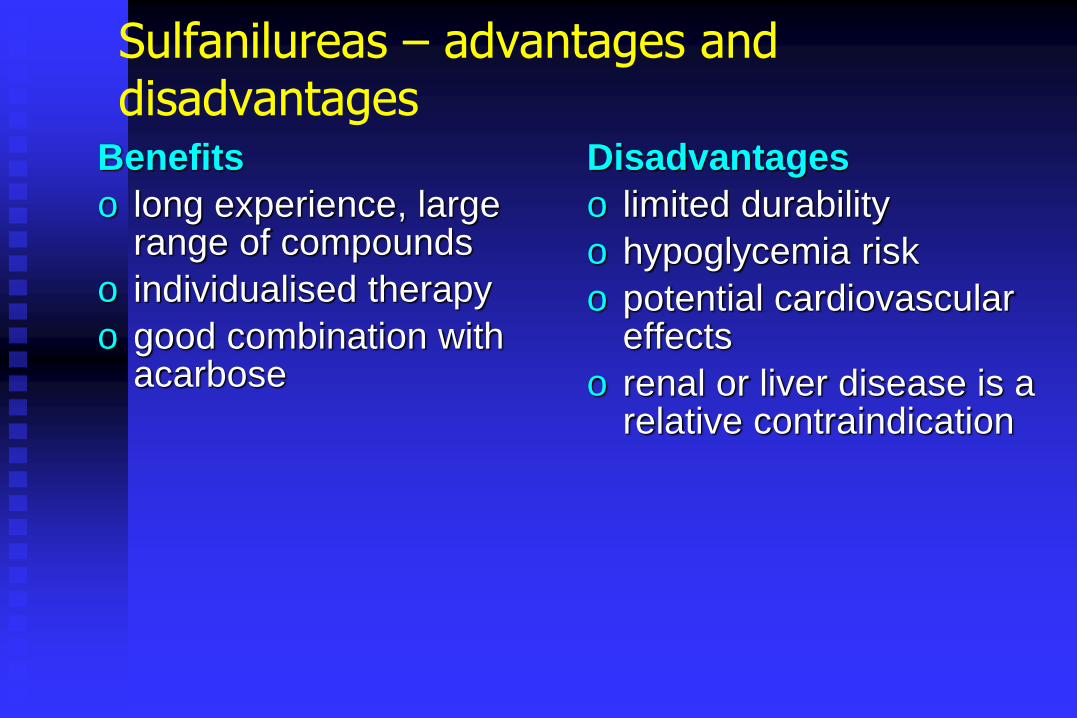
Sulfanilureas – advantages and disadvantages
Benefits
o long experience, large range of compounds
o individualised therapy
o good combination with acarbose
Disadvantages
o limited durability
o hypoglycemia risk
o potential cardiovascular effects
o renal or liver disease is a relative contraindication

Nathan DM et al. Diabetes Care 29:1963-1972
Glinides
Results
Glycemic effects 1-1,5% (HbA1c)
Side effects 3x / day
Nonglycemic effects
Cost Expensive

Prandial glucose regulators advantages and disadvantages
Benefits
o Rapid onset and short duration effect on insulin secretion
o low risk of hypoglycemia
o no dose adjustment in elderly, renal or liver disease
o flexible lifestyle
Disadvantages
o moderate effect on fasting glucose
o less effective that SUs
o expensive
Nathan DM et al. Diabetes Care 29:1963-1972
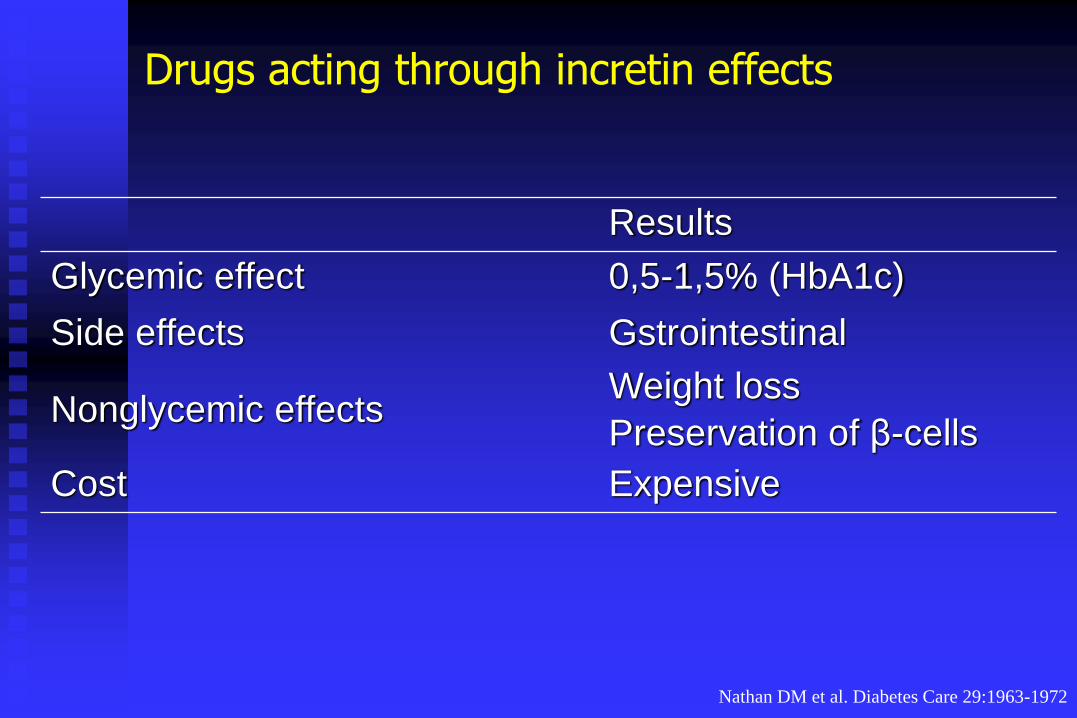
Drugs acting through incretin effects
Results
Glycemic effect 0,5-1,5% (HbA1c)
Side effects Gstrointestinal
Nonglycemic effectsWeight loss
Preservation of β-cells
Cost Expensive

The effects of GLP-1 in humans
GLP-1 secretion begins
from jejunal and ileal
L-cells
Subsequently…
•Increases glucose-dependent
insulin secretion and production
• Inhibits glucagon secretion
• Slows gastric emptying and
small bowel motility
(„ileal brake”)
• Decreases hunger and food intake
After a meal…
Drucker DJ. Curr Pharm Des 2001; 7:1399-1412
Drucker DJ. Mol Endocrinol 2003; 17:161-171

Postprandial GLP-1 secretion is decreased in IGT and type 2 diabetes
Data from: Toft-Nielsen M, et al. J Clin Endocrinol Metab 2001; 86:3717-3723
* P <0.05 T2DM vs. NGT.
20
15
10
5
00 60 120 180 240
Time (min)
Mean (SE)
GLP-1 (pmol/L)
* * * **
**
*
Meal NGT subjects
IGT subjects
T2DM patients

Possible ways to increase GLP-1 effects
DPP IV resistant compounds:
o GLP-1 analogues
oliraglutide; NN2211 (acilated) → 12 h
oCJC-1131 (reactive side chain)
o GLP-1 receptor agonists („incretin mimetics”): exendin-4 (exenatide), sc., 2,5 h
DPP IV (dipeptidyl-peptidase) inhibitors:
o vildagliptin, sitagliptin

Comparison of incretin-based therapies
*Significant compared to active comparator
Adapted from Drucker and Nauck, Lancet 2006;368:1696-705.
Hb
A1
c c
hange (
%)
1.0
0.5
0
–0.5
–1.0
–1.5
–2.0
*
*
Exenatide BIDHeine, 2005
Liraglutide ODVilsbøll, 2006
*
SitagliptinAschner, 2006
Fasti
ng
glu
co
se
change
(mg/d
L)
20
0
–20
–40
–60
–80
*
* *
3
2
1
–2
–3
–5
*
*
0
–1
–4
Weig
ht
change (
kg)
• based on studies that showed the highest effectiveness
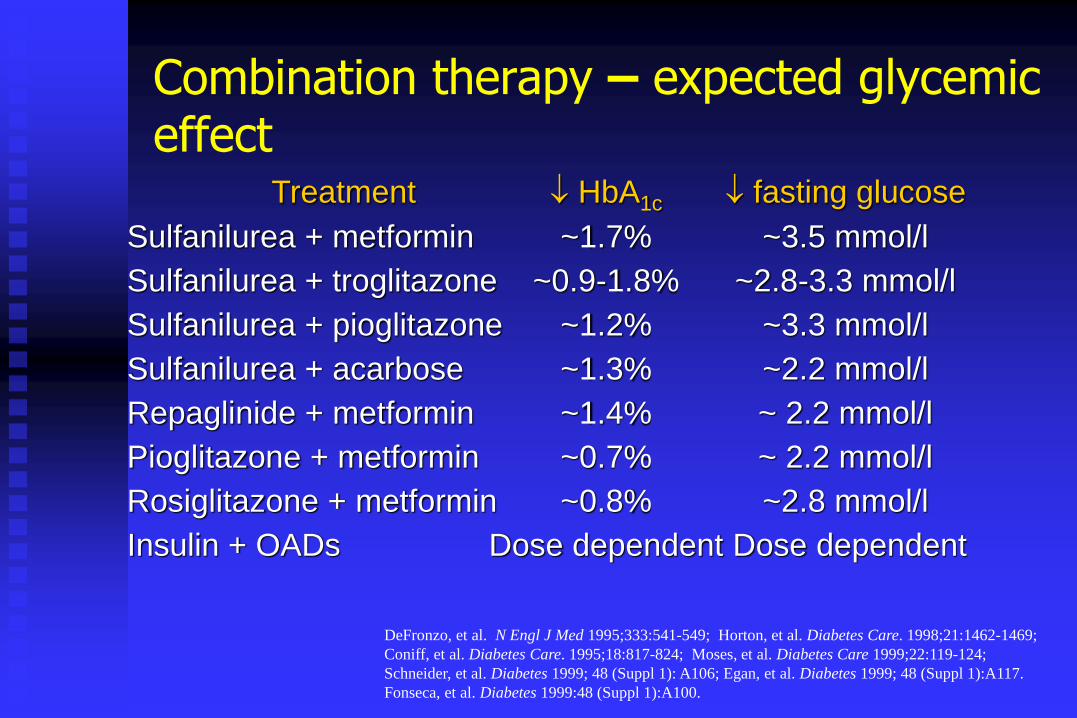
Combination therapy – expected glycemic effect
DeFronzo, et al. N Engl J Med 1995;333:541-549; Horton, et al. Diabetes Care. 1998;21:1462-1469;
Coniff, et al. Diabetes Care. 1995;18:817-824; Moses, et al. Diabetes Care 1999;22:119-124;
Schneider, et al. Diabetes 1999; 48 (Suppl 1): A106; Egan, et al. Diabetes 1999; 48 (Suppl 1):A117.
Fonseca, et al. Diabetes 1999:48 (Suppl 1):A100.
Treatment HbA1c fasting glucose
Sulfanilurea + metformin ~1.7% ~3.5 mmol/l
Sulfanilurea + troglitazone ~0.9-1.8% ~2.8-3.3 mmol/l
Sulfanilurea + pioglitazone ~1.2% ~3.3 mmol/l
Sulfanilurea + acarbose ~1.3% ~2.2 mmol/l
Repaglinide + metformin ~1.4% ~ 2.2 mmol/l
Pioglitazone + metformin ~0.7% ~ 2.2 mmol/l
Rosiglitazone + metformin ~0.8% ~2.8 mmol/l
Insulin + OADs Dose dependent Dose dependent

Nathan DM et al. Diabetes Care 29:1963-1972
Insulin
Results
Glycemic effect 1,5-2,5% (HbA1c)
Side effectsInjection, SMBG, Hypoglycemic risk,weight gain
Nonglycemic effects Improving lipid profile
Cost Relatively cheap

Absolute indications for insulin therapy in type 2 diabetes
o Significant hyperglycemia (HbA1c>10%)o Hyperglycemia present if maximal dose of oral
antidiabetic treatment is giveno Metabolic decompensation
o acute injury, stress, infectiono severre hyperglycemia with ketonemia or ketonuriao significant weight loss (symptomatic hyperglycemia)
o Surgeryo Pregnancyo Severe renal diseaseo Allergy to oral antidiabetic drugs
Nathan DM et al. Diabetes Care 29:1963-1972
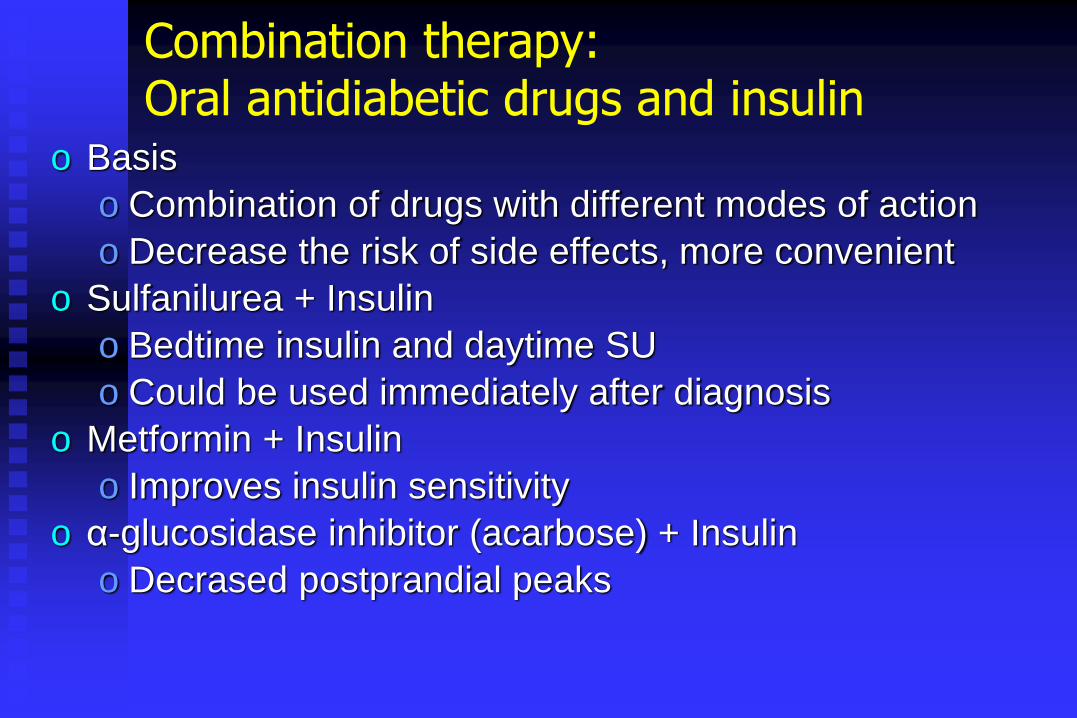
Combination therapy:Oral antidiabetic drugs and insulin
o Basis
o Combination of drugs with different modes of action
o Decrease the risk of side effects, more convenient
o Sulfanilurea + Insulin
o Bedtime insulin and daytime SU
o Could be used immediately after diagnosis
o Metformin + Insulin
o Improves insulin sensitivity
o α-glucosidase inhibitor (acarbose) + Insulin
o Decrased postprandial peaks
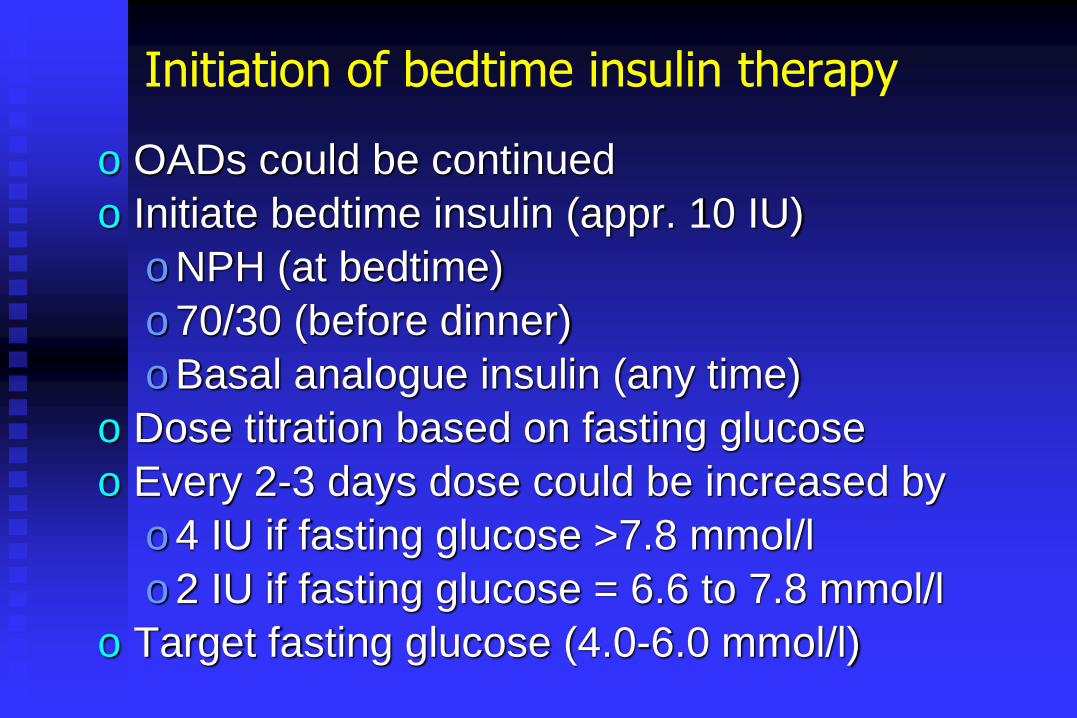
Initiation of bedtime insulin therapy
o OADs could be continued
o Initiate bedtime insulin (appr. 10 IU)
o NPH (at bedtime)
o 70/30 (before dinner)
o Basal analogue insulin (any time)
o Dose titration based on fasting glucose
o Every 2-3 days dose could be increased by
o 4 IU if fasting glucose >7.8 mmol/l
o 2 IU if fasting glucose = 6.6 to 7.8 mmol/l
o Target fasting glucose (4.0-6.0 mmol/l)
6-59

CSII
Insulin analogue bolus and basal ×4-5
Insulin analogue bolus human insulin basal ×4-5
Human insulin basal bolus ×4-5
Analogue high-mix ×3
Analogue low-mix ×2
Human premix ×2
Basal insulin analogue ×1-2
Human NPH or lente insulin ×1-2
Lindholm A.: Best Pract Res Clin Gastroent 2002
convenient
physiological
Pyramid of insulin treatment

Twice daily insulin therapy(Conservative insulin treatment)
o Premix insulins and pen devices simplify these treatments.
o After oral treatment (except for metformin) is stopped a mixture of intermedier and rapid acting insulin is injected (morning –before 7:00, evening before 18:00)
o During titration the different insulin preparations should be given separately for easier modification
o When the required dosage is found, it could be changed to premix insulins
o The usual rate of morning to evening insulin dose is 2:1 – 3:2
o Morning insulin usually contains 20-30% rapid acting insulin, evening mixture contains 0-10%
o The resimes are simple, usually patient compliance is good
o major disadvantage is the rigidity of the regime
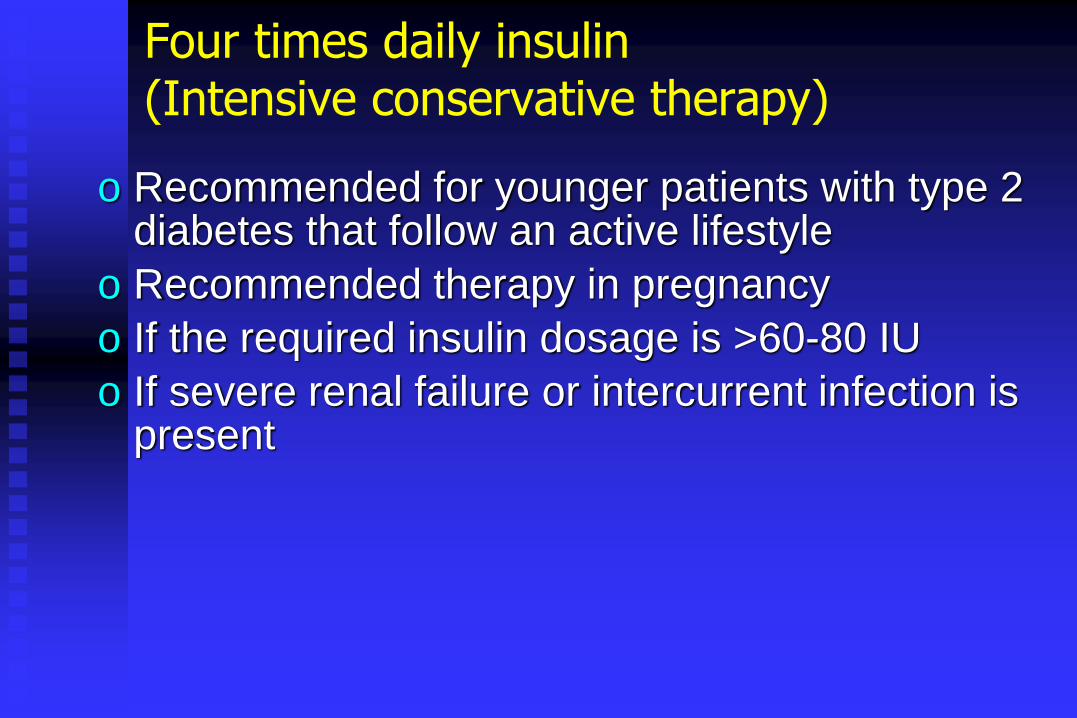
Four times daily insulin(Intensive conservative therapy)
o Recommended for younger patients with type 2 diabetes that follow an active lifestyle
o Recommended therapy in pregnancy
o If the required insulin dosage is >60-80 IU
o If severe renal failure or intercurrent infection is present

ADA/EASD: Initiation and Adjustment of Insulin Regimens


Overviewo Glycemia and diabetes complicationso The effect of glycemic treatment on
complicationso microvascular diseaseo macrovascular disease
o Pathophysiology of hyperglycemiao Treatment targetso Selecting the right treatmento Non-pharmacological therapyo Pharmacological therapyo Treatment algorithm

Causes of hypoglycaemias I
o Insulin treatment; SU treatment (long-term observation !);
o Deficiency/low levels of contrainsular hormones:
Sheehan sy; panhypopituitarism;
M. Addison
McQuarrie sy (low levels of catecholamines)
Absence of glucagon (pancreatectomy,
pancreas diabetes);
Enzymopathies:
Gierke disease (Ø Glucose-6-phosphatase)
impaired gluconeogenesis
hereditary fructose intolerance

Causes of hypoglycaemias II
o Alcohol intoxication (in SU or insulin treated DM patients)
o Leucine-induced hypoglycaemia
o PP hypoglycaemia:
1. in Dumping sy
2. hyperreactive B-cells (relatively common !)
Newborns of diabetic mothers (hyperinsulinaemia)
Diffuse B-cell hyperplasia (nesidioblastosis)
Genetic failure of the KATP-channel (closed channel)
(neonatal hyperinsulinaemia)
Insulin receptor autoantibodies

INSULINOMA
o Hypoglycaemia in the fasting state (early in the morning)
o High insulin levels (before breakfast)
o Unconsciousness (in the morningpatient will not awake)
o Dg: 4-hour OGTT (glucose and insulin determinations)
typically: insulin levels are high and the insulin profile does not follow the glucose profile
other diagnostic tools: 72-hour fasting, regular glucose measurement; abdominal sonography, CT,
angiography
Therapy: surgical removal of the adenoma

Blood glucose and insulin levels due to hyperreactive insulin responses and to insulinomas during the 4-hour OGTT
o Time Functional hyperinsulinaemia Organic hyperinsulinaemia glucose Insulin glucose Insulin
o 0 min 5,8 (mM/L) 7,8 (mU/ml) 3,9 (mM/L) 19,4 (mU/ml)
o 30 min 7,2 19,1 5,5 30,5
o 60 min 8,1 30,4 6,1 51,4
o 90 min 7,4 28,5 4,4 90,7
o 120 min 6,3 26,3 4,1 79,2
o 150 min 5,9 25,2 3,3 69,4
o 180 min 4,3 24,0 2,8 66,3
o 210 min 3,9 18,1 2,1 68,4
o 240 min 4,6 13,9 2,2 55,4
o in organic hyperinsulinaemia (due to insuloma) the insulin levels do not follow the blood glucose levels and they remained high corresponding to the automacy of insuloma;

Hypoglycaemia in other tumors
o Mesenchymal sarcomas
o Mesotheliomas
o Severe hypoglycaemia can develop
o Insulin and C-peptide levels are normal
o IGF-I and IGF-II are elavated
o Therapy is surgical removal of te sarcomas (if it is possible)
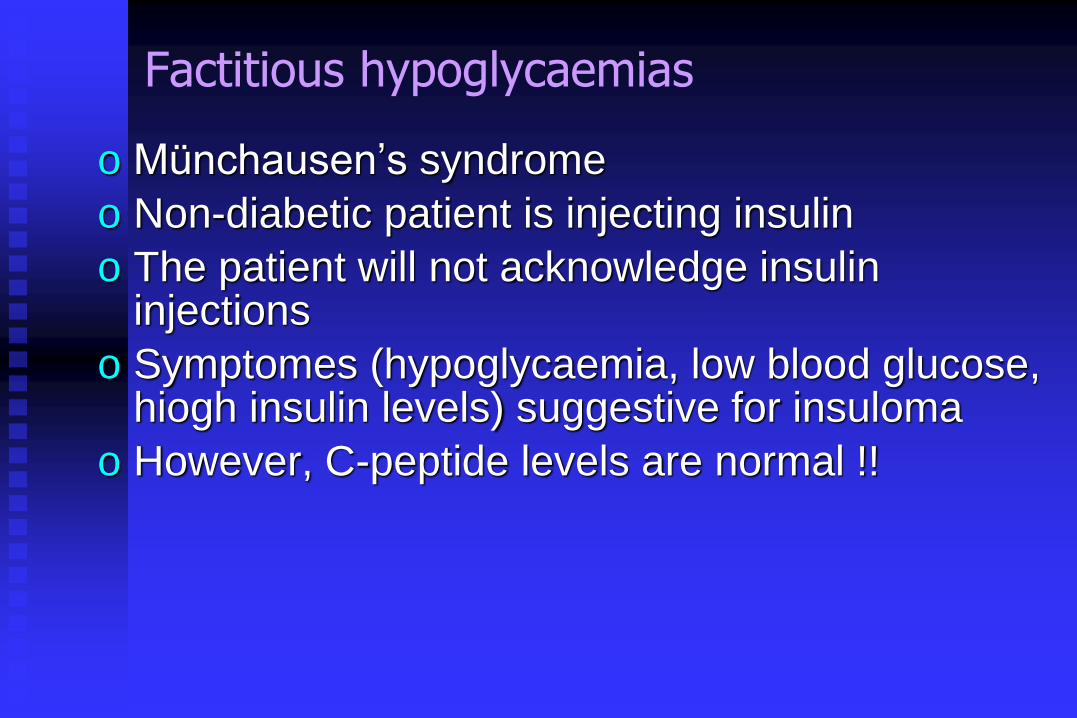
Factitious hypoglycaemias
o Münchausen’s syndrome
o Non-diabetic patient is injecting insulin
o The patient will not acknowledge insulininjections
o Symptomes (hypoglycaemia, low blood glucose, hiogh insulin levels) suggestive for insuloma
o However, C-peptide levels are normal !!