Embed Size (px)
Citation preview

REPAIR, EVALUATION, MAINTENANCE, ANDREHABILITATION RESEARCH PROGRAM
TECHNICAL REPORT REMR-GT-10
HIGH-RESOLUTION SEISMIC RE-FLECTIONco INVESTIGATIONS AT BEAVER DAM, ARKANSAS
by
~UIU Thomas L. Dobecki, Tanya L. NV ueller
Department of Geophysics< Colorado School of Mines
Golden, 'Colorado 80401
and
Monroe B. Savage
Instrumentation Services Division
DEPARTMENT OF TI-Z ARMYWaterways Experiment Station, IO orps of Engineers
P0 Box 631, Vicksburg, Mississippi 39181-0631
- - D'~I~ELi GTE
* o~AUG 41989
pla t d All ~ __I rwj) --
July 1989Final Rep )rt
Approved For F'-jblc Release; 1),sxrdbition Unlimited
P-repared for DEPARTMENT OF THE ARMYUS Army Corps of EngineersWashington, DC 20314-1000
Monitored by Geotechnical Le oratoryUS Army Engineer Waterways Ext e-riment StationP0 Box 631, Vicksburg, Missis;-ir. i 391F 1-0631
8
i

The following two letters used as part of the number designating technical
reports of research published under the Repair, Evaluation, Maintenance, and
Rehabilitation (REMR) Research Program identify the problem area under which
the report was prepared:
;roblem Area Problem Area
C7 Concrete and Steel Structures EM Electrical and Mechanical
G" Geotechnical E1 Environmental Impacts
H Hydraulics OM Operations Management
Cf Coastal
Destroy this report when no longer needed. Do not
return it to the originator.
The findings in this report are not to be construed as an
offizial Department of the Army position unless sodesignated by other authorized documents.
The contents of this report are not to be used for
advertising, publication, or promotional purposes.Citation of trade names does not constitute an
official endorsement or approval of the use of such
commercial products.
COVER PHOTOS:
TOP - Seismic Reflection Survey, Beaver Dam, Arkanisas.
I.. 1M iE -. Ccncept of Seismic Reflection.BO17 )M - Seismic Reflection Record, Beaver Dam, Arkalsas.

UnclassifiedSECURITY CLASSIFICATION OF THiS PAGE
Form Approved
REPORT DOCUMENTATION PAGE OMNo 07a4.0188
Ia. REPORT SECURITY CLASSJF CATJON "b RESTRICTIVE MARK:JGSUnclassified
2a SECURITY CLASSIFICATION AUTHORIT', 3 OiSTRi8UTION/ AVALABILITY OF REPORT2b DECLASSIFICATIONiDOWNGRADING SCHEOULE Approved for public release; distribution
unlimited.
4 PERFORMING ORGANIZATION REPORT NUMBER(S) S MON.TORiNG ORGANIZATION REPORT NUIMBER(S)
Technical Report REMR-GT-106a. NAME OF PERFORMING ORGANIZATiON 6b nFFCE SYMBOL 7a NAME OF MONITORNG ORGAN-ZAT!ONSee reverse 'if applhcabte) USAE1WES
Geotechnical Laboratory6c. ADDRESS (City, State, and ZIPCode) 7b 0, DRESS (City, Stmte and ZIP Code)
See reverse PO Box 631Vicksburg, MS 39181-0631
B& NAME OF FUNDING iSPONSORING So O;CCE SYMBOL 9 PROCL.,REMENT iNSTRUMENT DEN7IF.CATJON NUMBERORGANIZATIONI (if applicable)
US Army Corps of Engineer
Sc ADDRESS (Oty, State, and ZIP Code) 10 SO, RCE OF FUNDiNG NUMBERSPROGRAM I P=OECT 'TASK 'ORK UNITELEME1JT NO NO NO ACCESSO iC
W_h __to_, DC 234-_O__ WUI 3231511I TITLE (Inciude Security Classificati on)
High-Resolution Seismic Reflection investigations at Beaver Dam, Arkansas
12 PERSONAL AUTHOR(S)Dobecki, Thomas L., Mueller, Tanya L., Savage, Monroe B.
13a TYPE OF REPORT 13b TIME COVERED 14 DATE OF 3EPOPT (Year, Month, Day) I1S PAGE COUNTFinal report I ROMj.. j .TOJ 1uj A July 1989 9
5
16 SUPPLEMENTARY NOTATION
See reverse.
17 COSATI CODES 18 SI)BJECT TERMS (Continue on reverse if necessary and identfy by block number)FIELD GROUP SUB-GROUP Data processing Optimum offset Seismic reflection
Graben Seepage Seismic refraction
19. ABSTRACT (Continue on reverse if necessary and identify by block number)
Seismic refraction surveys require line lengths four to five times the desired depthof investigation. For many geotechnical applications, these are piysical ,nd gme..2...constraints which inhibit seismic refraction, such as narrow river valleys, changes indirection of the center line of a dam, or legal inaccessibility to land surrounding a site.The seismic reflection method offers an alternative to refraction for geotechnical siteinvestigations. Typical line lengths for reflection are approximately equal to the desireddepth of investigation. In the past, the required data processing, limitations of "engi-neering seismographs," and inapplicability of oil exploration seismic recording systems tovery shallow targets (< 30 m) precluded effective utilization of the seismic reflectionmethod for geotechnical applications. Rapid advances in microcomputer technology, develop-ment of digital engineering seismographs, development of high frequency seismic sources,
(Continued
20 DISTRIBUTION /AVAILABILITY OF ABSTRACT "21 ABSTRACT SECURITY CLASSIFICATION0 UNCLASSIFIED/UNLIMITED CM SAME AS RPT 0 DTIC USERS Unclassified
22a. NAME OF RESPONSIBLE INDIVIDUAL 22b TELEPHONE (Include Area Code) 22c OFFICE SYMBOL
00 Form 1473, JUN 86 Previous editions are obsolete. SECURITY CLASSIFICATION OF THIS PAGE
Unclassified

UnclassifiedSECURITY CLASSIFICATION OP TNIS PAGE
6A. NAME OF PERFORMING ORGANIZATION (Continued).
Department of GeophysicsColorado School of MinesUSAEWESInstrumentation Services Division
6C. ADDRESS (Continued).
Golden, CO 80401PO Box 631Vicksburg, MS 39181-0631
16. SUPPLEMENTARY NOTATION (Continued).
A report of the Geotechnical problem area of the Repair, Evaluation, Maintenance, andRehabilitation (REMR) Research Program. Available from National Technical InformationService, 5285 Port Royal Road, Springfield, Virginia 22161.
19. ABSTRACT (Continued).
and adaptation of oil exploration field procedures to account for inherent problems ofshallow depths of investigation now make shallow, high-resolution seismic reflection sur-veys a viable tool for geotechnical applications.
Field investigations of shallow, high-resolution seismic reflection methodology at anexisting structure site, Dike 1, Beaver Dam, AR are discussed. Dike I is built across agraben with vertical offset in excess of 70 m. The down dropped block consists of solu-tioned, cherty limestone. The top of rock is highly irregular, and solution cavities andsolution-widened joints exist in the rock. The seismic reflection results effectivelymapped the irregular top of rock (3 to 10 m dipth). detected previously unknown faultswithin the graben, and mapped sandstone and shale formatlon5 at the "base" of the graben(70 to 75 m depth). . -
Accesion For
NTIS CRA&I
DTIC TAB 0Unannounced 0
Justification
ByDistribution
:? Availability Codes
(\ ~dAv indior
Dist specill
Unci~qSECURITY CLASSIFICATION OF THIS PAGE

PREFACE
This work was performed from July 1985 to January 1986 by personnel of
the Department of Geophysics, Colorado School of Mines (CSM), Golden, CO, and
Instrumentation Services Division (ISD), US Army Engineer Waterways Experiment
Station (WES), Vicksburg, MS. The work was supported under an Intergovern-
mental Personnel Act Agreement between CSM and WES. This work was jointly
funded by the Repair, Evaluation, Maintenance, and Rehabilitation (REMR)
Research Program, Work Unit 32315, "Geophysical Techniques for Assessment of
Existing Structures and Structural Foundations," and the Little Rock District,
Corps of Engineers under Intra-Army Order No. 85-0045. The fieldwork was per-
formed during August 1985 and benefited greatly from the use of rental eauip-
ment and field personnel labor covered by Contract DACA 39-86-K-0008, "Active
Geophysical Methods Applied to the Tunnel Detection Problem." The Technical
Monitor was Mr. Ben Kelly.
CSM Principal Investigator for the work was Dr. Thomas L. Dobecki.
Mr. Monroe B. Savage, ISD, WES, and Messrs. Thomas Kertesz, Jeff Meis, and
Scott Stephens, CSM, were responsible for field data acquisition. Data
processing and interpretation were performed with the additional assistance of
Ms. Tanya L. Mueller, CSM. Technical monitoring was performed by Dr. Dwain K.
Butler and Mr. Jose L. Llopis, Geotechnical Laboratory (GL), Earthquake Engi-
neering and Geophysics Divison (EEGD), who were also Principal Investigators
of the REMR Work Unit. Mr. Jerry Huie, Engineering Geology and Rock Mechanics
Division, was the Geotechnical (Rock) Problem Area Leader, and Mr. William F.
McCleese is REMR Program Manager. Dr. Arley G. Franklin is Chief, EEGD, and
Dr. William F. Marcuson III is Chief, GL. The report was edited by
Ms. Odell F. Allen, Information Management Division, Information Technology
Laboratory.
Acting Commander and Director of WES during the preparation of this
report was LTC Jack R. Stephens, EN. Technical Director was Dr. Robert W.
Whalin.
L1

CONTENTS
Page
PREFACE ................................................................. I
PART I: INTRODUCTION ................................................. 3
PART II: GEOLOGIC SETTING ............................................. 5
PART III: SEISMIC REFLECTION COMPARED WITH STANDARD SURVEYS ............ 8
PART IV: DATA ACQUISITION ............................................. 11
Instrumentation ................................................... 11
Line C-i .......................................................... 12Line C-2 .......................................................... 15Line C-3 .......................................................... 16Vertical Seismic Profiling Data ................................... 16
PART V: DATA PROCESSING .............................................. 17
ES-2420 Processing ................................................ 17
C.G.G. (Lines C-i and C-3) Processing ................................. 23C.G.G. (Line C-2) Processing ...................................... 31Data Quality and Cost Comparison (ES-2420 versus C.G.G).............. 32
PART VI: GEOLOGICAL INTERPRETATION .................................... 35
Deep Basement Structure ........................................... 35
The Weathering Layer .............................................. 35Comparison of Field Methods Used .................................. 45
PART VII: SUMMARY AND CONCLUSIONS ...................................... 51
REFERENCES .............................................................. 53
PLATES 1-4
APPENDIX A: GLOSSARY ................................................... Al
2

HIGH-RESOLUTION SEISMIC REFLECTION INVESTIGATIONS
AT BEAVER DAM, ARKANSAS
PART I: INTRODUCTION
1. Shallow seismic stratigraphic surveying has been ignored typically
by the engineering industry as a tool for finding shallow anomalies and
delineating weathered zones that may adversely affect foundation conditions.
The Beaver Dam project attempts to show that the use of high-resolution seis-
mic data can be important to studies of fractures, cavities/voids, irregular
(weathered) top of rock, and other near-surface anomalies. Three seismic
reflection lines were shot downstream from the face of Dike No. 1, Beaver Dam,
AR, which is known to be leaking impounded water through subsurface foundation
formations. Although other geophysical methods have been used at the damsite
in hope of finding where and why leakage (Unomalous seepage) occurs, it was
hoped that high-resolution seismic reflection surveys could give an even more
accurate idea of where faulted zones are located and their relationship to
observed leakage. Further, with the Corps of Engineers program for certifica-
tion and rehabilitation of existing dams, it was felt that Beaver Dam would
provide an excellent test case to evaluate the utility of seismic reflection
for evaluating anomalies related to seepage.
2. The Beaver Dam seismic reflection project was undertaken by the
Colorado School of Mines (CSM), Geophysics Department, with several goals in
mind. Because of the known foundation structural problems mentioned, the
earthen Dike No. I has been under scrutiny for anomalous seepage since it was
built. It was hoped that high-resolution seismic data could resolve both
basement structures (more precisely define fault zones) and in addition,
resolve suspected large rugs*, voids, or zones of intense wtathering.
3. Dike No. I is situated just north of the main concrete dam and
embankment and occupies a low bedrock area which would otherwise be below pool
level. Geologically, the dike straddles a graben of estimated 305-m width and
76-m throw. This downdropped section has brought a vuggy carbonate formation
* Specialized and perhaps unfamiliar geophysical terms that are underlined
are defined in Appendix A.
3

(see Part II) down to a lowered elevation such that it is the foundation rock
for the dike. It is well above the top of the main embankment. This circum-
stance and the fracturing attending the graben boundary faults are suspected
to be the causes of seepage detected along the face of and downstream from
Dike No. 1.
4. The US Army Engineer Waterways Experiment Station (WES), as part of
its REMR research program, is investigating the use of seismic reflection for
the evaluation of existing dams and adjacent structures. At Beaver Dam, WES
has already employed seismic refraction, electrical resistivity, magnetic,
electromagnetic, ground penetrating radar, and self-potential (SP) surveys
along the dike. These surveys (US Army Corps of Engineers 1986; Llopis and
Butler 1988) have pointed out anomalous conditions at the soil-rock interface
(refraction) and localized fluid flow patterns (SP). WES felt, however, that
Beaver Dam would be an ideal site for testing the utility of seismic reflec-
tion, given the parallel refraction and extensive SP data, ground penetrating
radar, and borehole investigations already performed at this location. Given
the shallow penetration of radar and refraction (because of thick, relatively
uniform velocity stratigraphy and the physical limitations or refraction
survey line length) and the sensitivity of SP to flow and not structure,
seismic reflection surveys can provide the following information:
a. Lateral location and description of boundary and any otherfaults which affect the upper (approximately) 0 to 300 m.
b. Detection of localized cavities/voids associated with the vuggyBoone formation and/or faulted zones.
C. Correlation of the above with patterns of seepage determined by
other means.
5. An additional purpose in the seismic reflection investigation was to
evaluate different instrumentation and data acquisition methodologies to
determine optimal means for acquiring such data while retaining high data
quality.
4

PART II: GEOLOGIC SETTING
6. Beaver Dam is located on the White River, Ozark Uplift in Northern
Arkansas (Figure 1). The dam and other structures are founded on flat-lying
Paleozoic carbonate sedimentary rocks. The region is quite hilly as the White
River and its tributaries have steeply dissected these carbonates. Five of
these Paleozoic formations outcrop in the vicinity of the dam; these are named
and described in Figure 2. It is important to note that the Boone formation,
a cherty limestone, is the host rock for most of the springs and natural
caverns found throughout this region (US Army Corps of Engineers 1986).
7. The presence of this formation in the region of the dam might have
caused grave concern initially had it not been for the fact that the Boone
formation is situated at an elevation above the dam and reservoir on the south
abutment. The misfortune is that these flat-lying sedimentary rocks have been
offset by normal faulting such that Dike No. 1 occupies a graben where the
rocks have been downdropped in excess of 250 ft (76 m). As such, the founda-
tion rock for Dike No. i is indeed the Boone formation. Much of the leakage
observed is therefore felt attributable to the deteriorated character of this
soluble foundation rock and its deformation and fracturing resulting from the
close proximity to faulting.
8. In terms of candidate reflecting horizons in the Dike No. I area,
likely candidates, listed by increasing subsurface depth are:
a. Fill/weathered rock interface.
b. Weathered/solid rock interface.
c. Boone/Chatanooga/Sylamore contacts at -200 ft (61 m).
d. Dense or weak zones within the Cotter fm (Figure 2).
e. Crystalline basement (suspected depth >1,500 ft (457 m).
5

- "11
- -~ -- -- _ -- -

S 8 S 'T U
0 0 CP AT I E o-E s r N
SER
01 T E .
t;f E3
0 ' KE NO I2,
SO
H
KIRK( MOUNTAIN N, j~- EQuARRY SITE
R
f) T
A ___l __ __ _
I' NoD0
M N..s o. . . .... ...
Figure 2. Strat 4graphi'.column at Beaver Dam sit
G F 11 i I I -o
A'400 001059 W C-41- 0
C' "E ND 2, coo ~21t' .4 0 isl ..o xo4O,0 0 ,s50)DiKE NO ~ ~ ~ ~ ~ ~ ~ ., 3-- - I. _ t. T'.. o .t..oo "~40.K~qwi.
2.0*1 D A M -i ' ' 2 6 !0 5 14 0 *OC0.Z11 T4 c0 1 3 O h
D'K. NC:)SO 2'00 ... ,IS. so4 0
41.: 1. s t~f 4o 1-to 1 E. A04,.53
F 1 ~~ 4± 5 . o. ~'z o1t
D E 0 2± 7 ~ .qe..o ss, o~Oiso0 t.
30tj 9 1 ;71'l04 n4' ll! -- o4* 450ll .1 1-4 BI
%BAINN~ 0D4M A- 44. 004400% l04 LIwo wn.Rm.
CONCRETE - V T ~Wii
30 000. 00 O to..OO 0040 1".4 mt..0 "I "d5 -- I
R 20+1, 3)40 M3k OO t IC "114 00 1oIC-t10 *
40000W 11 .5 0[.M0 IaS t'll-.440.
Figure 2. Stratlgraphic column at Beaver Dam site
7

Ii|
PART III: SEISMIC REFLECTION COMPARED WITH STANDARD SURVEYS
9. Traditional geophysical surveys in support of geotechnical site
characterization have been dominated by (a) seismic refraction (b) cross-hole
seismic testing, and (c) electrical resistivity (Dobecki and Romig 1985).
Refraction in P- and S-wave modes provides fairly rapid areal coverage of a
site yielding the depths (thicknesses) and configuration of subsurface layers
as well as the compressional and/or the shear-wave velocity of each layer.
This is true provided that the velocity of each successively deeper layer
exceeds that of the layer above it. Even if this is satisfied, error can
arise if a given layer is thin ("thin" may be as thick as several tens of
meters); in such a circumstance, the thin layer escapes detection by refrac-
tion methods. Therefore, either low-velo-ity zones or thin, high-velocity
layers may be missed by refraction even if the data were obtained perfectly
(noise free). From an operational standpoint, refraction becomes difficult if
the targeted refraction horizon (e.g. bedrock) is deep. The required
shotpoint-to-geophone separation ("offset") to map the target effectively will
be roughly three to five times the depth of the target. This requires long
lines, which increases the chances for error due to lateral velocity varia-
tion. This also requires higher energy seismic sources such as dynamite to
accommodate for added attenuation of signal strength over the long travel path.
Oftentimes, logistical, topographic, or political influences can limit the
surface area available for data acquisition as well as the nature and strength
of seismic sources which could be used. Finally, in areas of complex subsur-
face geology, refraction Interpretation becomes extremely complicated (Palmer
1980).
10. Cross-hole seismic testing eliminates some of the problems asso-
ciated with refraction by providing very fine sampling of the subsurface P-
and S-wave velocity distribution with depth by making these as time-of-flight
measurements between boreholes. This is obtained however at the expense of
the areal coverage obtained from refraction and with the expense of drilling
two or more drillholes. As with refraction, some error may be associated with
thin beds, particularly low velocity thin beds, but this error may be cor-
rected if the presence of such thin beds is suspected (Butler and Curro 1981).
Still, even given perfect data, no information is available from depths
greater than that of the boreholes themselves.
i8
-I

11. Electrical resistivity in most geotechnical applications finds its
greatest use in determining depths and/or shapes of saturated zones (such as
water table or water-filled fracture zones) or in locating other conductive
horizons (clay seams and highly weathered rock). Unlike the seiRpiic methods,
resistivity is not based upon elasticity theory. The only relationships which
relate resistivity directly to rock strength parameters are empirical and
highly site specific (Keller 1974). Further, since resistivity is a potential
field technique (as opposed to a wave propagation technique), its resolution
is theoretically much less than seismic methods.
12. Under many circumstances, the combination of these three techni-
ques, tied to an exploratory borehole program, is totally adequate to support
a geotechnical site investigation. The obvious situations where these would
be inadequate include:
a. Sites where required depth of investigation exceeds(approximately) 50 to 100 m.
b. Sites characterized by the occurrence of low velocity layerssuch as clay layers or subhorizontal fracture zones at depth.
c. Sites with thin or small target zones in the subsurface whichmight otherwise require an extensive boring program.
d. Sites of limited access or of other logistical restriction(e.g. no explosives, presence of surface steel structures,etc.).
For such sites, the use of seismic reflection may be appropriate.
13. Seismic reflection uses shotpoint-to-geophone offsets comparable to
the depth of the target as opposed to three to five times the depth for
seismic refraction. This allows for shorter geophone spread lengths and
smaller source energies for a given depth of investigation as compared with
refraction. It is effective at detecting both high- and low-velocity beds at
depth, although determination of the bed's velocity is not done very
accurately. Reflection can also detect "thin" beds if the thickness of the
bed is somewhat greater than 1/8 the dominant seismic wavelength. Increased
resolution implies an increased bandwidth in the seismic wave/signal. Many of
the shortcomings of refraction, cross-hole, and resistivity can therefore be
eliminated or reduced with the addition of reflection to the geophysical
investigation program.
14. Seismic reflection 1--wever has inherent problems of its own.
Principally, obtaining good -rabiguous reflection data free from interfering
9

"noise" (e.g., ground roll, airwave, refractions) can be very difficult.
Obtaining good refraction data is generally quite easy; it may not be inter-
pretable, but it is easy to acquire. Great care in instrumentation, field
geometries, procedures, and subsequent data processing, however, are required
just to produce a visible and coherent reflection on a record section. This
requires greater skill on the part of the geophysicist. Once the reflection
has been recorded with fidelity, interpretation itself is much less cumbersome
than with refraction or resistivity.
10

PART IV: DATA ACQUISITION
Instrumentation
15. Seismic data were acquired using a 24-channel digital data acquisi-
tion system. The key specifications of this instrument are given below.
Acquisition Control Unit (ACU)
Sample interval menu selected from 1/4, 1/2, 1, 2, or
4 msec
Low cut filters menu selected from 5 to 320 Hz in 5 Hz
increments; 18 db/octave
Alias filters menu selectable; down 80 db at 128,256, 512, 1,024, 2,048, and 4,096 Hz
Notch filters menu selectable; 50 to 60 Hz (60 dbdown)
Acquisition mode write digital data direct to tape orinto mass storage memory, then to tape
Run time limited only by available memory,typically 4.096 sec at 1/4 msec;8.192 sec at 1/2 msec; etc.
Channels 24
Word size 15 bits plus 4-bits exponentrepresenting 6 db gain steps
Amplifiers Instantaneous floating point
Stacking No limit to summing of successivesignals
Display CRT with menu selected fixed gain,fixed gain normalized, or digitalAGC playback
Plotter
8.5 in. wide electrostatic paper;
print contents of full CRT memory
Digital Tape Recorder
Spec's 7.5 in. reel, 1,200 ft tape, 1,600 bpiFormat SEG D; menu selected multiplex or
demultiplex
11

Post Acquisition Processor (PAP) Programs Availabli
Bandpass digital filtering of raw or
processed data
Common offset gather
NMO correction
Transient suppression
Trace edit
Mute
FFT
Constant velocity CDP stack
16. Of utmost importance were the features of 15-bit recording (high
dynamic range) instantaneous floating point amplifiers (rapid, accurate data
acquisition) and post acquisition processing capability (in-field data
analysis). WES itself has 12- and 24-channel "engineering" seismographs
which it may wish to use for similar purposes on future projects. These
seismographs do not have many of the special features of the CSM system.
However, our procedures and analysis always kept the WES systems in mind to
determine how appropriate these might be in their current format and/or how
they might best be modified to allow for this usage.
Line C-i
17. Line C-i runs, for the most part, coincident with SP Line C
(Llopis and Butler 1988). It is roughly North-South, extending from north of
the northern fault zone, across the downstream berm of Dike No. 1, across the
southern fault zone, and part way down the main embankment (Figure 3). The
line was flagged at 5-ft (1.5 m) intervals with Flag C-i at the North and
Flag C-359 at the South for a total line length of 1,790 ft (546 m).
18. Line C-I was shot in common depth point (CDP) roll-along fashion as
follows:
a. An optimum offset (distance from shotpoint to first of24 geophones) of 12" ft (38 m) was determined by test shootingat several offsets.
b. Twenty-four geophone stations spaced at 5-ft (1.5 m) intervals
were used (Figure 4). Each station is an array of six single
geophones.
12

A.-, -a4
00
LLa)
-4
13 4

c. Each geophone station consisted of an array of six, series
connected, 24 Hz geophones at 5-ft (1.5-m) element spacing.
d. The seismic source employed was three stacks of a shotgun shell("Buffalo Gun") in a 2-ft (0.6-m) augered hole.
e. After recording, the entire arrangement was "rolled up"(advanced) two flag positions (10 ft or 3 m) and repeated.
SHOT POINT ~~0 0 0 0 0 0 C0 0 0 0 0 ,0 CC
SHOT POINT GEOPHONE GROUPS
5'Figure 4. Shot, geophone layout for one shot record, Line C-1
19. The choices of offsets, geophone groups versus single phones, and
Buffalo Gun source versus sledgehammer were based upon preliminary test
spreads in the center of the graben area. The target reflector for this line
was the Chatanooga/Sylamore beds at an estimated 250 ft (76 m) depth.
20. The resulting CDP coverage, given 24 geophone positions per shot
and advancing the shot two stations between shots, is a maximum of
6-fold stack. Subsurface reflection point spacing is one-half that of the
geophone spacing or 2.5 ft (0.8 m).
14

Line C-2
21. Line C-2 overlapped part of Line C-I by using geophone stations at
Flags C-171 through C-290 for a total line length of 595 ft (181 m). The
differences in Lines C-i and C-2 are how the data were acquired and what the
target reflector was. The target reflector was the top of sound foundation
rock estimated at 15 to 70 ft (4.6 to 21 m) from boring and WES refraction
data along Dike No. 1.
22. With a shallow target, the shot-geophone offset was changed, and a
switch was made from geophone groups to single geophones. The offset should,
by the rule of thumb, be on the order of the target depth. The use of single
phones for shallow reflections is because arrays tend to smear the high
frequency components of the reflected signal if the reflection path is not
near vertical. For a shallow reflection, this path is surely nonvertical.
Therefore, Line C-2 was shot in CDP roll along fashion as follows:
a. An optimum offset of 15 ft (4.6 m) was used.
b. Twelve geophone stations spaced at 5-ft (1.5 m) intervals were
used (Figure 5).
c. Single, 100 Hz vertical geophones were used.
d. The seismic source employed was four stacks of a sledgehammer
on a steel plate.
e. After recording, the entire arrangement was rolled up one flag
position (5 ft or 1.5 m) and repeated.
In addition, ground roll reduction was obtained by employing a 320 Hz low cut
filter (analog) prior to digitization. The resulting CDP coverage also was
six fold with a subsurface spacing of 2.5 ft (0.8 m) for reflection points.
515
Figure 5. Shot, geophone layout for one shot
record, Line C-2
15

Line C-3
23. Line C-3 was also an overlap of Line C-I but from Flags C-194
through C-337 for a total line length of 715 ft (218 m). Line C-3 had the
exact same target as Line C-i and was acquired as a practically redundant data
set. The principal difference was in the source and receivers used for the
two lines. Line C-i was a time-consuming and labor intensive effort with each
geophone station requiring the planting of six evenly spaced geophones (6 x 24
- 144 geophones per shot) and the shot requiring the augering of a hole and
reloading the Buffalo Gun for three shots. The difference in data quality can
be compared between such a painstaking approach with data acquisition and a
quick and inexpensive approach. Therefore, the same offset, spread lengths,
and instrumental parameters were used for Lines C-i and C-3. Single, 100 Hz
geophones were used in place of groups, however, and nine stacks of a sledge-
hammer on a steel plate replaced the Buffalo Gun. The two lines therefore had
the same CDP coverage over a common 715 ft (218 m) length. But Line C-i
required 2 days to cover this length; Line C-3 covered it in less than I day.
Vertical Seismic Profiling Data
24. The original plan for our survey was to tie the reflection data to
well data via vertical seismic profiling (VSP) in several of the test wells.
These tests were not successful as all holes had caved or were at least
bridged over at shallow depth such that the borehole seismometer could not be
advanced. Hole BE-2 was closed 90 ft (27 m) depth; no other hole (BE-1, BE-3,
or BE-4) was open as deep as 50 ft (15 m).
16

PART V: DATA PROCESSING
25. Lines C-i, C-2, and C-3 were initially processed in rough form on
the ES-2420 field acquisition unit. The lines were then processed again using
the state-of-the-art processing software available at Compagnie General de
Geophysique (C.G.G.) American Services in Denver. Due to the limited use of
seismic techniques for engineering projects, the two processing methods were
to be compared for feasibility and quality versus cost.
26. The ES-2420 processing was limited to full trace filtering, normal
moveout (NMO) at constant velocity, and CDP stack or gather. The processing
possibilities at C.G.G. were virtually unlimited except by cost and time
constraints.
ES-2420 Processing
27. Limited processing procedures are available on the ES-2420 includ-
ing editing, NMO correction (at constant velocity), common offset gather, and
CDP stack. All of the lines were initially processed on the ES-2420 as a pre-
liminary product for inspection of data quality and for comparison with other
processing systems. The total ES-2420 processing for the Beaver Dam data
required little more than I week. Elevation statics were not applied
(although the ES-2420 does have statics capabilities). The results were
encouraging but by no means the best possible from the data set.
28. Lines C-i and C-3 (see Figures 6 and 7) had obvious noise problems
which are discussed in detail in subsequent sections in addition to statics
problems. The ES-2420 cannot do deconvolution or time-variant filtering,
which seemed to be necessary. In addition, variations in velocity, both
lateral and with time, could not be accounted for by the ES-2420. Line C-2,
on the other hand, could be processed satisfactorily using a single velocity
function and thus was less affected by the restraints of the ES-2420. Gener-
ally, good results were obtained on Line C-2 by effectively eliminating traces
contaminated by noise within the zone of interest while the processing of
Lines C-i and C-3 was far from satisfactory. Little improvement could be
achieved on Line C-2 by further processing as explained later in the process-
ing section.
17

SHOT POINT 67 SHOT POINT 7
-0.0
_0.025
AUTOGORRELATION
.125.... -0.025
.- . . .......
o0.0-0.
0.100~ .... . .
-~---~- - ~ - 0.025
0.25
0.3500
0..025
- ,, JT~',j~\, 'A~)~- 0.350
Fiur 6.Baer.m in - ufleedrcr

OB NPLITUOE SPEC Tpljti0
-12
LATION -24
-- 4
- 0.025
-60 _ _ _ _ _ _ _ _ _ _ _ _ _ _ _ _ _ _ _
....... 6 400 F~ HZ]J
- 0.0 0 _ _ _ _ _ _ _ _ ___ __ _
ISHOT POINT 1, TRACE 12
- ~~-12 ________1__________
0.025
- ~~-24 _____ _
- 0.05 __ __ __3_ 6___ _
-48 ______
DB 400FHZ
-,unfiltered records

0
SHOT POINT 40 SHOT POINT 16-12
0.0 -=0.0
0.025 -24
AUTOCORRELATION
0.050 -___ 3
-- 0.050.075 ---. .
- -46
-- 0.025
- -- DB 0j
0 .1 5 0j
z - -0.000. 175 0
0. 200u zzzz.' -12
- _ ___ - ____ - 0.025
- - . ~ -- 24
____ -0.050 1::0.300-4
0.325
-6 0
0.350 D
Figure 7. Beaver Damn, Line C-3, unfiltered records

RM1PLITUDE SPECTRUM0
1
SHOT POINT:16 TRACE:12
-24
TOCORRELATION
- -.- ---. 05
- - - -0.025
DB 0 400 Fi HZ'
-0.0
SHOT r' N' C 7PCEi 12
- 0.025 -2__ _ _ _ _ _ _ _ _ _ _ _ _ _ _ _ _ _
-24
-0.050 -35
-48 ___ _
-601 1 -
DB 0 400 F HZI
r Dam, Line C-3, unfiltered records

29. The ES-2420 was a good processing tool because velocities and trace
edits could be determined prior to the more expensive C.G.G. processing. This
type of processing could be done in the field immediately after acquisition to
determine any problems that could be corrected by changing field parameters.
C.G.G. (Lines C-i and C-3) Processing
30. Lines C-i and C-3 were intended to allow a direct comparison of the
best result from the two distinctly different approaches to acquisition. The
C.G.G. American Services Geomax software was used in an effort to give such
shallow high-resolution methods a fair opportunity to be tested with state-
of-the-art processing modules. The processing sequences for the two lines
were made as parallel as possible for comparison purposes.
31. An outline of the processing sequence for Beaver Dam, Lines C-i and
C-3 are listed below.
a. Demultiplex and reformat.
b. Gain compensation for transmission loss and sphericaldivergence.
c. CDP sort.
d. Geophone edit.
e. Shot and trace edits.
f. Statics to flat datum.
. Spiking deconvolution.
h. Operator length = 40 msec.
i. Window from 62.5 to 250 msec.
2. Automatic residual statics.
k. Velocity analysis.
1. NMO correction.
m. Mutes.
n. Automatic residual statics.
o. CDP stack.
p. Time variant band pass filtering, 72/88-240/280 Hz, TO -
TI0 msec, 72/88-180/220 Hz, T150 - T500 msec.
s. Dynamic trace equalization.
r. Statics to floating datum (end point for final stack).
s. Wave equation migration.
23

t. Band pass filtering.
u. Dynamic trace equalization.
v. Film display.
32. The sequence is similar to a simple sequence for normal deep
seismic processing but with some differences. The major problems with these
two lines were:
a. Optimizing filters.
b. Removing airwave noise and groundroll.
c. Choosing velocity functions near surface.
d. Resolving statics.
33. One difficulty with the data acquired in engineering geophysics
projects is that the acquisition methods differ radically from normal deep
seismic reflection data acquisition. The high-resolution data are often
recorded at fractional sample rates such as 0.25 msec. Also, the data lengths
are typically very short, such as 500 msec. Although this might not seem to
be a problem, it can be when processing with software tailored to normal seis-
mic reflection acquisition parameters. Many processing packages cannot handle
decimal sample rates as in this Arkansas project; therefore, the headers had
to be changed on an alternate computer (a Raytheon) to "fool" the system into
believing that the sample interval was I msec with a data length of 2,000 msec
instead of 500 msec. All subsequent processing was then done as if the data
were 2,000 msec. Velocities and frequencies, entered as one-quarter of their
real values, had to be converted back to real values before analysis. The
short data lengths were also a problem in some cases. Line C-2, which had a
data length of only 200 msec (800 msec in processing time), had problems in
filtering solely because the application window of the filters for optimum
efficiency was nearly as long as the whole data set and, in some cases, longer
for the lower frequencies.
34. Extensive testing was deemed necessary to resolve these probiem,
particularly because high--resolution shallow seismic data processing has been
relatively unexplored.
Filtering
35. Both of these lines had 25 Hz high pass field filters. Figures 6
and 7 show the amplitude spectrum, autocorrelation, and a pair of raw records
from each line. The data are dominated by low-frequency groundroll (Rayleigh
surface waves) and high-frequency airwave. More airwave was experienced where
24

• l I I I I i
shooting over hard ground occurred because deep holes could not be drilled. A
low cut of 36 Hz and a high cut of 280 Hz were used on the data, as suggested
by a harmonic filter test. Both lines were improved, but a bad data zone
still resulted from the airwave and groundroll, particularly on Line C-i. It
was hoped that an F-K velocity filter would eliminate the noise without remov-
ing reflection data within the upler frequency range. While the airwave was
obviously slower velocity than any data, this method proved to be fruitless
due to the fact that the frequency of the noise was very high. Thus, when
transformed to the F-K domain, the wave number over which the filter was
applied corresponded to a frequency which was far below that of the noise.
This type of filter works much better on noise that is low frequency as well
as low velocity such as groundroll. The only alternative was to lower the
high- and low-cut frequency and use that to reduce the frequency content of
the data. Figures 8 and 9 show the final filtered records and their amplitude
spectra. The bulk of the amplitude spectra lost at high-frequency noise.
These were the final filters used on these data.
Velocity analysis
36. Near surface reflections were very sensitive to velocity change
while deeper events (> than 100 msec) were completely insensitive to change
because their moveout is nearly flat for such short spread lengths. Unfortu-
nately, slight changes in the velocity of shallow reflections change their
character but do not identify necessarily which velocity is correct. The
lateral velocity variation reflects the boundaries of the graben and the
vuggier zone between them.
Deconvolution
37. A spiking deconvolution was used to collapse the wavelet using an
operator length of 120 msec. Several operator lengths and white noise levels
were tested. The data were rather steady state in quality once a length of
120 msec was reached; therefore, while deconvolution is necessary, little
testing is necessary. A medium length operator used in a spiking deconvolu-
tion routine with about I percent white noise should be sufficient as long as
an impulsive source is used.
Statics
38. Near surface problems, including those created by fault zones, had
to be resolved on these lines. Two passes of surface consistent of short
wavelength automatic statics were run to resolve problems created by
25

SHOT POINT 67 SHOT POINT 7
... 02...5 AUTOCORRELATION
0.050 --
0.075 ___-0.05
0.100 -__ -- 4
-0.125- _ _ -0.025
0.150 - - __-
OiE
0. 17 -0.0
0
0. 200w
0. 225 U. -0025
0.275 -- 0.05 -
0.300- _ _
0.325
0.350
Figure 8. Beaver Dam, Line C-1, time-variant filtered re,

05 RNtPLITUDE SPECTRUI
TOCORRELATION-2
-- 0.05 -
_____ 0.025
________F(HZ
OB 400
___ __ _ 0.0 0 - _ _ _ _ _ _ _ _ _ _ _ _ _ _ _ _
JSHOT POINT T. RACE 12-12 -
_______ __ _
-0.025
-0.05 -36 -
-48 ____
-60____ _
DB 400 Ft HZ)
;A1ne C-1, time-variant filtered records

OB
0
SHOT POINT 40 SHOT POINT 160.0 -12
0.025- AUTOCORRELATION-2
0.050- -0.05
-- 0.22-5
S-------60
0o.50- 0.0 O8
W -
0.20-L 0.025 -12
E0.225 - __
_ - ____-24
0.250 -- 0.05
E0.275-4
o.325-6
0-350 D
Figure 9. Beaver Dam, Line C-3, filtered record

08AMPLITUDE SPECTRUM0
SHOT POINT 16 TRACE 12
-12
OCORRELATION -24
_ 2 -- 0.05
- -36
-- 0.025 -48_ _ _ _ _ _ __ _ _ _ _ _ _ _ _
-0.0 06400 F eHZ)
0 _____________________________
-SHOT POINT 40 TRACE 12
-aA 0.025 -12F
- -~~24_ _ __ _
-0.05
-36 1 -----
DB 400 F (HZ)
er Dam, Line C-3, filtered records

perturbations in the weathered zone. This was particularly important since
elevations were not surveyed. Elevations were hand picked from topographic
maps and from elevations of piezometers spaced along the line. Future engi-
neering projects would likely benefit from accurately surveyed elevations and
station locations. Elevations in this case were probably within tolerances of
1/2 ft (0.15 m). In addition, weathering velocities are well known based on
refraction surveys; thus, datum statics are probably very good. Correct
weathering velocity is crucial for shallow reflection surveys to the extent
that, if necessary, reconnaissance drilling or seismic refraction surveys
should be commonplace before such work to avoid large errors in datum statics.
Migration
39. Although sedimentary dip was not really a problem at the Beaver Dam
site, migration was deemed necessary to collapse any diffractions from fault
planes. A wave equation migration routine was tested beginning with values
recommended for traditional seismic work and adjusted from that point. Several
combinations of downward continuation step size and velocity function were
tested. While the data were somewhat sensitive to velocity, the most critical
value was the increment for each downward continuation iteration. Due to the
frequencies and times involved in these data, the step had to be smaller than
normally used even in steeply dipping areas. The best migration obtainable
within the time frame available to use was achieved at 90 percent stacking
velocities with an increment of about 6 msec per downward continuation
iteration.
40. Further investigation of migration for shallow high-resolution
seismic data is needed. It is possible that other migration methods such as
finite difference migration or partial or full prestack migration might be a
better method for these data. These methods were not tried in this study due
to time constraints.
C.G.G. (Line C-2) Processing
41. Line C-2 was shot expressly for the purpose of examining the near
surface, or more specifically, the weathered layer/rock interface. Addi-
tional processing (over that done on ES-2420) was limited to filtering, very
minimal muting, constant velocity moveout, and stack. Deconvolution was
abandoned because the low signal to noise ratio would not allow the filter to
31

stabilize. Data were not corrected for statics other than datum statics. Inthis case, the ES-2420 processing was probably sufficien t, in fact better than
the more expensive option. This was mainly in light of the fact that the SEGD
tapes had header errors that would not allow C.G.G. to read all of the records
making this data set incomplete.
Data Quality and Cost Comparison (ES-2420 versus C.G.G.)
42. Lines C-I and C-3 were most obviously improved by the additional
processing at C.G.G. Figure 10 (with the ES-2420 section of Line C-i on the
left and the C.G.G. processed section on the right) illustrates the character
differences between the two methods. Time scales are similar; the C.G.G.
horizontal scale is about one-half the ES-2420. Most obvious differences are
frequency content (ES-2420 dominated by groundroll), C.G.G. migration elimina-
ting the large diffraction (at 75 on ES-2420), and better definition of faults
on the C.G.G. section. The more advanced processing techniques improved the
frequency content of the data by about 130 Hz. Most likely, the capability of
using multiple, time-variant velocity functions can be credited with the dras-
tically improved frequency of the data. On Line C-1, time-variant filtering
reduced airwave noise without diminishing the data quality.
43. Continuity was improved by static corrections, thus emphasizing the
fault zones. Time and space variant velocities also improved the continuity
of the data on both Lines C-I and C-3 to well beyond that achieved on the
ES-2420.
44. On Line C-2, the different processing methods made a minimal dif-
ference. It is possible that for weathered zone surveys, field processing may
be sufficient, mostly because constant velocity functions can be used. How-
ever, on these shallow surveys, correct elevations are most critical and
should be incorporated via datum statics application (available on ES-2420,
but not used in this example).
45. In terms of cost, processing on the ES-2420 involved about 2 weeks
rental cost or about 7,000 dollars, which is about 6 dollars per stacked trace
on Line C-i. The processing at C.G.G., which is probably representative of
computer time cost at any data processing service company, came to about
7,000 dollars including filming and copies. For the processing alone, this
amounts to about 7 dollars per stacked trace on Line C-i.
32

(S(NO03S) 3WII1
0 0 0
A..._A A i . A
-. AA I .. A. ,1 *.... * A ...*a, - a a, AA A
t i.A. A.
1 & & .*a& aL -i hA.".Z.- i- A.AA L
A-]] i AA i.Ai -A&A A .. ka. 1 CiA$.-~' -h ~ &£ A A
LAAA . A A. ' I A A A 0
A IA- A- - ', ' " - A... ,A A .AL-_A I - A A A
A.. A A..A*A . 44A. A .& - A- - t - - I a 4
a A..A.A r~AAA&.co A A AA ... A ~AA,
AA4 AAA * A1-A-A A.A A~ A A- A A A..
.A* A A....h L A A.
.. & A A * - A AA. A ~ALR ~ 4.&AA... A A .
..4
A 4"14. .4A&A AA k A AAA. A.A a4 A5 AA
a. a..h.- i*A . .A ~ A
e*e ol a Ii ii i • •
4-)
4-4 -
-4 ,
0 -H
-,I *.4
U 4-
00
4
0
C)
4
0
4-4
Ln OD
C! CC
33)

46. If the ES-2420 is owned and is required in any case for data
acquisition, its incremental processing cost is limited only to operator time.
If ultimate resolution of deeper structure is a survey requirement, then the
cost of outside, sophisticated processing is justified. For most surveys
involving structural interpretation within the upper 200 to 300 ft (61 to
91 m), the ES-2420 processing itself can give rapid and useful sections for
interpretation.
47. Relating this back to compatibility with WES seismograph systems,
it is apparent that the capability of doing shallow reflection analysis (as
with Line C-2) is possible because some microcomputer-based software can be
purchased or written which will mimic the ES-2420 capability. The deeper
investigations would be at a severe disadvantage unless data can be trans-
ferred to tape in a standard SEG format for advanced processing.
34

PART VI: GEOLOGICAL INTERPRETATION
Deep Basement Structure
48. Line C-I was surveyed to look specifically at deep structure
(faults) affecting the dike. Figure 11 presents reduced and interpreted CDP
stacked sections along Line C-I. The sections presented are the final CDP
stack and a migrated stack section. Full-sized and noninterpreted versions of
Figure 11 are included as Plates 1 and 2. The colored bands were chosen to
represent continuous reflections and, because of no available well control,
are not tied to specific stratigraphic horizons. The continuous strong
reflection along the central portion of the line represents the
Chattanooga/Sylamore sequence.
49. The key observation along this line is the evident and substantial
faulting. The known major north and south bounding faults are actually series
of faults of rather complex character. In addition, there are several
observed faults within the graben which had not been noted in the drilling
program. Using Line C-I, the positions of all faults were located and thereby
transferred onto the section from Line C-2 which only looked at shallow
horizons.
50. The large boundary faults of the graben were previously interpreted
from borings and other geophysical methods. Plan maps showing locations of
boreholes are in US Army Corps of Engineers (1986) and Llopis and Butler
(1988). Borehole locations along the C-line are indicated on the seismic
sections. These faults are located near boreholes B27.9 on the North, and
G29.3 on the South. Other faults exist in the graben at sta 301 to 321
(Flags 166 to 176) and between sta 351 to 371 (Flags 191 to 201). The faults
are indicated by disruptions in continuity of events, changes in wave form,
and offsets in events. The throw on these faults within the large graben is
probably small, but it is likely that these zones of weakness are prone to
leakage through the foundation.
The Weathering Layer
51. Figure 12 is a CDP stacked section along Line C-2. It is plotted
in reverse direction from Line C-i because it was processed only by the
35

400 FT
Mi L
I U if
~ .
I. ~ *2
M-5 gp.... ~ D-
~40 FT
to, ...... r!$'' r*
---... * *-9
b *
I ~ ~ M U g 9 1
____________________ ___________ _________________
-~ .. *8 _________
*~*8~8**~bbI bI~p8*itpb I, 1 sII, 1 ~'~~fs,~.~.:~I ~ ;:~ : .. 9b1511 ~llI89999,,9bh&.&IS iU~SZ~bIIIII ISIIIIIII~tIII'~up~4~ts- ,
21 T 9.l* - lb. Z I.
.~ 4.... .~ ~*~ * ~i!.lI~ 99.9 ~ ..h.N2.~9. R M .9 Mi __M
Fiur 11.CDsetos(peisfnlta
fro LinC1,BeaerDa

13 1 omaamm. cgSomtn iw
NO-Lc Jew FT. m ls 4" man
ato 0.0 RCSIGSQE EUATERUAYS EXPERIMlENT STATION
I. 84WNWt EAUER DAM ARKAN4SAS
~, ~ 010 419 to RS LINE C-1~ m m u. Lot
.L* swammc anma wai
*~ - .2 Z iff 5TWR3______
I::.L it Iol-.sa- .e. "mum su.FINAL EQUALIZED STACKw FIELD RECORING~
z.-n 0.3 C ,, 5
41 WILL: is mcit M R um u.l~t
plmm -. s .G.:: OI a easmg. M mmu us .v .ow S es-rn 10 inE tax 0C &
10- maw lift W s CID. D. Uil a. ow.nF. E.9W.l0.4 Ift" MIL10s- T . Jk I ami.6 flimm Lv s SLM Im s
6 LAU u8T r
st mumP ANm Co o% mu u.-., coitmusa s..Tu mGfu 00"S' bWCAM.i
~~. G~I~j EOMSTER
* - 0. ~ vaUATERUAYS EXPERIMENT STATION0-user,555 m
... ~ 0.1 u =1wI LIN C-"W-610 "ftmn n lo, IN41110.*11tim Tommspo LU.
lom I L4Ur . 1 OIL-5- mmm owUr meting m or
IF :@,:O-' 11111m STOm KS
, P0.2w -z in-emit r~mlbW - N%..4Mm SWIMD TOM .0m
.) ftNfo g a.l..z wi Wsu .11118,1111 W. OI L y~ Irf mor wUmn EQ AT O MIRA IO
5. ."-.~~* 0mu . fmg . o m us mwmw 5ms-u m u u104= FIELe URECORDinINGn..~ n~~~L mmum - UWt rn 5ftm s niimnSmiu
DISLA .u'.IIET5II ~ vaa"am .S n. p"k m
.of!- u4110.owt a mt , A.s 111cti va-

...... .sO.'. .b b...pW ,
* ~~~ tw-blI be.-. ~ ~ .f5
*5P5.
be-- **,~ . ' ~ *~~ *
6.1a
ral-
S-si
vfg. g :2
ZU
Fiurep. G

Iv I,.4(
461 491 urn i ~ fi all los ma m 4
ob.0 81 #po ..gS . ... ..........
IT *to,
gr -4V
agar
PS. I4
.NAP__ t C~~** t3ht
I *I 3.11. u
U * I
M, M. n. .; -
I (CHontin'111led)l

(23
ISO 190 200 022020
AV r7 I 25
j 12
z
UU
2 ...LUI~~~ , , , . -*u .
z
LuJ
01
Figure 12. Colmmon offseton E-40seismc

230 250 260 27o
230 250 260 6 270 260
Common of fset (upper) and CDP stacked sections, produced.ES-2420 seismograph, from Line C-2, Beaver Dam

ES-2420 system, and plotting direction could not be controlled. The ES-2420
was used because a large portion of Line C-2 data was destroyed after acquisi-
tion and not available for further processing. The key reflections on this
section are the bottom of fill/original land surface interface and the top of
competent rock. Superimposed on this section are the faults determined from
Line C-I.
52. Figure 13 is the result of shallow drilling (US Army Corps of
Engineers 1986) in this area which shows striking correlation to Line C-2.
The reflection data faithfully reproduce the deep fill section and level com-
petent rock interface near boring E29.5. Borings indicate that the weathered
layer is much thicker when the faults reach the surface. These zones are
typically where the majority of leakage through the foundation occurs. It is
desirable then to locate other faults along the foundation and their corre-
sponding weathered zones near the surface.
53. The very shallow data on Line C-2 does not give a good indication
of faults directly, but the data show a good profile of the boundary between
the weathered zone and solid rock. Several zones of deep weathering are also
seen over fairly narrow lateral limits. Blue lines in Figure 12 indicate
stratified rock. The green lines indicate the interface between weathered and
solid rock. Deep weathering zones correlate with fault zones. The mechanical
fracturing due to faulting has increased the susceptibility of the bedrock to
dissolution, cavities/void formation, and enhanced weathering.
54. Seismic reflection therefore has been able to detect shallow zones
of deep weathering (to approximately 25 m depth) in the bedrock. When coupled
with deep structural data, the weathered zones are seen to be fault con-
trolled. Subsequent drilling for piezometer installation and exploratory
boreholes revealed brecciated rock core (gouge) in the interior of the grdben
in the vicinity of the 'faults' mapped by seismic reflection. No mappable
offsets were detected by the drilling interior to the graben, however.
55. Engineering seismographs could have produced equivalent results
along this line with a few modification. High pass analog filtering (pre-A/D)
on the order of 200 to 300 Hz would be necessary. Data would have to be taken
in CDP fashion which would require specialized cabling and a roll-along
switch. Finally, software for correcting NMO, CDP sorting, and CDP stack
would need to be either purchased or written.
43

CM'
Top Dike w
Top Sound Rock f.
30 mFigure 13. Results of shallow drilling program at Dike No. 1,
Beaver Dam, in area of seismic Line C-2
44

Comparison of Field Methods Used
56. One result of this project was a comparison of field acquisition
methods for high-resolution seismic. The final stack and Migration on
Line C-3 are given in Figure 14 (also, Plates 3 and 4). This can be compared
with Line C-I directly for quality (Figure ii). While some variations in pro-
cessing were necessary to optimize the results from both field methods, pro-
cessing was as parallel as possible. Figure 15 shows Flags 181 to 256 on both
Lines C-i and C-3. The most obvious difference between them is energy pene-
tration and signal to noise ratio. Figure 15 is over the southern edge or
Dike No. I where the most fracturing occurred at the graben's edge. The con-
tinuity of events is much better on Line C-i. While neither line allows dif-
ferentiation of all the individual faults over the zone, at least major
sedimentary features and faults can be discerned on Line C-i. On Line C-3
between Flags 214 and 244, little interpretation can be made except to call it
a "disturbed zone". On Line C-i over the same interval, several large struc-
tural features can be interpreted. It seems that the extra time and money
involved to collect the data by the method used on Line C-i is worthy for the
additional resolution. In addition, Line C-3 is really a better case since
velocities picked on Line C-i were applied on Line C-3. Normally, the proces-
sor would not have been able to pick velocities as accurately for Line C-3 if
it alone was available for analysis.
57. Therefore, Line C-3 would probably have been adequate to locate
major faults in Dike No. I area in this sense, rapid and inexpensive seismic
methods would have been sufficient. However, in seeing the improvement solely
due to extra care and the use of geophone arrays gained on Line C-i, Line C-3
procedure cannot be recommended. For future surveys, easier to manage arrays
could be used; also, the sledgehammer would probably be a very good source.
Time savings could be realized while retaining high-quality data.
58. Rapid seismic profiling for shallow, foundation description, as per
Line C-2, is the preferred method. Using geophone arrays instead of single
geophones smears the resolution of shallow reflections by combining the higher
frequency components of the signal in an out of phase manner, thus reducing
ultimate resolving power. Further, the sledgehammer source was certainly ade-
quate. Care must be taken to minimize airwave energy, reduce groundroll via
high pass filtering and high frequency geophones, and predetermine proper
45

384 if144
8I s u .1 Ja u s e sit I61 in1 t1 qm It wZ III af III a %
N I I N 1 mil
-.- .._...'... .. '. .. :.... , 1i !, ..,..,.. .... r . ! ..j.:, _8.
si "*Lts! .. 7Nb* --
0. 0 **L .s
.... ft.E5 :~ Pa !L .0 5
* ~;.. ~84 U35.% a I
•**3 ~ 5 _, .
RA 9 K"-, '*
*N33- ~ .**.
'3~ * .?*
':" . . ... ,,. ..... •..... ............ . .3,,, ;.:..... .,, ::, ...... . . .. '-,- .. . ,, *: ..3 ...... ,.. . .
*,. .. 8'.,., 39,. ... 9:3 ' ... b g*, .* 3 *,
,. - . ... . * . .:...s *s 359 ~ *. .. :.,.'.,,. . . .*-.3.. : , *... ,. 8I ,,. fl* '...:.....
.... , _i.- "% L $t-. 3 *
* . * 3 . . g " g 8 8 3 p l 3 3 .. ... . *.8
•_ _ __" .. 5 S '3',. . .:.. .,.I -
"" - ****.., .,.- r ,... 1.,Lt%-- '1 L8 ' 1 *.9 * J**"
Figure 14.

300 FTS F LAOSCMPTN
I 4 I a" 00 St. Gotag ii
[m& illi U* HfIRE Htifflftflf*i+It114111fIIr TEK. -a ago,
.... .. *,;.f b~ ~0.1 0 MR".? onflI'4
'Lf .- Pl- raw61. is m MU
b F0*ii.4
.,-awl TO TS SfRVTR
~~~~~~ ft _ V.~ia .M; 4oa .m .
~~~~~'~$- 'or, my.m ~ si m;4454 4m
.1*- ~ ~ ~ ~ IU S 4 fss .,M w amI I UW1. .C~&.I P.. ~ __ -'ik~e - - - ornS.0B:?.% ;:_______________________MUM
>-11WEVtA it," 1011 MO a a i tmm
. . . . .. .-.. -. P~r .ll PG MalOI<A# 4m
I......'~~~~~1 gotiiw UmsU@rjt
-2 M_ 0.
.,4 !LA. .olTN
M.,.'4 W mu ~
.58 PLhS CDMPLA UPTG
__1__ ST..REM I CILCIM L0.40 PL": Tell,~1 Ff onuttmm 'WL aU- . no t.L.U-
TWO~~~a Lt 2-9auPI
S ~ ~ ~ ~ ~ ~ ~ ~ ~ ~ M stlot ecins(peri fnlstcMIoe i igaeHsakfrom~~G*o LieanBevr a
9 6C40 sa

I"* owAN St.. SOUN iRN.M
0.0 PROCESSING Se.EIC!
Of-WaluquUATERUAYS EXPERIMIENT STATION
w UER DAMAKNSAS
W14111115S MI AIMs
L) Gl- lwmwa MLINE C-3wPMI Leave , FEW LOG
0~Iwx IIM S I WKS 2ws
0 2 13 IIiua sMM. Siam IBMO-z s.-w $%I=
IS 111M WLWWMFINAL EEXIALIZED STACK
- FIELD3 RECORDING
o 3 '""la wts u : tovoFew TS% 0111 nill sau am<~a eel:v ,*S lamin m PA.6 WIU 11501= S at WEWS
3:AN to~a Sa. w1s 6n
oQUALI TY CONTROL 12111Wilt Cog oup.06 FINKS y. Too N
0o i.1I 1= coA A.~ L:O .iinSKNi. woeno I fy. SAIVI~Ma enlA.l.tO 4 Ooci n 12 r WI . T.a.. Ia mebsl mImIN LC. a IS 11.0: To o~
41. 11 I -or FI 21,0: is miniAw Go FI
COMPUTING
as" in An cog eta 011:11l .l Comm1611 IATm ST.. 1113111 GOWnGm. Pip: urn I. mue. ommml,. Mw"I
-LAY..D.Tyu GEOflRSTER
o 0 PROCESSING SEQUENCE
414-41341.111,16"usi UATERUAYS EXPERIMIENT STATION
I. BEN"m DAM mAR
0.1 0C-ow -0 111Ilmm
ugo. i-a eraw LINE C-3
WOR - ama M.LO
oj -111111 STTCIV MM ITEEUTON1IRTO
m.. E mm M eS _ __ __ __ __ _ __ __ __ __ __ _
0,2 zc ".3-W NKIA F 190 REKII.-IFWUA $101111nwma a
OISLA Tof'fj3 ovn FIL mmS FIELD RECORDINGso apaom m :ftem miel.
0,3u swim : oncn ciops flw me. I~~~rM mm..en .n
3- mmm fi is mmM1:11 INim as min~ IS"SW
0 4 ULIT OTOL' o Mm"a
SA $8. 111a
s migrated stack)

AN10I M. OS n
liii IIl I'I I6:I
._. ........._ _- .--.- .-. _: ., . . 0
.......... p..*.*
.. , , .. .. .,,.A 'i ' ,;.. .. .•*,..,... ,;.,..... .:: ...... .
* •0
. , *..: ... . . .
Y.;,.;; .LU
L.L
rggZ,~ AA 0
A -Z ...-- -. ,. .
S-~. ~ ~ 0, 4
300 FT
.7 .. ..... ... .;* ' . .,l S ., S' . 2' ; , " . ...,
. . .. ,m z
U
:: i - 0 .2
.-. :LL
.,..-v, '.,;: --0.3
.° .o*;.9 <:
.... ,4~~.,~~ 6' ~ j:.' .*:. 0.2"
0.4
Figure 15. Direct comparison for identical processing of seismicsection from Line C-i (top) and Line C-3 (bottom) for the same
subsurface coverage
49

shot-geophone spread geometries. Shooting in CDP fashion dramatically aided
interpretation and resolution on smaller anomalous features. This would how-
ever require some specialized equipment (CDP cables and roll-along switch) and
some minimal processing capability for CDP sort, NMO, and stack. These are
readily available from equipment/cable manufacturers and can be purchased/
written for IBM-type microcomputers. Such measurements can therefore be
easily made with even a 12-channel engineering seismograph with minor
modifications.
50

PART VII: SUMMARY AND CONCLUSIONS
59. Seismic reflection data taken at Dike No. 1, Beaver Dam, AR, have
shown that the dike area has been affected greatly by faulting whose influence
extends all the way up to the bedrock surface. More faulting than suspected
ay early drilling programs has been detected. Each fault is also the locus of
deep weathering of the dike foundation rock. The soluble vuggy Boone forma-
tion not only has been dropped down to form the dike foundation which causes
seepage, but also has been fractured by faulting to increase the dissolution
which adds to the problem.
60. Common depth point data acquisition techniques were generally
proven superior to the simple common offset methods of Hunter et al. (1984).
*Geophone arrays were preferred for deep structural reflection data, and single
geophones with high pass filtering were preferred for shallow foundation
investigation. The high-resolution seismic reflection surveys were successful
in delineating a weathered, irregular top of rock beneath Dike 1 at depths of
20 to 80 ft (6 to 24 m). The deeper structure (\200 ft) of the graben was
also delineated. Also, evidence of previously unsuspected faults in the inte-
rior of the downfaulted block was observed in the seismic sections.
61. For the deeper data, advanced data processing methods proved supe-
rior to using very simple filtering and stacking techniques. More simple
techniques however were actually preferred for the very shallow data. In
either case, deep or shallow, some processing capability coupled with adding
CDP acquisition capability will be required for the use of engineering seismo-
graphs to acquire similar reflection data on future projects.
62. High-resolution seismic surveying is a rapidly advancing methodol-
ogy in all areas: engineering seismographs, field procedures, seismic
sources, data processing procedures, and office and field-portable microcompu-
ters. Even during the time since the fieldwork at Beaver Dam was performed,
significant advances have been made. These advances have resulted not only in
lower cost but also in improved data product. A high-resolution seismic
reflection survey, covering about 1,000 ft (305 m) with 12-fold CDP,
4 ft (1.2 m) geophone intervals, and 4 ft (1.2 m) shot points, would cost
about $12,000. This estimated cost is for a site within a day's mobilization
distance from the contractor and for a simple site and objective, i.e., easy
site access, no elevation surveying required (site either flat or survey
51
II

data supplied to contractor), and a well-defined mapping objective (e.g.,
irregular top of rock at 30 to 50 ft (9 to 15 m) depth and shallower anoma-
lies). The cost of the work conducted at Beaver Dam was approximately $35,000
and included multiple mapping objectives as well as 'research' objectives
(seismic source evaluation, geophone array optimization, data processing
requirements assessment).
52

REFERENCES
Butler, D. K., and Curro, J. R. 1981. "Crosshole Seismic Testing Procedures
and Pitfalls," Geophysics, Vol 46, pp 23-29.
Dobecki, T. L., and Romig, P. R. 1985. "Geotechnical and Ground-WaterGeophysics," Geophysics, Vol 50, pp 2621-2636.
Hunter, J. A., Pullen, S. E., Burns, R. A., Gagne, R. M., and Good, R. L.
1984. "Shallow Seismic Reflection Mapping of the Overburden-Bedrock Interfacewith the Engineering Seismograph-Some Simple Techniques," Geophysics, Vol 49,~pp 1381-1385.
Keller, G. V. 1974. "Engineering Applications of Electrical GeophysicalMethods: In Subsurface Exploration for Underground and Heavy Construction,"
American Society of Civil Engineers, NY.
Llopis, J. L., and Butler, D. K. 1988. "Geophysical Investigation in Supportof Beaver Dam Comprehensive Seepage Investigation," Technical Report GL-88-6,US Army Engineer Waterways Experiment Station, Vicksburg, MS.
Palmer, D. 1980. "The Generalized Reciprocal Method of Seismic Refraction
Interpretation: Society of Exploration," Geophysics, Tulsa, OK.
US Army Corps of Engineers. 1986. "Beaver Dam, White River Arkansas, Seepage
Investigations and Remedial Plan to Control Major Seepage at Dike No. 1:Little Rock District," Little Rock, AR.
53

131 1111101 918 161514
~b L~ 'I ~O l3,10 Po *jow',Po b-01o l" .4 joo
p~b F lo0 Poo 0 pbok000 o
P0oto optb ,0PU 1
p1
;
,b~p .1100.0WO, P"
I'llh$b Ii .hi I uht P I bi.o PIP
', " -orbI b I 0 w 14
O ppollJ 10-.00?
"I. PP*.T~~wj I

16 FLAG S COMIPUT ING
I STATION~S COMIPUTED AT CGG DATA PROCESSING CENTERI6IS CI4AfPA ST.. DENVER COLORADOJ
FLOATINGDATUM PLANE: 1080 FT. CORRECTIONAL VELOCITY: 2800 FT.'SEC.
- ~ 0.0 SEC.
01 -DEMULT IPLEX1,1 potlP 0 0002000 ,lbO-GAIN COMPENSATION FOR TRANSMISSION LOSS10 ft.il 0,)Op00 AND SPHERICAL DIVERGENCE
v, - 0 0 0301-COP SORT0 pot 0 NoQ4-GEOPHONE
EDITS~ ~ 05-SHOT AND TRACE EDITSwo to 0.1 07-STATICS TO FLAT DATUM
r li 08-SPIKING DECONUOLUTIONOPERATOR LENGTH 40 MSEC.lop po __ ~ t 0' PltINOOU FROM 62.5 TO 250 MSEC.
09-AUTOMATIC RESIDUAL STATICSwit lk W10-VELOCITY ANALYSIS
'4. ,~r a.?11-NMO CORRECTION
lob 1 12-MUTES
~ 0.2 13-AUTOMATIC RESIDUAL STAT ICS~ 14-COP STACK
It, lot101 )w15-TIME VARIENT BAND PASS FILTER1 1 t . 72-88-2401280 HZ. TO-TIOD MSEC.
.'Peo's.16-DYNAMIC TRACE EQUALIZATION
b4,RI~ b b 0CP it 1 p*' * 17-STATICS TO FLOATING DATUM.1180 18-FILM DISPLAY
,o pl''wi I DISPLAY PARAMETERSto 1 V.ww"' :0orbrt bHORIZONTAL SCALE: 12 TRACES PER INCH
* .' )p~~J~~, W~~bP~~,'VERTICAL SCALE: 14 INCHES PER SECOND* j'4 po POLARITY: FIELD POLARITY
r lop1 QUALITY CONTROL;o. P, DATE NOVEMBER 1986CGACTND 4230*l~w 04 PROCESSED BY: TANYA MUELLER CHECKED BY* DR. T.L. DOBECKI
,"woo.b~ MONROE B. SAVAGE
It. ---------------------------------------------------------------------------------------------------------------
33 TP. = 1;4 MILE

PLATE 1nPUT I NG
ilSING CENTER
LORADO,ECTIONAL VELOCITY: 2800 FT./SEC.
)MASTER!NG SEQUENCE UATERUAYS EXPERIMENT STATION
COMPANY
ON FOR TRANSMISSION LOSSVIUERGENCE BEAVER DAM ARKANSAS
AREAEDITS
DATUM LINE C-iUT ION L INE40 MSEC.
5 TO 250 MSEC. 644UAL STAITICSS STAT IONS
UAL STATICS SOUTH NORTH
fNO PASS FILTER
I HZ. TO-TIOO MSEC.
Hz. T15O-T500 MSEC. FINAL EQUALIZED STACKUAL IZAT ION
ING DATUM FIELD RECORDING
PARAMETERS RECORDED BY: CSM CREU DATE:AUGUST 1986
FIELD SYSTEM: ES-2420 FOR IAT:SEGD12 TRACES PER INCH ENERGY SOURCE: BUFFALO GUN SAMPLE INTERVAL: .25 MSEC.
14 INCHES PER SECOND NO. OF SHOTS/HOLE: 3 RECORD LENGTH: .5 SEC.>OLARITY GROUP INTERVAL: 5 FT. FOLD: 6
NUMBER OF GROUPS: 24 SHOTPOINT INTERVAL: 10 FT.Y CONTROL GEOPHONE TYPE: GSC-200 GEOPHONE FREQUENCY: 8 HZ.
CGG ACCT. NO.: 4223101 GEPHONE ARRAY: 25 FT. GEOPHONE SPACING: 5 FT.
CHECKED BY: DR. T.L. DOBECKI RECORDING FILTERS: LC: 25 HZ SLOPE: 18 DB/OCT
MONROE B. SAVAGE NC: 720 HZ SLOPE: 18 DB/OCT
NOTCH: 60 HZ
----------- ----------------------
sp,CALE CH'4 CHI
1/64 MILI 240 125'
-/
I I I I III I

176
1
391 381 371 361 351 341 331 321 311 301
.ipp,
pop- 0 L I p 0 0 1 0 0 p I lop
ItPOP 104 Will 111ijilift 11=7 L It 00*bi"ob 0010"Woo " 0 0 0 0 1 -- I P OP 00 P)'.W4 "I" 1, 6 it It 0 0 oftommWarommuo
polo
p ]PPI".0.100 , "Op P"NW10100p 0 1 BPI WO1, Ilot p W 0 It 1010 No 0 10 0 k o plopbol." "o, loop; i t 0 pool., It", I pool.) pop j
loop,1 10,
) 1 1.0 -0 b 0 It spOiOsop b Ito
to PIP ONO 61rp kk! : , I I.
Nov. 0 volobb& 7t I It -plo" Do,Zi= - , : .r it "!P- I - "
" , ; .' p - 60f Wit1... 0-0.6.61bb-6
MIT 6'." t lo 0 'owlpop I'm P Wo I- I I W"WiPw
III, It, P orIPA I It 11 P-1, to -P -P -P W 0:
below $.)I Lipop, 09WlPI, It to" m-,-R
Mob 0 It P
Ib *-f itW -- ' , P I-,P It -410 so"I I. It 4 1 1 DoIp - I I 1-b-pow lb;-0 r i.4 D. Pt It "I. two &IIt 0 0 p N.J. 0 ONO. 'Pol'bill"ll"ImL., 10 pipat-lo.
otbb. obom-p-j". k 0 ? I I ;t " p k lopp-p 0 P IPWLjpjWP'Pn
IbW>lW' taw two,101011b 11,10, 'O'b" two I, rot W oop".0, pop Itop lot 01 1'Lio-P No 1. 10 op jo P pp w wapmo," P WP0. 10 111
1 0, 1 1 1"Ir ' , .
p, 10imp;0 .0 0. 1 Pilot -Pjo ; imp, "t 1b 0 pop lopp,
two' Posz , Ito Plopo now b-b I.; 1 8.1poke, I - 0 b 10, rp . 11 W* - :W 0otPWWPP0 low bo it, W 01
hL;4 :.' Wp t;p'-v-'Wj I-&I. op lot 10 1It I, I lop, -ibv -pOp 0 0 Pit It1.0 1 lotoMOP. It lbDo r lb" low*plop, Pp.
OJ11I i : I rWO b - 10 m4p Op, 00-1- bv- 10 b abo* Pp P Pop r
00 10 W W Plot 0,ro Wn wpb: .11.0job, .0-bo *lot r P &P, 1. mpoBobo DOI. P P.
P&6 L I 1. 1. 1 1 bo 1. P, . I P) 1, biwo 1. "l0jow PIP W" . k1. 100 --. P) pollWoo.
. -*.; ft I b P o."'Ilk ' 2-0 0 : It - "tIN, I '!b ;c - W4 .*No :4wpio I It lim
Spit so No Orr !p it W. PIMbow Itto b:1WP' ti, bow I. D.
wb ski, No. jo P p It PO" 10104!0 1040. 1 1So Doi iwo lop 11111 10 110 10,11, 101,
Jor I . , b , . M...loplo. - P I Mot ft 0 - P. r : ip : 0 V-*lot I lopip -o :P I jw ;. W UJ 1" SOrr go. Pok P ;o
mokopoo;Ir - b.10% ot IOa., b !I I b OWP'fi "10 " ' - r 111D. * ,r r r.. limp I,100 t 6,& 10), 1
IPo6wim. A* Ao- bI I ", ,

311 301 291 281 271 261 251 241 231 221 211
111101 -hh bli,00*10"7 ' ~? I~I~ 1 ~~0,00 "Im"-.-
po 10 1 6 ioi bP"WIfi0Pmp00O&
0 p j R ow mrP I:r O ka 11
b bs 10 01 . , P !p o
W. 0.0 oV I
-irv Wo,,bk

96
211 201 191 1ei 171 161 151 141 131 121
____ __
O. 100 '0 p b.t~ M-1000 0 16 IO NIA I
*.opboo . II I I 1" 1 b'0 0 . 0 1P
1. p 'p l ,I ; o o po ,& *mo I.~~bb I.~ I.F~ .0 Poop1 hN" to~, b p b * b . , ;r1 ,Wt .O
io I 0 * o "II
PLATElo I Contnued

641 631 621 611 601 591 581 571 56644 1 1 1
SEC. 0.0 1I I ! I{ii{Iiwo,, lot 00"""
Pool ~~.~plo moopp lo
bo~
)W 1b m oij 14 ?"'?
I. op p* ,~ Lur~mi~.~ ,'~' ~ho
pop~ PIPI
ip, -vo p 5.J'r1i'
Wo LL631bf- e ,mw OS 1

256
A 571 561 551, 541 531 521 511 Sol 491 481 471
INIP
bo~ I 0 ,: P
W)b -W b~mh I *,
bPj 1DP bob P
4. -; '' V -r.;!pr ;
:0' W Ir 1 POM 0 P tP
~~~~~~~: 10.1.~P? ii~~P.b~PP J14 10 "r I' 'IPj t 6 P 3'P~' jb .1
Iwo 1 1 .
lb 0. ,b
.6 -v:~p rA *0 1
W I PPI A~btP ppIr &&I~ Ip P -V 0 I*WO
,~~P fP~ W 1t;b0b1 W )
j w*_ 011p !

1471 461 451 441 431 421 411 401 391 381
op 6;, b- 00 1
tbI ~ ' 4 ,' I I )Jb I 01
polo
10 m-9~ , Ot
bbb kL~'' ~ IF:'I II
VVV

11121 91 81 71 61 51 41 31
I 6I0-0 I-v-bI
bI'bbj bIlp bI "0
gU~lI~uLIP*"
NO up I . P I ]h, ?ppr
-Pb. P *,
P m 4 Pb,. P Mrp ~ ~ ~ ~ ~ ~ J BooPPi3~~i~~ ~___ __
tIPA W,
job,~lot-
VIN ba 0!0bP~ 14Pb~'loo ~p 3PbIPJ I, D Pb' "rlo 0' popmjb~I~~.* Pb~p~bhpP,

16 FLAGS COMIPUT ING
111 STATIONS COMIPUTED AT CGG DATA PROCESSING CENTER
- FLOATING 1616 CHAIIPA ST.. DENVER COLORADO~ ~DATUM DATUMI PLANE: 1080 FT. CORRECTINA VELOCITY: 2800 FT.'SEC.
i LL~~L~L~1LLGEOfiASTER0.0 SEC.PROCESSI NG SEQUENCE
0O1-OEflUL T IPLEX
lorllotL~ 02-GAIN COMlPENSATION FOP TRANSMIISSION LOSS0 b NoAND SPHERICAL DIVERGENCE~s b * ~ *~ '~,03-COP SORT~ *1 04-GEOPHjONE EDITS
91 05-SHOT AND TRACE EDITS0.1 07-STATICS TO FLAT DATUMi
~p 08-SPIKING DECO4'.OLUT IONb 1 .p~'Im'bbOPERATOR LENGTH 40 FiSEC.~'i ~ 3 ~ ~ b~b~bP~UINDOU FROMi 62.5 TO 250 FSEC.
.~ ~ 09-AUTOIATIC RESIDUAL STATICS~"
t - 1O-VELOCI TY ANALYSISINWIP ftw, jo -0 l-NflO CORRECTION
13-AUTOtlATIC RESIDUAL STATICS~.** *14-COP STACKoml ISl"ol r".o;1-TIME VARIENT BAND PASS FILTER6IL" a. ,~ 0 o 0 1 72188-2401280 HZ. TO-TIOO IlSEC.00~**b;..I;~III
72188-1801220 HZ. T150-T500 MSEC.oor W pppr 1-DYNAMlIC TRACE EQUALIZATIONbo~ os 0 oP.P 17-STATICS TO FLOATING DATUMl
18-UA.E EQUATION MIGRATION* ~ *.19-BAHD PASS FILTER
0.3 20-DYNWfIC TRACE EQUALIZATION~Z 21-FILMi DISPLAY
~'~' DISPLAY PARAME TERS,in~ 3.I""~~~'HORIZONTAL SCALE: 12 TRACES PER INCH
Nip I wbr. o. PWVERTICAL SCALE: 14 INCHES PER SECOND0 II~"~ " POLARITY: FIELD POLARITY
.&j ~ abL0.4~h QUALITY CONTROLr~b ~DATE NOVEMIBER 196 CGG ACCT. NO.: 4223101~ ~ IPROCESSED BY: TANYA MUIELLER CHECKED BY: DR. T.L. OECKI
I t o o #tMO N R O E . S A L4A G E
SCALE
33 TR. = 1/4 MILE

PLATE 2
TINGCENTER
ONAL UELOCITY: 2800 FT./SEC.
STERSEOUENCE UATERUAYS EXPERIMENT STATION
COMPANY
fR TRANSIISSION LOSS'GENCE BEAVER DAM ARKANSAS
AKREA
,Um LINE C-I9 ON LINE'c.644STATICS64
STATIONS
I STATICS SOUTH NORTH
'ASS FILTER•TO-TIO0 rMSEC.T1o-T,50 SEC. WAVE EQUATION MIGRATION
.IZATIONDATUMDATIUM FIELD RECORDING
IZFION RECORDED By: CSI CREU DATEAUGUIT 1986FIELD SYSTEM: ES-2420 FORtAT:SEGOENERGY SOURCE: BUFFALO GUN SAMPLE INTERUAL: .25 MSEC.
ORMETERS NO. OF SHOTS/HOLE: 3 RECORD LENGTH: .5 SEC.TRACE TERS IGROUP INTERVAL: 5 FT. FOLO: 6
TRCES PER INCH NUMBER OF GROUPS: 24 SHOTPOINT INTERVAL: 10 FT.
GEOPH.NE TYPE: GSC-20 GEOPHONE FREOUENCY: 8 HZ.-WITY GEOPHONE ARRAY: 25 FT. GEOPHONE SPACING: 5 FT.
RECORDING FILTERS: LC: 25 HZ SLOPE: 18 DB'OCT
'CONTROL HC: 720 HZ SLOPE: 18 DB/OCT
tG ACCT. NO.: 4223101 NOTCH: 60 HZ
NECKED BY: DR. T.L. DOSECKIMONROE B. SAVAGE s
CH24 CHI
I I I --- 2 0' 125'
t'64 NILE

176
391 381 371 361 351 341 331 1 321 311 301
tIBJIIJ~ ~ ~ ~~~~~0 it It Or4LLIU I~} ft~~[~1III~t!-'Pop-
1+~'
~1M ,' *
iboob,
0; .m 4bht imp ',m 3
__________ ~?blop,
bwwJ 6 p
~ ~ IP vbhiII
.7 ~bb w 0 1
boo.. w"wor
io ipm o.o m, noa, - 0.-
J-S~
'a. _bD 1. 1Plp'mgor mo 0 .r l~ o b

281 271 261 51241 231 221 211 201 191 181
IY~ I oi o
1o I. tri I, 1. I
* Opp LL
~ bbbb~Not
loot I p!'
lo wrPo
;vor - -, -6L6
Pr ;; ,b 0 pn s ,
lo: op loo
Pilo.~ ~*P0' Z-f 6

96
211 201 191 18 t! 161 151 141 131 121 1
AM i WNI
)piht
§0 ib b14 I-P 0 p lg
1b~ 1I b t W r '
4-
1=I -or: L'I
.0. 0 610 0 Iv. Jll _ _ _ _li
g., 1110 toAp~ *~ IPpp* ~ I~ ;~
PLAT 2tCotnud
rZ-

641 631 621 611 601 591 581 51 56
6441 1 1
0S E C. 0.
J L OP P1-0 b. 1- 0b )*bhp.7P
0~WillIlkb
Not w"00" * 0 bo0 o P -oo *0.0 00 0 0 , "oj~bbb.
b w O-W) bO. W*O4 10,
ml ~P *pOpb1h14Al
IFI, bon 'Il
Op Ofj *"omlp

256
51150471 4 461 451
1 bo
~ ~ ~i ~ I , w :1 *
K.o I fO* I'-
wo'$Jm 1
0 1 * b P108I P h b ~)
r b~ b
off IWP p loo, r !
pipINAM 00,1pugj~~~~:bl 0 o)t i
bb lt*hrI Opp
potaIr..* r p~bp~

481 471 46a1 451 441 431 421 411 401 391 381
PIPI).- ,, ?Z
IP
b P- p I . p I ,
b~bP If N! I Mimi ~,g~h"*I
Lp *p j _'bl
t kvbbI
PLTI2(ocldd
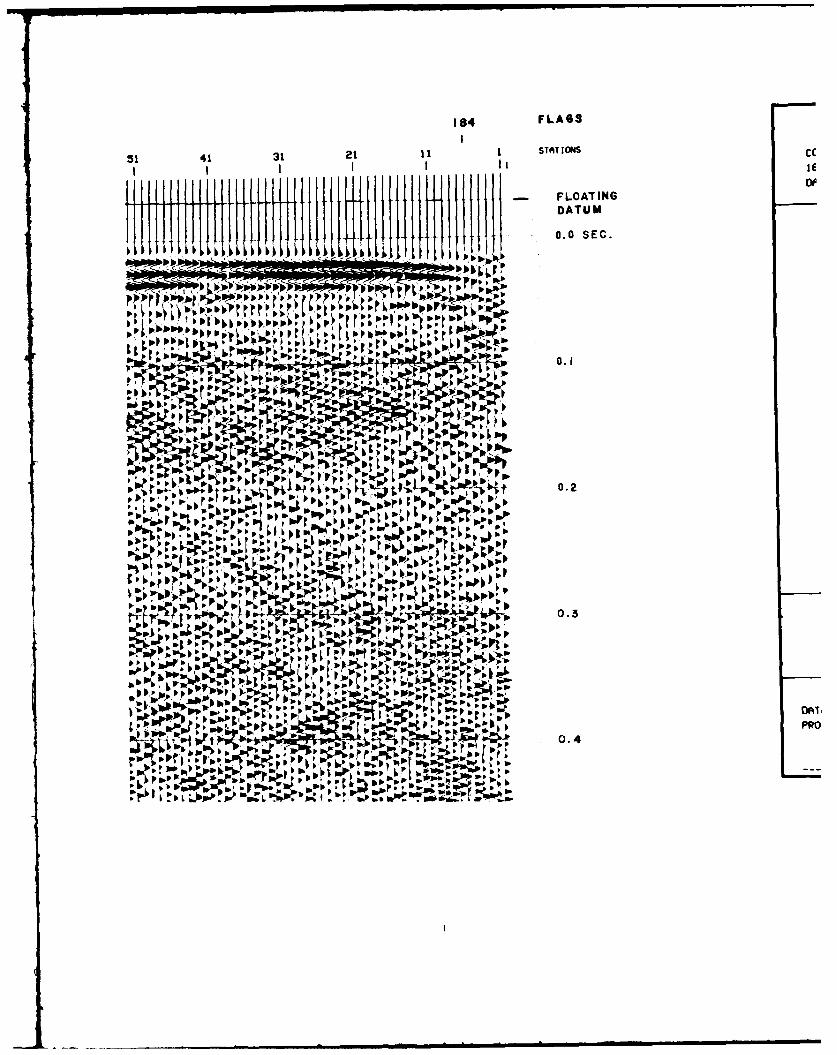
104 FLAGS
5 1 4 13 1 2 1 S TA T ION S c
Itttlttttltthlbi ,IbttttL.UttttPDATUM 1
0.0 SEC.
~LjutE 00 .1
0.2
~ '" 0.5
0.0;
1b1 0.461 O
ap lb oIb .
-~blip

F
COMPUT I NG
D AT CGG DATA PROCESSING CENTER
,, rr ST.. OENVER COLORADOLAlE: 1060 FT. CORRECTIONAL VELOCITY: 280 FT./SEC.
GEOMASTERPROCESS ING SEQUENCE UATERUAR
01 -DEIULT IPLEX
02-GAIN COMPENSATION FOR TRANSMlISSION LOSSAND SPHERICAL DIVERGENCE
03-CDP SORT04-GEOPHONE EDITS
05-SHOT AND TRACE EDITS07-STATICS TO FLAT DATUI08-SP IK ING DECONVOLUT I ON
OPERATOR LENGTH 40 MSEC.UINDOU FROM 62.5 TO M50 nSEC. 28E
09-AIJTOM TIC RESIDUAL STATICS1O-VELOCITY ANALYSIS1I-NM CORRECTION1 2-flUTES13-AUTOtTIC RESIDUAL STATICS14-COP STACKIS-BAND PASS FILTER
7218-180220 HZ FINA16-DYNAMIC TRACE EQUALIZATION17-STATICS TO FLOATING DATUM
18-FILM DISPLAY
DISPLAY PARAMETERS RECORDED BY: CS
HORIZONTAL SCALE: 12 TRACES PER INCH FIELD SYSTEM: E'
UERTICAL SCALE: 14 INCHES PER SECOND ENERGY SOURCE: IPOLARITY: FIELD POLARITY NO. OF HITS/HOLI
24 SINGLE GEOPH
QUALITY CONTROL GEOPHoNE TYPE:GEOPHNE SPC I N
IER 1986 CGG ACCT. NO.: 4223101 RECORDING FILTEiy: TANYA MUELLER CHECKED BY: OR. T.L. DOBECKI
MONROE B. SAVAGE
SC LE CH24
33 YR. = 1/64 MIlLE 240'

PLATE 3
WATERWAYS EXPERIMENT STATIONCOMPANY
-a BEAVER DAM ARKANSASAREA
Ll LINE C-3LINE
288STATIONS
SOUTH NORTH
Ec FINAL EQUALIZED STACK
FIE, FIELD RECORDING
?EU RECORDOE BY: CSI CREU DATE:AUGUST 1986
120 FIELD SYSTEM: ES-2420 FORMAT:SEGDR ENERGY SOURCE: AMER SAMPLE INTERVAL: .25 MSEC
9O. OF HITS/HOLE: 9 RECORD LENGTH: .5 SEC.
24 SINGLE GEOPHONES FOLD: 6
STGEOPHONE TYPE: CGS GEOPHONE FREQUENCY: 100 HZ5 FT. GEOPHOE SPACING: 5 FT. SHOTPOINT INTERVAL: 10 FT.LC: RECORDING FILTERS: LC: 25 HZ SLOPE: 18 DB/OCT
C: I, HC: 720 HZ SLOPE: 18 DB/OCT
NOTC - NOTCH: 60 HZ
CH24 CHI
240' 125,
I .. . ..... .. . . - - - - - •III

314
271 261 251 241 231 221 211 201
SEC. 0.0 It Hht[tt::tP# 6~, bk1i.
1 1 l o o p. . k"osl 0,
0. OF bk
j'p' jobil'.pk jo o
~W b- Mokt
4v io
wI .Ib3 J .IIJI ' * Wo
0.4 ~ frb.F~rV-~IUk~)lop p ~ ~le
F . e

244
119le 171 161 151 141 131 121 11101 9
I~ ~~ l ioi iI
0 1 It
DI~ .P~ - )i
14

244
131 1 111 101 9181 71 61 51 411 1 I
ti v ilPooi 1p1-1p. 1, 0i -bi S 'o6
I o loti
ii ,,
- m ,6, N% M b& .. h h m- oA
Paw MI " a
~IMP I
0P Io) 9* i wr An_
I Lep oL
9.. 1,w 0
lk to p
-tt
"-h.I 1 -~pop ,0- ',
PLAT ItCocuddlow 0,

184 FLAGS
514 121 11 1 SrAiii ION
.1 - FLOATING31 DATUMi1~ii 1LLL.0.0 SEC.
-or .2on P ;* S
L ~0.31
0 7 11r
__ ~ bb~1h~b 0.42D
lowR'~'Ir'~l5polo blm

~COMPUT ING
~COMPUTED AiT CGG DATAl PROCESSING CENTER
JTED 1616 CHArMPA ST., DENVER COLORADO1CH .._.DATUM1 PLANE: 1080 FT. CORRECTiONAA VELOCITY: 2800 FT./SEC.
GEOMASTER
PROCESSING SEQUENCE
01-DEMULTIPLEX02-GAIN COMPENSATION FOR TRANSMISSION LOSS
aT AND SPHERICAL DIVERGENCE
03-CDP SORT04-GEOPHONE EDITS05-SHOT AND TRACE EDITS
01 07-STATICS TO FLAT DATUM
Oi 08-SPIKING DECONUOLUT ION
OPERATOR LENGTH 40 MSEC.UINOOU FROM 62.5 TO 250 MSEC.
09-AUTOMATIC RESIDUAL STATICS
10-VELOCITY ANALYSIS
I1-NMO CORRECTION
12-MUTES
13-AUTOMATIC RESIDUAL STATICS
14-CDP STACKI, 15-BAND PASS FILTER
72188-1801220 HZ
16-DYNAMIC TRACE EQUALIZATION
17-STATICS TO FLOATING DATUMI 18-UAVE EQUATION MIGRATION
19-BAND PASS FILTER
20-DYNAMIC TRACE EQUALIZATION
21-FILM DISPLAY2
DISPLAY PARAMETERSHORIZONTAL SCALE: 12 TRACES PER INC;iVERTICAL SCALE: 14 INCHES PER SECOND
POLARITY: FIELD POLARITY
QUALITY CONTROLDATE NOUEMBER 1986 CGG ACCT. NO.: 4223101
OVEIUEl; PROCESSED BY: TANYA MUELLER CHECKED BY: DR. T.L. DOBECKISED BY' MONROE B. SAUAGE
SCALE
33 TR. = 1/64 MILE
j ,eliu . m~mlll~lllllIl••Illlllmm a

PLATE 4
UATERUAYS EXPERIMENT STATIONCOIPANY
BEAUER DAM ARKANSASAREA
LINE C-3L INE
288 1STAT IONS
SOUTH NORTH
WAUE EQUATION MIGRATION
FIELD RECORDING
RECORDED BY: CSI CREU DATE:AUGUST 1986
FIELD SYSTEM: ES-2420 FORMAT:SEGD
ENERGY SOURCE: HAMER SAMPLE INTERVAL: .25 MSEC
NO. OF HITS/HOLE: 9 RECORD LENGTH: .5 SEC.
24 SINGLE GEOPHONES FOLD: 6
GEOPHONE TYPE: CGS GEOPHONE FREQUENCY: 100 HZ.
GEOPHONE SPACING: 5 FT. SHOTPOINT INTERVAL: 10 FT.
RECOROING FILTERS: LC. 25 HZ SLOPE: 18 OB/OCTC: 720 HZ SLOPE: 18 D8/OCT
NOTCH: S0 HZ
sP
CHZ4 CHI
Z40' 125'

314(271 261 251 241 231 221 211 201276 1
S E C. 0. LIL.01p771:71 ~ ~oo pto1 F1 b[- Pwo
ob" popwo -
'I mt m~b,. mmb.b ION,4 h m b n m ~ ,~.
Pop,, Ob p
0.1 W b 0 ,'I 1. b W
IN-4 i. - W a -
-c lplpihrt 0, fpp Im -pi 1pb AW b o I
0.4 Or 0aat:11' lop, jk: 4 1op 0i m,%W
I. .6Ib0 lk r1 1~ ~ . -I r m-w ' 1 "0 lop~

244
16-. -~P . - _ .' 0",w.pp1
h. W .:i P u " 0 .. -it~ 7 N 0foo'' IP.0-
Pooli. 'D 'Nobb0 W.PP " Ito 00.0It w~. a Oo l o-
Moo~ 0.
00. - j -A
ti ~ I 6
0 , poo" Z3.b , P0pul N'b It L .'~ 'I Itp wS~L .II ~ Isi b l
0, b . -0 1 P- . t w, b ml, I , , Ibb si p
Pi * P, 1, P ,p 1, 1, 0 11 o. o- 0 P: ~ ~ * I ~ I ~ I*

244
K41 131 111 ltl 91 81 71 1 51 41
P 0 Do P bo 0 o, rKo oo01 .0,1 o01001o Kb01 I IpprK P P0
wo 'SP 00-1 OroHI01o&"P
ob b p 0, P
P,
two P 0 PP L
AV '; ; ; r~. ~ " L " .0 0'.' i " -, NI' ." -* I.
I-. POO(r lC u '

APPENDIX A: GLOSSARY*
Amplitude spectrum - amplitude-versus-frequency relationship such as computedin a Fourier analysis.
Autocorrelation - correlation of a waveform with itself... is equivalent topassing a waveform through its matched filter.
Common depth point (CDP) - having the same midpoint between souice anddetector.
CDP gather - the set of traces which have a common midpoint (see Figure Al).
CDP stack - a sum of the traces corresponding to the same midpoint.. .cor-rected for statics and normal moveout (NMO) and then summed (stacked).
CDP method of data acquisition - shooting seismic data in a manner such as togenerate CDP gathers (see Figure A2).
Common offset gather - a side-by-side display of traces which have the same
shot-to-geophone distance (offset).
Common offset method of data acquisition - see Figure A2.
Deconvolution - a process designed to restore a waveform to the form it hadbefore it underwent a linear filtering action (convolution).
Demultiplex - to separate the individual component channels which have beenmultiplexed (mixed together).
Elevation statics - see "statics."
F-K velocity filter - discrimination on the basis of apparent velocity.
Floating datum - a variable reference surface used in areas of variable
topography.
Fold - the multiplicity of common depth point data.
Gain compensation for transmission loss and spherical divergence - gainapplied to a recorded seismic trace to account for decrease in wavestrength due to energy absorption by the medium and due to geometricspreading of the wavefront.
Graben - a down-dropped block bounded by normal faults.
* Taken from Sheriff, R. E., 1984. Encyclopedic )ictionary of Exploration
Geophysics: Society Exploration Geophysicists, Tulsa, OK.
Al

Migration - rearrangement of interpreted seismic data so that reflections anddiffractions are plotted at the locations of the reflectors and diffract-ing points rather than with respect to observation points.
Mute - to change the relative contribution of components of a stack withrecord time.
Normal moveout (NMO) - the variation of reflection arrival time because ofshotpoint-to-geophone distance (offset).
Operator length - the time-domain length of the impulse response of a con-volution operator.
Optimum offset - the best shotpoint-to-geophone distance for observing aparticular reflection in a noise-free window.
Sort - rearrange seismic traces with respect to some attribute shared by each.
Spiking deconvolution - deconvolution in which the desired wavelet is a spikeor impulse.
Stack - a composite record made by combining traces from different records.
Statics - corrections applied to seismic data to compensate for the effects ofvariation in elevation, weathering thickness, weathering velocity, orreference to a datum.
Throw - the vertical component of separation of a rock unit (bed) by a fault.
Time-variant filtering - varying the frequency band-pass with record time.
Vertical seismic profile (VSP) - measurements of the response of a geophone atvarious depths in a borehole to shots on the surface.
Vugs - large pores in a rock mass from a few millimeters to a few centimetersin size; often caused by dissolution of carbonate minerals.
A2

Geophone group
Spread of 24-group locations
A ; B 5 C 7 D 9 E 1' F 13 15 17 19 21 23
Shotpoint
Reflector
Figure Al. Illustration of a set of seismic
raypaths sharing a common midpoint or common
depth point
A3

1 Rcords 10 Traces in The Ronge Shon
I x. I I
? .3 4 5 6 7- 8 9 Ito0--- -- eo s-•o
-50
SP 0SP f-*---.... C The*e Dots Represent TheSP 2 o .- .9-4 a Horicontol Posttions of TheSP 3 ** o*o* o -RefleCtirg Poits ForSP 4 Horionfol Horizons of AnySP 5 Depth.SP 6
R1/S5
S1 S2 S3 S4 R2R3R4R5
GROUND SURFACE
REFLECTOR
Figure A2. Illustrations of the procedures involved inCDP data acquisition (upper) and comnon offset data
acquisition (lower)
A4


![!1 [~~$~-~riDIDJtm] S¥1UJ[D)W @IF $~~~ ~~$ir~¥Ull1f~(Q](https://img.dokumen.tips/doc/110x75/61a55d20293bf4319f39f7d3/1-rididjtm-s1ujdw-if-irull1fq-.jpg)


