Embed Size (px)
Citation preview
Policy ReseaRch WoRking PaPeR 4610
Devolution, Accountability, and Service Delivery:
Some Insights from Pakistan
Zahid Hasnain
The World BankSouth Asia RegionPoverty Reduction Economic Management DepartmentApril 2008
WPS4610P
ublic
Dis
clos
ure
Aut
horiz
edP
ublic
Dis
clos
ure
Aut
horiz
edP
ublic
Dis
clos
ure
Aut
horiz
edP
ublic
Dis
clos
ure
Aut
horiz
edP
ublic
Dis
clos
ure
Aut
horiz
edP
ublic
Dis
clos
ure
Aut
horiz
edP
ublic
Dis
clos
ure
Aut
horiz
edP
ublic
Dis
clos
ure
Aut
horiz
ed
Produced by the Research Support Team
Abstract
The Policy Research Working Paper Series disseminates the findings of work in progress to encourage the exchange of ideas about development issues. An objective of the series is to get the findings out quickly, even if the presentations are less than fully polished. The papers carry the names of the authors and should be cited accordingly. The findings, interpretations, and conclusions expressed in this paper are entirely those of the authors. They do not necessarily represent the views of the International Bank for Reconstruction and Development/World Bank and its affiliated organizations, or those of the Executive Directors of the World Bank or the governments they represent.
Policy ReseaRch WoRking PaPeR 4610
This paper studies the relationship between devolution, accountability, and service delivery in Pakistan. It examines the degree of accessibility of local policy-makers and the level of competition in local elections, the expenditure patterns of local governments to gauge their sector priorities, and the extent to which local governments are focused on patronage or the provision of targeted benefits to a few as opposed to providing public goods. The main findings of the paper are three-fold. First, the accessibility of policy-makers to citizens in Pakistan is unequivocally greater after devolution, and local government elections are, with some notable exceptions, as competitive as national and provincial
This paper—a product of the South Asia Region, Poverty Reduction Economic Management Department—is part of a larger effort in the department to assess the impact of decentralization reforms on service delivery in the region. Policy Research Working Papers are also posted on the Web at http://econ.worldbank.org. The author may be contacted at [email protected].
elections. Second, local government sector priorities are heavily tilted toward the provision of physical infrastructure—specifically, roads, water and sanitation, and rural electrification—at the expense of education and health. Third, this sector prioritization is in part a dutiful response to the relatively greater citizen demands for physical infrastructure; in part a reflection of the local government electoral structure that gives primacy to village and neighborhood-specific issues, and in part a reaction to provincial initiatives in education and health that have taken the political space away from local governments in the social sectors, thereby encouraging them to focus more toward physical infrastructure
DEVOLUTION, ACCOUNTABILITY, AND SERVICE DELIVERY: SOME INSIGHTS FROM PAKISTAN
ZAHID HASNAIN

TABLE OF CONTENTS
I. Introduction .................................................................................................................... 1 II. Theoretical framework .................................................................................................. 2
Holding policy-makers accountable ............................................................................... 3 Holding providers accountable ....................................................................................... 4 The inter-governmental framework ................................................................................ 4
III. Pakistan’s Local Government System ......................................................................... 5 IV. Political Accountability ............................................................................................... 6
Citizen contacting ........................................................................................................... 6 Electoral accountability .................................................................................................. 7
V. Local government sectoral priorities .......................................................................... 10 Inter-governmental fiscal relations in Punjab ............................................................... 10 District development priorities in Punjab ..................................................................... 12
VI. Conclusion ................................................................................................................. 18 References......................................................................................................................... 20 Figures Figure 1: A framework for decentralized service delivery ................................................. 2 Figure 2: Citizen contacting of union councilors................................................................ 6 Figure 3: The competitiveness of local government elections............................................ 8 Figure 4: Incumbency disadvantage in local elections ....................................................... 8 Figure 5: PFC transfers in Punjab..................................................................................... 11 Figure 6: Consolidated Punjab district ADP 2006/07....................................................... 13 Figure 7: District ADPs in Punjab, 2006/07: number and average size of schemes ........ 13 Figure 8: Composition of the Punjab provincial ADP, 2001/02 to 2006/07 .................... 14 Figure 9: Trends in setoral district and provincial current expenditures .......................... 14 Figure 10: Per capita allocations in the districts ( 2006/07) ............................................. 16 Figure 11: Average size of district and provincial schemes ............................................. 17 Figure 12: Trends in Punjab real setoral district and provincial ADP allocations............ 17 Tables Table 1: Correlates with the election of a district nazim .................................................... 9

Devolution, Accountability, and Service Delivery: Some Insights from Pakistan1
I. Introduction Improving service delivery through increased accountability has been a significant implicit motivation behind the trend towards decentralization in developing countries. The standard theoretical argument for the transfer of responsibilities to lower tiers of government is that the closer proximity of local policy-makers to citizens increases the flow of information and better enables the public to monitor, and to hold to account, government officials. Conversely, elected local policy-makers, responding to this greater citizen vigilance, focus on improving service delivery in order to get re-elected. Ambitious devolution reforms were introduced by the military government in Pakistan in 2001. While decentralization had a variety of motivations, the most important of which arguably was to create political allies of the regime at the local level to counter opponents at the national and provincial levels, the service delivery imperative cannot be ignored. This paper seeks some insights into this relationship between devolution, accountability, and service delivery in Pakistan by examining first the degree of accessibility of local policy-makers and level of competition in local elections, and second the expenditure patterns of local governments to gauge their sectoral priorities, and the extent to which they are focused on patronage, or providing targeted benefits to a few, as opposed to providing public goods. Local governments in Pakistan do not exist in isolation, and any discussion of local government accountability must take into consideration the inter-governmental framework and the actions by higher tiers of government, particularly the provincial government, in sectors that are formally devolved. As a large literature shows, given that local governments generally have limited tax bases and must rely on inter-governmental transfers for most of their resources, this framework has important bearing on local incentives. Therefore, the relationship between devolution, accountability, and service delivery in Pakistan can only be analyzed in the context of a given inter-governmental framework and a given set of provincial interventions. Three conclusions are drawn from the analysis. First, that the accessibility of policy-makers to citizens in Pakistan is unequivocally greater after devolution, and local government elections are, with some notable exceptions, as competitive as national and provincial elections. Second, local government sectoral priorities are heavily tilted towards the provision of physical infrastructure — specifically, roads, water and sanitation, and rural electrification — at the expense of education and health. Within these sectors, particularly in water and sanitation and rural electrification, the focus is on small, neighborhood and even household specific schemes, which can be characterized as the provision of targeted, private goods. Third, this sectoral prioritization is in part a dutiful response to the relatively greater citizen demands for physical infrastructure; in part a reflection of the local government structure whereby the district political leadership is accountable to an electoral college of directly elected union councilors whose constituency is the village and neighborhood; and in part, as elaborated in detail, a reaction to provincial initiatives in education and health that have taken the political space away from local governments in the social sectors thereby encouraging them to focus more towards physical infrastructure. An important caveat is that this paper does not go beyond an expenditure analysis in gauging the impact of decentralization on service delivery. Sector governance, specifically managerial 1 I am grateful to Satu Kahkonen, Kaspar Richter, Hanid Mukhtar, and Deepak Mishra for their
insightful comments and to Nusrat Sultana Chaudhry for valuable research assistance.
1

capacity, merit-based recruitment of service providers, and the ability hold staff to account, is perhaps even more important in improving outcomes. The reason these issues are not taken up, and as will be elaborated later, is that local governments in Pakistan have very limited authority over these staff. The paper also does not discuss social outcomes as these are very difficult to attribute solely to the actions of any one particular tier of government. The paper is structured as follows: The next section provides the theoretical framework for the link between decentralization and service delivery. Section III briefly describes Pakistan’s local government system, focusing on the political, fiscal, and administrative aspects of decentralization. Section IV examines the question of political accountability of local governments in Pakistan, looking at both direct citizen contacting as well as electoral accountability. Section V, which is the core of the paper, addresses the issue of service delivery by analyzing the sectoral composition of development expenditures, the average size and type of typical local development schemes, and trends in non-salary recurrent expenditure to estimate the emphasis on operations and maintenance as opposed to new investments. This expenditure analysis is limited to the province of Punjab, as this is the only province where local governments exercise a significant degree of discretion over the resources at their disposal. Section VI concludes with some policy implications.
II. Theoretical framework The evidence on the impact of decentralization on service delivery is mixed. Some studies, such as Faguet (2001) on Bolivia, demonstrate that decentralization resulted in a huge shift in public spending in favor of smaller and poorer municipalities. Bardhan and Mookherjee (2004), show that inter-village allocations of credit, resources for local infrastructure and employment for the poor, and development grants from upper levels of government in the Indian state of West Bengal exhibited poorer targeting than allocations of these resources within villages by local governments. Other studies argue that decentralization increased elite capture and corruption. A World Bank study of village governments established in Indonesia in 1979 showed that accountability of village heads to the villagers was very weak, with a negligible number of village proposals included in district budgets (World Bank 2001). A cross-country investigation by Triesman (2002) found that decentralization was significantly associated with measures of corruption.
Figure 1: A framework for decentralized service delivery
National policymakers
Local policymakers
Poor people Providers
Source: Ahmad et al (2004) The reason for this mixed record is, as argued in Ahmad et al (2004), that improvements in public service delivery require three strong relationships of accountability between the different actors in the service delivery chain. These actors are illustrated in Figure 1. First, poor people must be able to hold policy-makers accountable; second policy-makers must be able to hold service providers accountable; and third the inter-governmental framework between national and local policy-makers must be conducive to improving service delivery. The authors refer to these relationships as the ‘long-route of accountability’ as opposed to the short route under which in a private, competitive market poor people, as customers, could hold providers directly accountable. Weaknesses in public service-delivery can be attributed to breakdowns in any one or all of these links.
2

Holding policy-makers accountable On the first part of the accountability relationship, the conventional wisdom, as mentioned, is that decentralization improves accountability as voters are better able to monitor the actions of policy-makers given their relative proximity, and policy-makers in turn, seeking re-election, are responsive to voter demands. Since the median voter in a developing country is poor, and improvements in basic education, health and physical infrastructure services help the poor, this responsiveness results in better service delivery. To evaluate this claim one must first understand why any democracy could produce outcomes that hurt the median voter. A large and growing literature on the subject has shown that political market failures, arising primarily out of information asymmetries, are the main reason for the non-accountability of elected officials to the public.2 The key question therefore, is whether local governments are less prone to these political market failures. Politicians care about getting elected, and they will focus on policies and will emphasize expenditure in areas that will maximize their electoral fortunes. Importantly, getting elected is also crucially contingent on information – specifically, it requires that voters are able to connect improvements or deteriorations in their welfare to the actions of a particular politician. In other words, politicians must be able to credibly take credit for these improvements. This importance of information implies that politicians are likely to be more responsive to the better informed group of citizens, and as a result focus more on private goods, or targeted benefits, as opposed to public goods that benefit the majority. Some public goods, such as the provision of roads, are much quicker to implement and easier to verify and credit to the efforts of a particular politician, than others, such as better quality healthcare or education. As World Bank (2003) points out, education and health place very high informational demands on voters as these are transaction-intensive services with outcomes that are crucially dependent on the behavior of providers that are very difficult to monitor. Therefore, given a menu of demands, one would expect politicians to focus more on roads and other physical infrastructure, and less on education and health. While some public goods like roads will get more attention than others, individual-specific favors will in general receive even greater priority. The reason is that demands for public goods and for individual-specific favors differ in the relative ease with which preferences are transmitted to policy-makers. Individual contacting for particularized benefits places the least organizational demands on citizens, and presents the clearest relationship between action and result. Demands for public goods entail free-rider problems and are therefore much more difficult to organize. Since individuals are much more likely to lobby for private goods, they are also likely to be much more informed about whether or not this demand was satisfied, and whether or not this fulfillment was due to the efforts of their elected representative. For example, people will observe how helpful the local representative’s office was, how much attention was paid to them, and what were the impressions of others waiting in line, and obviously whether they received the benefits. By contrast, improvements in service delivery will be much harder to measure. The key question is whether local governments are better able to resolve these political market failures than provincial or national governments. On the one hand closer proximity might 2 Important recent works in this literature include Persson and Tabellini (2000); Keefer (2002); Keefer
and Khemani (2003), Besley et al. 2004
3
ameliorate some of these information problems that lead to political market failure. On the other hand, and as per the classic argument against decentralization, articulated first by James Madison in the Federalist Papers, local governments may be more prone to elite capture as there will be fewer distinct political groupings in smaller jurisdictions, less media coverage compared to national elections, and less costly for elites to purchase the votes of less-informed voters.
Holding providers accountable In order to be able to act on the demands imposed on them by citizens, policy-makers must be able to hold the bureaucracy accountable for actually delivering these services. In general, mechanisms for monitoring and disciplining front-line providers such as teachers are weak in developing countries. Decentralization can further exacerbate these problems, as administrative devolution usually lags behind political and fiscal decentralization, and local policy-makers have limited authority over the staff assigned to them.
The inter-governmental framework Local governments’ incentives for improving service delivery are significantly influenced by the allocation of expenditure responsibilities between the local and higher tiers of government; the assignment of taxes across these levels; the design of the intergovernmental grant system; and the budgeting and monitoring of fiscal flows between different tiers of government.3 The literature posits that expenditure and tax assignments should be based on considerations of economies of scale, spillover benefits, tax efficiency and equity issues. In general these considerations imply that local governments are unable to meet most of their resources through taxes, and must rely on inter-governmental grants, which creates problems of soft-budget constraints and may weaken service delivery incentives. An effective fiscal transfer system should be predictable and formula-driven, consisting of a good balance between unconditional grants, to provide local governments’ expenditure discretion, and conditional grants, to enable the center to directly specify some accountability for service delivery. Effective expenditure assignments are also important from the perspective of political market failures. As noted earlier, to be motivated to deliver public goods, politicians must be able to effectively claim credit from voters for providing such goods to them. With multiple tiers of government, voters might have little knowledge about which tier of local government is responsible for which functions. Even though the responsibilities of the different tiers of government are clearly defined, it is likely that opportunistic politicians will exploit voters’ relative lack of knowledge by avoiding responsibility for their own lack of efforts or claiming credit for others’ actions in providing public goods. If voters are likely to be grateful to all the tiers of government when public goods increase, even if only one government contributed, then the incentive to provide that public good is diminished. There is some cross-national evidence to support this argument. A recent econometric study found that the number of tiers of government was positively associated with corruption, and negatively with the number of paved roads or infants inoculated.4 After briefly describing Pakistan’s local government system in the next section, the paper examines two of these three relationships of accountability: the ability of the public to hold local 3 Ahmad et al. 2004 4 Triesman. 2002.
4

policy-makers accountable, and the expenditure priorities of local governments in the context of the inter-governmental expenditure and fiscal framework. The third link, the ability of local policy-makers to hold the bureaucracy accountable for service delivery improvement, is not looked at in detail as this authority is very limited in Pakistan.
III. Pakistan’s Local Government System Devolution in Pakistan has significantly changed the provincial and sub-provincial government structure, with the main responsibility for the delivery of education, health, water and sanitation, roads and transport, and agriculture services devolved to local governments. New political structures for local governments have been created, new arrangements for intergovernmental sharing of resources have been established, large numbers of staff have been transferred from provincial to local governments, and an entire new administrative system has been set up at the local level. Politically, the formerly deconcentrated provincial bureaucracy in the above-mentioned sectors has been placed under the authority of elected local governments. Specifically, the devolution reforms created a three-tier local government structure at the union, tehsil, and district levels, with each government headed by a nazim to whom the local bureaucracy is formally answerable. The electoral system is mixture of direct and indirect elections. Members and nazims of the union council are directly elected, with one-third of the seats in these councils reserved for women, peasants and minorities; two-thirds of the members of district and tehsil councils are the union council nazims of that particular district and tehsil respectively and hence are directly elected as well, and the remaining seats are reserved for women, peasants and minorities, who are elected indirectly by an electoral college consisting of all union councilors. Importantly, district and tehsil nazims are also indirectly elected by the elected union councilors, and therefore need not command a majority of the public vote to hold office. Fiscally, a fairly elaborate ‘rule-based’ resource transfer system between the province and local governments has been created in the shape of the Provincial Finance Commission Awards. These awards divide provincial resources, consisting of both federal transfers and provincial taxes (and in some cases non-tax revenues), into provincial retained and allocable amounts, the latter of which is transferred to local governments. While the horizontal distribution of these funds across local governments is formula-based (based on population and an index for backwardness), the vertical distribution that determines the retained and allocable amounts is largely at the discretion of the province. Moreover, while the allocable amount is in theory at the discretion of local governments, and is non-lapsable, most of these resources are spent on personnel costs, with wages de facto set by the federal government. The level of local government autonomy over spending will be discussed in more detail in section V. Administratively, as discussed, the formerly deconcentrated bureaucracy is now on paper answerable to the locally elected leadership. The pre-devolution head of the district administration, the Deputy Commissioner, who used to report to the provincial bureaucracy, has now been replaced by the District Coordination Officer (DCO), who reports to the district nazim. The DCO in turn supervises a team of Executive District Officers (EDOs) who head each of the devolved departments at the district level. In all but one of the provinces (Balochistan), administrative authority — i.e., authority over appointment, promotion, transfer, and disciplinary proceedings — over non-officer staff in the devolved departments has been transferred to the DCOs, EDOs and in some cases junior officers in the districts.
5
Crucially however, these devolved staff remain provincial employees and therefore, despite these formal changes the nazim has limited administrative control over the local bureaucracy. The officers in the local government — the DCOs, EDOs, and junior officers — continue to be formally posted and managed by the province, and this administrative control permeates downwards to the frontline service providers.
IV. Political Accountability Citizens can hold policy-makers accountable through two channels: first, through actively contacting policy-makers, either individually or collectively in the form of interest groups, with specific demands, sometimes backed up with financial contributions; and second, through the ballot box by voting out officials who were unable to satisfy these demands. How has devolution impacted these two channels of enforcing accountability in Pakistan?
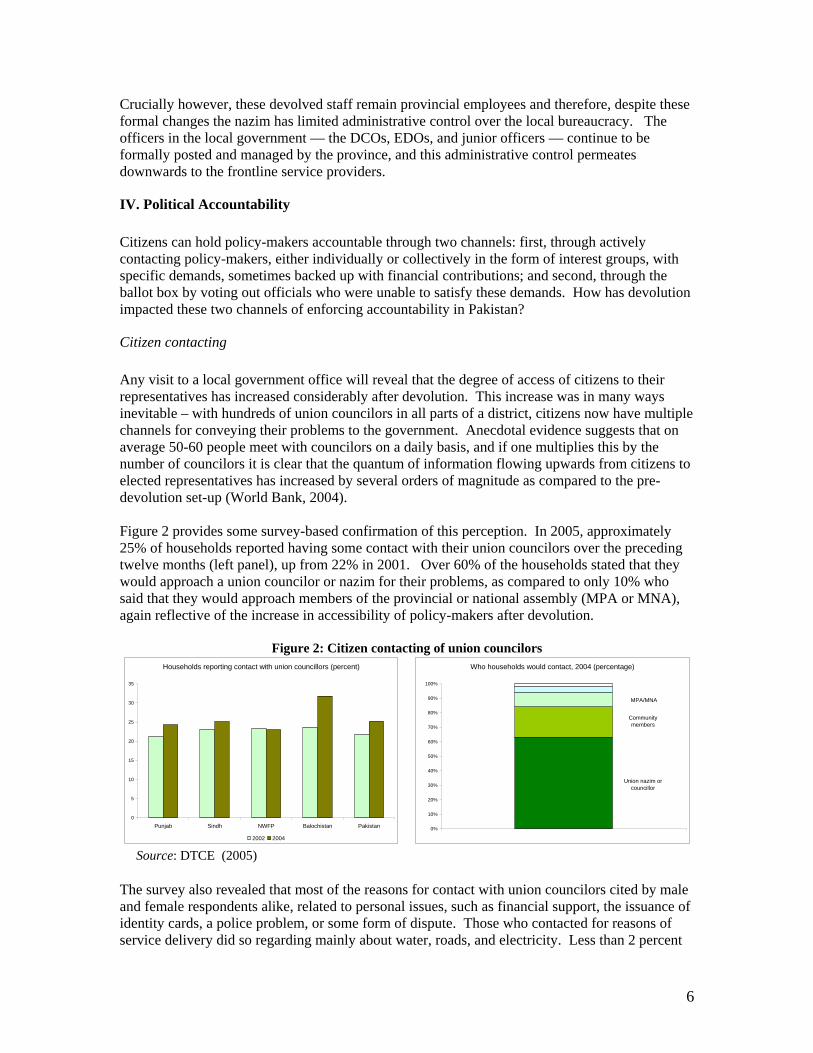
Citizen contacting Any visit to a local government office will reveal that the degree of access of citizens to their representatives has increased considerably after devolution. This increase was in many ways inevitable – with hundreds of union councilors in all parts of a district, citizens now have multiple channels for conveying their problems to the government. Anecdotal evidence suggests that on average 50-60 people meet with councilors on a daily basis, and if one multiplies this by the number of councilors it is clear that the quantum of information flowing upwards from citizens to elected representatives has increased by several orders of magnitude as compared to the pre-devolution set-up (World Bank, 2004). Figure 2 provides some survey-based confirmation of this perception. In 2005, approximately 25% of households reported having some contact with their union councilors over the preceding twelve months (left panel), up from 22% in 2001. Over 60% of the households stated that they would approach a union councilor or nazim for their problems, as compared to only 10% who said that they would approach members of the provincial or national assembly (MPA or MNA), again reflective of the increase in accessibility of policy-makers after devolution.
Figure 2: Citizen contacting of union councilors Households reporting contact with union councillors (percent)
0
5
10
15
20
25
30
35
Punjab Sindh NWFP Balochistan Pakistan
2002 2004
Who households would contact, 2004 (percentage)
Union nazim or councillor
Community members
MPA/MNA
0%
10%
20%
30%
40%
50%
60%
70%
80%
90%
100%
1
Source: DTCE (2005)
The survey also revealed that most of the reasons for contact with union councilors cited by male and female respondents alike, related to personal issues, such as financial support, the issuance of identity cards, a police problem, or some form of dispute. Those who contacted for reasons of service delivery did so regarding mainly about water, roads, and electricity. Less than 2 percent
6

of the respondents approached local officials for education and health matters. Clearly, this suggests that increased proximity and greater accessibility of policy-makers does not necessarily imply that pressures for improving social service delivery increase; it may imply that while elected officials may be less able to shirk their responsibilities to their respective constituencies, they may also be consumed by satisfying the personal demands of voters, or demands for improving physical infrastructure.
Electoral accountability As discussed, an argument against local government accountability is that local government elections may not be as competitive as national elections, due either to relatively lower citizen interest and media coverage, or elite capture. The competitiveness of local government elections can be examined along three dimensions: a) voter turnout; b) the level of contestation (percent of seats filled by contest between 2 or more candidates); and c) level of partisan politics, or the number of independent candidates who win relative to candidates who are affiliated with political parties. The first two indicators are almost self-evident — the higher the voter turnout and the greater the level of contest for individual seats, the more ‘representative’ a candidate. With regards to the third indicator — partisan affiliation — it can be argued that intensity of election campaigns is likely to be higher when political parties are involved as opposed to when independent candidates are contesting, primarily because candidates affiliated with political parties have greater resources at their disposal for their campaign. Partisan politics is also likely to impact the first two indicators and lead to a higher voter turnout and greater contestation. As Figure 3, left panel shows, voter turnout in union council elections in Pakistan has been higher than national elections — for example, their was a 48% turnout in the 2005 local government elections, as compared to a 42% turnout in the 2002 national assembly elections — indicating that citizens are if anything more interested in local issues than national ones. Turnout varied considerably across the provinces, from a high of 54% in Punjab to a low of 31% in Balochistan, but was in all provinces higher than the turnout in the national elections. The level of contestation, with one notable exception, has also been considerable. In Punjab, Sindh, and NWFP in only 6%, 12%, and 11% respectively of the seats in the 2005 elections were candidates returned unopposed (Figure 3, right panel). By contrast, in the Balochistan local government elections of 2001 almost 40% of the union council seats were uncontested, a number far higher than in any election at the national or provincial level, and reflected the fact that in many cases the elections were managed up front by tribal elders with the aim of ensuring adequate representation of most of the sub-tribes and clans that were politically important in the district. The 2005 elections appear to have been more competitive, with the number of uncontested seats in the province declining to 17%. Political parties are by law not allowed to participate in local government elections, and candidates have to compete on an individual capacity. However, in reality the vast majority of candidates in the local elections belonged to one or another of the established political parties, and the resources of these parties were, again with the notable exception of some districts in Balochistan, utilized in the campaigns (World Bank 2004). The nature of local partisan politics appears to be quite similar to that at the provincial level — in the districts of Punjab for example, traditional patron-client or factional politics based on biraderis (patrilineal networks) were the main basis for political mobilization (Cheema and Mohmand 2005). The indirect election of the district and tehsil nazim implies that the relative competitiveness of union council elections does not automatically translate into the electoral accountability of these
7

Figure 3: The competitiveness of local government elections Voter turnout in national and local elections
0
10
20
30
40
50
60
National Assembly elections Local Government elections
1993
1997
2002
2001
2005
Percentage of uncontested seats in union council elections
0
5
10
15
20
25
30
35
40
45
Punjab Sindh NWFP Balochistan
2001 2005
Source: DTCE (2005)
key local policy-makers. The re-election of an incumbent district or tehsil nazim is dependent not on voters but on a few hundred union councilors and therefore, downward accountability is dependent on the degree to which union councilors act as agents of the public, and the extent to which nazims have an incentive to listen to councilors. One uniform way that district nazims have responded across districts to this dependence on union councilors is by allocating some portion of the district development budget to each individual union nazim to be used at his or her discretion. This is the equivalent of the MPA and MNA funds that have been constituted at the provincial and national levels respectively. However, the district nazim’s relatively greater independent political standing — they are usually from established political families — also implies that the future electoral fortunes of union councilors are as much linked to their endorsement by the nazim. There are many examples of district nazims campaigning on behalf of union councilors in order to secure his own future re-election from a pliant electoral college (World Bank 2004).
Figure 4: Incumbency disadvantage in local elections
Incumbent winning percentage
0
10
20
30
40
50
60
Punjab Sindh NWFP Baloch. Pakistan
PA elections 1990 PA elections 1993 PA elections 1997 LG elections 2005
Source: Govt. of Punjab (2007)
An interesting feature of local government elections is the relatively high degree of incumbency disadvantage of district nazims. As Figure 4 shows, only 24% of the incumbent district nazims were re-elected in the 2005 across Pakistan, as compared to 38% of members of provincial assemblies in 1997.5 Across the provinces, only in Punjab were district nazims and MPAs equally disadvantaged, with 35% getting re-elected. The incumbency disadvantage of nazims was particularly acute in NWFP and Balochistan, with only 13% and 11% of nazims getting re-elected respectively. A district nazim’s chances of getting re-elected also appears to be unrelated to citizens’ satisfaction with basic services, or views about whether or not these services had improved, as indicated in the household survey data. As Table 1 shows, there is no association between citizen 5 The 2002 provincial assemblies were not considered due to the complications caused by the
intervening period of military rule.
8

Table 1: Correlates with the election of a district nazim
Prob. of nazim
getting re-elected Prob. of nazim
getting re-elected Citizen satisfaction with: Basic health facilities -0.13 (1.88) Schools -6.70 (4.59) Roads 3.29 (2.58) Drinking water supply 2.67 (2.79) Perceived improvement (over past 12 months) in: Basic health facilities -1.01 (0.62) Schools -0.01 (0.97) Roads 0.54 (1.08) Drinking water supply 0.702 (1.78) Note: Logit regression; standard errors in parenthesis Sources: PSLM 2004/05 and data from the Election Commission of Pakistan
satisfaction with education, health, roads, and water supply services in a particular district, or whether the service had improved over the past year (as expressed in the PSLM survey of 2004/05), and the re-election of the district nazim. What does this data on re-election imply? First, incumbency disadvantage reinforces the fact that district nazim elections are indeed competitive and therefore political capture in its crudest form — that is, local monopoly control — is limited. Second, given the indirect election system this result may not be surprising since re-election depends on the support of a few hundred union councilors and may have nothing to do with citizens’ perceptions of service delivery. Third, electoral accountability may exist but voters credit service delivery improvements not to the district nazim but to the provincial government, the prime minister, or other actors, or take other factors into account during elections.6 To conclude, while proximity of local policy-makers is unequivocally greater than that of provincial or national policy-makers, and local government elections appear to be reasonably competitive, the impact of this greater accountability on service delivery is unclear. The next section delves into incentives for service delivery by examining what district governments actually spend on.
6 Electoral manipulation is also a factor that cannot be ruled out. The provinces with high incumbency
disadvantage — Sindh, NWFP, and Balochistan — also had a majority of incumbent district nazims that were in political opposition to the ruling provincial coalition, and anecdotal evidence does suggest that in part their failure to get re-elected was due to the provincial manipulation of the votes of their electoral colleges.
9

V. Local government sectoral priorities This section attempts to uncover the political preferences of local policy-makers by analyzing the expenditure priorities of district governments. For such an exercise to make sense it is crucial that local policy-makers have significant discretion over the funds at their disposal. The analysis therefore focuses on Punjab as local governments are the least fiscally constrained in this province. The focus is also primarily on development expenditures as these are both politically the most visible of government activities and where preferences are most revealed, and also the budgetary area where the greatest element of discretion can be exercised by local policy-makers. We will attempt to gauge political preferences by a) examining the sectoral composition of development expenditures as outlined in the Annual Development Plan (ADP), the budgetary document that provides this information; b) the average size and type of typical local development schemes; c) trends in non-salary recurrent expenditure to estimate the emphasis on operations and maintenance as opposed to new investments; and d) the relative size of provincial spending in the devolved sectors in a district. A main finding from this analysis is that provincial priorities in the devolved sectors have had a significant impact on local preferences, and appear to have encouraged districts to focus more on the physical infrastructure sectors. A major caveat before proceeding is the limitation of fiscal data on local governments. Consolidated ADPs of local governments are not being compiled; each district prepares its ADP as per its own format, and these to date have not been consolidated by the provincial planning or local government departments. The analysis for this paper is based on ADP data for 2006/07 received from 33 of the 35 districts of Punjab. This is the first time to our knowledge that a consolidated profile of the district development portfolio has been prepared.
Inter-governmental fiscal relations in Punjab Given their limited revenue base, local governments in Punjab are heavily dependent on inter-governmental transfers for their resources. The structure of inter-governmental fiscal relations is complex, with local governments receiving funds from a variety of sources over which they have varying degrees of discretion. These sources, as elaborated below, include transfers from the provincial and federal governments, as well as funds that are administered by local governments on behalf of the province and the federal government, in particular under the provincial Annual Development Program and federal and provincial vertical programs. The Provincial Allocable Amount: The formula-based transfers in Punjab, as in the rest of Pakistan, are de jure determined by the Provincial Finance Commission Award. Until 2006/07, these were annual, interim awards; the Punjab Specification and Distribution of Provincial Finances Order, 2006 provided the first three-year award covering the financial years 2006/07 to 2008/09. The Provincial Consolidated Fund (PCF) determines the resources to be divided up between the provincial and local governments, and consists of federal transfers and provincial revenues, with deductions made on account of pensions, debt servicing, and other liabilities of the local government. The Award divides the PCF into the Provincial Retained and the Provincial Allocable amount in the ratio of 58:42, the latter of which is transferred to the local governments into their account (Account 4). This ratio is determined on the basis of expenditure baselines of the province and local governments, taking into account the obligatory expenditures of the province.
10

The provincial allocable amount is transferred to the local government broadly under two separate block grants, one for recurrent expenditures, which constitutes approximately 88% of the allocable amount, and the remainder for development expenditures, with no de jure discretion to local governments to re-allocate across these two windows.7 The development grant — Rs.12 billion in 2006/07 — is distributed horizontally across the districts on the basis of a formula that gives equal weights to population and backwardness. As Figure 5 shows, due to overall improved resource availability, transfers to local governments in Punjab have been increasing steadily at an annual rate of approximately 15% over the past five years, with growth rising to 18% and 22% in 2005/06 and 2006/07. In 2006/07, approximately Rs.100 billion was transferred to local governments, with districts receiving Rs.84 billion, TMAs Rs.12.7 billion, and Unions Rs.4 billion. Given that salary expenditures have increased at a lower rate, districts have been able to utilize some of the savings from the recurrent grants to fund development activities, despite the official earmarking of these transfers. This fiscal space is unique to the districts of Punjab; however even here it is overshadowed by the provincial presence in the districts, particularly in the social sectors. Transfers from the Provincial Retained Amount: The province makes a number of additional transfers to local governments from the provincial retained amount and outside the framework of the PFC. The most significant at the district level are the tied or conditional grants for education and health under the provincial Education Sector Reform Program (ESRP) and Health Sector Reform Program (HSRP) respectively, which are earmarked for the improvement of school and health facility infrastructure. These tied grants are distributed among the districts on a formula based on both need and performance. Additional funds for the social infrastructure improvement are also transferred to local accounts on a more ad hoc basis under the Chief Ministers Accelerated Program for Social Development (CMAPSD). The allocations in the provincial public sector development program for ESRP, HSRP, and CMAPSD (education and health components) in 2006/07 were Rs.5 billion, Rs.1.3 billion, and Rs.5.5 billion respectively.
Figure 5: PFC transfers in Punjab PFC transfers to local governments (Rs. million)
0
20,000
40,000
60,000
80,000
100,000
120,000
2002/03 2003/04 2004/05 2005/06 2006/07
Districts TMAs Unions
Source: Govt. of Punjab (2007)
An additional significant source of local development work is through federal vertical programs such as the Khushal Pakistan Program, the federal Education Sector Reforms (ESR), and the President’s Program for the Improvement of Watercourses. These funds are usually tied to certain pre-defined interventions, and are administered by the concerned DCO or EDO, usually through Personal Ledger Accounts held outside the provincial treasury, again with little or no involvement of the local political leadership.
7 To be precise, the 2.5% of the General Sales Tax is added to the Provincial Allocable and the total
amount is transferred under four grants: a General Purpose Grant to meet current expenditures; an Equalization Grant to meet any shortfalls from the baseline expenditures after distribution of the General Purpose Grant; a Development Grant to meet development needs; and a Tied Grant to meet the social sector priorities of the provincial government.
11

In 2006/07, these and other non-PFC development transfers amounted to Rs.14.5 billion or larger than the local government’s allocation under the block development grant.8 The analysis of district expenditure priorities has to take into consideration this large provincial presence, particularly in the sectors that have been de jure devolved to local governments. Local governments are also involved in executing provincial development schemes through the provincial Account 1. Specifically, the concerned department will, through the respective EDOs, implement these projects. There is no involvement of the district political leadership in the execution of these schemes. On the recurrent side, the province also transfers resources for the recruitment of government employees against vacant posts, and to fund salary increases mandated by the federal government that cannot be financed under the provincial allocable amount.
District development priorities in Punjab Four stylized facts emerge from an analysis of provincial and district development expenditures in Punjab. First, physical infrastructure, in particular roads, is by far the highest priority of the district governments; second, these infrastructure schemes are small and largely neighborhood-specific; third, district policy-makers appear to attach a lower priority to operations and maintenance than their provincial counterparts; and finally provincial interventions in education and health appear to have provided additional incentives for districts to prioritize the physical infrastructure sectors.9 As Figure 6 shows, roughly 32% of the Rs.22.6 billion allocated collectively by the districts in their ADPs for 2006/07 was devoted to the roads sector.10 Citizen Community Boards were the second biggest component, but this was not by choice due to the stipulation of the Local Government Ordinance that 25% of the ADP annually be reserved for CCBs.11 Other major allocations included water and sanitation, Rs.1.8 billion (8% of the ADP), rural electrification Rs.1.3 billion (6%), education Rs.1.15 billion (5%), and health Rs.0.4 billion (2%).12 In total, the three infrastructure sectors of roads, water, and electrification received 46% of the total ADP, and
8 Government of Punjab (2007) 9 This paper focuses on budget allocations as opposed to actual expenditures. The reason is that only the
budget data allows for a separation of what development schemes in the district ADB are being financed by the district (i.e from the block development grant, own source revenues, and any savings from the recurrent grant) and what are being financed by the province.
10 Given that only Rs.12 billion was transferred by the province under the Development Grant in the
PFC, it is likely that actual utilization of the district ADPs would be much less. 11 As per the LGO, a CCB is to be a non-elected voluntary organization, consisting of at least 25
members, which can be established for a variety of purposes, including initiating and improving development projects, establishing cooperatives, forming monitoring bodies over police and other service providers and reinforcing the capacity of monitoring committees at the behest of the concerned council. At least 25 percent of the total development budget of each tier of local government (district, tehsil, and union) must be earmarked for projects identified by CCBs, and each CCB has to make a cash contribution of 20 percent in order to tap into these funds for a specific project.
12 As per the LGO, water and sanitation is the responsibility of tehsils; however district governments’ are
also spending in the sector
12
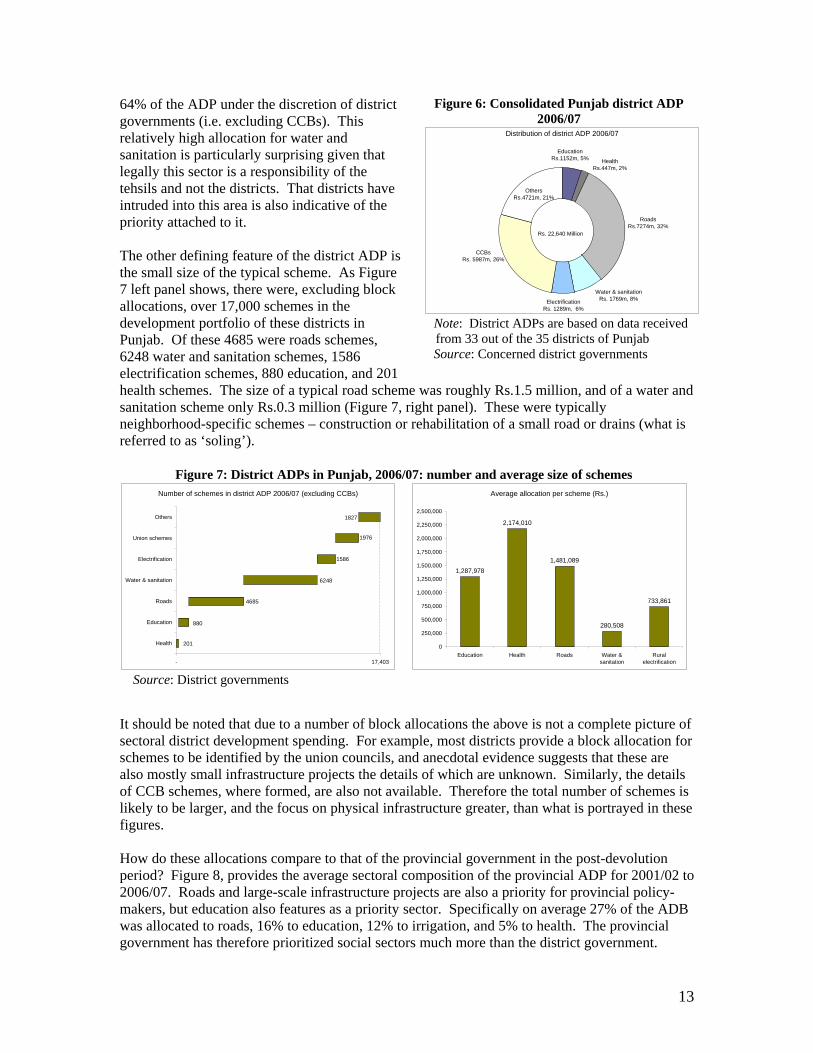
64% of the ADP under the discretion of district governments (i.e. excluding CCBs). This relatively high allocation for water and sanitation is particularly surprising given that legally this sector is a responsibility of the tehsils and not the districts. That districts have intruded into this area is also indicative of the priority attached to it. The other defining feature of the district ADP is the small size of the typical scheme. As Figure 7 left panel shows, there were, excluding block allocations, over 17,000 schemes in the development portfolio of these districts in Punjab. Of these 4685 were roads schemes, 6248 water and sanitation schemes, 1586 electrification schemes, 880 education, and 201 health schemes. The size of a typical road scheme was roughly Rs.1.5 million, and of a water and sanitation scheme only Rs.0.3 million (Figure 7, right panel). These were typically neighborhood-specific schemes – construction or rehabilitation of a small road or drains (what is referred to as ‘soling’).
Figure 6: Consolidated Punjab district ADP 2006/07
Distribution of district ADP 2006/07
Water & sanitation Rs. 1769m, 8%
CCBs Rs. 5987m, 26%
ElectrificationRs. 1289m, 6%
OthersRs.4721m, 21%
Education Rs.1152m, 5% Health
Rs.447m, 2%
Roads Rs.7274m, 32%
Rs. 22,640 Million
Note: District ADPs are based on data received from 33 out of the 35 districts of Punjab
Source: Concerned district governments
Figure 7: District ADPs in Punjab, 2006/07: number and average size of schemes Number of schemes in district ADP 2006/07 (excluding CCBs)
201
880
4685
6248
1586
1976
1827
- 17,403
Health
Education
Roads
Water & sanitation
Electrification
Union schemes
Others
Average allocation per scheme (Rs.)
1,287,978
2,174,010
1,481,089
280,508
733,861
0
250,000
500,000
750,000
1,000,000
1,250,000
1,500,000
1,750,000
2,000,000
2,250,000
2,500,000
Education Health Roads Water &sanitation
Ruralelectrification
Source: District governments
It should be noted that due to a number of block allocations the above is not a complete picture of sectoral district development spending. For example, most districts provide a block allocation for schemes to be identified by the union councils, and anecdotal evidence suggests that these are also mostly small infrastructure projects the details of which are unknown. Similarly, the details of CCB schemes, where formed, are also not available. Therefore the total number of schemes is likely to be larger, and the focus on physical infrastructure greater, than what is portrayed in these figures. How do these allocations compare to that of the provincial government in the post-devolution period? Figure 8, provides the average sectoral composition of the provincial ADP for 2001/02 to 2006/07. Roads and large-scale infrastructure projects are also a priority for provincial policy-makers, but education also features as a priority sector. Specifically on average 27% of the ADB was allocated to roads, 16% to education, 12% to irrigation, and 5% to health. The provincial government has therefore prioritized social sectors much more than the district government.
13

The average provincial schemes were considerably larger than their district counterparts. In total, there were about 2400 schemes in the provincial ADP of 2006/07, with 623 roads, 286 water and sanitation, 174 health, and 149 education schemes. These translated into average scheme sizes of for example Rs.22 million for roads and Rs.13 million for water and sanitation. What are the trends in recurrent expenditure, particularly operations and maintenance expenditure? Unfortunately district expenditure data by object classification are unavailable, and therefore non-salary expenditure patterns need to be estimated from total recurrent expenditures taking into account the annual stipulated salary increases. As Figure 9, left panel shows education, health, and ‘community services’ (primarily roads) nominal recurrent expenditures have increased on average annually by 17%, 13%, and 2% respectively from 2002/03 to 2005/06. Given that salary increases have on average been in the range of 10% to 15% annually in these years, suggests that non-salary expenditures have been broadly stagnant in nominal terms in education and health, and have declined in the roads sector. By contrast, provincial recurrent expenditures in these sectors have increased more sharply, growing annually by 48%, 16%, and 12% in education, health, and community services respectively (Figure 9, right panel).
Figure 8: Composition of the Punjab provincial ADP, 2001/02 to 2006/07
Distribution of Punjab ADP: 2001/02 to 2006/07
Education16%
Health5%
Roads27%Irrigation
12%
Others24%
Block alloc.9%
W & S7%
Source: Punjab P&D department
Figure 9: Trends in setoral district and provincial current expenditures (2002/03 to 2005/06) District current expenditures (2002/03 to 2005/06)
0
20
40
60
80
100
120
140
160
180
2002/03 2003/04 2004/05 2005/06
Education Health Community services
17% annual growth
13% growth
2% growth
Provincial current expenditures (2002/3 to 2004/05)
0
50
100
150
200
250
2002/03 2003/04 2004/05
Education Health Community services
48% annual growth
16% growth
12% growth
Source: Accountant General of Punjab, monthly civil accounts
This relative neglect of non-salary expenditures, combined with the large size of the consolidated district ADPs relative to the block development grant transfer in the PFC, suggests that districts have reallocated funds from the non-salary PFC grant to fund development expenditures. The greater focus on physical infrastructure investments, the emphasis on small, localized schemes, and the relative lack of prioritization of operations and maintenance suggests that incentives for providing visible, targeted benefits are even higher for local policy-makers as compared to their provincial counterparts. Water and sanitation and village electrification in particular exemplify this targeting. As Cheema and Mohmand (2006) found in villages they surveyed in Punjab, sanitation and drain provision was being targeted to specific households even
14

within a lane in a given village. Similarly, village electrification in many cases is actually the provision of electricity connections to particular households in a village. Given the considerable direct contact between citizens and their local political representatives elaborated on in Section IV, and the relatively greater demands of citizens for improvements in roads, water, and electricity as compared to education and health, this emphasis on physical infrastructure could simply be reflective of the relatively greater responsiveness of local governments. It could also be an outcome of the local government political structure. As also discussed in Section IV, district nazims have responded to their electoral dependency on union councilors by allocating some portion of their development funds to each union nazim. This parceling of the development budget into small portions would automatically result in a bias towards small-scale infrastructure schemes targeted to the village and neighborhood that are the constituencies of these councilors. These local priorities are also significantly influenced by the actions of the province, particularly in the sectors that are, as per the LGO, local responsibilities. As discussed, over the past four years, the Punjab government has launched large-scale reform programs in the education and health sectors. The Punjab Education Sector Reform Program is a high-profile program of the government, with a number of interventions including the provision of missing facilities for primary schools, provision of free textbooks to public primary and middle schools, and the provision of stipends to female middle and secondary students in 15 low literacy districts. The funding for the provision of missing facilities is transferred to local governments as tied grants. A total of Rs.5 billion were allocated for this component in 2006/07, and distributed across districts on the basis of need and performance. The mechanics for scheme identification and execution are as follows: the districts provide the provincial government with the total number of missing facilities, and the prioritization within this list is done by the concerned MPAs of the particular district. Therefore, while there is some role for district governments in identifying the schools that will be provided these facilities, the decision about which schools will be targeted in a given year primarily rests with the provincial political leadership. In the initial years of the program, these schemes were implemented by the works and services departments of the concerned district. Starting in 2006/07, implementation has been contracted out to the National Logistics Corporation (NLC), an agency outside of the Punjab public administration. The districts therefore no longer have any role in the execution of these schemes, and serve mainly as a conduit for funds. The Health Sector Reform Program similarly provides tied grants for missing facilities, albeit on a smaller scale, with the schemes again identified by the concerned MPAs. As in education, the implementation of these schemes as also been contracted out to the NLC. A total of Rs.1.3 billion was allocated for this program in 2006/07 in the provincial PSDP, of which Rs.0.9 billion was for the provision of missing facilities in BHUs and RHCs. In addition to these tied grants, the CMAPSD is another major intervention in the provincial PSDP in the devolved education and health sectors. Of the total allocation of approximately Rs.5.5 billion for the education and health components of this program, Rs.2.6 billion is for investments in schools, and Rs.0.8 million for infrastructure improvements in local hospitals, BHUs, and dispensaries, with the remainder targeted at the higher education sector (a provincial responsibility). While these are not referred to as tied grants, as in the ESRP and HSRP individual schemes in this program are identified by the provincial political leadership, but with the districts involved in the execution of these schemes through their works and services departments. The only substantive difference between these programs is that CMAPSD does not
15

have a formula-based allocation mechanism to the districts and is instead distributed in a more ad hoc manner.
Figure 10: Per capita allocations in the districts ( 2006/07) Per capita education development allocations (Rs.)
0
50
100
150
200
250
300
350
400
450
Bhak
kar
Bah
awal
naga
r
Cha
kwal
Fais
alab
ad
Guj
rat
Haf
izab
ad
Jhan
g
Jhel
um
Khu
shab
Laho
re
M.B
.Din
Mia
nwal
i
Nar
owal
Oka
ra
Raj
anpu
r
R.Y
.Kha
n
Sia
lkot
T.T.
Sing
h
District Tied grants Province
Per capita health development allocations (Rs.)
0
20
40
60
80
100
120
Bha
kkar
Bah
awal
naga
r
Cha
kwal
Fais
alab
ad
Guj
rat
Haf
izab
ad
Jhan
g
Jhel
um
Khus
hab
Laho
re
M.B
.Din
Mia
nwal
i
Nar
owal
Oka
ra
Raj
anpu
r
R.Y
.Kha
n
Sia
lkot
T.T.
Sin
gh
District Tied grants Province
Per capita roads development allocations (Rs.)
0
100
200
300
400
500
600
700
800
900
1000
Bha
kkar
Bah
awal
naga
r
Cha
kwal
Fais
alab
ad
Guj
ranw
ala
Guj
rat
Haf
izab
ad
Jhan
g
Jhel
um
Kas
ur
Kha
new
al
Khus
hab
Laho
re
Layy
ah
M.B
.Din
Mul
tan
Mia
nwal
i
Nan
kana
Sah
ib
Nar
owal
Oka
ra
Pak
patta
n
Raj
anpu
r
Raw
alpi
ndi
R.Y
.Kha
n
Sar
godh
a
Sia
lkot
She
ikhu
pura
T.T.
Sin
gh
Veh
ari
District Province
Per capita water and sanitation development allocations (Rs.)
0
50
100
150
200
250
300
350
400
450
500
Bha
kkar
Bah
awal
naga
r
Cha
kwal
Fais
alab
ad
Guj
ranw
ala
Haf
izab
ad
Jhan
g
Jhel
um
Kas
ur
Kha
new
al
Khu
shab
Laho
re
M.B
.Din
Mul
tan
Mia
nwal
i
Nan
kana
Sah
ib
Raj
anpu
r
R.Y
.Kha
n
She
ikhu
pura
T.T.
Sin
gh
District Province
Source: Punjab P&D department and district governments
In total therefore, the provincial ADP allocated Rs.7.6 billion and Rs.1.7 billion for primary and secondary school and health infrastructure, far greater than the Rs.1.1 and Rs.0.4 billion that the districts are spending in these devolved sectors. This predominance of provincial priorities at the local level is evident in Figure 10, which displays per capita allocations in education, health, roads, and water and sanitation by the district and provincial governments in districts on which data was available. Tied grants, the CMAPSD, and provincial schemes executed from Account 1 form by far the largest source of development expenditures in education and health in the districts for which data was available (Figure 10, top panels). On average these are five to six times the district allocations. The provincial presence in the districts in the infrastructure sectors is also large, but not as predominant (Figure 10, bottom panels). In roads the province and districts are allocating on average roughly equivalent amounts, while in water and sanitation district allocations form a larger proportion. It is not unreasonable to presume that these provincial interventions have an impact on the decision-making of local policy-makers. Credit claiming for a particular service becomes difficult if multiple tiers of government are providing the same service. This distortion can then create incentives for politicians to focus on targeted benefits or on more visible interventions. Figure 11 provides some clues as to why districts are focusing on small-scale infrastructure. Since both the education and health tied grants are for the provision of missing facilities, there is
16

very little distinction between these and district schemes, as indicated by the similar average size of these schemes. By contrast, the district is able to distinguish itself much more from the province in roads and water and sanitation by focusing on smaller schemes. The average district road scheme is one-tenth the size of a provincial scheme, and the average water and sanitation scheme one-twentieth the size. The reason it can do so is that physical infrastructure is intrinsically more ‘heterogeneous’ than social infrastructure — roads and drains come in all sizes whereas primary schools and basic health units are all quite similar. This heterogeneity allows for ‘specialization’, enabling district policy-makers to focus on and to take credit for the small, neighborhood schemes and provincial policy-makers to take credit for the larger ones.
Figure 11: Average size of district and provincial schemes
Average size of development schemes executed in specific districts (Rs.Thousand)
1,2882,174
1,481281
14,839
5,786
3,102
930
0
2,000
4,000
6,000
8,000
10,000
12,000
14,000
16,000
Education Health Roads Water & sanitation
District Tied grants or province
Tied grants
Tied grants
Province
Province
Source: P&D department and district
governments
The above data also suggests that many districts have responded to the provincial initiatives in education and health by essentially ceding all responsibility for these sectors to the province. For example, districts, such as Bhawalnagar, Mianwali, Narowal, Rajanpur, and Toba Tek Singh allocated either zero or negligible development funds to health in their ADPs in 2006/07. Similarly, Bhakkar, Bhawalnagar, Jhelum, and Mianwali had no education schemes in their ADPs.
Figure 12: Trends in Punjab real setoral district and provincial ADP allocations Growth in provincial real development allocations
0
100
200
300
400
500
600
700
800
900
1000
11001200
1300
1400
1500
2001/02 2002/03 2003/04 2004/05 2005/06 2006/07
Roads
Education
Health
W&S
Real district ADP allocations (2003/04 to 2006/07)
0
20
40
60
80
100
120
140
160
180
2003/04 2004/05 2005/06 2006/07
Roads
Health
Electrification
Education
Note: Trends in district ADP is based on data for 13 districts of Punjab Source: P&D department, and district governments
This replacement of district social sector funding by the province is also evident in the sectoral trends in the provincial and district ADPs (Figure 12). Provincial real development allocations for roads and education have increased significantly in the post-devolution period. Road allocations have risen fourteen-fold in real terms between 2001/02 and 2006/07, and education allocations six-fold (Figure 12, left panel). By contrast, consolidated district education ADP allocations (based on available data from 13 Punjab districts) have declined by approximately 50 percent in real terms from 2003/04 to 2006/07. District health allocations have also declined in real terms over this period, while provincial health allocations have roughly doubled from 2001/02. Districts’ prioritization of physical infrastructure is again evident, with roads allocations increasing by 70 percent and rural electrification by 30 percent.
17

The fact that district allocations in education and heath have declined over time suggests that relative lack of emphasis on social infrastructure is not simply due to lower citizen demand (one would not expect these to change in the short run), or the structural constraints imposed by the local government electoral system (which are constant). It reinforces the finding that the general unforeseen impact of the provincial tied grants is an even greater incentive for local politicians to emphasize physical infrastructure, a prioritization that is understandable given the problems of credit-claiming in social infrastructure.
VI. Conclusion This paper explored the linkage between devolution, accountability, and service delivery in Pakistan by first examining the degree of accessibility of local policy-makers and level of competition in local elections, and second the expenditure priorities of local governments, and the extent to which they were focused on patronage as opposed to the provision of public goods. The available evidence suggests that the direct accessibility of local policy-makers to citizens is considerably greater than that of provincial and national policy-makers, allowing the public many more channels to communicate their demands to the government. It is also the case that union council elections in general, barring some notable regional variations, are as competitive as provincial and national elections. The high incumbency disadvantage of district nazims also suggests that elite capture is not a significant problem at the district level. However, the indirect elections of the district and tehsil leadership imply that there are some question marks around the electoral accountability of these key policy-makers. This greater accessibility has not translated into incentives for improved social service delivery. Local government priorities are heavily tilted towards the physical infrastructure sectors, and within physical infrastructure to small schemes that can be targeted to specific localities and even households. The fact that roads and water and sanitation schemes are small and neighborhood specific indicates that local policy-makers are focusing on areas of spending for which they can get maximum visibility. This conclusion is also evident in the emphasis on development expenditures at the expense of operations and maintenance expenditure. This in part may be an outcome of their relatively greater accountability — as discussed, most citizens contact councilors for personal favors or for physical infrastructure. It may also be a product of the indirect election system, as district nazims are dependent on the support of union councilors, and the latter’s constituency is the village and neighborhood. It is also, as elaborated at length, a response to the province’s focus on the social sectors. If the provincial government has taken on the agenda for education and health, and the district is focusing on physical infrastructure, then is that necessarily an inefficient outcome? As discussed in Section III, administrative devolution remains incomplete in Pakistan, and local governments have little effective authority over the provincial staff assigned to them. Therefore, given that personnel management is such an important feature of effective delivery of education and health service, this de facto re-centralization may indeed produce beneficial outcomes. The counterargument to this concerns sustainability. Given that it will be the district’s responsibility to maintain these social infrastructure schemes, what incentives would they have to keep them going if they have had little say in their identification and construction? One of the major criticisms of the Social Action Program of the 1990s, under which the government and donors invested approximately $9 billion in the social sectors with very little to show in the way
18
of outcomes, was precisely that the program was too centralized and that the infrastructure investments did not take into account local conditions. So there is a risk that the same mistake is being repeated. The main policy implication of these findings is the need for coherence in the key accountability relationships delineated in Figure 1. If administrative devolution is unlikely to take place, and this appears to be the case in Pakistan, then recentralization of education and health may indeed be a sensible strategy, but then this should be complete recentralization, and the province should also be responsible for the recurrent budget in these sectors. Given the citizen pressures for provision of physical infrastructure, this recentralization could be part of a bargain and agreement between the province and local governments that (intra-district) roads and water and sanitation services would then be an area the province would not interfere in and where local governments would have considerable expenditure autonomy.
19
References
Ahmad, Junaid, Shantayanan Devarajan, Stutu Khemani, and Shekhar Shah. 2004. “Decentralization and Service Delivery”. Mimeo, World Bank Bardhan, Pranab and Dilip Mookherjee. 2004. “Pro-poor Targeting and Accountability of Local
Governments in West Bengal”, Working paper, Institute for Economic Development, Boston University
Besley, Timothy, Rohini Pande, Lupin Rahman, Vijayendra Rao. 2004. “The Politics of Public
Goods Provision: Evidence from Indian Local Governments.” Journal of the European Economic Association Papers and Proceedings, Vol. 2 (2-3), pp. 416-426, April - May 2004
Cheema, Ali and Shandana Khan Mohmand. 2006. “Bringing Electoral Politics to the Doorstep:
Who Gains who Loses?” Mimeo, Lahore University of Management Sciences Devolution Trust for Community Empowerment (DTCE) and CIET, 2005. Social Audit of
Governance and Delivery of Public Services: National Report. 2004/05. Islamabad: DTCE Faguet, Jean-Paul. 2001. “Does Decentralization Increase Government Responsiveness to Local
Needs? Decentralization and Public Investment in Boliia”. Working Paper No. 999, Centre for Economic Performance, London School of Economics
Government of Pakistan. 2005. Pakistan Social and Living Standard Measurement Survey
(PSLM), 2004/05. Islamabad: Federal Bureau of Statistics Government of Pakistan, Accountant General of Punjab. 2002/03–06/07. Monthly Civil
Accounts. Government of Punjab, Finance Department. 2007. White Paper on the Budget, 2007/08.
Lahore: Government of Punjab Government of Punjab, Planning and Development Department. 2001/02–06/07. Annual
Development Program. Lahore: Government of Punjab Keefer, Philip and Stuti Khemani. 2003. “Democracy, Public Expenditures, and the Poor.” World
Bank Policy Research Working Paper No. 3164. Washington D.C. Keefer, Philip. 2004. “What does Political Economy tell us about Economic Development – and
Vice Versa?” World Bank Policy Research Working Paper No. 3250. Washington D.C. Keefer, Philip. 2002. Clientelism, Credibility, and Democracy”. Mimeo, Development Research
Group, World Bank Persson, Torsten and Guido Tabellini. 2000. Political Economics. Cambridge, MA: MIT Press Triesman, Daniel. 2002. “Decentralization and the Quality of Government.” Mimeo, University
of California, Los Angeles
20

World Bank. 2004. Devolution in Pakistan: An Assessment and Recommendations for Action. Washington, D.C.
World Bank. 2003. Making Services Work for Poor People: World Development Report 2004.
Washington D.C. World Bank. 2001. Indonesia Poverty Report. The World Bank: Washington D.C
21