Embed Size (px)
Citation preview

DEVELOPMENTS IN THE EXTERNAL SECTOR 6.1 Overall Balance of Payments
Fiscal year 2004/05 witnessed a turn-around in the overall balance of payments position of the country. It registered a deficit of USD 101.4 million in 2004/05 from a surplus of USD 226.7 and 306.5 million in the last two years, respectively. This was solely attributed to the recorded deficit in the merchandise trade which more than offset the exhibited surplus in net services, unrequited transfers and non-monetary capital.
Merchandise trade deficit widened to USD 2815.9 million (25.2 percent of GDP) from USD 1373.3 million (20.7 percent of GDP) in 2002/03 and USD 1985.7 million (24.7 percent of GDP) in 2003/04, reflecting the surge in imports which more than offset a substantial increase in exports. Mirroring the widening of the merchandise trade deficit, the current account deficit (including official transfers) more than doubled and stood at USD 1013.6 million (11.4 percent of GDP) against a deficit of USD 501.7 million (6.2 percent of GDP) in 2003/04.
Meanwhile, the net reserve holdings of the NBE depicted a build-up of USD 52.8 million in the review year reflecting the Bank's policy of maintaining adequate level of reserves. In effect, the international reserves of the country as at July 7,2005 was sufficient to cover over 3.6 months of imports of goods and non-factor services of next year.
Table VI. 1 Balance of Payments (In Millions USD)

2002/03 2003/04 2004/05 Percentage Change
Particulars A B C C/B C/A
Trade Balance -1373.29 -1985.68 -2815.91 41.81 105.05
Exports 482.71 600.45 817.91 36.22 69.44
Imports 1856.00 2586.13 3633.25 40.49 95.76
Net Services 121.91 246.17 241.57 -1.87 98.15
Travel 39.09 100.62 114.06 13.35 191.78
Transportation 83.30 57.30 70.73 23.43 -15.09
Government (n.i.e.) 117.08 173.81 176.88 1.77 51.08
Investment income -46.51 -63.58 -35.79 -43.71 -23.06
Interest -34.98 -38.94 -14.03 -63.97 -59.89
Cash (net) -7.32 -11.07 12.48 -212.75 -270.46
Arrears -0.50 0.00 0.00 -100.00
Relief -27.15 -27.87 -26.51 -4.85 -2.36
Dividend -11.53 -24.64 -21.76 -11.70 88.67
Other Services -71.04 -21.99 -84.32 283.43 18.69
Private Transfers 494.89 671.32 810.95 20.80 63.87
Current Account Balance (excl. public transfers)
-756.49 -1068.19 -1763.39 65.08 133.10
Public Transfers 599.80 566.53 749.77 32.35 25.00
Current Account Balance (incl. public transfers)
-156.69 -501.66 -1013.61 102.05 546.88
Non-monetary Capital 400.04 512.44 585.09 14.18 46.26
Long-term (net) 336.81 388.36 440.61 13.45 30.82
Disbursements 561.13 510.67 570.83 11.78 1.73
Repayments 224.32 122.30 130.22 6.47 -41.95
Cash 136.51 68.69 72.92 6.16 -46.58
Arrears 0.33 0.00 0.00 -100.00
Relief 87.48 53.61 57.29 6.86 -34.51
Direct Investment (net) 123.31 150.00 150.00 0.00 21.64
Short-term (net) -60.09 -25.92 -5.52 -78.70 -90.81
Net Errors & Omissions 63.17 215.93 327.1 51.51 417.91

Overall Balance 306.51 226.71 -101.37 -144.71 -133.07
Financing -306.51 -226.71 101.37 -144.71 -133.07
Reserves (-:increase) -376.52 -308.19 17.57 -105.70 -104.67
NBE net foreign asset -290.11 -333.58 -52.80 -84.17 -81.80
CBE net foreign asset -84.26 25.39 70.37 177.17 -183.51
Arrears 0.83 0.00 0.00 -100.00
Principal 0.33 0.00 0.00 -100.00
Interest 0.50 0.00 0.00 -100.00
Debt Relief 69.18 81.48 83.81 2.86 21.15
Principal 42.07 53.61 57.29 6.86 36.17
Interest 27.19 27.87 26.51 -4.85 -2.50
Source: National Bank of Ethiopia, staff compilation
Table VI.2 Components of External Trade as a percentage of GDP
Particulars 2002/03 2003/04 2004/05 Percent Change
A B C C/B C/A
Exports 7.30 7.50 7.31 -2.55 0.12
Imports 27.91 32.23 32.47 0.75 16.35
Trade Balance -20.70 -24.70 -25.16 1.88 21.56
Net Services 1.80 3.10 2.16 -30.36 19.93
Net Private Transfers 7.40 8.40 7.21 -14.12 -2.52
Current Account Deficit (Excluding Official Transfers)
-11.40 -13.30 -15.79 18.73 38.52
Current Account Deficit (Including Official Transfers)
-2.40 -6.20 -11.35 83.12 373.07
Source: The National Bank of Ethiopia, staff compilation
6.2 Developments in Merchandise Trade
In the review year, owing to a significant surge in imports which more than offset a substantial increase in exports, merchandise trade deficit widened to USD 2815.9 million, up by 41.8 and 105 percent compared to the deficits recorded in 2003/04 and 2002/03, respectively. Nevertheless, as a partial reflection of the continued integration of the Ethiopian economy with the rest of the world, the share of merchandise trade rose to 39.8 percent of GDP in 2004/05 from 35.2 percent of GDP in 2002/03.
6.2.1 Exports
The performance of exports in 2004/05 had been encouraging, as earnings from exports reached a record high level of USD 817.7 million, up by 36 and 69 percent over the preceding two fiscal years, respectively. The continued robust growth in export earnings was spurred by improvements in international price of coffee, Ethiopia's dominant export commodity, and a substantial increase in the quantity of major export items. For the last two consecutive years on average exports registered more than 30 percent growth rate in contrast to less than 8 percent growth rate during the last three decades.

Table VI.3 Values of Major Export Items (In Millions of USD)
Particulars 2002/03 2003/04 2004/05 Percentage Change
A B C C/B C/A
Coffee 165.26 223.45 335.37 50.09 102.93
Leather & Leather Products 52.22 43.59 63.73 46.20 22.04
Pulses 19.97 22.58 35.47 57.09 77.62
Oilseeds 46.09 82.66 102.29 23.75 121.94
Fruits & Vegetables 9.58 12.72 16.07 26.34 67.75
Meat & meat products 2.42 7.66 14.59 90.47 502.89
Live Animals 0.481 1.91 12.82 571.59 2564.22
Chat 58.02 88.02 99.96 13.57 72.29
Gold 42.08 48.71 52.50
7.78 24.78
Others 86.66 69.15 84.96 22.86 -1.96
Total 482.78 600.45 817.74 36.19 69.38
Of which Non Coffee 317.52 377 482.37 27.95 51.92
Source: Ethiopian Customs Authority
Earnings from coffee export grew by 50 percent and reached USD 335.3 million in the review year, largely on account of a 48 percent increase in the international prices of coffee from USD 1.43/kg in 2003/04 to USD 2.08/kg in 2004/05. The increase in earnings was even more pronounced (102.9 percent increase) as compared to 2002/03 largely driven by higher coffee prices.
On the other hand, notwithstanding the exhibited decline in their prices, earnings from pulses, oilseeds and chat reached a record high level as compared to receipts of the last three years. This was mainly attributed to improvements in the volume of exports of these commodities, which in turn was the result of good weather conditions. Earnings from meat and meat products and live animals also more than doubled in 2004/05, presumably due to market deepening in the Middle East and the opening-up of a new market for meat products in Egypt.


Table VI.4 : Volume of Major Exports (In Millions of Kg)
Particulars 2002/03 2003/04 2004/05 Percent Change
A B C C/B C/A
Coffee 126.13 156.00 161.10 3.27 27.73
Oilseeds 82.80 106.00 140.70 32.74 69.93
Leather & Leather Products 11.54 9.41 15.40 63.69 33.47
Pulses 66.15 73.00 121.70 66.71 83.98
Meat & Meat Products 1.72 4.01 7.27 81.43 322.14
Fruits & Vegetables 25.30 37.00 37.90 2.43 49.80
Live Animals 0.61 3.1 9.13 190.76 1403.28
Chat 6.11 18.52 19.43 4.92 217.94
Gold 0.00 0.00 0.00 -18.86 -27.27
Source: Ethiopian Customs Authority.

Table VI. 5 : Unit Value of Major Exports (In USD Per Kg.)
Particulars 2002/03 2003/04 2004/05 Percent Change
A B C C/B C/A
Coffee 1.31 1.43 2.08 45.34 58.88
Oilseeds 0.56 0.78 0.73 -6.77 30.61
Leather & Leather Products 4.95 4.63 4.14 -10.68 -16.49
Pulses 0.30 0.31 0.29 -5.77 -3.46
Meat & Meat Products 1.41 1.91 2.01 4.98 42.82
Fruits & Vegetables 0.38 0.35 0.42 23.34 11.98
Live Animals 0.79 6.08 1.40 -76.88 77.23
Chat 9.50 4.75 5.15 8.24 -45.81
Gold 8417.85 10867.26 14441.83 32.89 71.56
Source: Calculated from tables VI.3 and VI.4

6.2.2. Imports
Fiscal year 2004/05 marked a surge in merchandise imports from USD 2586 million in 2003/04 to USD 3633.3 million in 2004/05 owing to increases in all major components of imports.
Raw materials imports grew by 89 and 125 percent against the preceding two years’ low base of USD 26 and 22 million, respectively. This was presumably associated with the expansion in industrial production and higher international prices for metal products such as iron sheet and steel.
Similarly, fuel imports more than doubled and reached USD 668.7 million from USD 310.5 million a year ago, largely reflecting the continued rise in the average price of oil in the international market. According to World Economic Outlook (April, 2005), average price of oil is estimated to increase by 23.2 percent in 2005 and expected to reached USD 46.50 per barrel from USD 37.76 per barrel in 2004. In April 2005, the price further rose to USD 52.96 per barrel. In Ethiopia, fuel imports accounted for about 18 percent of total imports in the review year from about 12 percent a year ago reflecting the adverse impact of oil price shock.
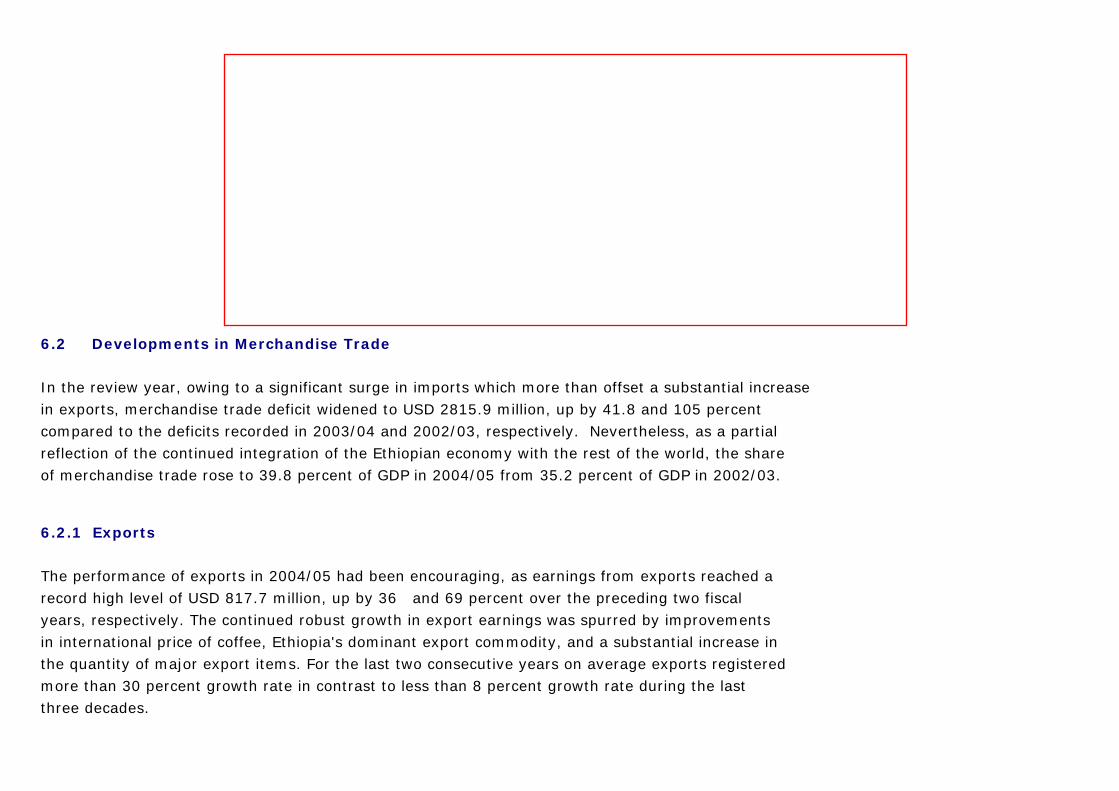
A notable increase was also registered for capital goods import as it more than doubled and stood at USD 1199 million in 2004/05 compared to USD 549.5 million in 2002/03, reflecting the increasing investment activities in the country. Industrial goods accounted for about 67 percent of the total capital goods imported in 2004/05 compared to 65 percent a year earlier.
Consumer goods import went-up to USD 986.1 million in 2004/05 from USD 654.4 million in 2002/03 and USD 895.6 million in 2003/04, although their share in total imports tended to slowdown over the last three years.
Table VI.6 : Value of Imports by End Use (In Millions of USD)
2002/03 Share from total
Import
2003/04 Share from total
Import
2004/05 Share from total
Import
Percentage Change
A B C C/B C/ARaw Materials 21.83 1.18 25.98 1.00 49.11 1.35 89.08 124.97Semi-finished Goods
274.64 14.79 435.17 16.82 664.67 18.29 52.74 142.02
O/w Fertilizers
53.90 2.90 106.63 4.12 121.96 3.36 14.37 126.28
Fuel 287.65 15.49 310.51 12.00 668.72 18.41 115.36 132.48 Petroleum Products
287.14 15.47 310.19 11.99 667.36 18.37 115.14 132.42
Others 0.51 0.03 0.32 0.01 1.35 0.04 322.97 166.67Capital Goods 549.49 29.60 876.56 33.88 1,199.37 33.01 36.83 118.27 Transport 174.04 9.38 298.31 11.53 371.63 10.23 24.58 113.53 Agricultural 5.89 0.32 10.77 0.42 24.37 0.67 126.25 313.67 Industrial 369.56 19.91 567.47 21.94 803.37 22.11 41.57 117.38Consumer Goods 654.35 35.25 895.58 34.62 986.14 27.14 10.11 50.71 Durables 183.56 9.89 294.60 11.39 337.33 9.28 14.50 83.77 Non-durables 470.79 25.36 600.99 23.23 648.82 17.86 7.96 37.81Miscellaneous 68.45 3.69 43.06 1.66 65.28 1.80 51.59 -4.63Total Imports 1,856.41 100.00 2,586.87 100.00 3,633.29 100.00 40.45 95.72
Source: Ethiopian Customs Authority

6.3 Services and Transfers
6.3.1 Services
In the review year, the surplus in net services account declined by about 2 percent to USD 241.5 million from USD 246.2 million in the previous year. This was largely attributable to a sizable increase in payments for other services such as construction and other business services performed by non-residents.
As Addis Ababa continued to host regional and/or international conferences, net receipts from travel services picked-up to USD 114.1 million in 2004/05 from USD 39 million in 2002/03.
Similarly, net receipts from transportation services increased to USD 70.7 million in the review year from USD 57.30 million in 2003/04, mainly associated with improvement in receipts of the Ethiopian Airlines resulting from sizable increases in conference tourism and the operational activities of the Airlines across the globe.
Inspite of the low interest payment in connection with debt cancellation measures for Heavily Indebted Poor Countries (HIPC), the income account was still persistently in deficit reflecting the indebtedness of the country. Nevertheless, the magnitude of the deficit declined overtime and reached USD 35.8 million from USD 63.6 million a year ago.

6.3.2 Unrequited Transfers
Net receipts from private transfers increased to USD 810.8 million in the review year from USD 671.3 million in the preceding year mainly due to a significant increase in private individual transfers. Inspite of the modest increase (9.9 percent) in NGO's cash transfers, overall transfers from NGOs almost remained at the previous year's level of USD 457 million, owing to a substantial decline in food assistance. Emergency food relief slowed down to USD 13.4 million in 2004/05 from USD 52.9 million in the previous year, reflecting good weather conditions and the willingness of NGOs to purchase relief food from the local market.
As indicated above, private individual transfers also surged by 58.8 percent over the previous year largely due to the conducive environment that eased the transfer of money by Ethiopians in the Diaspora through international money transfers such as Western Union and Money Gram in cooperation with domestic commercial banks.
Table VI. 7 Unrequited Transfers (In Millions of USD)
No.
Particulars
2002/03 2003/04 2004/05 Percentage Change
A B C C/B C/A 1 Private Transfers 495.52 671.27 810.77 20.78 63.62
1.1 Receipts 511.22 690.22 828.10 19.98 61.98
NGO's 346.74 456.82 457.38 0.12 31.91
Cash 300.77 403.91 444.02 9.93 47.63
Other 0.01 0.01 0.00 -99.34 (99.44)
Food 45.96 52.90 13.36 -74.75 (70.93)
Private individuals 164.49 233.40 370.71 58.83 125.37
Cash 140.60 211.01 350.75 66.23 149.47
In kind 23.89 22.39 19.96 -10.87 (16.45)
1.2 Payments (15.70) (18.95) (17.32) -8.58 10.34
2 Official Transfers 599.80 566.48 749.70 32.34 24.99
2.1 Receipts 603.84 573.13 754.99 31.73 25.03
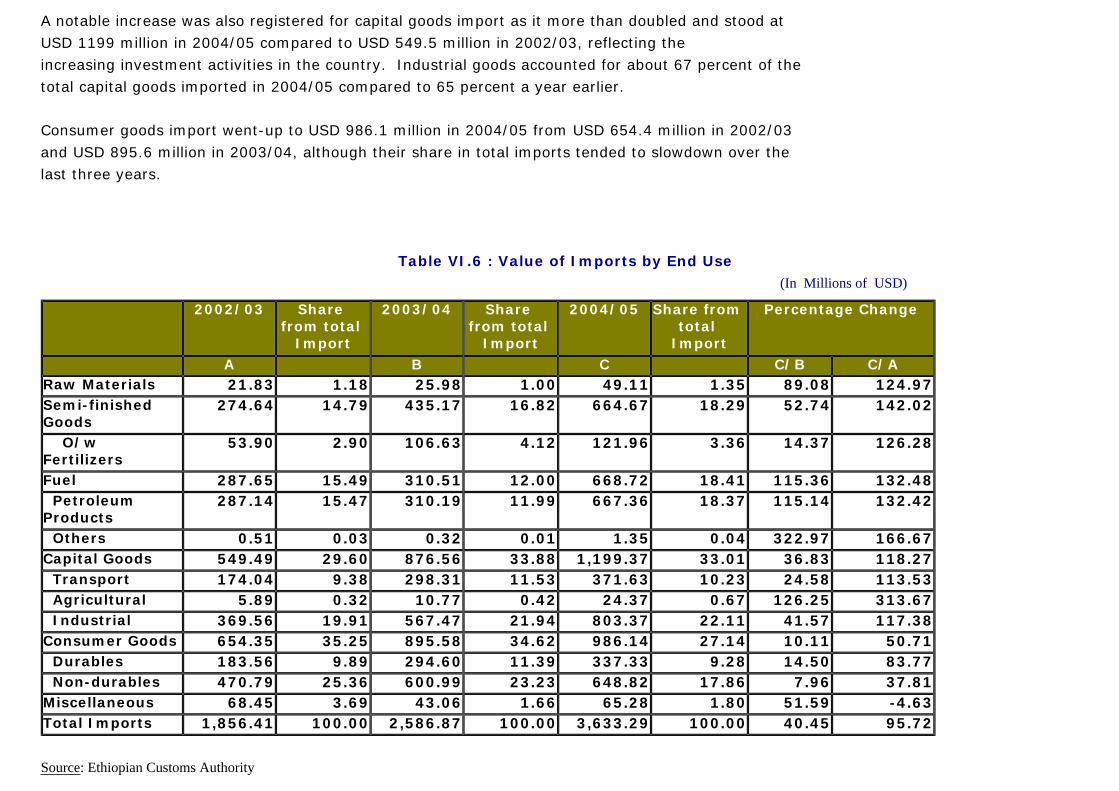
Cash 471.99 490.95 659.79 34.39 39.79
Other 0.92 0.20 0.27 30.92 (71.17)
Food 130.93 81.98 94.93 15.79 (27.50)
2.2 Payments (4.03) (6.65) (5.29) -20.53 31.08
Total Transfers 1,095.33 1,237.75 1,560.47 26.07 42.47
Source: DPPC and FESMD, NBE
Meanwhile, net official transfers increased by 32.3 percent to USD 749.7 million in the review year from USD 566.5 million in 2003/04. In particular, official cash transfers increased to its pick level of USD 659.8 million in the review year from USD 490.9 million in the previous year. Official food aid and other transfers also increased by 15.8 percent and 30.9 percent, respectively.
6.4 Current Account
As is evident from the above analysis, the positive developments in the services and unrequited transfers accounts were off-setted by the merchandise trade deficit. Consequently, the current account deficit (excluding official transfers) worsened to USD 1763.4 million (15.8 percent of GDP) from USD 756.4 million (11.4 percent of GDP) in 2002/03. The current account deficit (including official transfers) also widened from USD 156.5 million (2.4 percent of GDP) to USD 498.6 million (11.4 percent of GDP) during the same period.
6.5 Capital Account
The surplus in the capital account rose to USD 585 million from USD 512.4 million in 2003/04 largely driven by 11.8 percent increase in long term loan disbursement and a significant decline (78.7 percent) in outflows of short term capital. Compared to the level in 2002/03 as well, the capital account surplus has shown a substantial improvement (46.3 percent increase), driven by lower amortization payments and short-term capital outflows. Amortization payments declined to USD 130.2 million in 2004/05 from USD 224.3 million in 2002/03, reflecting the debt relief assistance obtained by the country after reaching the HIPC completion point in April, 2004.

6.6 Change in Reserve Position
In contrast to the last two years which saw continuous build-up in reserves, the net reserve holdings of the country depicted a reserve drawdown of USD 17.6 million in 2004/05. This was wholly associated with a reserve draw-down of USD 70.4 million by the commercial banks, which more than offset a net reserve build-up of USD 52.8 million by the NBE.
The decline in the reserve holdings of commercial banks clearly reflects their effort to finance import demands from their own reserves. Spurred by a reserve build-up of USD 52 million by the NBE, the gross reserve of the country as at July 7,2005 was sufficient to cover 3.6 months of imports of goods and non-factor services of next year.6.7 External Debt
At the end of 2004/05 fiscal year, the country’s external debt stock stood at USD 6021.0 million, 16.4 percent lower than USD 1179.3 million in 2003/04.
Of the total debt stock, about 81 percent was owed to multilateral creditors, 13 percent to bilateral creditors and the remaining 6.0 percent to commercial lenders. Within the multilateral group, IDA accounted for the lion's share of 68.9 percent followed by ADB/ADF (22.0 percent). Similarly, Paris club and non-Paris club creditors accounted for 29.0 percent and 71.0 percent of the total debt stock owed to bilateral creditors.
A simple indicator of the external indebtedness of the country reveals that the debt burden of Ethiopia has reduced over time, owing to the HIPC relief assistance. The ratio of external debt service to receipts from export of goods and non-factor services steadily declined during the past three fiscal years and reached 9.9 percent in the review period. Similarly, debt stock to GDP[1] ratio dropped from
73.5 percent in 2003/04 to 53.8 percent in 2004/05. At the same time, the ratio of external debt to exports of goods declined to 3.2 percent in 2004/05 from 5.9 percent in 2002/03.
[1] GDP at current market price based on revised series in 2005 and official exchange rates are used to convert it into US dollar.
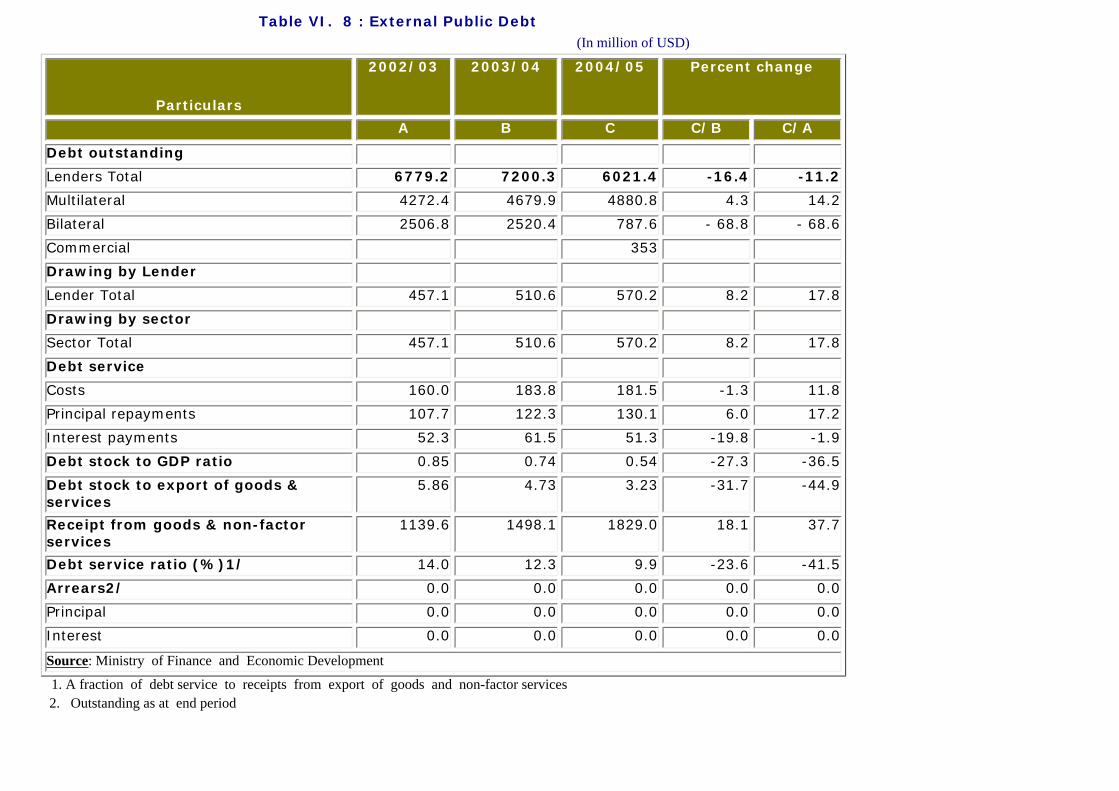
Table VI. 8 : External Public Debt (In million of USD)
Particulars
2002/03 2003/04 2004/05 Percent change
A B C C/B C/A
Debt outstanding
Lenders Total 6779.2 7200.3 6021.4 -16.4 -11.2
Multilateral 4272.4 4679.9 4880.8 4.3 14.2
Bilateral 2506.8 2520.4 787.6 - 68.8 - 68.6
Commercial 353
Drawing by Lender
Lender Total 457.1 510.6 570.2 8.2 17.8
Drawing by sector
Sector Total 457.1 510.6 570.2 8.2 17.8
Debt service
Costs 160.0 183.8 181.5 -1.3 11.8
Principal repayments 107.7 122.3 130.1 6.0 17.2
Interest payments 52.3 61.5 51.3 -19.8 -1.9
Debt stock to GDP ratio 0.85 0.74 0.54 -27.3 -36.5
Debt stock to export of goods & services
5.86 4.73 3.23 -31.7 -44.9
Receipt from goods & non-factor services
1139.6 1498.1 1829.0 18.1 37.7
Debt service ratio (%)1/ 14.0 12.3 9.9 -23.6 -41.5
Arrears2/ 0.0 0.0 0.0 0.0 0.0
Principal 0.0 0.0 0.0 0.0 0.0
Interest 0.0 0.0 0.0 0.0 0.0
Source: Ministry of Finance and Economic Development
1. A fraction of debt service to receipts from export of goods and non-factor services 2. Outstanding as at end period

Developments in the Foreign Exchange Market
Developments in the Nominal Exchange Rate
In the inter-bank foreign exchange market, the official exchange rate continued to depreciate in the review year and stood at Birr 8.6518/USD, reflecting a depreciation of 0.372 and 0.826 percent vis-à-vis 2003/04 and 2002/03, respectively. Similarly, the parallel market exchange rate depreciated by 0.414 percent to reach Birr 8.711085/USD from Birr 8.6751/USD in the preceding year. As a result, the spread between the official and parallel market rates widened from 0.64 percent in the preceding year to 0.68 percent in the review year.
With regard to exchange rate developments in the retail market, the average buying and selling rates of commercial banks have depreciated by 0.37 percent and 0.62 percent, respectively to reach Birr 8.6526/USD and Birr 8.8194/USD from Birr 8.6204/USD and Birr 8.7653/USD in the previous year. In a similar development, the average buying and selling rates of the foreign exchange bureaux have depreciated by 0.36 percent and 0.37 percent respectively compared to last year (Table VI.12 & Table VI.13).
Table VI.9 : Inter-Bank and Parallel Forex Market Exchange Rates

Period Average Weighted
Rate
Amount Traded in millions of USD
Parallel Market
Number of Trades
Total o/w Among CBs
Total o/w Among CBs
Average
2002/03 8.5809 160.43 51.74 588 141 8.7091
Qtr.I 8.5697 36.0 18.1 112 40 8.7486
Qtr.II 8.5768 31.2 9.1 243 25 8.7926
Qtr.lll 8.5845 45.75 15.85 102 52 8.6537
Qtr.IV 8.5927 47.5 8.7 131 24 8.6416
2003/04 8.6197 228.0 96.0 978 343 8.6751
Qtr. I 8.6057 65.05 25.10 180 68 8.6452
Qtr. II 8.6166 96.51 38.51 254 124 8.6617
Qtr. III 8.6244 39.48 19.20 268 75 8.6691
Qtr. IV 8.6322 27.00 13.15 276 76 8.7242
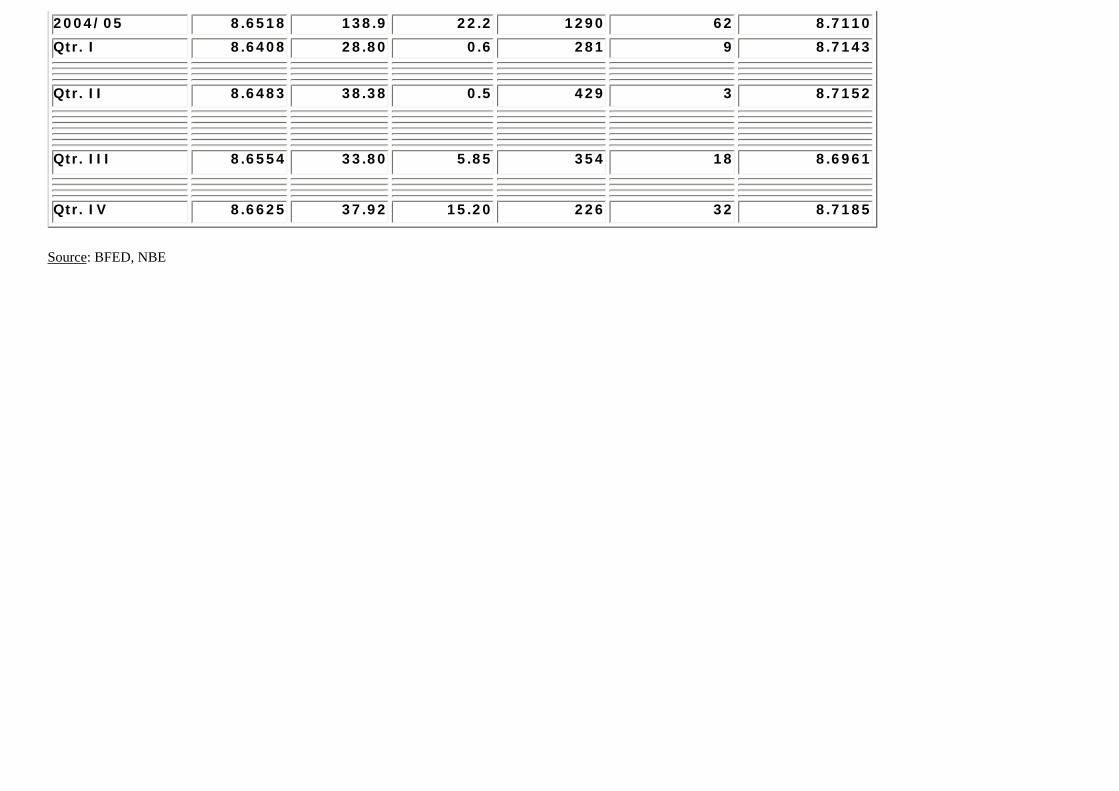
2004/05 8.6518 138.9 22.2 1290 62 8.7110
Qtr. I 8.6408 28.80 0.6 281 9 8.7143
Qtr. II 8.6483 38.38 0.5 429 3 8.7152
Qtr. III 8.6554 33.80 5.85 354 18 8.6961
Qtr. IV 8.6625 37.92 15.20 226 32 8.7185
Source: BFED, NBE
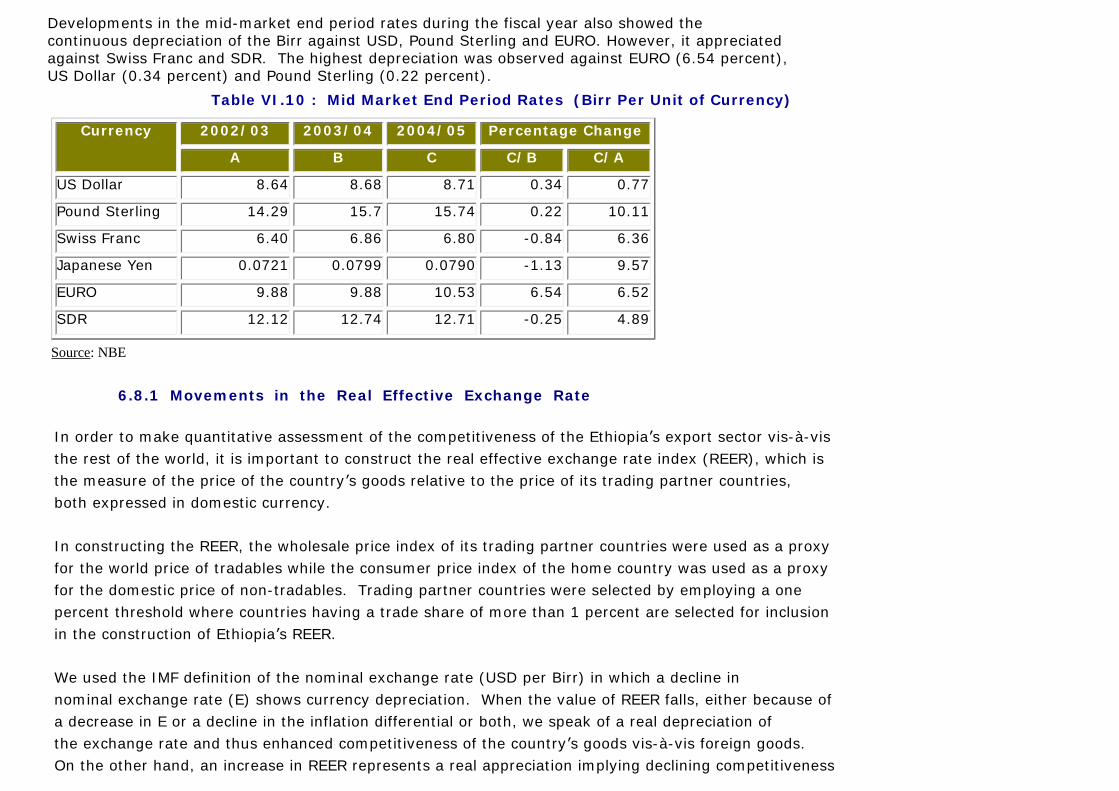
Developments in the mid-market end period rates during the fiscal year also showed the continuous depreciation of the Birr against USD, Pound Sterling and EURO. However, it appreciated against Swiss Franc and SDR. The highest depreciation was observed against EURO (6.54 percent), US Dollar (0.34 percent) and Pound Sterling (0.22 percent).
Table VI.10 : Mid Market End Period Rates (Birr Per Unit of Currency)
Currency 2002/03 2003/04 2004/05 Percentage Change
A B C C/B C/A
US Dollar 8.64 8.68 8.71 0.34 0.77
Pound Sterling 14.29 15.7 15.74 0.22 10.11
Swiss Franc 6.40 6.86 6.80 -0.84 6.36
Japanese Yen 0.0721 0.0799 0.0790 -1.13 9.57
EURO 9.88 9.88 10.53 6.54 6.52
SDR 12.12 12.74 12.71 -0.25 4.89
Source: NBE
6.8.1 Movements in the Real Effective Exchange Rate
In order to make quantitative assessment of the competitiveness of the Ethiopia’s export sector vis-à-vis the rest of the world, it is important to construct the real effective exchange rate index (REER), which is the measure of the price of the country’s goods relative to the price of its trading partner countries, both expressed in domestic currency.
In constructing the REER, the wholesale price index of its trading partner countries were used as a proxy for the world price of tradables while the consumer price index of the home country was used as a proxy for the domestic price of non-tradables. Trading partner countries were selected by employing a one percent threshold where countries having a trade share of more than 1 percent are selected for inclusion in the construction of Ethiopia’s REER.
We used the IMF definition of the nominal exchange rate (USD per Birr) in which a decline in nominal exchange rate (E) shows currency depreciation. When the value of REER falls, either because of a decrease in E or a decline in the inflation differential or both, we speak of a real depreciation of the exchange rate and thus enhanced competitiveness of the country’s goods vis-à-vis foreign goods. On the other hand, an increase in REER represents a real appreciation implying declining competitiveness

of the home economy.
The index constructed based on the above methodology revealed that during the review year, the real effective exchange rate (REER) depreciated by 4.85 percent and 3.29 percent against 2003/04 and 2002/03 respectively. The depreciation of the REER during the review year could be explained by the gain in competitiveness stemming from Nominal Effective Exchange Rate (NEER) depreciation, which more than offset the relative rise of domestic inflation. This resulted in the improvement of the external competitiveness of the country which can be witnessed by the significant increase in total exports. During the year under review, total exports amounted to USD 817.9 million, up by 36.2 percent, compared to USD 600.45 million in the previous year.
Table VI. 11 : Trends in the Real and Nominal Effective Exchange Rates
REERI NEERI
1999/00 93.6 95.5
2000/01 87.9 98.72001/02 85.3 103.1
2002/03 97.4 96.52003/04 99.0 92.02004/05 94.2 85.2
Source: National Bank of Ethiopia, staff compilationNote: An increase in REERI and NEERI indicates appreciation and vice-versa.
Where: REERI = Real effective exchange rate indexNEERI = Nominal effective exchange rate index

6.8.3 Foreign Exchange Transactions
Notwithstanding the increase in the number of trades, total value of transaction in the inter-bank foreign exchange market during the review year actually decreased to USD 138.9 million from USD 228 million in the previous year. This was the result of the slow down in foreign exchange transaction both among commercial banks and between the banks and the National Bank of Ethiopia as commercial banks largely depended on their own sources of funds to finance economic transactions (See Table VI.9).
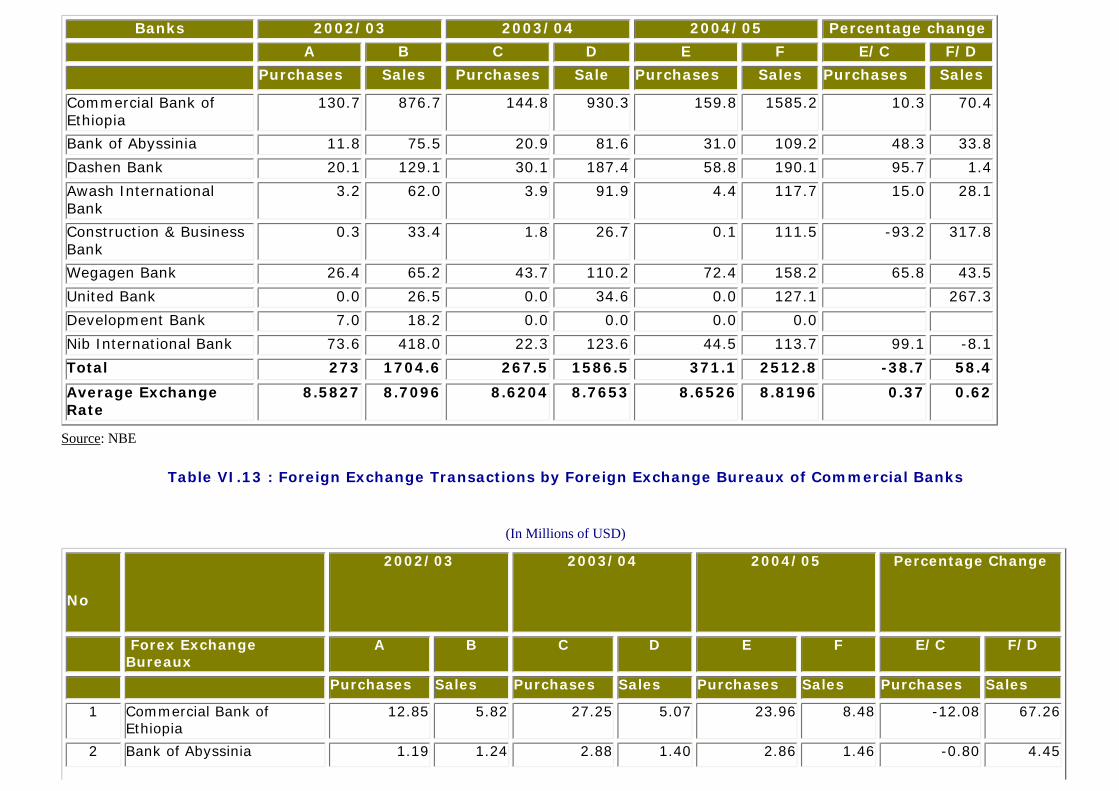
In another development, commercial banks’ purchase of foreign exchange from exporters rose by 38.7 percent to reach USD 371 million in the review year from USD 267.5 million in the previous year. Likewise, their foreign exchange sales to importers increased to USD 2512.8 million in the review year from USD 1586.5 million in the previous year (Table VI.12). About 63 percent of sales and 43 percent of the purchases of foreign exchange was made by the largest bank, the Commercial Bank of Ethiopia.
Similarly, foreign exchange bureaux purchases of foreign exchange picked up by 8.3 percent and stood at USD 76.6 million presumably due to the low level of the premium (below 1 percent) between the official and parallel rates which encouraged the public to use the banking system rather than the parallel market. Their sales also increased by 22.8 percent to reach USD 15.9 million from USD 13 million in the preceding year.
Similarly, 31.3 percent of the purchases and 53.3 percent of the sales of foreign exchange was conducted by the forex bureaus of the Commercial Bank of Ethiopia.
Table VI.12 : Foreign Exchange Transactions by Commercial Banks
(In Millions of USD)
Banks 2002/03 2003/04 2004/05 Percentage change A B C D E F E/C F/D Purchases Sales Purchases Sale Purchases Sales Purchases Sales
Commercial Bank of Ethiopia
130.7 876.7 144.8 930.3 159.8 1585.2 10.3 70.4
Bank of Abyssinia 11.8 75.5 20.9 81.6 31.0 109.2 48.3 33.8Dashen Bank 20.1 129.1 30.1 187.4 58.8 190.1 95.7 1.4Awash International Bank
3.2 62.0 3.9 91.9 4.4 117.7 15.0 28.1
Construction & Business Bank
0.3 33.4 1.8 26.7 0.1 111.5 -93.2 317.8
Wegagen Bank 26.4 65.2 43.7 110.2 72.4 158.2 65.8 43.5United Bank 0.0 26.5 0.0 34.6 0.0 127.1 267.3Development Bank 7.0 18.2 0.0 0.0 0.0 0.0 Nib International Bank 73.6 418.0 22.3 123.6 44.5 113.7 99.1 -8.1Total 273 1704.6 267.5 1586.5 371.1 2512.8 -38.7 58.4
Average Exchange Rate
8.5827 8.7096 8.6204 8.7653 8.6526 8.8196 0.37 0.62
Source: NBE
Table VI.13 : Foreign Exchange Transactions by Foreign Exchange Bureaux of Commercial Banks
(In Millions of USD)
No
2002/03 2003/04 2004/05 Percentage Change
Forex Exchange Bureaux
A B C D E F E/C F/D
Purchases Sales Purchases Sales Purchases Sales Purchases Sales
1 Commercial Bank of Ethiopia
12.85 5.82 27.25 5.07 23.96 8.48 -12.08 67.26
2 Bank of Abyssinia 1.19 1.24 2.88 1.40 2.86 1.46 -0.80 4.45

3 Dashen Bank 5.60 1.86 8.97 2.28 13.10 1.90 46.07 -16.68
4 Awash International Bank 3.15 0.70 4.84 0.88 1.45 0.78 -69.99 -11.64
5 Construction & Business Bank
0.58 0.34 1.19 0.19 1.27 0.18 6.55 -6.85
6 Wegagen Bank 1.95 0.75 2.94 1.36 3.22 1.52 9.58 11.89
7 United Bank 3.45 0.54 8.77 0.89 10.01 0.91 14.11 1.78
8 Development Bank 1.80 0.12 0.00 0.00 0.00 0.00
9 Nib International Bank 15.02 3.74 13.90 0.89 20.74 0.69 49.20 -22.44
10 Total 45.59 15.09 70.7 13.0 76.61 15.91 8.29 22.78
11 Average Exchange Rate 8.5807 8.7512 8.6229 8.7902 8.6540 8.8228 0.36 0.37
Source: NBE