Embed Size (px)
Citation preview

Global Access to Nutrition Index 2021Methodology
Development, structure, scope, contents, scoring and results presentation
June 2020
Unde
r em
barg
o

1Global Access to Nutrition Index 2021
Table of contents
Abbreviations 3
Introduction 4
The Access to Nutrition Initiative 4This document 4
ATNI’s conceptual framework 6
How it started: the first Global Index 6Purpose and Theory of Change behind ATNI’s Indexes 6Purpose 6ATNI’s Theory of Change 6
Stakeholder consultation and expert input 10Key elements of the Global Index 11The Corporate Profile 11The Product Profile 11The Breast-milk Substitutes/Complementary Foods Marketing assessment 12
Scope 13Outside the scope of the Global Index 13
Global Index 2021: 14 specific aim, development and new features
Specific aim of the Global Index 14Development of the Global Index 2021 14Key changes from previous indexes 15
Research process 20
Company selection 20Criteria for company selection 20Global Index 2021: companies selected 20
Research procedures 22Corporate Profile procedure 22Product Profile procedure 22Breast-milk Substitutes/Complementary Foods procedure 23
Unde
r em
barg
o

2Global Access to Nutrition Index 2021
GI 2021 approach to scoring and ranking 24The Corporate Profile score 24The Product Profile score 25The Breast-milk Substitutes/Complementary Foods Marketing score 27
Final score and ranking 28
Quality assurance processes 28Limitations 29
Future development of the Global Index 31
Appendices 31
Appendix I: Global Index Corporate Profile methodology 2021 31Section 1 - Nutrition governance and management 32Section 2 - Formulating and delivering appropriate, affordable, 41
accessible productsSection 3 - Influencing consumer choice and behavior 57
Appendix II: ATNI Expert Group members 85
Unde
r em
barg
o
3Global Access to Nutrition Index 2021
Abbreviations
ATNI Access to Nutrition InitiativeBMS Breast-Milk SubstitutesCF Complementary FoodsCSO Civil Society OrganizationF&B Food and Beverage FLW Food loss and WasteFY Financial YearGAIN Global Alliance for Improved NutritionHSR Healthy Star RatingICC International Chamber of CommerceNCD Non-Communicable DiseasesNDA Non-Disclosure AgreementNGO Non-Governmental OrganizationNPS Nutrition Profiling SystemOECD Organisation for Economic Co-operation and DevelopmentPP Product ProfileSDG Sustainable Development GoalSASB Sustainability Accounting Standards BoardSEC Securities and Exchange CommissionSEM Social Ecological ModelTGI The George Institute for Global HealthUN United NationsUNICEF United Nations International Children’s Emergency FundWHA World Health AssemblyWHO World Health OrganizationWHO ARCO World Health Organization Regional Office for the Africa RegionWHO EMRO World Health Organization Regional Office for the Eastern Mediterranean RegionWHO EURO World Health Organization Regional Office for the European RegionWHO PAHO World Health Organization Regional Office for the Pan-American Region WHO SEAR World Health Organization Regional Office for the South-East Asian RegionWHO WPR World Health Organization Regional Office for the Western-Pacific Region
Unde
r em
barg
o
4Global Access to Nutrition Index 2021
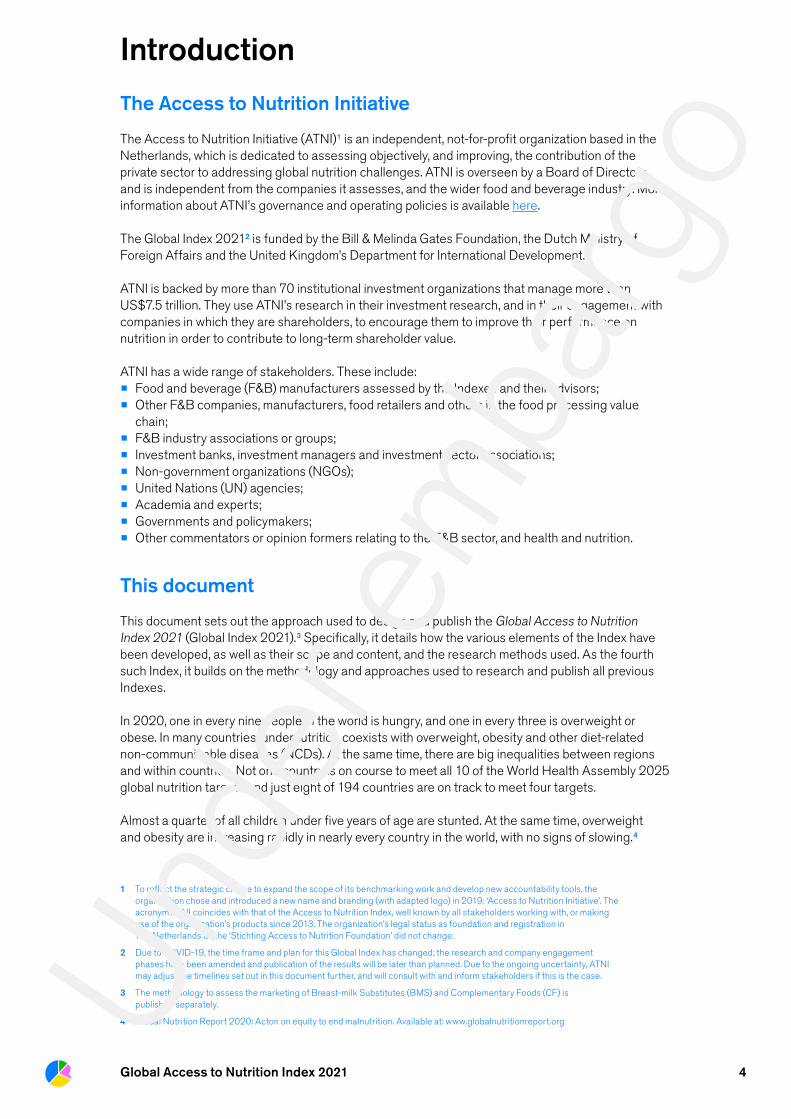
Introduction
The Access to Nutrition Initiative
The Access to Nutrition Initiative (ATNI)1 is an independent, not-for-profit organization based in the Netherlands, which is dedicated to assessing objectively, and improving, the contribution of the private sector to addressing global nutrition challenges. ATNI is overseen by a Board of Directors and is independent from the companies it assesses, and the wider food and beverage industry. More information about ATNI’s governance and operating policies is available here.
The Global Index 20212 is funded by the Bill & Melinda Gates Foundation, the Dutch Ministry of Foreign Affairs and the United Kingdom’s Department for International Development.
ATNI is backed by more than 70 institutional investment organizations that manage more than US$7.5 trillion. They use ATNI’s research in their investment research, and in their engagement with companies in which they are shareholders, to encourage them to improve their performance on nutrition in order to contribute to long-term shareholder value.
ATNI has a wide range of stakeholders. These include:
• Food and beverage (F&B) manufacturers assessed by the Indexes and their advisors;
• Other F&B companies, manufacturers, food retailers and others in the food processing value chain;
• F&B industry associations or groups;
• Investment banks, investment managers and investment sector associations;
• Non-government organizations (NGOs);
• United Nations (UN) agencies;
• Academia and experts;
• Governments and policymakers;
• Other commentators or opinion formers relating to the F&B sector, and health and nutrition.
This document
This document sets out the approach used to design and publish the Global Access to Nutrition Index 2021 (Global Index 2021).3 Specifically, it details how the various elements of the Index have been developed, as well as their scope and content, and the research methods used. As the fourth such Index, it builds on the methodology and approaches used to research and publish all previous Indexes.
In 2020, one in every nine people in the world is hungry, and one in every three is overweight orobese. In many countries, undernutrition coexists with overweight, obesity and other diet-related non-communicable diseases (NCDs). At the same time, there are big inequalities between regions and within countries. Not one country is on course to meet all 10 of the World Health Assembly 2025 global nutrition targets and just eight of 194 countries are on track to meet four targets.
Almost a quarter of all children under five years of age are stunted. At the same time, overweight and obesity are increasing rapidly in nearly every country in the world, with no signs of slowing.4
1 To reflect the strategic choice to expand the scope of its benchmarking work and develop new accountability tools, the organization chose and introduced a new name and branding (with adapted logo) in 2019: ‘Access to Nutrition Initiative’. The acronym ATNI coincides with that of the Access to Nutrition Index, well known by all stakeholders working with, or making use of the organization’s products since 2013. The organization’s legal status as foundation and registration in The Netherlands as the ‘Stichting Access to Nutrition Foundation’ did not change.
2 Due to COVID-19, the time frame and plan for this Global Index has changed; the research and company engagement phases have been amended and publication of the results will be later than planned. Due to the ongoing uncertainty, ATNI may adjust the timelines set out in this document further, and will consult with and inform stakeholders if this is the case.
3 The methodology to assess the marketing of Breast-milk Substitutes (BMS) and Complementary Foods (CF) is published separately.
4 Global Nutrition Report 2020: Acton on equity to end malnutrition. Available at: www.globalnutritionreport.orgUnde
r em
barg
o

5Executive summary
As of 2016, over 2 billion people worldwide were overweight or obese, with a large majority of them (70%) living in low- and middle-income countries.5 Meanwhile, demand for processed foods in these contexts has been increasing and is projected to keep rising in lower-middle and upper-middle income countries in particular.6 The United Nations Children’s Fund’s (UNICEF) flagship report in 2019 revealed that at least one in three children globally are not getting the nutrition they need to grow well.7 Given their scale and reach, and continued growth, global F&B companies have a huge influence on the lives of consumers and employees. They must play their part in helping to address the global nutrition crisis and achieving the 2030 targets of the Sustainable Development Goals.
Although findings from the Global Access to Nutrition Index 2018 indicated that the world’s largest F&B companies had advanced their commitments to tackle various nutrition issues, less than a third of the products analyzed in the 2018 Global Product Profile were classified as ‘healthy’. Further, the Global Index 2018 showed that the world’s six largest baby food companies continue to market Breast-milk Substitutes (BMS) using marketing practices that do not meet the recommendations of the WHO International Code of Marketing of Breast-milk Substitutes and subsequent relevant World Health Assembly (WHA) resolutions (together known as ‘The Code’).
Like previous ATNI Indexes, work on the Global Index 2021 Methodology is guided by the Theory of Change (Figure 2, page 8), stakeholder engagement (from public and private sector), and input from ATNI’s Expert Group and Board of Directors. Of note in the Global Index 2021, and a change from 2018, is the integration of the Product Profile into the Corporate Profile so that it contributes to the overall Global Index score and ranking. Like the 2018 Global Index, the Corporate Profile methodology assesses companies against international guidelines, standards and norms, and accepted good practices. When such guidance is not available, the assessment is based on the input of ATNI’s Expert Group.
The following sections describe the approach that ATNI uses to develop its Indexes and the Theory of Change. It outlines the main topics addressed by each Index and provides an explanation of the different elements of the Indexes, i.e.: the Corporate Profile, the Product Profile and the BMS and Complementary Foods (CF) Marketing assessment. This Global Index 2021 Methodology document describes how companies are selected for inclusion, the approach used to collect data, and how companies are scored and ranked. The document concludes with commentary about ATNI’s plans for future Global Indexes. A full description of the indicators used for the Global Index 2021 is included in Appendix I, and Appendix II describes ATNI’s Expert Group.
5 Shekar, Meera, and Barry Popkin, eds. 2020. Obesity: Health and Economic Consequences of an Impending Global Challenge. Human Development Perspectives series. Washington, DC: World Bank. doi:10.1596/978-1-4648-1491-4.
6 Global Nutrition Report 2020: Acton on equity to end malnutrition. Spotlight 4.3, pages 86-87. Available at: www.globalnutritionreport.org
7 UNICEF (2019). The State of the World’s Children 2019. Children, Food and Nutrition: Growing well in a changing world. UNICEF, New York.Un
der e
mba
rgo

6Executive summary
ATNI’s conceptual framework
How it started: the first Global Index
ATNI’s Global Index was initially developed between 2009 and 2013 by the Global Alliance for Improved Nutrition (GAIN), who built on the work of many other organizations, particularly other benchmarks and indexes, on other sustainability issues. It was designed through an extensive, multi-stakeholder consultative process. This approach was taken to ensure that the Index would be a useful tool for different stakeholder groups (including the World Health Organization (WHO) and other UN agencies, academia, civil society organizations (CSOs), industry and investors), and that it would reflect the latest thinking and practices related to the private sector’s role in nutrition. It also conceived the concept of an Index for ‘spotlight countries’ to reflect on how the local legal / regulatory and business context could help each country address its specific nutrition challenges. ATNI was established as an independent, not-for-profit organization in 2013 to design and publish Global and Spotlight Indexes and develop other private sector accountability mechanisms.
More information about ATNI’s Indexes, including methodology documents from previous Global Indexes and country Spotlight Indexes, is available on the ATNI website.
Purpose and Theory of Change behind ATNI’s Indexes
PurposeThe Indexes that ATNI publishes are modelled primarily on the types of benchmarks developed for or by the investment and finance community. ATNI’s purpose is to develop and deliver tools that:
• Track the contribution of the F&B industry to address the interrelated global nutrition challenges of undernutrition, micro-nutrient deficiencies, overweight and obesity and all diet-related diseases; and
• Can be used by stakeholders to hold companies to account for delivering their commitments to tackle these challenges.
The Global Index — ATNI’s flagship report — is a unique private sector accountability tool that tracks, scores and ranks the world’s largest F&B manufacturers. By comparing scores from one Index to the next, the companies themselves, their investors and other stakeholders, can see whether and how their performance has improved over time. The ultimate aim is to encourage these companies to do as much as they can to improve the diets of adults and children around the world.
ATNI’s Indexes and related activities are guided and informed by the design principles (see Figure 1) that stem from desk research, ATNI’s Theory of Change (see Figure 3, page 9), extensive stakeholder consultations and input from advisors and experts.
Unde
r em
barg
o

7Global Access to Nutrition Index 2021
Figure 1
Key design principles that guide ATNI Indexes
1. Base the assessment methodologies on prevailing international and national standards, norms and established best practices where possible ATNI Indexes aim to reflect the existing consensus on best practice, not to define such practices. Prevailing international and national standards, norms and established best practices form the starting point of the methodology. The Index does not assess compliance with regulations or law, which is the role of governments, but rather assesses the degree to which companies voluntarily align their policies, practices and products to international standards, norms and best practices.
2. Recognize current state of knowledge and continually evolveTo maintain alignment with evolving knowledge and practices about diets, nutrition and health, Index methodologies are revised at regular intervals while striving to retain comparability over time.
3. Ensure relevance and applicability to a range of company typesThe ATNI methodologies are designed to evaluate the degree to which core business activities such as product formulation, marketing, distribution and product labeling embed nutrition considerations. This type of assessment is relevant to a variety of company ownership types (i.e. publicly listed and privately owned), as well as companies with different product portfolios (primarily food, primarily beverages, or a mix of both).
4. Identify, reward and spread good practice Access to Nutrition Indexes aim to generate ‘healthy competition’ among the ranked companies to encourage them to do better in each future Index iteration, thereby demonstrating their increasing contribution to addressing global nutrition challenges. They are not intended to be ‘name and shame’ exercises. The Corporate Profile therefore awards credit for good practice beyond minimum legal standards. The Product Profile aims to highlight which companies have the healthiest portfolios and the healthiest products within categories, to stimulate them to improve their products and increase their contribution to public health.
5. Encourage transparency as well as good practiceThe ATNI Indexes award credit to companies not only for their policies and practices, but also for the level and quality of their public reporting. High levels of transparency allow other stakeholders to better understand the extent to which companies are addressing nutrition issues, and to engage with them about their approach and effectiveness.
6. Utilize an inclusive approach, incorporating multi-stakeholder inputAs noted, input from relevant stakeholder groups – including policymakers, experts, non-governmental organizations and industry – was sought throughout the original methodology development process and subsequent revisions. This approach is taken to develop each iteration of the Global Index methodology, and Spotlight Index methodologies.
Unde
r em
barg
o

8Global Access to Nutrition Index 2021
ATNI’s Theory of ChangeATNI aims to contribute to the global effort to achieve the UN 2030 Sustainable Development Goals (SDGs) and the 2025 WHA Global Nutrition Targets. As indicated within the context of the UN Decade of Action on Nutrition and shown in Figure 2, good nutrition plays a central role in many of the SDGs.8
Figure 2
Nutrition and the SDGs
NUTRITI N AND THE SDGs CENTRAL TO THE 2030 AGENDA
Good nutrition results in higher labour productivity, greater mental capacity and longer, healthier lives.
Without a sufficiently nutritious diet, learning ability and focus are greatly impaired.
Improving the nutrition of girls, women and children improves schooling, reducing gender inequalities.
Ensuring good nutrition requires access to safe water and sanitation.
Good nutrition for all increases demand for healthy food, requiring clean, renewable energy sources.
Malnutrition in all its forms lowers economic productivity and unnecessarily increases healthcare costs. Enhanced nutrition through
the lifespan supports learning and later
innovation potential.
Reducing current nutrition inequalities will
lessen income inequalities.
Sustainable cities require integrated urban and
rural food systems.
Responsible food consumption and
production reduces food waste and loss.
Sustainable food systems reduce greenhouse gas
emissions.
Better nutrition reduces population
pressure on the world’s oceans.
Soil degradation and reduced biodiversity
threaten our ability to grow food.
War and conflict are major underlying
factors of nutrition insecurity.
Global prioritization of nutrition has never been
higher and requires cooperation of all actors.
ZERO HUNGER
GOOD HEALTH
Source: WHO Department of Nutrition for Health and Development, 2018
8 United Nations Decade of Action on Nutrition. More information available at: https://www.who.int/nutrition/decade-of-action/en/Unde
r em
barg
o

9Global Access to Nutrition Index 2021
ATNI’s Theory of Change (shown in Figure 3) illustrates how ATNI contributes to the SDG agenda through its activities with a predominant focus on two of the goals:
• Goal 2: ‘End hunger, achieve food security and improved nutrition and promote sustainable agriculture’. ATNI develops its tools to monitor and drive F&B manufacturers’ contributions to ending hunger and ensuring access by all people to safe, nutritious and sufficient food all year round (target 2.1); and ending all forms of malnutrition (target 2.2) by 2030; and
• Goal 3: ‘Ensure healthy lives and promote well-being for all at all ages’ also guides ATNI’s work, aiming to improve access to more nutritious foods and healthier lifestyles for all, with particular attention to the needs of newborns and children, as well as priority populations (a concept that is further described on page 16, below).
Figure 3
ATNI’s Theory of Change
Stakeholders use ATNI’s outputs
to create a more conductive
policy and food consumption environment
Stakeholders use ATNI’s outputs to
improve companies’ nutrition
performance
Indirect influenceDir
ect i
nflu
ence
Based on extensive research and consulation , and its unique capabilities, ATNI develops and publishes analysis and reports, and provides data to others,
to track F&B companies’ delivery of action on nutrition, globally and at the country level, often through partnerships
Healthy & sustainable diets for all
International community sets 2030 SDGs & global nutritions goals to achieve good diets an nutrition for all consumers worldwide
ATNI engages with companies
Companies use ATNI’s analysis + tools to improve their nutrition performance
ATNI supports data collection and disseminates results widely, encourages
other stakeholders in using its tools – other benchmarking organisations, investors, academia, policymakes,
UN agendas, CSOs etc
Improved Nutrition governace and management
Better product reformulation and fortification
Equitable pricing of healthy products
More responsible marketing
Better employee health + wellness, more support for breastfeeding mothers at work
Better labeling, more responsible use of claims
More rsponsible government and policymakers influence, better stakeholders engagement
Unde
r em
barg
o
10Global Access to Nutrition Index 2021
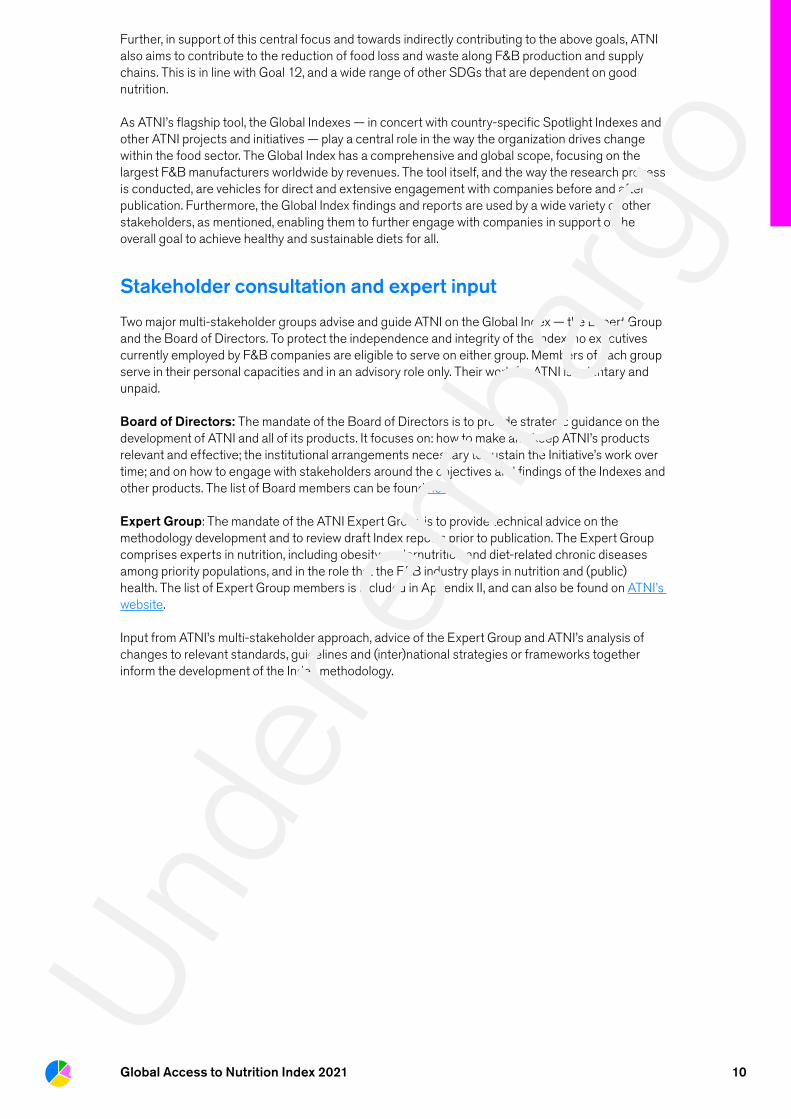
Further, in support of this central focus and towards indirectly contributing to the above goals, ATNI also aims to contribute to the reduction of food loss and waste along F&B production and supply chains. This is in line with Goal 12, and a wide range of other SDGs that are dependent on good nutrition.
As ATNI’s flagship tool, the Global Indexes — in concert with country-specific Spotlight Indexes and other ATNI projects and initiatives — play a central role in the way the organization drives change within the food sector. The Global Index has a comprehensive and global scope, focusing on the largest F&B manufacturers worldwide by revenues. The tool itself, and the way the research process is conducted, are vehicles for direct and extensive engagement with companies before and after publication. Furthermore, the Global Index findings and reports are used by a wide variety of other stakeholders, as mentioned, enabling them to further engage with companies in support of the overall goal to achieve healthy and sustainable diets for all.
Stakeholder consultation and expert input
Two major multi-stakeholder groups advise and guide ATNI on the Global Index — the Expert Group and the Board of Directors. To protect the independence and integrity of the Index, no executives currently employed by F&B companies are eligible to serve on either group. Members of each group serve in their personal capacities and in an advisory role only. Their work for ATNI is voluntary and unpaid.
Board of Directors: The mandate of the Board of Directors is to provide strategic guidance on the development of ATNI and all of its products. It focuses on: how to make and keep ATNI’s products relevant and effective; the institutional arrangements necessary to sustain the Initiative’s work over time; and on how to engage with stakeholders around the objectives and findings of the Indexes and other products. The list of Board members can be found here.
Expert Group: The mandate of the ATNI Expert Group is to provide technical advice on the methodology development and to review draft Index reports prior to publication. The Expert Group comprises experts in nutrition, including obesity, undernutrition and diet-related chronic diseases among priority populations, and in the role that the F&B industry plays in nutrition and (public) health. The list of Expert Group members is included in Appendix II, and can also be found on ATNI’s website.
Input from ATNI’s multi-stakeholder approach, advice of the Expert Group and ATNI’s analysis of changes to relevant standards, guidelines and (inter)national strategies or frameworks together inform the development of the Index methodology.
Unde
r em
barg
o

11Global Access to Nutrition Index 2021
Key elements of the Global Index
The Corporate ProfileCompanies’ policies, practices and disclosure related to promoting good nutrition for all, i.e. preventing and tackling undernutrition, micronutrient deficiencies, overweight and obesity, and diet-related diseases, are assessed using the Corporate Profile methodology. The Corporate Profile scores and ranking form one of three of the main outputs of the ATNI Indexes. They reflect the efforts that companies have made to: incorporate nutrition into their overall corporate strategy and their governance and management systems; improve the nutritional quality of their product portfolios and develop new healthy products; improve their pricing and distribution of healthy products; support consumers to eat a healthy diet and live healthy lives; label their products effectively to help consumers choose healthy options; market their products responsibly, and; engage with policymakers and their stakeholders.
The Corporate Profile was the first Index element developed by ATNI. In 2018, the Product Profile was added to the Global Index for the first time, and has now been integrated into the Corporate Profile methodology. The basic structure of the 2021 methodology has not been modified from the 2013, 2016 and 2018 Global Indexes, and is organized into Sections, Categories, Criteria and Indicators:
• Sections: There are three sections, which reflect distinct types of corporate activity: i) Nutrition governance and management ii) Formulating and delivering appropriate, affordable, accessible products; iii) Influencing consumer choice and behavior. Each section includes one or more categories.
• Categories: ATNI’s thematic areas that capture companies’ nutrition-related practices and efforts are assessed in the seven categories (A-G). Within each category are sub-categories called criteria. All categories and criteria are listed in Table 1 (page 15).
• Criteria: The criteria are more detailed and are nested within the categories. Within the criteria are indicators of corporate activity.
• Indicators: There are three types of indicators or ‘units’ of information on which companies are scored; commitments, performance and disclosure. Weighting of the indicator scores is applied at various levels. The performance indicators, for example, have double the weight of the commitment and disclosure indicators.
Many details have changed since previous Global Indexes. An overview of the sections, categories and criteria is provided in Table 1 (page 15) and the complete Corporate Profile methodology including all indicators is presented in Appendix I.
The Product ProfileThe Product Profile is an independent assessment of the nutritional quality of companies’ product portfolios in several markets undertaken by analyzing the levels of fat, salt, sugar, fruit, vegetables, and other components within individual products. The results are assessed in three ways: i) an analysis of the healthiness of the companies’ overall product portfolios; ii) an analysis of companies’ performance compared to peer companies within the same product categories, and; iii) an analysis of how the healthiness of the product portfolio has changed since the previous Index. The Product Profile in the Global Index 2018 generated baseline data that enables the measurement of improvements over time. This trend analysis has been introduced in the scoring of the Product Profile for those companies that have been assessed in 2018 and in 2020, comparing the outcomes for those countries/markets that are covered at both time points.
The proportion of healthy products as well as estimated category- and portfolio-level sales derived from healthy products for each company are also being monitored through the Product Profile. While the 2018 Product Profile was presented as a separate score and ranking, it has been integrated into the Corporate Profile scores and ranking for the Global Index 2021.
Unde
r em
barg
o

12Global Access to Nutrition Index 2021
To determine products’ nutritional quality, ATNI uses Nutrient Profiling Systems (NPS)9 that meet qualitative criteria as defined by ATNI’s Expert Group. According to these criteria, an NPS should:10
• Be developed with appropriate stakeholder consultation;
• Cover the majority of categories of processed F&B products;
• Take into account both positive and negative nutrients;
• Not have been designed solely to address school foods but to assess foods in the general market;
• Be well-validated with results published in the peer-reviewed literature demonstrating that the models produce internally consistent classifications of ‘healthy’ and ‘unhealthy’ foods, consistent with general nutrition principles;
• Enable differentiation of nutritional quality within and between categories;
• Be available in the public domain, including the algorithm, so as to be able to access and apply it;
• Be able to generate meaningful results across all countries.
ATNI uses two NPS that meet these criteria:
• The Health Star Rating (HSR) NPS was initially developed for use in Australia and New Zealand, but is applicable to any market to determine how healthy each product is. Products are rated between 0.5 stars (least healthy) to 5 stars (most healthy). Based on Australian research, any product that scores 3.5 or above is considered by ATNI to be healthy.11 The results from the HSR analysis are used to generate each company’s Product Profile score.
• The WHO Regional Nutrient Profile Models that identify which products are suitable to be marketed to children. Regional nutrient profile models currently exist for the WHO EURO, WHO SEAR, WHO EMRO, WHO WPR, WHO ARCO and WHO PAHO regional offices.12 Analysis is presented of companies’ products’ suitability to market to children, according to these models, but the results are not included in the Product Profile score.
The Product Profile methodology was initially developed in partnership with Mike Rayner, a Professor at the University of Oxford (and member of ATNI’s Expert Group), and more recently with the Food Policy Division of The George Institute (TGI) for Global Health. A detailed description of the methodology, as applied to the Global Index 2018, can be accessed here.
The Product Profile methodology for the Global Index 2021 will be applied according to the same principles as the Global Index 2018, but with two main changes. Three scored elements are taken into account instead of one, which are explained in the section ‘Product Profile score’ (page 25) below. Secondly, the WHO Regional Nutrient Profile Models are used to assess which products are suitable to be marketed to children in the selected markets. For the Global Index 2018, the WHO EURO model was applied for this unscored element of the Product Profile.
BMS / CF Marketing assessmentATNI Indexes include an assessment of the marketing practices of major baby food companies, presented in the BMS / CF Marketing sub-ranking. This element of the methodology assesses whether the world’s largest BMS manufacturers’ marketing policies are in full compliance with the International Code of Marketing of BMS and subsequent relevant WHA resolutions, and whether they have management systems in place to ensure proper implementation of those policies across their businesses. It also assesses whether companies have clear objectives, policies and
9 Nutrient profiling is “The science of classifying or ranking foods according to their nutritional composition for reasons related to preventing disease and promoting health.” More information: http://www.who.int/nutrition/topics/profiling/en/
10 A catalogue developed for the World Health Organization in 2011 was reviewed and updated for the Product Profile in the Global Index 2018. The two selected models were selected from the 67 models included in the updated catalogue (prepared by Professor Mike Rayner of the University of Oxford: Nutrient profiling: catalogue of nutrient profile models). For the Global Index 2021, more recent information was considered, including a recent overview that included information from the WHO catalogue, but the selection of NPS remained unchanged. Reference: Labonté, M., Poon, T., Gladanac, B., Ahmed, M., Franco-Arellano, B., Rayner, M. and L’Abbé, M., 2018. Nutrient Profile Models with Applications in Government-Led Nutrition Policies Aimed at Health Promotion and Noncommunicable Disease Prevention: A Systematic Review. Advances in Nutrition, 9(6), pp.741-788.
11 The threshold of 3.5 or above (≥3.5 HSR) is based on work commissioned by the New South Wales Ministry of Health in Australia, which concluded that “healthy core foods with a HSR of ≥3.5 can be confidently promoted in public settings as healthier choices.” Reference: Dunford E, Cobcroft M, Thomas M, Wu JH. Technical Report: Alignment of the NSW Healthy Food Provision Policy with the Health Star Rating System. Sydney, NSW: NSW Ministry of Health; 2015. Available at http://www.health.nsw.gov.au/heal/Publications/health-star-rating-system.pdf
12 WHO ARCO: Regional Office for Africa ; WHO PAHO: Regional Office for the Americas; WHO SEAR: Regional Office for South-East Asia; WHO EURO: Regional Office for Europe ; WHO EMRO: Regional Office for the Eastern Mediterranean; WHO WPR: Regional Office for the Western PacificUn
der e
mba
rgo
13Global Access to Nutrition Index 2021
management systems to guide their lobbying activities related to BMS and whether they disclose their policies, information about their governance and management systems, auditors’ reports, position statements and other relevant documentation. The methodology used for such assessments is available here. The 2021 Global Index BMS / CF Marketing sub-ranking will include the world’s 10 largest BMS producers.
Scope
The food and nutrition value chain is complex and varied, including a range of actors from farmers and agricultural companies, to traders, manufacturers, retailers, café and restaurant chains, and food service companies. Although ATNI recognizes all levels and value chain actors are critical for delivering healthy and sustainable foods and diets, the Global Index focuses on the F&B manufacturers that produce packaged food and beverages.
ATNI’s thematic approach is centered on assessing F&B companies’ commitments, performance and disclosure practices related to all forms of malnutrition. The 2021 methodology has been adapted to specifically address the nutritional needs of priority populations (a concept that is further described on pages 16-18), which replaces the separate ‘Nutrition’ and ‘Undernutrition’ elements as applied in the 2018 and prior Global Indexes.
Outside the scope of the Global IndexCompanies’ practices, products and issues that are outside the scope of the Global Index 2021, and are therefore excluded from ATNI’s analysis, include:
Sports and medical nutrition productsThe Global Index is not designed to account for companies’ activities targeting people with special nutritional or dietary needs, such as athletes and people whose dietary requirements are supervised by healthcare professionals. However, sports and energy drinks that are sold through mainstream retail channels and which are commonly used as normal beverages are included in ATNI’s analysis.
Products that are a part of a formal weight management programIf companies rated by the Indexes sell products that are intended to be a part of (or are marketed / branded in association with) a formal weight management program, their activities related to these products are not included in the Global Index, as there is currently no international consensus on the appropriate nutritional standards for such products.
Practices related to legal complianceThe Global Index does not assess companies’ compliance with national and international regulations or law. It is the responsibility of individual companies to ensure compliance with all applicable laws and regulations, and the role of governments is to monitor their compliance with them.
Issues not related to nutrition and healthThe following social and environmental impacts of F&B companies fall largely outside of the scope of the Global Index:Food safety13
• Water management practices
• Environmental sustainability, including sourcing of ingredients14
• Contribution to climate change
• Fair treatment of workers and communities15
• Crop breeding (e.g. hybridization and genetic modification)
13 For the India Spotlight Indexes, due to the specific local relevance and importance, indicators related to food safety are included in ATNI’s methodology.
14 Other than in relation to food loss and waste.
15 Other than workforce (and supply chain) nutrition elements in Criteria E1, and a single indicator that addresses adherence to international codes of conduct related to responsible interaction with stakeholders in the food supply chain (Criteria G2, indicator 4).Un
der e
mba
rgo

14Global Access to Nutrition Index 2021
Global Index 2021: specific aim, development and new features
Specific aim of the Global Index
Aligned with the purpose of ATNI’s Indexes as described on page 6, the specific purpose of publishing the Global Index 2021 is to encourage companies to increase consumers’ access to nutritious products and responsibly exercise their influence on consumers’ choice and behavior. The Global Index 2021 builds on the previous Global Indexes from 2013, 2016 and 2018 to:
• Track the contribution of the largest F&B manufacturers to address overweight and obesity, diet-related diseases, food insecurity, undernutrition and micronutrient deficiencies at a global level;
• Enable investors and other stakeholders to hold companies accountable for fulfilling their commitments to help tackle these global nutrition challenges, and;
• Highlight new developments, and describe and share best practices of front-running companies on nutrition-related topics.
Development of the Global Index 2021
ATNI organizes multi-stakeholder consultations for companies, investors and CSOs, after each iteration of its Indexes. Consistent with this approach, ATNI has adapted the 2021 methodology based on stakeholder input received after the publication of the Global Index 2018 and finalized it with the advice from ATNI’s Expert Group. The planned research and engagement process, including the dissemination of results, is shown in Figure 5.
Figure 5
ATNI Index methodology development: engagement process with stakeholders
ATNI
Q4 Q1 Q2 Q3 Q4 Q1 Q2
Gl Methodology revision based on extensive consultation
Prepopulation of data on online assessment platform
2nd review of companies inputs
Data analysis
Write-up of findings
Company assessment & clarifications
2019 2020 2021
ATNI Expert Group
25 Global Index Companies
CSOs
ATNI investor signatories and other investors
2 consecutive peer reviews
Publication of methodology
Consultation on methodology
Consultation on findings and messaging
Consultation on revised methodology
Consultation on revised methodology
Consultation on revised methodology
Ongoing engagement
Ongoing engagement
Informed on engagemnet process, product profile process
Input data & clarifi cation
Scorecards & best practices fact & NDA check
Post launch engagement
Input data phase 1
Progressive dissemination of findings
Methodologyconsultation
Data Collection
Post launch engagement
Post launch engagementUn
der e
mba
rgo

15Global Access to Nutrition Index 2021
Key changes from previous indexes
As noted, while the structure of the methodology for the Global Index 2021 has not changed, several adjustments have been made compared to the previous iterations of the Global Index. These are explained further in the following paragraphs.
Integration of the Product Profile In 2018, the Corporate Profile and Product Profile were presented as separate outputs and with different scores and rankings. In the process of revising the methodology, ATNI has decided to integrate the Product Profile results into Category B of the Corporate Profile in order to present one overall Index ranking. For the Global Index 2021, the Product Profile will carry 20% of the overall Index weight, and is incorporated as one of the criteria in Category B. The overview of the categories and criteria in the Global Index 2021, and the weights, are shown below in Table 1. The weights of the categories are distributed evenly across the criteria, except for Category B.
Table 1
Global Index Corporate Profile methodology overview
Category (weight in total score) Description Criteria*
Section1: Nutrition governance and management
A Governance (12.5%) Corporate strategy, management and governance
A1 Corporate nutrition strategy
A2 Nutrition governance and management systems
A3 Quality of reporting
Section 2: Formulating and delivering appropriate, affordable, accessible products
B Products (35%) Formulating appropriate products B1 Product profile results (20%)
B2 Product formulation (7.5%)
B3 Defining healthy and appropriate products (7.5%)
C Accessibility (15%) Delivering affordable, accessible products C1 Product pricing
C2 Product distribution
Section 3: Influencing consumer choice and behavior
D Marketing (20%) Responsible marketing policies and auditing of compliance
D1 Marketing policy: general aspects of responsible marketing
D2 Marketing policy: specific arrangements regarding responsible marketing to children and teens
D3 Auditing and compliance with policy
E Lifestyles (2.5%) Supporting healthy diets and active lifestyles
E1 Supporting employee health & wellness
E2 Supporting breastfeeding mothers at work
E3 Supporting community-supporting healthy eating and active lifestyle programs
F Labeling (10%) Product labeling and use of health and nutrition claims
F1 Product labeling
F2 Health and nutrition claims
G Engagement (5%) Influencing governments and policymakers, and stakeholder engagement
G1 Lobbying and influencing governments and policymakers
G2 Stakeholder engagement and partnerships
*Note: The category weight is equally distributed over criteria except for category B where Product Profile results carry a higher weight.Unde
r em
barg
o

16Global Access to Nutrition Index 2021
Reduction of indicator numbersATNI has made an effort to reduce the number of indicators to be more efficient in assessing and engaging with companies. For example, the structure of Category D (responsible marketing) has been changed to reduce the number of criteria (from four in 2018 to three in 2021) and overall number of indicators within the category.
Table 2
Comparison of the number of indicators in the 2018 and 2021 Global Index Corporate Profile methodology
Global Index 2018 Global Index 2021
Total n. indicators
Total n. of scored indicators
Total n. of non-scored indicators
Total n. indicators
Total n. of scored indicators
Total n. of non-scored indicators
Category A 43 38 5 24 24 0
Category B 48+52* 40+52* 8 34 33 1
Category C 26 20 6 14 14 0
Category D 34 32 2 27 26 1
Category E 34 27 7 18 18 0
Category F 20 19 1 18 18 0
Category G 13 12 1 15 15 0
Total 270 240 30 150 148 2
*Note: a set of 13 product reformulation-related indicators were assessed separately for up to five product categories in 2018, depending on the company portfolio, resulting in up to 52 indicators. This approach is not applied in the 2021 Global Index to reduce the number of indicators and because product category-specific analysis is now part of the Product Profile analysis.
Integration of nutrition and undernutrition rankings and scoresIn contrast to assessing companies’ approaches to undernutrition through a separate section and with specific indicators in 2018, this Index methodology reverts to integrating and assessing companies´ commitments, policies and practices related to undernutrition and micronutrient deficiencies, as well as overweight / obesity and diet-related challenges in each category. The concept of priority populations has been developed to help bridge the challenges associated with the different forms of malnutrition throughout the methodology.
Simplified scoring systemThe scoring system of the Corporate Profile has been updated and simplified to make it easier to understand and improve the quality control processes related to the automated scoring system of ATNI’s online data gathering platform. The number of weighting steps have been reduced in two ways: firstly, due to the integration of nutrition and undernutrition indicators and, secondly, due to replacing the weighting of commitment (25%), performance (50%) and disclosure (25%) indicators by allocating a maximum of 10, 20 and 10 points to these types of indicators, respectively, to achieve the same goal. Furthermore, additional changes have been implemented related to the integration of the Product Profile. Details of the scoring system are explained in ‘The Corporate Profile score’ (page 24).
Priority populationsIn the Global Index 2018, company actions to prevent and address undernutrition among at-risk populations in low-income countries were assessed through a specific set of ‘Undernutrition’ indicators. These indicators were not applied to companies that derived less than 5% of their F&B revenues from non-OECD markets. In the Global Index 2021 methodology, the commitment of companies to specifically address the needs and key nutritional priorities of specific population groups at risk of malnutrition is assessed across low-, middle- and high-income countries. As a result, how comprehensively a company addresses all forms of malnutrition is based on the company’s market presence and the specific nutrition issues in those markets. Un
der e
mba
rgo
17Global Access to Nutrition Index 2021
Specifically, the Index assesses whether companies commit to addressing the needs of those groups experiencing or at higher risk of experiencing malnutrition than the general population, as defined by public authorities in the markets they are present in, and as relevant to their product portfolios and activities. All aspects of malnutrition are considered relevant if identified as a priority by public health authorities, and may encompass undernutrition, micronutrient deficiencies and overweight, obesity and diet-related diseases. Further, (risk of) malnutrition may be related to or overlap with aspects of food insecurity, defined as the uncertainties people face about their ability to obtain food and the need to reduce, at times during the year, the quality and / or quantity of food they consume due to lack of money or other resources.16
To refer to these groups, ATNI uses the overarching term ‘priority populations’. This term intends to capture the multiple layers of marginalization that may shape peoples’ lives, which, in turn, can result in them experiencing (or heightening their risk of experiencing) malnutrition at higher rates than the general population. Throughout ATNI’s methodology, the use of this term focuses on addressing nutrition priorities in a given environment. Several factors or determinants are potentially important in identifying and addressing priority populations in relation to nutrition priorities, which are addressed in the ATNI methodology as follows:
• Nutritional factors related to age or life stages (e.g. women of childbearing age, infants, young children, elderly) and undernourished groups, with a specific focus on (the risk of) micronutrient deficiencies that can be addressed by appropriate fortification or using micronutrient-rich products, ingredients or commodities (addressed in Category B). Whether the marketing of such products is adapted appropriately to the context of the target groups is assessed in Category D, in addition to a general focus on responsible marketing of products to children and youth (i.e. refraining from marketing products that do not meet relevant health guidelines to these groups);
• Income and other socioeconomic and cultural factors are addressed in Category C in relation to the affordability and accessibility of healthy products. In addition, behavioral factors are relevant in Category E to assess if consumer-oriented educational and lifestyle programs are well attuned to the target audiences, e.g. in relation to nutrition literacy;
• Physical access factors e.g. in relation to rural or urban areas in which people’s regular access to healthy foods may be limited: geographical factors are addressed in Category C — Criterion C2.
These factors, which vary by market and context, should be evident in the design and nature of companies’ approaches to addressing all forms of malnutrition.17 ATNI will assess how companies identify the needs of priority populations in the markets in which they operate based on national and / or international guidelines and policies. Further, ATNI aims to credit companies’ strategies that are universal but are resourced and delivered to respond to the specific nutritional needs of relevant population groups in a given market and context.
16 FAO, IFAD, UNICEF, WFP and WHO. 2019. The State of Food Security and Nutrition in the World 2019. Safeguarding against economic slowdowns and downturns. Rome, FAO, p. 5. The same report defines the inverse – food security – as “A situation that exists when all people, at all times, have physical, social and economic access to sufficient, safe and nutritious food that meets their dietary needs and food preferences for an active and healthy life.” (p. 186). Based on this definition, four food security dimensions can be identified: food availability, economic and physical access to food, food utilization, and stability over time.” Companies’ contributions to these elements of food security are addressed throughout the ATNI methodology.
17 Such factors have been widely recognized by the international community. First, by the World Health Organization Commission, in 2008 (“Closing the gap in a generation: health equity through action on the social determinants of health. Final report of the Commission on Social determinants of Health.” Available at: www.who.int/social_determinants/thecommission/finalreport/en/). This report has served as a basis for the development of the nutrition equity framework used in the 2020 Global Nutrition Report (Available at: https://globalnutritionreport.org/reports/2020-global-nutrition-report/). Further, in 2014, the FAO/WHO Second International Conference on Nutrition (ICN2) acknowledged that: “the root causes of and factors leading to malnutrition are complex and multidimensional:
a) poverty, underdevelopment and low socio-economic status are major contributors to malnutrition in both rural and urban areas;
b) the lack of access at all times to sufficient food, which is adequate both in quantity and quality which conforms with the beliefs, culture, traditions, dietary habits and preferences of individuals in accordance with national and international laws and obligations;
c) malnutrition is often aggravated by poor infant and young child feeding and care practices, poor sanitation and hygiene, lack of access to education, quality health systems and safe drinking water, foodborne infections and parasitic infestations, ingestion of harmful levels of contaminants due to unsafe food from production to consumption.” (FAO & WHO. 2015. Second International Conference on Nutrition (ICN2). Report of the Joint FAO/WHO Secretariat on the Conference. www.fao.org/3/a-i4436e.pdf)Un
der e
mba
rgo

18Global Access to Nutrition Index 2021
Figure 6
Priority populations conceptual framework and related indicator numbers
C1 1, 2.2, 3, 4, 5E3 3
A1 2.2, 7, 8, 9, 10A2 2.1A3 2
G2 6
C2 1, 2.2, 3, 4, 5
B2 9, 10D1 4, 5
Nutritional(Related to life stages)
• Infants• Children under 6
• Women of childbearing age• Elderly
Socioeconomic & cultural
• Wealth & Income (level & reliability)
• Education• Ethnicity
Geographic• Distance from
(super-) markets, food distribution centers, etc.
• Poor infrastructure & accessibility
• Risk of natural disaster
Note: Numbers refer to the indicators that refer to priority populations across the categories and criteria.
ATNI’s definition of priority populations emerges from the understanding that ‘unequal nutrition outcomes are rooted in deeper inequities […] that structure everyday living conditions’.18 ATNI believes that F&B companies can and should contribute to shaping opportunities and lowering barriers to attain healthy diets, environments, and lifestyles. With this approach, ATNI chooses to focus on opportunities and processes rather than outcomes, in line with the concept of ‘nutrition equity’ that the 2020 Global Nutrition Report focuses on.
The factors presented in Figure 6 are also important determinants for the challenges that the SDGs aim to overcome, and should be considered in any intervention addressing food insecurity and malnutrition.19 For the SDGs and related nutrition targets to be realized, it is crucial to understand how companies can contribute to addressing the determinants of nutrition inequities. While priority populations are addressed in general in Categories A and G, specific factors are addressed in Categories B, C, D, and E.
Further strengthening of linkages to the SDGs through food loss and wasteAs in previous Global Index iterations, ATNI continues to focus on the SDGs, particularly with regards to reaching Goals 2 (‘End hunger, achieve food security and improved nutrition and promote sustainable agriculture’) and 3 (‘Ensure healthy lives and promote well-being for all at all ages’). In this methodology, ATNI has further strengthened its emphasis on the SDGs and their realization. ATNI has incorporated indicators assessing companies’ efforts in reducing the per capita food loss and waste along F&B production and supply chains (from the post-harvest stage to the retail and consumer levels), in line with SDG 12 (target 12.3 - “By 2030, halve per capita global food waste at the retail and consumer levels and reduce food losses along production and supply chains, including post-harvest losses”). ATNI believes that minimizing food loss and waste can make a substantial contribution to increasing access to food.
18 See 2020 Global Nutrition Report: Action on equity to end malnutrition, p. 21. Available at: https://globalnutritionreport.org/reports/2020-global-nutrition-report/
19 ATNI aims to guide F&B manufacturers in getting further involved in the process towards achieving the SDGs. In particular, ATNI focuses on Goals 2 (“End hunger, achieve food security and improved nutrition and promote sustainable agriculture” – paying special attention to targets 2.1 and 2.2) and 3 (“Ensure healthy lives and promote well-being for all at all ages”). Besides, ATNI covers the environmental aspects affecting food security by incorporating indicators assessing companies’ efforts in reducing food loss and waste along production and supply chains, in line with Goal 12 (target 12.3). However, the latter has not been included as a factor to define priority populations. Rather, this sustainability element has been included across categories without being targeted or solely linked to these population groups.Un
der e
mba
rgo
19Global Access to Nutrition Index 2021
WHO regional models and benchmarking NPSSince the Global Index 2018, WHO has published a series of regional NPS to determine which products should not be marketed to children in relation to its worldwide efforts to reduce the exposure of children to marketing that promotes unhealthy foods and beverages. These models cover all relevant geographies and are now referred to as the relevant standard in relation to marketing to children in Category D of the Global Index 2021 methodology.
In addition, the methodology assesses whether manufacturers use a government-endorsed NPS to determine which products they define as ‘healthy’. It also assesses if the company develops its own NPS customized to its business model and particular approach to product development, and if that system should be benchmarked against a well-recognized government-endorsed NPS (e.g. HSR, Nutri-Score).
Other changesIn addition to the changes above, other amendments to the Global Index 2021 methodology relate to new or updated standards or global guidelines, text edits to indicators and the provision of more detailed explanations about the scope and interpretation of indicators by providing ‘additional information’ sections.
Unde
r em
barg
o

20Global Access to Nutrition Index 2021
Research processThe research process starts with company selection. This section describes how it is done, as well as the procedures for data collection for the Corporate Profile, the Product Profile and the BMS / CF Marketing elements.
Further, it explains the scoring algorithm of the Corporate Profile, including the Product Profile, and the BMS / CF Marketing score that is incorporated into the final Global Index score and ranking. Finally, it describes ATNI’s approach to quality assurance to ensure accuracy and validity of the results.
Company selection
Criteria for company selectionATNI’s Global Indexes rank the world’s largest food and non-alcoholic beverage manufacturers, including companies that are publicly listed, privately owned or cooperatives. The Global Index 2021 company selection identifies the 25 largest F&B manufacturers by total global financial year (FY) revenues, consisting of the top 20 companies, plus those companies that were included in earlier Global Indexes.
Company selection for inclusion in the Global Index 2021 was based on two sets of data: companies’ publicly reported and self-reported sales revenues for the FY 2018, complemented with estimated retail sales of packaged food and (non-alcoholic) beverage products worldwide (obtained from ATNI’s data service provider) for the same year.
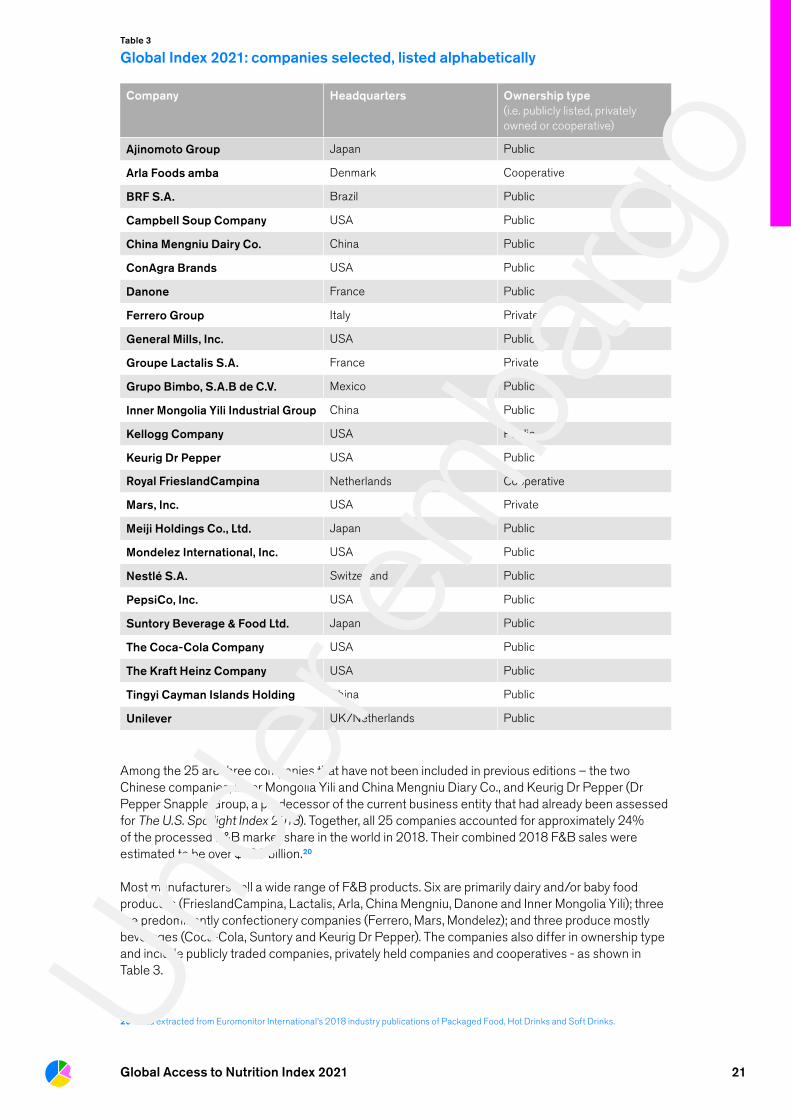
Global Index 2021: companies selectedTable 3 lists the 25 largest F&B manufacturers selected for the Global Index 2021 assessment. These companies have the greatest impact among processed food producers on consumers’ diets across different markets.
Unde
r em
barg
o
21Global Access to Nutrition Index 2021
Table 3
Global Index 2021: companies selected, listed alphabetically
Company Headquarters Ownership type (i.e. publicly listed, privately owned or cooperative)
Ajinomoto Group Japan Public
Arla Foods amba Denmark Cooperative
BRF S.A. Brazil Public
Campbell Soup Company USA Public
China Mengniu Dairy Co. China Public
ConAgra Brands USA Public
Danone France Public
Ferrero Group Italy Private
General Mills, Inc. USA Public
Groupe Lactalis S.A. France Private
Grupo Bimbo, S.A.B de C.V. Mexico Public
Inner Mongolia Yili Industrial Group China Public
Kellogg Company USA Public
Keurig Dr Pepper USA Public
Royal FrieslandCampina Netherlands Cooperative
Mars, Inc. USA Private
Meiji Holdings Co., Ltd. Japan Public
Mondelez International, Inc. USA Public
Nestlé S.A. Switzerland Public
PepsiCo, Inc. USA Public
Suntory Beverage & Food Ltd. Japan Public
The Coca-Cola Company USA Public
The Kraft Heinz Company USA Public
Tingyi Cayman Islands Holding China Public
Unilever UK/Netherlands Public
Among the 25 are three companies that have not been included in previous editions – the two Chinese companies, Inner Mongolia Yili and China Mengniu Diary Co., and Keurig Dr Pepper (Dr Pepper Snapple Group, a predecessor of the current business entity that had already been assessed for The U.S. Spotlight Index 2018). Together, all 25 companies accounted for approximately 24% of the processed F&B market share in the world in 2018. Their combined 2018 F&B sales were estimated to be over $720 billion.20
Most manufacturers sell a wide range of F&B products. Six are primarily dairy and/or baby food producers (FrieslandCampina, Lactalis, Arla, China Mengniu, Danone and Inner Mongolia Yili); three are predominantly confectionery companies (Ferrero, Mars, Mondelez); and three produce mostly beverages (Coca-Cola, Suntory and Keurig Dr Pepper). The companies also differ in ownership type and include publicly traded companies, privately held companies and cooperatives - as shown in Table 3.
20 Data extracted from Euromonitor International’s 2018 industry publications of Packaged Food, Hot Drinks and Soft Drinks.Unde
r em
barg
o

22Global Access to Nutrition Index 2021
Research procedures
Corporate Profile procedureATNI collects data through an iterative, consultative process with the companies that are assessed. Companies are invited to engage on a voluntary and cost-free basis (to ensure the independence of the Index), to provide information (including non-publicly available data) and clarification. They are offered the option of entering into a Non-Disclosure Agreement (NDA) with ATNI, which facilitates the exchange of information that is not publicly available.
ATNI research analysts gather public information from corporate websites and third-party sources referred to by companies. All of this information and source documents are saved on an online data gathering platform. A dedicated ATNI analyst makes a preliminary assessment of that information against the methodology. Companies are provided access to the platform and offered training on how to use it. They may comment on ATNI’s initial assessment and provide additional relevant information via the platform — under an NDA if desired. This information, provided it is sufficiently supported with evidence, is accepted by ATNI to assess their commitment and performance only; companies can only achieve scores for disclosure based on published information. After re-assessment of the data by ATNI, companies are asked to clarify and / or provide additional evidence through the platform. New information and source documents are accepted if published before the deadline of 29 September 2020.
Product Profile procedure ATNI and The George Institute for Global Health (TGI),21 with additional data input from Innova Market Insights,22 work in partnership to generate the Product Profile, which involves the following procedures:
• Country selection: The 2018 Product Profile assessed the nutritional quality of the products of the Index companies in nine markets (Australia, China, Hong Kong, India, Mexico, New Zealand, South Africa, the U.K. and the U.S.). To ensure that the 2021 results are comparable across companies and based on an analysis of the countries that contribute most to their estimated global retail sales, the selection of markets for the Product Profile starts with this list of countries covered in 2018 and adds additional important markets not already covered. Six major regional markets (Brazil, Canada, France, Germany, Japan and Russia) are prioritized to ensure optimal comparability between companies, but additional countries are included as necessary according to their global presence. For each company, up to a total of 10 countries are included in the Product Profile with the aim of covering 80% of their estimated global retail sales, and with a minimum of 50%, based on the cumulative country-level retail sales. Data from the FY 2018 was used as a basis for the analysis.
• Food category selection: ATNI identifies the product categories for each company using the FY 2018 retail sales data.23 All packaged foods and non-alcoholic beverages manufactured and marketed by the included companies’ are included in the analyses, other than those identified under ‘Outside the scope of the Global Index’.24 Up to five best-selling product categories for each company, per country, are identified based on retail sales value and included in the analysis, to cover those products that make a large contribution to diets in those countries.
• Nutrient content data: Nutrient content information, which is extracted from the label information on the product packaging, is compiled into a database from two sources: TGI’s FoodSwitch databases in the nine countries assessed in 2018, and the Innova Market Insights database for all countries covered, to ensure the dataset used for the Product Profile is comprehensive and contains the most up-to-date information. Products with data entered or updated from 2018 onwards are used to generate product lists for each company, using the most recent data if the same product is listed multiple times.
21 ATNI commissions TGI to undertake the Product Profile research. TGI’s flagship FoodSwitch program is a growing database of nutrition and labelling information with over 500,000 packaged and restaurant foods. TGI has previously used their database to analyze the healthiness of the food supply of more than 1 billion people around the world. TGI follows its standard rigorous research and validation processes for the Product Profile. For a detailed account about the background and calculation, please refer to TGI´s 2018 Product Profile report
22 Innova Market Insight is a market research company that tracks new F&B product launches in more than 75 countries. More information available at: https://www.innovamarketinsights.com/
23 Data extracted from Euromonitor International’s 2020 industry publications of; Packaged Food, Hot Drinks and Soft Drinks.
24 So-called ‘private label’ products, which may be manufactured by companies included in ATNI’s analysis but are marketed and sold by other parties under different brand names, are not included in the analysis.Un
der e
mba
rgo

23Global Access to Nutrition Index 2021
• Nutrient content data confirmation: All included companies are provided with their product lists and nutrient content for all included countries and are offered the opportunity to provide corrections or additions, which will be used to update the product database before starting the data analysis.
BMS / CF procedureThe BMS / CF Marketing methodology is designed to evaluate whether baby food manufacturers market their BMS and CF products in line with the following key international guidelines and standards in this area:
• The International Code of Marketing of Breast-milk Substitutes (1981);
• Subsequent WHA resolutions that make significant additions or provide clarifications to the original Code, referred to throughout this document in appropriate sections;
• Codex Alimentarius Standard for Infant Formula and Formulas for Special Medical Purposes Intended for Infants (Codex Standard 72-1981), Codex standard for Follow-up Formula (Codex Standard 156-1987), and Codex Alimentarius Code of Hygienic Practice for Powdered Formulae for Infants and Young Children (CAC / RCP 66-2008);
• WHO / the Food and Agriculture Organization of the United Nations (FAO) Guidelines on Safe Preparation, Storage and Handling of Powdered Infant Formula (2007);
• Relevant local regulations in the countries in which ATNI conducts in-country studies.
The Indexes assess whether companies market the following BMS / CF products in line with the recommendations of The Code:
• CF identified as being suitable for infants from 6 to 36 months of age;
• Any type of milk-based formula, including: infant formula (that can satisfy the normal nutritional requirements of infants up to six months of age); follow-on formula, also called follow-up formula (for infants from six months of age); and growing-up milk, also called toddler milk (for young children from 12 to 36 months of age).
The 2018 Global Index did not assess whether companies had adopted the recommendations of WHA resolution 69.9 passed in 2016, which extends The Code’s application to infant formula marketing as suitable for young children up to 36 months of age, and makes new recommendations on the marketing of CF for infants from 6 to 36 months of age. This was to give companies time to implement those recommendations. ATNI has incorporated WHA 69.9 recommendations into this methodology for the Global Index 2021.25
The assessment is undertaken using two separate tools: the BMS / CF 1 Corporate Profile assessment, and the BMS / CF 2 in-country assessment.
BMS / CF 1 Corporate Profile assessmentThe BMS 1 Corporate Profile methodology has two modules, designed to measure the extent to which BMS companies’ marketing policies align to The Code and resolution WHA 69.9. Both the BMS and CF modules measure whether companies have comprehensive, effective procedures and management systems to implement their policies, as well as their level of transparency. The 10 largest BMS and CF manufacturers are included in the sub-ranking for the Global Index 2021, based on their FY 2018 global revenues.26 These are (listed in alphabetical order):
• Abbott Laboratories Inc. (included in 2016 and 2018 sub-ranking);
• China Mengniu Dairy Co. (new);
• Danone (included in 2016 and 2018 sub-ranking);
• Feihe International Inc. (new);
• Inner Mongolia Yili Industrial Group (new);
• The Kraft Heinz Company (included in 2016 and 2018 sub-ranking);
• Nestlé S.A. (included in 2016 and 2018 sub-ranking);
• PepsiCo, Inc. (new);
• RB (included in 2016 and 2018 sub-ranking);
• Koninklijke FrieslandCampina (included in 2016 and 2018 sub-ranking).
25 Further, because The Code encompasses products for special medical or dietary use, these products are also assessed in both BMS 1 and BMS 2.
26 Data extracted from Euromonitor International’s 2020 industry publications of Packaged Food.Unde
r em
barg
o

24Global Access to Nutrition Index 2021
As per the process for the standard Global Index Corporate Profile methodology described above, the publicly available BMS and CF marketing policies of each of the 10 baby food companies are first reviewed to determine the extent to which they align with The Code. ATNI collects information through an iterative, consultative process with the assessed companies. Companies are invited to engage on a voluntary and cost-free basis, and are offered to enter into an NDA with ATNI.
BMS / CF 2 in-country assessmentsIn-country assessments are designed to measure companies’ compliance with The Code and / or national regulations — whichever is stricter. These assessments cover all forms of marketing, as set out in The Code, by interviewing mothers and healthcare workers, visiting retail stores and online retailers, as well as monitoring traditional and digital media. Countries are selected based on a risk rating system used by FTSE4Good based on data relating to the child mortality rate, level of malnutrition, HIV rates, corruption levels, the Human Development Index score, status of implementation of The Code, and other factors 27. For the BMS / CF 2 assessment, all companies — local or multinational — whose products are found in the territory are included in the study.
Global Index 2021 approach to scoring and ranking
The Corporate Profile scoreThe Corporate Profile score is calculated using the sequential steps as illustrated in Figure 7 below.
Indicator level: Indicators are closed questions, and the basic ‘units’ of information, each of which assesses a specific aspect of the company’s activity. Three types of activity are measured: the companies’ commitments, performance and disclosure.
The maximum score for performance indicators is 20, but for commitment and disclosure indicators the maximum is 10, to ensure that indicators that assess what companies put in practice have double the influence on the final scoring compared to commitment and disclosure indicators. Indicators have a number of scoring options and a fixed maximum score. Some are organized on a sliding scale with the top level receiving a score of 10 (or 20) and lower levels being awarded lower scores on a standardized scale of 5 (or 10), 2.5 (or 5) and 0, typically. Other indicators are scored using multiple, equally valid options. In this case, each answer carries an equal number of points that are totaled for the indicator score.
Lastly, two multipliers are applied to indicators that assess companies’ commitments, performance and disclosure related to ‘healthy’ foods and ‘geographic’ factors:
Healthy multiplier: ATNI aims to give a higher score to companies that use a rigorous definition of ‘healthy products’. It therefore awards a healthy multiplier based on the score in B3, which assesses the quality of a company’s NPS and the rigor of its definition of healthy products. A healthy multiplier ranges between 0.5 (i.e. reducing the score of a relevant indicator) and 1 (i.e. no effect on the score of a relevant indicator). Indicators to which the healthy multiplier is applied are identified by a heart symbol.
Geographic multiplier. In order to reward companies that make and deliver commitments on a global basis, rather than on a more limited geographic basis, ATNI applies a geographic multiplier to some indicators. The scope of a company’s policy or performance is in some cases multiplied (e.g. by 1 if it applies globally, by 0.75 if it applies to multiple major markets, and by 0.5 if it applies to a company’s home market only). Indicators to which the geographic multiplier is applied are identified by a globe symbol.
Criterion level: The criterion score is calculated by adding the scores for all indicators within the criterion and dividing this by the total maximum score (obtained by adding the maximum of 10 points per commitment and disclosure indicator, and 20 points per performance indicator).
27 For more information about FTSE4Good’s risk rating system, see: https://research.ftserussell.com/products/downloads/F4G_BMS_Criteria.pdfUn
der e
mba
rgo

25Global Access to Nutrition Index 2021
Category level: The category score is the mean of its criteria scores, except for Category B, in which the weighted mean of Criteria B1, B2 and B3 is calculated according to the respective weighting of 20%, 7.5% and 7.5% of those criteria in the overall Corporate Profile score.
Corporate Profile score: The Corporate Profile score is the weighted mean of the category scores (A 12.5%, B 35%, C15%, D 20%, E 2.5%, F10% and G 5%).
Figure 7
Calculation of the Corporate Profile score
Corporate profile scores per company (out of 10 points)
* Weighted category score average (A 12.5%, B 35%, C 15%, D 20%, E 2.5%, F 10% and G 5%)
Category Level
• Category scores calculated by averaging criteria scores within the category (0-100%)
• Seven categories (ATNI thematic areas) carry different weights
Category Scores
Criteria Level
• Criterion scores calculated by combining all indicators and multipliers within a criterion.
• All criteria have identical weight within a category except criteria in category B (B1 Product Profile 20%, B2 7.5% and B3 7.5% weight in final Index scores)
Criteria Scores
Indicator Level
• Individual indicators: closed-ended answer options selected.
• Commitment and disclosure indicators maximum base score of 10 points.
• Performance indicators maximum base score of 20 points.
• Healthy and Geographic multipliers applied (range between 0.5 and 1).
Indicator Scores
The Product Profile score The three elements of the Product Profile score are calculated and integrated into the Corporate Profile methodology in Criterion B1: Product Profile results. The steps below describe the calculation of the elements that make up the Product Profile score (see also Figure 8 below).
• Calculation of HSR: The HSR is first calculated for each unique product. A food or beverage is considered as a unique item based upon the brand name and description irrespective of serving size and packaging (i.e. a specific brand of cola sold in 7.5 fl oz cans is considered the same as the same specific brand of cola sold in 12 fl oz bottles). A mean HSR for the category is determined by adding up the HSRs for each unique product in the category and dividing the sum by the number of products in the category. Mean HSR scores are calculated for all included categories within each of the included countries for the assessment.
• Healthiness score (sales-weighted mean HSR score): To generate each company’s sales-weighted mean HSR score, first, the mean HSR per country is calculated as the sales-weighted mean of the product categories according to the corresponding category retail sales values.28 Secondly, the overall sales-weighted mean HSR score is calculated as the sales-weighted mean of all included countries. The highest possible score on the HSR and for this initial calculation is five. The score is doubled to obtain a score out of 10. In addition to the sales-weighted mean HSR, the non-sales weighted mean HSR is calculated per company as well as by simply calculating the mean HSR of all included products across all product categories and countries included for that company.
28 Data extracted from Euromonitor International’s 2020 industry publications of; Packaged Food, Hot Drinks and Soft Drinks.Unde
r em
barg
o

26Global Access to Nutrition Index 2021
• Relative Category performance score: 29 Within-category ranks are calculated for all product categories in which two or more companies are active. Next, a performance percentage is calculated from the inverted rank (e.g. first out of 10: inverted rank 10/10 = 100% performance score; tenth out of 10: inverted rank 1/10 = 10% performance score). An exception is made for categories in which only two companies compete: 75% and 25% performance scores are allocated for companies ranking first and second, respectively, to prevent extreme scores. As the final step, the sales-weighted company mean across all product categories in which the company competes with peers is calculated. The score on a scale of 0-100% is converted into a score out of 10.
• Change in HSR score: 30 This score quantifies the rate of change in portfolio healthiness, based on the difference in the companies’ overall sales-weighted mean HSR score in 2020 compared to 2018. This applies only to companies assessed in both Indexes and takes into account only those countries that are included in both assessments. Companies are also excluded from this scored element if overlapping countries account for less than 5% of their estimated retail sales in 2019.31 For every 0.1 increase in the overall sales-weighted mean HSR for 2020 over the 2018 HSR, a score of 20% is credited, leading to a maximum performance of 100% if the company achieves an increase of 0.5 HSR or more. The score on a scale of 0-100% is converted into a score out of ten.
• The Product Profile score is simply the equally weighted mean of the three scored elements, yielding a score that ranges between 0 and 10. If a company is assessed in the Product Profile for the first time, the final score is the equally weighted mean of two scored elements only, the healthiness score (sales-weighted mean HSR) and the relative category score.
The results of the Product Profile are integrated into the Corporate Profile in Category B1, indicators B1.1, B1.2 and B1.3 (see Appendix I).
Figure 8
Calculation of the Product Profile score
Three scored elements
B1.1 Mean healthiness score portfolio sales-weighted mean HSR (max.10)
Sales-weighting by product category
B1.3 Change in HSR Score ***difference in sales-weighted mean HSR in 2021 compared to 2018 (max. 10)
Each product assessed using HSR** within its category, and the mean HSR is calculated for each product category
Selection of companies’ top-five best selling product categories in up to 10 markets*
B1.2 Relative category performance scorebased on ranking within product categories (max. 10)
Sales-weighting by product category
Ranking, per product category, of nutritional quality relative to peers
Final Product profile scoreEqually weighted average of the three scored elements (out of10)
*Analysis based on each company’s five best-selling categories in up to 10 selected markets that together cover at least 50% of their global retail sales. Based on data derived from the Euromonitor International’s 2020 industry publications of; Packaged Food, Hot Drinks and Soft Drinks. **Health Star Rating ***This applies only to companies previously assessed in the Global Index 2018 Products Profile and only includes countries which were common to both Product Profiles in 2018 and 2021. Companies are also excluded from this scored element if overlapping countries account for less than 5% of their estimated retail sales in 2019.
29 An earlier iteration of this methodology had additional exceptions for these elements which have since then been removed based on consultations with ATNI’s Expert Group.
30 An earlier iteration of this methodology had additional exceptions for these elements which have since then been removed based on consultations with ATNI’s Expert Group.
31 This exception was introduced during the research phase.Unde
r em
barg
o
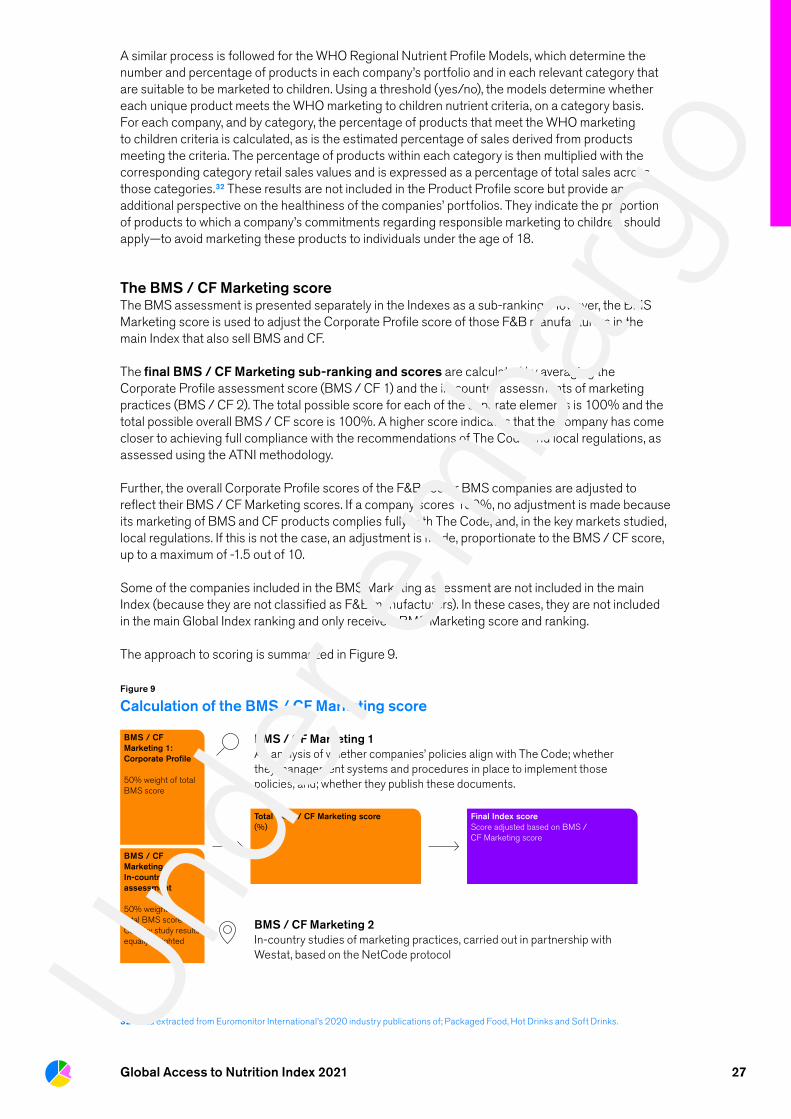
27Global Access to Nutrition Index 2021
A similar process is followed for the WHO Regional Nutrient Profile Models, which determine the number and percentage of products in each company’s portfolio and in each relevant category that are suitable to be marketed to children. Using a threshold (yes/no), the models determine whether each unique product meets the WHO marketing to children nutrient criteria, on a category basis. For each company, and by category, the percentage of products that meet the WHO marketing to children criteria is calculated, as is the estimated percentage of sales derived from products meeting the criteria. The percentage of products within each category is then multiplied with the corresponding category retail sales values and is expressed as a percentage of total sales across those categories.32 These results are not included in the Product Profile score but provide an additional perspective on the healthiness of the companies’ portfolios. They indicate the proportion of products to which a company’s commitments regarding responsible marketing to children should apply—to avoid marketing these products to individuals under the age of 18.
The BMS / CF Marketing score The BMS assessment is presented separately in the Indexes as a sub-ranking. However, the BMS Marketing score is used to adjust the Corporate Profile score of those F&B manufacturers in the main Index that also sell BMS and CF.
The final BMS / CF Marketing sub-ranking and scores are calculated by averaging the Corporate Profile assessment score (BMS / CF 1) and the in-country assessments of marketing practices (BMS / CF 2). The total possible score for each of the separate elements is 100% and the total possible overall BMS / CF score is 100%. A higher score indicates that the company has come closer to achieving full compliance with the recommendations of The Code and local regulations, as assessed using the ATNI methodology.
Further, the overall Corporate Profile scores of the F&B sector BMS companies are adjusted to reflect their BMS / CF Marketing scores. If a company scores 100%, no adjustment is made because its marketing of BMS and CF products complies fully with The Code, and, in the key markets studied, local regulations. If this is not the case, an adjustment is made, proportionate to the BMS / CF score, up to a maximum of -1.5 out of 10.
Some of the companies included in the BMS Marketing assessment are not included in the main Index (because they are not classified as F&B manufacturers). In these cases, they are not included in the main Global Index ranking and only receive a BMS Marketing score and ranking.
The approach to scoring is summarized in Figure 9.
Figure 9
Calculation of the BMS / CF Marketing score
BMS / CF Marketing 1An analysis of whether companies’ policies align with The Code; whether they management systems and procedures in place to implement those policies, and; whether they publish these documents.
BMS / CF Marketing 2In-country studies of marketing practices, carried out in partnership with Westat, based on the NetCode protocol
BMS / CF Marketing 1: Corporate Profile
50% weight of total BMS score
BMS / CF Marketing 2: In-country assessment
50% weight of total BMS scoreCountry study results equally weighted
Total BMS / CF Marketing score(%)
Final Index scoreScore adjusted based on BMS / CF Marketing score
32 Data extracted from Euromonitor International’s 2020 industry publications of; Packaged Food, Hot Drinks and Soft Drinks.Unde
r em
barg
o
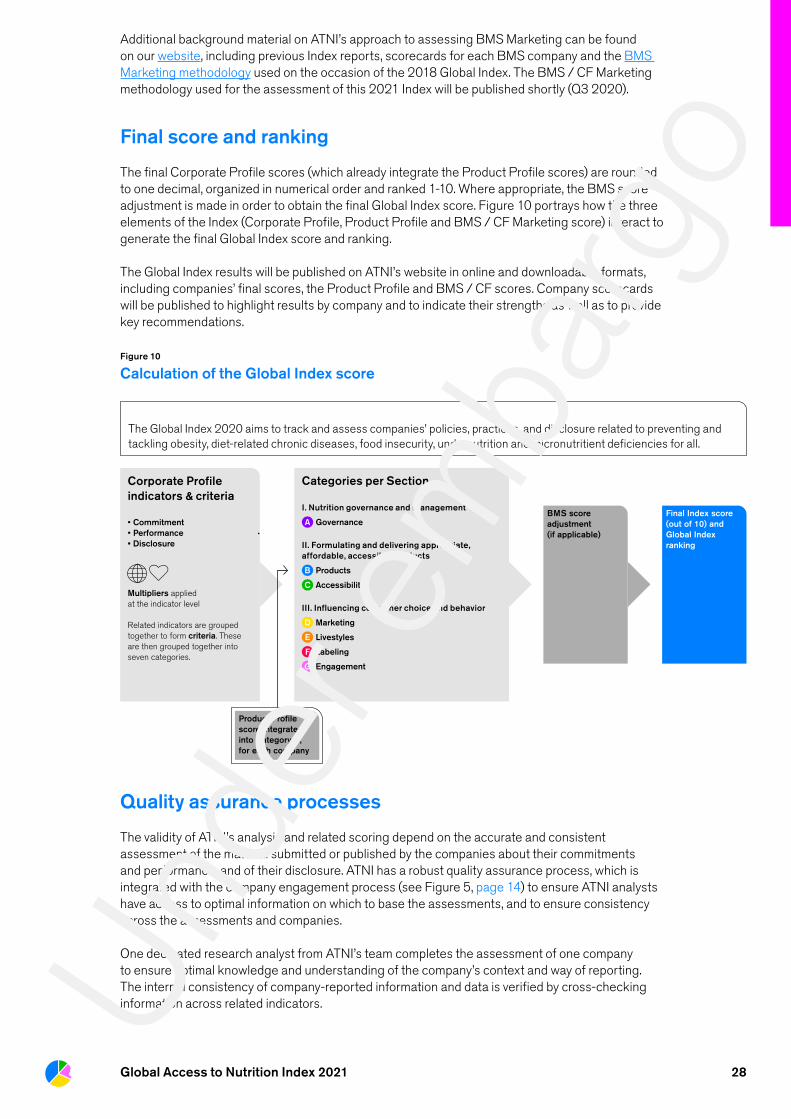
28Global Access to Nutrition Index 2021
Additional background material on ATNI’s approach to assessing BMS Marketing can be found on our website, including previous Index reports, scorecards for each BMS company and the BMS Marketing methodology used on the occasion of the 2018 Global Index. The BMS / CF Marketing methodology used for the assessment of this 2021 Index will be published shortly (Q3 2020).
Final score and ranking
The final Corporate Profile scores (which already integrate the Product Profile scores) are rounded to one decimal, organized in numerical order and ranked 1-10. Where appropriate, the BMS score adjustment is made in order to obtain the final Global Index score. Figure 10 portrays how the three elements of the Index (Corporate Profile, Product Profile and BMS / CF Marketing score) interact to generate the final Global Index score and ranking.
The Global Index results will be published on ATNI’s website in online and downloadable formats, including companies’ final scores, the Product Profile and BMS / CF scores. Company scorecards will be published to highlight results by company and to indicate their strengths as well as to provide key recommendations.
Figure 10
Calculation of the Global Index score
Categories per Section
I. Nutrition governance and management
A Governance
II. Formulating and delivering appropriate,affordable, accessible products
B Products
C Accessibility
III. Influencing consumer choice and behavior
D Marketing
E Livestyles
F Labeling
G Engagement
BMS score adjustment (if applicable)
Final Index score (out of 10) and Global Index ranking
Product Profile score integrated into Category B, for each company
Corporate Profile indicators & criteria
• Commitment • Performance • Disclosure
Multipliers applied at the indicator level
Related indicators are grouped together to form criteria. These are then grouped together into seven categories.
The Global Index 2020 aims to track and assess companies’ policies, practices, and disclosure related to preventing and tackling obesity, diet-related chronic diseases, food insecurity, undernutrition and micronutritient deficiencies for all.
Quality assurance processes
The validity of ATNI’s analysis and related scoring depend on the accurate and consistent assessment of the material submitted or published by the companies about their commitments and performance, and of their disclosure. ATNI has a robust quality assurance process, which is integrated with the company engagement process (see Figure 5, page 14) to ensure ATNI analysts have access to optimal information on which to base the assessments, and to ensure consistency across the assessments and companies.
One dedicated research analyst from ATNI’s team completes the assessment of one company to ensure optimal knowledge and understanding of the company’s context and way of reporting. The internal consistency of company-reported information and data is verified by cross-checking information across related indicators. Un
der e
mba
rgo

29Global Access to Nutrition Index 2021
An internal peer review is carried out twice during the process to check the consistency of assessment for all companies and all indicators, in order to ensure fair and consistent scoring. The first peer review focuses on the analyst’s interpretation of all indicators and answer options, and how this aligns with the pre-assessment of company information. This takes place before the companies can engage for the first time to add information. The second peer review is carried out after all phases of company engagement have taken place, and before finalization of the assessments, and is more formal. One research analyst reviews the assessment of all indicators within one category and across all companies, to ensure that a consistent approach is applied. All seven categories are reviewed in this way and assessments are revised as needed. The ATNI research manager completes the final cross-check and companies review their own scorecards and best practice examples for factual accuracy prior to publication.
Limitations
Company commitments and self-reported performance: The Corporate Profile relies on companies’ self-reported information and data, as it is not feasible to perform independent, on-the-ground assessments of companies’ practices across all the topics covered in the seven categories. Therefore, ATNI requires companies to provide evidence of performance and to implement independent auditing where relevant in the methodology. For example, in Category D, which addresses responsible marketing practices, companies are assessed regarding their public commitments, their commissioning of third party audits to review their marketing practices, and their ability to provide evidence of performing in line with their commitments.
Research process: The interactive nature of the Corporate Profile research process involves engagement with company representatives to request more information and / or clarification in case the information basis for the assessment of single indicators is not complete and / or clear. Because of this interactive process, it is not practically feasible to generate commonly used statistics, such as inter- and intra-rater reliability, in a meaningful way as part of ATNI’s quality assurance process. ATNI ensures that the assessments are accurate, consistent and fair across companies by applying an internal peer review system and frequent alignment within the research team (see ‘Quality assurance process’ on page 28, for more information).
Scope of markets selected for the Product Profile:Having extensively piloted the Product Profile methodology, the first full Product Profile was undertaken for the 2018 Global Index. Products in up to nine markets (Australia, China, Hong Kong, India, Mexico, New Zealand, South Africa, the U.K. and the U.S.) were included, to provide representation across several continents. For the 2021 iteration of the Product Profile, the scope of countries included has been expanded to cover up to 10 markets for any given company in order to achieve a minimum coverage of 50% or more of the estimated global retail sales. Ideally, the Product Profile would encompass all countries in which a company is active so as to assess the healthiness of its global product portfolio. However, this approach is intended to be a pragmatic one (taking into account resources available for ATNI to do this work) that achieves a fair representation of the companies’ global portfolios.
Scope of categories and products for the Product Profile: Similarly, the Product Profile would ideally include products in all of a companies’ product categories, but for practical reasons, ATNI limit analysis to the five best-selling categories for any company in each country selected, using the approach outlined above.
Specificity of the retail sales data in the Product Profile: Product-level sales data would ideally be used to calculate the sales-weighted figures, rather than the product category-level sales data that is used currently. However, ATNI is currently unable to obtain that data set at an affordable cost from information providers. Un
der e
mba
rgo
30Global Access to Nutrition Index 2021
Category scope of the HSR system: The HSR model does not score some ‘non-nutritive’ products such as tea and instant coffee; as a result, these products are not included in the analysis. This means that the results for companies such as Unilever and Nestlé, for example, are based on their sales excluding these products. Plain water, on the other hand, is given a maximum HSR of five to encourage its consumption.
Baby foods are also excluded from the study as the two selected nutrient profiling models are not designed to assess these specialized products, as are minimally processed agricultural products.
Serving size of products: Neither of the nutrient profiling models used take serving size into account. Some experts consider this to be a limitation while others believe it is a strength. One important determinant of weight gain is the quantity of food people choose to consume in one sitting (portion size). The serving size indicated on a multi-pack or provided within a single pack can influence how much of a product is eaten. Some argue that nutrient profiling models should include consideration of serving size—and some of the companies’ systems do. However, the absence of agreed national and international standards has meant that, to date, it has not proved possible to consider serving size with the models used for this study. This may also account for the differences between the numbers of healthy foods identified by this study and by the companies themselves using their own models.
NDAs: Some of the data shared by the companies is provided under NDA and therefore cannot be referenced explicitly in the report. However, it is reviewed by ATNI research analysts and, if relevant, incorporated into their scores for commitment and performance indicators. By default, data shared with ATNI that is not publicly available is not taken into account for disclosure indicators.
Limited or no disclosure: Some companies disclose limited or no information at all, either publicly or to ATNI under NDA. Scores for companies with limited or no disclosure are therefore lower and may not represent the companies’ actual performance on any topic. ATNI’s Indexes aim to stimulate transparency and public disclosure of nutrition and health information for the benefit of all stakeholders.
Different FYs and time periods assessed: Companies sometimes publish relevant information after ATNI’s deadline for data collection. This is because companies have different FYs and publishing timetables for their corporate reports. Any information that is published or disclosed to ATNI after the deadline is not included in their assessment or score.
Time constraints: Completing the Corporate Profile assessment and providing feedback on the Product Profile product lists requires significant time from the companies. Time constraints may limit the amount of information they share that is not already publicly available.
Unde
r em
barg
o
31Global Access to Nutrition Index 2021
Future development of the Global Index
A range of stakeholder consultations will gather feedback on the results of the Index and how the methodology for each element could be improved. ATNI will then develop proposals, and review them with the Expert Group. Once final revisions are agreed, this methodology document will be updated, as will the data gathering platform, ready for research for the subsequent Global Index to begin. This cycle will continue following the publication of each Index.
ATNI is already aware of additional elements that could be added in future to measure, for example, companies’ spending on marketing healthy and less healthy foods and beverages; how well designed and effective their programs to improve public health are; and whether they take a responsible approach to lobbying. Moreover, were more funding available, the Index could be expanded to rate more manufacturers, or parallel Indexes could be developed to assess food retailers, food service providers and cafés, and restaurant chains.
AppendicesThe appendices include:
• Appendix I: Global Index Corporate Profile Methodology 2021
• Appendix II: ATNI Expert Group members
Appendix I:Global Index Corporate Profile Methodology 2021
Healthy multiplier A healthy multiplier is applied to any scores for commitment or performance indicators relating to ‘healthy’ products. The multiplier is derived from the company’s score on Category B3 ‘Defining healthy and affordable products’ and ranges between 0.5 (adjusting the underlying score) and 1 (having no effect on the underlying score).
Geographic multiplier In order to reward companies that make commitments or deliver commitments on a global basis, rather than on a more limited geographic basis, a company’s score on the scope of its policy or performance is in some cases multiplied (e.g. by 1 if it applies globally, by 0.75 if that policy or performance applies to multiple major markets, and by 0.5 if it applies to a company’s home or single market only).
Unde
r em
barg
o
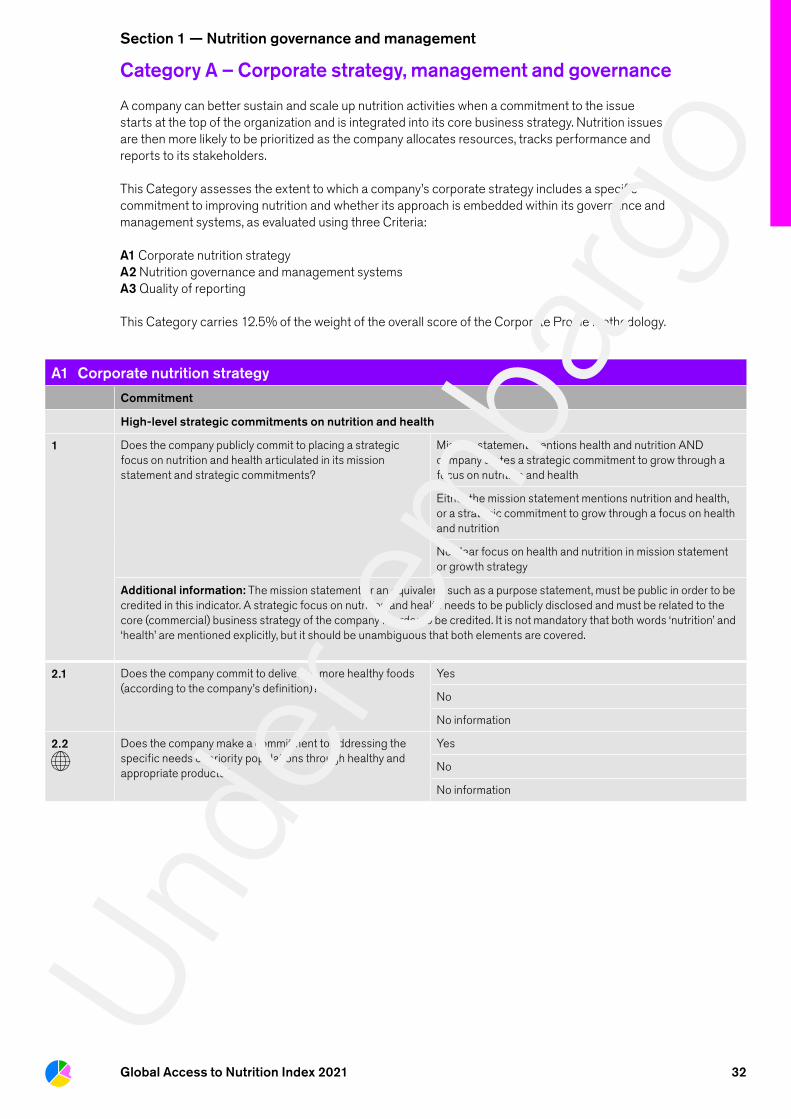
32Global Access to Nutrition Index 2021
Section 1 — Nutrition governance and management
Category A – Corporate strategy, management and governance
A company can better sustain and scale up nutrition activities when a commitment to the issue starts at the top of the organization and is integrated into its core business strategy. Nutrition issues are then more likely to be prioritized as the company allocates resources, tracks performance and reports to its stakeholders. This Category assesses the extent to which a company’s corporate strategy includes a specific commitment to improving nutrition and whether its approach is embedded within its governance and management systems, as evaluated using three Criteria:
A1 Corporate nutrition strategyA2 Nutrition governance and management systemsA3 Quality of reporting
This Category carries 12.5% of the weight of the overall score of the Corporate Profile methodology.
A1 Corporate nutrition strategy
Commitment
High-level strategic commitments on nutrition and health
1 Does the company publicly commit to placing a strategic focus on nutrition and health articulated in its mission statement and strategic commitments?
Mission statement mentions health and nutrition AND company states a strategic commitment to grow through a focus on nutrition and health
Either the mission statement mentions nutrition and health, or a strategic commitment to grow through a focus on health and nutrition
No clear focus on health and nutrition in mission statement or growth strategy
Additional information: The mission statement or an equivalent, such as a purpose statement, must be public in order to be credited in this indicator. A strategic focus on nutrition and health needs to be publicly disclosed and must be related to the core (commercial) business strategy of the company in order to be credited. It is not mandatory that both words ‘nutrition’ and ‘health’ are mentioned explicitly, but it should be unambiguous that both elements are covered.
2.1 Does the company commit to delivering more healthy foods (according to the company’s definition)?
Yes
No
No information
2.2 Does the company make a commitment to addressing the specific needs of priority populations through healthy and appropriate products?
Yes
No
No information
Unde
r em
barg
o

33Global Access to Nutrition Index 2021
A1 Corporate nutrition strategy
Additional information: Companies should address the nutrition policy priorities determined by public authorities in the markets in which they are active, as relevant to companies’ portfolios and activities. In addition to improving the healthiness of products for the general population, ATNI assesses whether companies commit to addressing the needs of those groups experiencing, or at higher risk of malnutrition than the general population. All aspects of malnutrition are considered relevant if identified as a priority by public health authorities, and may encompass undernutrition, micronutrient deficiencies and overweight, obesity and diet-related diseases. Further, (risk of) malnutrition may be related to, or overlap with, aspects of food insecurity, defined as the uncertainties people face about their ability to obtain food and the need to reduce, at times during the year, the quality and / or quantity of food they consume due to lack of money or other resources.33
To refer to these groups, ATNI uses the overarching term ‘priority populations’. Throughout ATNI’s methodology, the use of this term focuses on addressing nutrition priorities in a given environment. Several factors or determinants are potentially important in identifying and addressing priority populations in relation to nutrition priorities, which are addressed in the ATNI methodology:
• Nutritional factors related to age or life stages (e.g. women of childbearing age, infants, young children, elderly) and undernourished groups, with a specific focus on (the risk of) micronutrient deficiencies that can be addressed by appropriate fortification or using micronutrient-rich products, ingredients or commodities (addressed in Category B). Whether the marketing of such products is adapted appropriately to the context of the target groups is assessed in Category D, in addition to a general focus on responsible marketing of products to children and youth (i.e. refraining from marketing products that do not meet relevant health guidelines to these groups);
• Income and other socioeconomic and cultural factors are addressed in Category C in relation to the affordability and accessibility of healthy products. In addition, behavioral factors are relevant in Category E to assess if consumer-oriented educational and lifestyle programs are well attuned to the target audiences, e.g. in relation to nutrition literacy;
• Physical access factors e.g. in relation to rural or urban areas in which people’s regular access to healthy foods may be limited: geographical factors are addressed in Category C — Criterion C2.
These factors, which vary by market and context, should be evident in the design and nature of companies’ approaches to addressing all forms of malnutrition. ATNI will assess how companies identify the needs of priority populations in the markets in which they operate based on national and / or international guidelines and policies. Further, ATNI aims to credit companies’ strategies that are universal but are resourced and delivered to respond to the specific nutritional needs of relevant population groups in a given market and context.
3
3.1. Has the company formally set out how it intends to address all forms of malnutrition (i.e. undernutrition, micronutrient deficiencies and obesity and diet-related chronic diseases) through its commercial strategy?
Yes, comprehensively
Yes, covering one or limited aspects of malnutrition only
No
No information
3.2. [Supplemental score] And through its philanthropic / non-commercial approach?
Yes, comprehensively
Yes, covering one or limited aspects of malnutrition only
No
No information
Additional information: The comprehensiveness of companies’ commercial and philanthropic strategies will be assessed on a company level, dependent on the needs of the markets in which they operate, i.e. undernutrition may not be relevant for companies only active in developed markets.
The ‘supplemental score’ in relation to its philanthropic / non-commercial approach in indicator 3.2 is not necessary to obtain the maximum score for indicator 3. The highest answer option in indicator 3.1 is sufficient for that. However, when the score for indicator 3.1 is not maximal, indicator 3.2 can add a limited contribution (up to 30%) to the score of indicator 3 in total.
33 FAO, IFAD, UNICEF, WFP and WHO. 2019. The State of Food Security and Nutrition in the World 2019. Safeguarding against economic slowdowns and downturns. Rome, FAO, p. 5. The same report defines the inverse — food security — as (page 186): “A situation that exists when all people, at all times, have physical, social and economic access to sufficient, safe and nutritious food that meets their dietary needs and food preferences for an active and healthy life. Based on this definition, four food security dimensions can be identified: food availability, economic and physical access to food, food utilization, and stability over time.” Companies’ contributions to these elements of food security are addressed throughout the ATNI methodology.Un
der e
mba
rgo

34Global Access to Nutrition Index 2021
A1 Corporate nutrition strategy
4 Company’s role in global (mal)nutrition commitments
4.1 Does the company publicly recognize the targets set out in the WHO Global Action Plan for the Prevention and Control of NCDs 2013-2020?
Yes
No
No information
Additional information: The main focus of WHO Global Action Plan for the Prevention and Control of NCDs 2013-2020 is on four types of NCDs — cardiovascular diseases, cancer, chronic respiratory diseases and diabetes — that make the largest contribution to morbidity and mortality due to NCDs, and on four shared behavioral risk factors — tobacco use, unhealthy diet, physical inactivity and harmful use of alcohol. It recognizes that the conditions in which people live and work, and their lifestyles, influence their health and quality of life. ATNI works in line with the Global Action Plan, focusing mainly on nutrition-related NCDs, and on behavioral risk factors related to nutrition and physical activity.
The Global Action Plan offers a paradigm shift by providing a road map and a menu of policy options for Member States, WHO, other UN organizations and intergovernmental organizations, NGOs and the private sector which, when implemented collectively between 2013 and 2020, will attain the nine voluntary global targets. Food and beverage companies have a key role to play in achieving the following targets, which is taken into account under this indicator:
• A 25% relative reduction in risk of premature mortality from cardiovascular diseases, cancer, diabetes, or chronic respiratory diseases;
• A 30% relative reduction in mean population intake of salt / sodium;
• A 25% relative reduction in the prevalence of raised blood pressure or contain the prevalence of raised blood pressure, according to national circumstances;
• Halt the rise in diabetes and obesity;
For more information, see: https://www.who.int/nmh/publications/ncd-action-plan/en/
4.2 Does the company publicly commit to delivering nutrition-specific SDGs (Goal 2, Goal 3 and Goal 12)?
Yes, covering all three SDGs mentioned
Yes, covering one or two of the SDGs mentioned, or by acknowledging the central role of nutrition to achieve the SDG agenda and committing to address it
No
Additional information: The 2030 Agenda for Sustainable Development, adopted by all United Nations Member States in 2015, provides a shared blueprint for peace and prosperity for people and the planet, now and into the future. At its heart are the 17 Sustainable Development Goals (SDGs), which are an urgent call for action by all countries — developed and developing — in a global partnership. They recognize that ending poverty and other forms of deprivation must go together with strategies that improve health and education, reduce inequality, and spur economic growth — all while tackling climate change and working to preserve our oceans and forests.
ATNI considers that food and beverage companies have a key role to play in achieving the SDGs, and a more sustainable future for all. Particularly, with regards to:
• SGD 2, to end hunger, achieve food security and improved nutrition and promote sustainable agriculture;
• SDG 3, focused on ensuring healthy lives and promote well-being for all at all ages;
• SDG 12 which aims at ensuring sustainable consumption and production patterns (particularly considering target 12.3, focused on halving the per capita global food waste at the retail and consumer levels and reduce food losses along production and supply chains, including post-harvest losses by 2030).
Although the ambition to reach zero hunger and healthy sustainable diets for all is most directly linked to SDG’s 2, 3 and 12, at least 12 of the 17 Goals contain indicators that are related to nutrition. Without adequate and sustained investments in good nutrition, the complete set of SDGs will not be realized.
For more information, see: https://sustainabledevelopment.un.org/sdgs and https://scalingupnutrition.org/nutrition/nutrition-and-the-sustainable-development-goals/
Unde
r em
barg
o
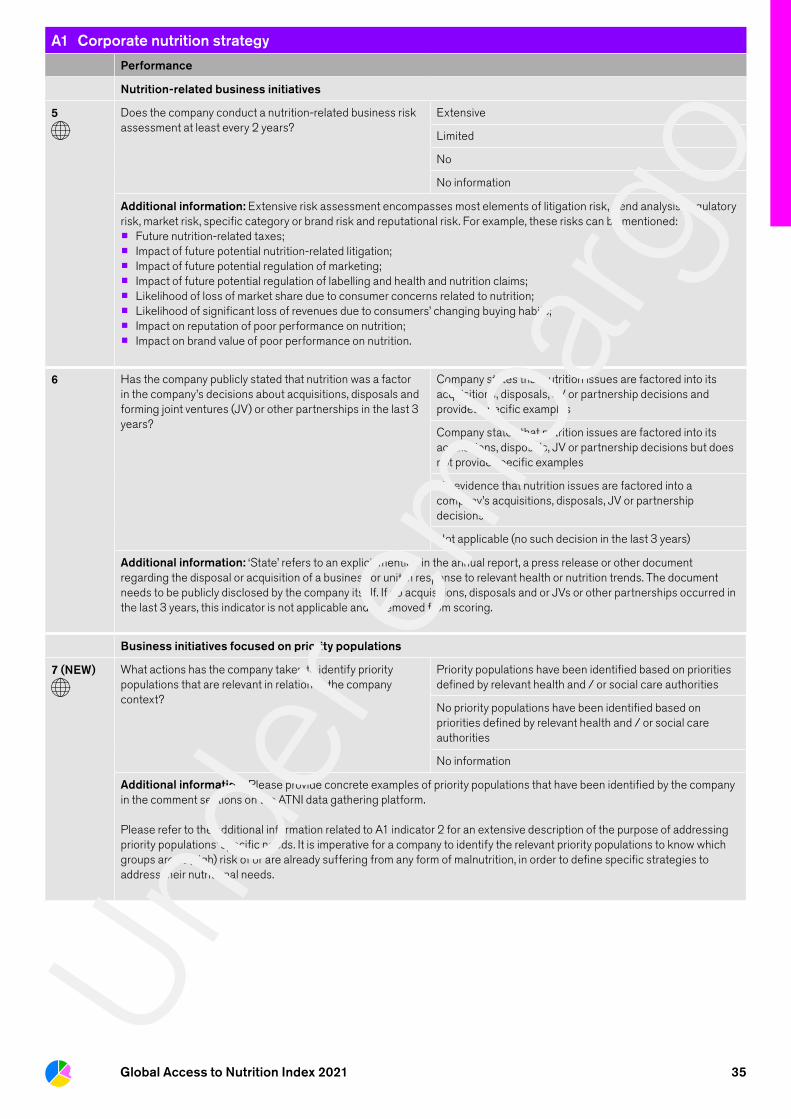
35Global Access to Nutrition Index 2021
A1 Corporate nutrition strategy
Performance
Nutrition-related business initiatives
5 Does the company conduct a nutrition-related business risk assessment at least every 2 years?
Extensive
Limited
No
No information
Additional information: Extensive risk assessment encompasses most elements of litigation risk, trend analysis, regulatory risk, market risk, specific category or brand risk and reputational risk. For example, these risks can be mentioned:
• Future nutrition-related taxes;
• Impact of future potential nutrition-related litigation;
• Impact of future potential regulation of marketing;
• Impact of future potential regulation of labelling and health and nutrition claims;
• Likelihood of loss of market share due to consumer concerns related to nutrition;
• Likelihood of significant loss of revenues due to consumers’ changing buying habits;
• Impact on reputation of poor performance on nutrition;
• Impact on brand value of poor performance on nutrition.
6 Has the company publicly stated that nutrition was a factor in the company’s decisions about acquisitions, disposals and forming joint ventures (JV) or other partnerships in the last 3 years?
Company states that nutrition issues are factored into its acquisitions, disposals, JV or partnership decisions and provides specific examples
Company states that nutrition issues are factored into its acquisitions, disposals, JV or partnership decisions but does not provide specific examples
No evidence that nutrition issues are factored into a company’s acquisitions, disposals, JV or partnership decisions
Not applicable (no such decision in the last 3 years)
Additional information: ‘State’ refers to an explicit mention in the annual report, a press release or other document regarding the disposal or acquisition of a business or unit in response to relevant health or nutrition trends. The document needs to be publicly disclosed by the company itself. If no acquisitions, disposals and or JVs or other partnerships occurred in the last 3 years, this indicator is not applicable and is removed from scoring.
Business initiatives focused on priority populations
7 (NEW) What actions has the company taken to identify priority populations that are relevant in relation to the company context?
Priority populations have been identified based on priorities defined by relevant health and / or social care authorities
No priority populations have been identified based on priorities defined by relevant health and / or social care authorities
No information
Additional information: Please provide concrete examples of priority populations that have been identified by the company in the comment sections on the ATNI data gathering platform.
Please refer to the additional information related to A1 indicator 2 for an extensive description of the purpose of addressing priority populations’ specific needs. It is imperative for a company to identify the relevant priority populations to know which groups are at (high) risk of or are already suffering from any form of malnutrition, in order to define specific strategies to address their nutritional needs.
Unde
r em
barg
o

36Global Access to Nutrition Index 2021
A1 Corporate nutrition strategy
8 Has the company undertaken a strategic review in the last 3 years of the commercial opportunities available to it in addressing specific needs of priority populations, and at what level of the company was this reviewed?
Yes, comprehensively and reviewed by the Board
Yes, but limited and reviewed by the Board
Yes, comprehensively but not reviewed at Board level
Yes, but limited and not reviewed at Board level
No strategic review
No information
Additional information: For this indicator, a strategic review means a broad review that takes into account company-internal (e.g. portfolio, distribution, innovation strategy) and other considerations, which may include market research such as assessed in indicator 9. Malnutrition includes undernutrition, micronutrient deficiencies, obesity and diet-related diseases. A comprehensive review covers all of these types of malnutrition.
9 Has the company done market research or other types of studies to assess unmet needs of priority populations, including through products that address micronutrient deficiencies (which may be through micronutrient fortification, the use of fortified ingredients / staples and / or products inherently high in micronutrients) where relevant?
Yes
No such market studies done
No information
Additional information: In order to be credited, the objective of the market research or other types of studies should be to assess or identify unmet needs in the market that can be addressed commercially. Initiatives that are not part of the commercial strategy or philanthropic programs are not relevant for this indicator.
10 10.1. Is the company’s commercial nutrition strategy and general approach to making its products healthier and addressing issues related to obesity and diet-related chronic disease:
Strategic and well-structured with a global strategy that is aligned with international guidelines
Ad hoc
Not articulated
10.2. Is the company’s commercial approach to address nutrition-related unmet needs of priority populations across the markets in which it is active:
Strategic and well-structured with a global strategy that is aligned with international guidelines
Ad hoc
Not articulated
Not applicable
10.3. [Supplemental score] Does the company or its foundation fund non-commercial public health and nutrition programs that serve priority populations?
Yes, based on a clear strategy or plan
Yes, on an ad-hoc basis
No
No information
Additional information: In the answer options, ‘strategic’ means that the company seems to have a clear rationale and approach for focusing on the target populations that the questions refer to; ‘well-structured’ means that it appears to follow a sensible process, following specific steps in all markets. The activities in question need to be part of the commercial strategy rather than being delivered through philanthropic programs or giving.
Disclosure
11 Does the company publicly disclose: (Tick all that apply) Commitment to delivering more healthy foods (indicator 2.1)
Commitment to reaching priority populations with healthy and appropriate products (indicator 2.2)
Commitment / strategy for addressing malnutrition commercially (indicator 3.1)
12 Does the company publicly disclose: Nutrition risk assessment (indicator 5)
13 Does the company publicly disclose: (Tick all that apply) The strategic review (indicator 8)
Studies on market need (indicator 9)Unde
r em
barg
o
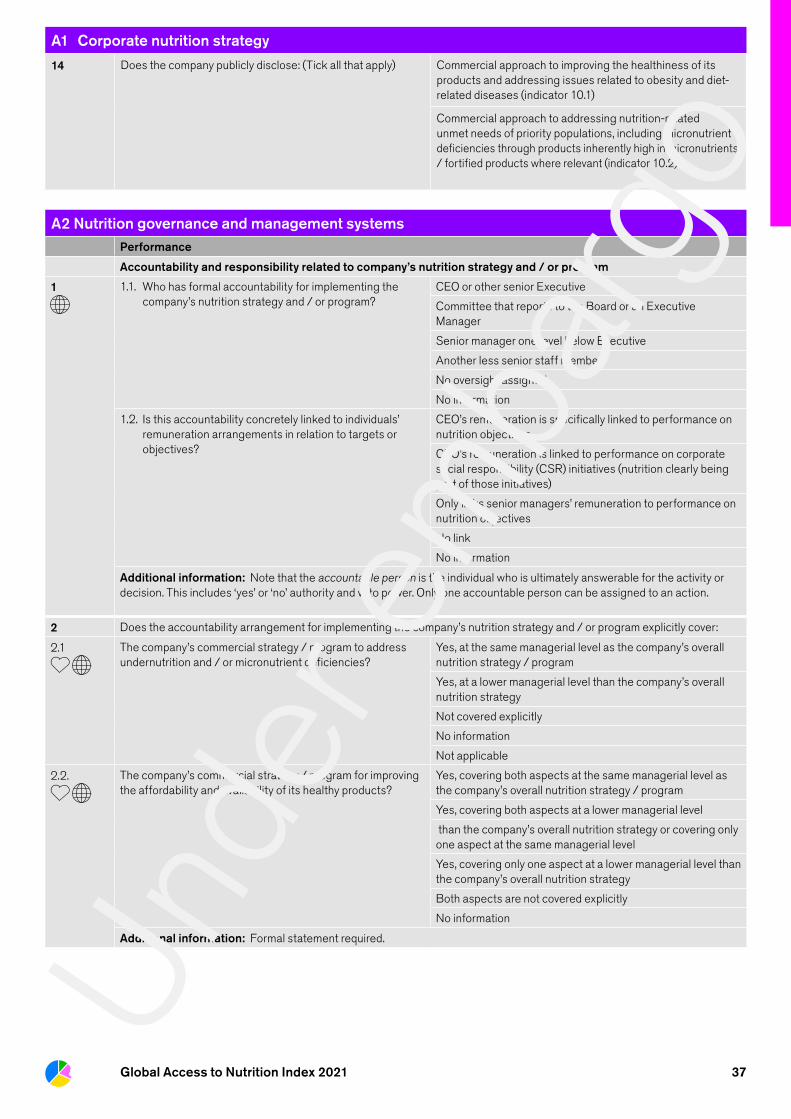
37Global Access to Nutrition Index 2021
A1 Corporate nutrition strategy
14 Does the company publicly disclose: (Tick all that apply) Commercial approach to improving the healthiness of its products and addressing issues related to obesity and diet-related diseases (indicator 10.1)
Commercial approach to addressing nutrition-related unmet needs of priority populations, including micronutrient deficiencies through products inherently high in micronutrients / fortified products where relevant (indicator 10.2)
A2 Nutrition governance and management systemsPerformance
Accountability and responsibility related to company’s nutrition strategy and / or program
1 1.1. Who has formal accountability for implementing the company’s nutrition strategy and / or program?
CEO or other senior Executive
Committee that reports to the Board or an Executive Manager
Senior manager one level below Executive
Another less senior staff member
No oversight assigned
No information
1.2. Is this accountability concretely linked to individuals’ remuneration arrangements in relation to targets or objectives?
CEO’s remuneration is specifically linked to performance on nutrition objectives
CEO’s remuneration is linked to performance on corporate social responsibility (CSR) initiatives (nutrition clearly being part of those initiatives)
Only links senior managers’ remuneration to performance on nutrition objectives
No link
No information
Additional information: Note that the accountable person is the individual who is ultimately answerable for the activity or decision. This includes ‘yes’ or ‘no’ authority and veto power. Only one accountable person can be assigned to an action.
2 Does the accountability arrangement for implementing the company’s nutrition strategy and / or program explicitly cover:
2.1
The company’s commercial strategy / program to address undernutrition and / or micronutrient deficiencies?
Yes, at the same managerial level as the company’s overall nutrition strategy / program
Yes, at a lower managerial level than the company’s overall nutrition strategy
Not covered explicitly
No information
Not applicable
2.2.
The company’s commercial strategy / program for improving the affordability and availability of its healthy products?
Yes, covering both aspects at the same managerial level as the company’s overall nutrition strategy / program
Yes, covering both aspects at a lower managerial level
than the company’s overall nutrition strategy or covering only one aspect at the same managerial level
Yes, covering only one aspect at a lower managerial level than the company’s overall nutrition strategy
Both aspects are not covered explicitly
No information
Additional information: Formal statement required.
Unde
r em
barg
o

38Global Access to Nutrition Index 2021
A2 Nutrition governance and management systemsInternal business performance evaluation and auditing
3 Is the company’s nutrition strategy / program approved by the Board of Directors and is its delivery subject to an annual standard internal audit and annual management review? (Tick all that apply)
Nutrition strategy / program is approved by the Board
Annual internal audit of strategy / program delivery is in place
Annual management review of strategy / program delivery is in place
Additional information: Note that internal auditing or first party auditing is an assurance and consulting activity undertaken by the company itself designed to add value and improve an organization’s operations. It helps an organization accomplish its objectives and internal standards by bringing a systematic, disciplined approach to evaluate and improve the effectiveness of risk management, control, and governance processes. Such audits are most often performed by auditors employed within the organization.Management review is the routine evaluation of whether management systems are performing as intended and producing the desired results as efficiently as possible. It is the ongoing ‘due diligence’ review by management that fills the gap between day-to-day work activities and periodic formal audits.
4 Does the company include food loss and waste (FLW) tracking and prevention tools in its management system? (Tick all that apply)
Including FLW within the Key Performance Indicators (KPIs) at executive management level
Value stream mapping along the production chain focused on identifying FLW
Application of the FLW Accounting and Reporting Standard
Application of the Sustainability Accounting Standards
Other methods / please specify which
Additional information: Reducing FLW is an important sustainability goal that links closely to access to nutrition, undernutrition and the right to food. The less FLW there is, the greater the supply of food, which obviously impacts consumers’ access to nutrition. This indicator’s aim is to assess the extent to which the company has mechanisms in place to prevent and reduce FLW in the production process (i.e. within the stages of the food chain where manufacturers have most decision-making power: agricultural production, post-harvest handling and storage, and mainly in processing — downstream stages are not considered). These include, inter alia: i) including FLW within the KPIs; ii) applying Value Stream Mapping tools (which help identify and understand the flow of materials and information of a product as it makes its way through the value stream) to reduce FLW in supply chains. Thus, this system is used to identify lean wastes (i.e. defects, overproduction, inappropriate processing, unnecessary inventory, unnecessary motion, transport and waiting) or the drivers (product-specific, generic or systemic) that cause the loss or waste of a product; iii) applying the FLW Accounting and Reporting Standard, a tool to quantify and report on FLW designed to help public and private actors — from cities to manufacturers — set targets for FLW reduction. This tool was developed by the Food Loss & Waste Protocol, a multi-stakeholder partnership whose mission is to ensure wide adoption of the FLW Standard and to grow understanding of the problem and its impact.Lastly, the Sustainability Accounting Standards Board (SASB) was founded in 2011 as an independent standard-setting organization. The SASB issues and maintains sustainability accounting standards for 79 industries, focusing on the subset of industry-specific sustainability factors that are reasonably likely to have material financial impacts on companies within that industry. Companies can use the standards to disclose material information to investors in SEC filings, including Forms 10-K, 20-F, and 8-K, as well as S-1 and S-3, in a cost-effective and decision-useful manner. The standards are designed to help companies better comply with existing disclosure obligations, working within the framework of existing U.S. securities laws.SASB includes accounting metrics for food waste management (which also observes food loss) targeted at the food retailers and distributors industry.
ATNI uses the definition of the Food and Agriculture Organization of the United Nations (FAO) for food loss and food waste. Food loss consists of “all the food produced for human consumption that is not eaten by humans”. Food waste is “considered to be a part of food loss and is understood as food intended for human consumption being discarded or left to spoil as a result of decisions taken by actors along the food supply chain”. Food loss and food waste happen at different stages of the food chain and are caused by different driving forces. (For more information, see: www.fao.org/3/ca1397en/CA1397EN.pdf)
Disclosure
5 Does the company publicly disclose: (Tick all that apply) Formal accountability arrangement for implementing the company’s nutrition strategy and / or program (indicator 1.1)
Compensation arrangements related to implementing the company’s nutrition strategy and / or program (indicator 1.2)
6 Does the company publicly disclose: (indicator 3) The process and / or results of its audit or management review
7 Does the company publicly disclose the FLW tracking and prevention tools it has implemented? (indicator 4)
Yes, comprehensively
Yes, in part
No
No informationUnde
r em
barg
o

39Global Access to Nutrition Index 2021
A3 Quality of reporting
Performance only
Reporting on nutrition
1 1.1. Does the company publish formal, regular reports on its overall approach to tackling nutrition issues and how often?
Yes, annually (i.e. the company has an annual reporting cycle)
Yes, but less frequently than annually
No reporting
Additional information: The report or document may be part of a CSR, sustainability or annual report; it does not have to be a separate report. In order to be considered for this indicator, the reports need to be disclosed publicly.
1.2. In what kind of publication and how does the company report on its nutrition activities?
Throughout the Annual Report and Accounts or equivalent, highlighting how nutrition issues are adding value to the business
Within its Annual Report and Accounts or equivalent, e.g. in the sustainability or corporate responsibility section
In a separate report (e.g. website) on its nutrition activities but does not mention nutrition issues its Annual Report and Accounts or equivalent
No reporting
Additional information: -
2 2.1. Does the company’s reporting on preventing and tackling obesity and diet-related diseases include: (Tick all that apply)
A clear sense of the company’s nutrition strategy and how it relates to overall business strategy
Clear reporting on current performance against all objectives and targets
A clear outlook on future plans and targets
Explanation of the challenges faced, not only success / positive stories
Information about the impact of its efforts, in terms of those reached
Additional information: -
2.2. Does the company’s reporting on preventing and tackling undernutrition and/or micronutrient deficiencies include: (Tick all that apply)
A clear sense of the company’s strategy and how it relates to overall business strategy
Clear reporting on current performance against all objectives and targets
A clear outlook on future plans and targets
Explanation of the challenges faced, not only success / positive stories
Information about the impact of its efforts, in terms of those reached
Not applicable
Additional information: -
Unde
r em
barg
o

40Global Access to Nutrition Index 2021
A3 Quality of reporting
3 Geographical scope of nutrition reporting
3.1 What is the geographical scope of the company’s nutrition reporting?
Reporting covers global operations
Reporting only covers major markets
No reporting
Additional information: -
3.2 Does the company make specific reference to different markets in the published periodic reports?
For several major national markets
For 1-2 national markets only
No additional reporting
Additional information: -
External verification of reported data
4 Is the company’s nutrition reporting subject to verification or external review?
The report that contains the nutrition commentary is independently verified
Report not formally verified but includes commentary from independent external reviewer(s)
No or limited external review
Additional information: Documents must be publicly available.
Unde
r em
barg
o

41Global Access to Nutrition Index 2021
Section 2 — Formulating and delivering appropriate, affordable, accessible products
Category B – Formulating appropriate products
Companies can help consumers make healthier choices by improving the nutritional quality of foods made available to them. This Category firstly assesses the nutrition quality of a substantial part of all food and beverage products companies sell globally through the Product Profile using Health Star Rating (HSR). Secondly, it addresses companies’ efforts through research and development (R&D), new product formulation and reformulation of existing products. Lastly, Category B assesses the quality of the nutrient profiling system (NPS) or model that a company may use to guide its product formulation efforts. This Category consists of three Criteria:
B1 Product Profile results (20%)B2 Product formulation (7.5%) B3 Defining healthy and appropriate products (7.5%) This Category carries 35% of the weight of the overall score Corporate Profile methodology.
B1 Product Profile results
Performance
Scores imported from the Product Profile
1(NEW)
Assessment of the overall healthiness of the product portfolio, measured as the sales-weighted mean HSR score: [value between 0 and 100]
i. This value is calculated in the Product Profile (PP) and imported in this indicator (company input is obtained during the data gathering phase of the PP).
2(NEW)
Assessment of the companies’ performance within product categories, relative to competition, measured as the mean within-product category score: [value between 0 and 100]
i. This value is calculated in the PP and imported in this indicator (company input is obtained during the data gathering phase of the PP).
3 (NEW)
Assessment of the change in product portfolio healthiness compared with the 2018 Product Profile: [value between 0 and 100]
i. This value is calculated in the PP and imported in this indicator (company input is obtained during the data gathering phase of the PP).
B2 Product formulation
Commitment
Nutrient formulation and reformulation targets
1 Salt / sodium targets
Additional information: The WHO Member States in WHA 66.10 have agreed on a voluntary global NCD target for a 30% relative reduction in mean population intake of salt, with the aim of achieving a target of less than 5 g per day (approximately 2 g sodium) by 2025.
1.1 Has the company set a target to reduce levels or achieve lower stated levels of salt/sodium and, if so, in how many products or categories?
The company has set a target to reduce levels of salt / sodium in all relevant products / categories
The company has set a target to reduce levels of salt / sodium in some relevant products / categories
No salt reduction target
No information
Not applicable (explain)
Unde
r em
barg
o

42GLOBAL Access to Nutrition Index 2021
B2 Product formulation
1.2 Baseline and target year: (Tick all that apply) The company has defined a specific and measurable (quantifiable) target
The target encompasses either objective nutrition criteria or limits (sets limits per g / ml / kcal or specifies a (mean) target value), or relative reduction criteria with full specification of the baseline value
The target is time-bound
The target is externally verifiable (does not rely on company-internal definitions or information for verification)
2 Trans fat targets
Additional information: WHO recommends that the amount of industrial trans-fat (iTFA) in products does not exceed 2 g of iTFA per 100 g fat / oil globally by 2023 (https://www.who.int/news-room/detail/07-05-2019-who-welcomes-industry-action-to-align-with-global-trans-fat-elimination-targets).
2.1 Has the company set a target to eliminate or reduce industrially-produced trans-fat in accordance with WHO guidance?
Target aligns with WHO recommendation to eliminate industrially-produced trans fat in all relevant products/categories
Target aligns with WHO recommendation to eliminate industrially-produced trans fat in some relevant products/ categories
Target does not align with WHO recommendation
No trans-fat reduction target
No information
Not applicable (explain)
2.2 Baseline and target year: (Tick all that apply) The company has defined a specific and measurable (quantifiable) target
The target encompasses objective criteria or limits based on percentage of energy or weight
The target is time-bound
The target is externally verifiable (does not rely on company-internal definitions or information for verification)
3 Saturated fats targets
Additional information: -
3.1 Has the company set a target to reduce levels or achieve lower stated levels of saturated fats and, if so, in how many products or categories?
The company has set a target to reduce / reach lower levels of saturated fats for all relevant products / sub-categories
The company has set a target to reduce / reach lower levels of saturated fats for some relevant products / sub-categories
No saturated fat reduction target
No information
Not applicable (explain)
3.2 Baseline and target year: (Tick all that apply) The company has defined a specific and measurable (quantifiable) target
The target encompasses either objective nutrition criteria or limits (sets limits per g / ml / kcal or specifies a (mean) target value), or relative reduction criteria with full specification of the baseline value
The target is time-bound
The target is externally verifiable (does not rely on company-internal definitions or information for verification)Un
der e
mba
rgo
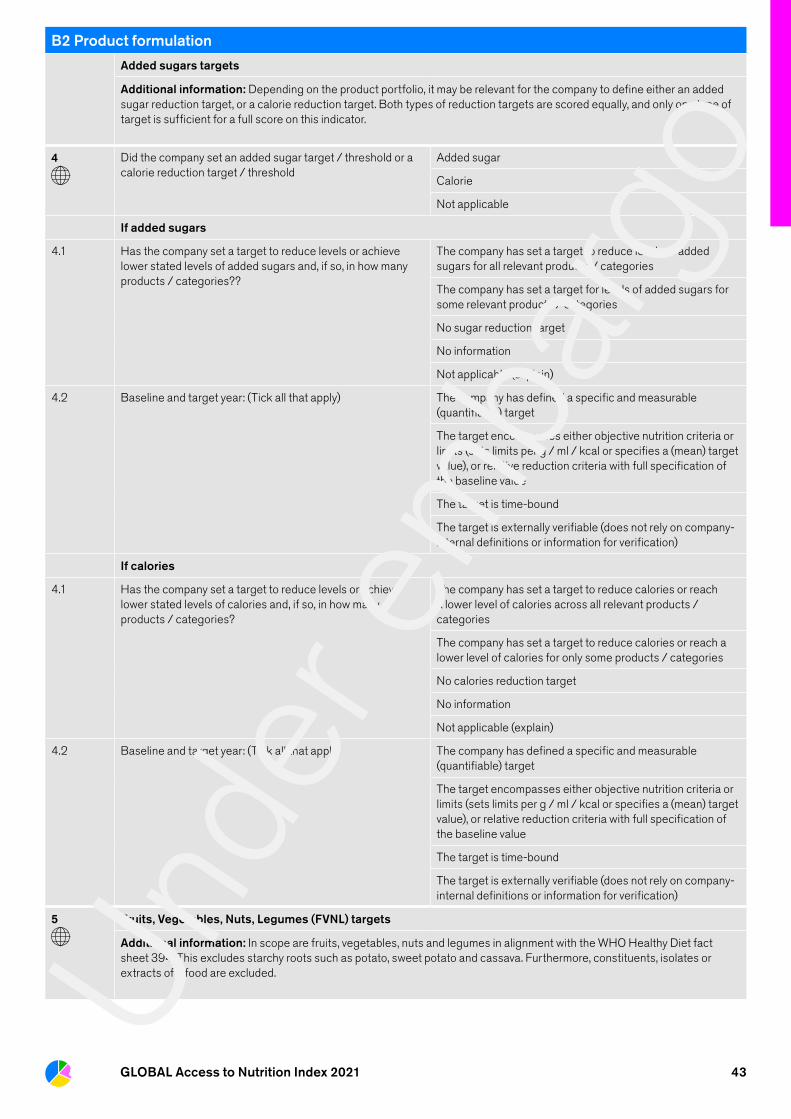
43GLOBAL Access to Nutrition Index 2021
B2 Product formulation
Added sugars targets
Additional information: Depending on the product portfolio, it may be relevant for the company to define either an added sugar reduction target, or a calorie reduction target. Both types of reduction targets are scored equally, and only one type of target is sufficient for a full score on this indicator.
4 Did the company set an added sugar target / threshold or a calorie reduction target / threshold
Added sugar
Calorie
Not applicable
If added sugars
4.1 Has the company set a target to reduce levels or achieve lower stated levels of added sugars and, if so, in how many products / categories??
The company has set a target to reduce levels of added sugars for all relevant products / categories
The company has set a target for levels of added sugars for some relevant products / categories
No sugar reduction target
No information
Not applicable (explain)
4.2 Baseline and target year: (Tick all that apply) The company has defined a specific and measurable (quantifiable) target
The target encompasses either objective nutrition criteria or limits (sets limits per g / ml / kcal or specifies a (mean) target value), or relative reduction criteria with full specification of the baseline value
The target is time-bound
The target is externally verifiable (does not rely on company-internal definitions or information for verification)
If calories
4.1 Has the company set a target to reduce levels or achieve lower stated levels of calories and, if so, in how many products / categories?
The company has set a target to reduce calories or reach a lower level of calories across all relevant products / categories
The company has set a target to reduce calories or reach a lower level of calories for only some products / categories
No calories reduction target
No information
Not applicable (explain)
4.2 Baseline and target year: (Tick all that apply) The company has defined a specific and measurable (quantifiable) target
The target encompasses either objective nutrition criteria or limits (sets limits per g / ml / kcal or specifies a (mean) target value), or relative reduction criteria with full specification of the baseline value
The target is time-bound
The target is externally verifiable (does not rely on company-internal definitions or information for verification)
5 Fruits, Vegetables, Nuts, Legumes (FVNL) targets
Additional information: In scope are fruits, vegetables, nuts and legumes in alignment with the WHO Healthy Diet fact sheet 394. This excludes starchy roots such as potato, sweet potato and cassava. Furthermore, constituents, isolates or extracts of a food are excluded. Un
der e
mba
rgo

44GLOBAL Access to Nutrition Index 2021
B2 Product formulation
5.1 Has the company set a target to increase levels or achieve higher stated levels of fruits, vegetables, nuts, and legumes and, of so, in how many products or categories?
The company has set a target to increase levels of FVNL in all relevant products / categories
The company has set a target to increase levels of FVNL in some relevant products / categories
No FVNL increase target
No information
Not applicable (explain)
5.2 Baseline and target year: (Tick all that apply) The company has defined a specific and measurable (quantifiable) target
The target encompasses either objective nutrition criteria or goals (sets goals per g / ml/ kcal or specifies a (mean) target value), or relative criteria to increase FVNL with full specification of the baseline value
The target is time-bound
The target is externally verifiable (does not rely on company-internal definitions or information for verification)
6 Whole grains targets
Additional information: -
6.1 Has the company set a target to increase levels or achieve higher stated levels of whole grains and, if so, in how many products or categories?
The company has set a target to increase levels of whole grains in all relevant products / categories
The company has set a target to increase levels of whole grains in some relevant products / categories
No whole grains increase target
No information
Not applicable (explain)
6.2 Baseline and target year: (Tick all that apply) The company has defined a specific and measurable (quantifiable) target
The target encompasses either objective nutrition criteria or goals (sets goals per g / ml / kcal or specifies a (mean) target value), or relative criteria to increase whole grains with full specification of the baseline value
The target is time-bound
The target is externally verifiable (does not rely on company-internal definitions or information for verification)
Performance
Portion control
7 In the last 3 years, has the company invested in or developed products with smaller packaging sizes or serving sizes, aimed to improve consumer portion control?
Yes, across multiple products or product categories
Yes, limited to one type of product or product category
No
No information
Not applicable
Unde
r em
barg
o

45GLOBAL Access to Nutrition Index 2021
B2 Product formulation
8 In the last 3 years, has the company undertaken research to demonstrate the efficacy of its portion control efforts on consumer behavior?
Yes, with evidence of efficacy (improvement of portion control)
Yes, without evidence of efficacy
No
No information
Not applicable
Additional information: This indicator applies to selected product categories that typically have a high sugar or energy content and low ‘beneficial’ nutrient density (confectionery, carbonated drinks, juice, sports and energy drinks, Asian specialty drinks, savory snacks, ice creams).
R&D investment to improve nutrition
9 Does the company provide evidence of investment in research or new technologies that enables the development or improvement of products aimed at addressing the specific needs of priority populations, including undernutrition where relevant?
Yes
No
No information
Additional information: This indicator focuses on R&D investments that enables the development or improvement of products aimed at addressing priority populations, rather than the development of the products themselves. Relevant examples include research into: milder processing to retain more nutritional value in processed foods; (micro)nutrient deficiencies and bioavailability; new ways to do (bio)fortification; improved (refrigerated) distribution or packaging in low-resource settings to improve shelf life of fortified products.
Developing and selling products specifically aimed at priority populations
10 As part of its approach to addressing the needs of priority populations, has the company developed specific products in the last 3 years aimed at as the following age groups or other population groups: (Tick all that apply)
Women of childbearing age
Children between 6 and 36 months (complementary foods only)
Children between 3 and 5 years
Children over 5 years
Elderly
Other population groups (specify)
Not applicable
Additional information: Many factors or determinants can be relevant for the identification of priority populations (see A1 indicator 2 for more extensive information), as defined by public health authorities. This indicator focuses on age or life stages and how these relate to a high risk or burden of malnutrition compared to the general population. The indicator assesses whether companies address such age groups in their wider strategy to addressing the specific nutritional needs of priority populations with a focus on the formulation of products, for example by developing specifically formulated and / or fortified products that address nutritional deficiencies in undernourished populations or populations that are at particular risk.
The focus of this indicator is on the R&D effort related to developing new products or improving existing products. Therefore, companies are not scored for having products on the market for longer than 3 years.
ATNI defines ‘women of childbearing age’ as women aged 15 to 49 years old, in line with WHO terms. Moreover, ‘elderly’ refers to individuals with a chronological age (i.e. years since birth) of 65 years and above.
Finally, it is essential that companies that make products marketed as suitable for children between 6 and 36 months of age abide by the WHO International Code of Marketing of Breast-milk Substitutes and subsequent World Health Assembly resolutions (including WHA 69.9). Hence, companies that generate significant sales from Breast-milk Substitutes and / or Complementary Foods for this age group are also assessed against the ATNI’s BMS /CF 1 Corporate Profile methodology. However, as stated above, this indicator only focuses on products manufactured to address specific nutritional needs within these age groups (i.e. not all products aimed at children 6 — 36 months will be considered). Finally, ‘Complementary Foods’ are defined as commercially produced food or beverage products that are specifically marketed as suitable for feeding children up to 36 months of age (WHO, 2017. Guidance on Ending the Inappropriate Promotion of Foods for Infants and Young Children: Implementation Manual).Un
der e
mba
rgo

46GLOBAL Access to Nutrition Index 2021
B2 Product formulation
Improving access to nutrition by reducing food loss / waste in production
11 Can the company provide examples of measures taken to improve the food supply chain efficiency in order to reduce food loss / waste? (Tick all that apply)
During processing / manufacturing
During distribution
Indirectly during states of agricultural production, post-harvest handling and storage, and during consumption
Additional information: The food supply chain stages are: agricultural production, post-harvest handling and storage, processing, distribution and consumption.
Reducing FLW is an important sustainability goal that links closely with access to nutrition, undernutrition and the right to food. ATNI uses the definition of the FAO for food loss and food waste. Food loss consists of “all the food produced for human consumption that is not eaten by humans”. Food waste is “considered to be a part of food loss and is understood as food intended for human consumption being discarded or left to spoil as a result of decisions taken by actors along the food supply chain”. Food loss and food waste happen at different stages of the food chain and are caused by different driving forces. (For more information, see: www.fao.org/3/ca1397en/CA1397EN.pdf and additional info provided under A1 indicator 4.2)
Under this indicator, ATNI considers companies’ measures tackling food loss and waste prevention connected to their commercial activity (philanthropic initiatives will not be considered). As the focus of Criterion B2 is on product composition and reformulation, the focus is on early stages of the food supply chain, but production, packaging, distribution and other factors may also impact FLW in later stages of the food supply chain).
Disclosure
12 Does the company publicly disclose: (Tick all that apply) A commentary on investments made in research or other business areas to develop products aimed at priority populations (indicator 9)
A commentary on products developed for the specific age groups referred to in indicator 10, or other priority population groups (indicator 10)
Information about company’s ‘healthy’ products
13 13.1. Does the company publicly disclose the percentage of the company’s ‘healthy’ products (according to company’s definition of healthy) as part of the total global product portfolio by the end of FY 2019?
Yes
No
Additional information: -
13.2. Does the company publicly disclose the total number, or the change in percentage, of the number of new healthy products (according to company’s definition of healthy) introduced in the last 3 years:
Yes
No
Additional information: -
Disclosure related to products that meet company targets
14 Does the company publicly disclose: (tick all that apply) Its sodium / salt target
The percentage of all relevant products (by number or volume) that met its sodium / salt target by FY 2019
15 If assessed on added sugars:Does the company publicly disclose: (tick all that apply)?
Its sugar target
The percentage of all relevant products (by number or volume) that met its sugar target by FY 2019
If assessed on calories:Does the company publicly disclose: (tick all that apply)
Its calorie target
The percentage of all relevant products (by number or volume) that met its calorie target by FY 2019
16 Does the company publicly disclose: (tick all that apply) Its saturated fat target
The percentage of all relevant products (by number or volume) that met its saturated fat target by FY 2019 Un
der e
mba
rgo
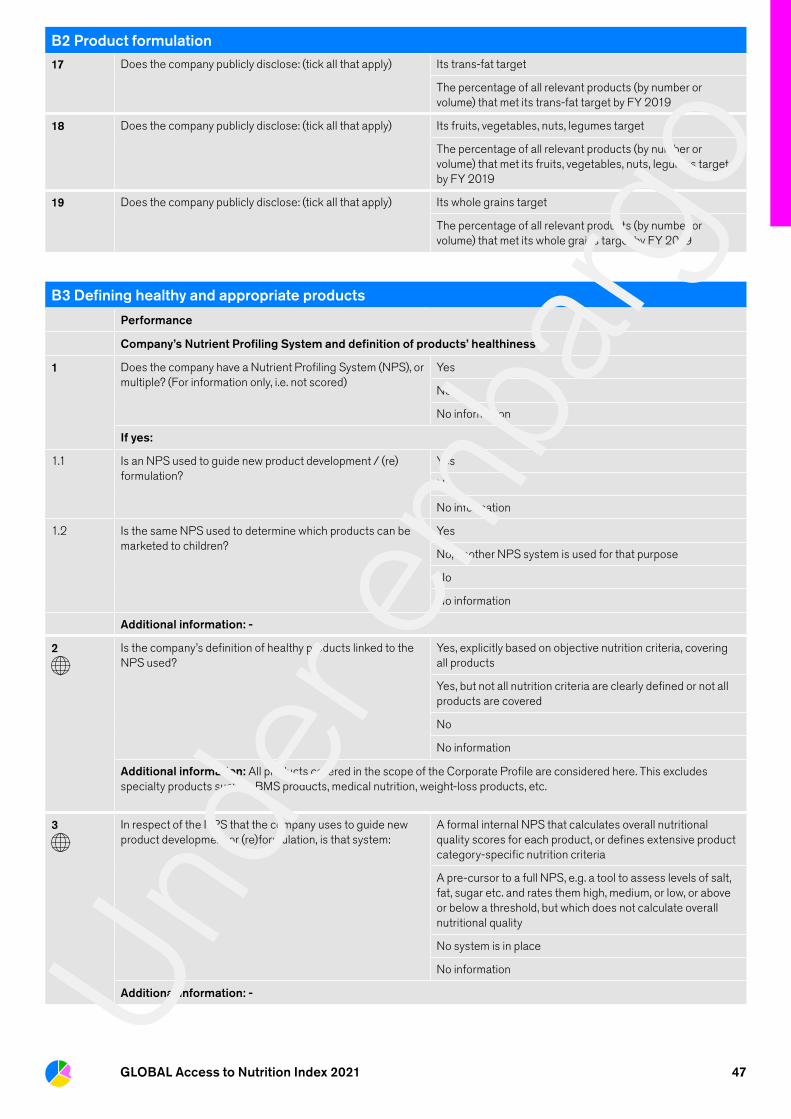
47GLOBAL Access to Nutrition Index 2021
B2 Product formulation
17 Does the company publicly disclose: (tick all that apply) Its trans-fat target
The percentage of all relevant products (by number or volume) that met its trans-fat target by FY 2019
18 Does the company publicly disclose: (tick all that apply) Its fruits, vegetables, nuts, legumes target
The percentage of all relevant products (by number or volume) that met its fruits, vegetables, nuts, legumes target by FY 2019
19 Does the company publicly disclose: (tick all that apply) Its whole grains target
The percentage of all relevant products (by number or volume) that met its whole grains target by FY 2019
B3 Defining healthy and appropriate products
Performance
Company’s Nutrient Profiling System and definition of products’ healthiness
1 Does the company have a Nutrient Profiling System (NPS), or multiple? (For information only, i.e. not scored)
Yes
No
No information
If yes:
1.1 Is an NPS used to guide new product development / (re)formulation?
Yes
No
No information
1.2 Is the same NPS used to determine which products can be marketed to children?
Yes
No, another NPS system is used for that purpose
No
No information
Additional information: -
2 Is the company’s definition of healthy products linked to the NPS used?
Yes, explicitly based on objective nutrition criteria, covering all products
Yes, but not all nutrition criteria are clearly defined or not all products are covered
No
No information
Additional information: All products covered in the scope of the Corporate Profile are considered here. This excludes specialty products such as BMS products, medical nutrition, weight-loss products, etc.
3 In respect of the NPS that the company uses to guide new product development or (re)formulation, is that system:
A formal internal NPS that calculates overall nutritional quality scores for each product, or defines extensive product category-specific nutrition criteria
A pre-cursor to a full NPS, e.g. a tool to assess levels of salt, fat, sugar etc. and rates them high, medium, or low, or above or below a threshold, but which does not calculate overall nutritional quality
No system is in place
No information
Additional information: -Unde
r em
barg
o

48GLOBAL Access to Nutrition Index 2021
B3 Defining healthy and appropriate products
4 Does the company provide evidence that its definition of healthy products or products that meet its nutrition criteria, aligns with external benchmarks?
4.1. Tick the answer option that applies: Its definition of healthy products corresponds with the HSR* >=3.5 definition of healthy (smaller than 10% deviation in estimated percentage of healthy products)
Its definition of healthy products is benchmarked by the company to external standards but the deviation with HSR* >=3.5 criterion is larger than 10%
Its definition of healthy products is NOT benchmarked to external standards
No information
4.2. Tick the answer option that applies: For products marketed to children, its nutrition criteria correspond with regional WHO criteria for marketing to children or the percentage deviation of products meeting both criteria is smaller than 10%
For products marketed to children, its nutrition criteria do NOT correspond with regional WHO criteria for marketing to children or the percentage deviation of products meeting both criteria exceeds 10%
No information
Additional information: *As an alternative to benchmarking ‘healthy products’ to the Health Star Rating system using the >=3.5 threshold, other government-endorsed systems may be benchmarked against to obtain a score in this indicator. Benchmarking against the Nutri-Score NPS, considering all A and B products as healthy, is considered equivalent. For benchmarking against other government-endorsed systems the answer option ‘Its definition of healthy products is benchmarked by the company to external standards but the deviation with HSR* >=3.5 criterion is larger than 10%’ will be selected if a healthy threshold (equivalent) cannot be determined.
Regional Nutrient Profile Models to implement recommendations on the marketing of foods and non-alcoholic beverages to children have been defined by the World Health Organization for all regions (except for Africa as of 22 August 2019, but the publication of that model is pending). Links to descriptions of those models can be found here: https://www.who.int/nutrition/reg_offices/en/.
For this indicator, only two answer options can be selected — one of the first three options and one of the remaining two options. In case companies commit to not market any products to children, the relevant answer option is ‘Its nutrition criteria correspond with regional WHO criteria for marketing to children or the percentage deviation of products meeting the both criteria is smaller than 10%’
Products covered under the company’s NPS
5 Which products and categories are covered by the company’s NPS?
All products and product categories
Some products and product categories
No products and categories (no NPS)
No information
Additional information: -
6 What types of food components does the company’s NPS assess?
Both positive and negative food components
Negative food components only
None (no NPS)
No information
Not applicable
Additional information: If a company explicitly applies the WHO regional models or other government-endorsed models as its NPS and which does not include positive food components, ‘not applicable’ should be selected, to avoid a sub-optimal assessment. Please note that for a company’s own NPS, which may be based on WHO or other guidelines, this does not apply.Un
der e
mba
rgo
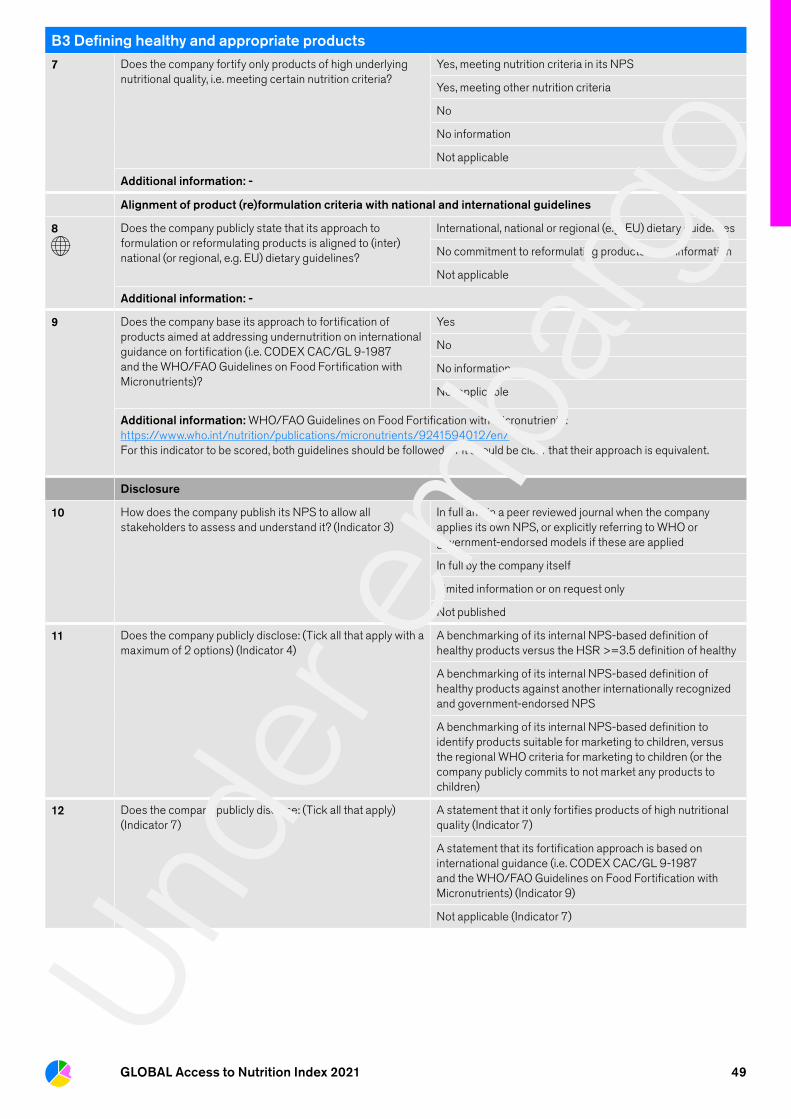
49GLOBAL Access to Nutrition Index 2021
B3 Defining healthy and appropriate products
7 Does the company fortify only products of high underlying nutritional quality, i.e. meeting certain nutrition criteria?
Yes, meeting nutrition criteria in its NPS
Yes, meeting other nutrition criteria
No
No information
Not applicable
Additional information: -
Alignment of product (re)formulation criteria with national and international guidelines
8 Does the company publicly state that its approach to formulation or reformulating products is aligned to (inter)national (or regional, e.g. EU) dietary guidelines?
International, national or regional (e.g. EU) dietary guidelines
No commitment to reformulating products or no information
Not applicable
Additional information: -
9 Does the company base its approach to fortification of products aimed at addressing undernutrition on international guidance on fortification (i.e. CODEX CAC/GL 9-1987 and the WHO/FAO Guidelines on Food Fortification with Micronutrients)?
Yes
No
No information
Not applicable
Additional information: WHO/FAO Guidelines on Food Fortification with Micronutrients: https://www.who.int/nutrition/publications/micronutrients/9241594012/en/For this indicator to be scored, both guidelines should be followed, or it should be clear that their approach is equivalent.
Disclosure
10 How does the company publish its NPS to allow all stakeholders to assess and understand it? (Indicator 3)
In full and in a peer reviewed journal when the company applies its own NPS, or explicitly referring to WHO or government-endorsed models if these are applied
In full by the company itself
Limited information or on request only
Not published
11 Does the company publicly disclose: (Tick all that apply with a maximum of 2 options) (Indicator 4)
A benchmarking of its internal NPS-based definition of healthy products versus the HSR >=3.5 definition of healthy
A benchmarking of its internal NPS-based definition of healthy products against another internationally recognized and government-endorsed NPS
A benchmarking of its internal NPS-based definition to identify products suitable for marketing to children, versus the regional WHO criteria for marketing to children (or the company publicly commits to not market any products to children)
12 Does the company publicly disclose: (Tick all that apply) (Indicator 7)
A statement that it only fortifies products of high nutritional quality (Indicator 7)
A statement that its fortification approach is based on international guidance (i.e. CODEX CAC/GL 9-1987 and the WHO/FAO Guidelines on Food Fortification with Micronutrients) (Indicator 9)
Not applicable (Indicator 7)
Unde
r em
barg
o

50Global Access to Nutrition Index 2021
Category C – Delivering affordable, accessible products
Producing healthier options is necessary but insufficient to improve consumer access to nutritious foods and beverages. Consumers also need to have access to these products. Companies should offer nutritious options at competitive prices and distribute them widely to offer consumers a ‘level playing field’ between healthy and less healthy options. This Category assesses companies’ efforts to make their healthy products more accessible through their approaches to pricing and distribution. It consists of two Criteria:
C1 Product pricingC2 Product distribution This Category carries 15% of the weight of the overall score Corporate Profile methodology.
C1 Product pricing
Commitment
Improving affordability of healthy products and products addressing micronutrient deficiencies
1
1.1. Has the company made a public commitment to address the affordability of its healthy products for the general consumer and for priority populations accounting for low-income groups in the last 3 years?
Clear commitment made for whole business, with particular reference to low-income populations
Clear commitment made for whole business, without particular reference to low-income populations
Broad commitment with particular reference to low-income populations
Broad commitment without particular reference to low-income populations
No commitment
No information
Additional information: Clear commitment means a public statement in a policy or other document setting out how the company will ensure affordability, consider it when developing new products, in all key decisions re. placement, distribution etc. The commitment should specifically address the affordability of healthy products, e.g. relative to other products or referring specifically to products meeting the company’s healthy criteria. A general commitment to address or improve the affordability of all products is not sufficient to be credited. The company’s own definition of healthy products is considered relevant for this indicator, and throughout Criterion C1. Portion-limited products that do not otherwise meet healthy standards are not considered relevant as healthy products for this indicator and category overall (in general, products or product categories such as confectionery, sugary drinks or ice cream are not considered as healthy products unless there is a specific reason to make an exception).
1.2. Has it committed to addressing in its commercial activities the affordability of healthy products designed to address micronutrient deficiencies in priority populations?
Yes
No
No information
Not applicable
Unde
r em
barg
o

51GLOBAL Access to Nutrition Index 2021
C1 Product pricing
Additional information: For appropriate guidance on fortification schemes, ATNI recommends following the WHO/FAO Guidelines on Food Fortification with Micronutrients: https://www.who.int/nutrition/publications/micronutrients/9241594012/en/
It is important to address the affordability of fortified or otherwise appropriate products, designed to address micronutrient deficiencies in priority populations, as these groups often have a low income and corresponding spending power.
To indicate populations that are at (high) risk of or experiencing malnutrition in all its forms, including undernutrition, micronutrient deficiencies, obesity and diet-related diseases, ATNI uses the overarching term ‘priority populations’. More specifically, ATNI defines priority populations as ‘those groups that are at (high) risk of or suffering from any form of malnutrition (including undernutrition or any other deficiency, excess or imbalance in a person’s intake of energy and / or nutrients), and for which intervention may be reasonably considered to have a substantial impact at the population level.’
Under Category C, ATNI specifically observes the following determinants or factors to identify population groups suffering from or at risk of nutrition-related health inequities:
• Socioeconomic factors such as income, which in turn lead to an increased burden of nutrition-related illness or increased risk for adverse nutrition-related health outcome(s) such as micronutrient deficiencies; and
• Geographical factors (i.e. remote access to supermarkets or food distribution centers), which are physical barriers in accessing nutrition.
2
2.1. Does the company have a clear strategy, and one or more quantitative targets, to specifically improve the affordability of healthy products?
Yes, it has defined a clear strategy AND one or more targets
Yes, it has defined a clear strategy OR one or more targets
No clear strategy and / or targets
No information
Additional information: Specifically improving the affordability of healthy products may be done by explicitly focusing on products that meet the company’s healthy standard (related to nutrition criteria in its NPS), or by addressing affordability of healthy products relative to products not meeting healthy standards.
Targets considered for scoring regarding healthy products may include examples such as:
• Number of consumers to reach with affordably priced healthy products by set date
• Number of units or sales value target for affordably priced healthy products by set date
• Achieve a particular price point for healthy products
• Narrow the price differential on healthy vs. less healthy products
• Targets set with particular reference to low-income groups
2.2. Does the company have a clear strategy, and one or more quantitative targets, to improve the affordability of healthy products aiming to address micronutrient deficiencies in priority populations?
Yes, it has defined a clear strategy AND one or more targets
Yes, it has defined a clear strategy OR one or more targets
No clear strategy and / or targets
No information
Not applicable
Additional information: Targets considered for scoring regarding products addressing micronutrient deficiencies may include these examples:
• Number of consumers to reach with affordably priced healthy products aiming to address micronutrient deficiencies by set date;
• Number of units or sales value target for affordably priced healthy products aiming to address micronutrient deficiencies by set date;
• Achieve a particular price point for healthy products aiming to address micronutrient deficiencies;
• Narrow the price differential on fortified vs non-fortified products;
• Targets set with particular reference to low-income groups, which may include providing smaller packages of healthy fortified foods to lower the price point of single purchase units.
Unde
r em
barg
o

52GLOBAL Access to Nutrition Index 2021
C1 Product pricing
Performance
Commercial strategies to improve affordability
3
Has the company done a comprehensive analysis on appropriate pricing of products that meet its healthy standard for the general consumer and for priority populations (i.e. low-income groups) in the last 3 years?
Yes, with specific attention to low-income groups
Yes, without specific attention to low-income groups
No analysis on appropriate pricing has been conducted
No information
Additional information: The pricing analysis should specifically address healthy products, e.g. relative to other products. A general analysis of pricing of all products is not sufficient to be credited. Portion-limited products that do not otherwise meet healthy standards are not considered relevant for this indicator and category overall.
4
Does the company provide evidence that it has specifically offered discounts, price promotions or coupons on its healthy products?
Yes, with specific attention to low-income groups
Yes, without specific attention to low-income groups
No evidence provided
No information
Additional information: Specifically offering discounts, price promotions or coupons on its healthy products may be done by explicitly focusing on products that meet the company’s healthy standard (related to nutrition criteria in its NPS), or by addressing affordability of healthy products relative to products not meeting healthy standards.
5
Does the company provide evidence or examples of improving affordability of healthy products that address micronutrient deficiencies in priority populations?
Yes
No evidence provided
No information
Not applicable
Additional information: Please specify the strategy used to make healthy products that address micronutrient deficiencies more affordable, e.g. reduced / set pricing of these products, reduced package sizes, etc.
Note: information regarding fortified products not meeting the company’s healthy standard will not be considered under this indicator.
Disclosure
6 Does the company publicly disclose: (Indicator 2.1)
Clear strategy and / or targets to improve the affordability of healthy products relative to products not meeting healthy standards
Does the company publicly disclose:(Indicator 2.2)
Clear strategy and / or targets to improve the affordability of products aiming to address micronutrient deficiencies in priority populations
Not applicable
7 Does the company publicly disclose: (Tick all that apply) Commentary on or examples of improving the affordability of healthy options in general or for low-income populations (indicator 4)
Commentary on or examples of improving affordability of healthy products that address micronutrient deficiencies (indicator 5)
Unde
r em
barg
o

53GLOBAL Access to Nutrition Index 2021
C2 Product distribution
Commitment
Improving physical accessibility of healthy products and products addressing micronutrient deficiencies
1
1.1. Has the company made a public commitment to address the physical accessibility of its healthy products for the general consumer and for priority populations accounting for geographical access?
Clear commitment made for whole business, with particular reference to populations with limited access to nutritious food (i.e. living in food deserts)
Clear commitment made for whole business without particular reference to populations with limited access to nutritious food (i.e. living in food deserts)
Broad commitment with particular reference to populations with limited access to nutritious food (i.e. living in food deserts)
Broad commitment without particular reference to populations with limited access to nutritious food (i.e. living in food deserts)
No commitment
No information
Additional information: Clear commitment means a formal, public statement in a policy or other document setting out how the company will ensure physical accessibility and consider it when developing new products, as well as in all key decisions re. placement, distribution etc. The commitment should specifically address the physical accessibility of healthy products, e.g. relative to other products or referring specifically to products meeting the company’s healthy criteria. A general commitment to address or improve the accessibility of all products is not sufficient to be credited. The company’s own definition of healthy products is considered relevant for this indicator, and throughout Criterion C2. Portion-limited products that do not otherwise meet healthy standards are not considered relevant as healthy products for this indicator and category overall (in general, products or product categories such as confectionery, sugary drinks or ice cream are not considered as healthy products unless there is a specific reason to make an exception). Note: A food desert is an area (either an urban or suburban area, or an isolated rural area) which offers limited access to affordable and nutritious food (especially fresh produce). Usually food deserts are populated by low purchasing-power groups with limited mobility, which makes them less attractive consumers to large supermarkets. Therefore, available food options are often limited to processed foods high in sugar, fat and salt, which if not consumed in moderation can contribute to obesity and diet-related diseases.
1.2. Has it committed to addressing in its commercial activities the physical accessibility of healthy products designed to address micronutrient deficiencies in priority populations?
Yes
No
No information
Not applicable
Additional information: It is important to address the physical accessibility of fortified or otherwise appropriate products, designed to address micronutrient deficiencies in priority populations.
To indicate populations that are at (high) risk of or experiencing malnutrition in all its forms, including undernutrition, micronutrient deficiencies, obesity and diet-related diseases, ATNI uses the overarching term ‘priority populations’. More specifically, ATNI defines priority populations as ‘those groups that are at (high) risk of or suffering from any form of malnutrition (including undernutrition or any other deficiency, excess or imbalance in a person’s intake of energy and/or nutrients), and for which intervention may be reasonably considered to have a substantial impact at the population level.’
Under Category C, ATNI specifically observes the following determinants or factors to identify population groups suffering from or at risk of nutrition-related health inequities:
• Socioeconomic factors such as income, which in turn lead to an increased burden of nutrition-related illness or increased risk for adverse nutrition-related health outcome(s) such as micronutrient deficiencies; and
• Geographical factors (i.e. remote access to supermarkets or food distribution centers), which are physical barriers in accessing nutrition.
Unde
r em
barg
o

54GLOBAL Access to Nutrition Index 2021
C2 Product distribution
2
2.1. Does the company have a clear strategy, and one or more quantitative targets, to specifically improve the physical accessibility of healthy products?
Yes, it has defined a clear strategy AND one or more targets
Yes, it has defined a clear strategy OR one or more targets
No clear strategy and / or targets
No information
Additional information: Specifically improving the physical accessibility of healthy products may be done by explicitly focusing on products that meet the company’s healthy standard (related to nutrition criteria in its NPS), or by addressing the physical accessibility of healthy products relative to products not meeting healthy standards.
Targets considered for scoring regarding healthy products may include examples such as:
• Number of new consumers of healthy products to reach through improved distribution;
• Number of priority populations with limited access to nutritious food to reach with healthy and appropriate products through improved distribution;
• Number of units or sales value targets for healthy products related to extended distribution;
• Number of new retail partners to achieve extended accessibility goals;
• Number of consumers to reach with healthy products through improved distribution in ‘food deserts’;
• Investment plans on improving accessibility of healthy products.
2.2. Does the company have a clear strategy, and one or more quantitative targets, to improve the physical accessibility of healthy products designed to address micronutrient deficiencies in priority populations?
Yes, it has a defined clear strategy AND one or more targets
Yes, it has defined a clear strategy OR one or more targets
No clear strategy and / or targets
No information
Not applicable
Additional information: Targets considered for scoring regarding products addressing micronutrient deficiencies may include:
• Number of new consumers to reach through improved distribution of healthy products aiming to address micronutrient deficiencies;
• Number of groups experiencing or at high-risk of malnutrition to reach with healthy products aiming to address micronutrient deficiencies through improved distribution;
• Number of units or sales value targets for healthy products aiming to address micronutrient deficiencies with extended distribution;
• Number of new retail partners to achieve extended accessibility goals;
• Number of consumers to reach with healthy products aiming to address micronutrient deficiencies through improved distribution in ‘food deserts’;
• Investment plans on improving accessibility of healthy products aiming to address micronutrient deficiencies.
Performance
Strategies to improve the physical accessibility of healthy products and appropriate products
3
Has the company conducted analysis on how to improve the physical accessibility of healthy products for the general consumer and for priority populations accounting for geographical access?
Yes, with specific attention to populations with limited access to nutritious food (i.e. living in food deserts)
Yes, without specific attention to populations with limited access to nutritious food (i.e. living in food deserts)
No analysis on physical accessibility has been conducted
No information
Additional information: This indicator assesses whether areas that lack access to healthy products (i.e. food deserts) are covered in the company’s accessibility strategy related to healthy products.
Examples that can be considered for scoring include:
• Arrangements / incentives with retailers for prominent shelf positions for its healthy products on a regular basis (not a one-off);
• Arrangements / incentives with distributors re. how healthy products are distributed;
• Data to demonstrate that rural retailers are provided with healthy options as standard;
• Data to demonstrate that retailers in poor urban areas are provided with healthy options as standard;
• Other examples.Unde
r em
barg
o

55GLOBAL Access to Nutrition Index 2021
C2 Product distribution
4
Does the company provide evidence of specifically improving the physical accessibility of its healthy products?
Yes, with specific attention to populations with limited access to nutritious food (i.e. living in food deserts)
Yes, without specific attention to populations with limited access to nutritious food (i.e. living in food deserts)
No evidence of physical accessibility has been provided
No information
Not applicable
Additional information: Specifically improving the physical accessibility of its healthy products may be done by explicitly focusing on products that meet the company’s healthy standard (related to nutrition criteria in its NPS), or by addressing the physical accessibility of healthy products relative to products not meeting healthy standards.
Examples that can be considered for scoring include:
• Arrangements / incentives with retailers for prominent shelf positions for its healthy products on a regular basis (not a one-off);
• Arrangements / incentives with distributors re. how healthy products are distributed;
• Data to demonstrate that rural retailers are provided with healthy options as standard;
• Data to demonstrate that retailers in poor urban areas are provided with healthy options as standard;
• Other examples.
5
5.1. Does the company provide evidence or examples of improving physical accessibility of healthy products that address undernutrition and micronutrient deficiencies through commercial activities?
Yes
No
No information
Not applicable
Additional information: Examples that can be considered for scoring include:
• Arrangements / incentives with retailers for prominent shelf positions for its healthy products on a regular basis (not a one-off);
• Arrangements / incentives with distributors re. how healthy products are distributed;
• Data to demonstrate that rural retailers are provided with healthy options as standard;
• Data to demonstrate that retailers in poor urban areas are provided with healthy options as standard;
• Other examples.
Note: information regarding fortified products not meeting the company’s healthy standard will not be considered under this indicator.
5.2. [Supplemental score] Does the company provide evidence or examples of improving the physical accessibility of healthy products that address undernutrition and micronutrient deficiencies, through non-commercial activities? (Tick all that apply)
Yes, providing products to be distributed to undernourished groups
Yes, providing products to school feeding programs
Yes, by using its distribution systems to deliver micronutrient powders, supplements, etc.
Yes, by otherwise supporting programs designed to address undernutrition to reach target groups with appropriate products
Not applicable
Additional information: Non-commercial or philanthropic activities include product donations or providing other types of contributions on a philanthropic basis. Product sales, including at reduced prices or related to governmental programs, should be assessed as commercial activities in indicator 5.1.
Note: information regarding fortified products not meeting the company’s healthy standard will not be considered under this indicator.
Unde
r em
barg
o
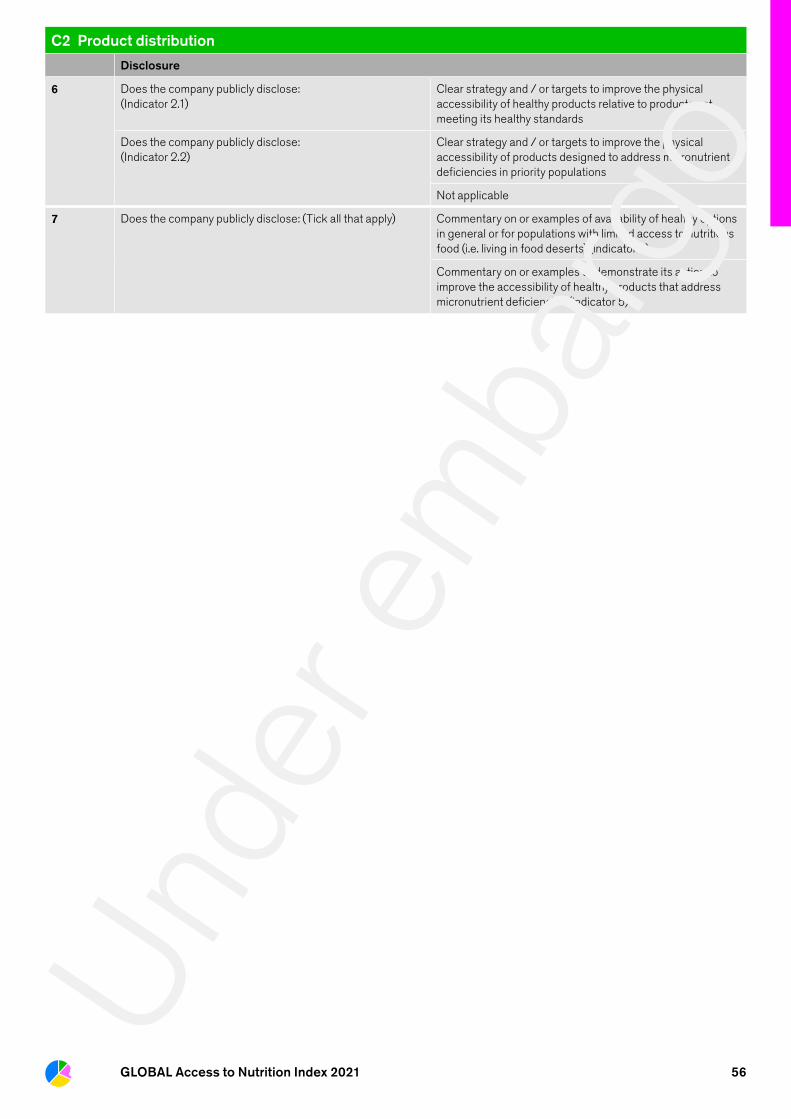
56GLOBAL Access to Nutrition Index 2021
C2 Product distribution
Disclosure
6 Does the company publicly disclose: (Indicator 2.1)
Clear strategy and / or targets to improve the physical accessibility of healthy products relative to products not meeting its healthy standards
Does the company publicly disclose:(Indicator 2.2)
Clear strategy and / or targets to improve the physical accessibility of products designed to address micronutrient deficiencies in priority populations
Not applicable
7 Does the company publicly disclose: (Tick all that apply) Commentary on or examples of availability of healthy options in general or for populations with limited access to nutritious food (i.e. living in food deserts) (indicator 4)
Commentary on or examples to demonstrate its action to improve the accessibility of healthy products that address micronutrient deficiencies (indicator 5)
Unde
r em
barg
o
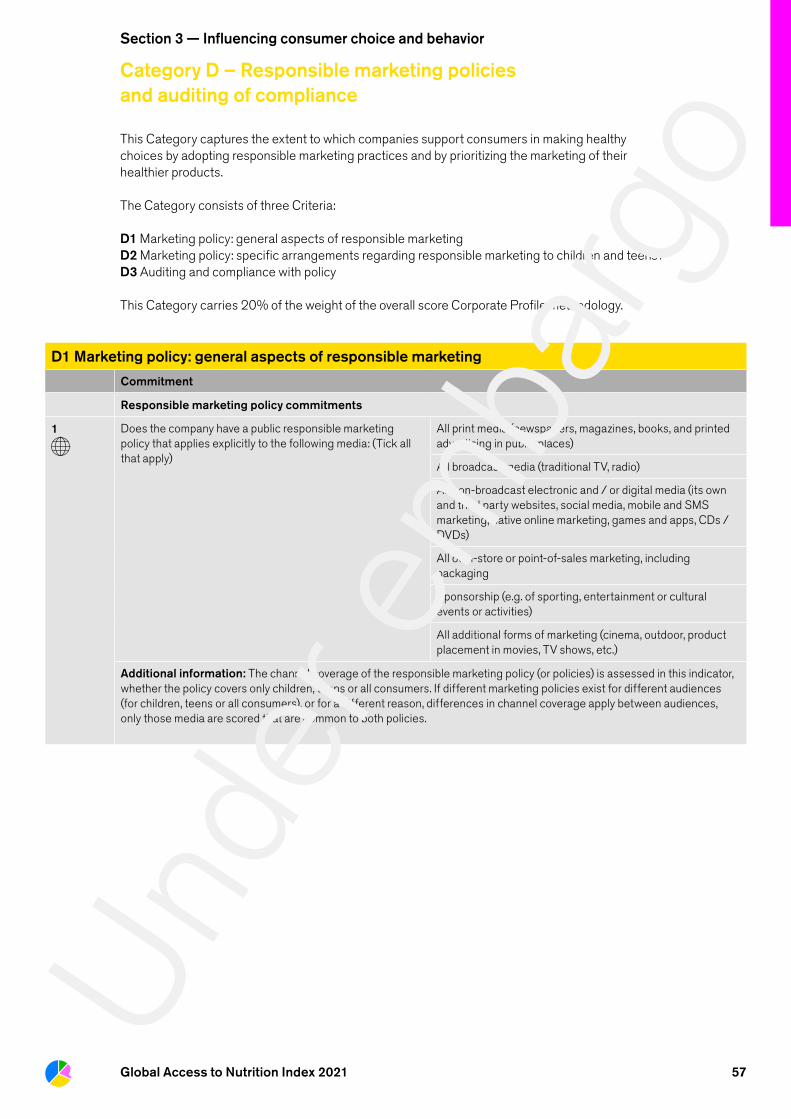
57Global Access to Nutrition Index 2021
Section 3 — Influencing consumer choice and behavior
Category D – Responsible marketing policiesand auditing of compliance
This Category captures the extent to which companies support consumers in making healthy choices by adopting responsible marketing practices and by prioritizing the marketing of their healthier products. The Category consists of three Criteria:
D1 Marketing policy: general aspects of responsible marketingD2 Marketing policy: specific arrangements regarding responsible marketing to children and teens1 D3 Auditing and compliance with policy This Category carries 20% of the weight of the overall score Corporate Profile methodology.
1 ATNI recognizes that teens are to be considered as children, as they are also covered by the United Nations Convention on the Rights of the Child (Article 1 states that “For the purposes of the […] Convention, a child means every human being below the age of eighteen years unless under the law applicable to the child, majority is attained earlier.”). However, in order to allow distinction between marketing practices addressed at different age groups below eighteen, in this Category ‘children’ is used to refer to individuals aged 12 years and under, whereas ‘teens’ means those individuals aged 13 — 17 years, in line with the definition provided by the ICC Advertising and Marketing Communications Code, 2018 (p.8).
D1 Marketing policy: general aspects of responsible marketing
Commitment
Responsible marketing policy commitments
1 Does the company have a public responsible marketing policy that applies explicitly to the following media: (Tick all that apply)
All print media (newspapers, magazines, books, and printed advertising in public places)
All broadcast media (traditional TV, radio)
All non-broadcast electronic and / or digital media (its own and third party websites, social media, mobile and SMS marketing, native online marketing, games and apps, CDs / DVDs)
All of in-store or point-of-sales marketing, including packaging
Sponsorship (e.g. of sporting, entertainment or cultural events or activities)
All additional forms of marketing (cinema, outdoor, product placement in movies, TV shows, etc.)
Additional information: The channel coverage of the responsible marketing policy (or policies) is assessed in this indicator, whether the policy covers only children, teens or all consumers. If different marketing policies exist for different audiences (for children, teens or all consumers), or for a different reason, differences in channel coverage apply between audiences, only those media are scored that are common to both policies.
Unde
r em
barg
o

58GLOBAL Access to Nutrition Index 2021
D1 Marketing policy: general aspects of responsible marketing
2 Does the company’s public responsible marketing policy include the following commitments related to the representation of products? (Tick all that apply)
Commits to presenting products in the appropriate portion size and context (and not to condone or encourage excess consumption) (Article 1 of ICC**)
All nutritional and health benefit information and claims for food and beverage products should have a sound scientific basis (Art. 9**). And where claims or terminology used in marketing communications might reasonably be interpreted by a consumer as health or nutrition claims, they should be supportable with appropriate scientific evidence (Article 4 of ICC**)
Commits that copy, sound and visual presentations in marketing communications for food and beverage products should accurately represent the material characteristics of the product featured, such as taste, size, content nutrition or health benefits, and should not mislead consumers concerning any of those characteristics (Article 5 of ICC**)
Commits not to represent food products not intended to be substitutes for meals as such (Article 5 of ICC**)
Commits not to use consumer taste or preference tests in a way that might imply statistical validity if there is none. Testimonials are based on well-accepted and recognized opinion from experts (Article 9 of ICC**)
Commits not to undermine the concept of healthy, balanced diets, or the importance of a healthy, active lifestyle (Article 17 of ICC**)
Commits not to use any models with a BMI of under 18.5 (industry best practice)
Commits to presenting products in the context of a balanced diet (industry best practice)
Additional information: Disclosure needs to be mandatory, therefore the policy needs to be public for the company to score.**International Chamber of Commerce Framework for Responsible Food and Beverage Marketing Communications, 2019, sets forth how general principles of the ICC Advertising and Marketing Communications Code, 2018, which governs all marketing communications, and includes separate sections on sales promotion, sponsorship, direct marketing, digital interactive marketing and environmental marketing, is applied in the context of food and beverage marketing communications. For more information, see: https://cms.iccwbo.org/content/uploads/sites/3/2018/09/icc-advertising-and-marketing-communications-code-int.pdf and https://iccwbo.org/content/uploads/sites/3/2019/08/icc-framework-for-responsible-food-and-beverage-marketing-communications-2019.pdf
3 For transparency in its marketing activities, does the company commit: (Tick all that apply)
To clearly display the company or brand name when advertising on virtual media
To ensure that the true commercial purpose of marketing communications is transparent and recognizable as an advertisement; and to clearly differentiate, by labelling, advertising and content on virtual media, including so-called ‘native advertising’ (Art. 7, ICC Advertising and Marketing Communications Code, 2018)
Additional information: According to Article 7 ICC Advertising and Marketing Communications Code, 2018, “a communication promoting the sale of a product should not be disguised as, for example, market research, consumer surveys, user-generated content, private blogs, private postings on social media or independent reviews.”
Assessment of marketing practices to reach priority populations
Unde
r em
barg
o

59GLOBAL Access to Nutrition Index 2021
D1 Marketing policy: general aspects of responsible marketing
4 Does the company make an explicit commitment to developing and delivering marketing strategies appropriate to reaching priority populations, in all countries in which it operates?
Yes
No
No information
Not applicable
Additional information: For companies that are active in developing countries, reaching priority populations with a high burden of undernutrition and micronutrient deficiencies is an essential element of the company’s commitment in order to be credited. However, even when considered a priority population group, marketing directly to children should not be considered under this indicator — as marketing policies aimed at children are to be considered in Criterion D2.
Performance
5
Can the company provide evidence of taking steps to understand and reach priority populations, with appropriate products through tailored marketing? (Tick all that apply)
Has done research to generate consumer and marketing insights relating to priority populations
Has used multiple communication channels and worked with professionals in the communications field (creative agencies, behavioral specialists) to ensure communication is compelling and appropriate to drive desired behavior change of priority populations
Has conducted evaluations to assess the implementation of the specific marketing measures aimed at priority populations
Not applicable
Additional information: For companies that are active in low- and middle-income countries, reaching priority populations with a high burden of undernutrition and micronutrient deficiencies is an essential element of the company’s commitment in order to be credited. It is important that products for priority populations are healthy and, if fortified, fortified according to the appropriate guidelines. For this reason, the healthy multiplier is applied in this indicator, as it is based on the assessment in Criterion B3, which addresses both the elements related to (definition of) healthiness and fortification approach.
Disclosure
6 Does the company publicly disclose: (Tick all that apply) Commitment to clearly distinguishing marketing messages from other content (indicator 3)
Commitment to developing and delivering marketing strategies for healthy and / or appropriate products, appropriate to reaching priority populations (indicator 4)
Unde
r em
barg
o
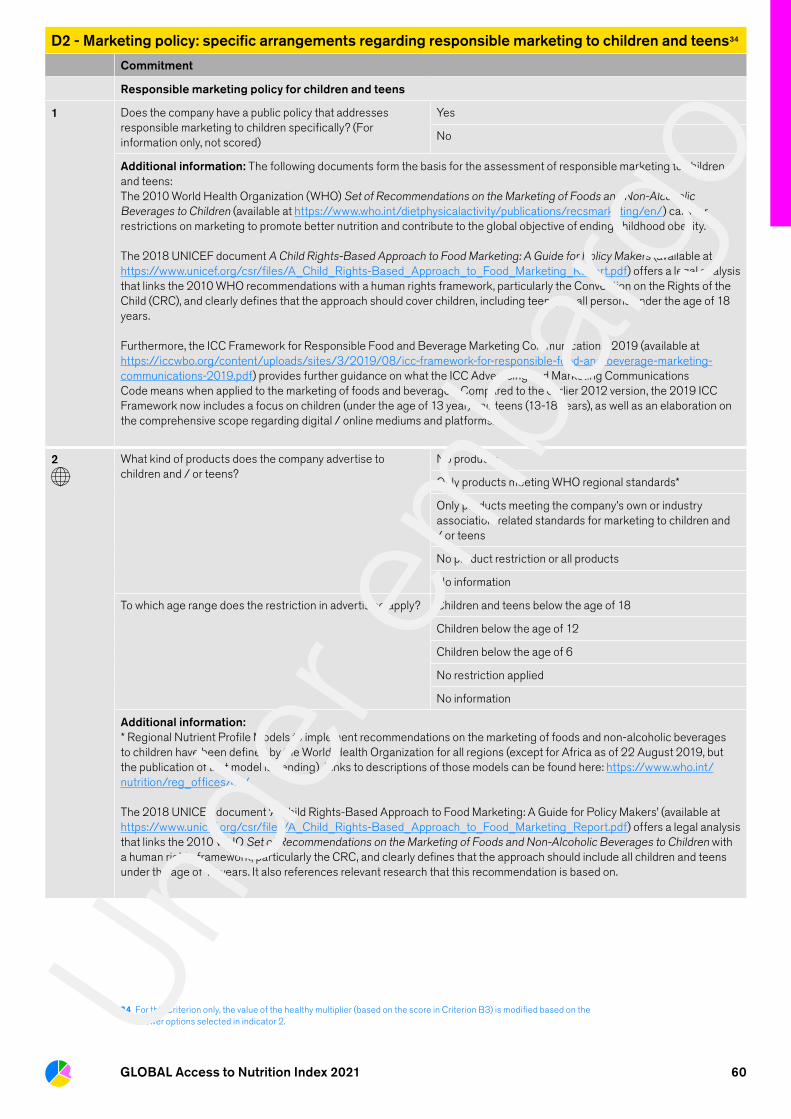
60GLOBAL Access to Nutrition Index 2021
D2 - Marketing policy: specific arrangements regarding responsible marketing to children and teens34
Commitment
Responsible marketing policy for children and teens
1 Does the company have a public policy that addresses responsible marketing to children specifically? (For information only, not scored)
Yes
No
Additional information: The following documents form the basis for the assessment of responsible marketing to children and teens:The 2010 World Health Organization (WHO) Set of Recommendations on the Marketing of Foods and Non-Alcoholic Beverages to Children (available at https://www.who.int/dietphysicalactivity/publications/recsmarketing/en/) calls for restrictions on marketing to promote better nutrition and contribute to the global objective of ending childhood obesity.
The 2018 UNICEF document A Child Rights-Based Approach to Food Marketing: A Guide for Policy Makers (available at https://www.unicef.org/csr/files/A_Child_Rights-Based_Approach_to_Food_Marketing_Report.pdf) offers a legal analysis that links the 2010 WHO recommendations with a human rights framework, particularly the Convention on the Rights of the Child (CRC), and clearly defines that the approach should cover children, including teens, i.e. all persons under the age of 18 years.
Furthermore, the ICC Framework for Responsible Food and Beverage Marketing Communications, 2019 (available at https://iccwbo.org/content/uploads/sites/3/2019/08/icc-framework-for-responsible-food-and-beverage-marketing-communications-2019.pdf) provides further guidance on what the ICC Advertising and Marketing Communications Code means when applied to the marketing of foods and beverages. Compared to the earlier 2012 version, the 2019 ICC Framework now includes a focus on children (under the age of 13 year) and teens (13-18 years), as well as an elaboration on the comprehensive scope regarding digital / online mediums and platforms.
2 What kind of products does the company advertise to children and / or teens?
No products
Only products meeting WHO regional standards*
Only products meeting the company’s own or industry association-related standards for marketing to children and / or teens
No product restriction or all products
No information
To which age range does the restriction in advertising apply? Children and teens below the age of 18
Children below the age of 12
Children below the age of 6
No restriction applied
No information
Additional information: * Regional Nutrient Profile Models to implement recommendations on the marketing of foods and non-alcoholic beverages to children have been defined by the World Health Organization for all regions (except for Africa as of 22 August 2019, but the publication of that model is pending). Links to descriptions of those models can be found here: https://www.who.int/nutrition/reg_offices/en/
The 2018 UNICEF document ‘A Child Rights-Based Approach to Food Marketing: A Guide for Policy Makers’ (available at https://www.unicef.org/csr/files/A_Child_Rights-Based_Approach_to_Food_Marketing_Report.pdf) offers a legal analysis that links the 2010 WHO Set of Recommendations on the Marketing of Foods and Non-Alcoholic Beverages to Children with a human rights framework, particularly the CRC, and clearly defines that the approach should include all children and teens under the age of 18 years. It also references relevant research that this recommendation is based on.
34 For this Criterion only, the value of the healthy multiplier (based on the score in Criterion B3) is modified based on the answer options selected in indicator 2.Un
der e
mba
rgo

61GLOBAL Access to Nutrition Index 2021
D2 - Marketing policy: specific arrangements regarding responsible marketing to children and teens34
Marketing techniques and materials aimed at children and teens
3
Does the company commit to using responsible marketing techniques aimed at children and / or teens, by: (Tick all that apply)
Not to create a sense of urgency
Not to use inappropriate price minimization
Not to exploit a child’s imagination in a way that could mislead him / her about the nutritional benefits of the product involved
Supporting the role of parents or others responsible for guiding diet and lifestyle choices or not to undermine the role of parents or others responsible for guiding diet and lifestyle choices
Ensuring that marketing materials contain an educative message in relation to healthy diets and lifestyles
Not to brand merchandise aimed at children except related to healthy products
Additional information: The first three answer options relate directly to Article 18 of the ICC Framework for Responsible Food and Beverage Marketing Communications, 2019. This Article sets forth how general principles of the ICC Advertising and Marketing Communications Code, 2018, are applied in the context of food and beverage marketing communications. The principles of the ICC Advertising and Marketing Communications Code govern all marketing communications, and include separate sections on sales promotion, sponsorship, direct marketing, digital interactive marketing and environmental marketing. For more information, see: https://cms.iccwbo.org/content/uploads/sites/3/2018/09/icc-advertising-and-marketing-communications-code-int.pdf and https://iccwbo.org/content/uploads/sites/3/2019/08/icc-framework-for-responsible-food-and-beverage-marketing-communications-2019.pdf
Commitment by companies to ‘supporting the role of parents or others responsible for guiding diet and lifestyle choices or not to undermine the role of parents or other responsible for guiding diet and lifestyle choices (industry best practice)’ is consistent with the approach to the role of parents (section 3.4, page 46) of the 2018 UNICEF document A Child Rights-Based Approach to Food Marketing: A Guide for Policy Makers (available at https://www.unicef.org/csr/files/A_Child_Rights-Based_Approach_to_Food_Marketing_Report.pdf). In addition, it was included previously in the 2012 version of the ICC Framework for Responsible Food and Beverage Marketing Communications.
The last two answer options are industry best practices to ensure responsible marketing to children and / or teens.
4
Does the company commit to use children, celebrities (including influencers) or fantasy and animated characters responsibly or not at all? (Tick all that apply)
Commits not to sponsor people, materials or activities popular with children and / or teens at all or except in conjunction with healthy products
Commits to not depict children on packaging at all or except in conjunction with healthy products
Pledges not to use celebrities and other people with strong appeal to children and / or teens in marketing of products at all or except in conjunction with healthy products
Pledges that celebrities or others (including influencers), if used in marketing, will not imply they have achieved their enhanced performance or status through use of the product
Pledges not to use third-party nor own fantasy and animation characters with a strong appeal to children and/or teens in marketing of products at all or except in conjunction with healthy products, IN ALL FORMS OF MARKETING
Pledges not to use third-party nor own fantasy and animation characters with a strong appeal to children and/or teens in marketing of products at all or except in conjunction with healthy products, with an exception for point of sale and packaging
Additional information: For this indicator, the last two answer options are mutually exclusive, and therefore, only one of these two options may be selected.Un
der e
mba
rgo

62GLOBAL Access to Nutrition Index 2021
D2 - Marketing policy: specific arrangements regarding responsible marketing to children and teens34
5
Regarding responsible use of promotional toys, games, vouchers and competitions; does the company commit to:
Never make use of promotional games, toys, vouchers, competitions etc. in their marketing to children and / or teens
Using promotional games, toys, vouchers, competitions etc. only in accordance to WHO regional standards*
Using promotional games, toys, vouchers, competitions etc. only in accordance to the company’s own or industry association-related standards for marketing to children and / or teens
No commitment
No information
Additional information: * Regional Nutrient Profile Models to implement recommendations on the marketing of foods and non-alcoholic beverages to children have been defined by WHO for all regions (except for Africa as of 22 August 2019, but the publication of that model is pending). Links to descriptions of those models can be found here: https://www.who.int/nutrition/reg_offices/en/.
6 Marketing arrangements in relation to age thresholds
6.1 What percentage audience threshold does the company use to restrict its advertising on measured media to avoid inappropriately reaching children and / or teens?
<25%
26-35%
36-50%
>50%
No audience threshold
No information
Additional information: Measured media is where audience is audited, which is usually TV.
If different thresholds are used for different age ranges, the least strict threshold will be scored (representing the lowest score).
6.2 To which age range does the restriction in advertising apply? Children and teens below the age of 18
Children below the age of 12
Children below the age of 6
No restriction
No information
7 Digital marketing arrangements related to age thresholds
7.1
Does the company utilize tools to ensure that its digital marketing does not reach younger age groups? (Tick all that apply)
Ensuring design of websites / pages / social media / apps is appropriate to adults predominantly, i.e. not designed to attract children and / or teens
Age screening prior to logging on / registering (e.g. enter date of birth or require parent to consent)
Review of age-related data to determine demographic that is targeted by its digital marketing
Ensuring adverts are designed deliberately not to appeal to children and / or teens
Nature of third party websites chosen to advertise on (i.e. ages targeted)
Additional information: -
Unde
r em
barg
o

63GLOBAL Access to Nutrition Index 2021
D2 - Marketing policy: specific arrangements regarding responsible marketing to children and teens34
7.2
To which digital media and forms of marketing does the company apply the tools listed above?
All forms** and digital media, including own and third party digital media
Only own digital media or limited in another way
No separate consideration of how to address ‘child audience’ for these media
No information
Additional information: **Digital marketing techniques encompasses the insertion of advertising and other promotions in content that is accessible online and through digital devices. It includes specific types: native advertising, influencer marketing, advergames and immersive environments, branded environments, viral marketing, location targeting, sponsored search results, neuromarketing and sentiment analysis.
Marketing in or around schools and other educational centers, facilities and premises aimed at children and teens
8
To what extent does the company commit to a responsible marketing approach near and in PRIMARY schools (for children up to age 12)?
No marketing or advertising in or near PRIMARY schools
No marketing or advertising in PRIMARY schools
Only marketing / advertising ‘healthy’ products in (or near) PRIMARY schools in agreement with schools / parents
The company does not commit to this
No information
Additional information: This indicator refers to any formal school or schooling system that is attended by children up to age 12, however, in countries in which primary or elementary school is attended by children up to age 11, a responsible marketing commitment linked to primary or elementary schools will be credited for this indicator.
9
To what extent does the company commit to a responsible marketing approach near and in SECONDARY schools (for teens)?
No marketing or advertising in or near SECONDARY schools
No marketing or advertising in SECONDARY schools
Only marketing / advertising ‘healthy’ products in (or near) SECONDARY schools in agreement with schools / parents
The company does not commit to this
No information
Additional information: ‘Teens’ means those individuals aged 13-17 years (ICC 2018). This indicator is only credited for school-related commitments up to and including age 17. For example, U.S. middle school commitments, which typically include individuals up to age 13 or 14, are not considered relevant to be credited in this indicator.
10
Concerning the form and digital medium of advertisement in schools, does the company: (Tick all that apply)
Extend its commitment explicitly to new media marketing / advertising techniques in or related to schools
Include offering ‘educational materials’ only when in agreement with schools / parents in its commitment
Additional information: This indicator applies to commitments linked to primary and / or secondary schools.
11
To what extent does the company commit to a responsible marketing approach in other places where children gather (childcare and other educational establishments, family and child clinics, pediatric services or other health facilities, including sporting or cultural events held at those premises)?
No marketing or advertising in or near these settings
No marketing or advertising in these settings
Only marketing / advertising ‘healthy’ products in (or near) these settings in consultation with their management and users
No commitment
No information
Additional information: This indicator relates to Rec. 5, WHO recommendations on the Marketing of Food and Non-Alcoholic Beverages to Children, 2012.Un
der e
mba
rgo

64GLOBAL Access to Nutrition Index 2021
D2 - Marketing policy: specific arrangements regarding responsible marketing to children and teens34
Disclosure
12 Does the company publish its policy for marketing to children and / or teens in full or does it make the industry Pledge or Initiative that it follows publicly available?
Yes, policy or Pledge that is published in full
No or policy or Pledge is not published in full
D3 Auditing and compliance with policy
Performance
Auditing and compliance with policy: all consumers
1 Does the company audit its compliance with its policy, including on marketing to children?
Yes, covering all audiences, including children and / or teens
Yes, but only for children and / or teens
No audit
No information
Additional information: -
2 Assessment of compliance
2.1 How is compliance assessed regarding children and / or teens?
The company appoints an independent external auditor (not related to, or in addition to, an industry association-appointed third party auditor)
By an industry association or an industry association-appointed third party auditor
The company conducts its own audits
No audit
No information
Additional information: Although an industry association or pledge organization (e.g. International Food and Beverage Alliance, Children’s Food and Beverage Advertising Initiative, etc.) may appoint a third party auditor, the first answer option ‘the company appoints an independent external auditor’ is only credited if a company commissions additional independent auditing to complement industry association or pledge organization auditing, or if it commissions a comprehensive third party compliance audit on an individual basis.
2.2 Does the company assess compliance of all aspects of marketing (covering all audiences)?
Yes, to the same standards that it applies in assessing compliance regarding children and / or teens
Yes, but to less restrictive standards
No
No information
Additional information: -
3 How often is the audit undertaken? Annually, covering all audiences, including children and teens
Annually, covering children and / or teens only; and less frequently for other audiences
Less frequently than annually, for any audience covered by the audit
No
No information
Additional information: -
Unde
r em
barg
o

65GLOBAL Access to Nutrition Index 2021
D3 Auditing and compliance with policy
4 Which forms of advertisement and media (including both traditional and new media) are covered by the audit:
The company audits compliance across all media and in all its forms
The company audits compliance across main print, traditional and digital media, but with no specific reference to the forms of marketing used
The company audits compliance across limited selection of media is unclear but there is clear evidence of auditing
No audit
No information
Additional information: This indicator assesses the company’s level of transparency in its advertisement, in accordance with article 7 of new ICC Code 2018.
5 What is the company’s individual compliance level for TV and digital marketing? (%)
5.1 Individual compliance level for TV: Over 90%
Less than 90% or no reporting
No information
5.2 Individual compliance level for digital media: Over 90%
Less than 90% or no reporting
No information
Additional information (5.2): Individual compliance refers to company’s non-aggregated compliance level. Digital media refers to social networks i.e. Facebook, Twitter, blogs, YouTube, online newspapers.
6 Does the company have a response mechanism to ensure corrective measures are taken regarding any non-compliance with its marketing policy?
A response mechanism for corrective action, if needed
No response mechanism for corrective action
No information
Additional information: -
Disclosure
7 Does the company publicly disclose information about its audit (indicator 1)?
Yes
No
8 Disclosure of compliance levels
8.1 Does the company publicly disclose (indicator 5.1): Its individual compliance level for TV based on an audit of multiple markets
Its individual compliance level for TV based on an audit of single market only
Disclosure of only aggregate industry compliance level
8.2 Does the company publicly disclose (indicator 5.2): Its individual compliance level for digital media based on an audit of multiple markets
Its individual compliance level for digital media based on an audit of single market only
Disclosure of only aggregate industry compliance level
Unde
r em
barg
o
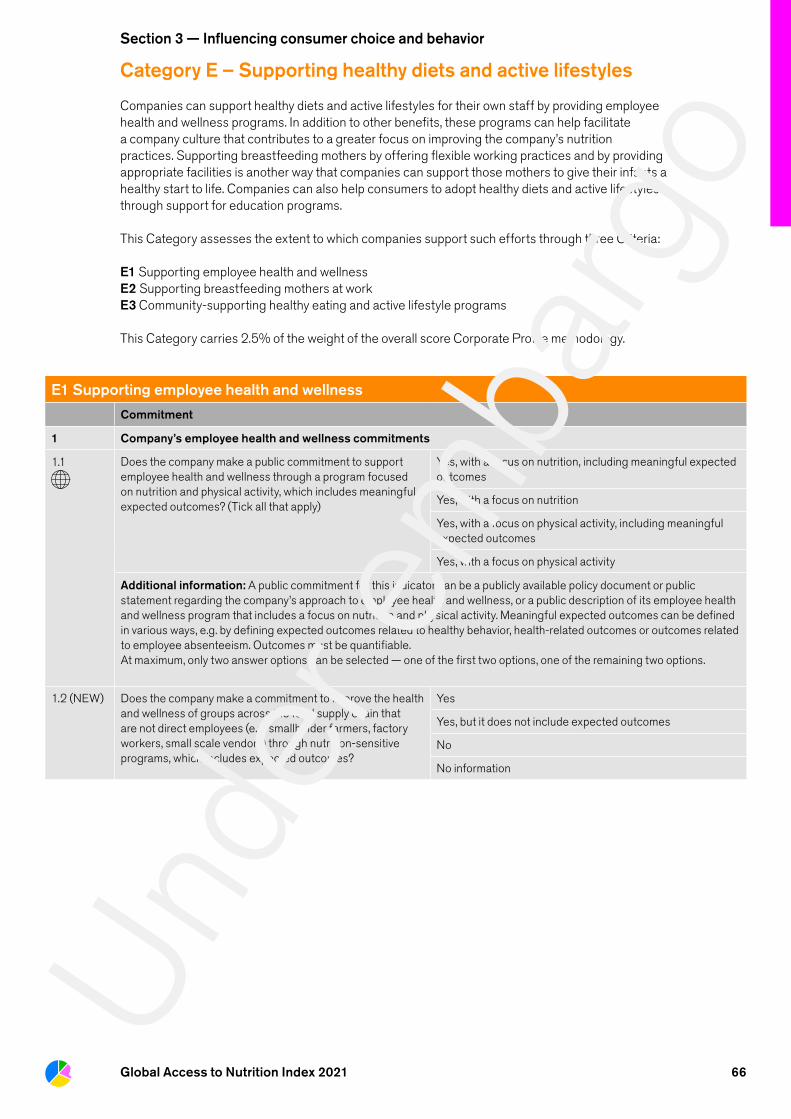
66Global Access to Nutrition Index 2021
Section 3 — Influencing consumer choice and behavior
Category E – Supporting healthy diets and active lifestyles
Companies can support healthy diets and active lifestyles for their own staff by providing employee health and wellness programs. In addition to other benefits, these programs can help facilitate a company culture that contributes to a greater focus on improving the company’s nutrition practices. Supporting breastfeeding mothers by offering flexible working practices and by providing appropriate facilities is another way that companies can support those mothers to give their infants a healthy start to life. Companies can also help consumers to adopt healthy diets and active lifestyles through support for education programs. This Category assesses the extent to which companies support such efforts through three Criteria:
E1 Supporting employee health and wellnessE2 Supporting breastfeeding mothers at work E3 Community-supporting healthy eating and active lifestyle programs This Category carries 2.5% of the weight of the overall score Corporate Profile methodology.
E1 Supporting employee health and wellness
Commitment
1 Company’s employee health and wellness commitments
1.1 Does the company make a public commitment to support employee health and wellness through a program focused on nutrition and physical activity, which includes meaningful expected outcomes? (Tick all that apply)
Yes, with a focus on nutrition, including meaningful expected outcomes
Yes, with a focus on nutrition
Yes, with a focus on physical activity, including meaningful expected outcomes
Yes, with a focus on physical activity
Additional information: A public commitment for this indicator can be a publicly available policy document or public statement regarding the company’s approach to employee health and wellness, or a public description of its employee health and wellness program that includes a focus on nutrition and physical activity. Meaningful expected outcomes can be defined in various ways, e.g. by defining expected outcomes related to healthy behavior, health-related outcomes or outcomes related to employee absenteeism. Outcomes must be quantifiable. At maximum, only two answer options can be selected — one of the first two options, one of the remaining two options.
1.2 (NEW) Does the company make a commitment to improve the health and wellness of groups across the food supply chain that are not direct employees (e.g. smallholder farmers, factory workers, small scale vendors) through nutrition-sensitive programs, which includes expected outcomes?
Yes
Yes, but it does not include expected outcomes
No
No information
Unde
r em
barg
o

67GLOBAL Access to Nutrition Index 2021
E1 Supporting employee health and wellness
Additional information: The programs may or may not include a focus on physical activity, but the indicator is assessed on the focus on nutrition, and in relation to the company’s own supply chain (i.e. programs addressed to actors in the supply chain that, while not being direct employees, are involved in the company’s product development).
In this regard, the OECD/FAO Guidance for Responsible Agricultural Supply Chains provides a framework of reference for the type of programs to be considered (i.e. it is not necessary for a company to commit to this Guidance in order to get a score in this indicator — this is assessed under Category G). This Guidance has been developed to help enterprises observe existing standards for responsible business conduct along agricultural supply chains. The Guidance targets all enterprises operating along agricultural supply chains, and covers several areas of risk arising along agricultural supply chains are addressed, inter alia, health and safety, and food security and nutrition. This way, it proposes a model enterprise policy outlining the content of existing standards for responsible agricultural supply chains and a five-step framework for due diligence describing the steps that enterprises should follow to identify, assess, mitigate and account for how they address the actual and potential adverse impacts associated with their activities or business relationships. Particularly in relation to food security and nutrition, the Guidance calls on private sector stakeholders to ensure that their operations contribute to food security and nutrition, and to give attention to enhancing the availability, accessibility, stability and utilization of safe, nutritious and diverse foods. To mitigate the risks associated with food and nutrition security problems in the supply chain, the Guidance suggests measures such as:
• To consider the impacts of operations on the availability and access to food, local employment, dietary preferences and stability of food supply;
• To identify food-related concerns of different stakeholders and evaluate strategies for meeting investment objectives while respecting the food-related concerns of different stakeholders, through consultations with relevant stakeholders;
• To consider contributing to improving access to food and the resilience and nutrition of local populations by: increasing the production of safe, nutritious and diverse foods and promoting the nutritional value of food and agricultural products; facilitating access to inputs, technology, and markets; generating employment (considering living wages) in downstream activities; or setting up community storage facilities to reduce postharvest losses and price volatility.
Performance
Categories of the company’s employee health and wellness program
2 Which of the following elements are included in the company’s program(s) across the whole company? Provide examples for each of the relevant options.
A. Policy or organization-level elements
B. Interpersonal or community-level elements
C. Individual elements
Unde
r em
barg
o

68GLOBAL Access to Nutrition Index 2021
E1 Supporting employee health and wellness
Additional information:Opportunities to support employee health and wellness are organized in terms of the Social Ecological Model (SEM). The SEM states that health is affected by lifestyle and behavior choices which are directly and indirectly influenced through different levels of the environment. The health and wellness elements are organized into three levels of environment with examples: (A) Policy and Organization-level (B), Interpersonal and Community-level and (C) Individual-level. [For further discussion of the Social Ecological Model, see Glanz, K., Rimer, B. K., & Viswanath, K. (Eds.). (2008). Health Behavior and Health Education: Theory, Research, and Practice (4th ed.). Jossey-Bass.]
Diet
A. Policy and Organization-level elements
• For staff awards for physical activity and healthy dietary choices
• Health focused orientation welcome pack
• On-site sports teams
• Gyms on work sites
• Availability and / or affordability of healthy options / diet plans in cafes, restaurants on work sites
• Dietary information on menus
• Subsidized fruit / healthy snacks
• No subsidies on chocolates, high sugar / fat / salt products
B. Interpersonal and Community-level elements
• Lunchtime / worktime walking or exercise clubs
• Active participation in sports challenges
• Seminars on nutrition, diets, etc.
• Cooking master classes focused on healthy options
• Nutrition campaigns regularly throughout work sites
• Physical activity campaigns regularly throughout work sites
• Encouragement to use stairs, not elevators, etc.
• Encouragement / facilities to walk / bike to work
• Links to local fresh food markets or similar
• Subsidies for gym memberships off site
C. Individual elements
• Newsletter highlighting recipes, employee stories of successes and challenges;
• Nutrition counseling or personalized nutrition with a registered dietitian to plan meals, read nutrition labels and learn money-saving tips at the supermarket;
• Work-life balance counseling for time management, planning for physical activity, stress management and coping skills with a certified counselor;
• Personalized exercise plans with a personal exercise trainer.
In case the company offers multiple programs or program variants in different locations or geographies, the common elements across those programs are scored in this indicator, aligned with the geographic multiplier that is applied.
3 Availability of the company’s health and wellness program
3.1 To whom is the company’s health and wellness program available (across the whole company and all operations)?
The program is available to all employees
The program is available to some employees
The company does not offer a health and wellness program
No information
Additional information: Note: this indicator assesses the health and wellness program(s) considered under indicator 2. The availability to employees and family members is assessed within the geographic scope of the program. However, the geographic scope of the program is considered under the geographic multiplier.
3.2 Is the company’s program also available for family members? The program is available to all employees’ family members
The program is available to some employees’ family members
The program is not available to family members
Additional information: -Unde
r em
barg
o

69GLOBAL Access to Nutrition Index 2021
E1 Supporting employee health and wellness
Assessment of the impact of the company’s health and wellness programs
4 Has the company evaluated the impact of the nutrition and physical activity elements of its health and wellness programs within the last three years?
Independent evaluations undertaken for at least one site (taking into account employee privacy and rights)
Company performed its own evaluations for at least one site (taking into account employee privacy and rights)
No evaluations
No information
Additional information: This indicator assesses the impact evaluation of employee health and wellness programs. It is mandatory for this indicator to be credited that the impact of the health and wellness program, which includes nutrition and physical activity elements, is evaluated at the group or program level. It is not sufficient to measure parameters on an individual level only (e.g. body weight, daily steps, blood parameters) without assessing the impact on the program level.
Disclosure
5 Does the company publicly disclose: (Tick all that apply) Commitment to support health and wellness of groups across the food supply chain beyond direct employees (indicator 1.2)
A description of the common elements that are included in the company’s program(s) across the whole company (indicator 2)
Statement on the availability of the health and wellness program to employees and / or family members (indicator 3)
6 Does the company disclose evaluations of any of the nutrition, diet and activity elements of its health and wellness program? (Indicator 4)
Full evaluation
Summary evaluation
No disclosure
No information
E2 Supporting breastfeeding mothers at work
Commitment
1 Does the company publicly commit to allowing parents to take paid parental leave, and to providing breastfeeding mothers with appropriate working conditions and facilities at work?
Formally commits to both granting paid parental leave, and to providing appropriate working conditions and facilities to facilitate breastfeeding
Has one formal commitment in place
The company makes at least one commitment, but has no formal policy
No commitment
No information
Additional information: -
Performance
Unde
r em
barg
o

70GLOBAL Access to Nutrition Index 2021
E2 Supporting breastfeeding mothers at work
2 Does the company’s parental policy allow parents to take paid parental leave?
26 weeks or more
Between 14 and 26 weeks
14 weeks, in line with International Labour Organization (ILO) recommendation
Between 8 and 14 weeks
No policy
No information
Additional information: Minimum legal requirements regarding paid parental leave vary widely between countries. According to Article 4(1) of ILO’s Maternity Protection Convention, “a woman to whom this Convention applies shall be entitled to a period of maternity leave of not less than 14 weeks.” (C183 — Maternity Protection Convention, 2000 (No. 183)). To optimally support mothers to breastfeed exclusively for the first six months according to WHO recommendations (see https://www.who.int/nutrition/topics/exclusive_breastfeeding/en/ for more information) paid leave of 26 weeks or more is recommended. Companies are encouraged to establish a policy that goes beyond legal minimums and which defines a minimum arrangement across the markets they operate in (of course allowing for longer paid leave where legally required).
3 Company’s provision of facilities to support breastfeeding mothers
3.1. Does the company:
Provide private, hygienic, safe rooms for expressing breastmilk?
Yes
No
No information
Provide fridges for storing expressed breastmilk? Yes
No
No information
Allow breastfeeding mothers breaks to express breastmilk? Yes
No
No information
Offer other functional or flexible working arrangements to support breastfeeding mothers?
Yes
No
No information
Additional information: Other functional arrangements include other facilities at the workplace to help mothers express and / or breastfeed.
3.2. (NEW) Does the company offer these facilities: In all its locations with 50 or more employees
In some of its locations
The company does not offer facilities to breastfeeding mothers
No information
Additional information: -
Disclosure
4 Does the company publicly disclose its policy on supporting breastfeeding mothers? (indicator 1)
Yes
No
5 Does the company publish a commentary about how it supports breastfeeding mothers within the workplace? (indicator 3)
Yes
No Unde
r em
barg
o

71GLOBAL Access to Nutrition Index 2021
E3 Community-supporting healthy eating and active lifestyle programs
Commitment
Company’s programs aimed at supporting consumers’ healthy lifestyles
1 1.1. For nutrition literacy and education, healthy diet-oriented, and active lifestyle programs, does the company:
Commit to, or demonstrate, that all programs exclude product or brand level branding
Commit to, or demonstrate, that some of its programs exclude product or brand-level branding
No
No information
1.2. For nutrition literacy and education, healthy diet-oriented, and active lifestyle programs, does the company:
Commit to, or demonstrate, that all programs are evidence-based and aligned with relevant national or international guidelines
Commit to, or demonstrate, that some of its programs are evidence-based and aligned with relevant national or international guidelines
No
No information
Additional information: Nutrition literacy may be defined as “the degree to which individuals have the capacity to obtain, process, and understand nutrition information and skills needed in order to make appropriate nutrition decisions.” (D Gibbs, et al., 2018).
In order for this indicator to be credited, a policy document or similar statement regarding the company’s approach to nutrition literacy and education, healthy diet-oriented, and active lifestyle programs is relevant but evidence (or a description) of all relevant programs about the branding approach, evidence base and / or alignment with national or international guidelines is accepted as well.
Performance
2 For nutrition education / nutrition literacy / healthy diet-oriented / active lifestyle programs, what types of programs does the company offer / sponsor / fund?
Only those designed by and / or (co)implemented with diverse stakeholder groups with relevant expertise
Evidence of some programs designed by or (co)implemented with stakeholder groups with relevant expertise
Only its own programs
No relevant information
Additional information: We credit both evidences based on implemented programs as well as a policy or strategy showing this is the case.
3 For nutrition education / nutrition literacy / healthy diet-oriented / active lifestyle programs that aim to reach priority populations, does the company support or fund programs that are adapted to the specific needs, background and level of nutrition literacy of these groups?
Yes, and these adapted programs have been designed by and / or (co)implemented with groups with relevant expertise and strong leadership in the process
Yes, and some of these adapted programs have been designed by and / or (co)implemented with groups with relevant expertise and strong leadership in the process
Company only offers own programs
No information
Not applicable (i.e. this indicator is not relevant as no priority populations are reached)
Additional information: -
Unde
r em
barg
o

72GLOBAL Access to Nutrition Index 2021
E3 Community-supporting healthy eating and active lifestyle programs
4 For nutrition education / nutrition literacy / healthy diet-oriented / active lifestyle programs, how does the company evaluate the outcomes of the programs?
All programs are evaluated by independent groups with relevant expertise (i.e. third party evaluation)
Some programs are evaluated by independent groups with relevant expertise (i.e. third party evaluation)
Evaluated by the company itself (i.e. first party or internal evaluation)
No evaluations are performed
No relevant information
Additional information: -
Disclosure
5 Does the company publicly disclose: (Tick all that apply) Document that sets out its policy on brand-level branding (indicator 1.1)
Commitment that its programs are evidence-based and aligned with relevant national or international guidelines (indicator 1.2)
6 Does the company publicly disclose: (Tick all that apply) A description of the nutrition education / nutrition literacy / healthy diet-oriented / active lifestyle programs (indicator 2)
A description of the nutrition education / nutrition literacy / healthy diet-oriented / active lifestyle programs aimed at reaching priority populations (indicator 3)
7 Does the company publicly disclose: (indicator 4) All the independent evaluations carried out for the programs it supports
Some of the independent evaluations carried out for the programs it supports
No relevant information about independent evaluations
Unde
r em
barg
o
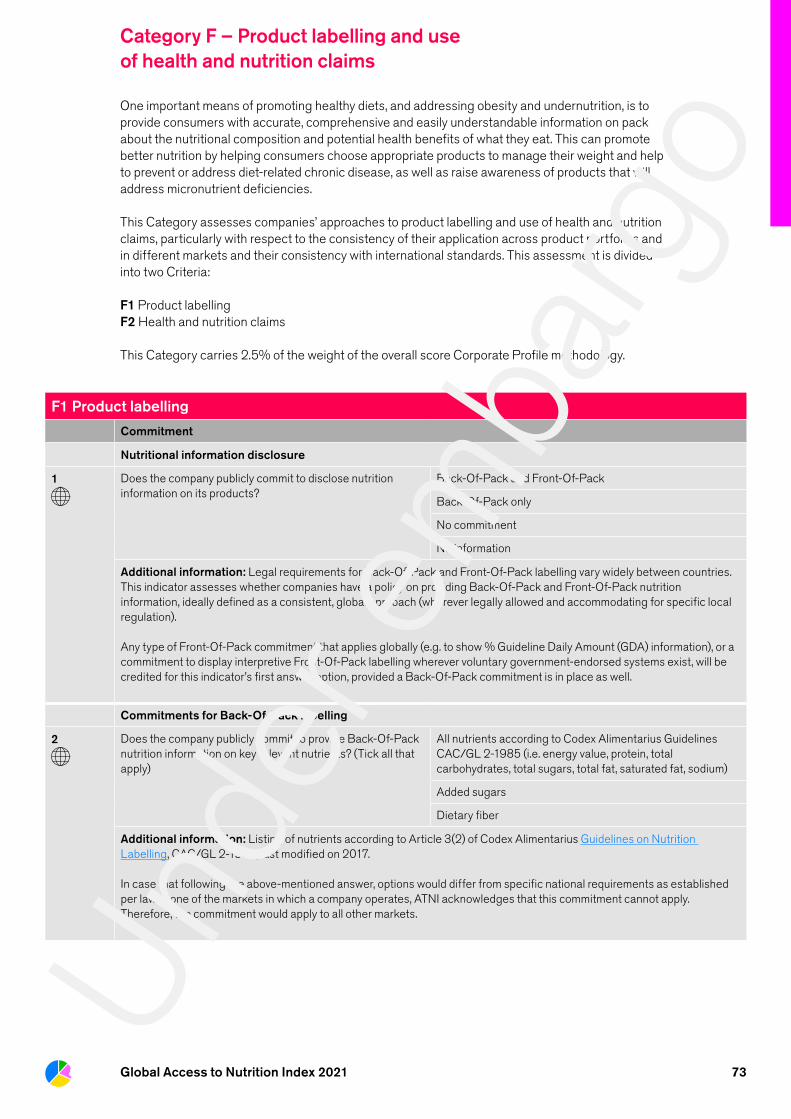
73Global Access to Nutrition Index 2021
Category F – Product labelling and use of health and nutrition claims
One important means of promoting healthy diets, and addressing obesity and undernutrition, is to provide consumers with accurate, comprehensive and easily understandable information on pack about the nutritional composition and potential health benefits of what they eat. This can promote better nutrition by helping consumers choose appropriate products to manage their weight and help to prevent or address diet-related chronic disease, as well as raise awareness of products that will address micronutrient deficiencies. This Category assesses companies’ approaches to product labelling and use of health and nutrition claims, particularly with respect to the consistency of their application across product portfolios and in different markets and their consistency with international standards. This assessment is divided into two Criteria:
F1 Product labellingF2 Health and nutrition claims This Category carries 2.5% of the weight of the overall score Corporate Profile methodology.
F1 Product labelling
Commitment
Nutritional information disclosure
1 Does the company publicly commit to disclose nutrition information on its products?
Back-Of-Pack and Front-Of-Pack
Back-Of-Pack only
No commitment
No information
Additional information: Legal requirements for Back-Of-Pack and Front-Of-Pack labelling vary widely between countries. This indicator assesses whether companies have a policy on providing Back-Of-Pack and Front-Of-Pack nutrition information, ideally defined as a consistent, global approach (wherever legally allowed and accommodating for specific local regulation).
Any type of Front-Of-Pack commitment that applies globally (e.g. to show % Guideline Daily Amount (GDA) information), or a commitment to display interpretive Front-Of-Pack labelling wherever voluntary government-endorsed systems exist, will be credited for this indicator’s first answer option, provided a Back-Of-Pack commitment is in place as well.
Commitments for Back-Of-Pack labelling
2 Does the company publicly commit to provide Back-Of-Pack nutrition information on key relevant nutrients? (Tick all that apply)
All nutrients according to Codex Alimentarius Guidelines CAC/GL 2-1985 (i.e. energy value, protein, total carbohydrates, total sugars, total fat, saturated fat, sodium)
Added sugars
Dietary fiber
Additional information: Listing of nutrients according to Article 3(2) of Codex Alimentarius Guidelines on Nutrition Labelling, CAC/GL 2-1985, last modified on 2017.
In case that following the above-mentioned answer, options would differ from specific national requirements as established per law in one of the markets in which a company operates, ATNI acknowledges that this commitment cannot apply. Therefore, the commitment would apply to all other markets.
Unde
r em
barg
o

74GLOBAL Access to Nutrition Index 2021
F1 Product labelling
3 Commitments for Front-Of-Pack labelling
3.1 Does the company also commit to providing information on Front-Of-Pack?
In an interpretative format that is government-endorsed (where available) on ALL relevant products, providing indicators of how healthy the product is, rather than just numeric information
In an interpretative format that is government-endorsed (where available) on SOME relevant products, providing indicators of how healthy the product is, rather than just numeric information
Numeric information only, but showing % of GDA (or similar measure) of multiple nutrients
Numeric information only, but showing % of GDA (or similar measure) of a single nutrient or energy only
Numeric information on levels of key nutrients, but not showing % GDA (or similar measure)
No Front-Of-Pack labelling used
No information
Additional information: Interpretative format means using colors or symbols or other graphics to help consumers to understand the information. Government-endorsed interpretative Front-Of-Pack labelling that are assessed in indicator 3.1 refer to voluntary Front-Of-Pack labelling systems that are legally allowed and supported by government or other authorities in the country or jurisdiction. Mandatory Front-Of-Pack labelling systems are not relevant in indicator 3.1.
3.2 For countries in which mandatory Front-Of-Pack labelling systems are implemented, including health warning labels, does the company commit:
Not to provide additional interpretive labelling or other information Front-Of-Pack that directly relates to the message of the mandatory Front-Of-Pack labelling (which may confuse consumers or modify the effect of the mandatory labelling)
No commitment
Not applicable
Additional information: Examples of Front-Of-Pack labelling or nutrition information have been observed in markets with mandatory health warning labels, in which case food and beverage companies added information Front-Of-Pack that undermined the message of the health warning. Indicator 3.2 assesses whether companies commit to not provide Front-Of-Pack information in that way.
Countries with mandatory Front-Of-Pack labelling systems are: Chile, Ecuador, Finland, Iran, Israel Mexico, Peru, Sri Lanka, Thailand, Uruguay (as of May 2020). For more information, see: Jones A, Neal B, Reeve B, et al. (2019) ‘Front-of-pack nutrition labelling to promote healthier diets: current practice and opportunities to strengthen regulation worldwide.’ BMJ Global Health 2019;4:e001882; and S Storcksdieck genannt Bonsmann, G Marandola, E Ciriolo, R van Bavel, J Wollgast. (2020) Front-of-pack nutrition labelling schemes: a comprehensive review. EUR 29811 EN, Luxembourg, Publications Office of the European Union.
Additional labelling commitments
4 Does the company commit to providing Back-Of-Pack information on the quantity of nutrients as a percentage of the GDAs (or similar measure)?
Yes, for all applicable nutrients and energy
Yes, for a selection of nutrients or energy only
No commitment
No information
Additional information: -
Unde
r em
barg
o

75GLOBAL Access to Nutrition Index 2021
F1 Product labelling
Assessment of portion / serving size labelling
5 Does the company commit to providing nutritional information on a per 100 g or per 100 ml basis, and to providing portion- or serving-based information (Article 3.4 of Codex Alimentarius CAC/GL 2-1985)? (Tick all that apply)
Information on the amounts of energy and nutrients is expressed in g per 100 g or per 100 ml or per package if the package contains only a single portion
Information on the amounts of energy and nutrients is expressed per serving as quantified on the label or per portion provided that the number of portions contained in the package is stated
Additional information: This indicator assesses commitments regarding the information on the amounts of energy and nutrients according to Article 3.4.2, 3.4.3 and of Codex Alimentarius Guidelines on Nutrition Labelling, CAC/GL 2-1985, last modified on 2017.
6 Has the company defined a labelling strategy and targets aimed at reducing food waste?
Yes, a labelling strategy AND targets aimed at reducing food waste are defined
Yes, either a labelling strategy OR targets aimed at reducing food waste are defined
No strategy or targets
No information
Not applicable
Additional information: This indicator assesses whether companies are aware of the impact that best-by dates or other labelling aspects have on people’s consumption patterns, and whether they’re addressing it.
Performance
Roll-out of full labelling commitments: market coverage
7 In what percentage of the company’s markets has it rolled out its full labelling commitments, i.e. all products in those markets are labelled according to the commitments?
7.1 In what percentage of markets has the company rolled out its Back-Of-Pack labelling commitments that comply (at minimum) with Codex Alimentarius on Nutrition and Labelling CAC/GL 2-1985, last modified 2017?
More than 80% (or more than 98% of products globally)
Between 50 and 79% (or more than 90% of products globally)
Between 6 and 49% (or more than 80% of products globally)
Less than 5% (or less than 79% of products globally)
No Back-Of-Pack labelling commitment in place
No information
Additional information: This performance indicator is related to the commitments assessed under indicator 2, above.
Unde
r em
barg
o
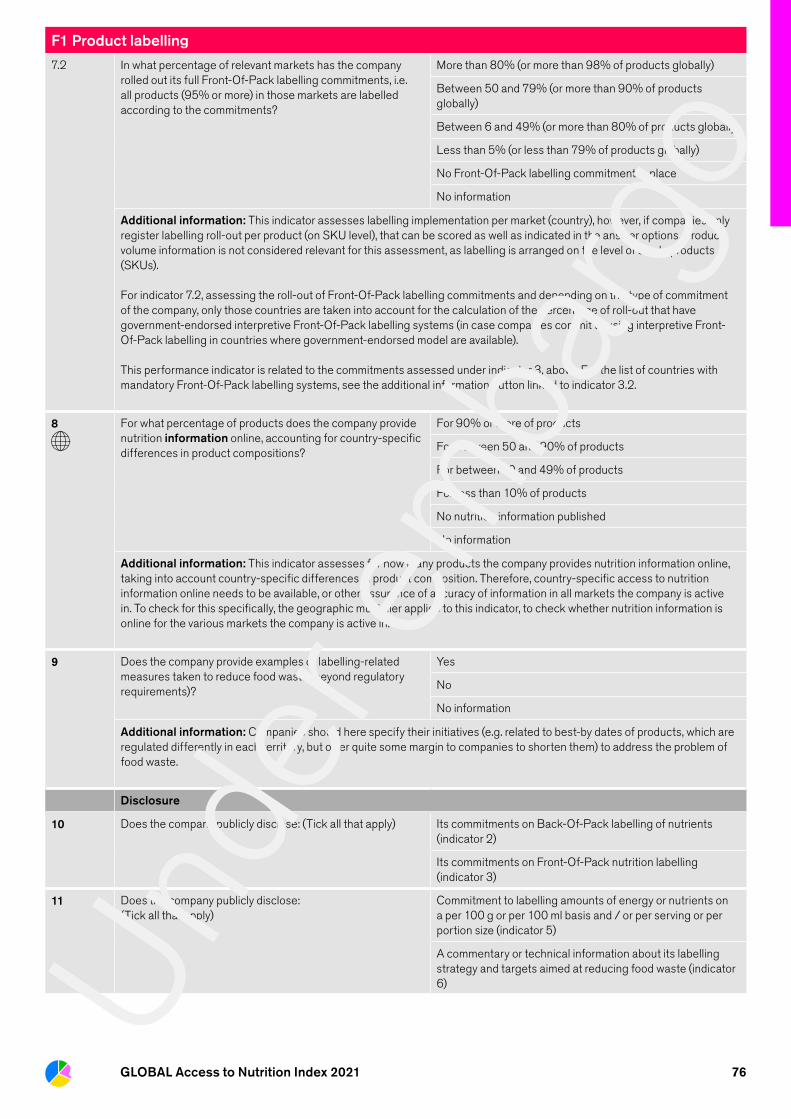
76GLOBAL Access to Nutrition Index 2021
F1 Product labelling
7.2 In what percentage of relevant markets has the company rolled out its full Front-Of-Pack labelling commitments, i.e. all products (95% or more) in those markets are labelled according to the commitments?
More than 80% (or more than 98% of products globally)
Between 50 and 79% (or more than 90% of products globally)
Between 6 and 49% (or more than 80% of products globally)
Less than 5% (or less than 79% of products globally)
No Front-Of-Pack labelling commitment in place
No information
Additional information: This indicator assesses labelling implementation per market (country), however, if companies only register labelling roll-out per product (on SKU level), that can be scored as well as indicated in the answer options. Product volume information is not considered relevant for this assessment, as labelling is arranged on the level of single products (SKUs).
For indicator 7.2, assessing the roll-out of Front-Of-Pack labelling commitments and depending on the type of commitment of the company, only those countries are taken into account for the calculation of the percentage of roll-out that have government-endorsed interpretive Front-Of-Pack labelling systems (in case companies commit to using interpretive Front-Of-Pack labelling in countries where government-endorsed model are available).
This performance indicator is related to the commitments assessed under indicator 3, above. For the list of countries with mandatory Front-Of-Pack labelling systems, see the additional information button linked to indicator 3.2.
8 For what percentage of products does the company provide nutrition information online, accounting for country-specific differences in product compositions?
For 90% or more of products
For between 50 and 90% of products
For between 10 and 49% of products
For less than 10% of products
No nutrition information published
No information
Additional information: This indicator assesses for how many products the company provides nutrition information online, taking into account country-specific differences in product composition. Therefore, country-specific access to nutrition information online needs to be available, or other assurance of accuracy of information in all markets the company is active in. To check for this specifically, the geographic multiplier applies to this indicator, to check whether nutrition information is online for the various markets the company is active in.
9 Does the company provide examples of labelling-related measures taken to reduce food waste (beyond regulatory requirements)?
Yes
No
No information
Additional information: Companies should here specify their initiatives (e.g. related to best-by dates of products, which are regulated differently in each territory, but offer quite some margin to companies to shorten them) to address the problem of food waste.
Disclosure
10 Does the company publicly disclose: (Tick all that apply) Its commitments on Back-Of-Pack labelling of nutrients (indicator 2)
Its commitments on Front-Of-Pack nutrition labelling (indicator 3)
11 Does the company publicly disclose: (Tick all that apply)
Commitment to labelling amounts of energy or nutrients on a per 100 g or per 100 ml basis and / or per serving or per portion size (indicator 5)
A commentary or technical information about its labelling strategy and targets aimed at reducing food waste (indicator 6)Un
der e
mba
rgo
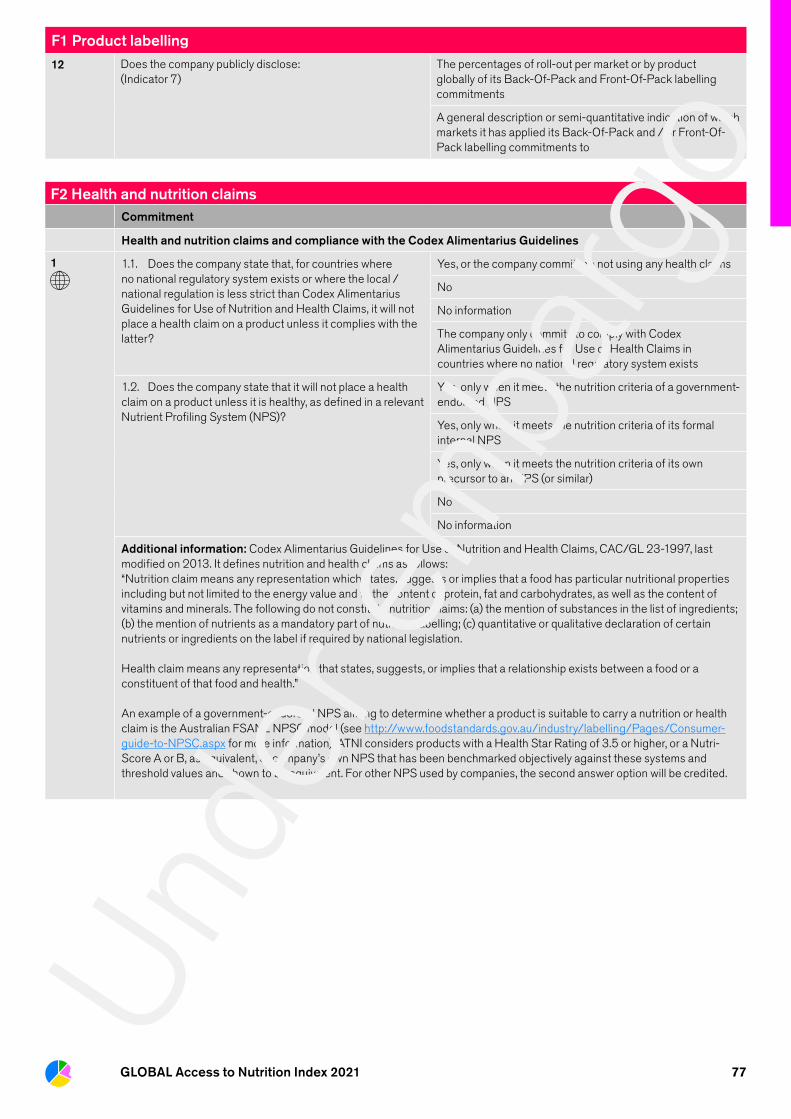
77GLOBAL Access to Nutrition Index 2021
F1 Product labelling
12 Does the company publicly disclose: (Indicator 7)
The percentages of roll-out per market or by product globally of its Back-Of-Pack and Front-Of-Pack labelling commitments
A general description or semi-quantitative indication of which markets it has applied its Back-Of-Pack and / or Front-Of-Pack labelling commitments to
F2 Health and nutrition claimsCommitment
Health and nutrition claims and compliance with the Codex Alimentarius Guidelines
1 1.1. Does the company state that, for countries where no national regulatory system exists or where the local / national regulation is less strict than Codex Alimentarius Guidelines for Use of Nutrition and Health Claims, it will not place a health claim on a product unless it complies with the latter?
Yes, or the company commits to not using any health claims
No
No information
The company only commits to comply with Codex Alimentarius Guidelines for Use of Health Claims in countries where no national regulatory system exists
1.2. Does the company state that it will not place a health claim on a product unless it is healthy, as defined in a relevant Nutrient Profiling System (NPS)?
Yes, only when it meets the nutrition criteria of a government-endorsed NPS
Yes, only when it meets the nutrition criteria of its formal internal NPS
Yes, only when it meets the nutrition criteria of its own precursor to an NPS (or similar)
No
No information
Additional information: Codex Alimentarius Guidelines for Use of Nutrition and Health Claims, CAC/GL 23-1997, last modified on 2013. It defines nutrition and health claims as follows:“Nutrition claim means any representation which states, suggests or implies that a food has particular nutritional properties including but not limited to the energy value and to the content of protein, fat and carbohydrates, as well as the content of vitamins and minerals. The following do not constitute nutrition claims: (a) the mention of substances in the list of ingredients; (b) the mention of nutrients as a mandatory part of nutrition labelling; (c) quantitative or qualitative declaration of certain nutrients or ingredients on the label if required by national legislation.
Health claim means any representation that states, suggests, or implies that a relationship exists between a food or a constituent of that food and health.”
An example of a government-endorsed NPS aiming to determine whether a product is suitable to carry a nutrition or health claim is the Australian FSANZ NPSC model (see http://www.foodstandards.gov.au/industry/labelling/Pages/Consumer-guide-to-NPSC.aspx for more information). ATNI considers products with a Health Star Rating of 3.5 or higher, or a Nutri-Score A or B, as equivalent, or company’s own NPS that has been benchmarked objectively against these systems and threshold values and shown to be equivalent. For other NPS used by companies, the second answer option will be credited.
Unde
r em
barg
o
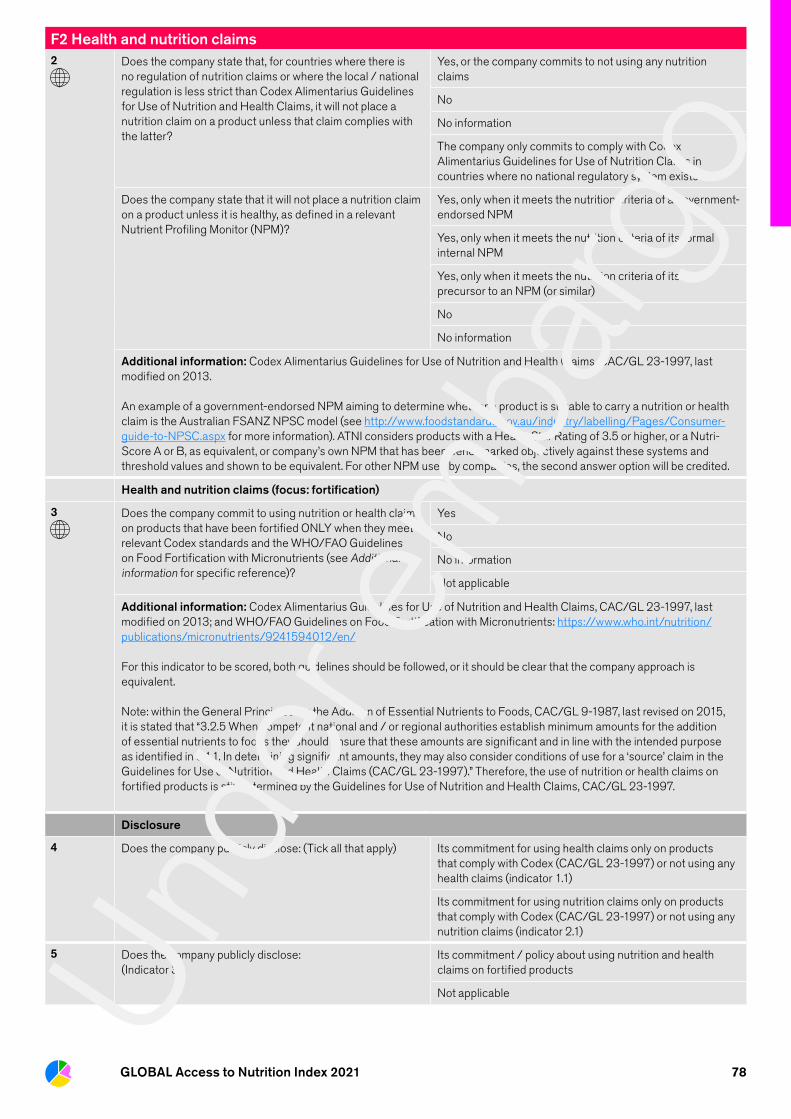
78GLOBAL Access to Nutrition Index 2021
F2 Health and nutrition claims2 Does the company state that, for countries where there is
no regulation of nutrition claims or where the local / national regulation is less strict than Codex Alimentarius Guidelines for Use of Nutrition and Health Claims, it will not place a nutrition claim on a product unless that claim complies with the latter?
Yes, or the company commits to not using any nutrition claims
No
No information
The company only commits to comply with Codex Alimentarius Guidelines for Use of Nutrition Claims in countries where no national regulatory system exists
Does the company state that it will not place a nutrition claim on a product unless it is healthy, as defined in a relevant Nutrient Profiling Monitor (NPM)?
Yes, only when it meets the nutrition criteria of a government-endorsed NPM
Yes, only when it meets the nutrition criteria of its formal internal NPM
Yes, only when it meets the nutrition criteria of its own precursor to an NPM (or similar)
No
No information
Additional information: Codex Alimentarius Guidelines for Use of Nutrition and Health Claims, CAC/GL 23-1997, last modified on 2013.
An example of a government-endorsed NPM aiming to determine whether a product is suitable to carry a nutrition or health claim is the Australian FSANZ NPSC model (see http://www.foodstandards.gov.au/industry/labelling/Pages/Consumer-guide-to-NPSC.aspx for more information). ATNI considers products with a Health Star Rating of 3.5 or higher, or a Nutri-Score A or B, as equivalent, or company’s own NPM that has been benchmarked objectively against these systems and threshold values and shown to be equivalent. For other NPM used by companies, the second answer option will be credited.
Health and nutrition claims (focus: fortification)
3 Does the company commit to using nutrition or health claims on products that have been fortified ONLY when they meet relevant Codex standards and the WHO/FAO Guidelines on Food Fortification with Micronutrients (see Additional information for specific reference)?
Yes
No
No information
Not applicable
Additional information: Codex Alimentarius Guidelines for Use of Nutrition and Health Claims, CAC/GL 23-1997, last modified on 2013; and WHO/FAO Guidelines on Food Fortification with Micronutrients: https://www.who.int/nutrition/publications/micronutrients/9241594012/en/
For this indicator to be scored, both guidelines should be followed, or it should be clear that the company approach is equivalent.
Note: within the General Principles for the Addition of Essential Nutrients to Foods, CAC/GL 9-1987, last revised on 2015, it is stated that “3.2.5 When competent national and / or regional authorities establish minimum amounts for the addition of essential nutrients to foods they should ensure that these amounts are significant and in line with the intended purpose as identified in 3.1.1. In determining significant amounts, they may also consider conditions of use for a ‘source’ claim in the Guidelines for Use of Nutrition and Health Claims (CAC/GL 23-1997).” Therefore, the use of nutrition or health claims on fortified products is still determined by the Guidelines for Use of Nutrition and Health Claims, CAC/GL 23-1997.
Disclosure
4 Does the company publicly disclose: (Tick all that apply) Its commitment for using health claims only on products that comply with Codex (CAC/GL 23-1997) or not using any health claims (indicator 1.1)
Its commitment for using nutrition claims only on products that comply with Codex (CAC/GL 23-1997) or not using any nutrition claims (indicator 2.1)
5 Does the company publicly disclose:(Indicator 3)
Its commitment / policy about using nutrition and health claims on fortified products
Not applicableUnde
r em
barg
o
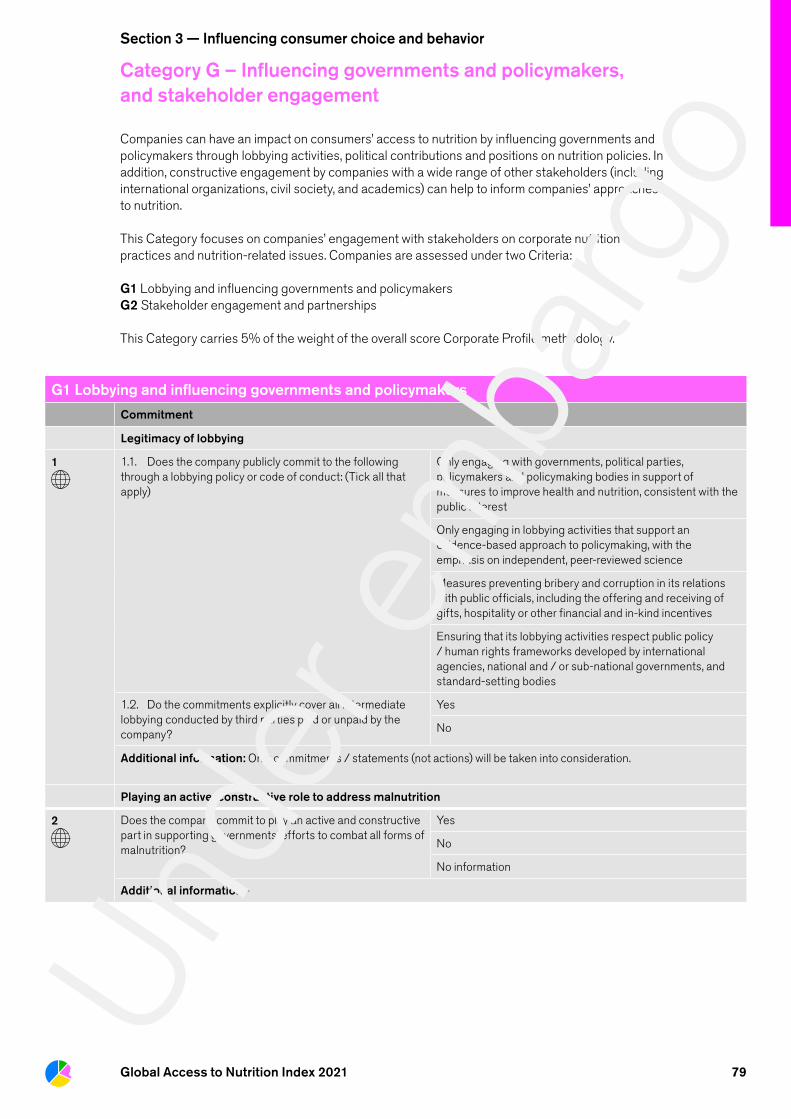
79Global Access to Nutrition Index 2021
Section 3 — Influencing consumer choice and behavior
Category G – Influencing governments and policymakers, and stakeholder engagement
Companies can have an impact on consumers’ access to nutrition by influencing governments and policymakers through lobbying activities, political contributions and positions on nutrition policies. In addition, constructive engagement by companies with a wide range of other stakeholders (including international organizations, civil society, and academics) can help to inform companies’ approaches to nutrition. This Category focuses on companies’ engagement with stakeholders on corporate nutrition practices and nutrition-related issues. Companies are assessed under two Criteria:
G1 Lobbying and influencing governments and policymakersG2 Stakeholder engagement and partnerships This Category carries 5% of the weight of the overall score Corporate Profile methodology.
G1 Lobbying and influencing governments and policymakers
Commitment
Legitimacy of lobbying
1 1.1. Does the company publicly commit to the following through a lobbying policy or code of conduct: (Tick all that apply)
Only engaging with governments, political parties, policymakers and policymaking bodies in support of measures to improve health and nutrition, consistent with the public interest
Only engaging in lobbying activities that support an evidence-based approach to policymaking, with the emphasis on independent, peer-reviewed science
Measures preventing bribery and corruption in its relations with public officials, including the offering and receiving of gifts, hospitality or other financial and in-kind incentives
Ensuring that its lobbying activities respect public policy / human rights frameworks developed by international agencies, national and / or sub-national governments, and standard-setting bodies
1.2. Do the commitments explicitly cover all intermediate lobbying conducted by third parties paid or unpaid by the company?
Yes
No
Additional information: Only commitments / statements (not actions) will be taken into consideration.
Playing an active, constructive role to address malnutrition
2 Does the company commit to play an active and constructive part in supporting governments’ efforts to combat all forms of malnutrition?
Yes
No
No information
Additional information:-
Unde
r em
barg
o
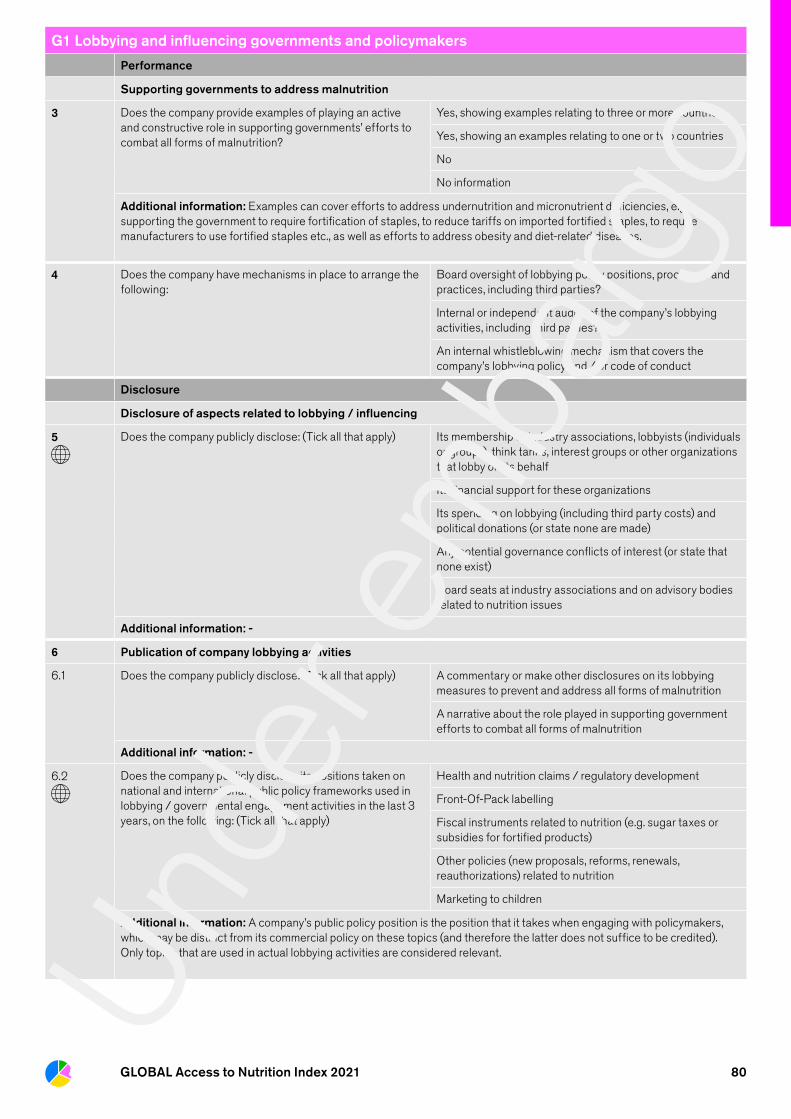
80GLOBAL Access to Nutrition Index 2021
G1 Lobbying and influencing governments and policymakers
Performance
Supporting governments to address malnutrition
3 Does the company provide examples of playing an active and constructive role in supporting governments’ efforts to combat all forms of malnutrition?
Yes, showing examples relating to three or more countries
Yes, showing an examples relating to one or two countries
No
No information
Additional information: Examples can cover efforts to address undernutrition and micronutrient deficiencies, e.g. supporting the government to require fortification of staples, to reduce tariffs on imported fortified staples, to require manufacturers to use fortified staples etc., as well as efforts to address obesity and diet-related diseases.
4 Does the company have mechanisms in place to arrange the following:
Board oversight of lobbying policy positions, processes and practices, including third parties?
Internal or independent audits of the company’s lobbying activities, including third parties?
An internal whistleblowing mechanism that covers the company’s lobbying policy and / or code of conduct
Disclosure
Disclosure of aspects related to lobbying / influencing
5 Does the company publicly disclose: (Tick all that apply) Its membership of industry associations, lobbyists (individuals or groups), think tanks, interest groups or other organizations that lobby on its behalf
Its financial support for these organizations
Its spending on lobbying (including third party costs) and political donations (or state none are made)
Any potential governance conflicts of interest (or state that none exist)
Board seats at industry associations and on advisory bodies related to nutrition issues
Additional information: -
6 Publication of company lobbying activities
6.1 Does the company publicly disclose: (Tick all that apply) A commentary or make other disclosures on its lobbying measures to prevent and address all forms of malnutrition
A narrative about the role played in supporting government efforts to combat all forms of malnutrition
Additional information: -
6.2 Does the company publicly disclose its positions taken on national and international public policy frameworks used in lobbying / governmental engagement activities in the last 3 years, on the following: (Tick all that apply)
Health and nutrition claims / regulatory development
Front-Of-Pack labelling
Fiscal instruments related to nutrition (e.g. sugar taxes or subsidies for fortified products)
Other policies (new proposals, reforms, renewals, reauthorizations) related to nutrition
Marketing to children
Additional information: A company’s public policy position is the position that it takes when engaging with policymakers, which may be distinct from its commercial policy on these topics (and therefore the latter does not suffice to be credited). Only topics that are used in actual lobbying activities are considered relevant. Un
der e
mba
rgo

81GLOBAL Access to Nutrition Index 2021
G2 Stakeholder engagement and partnershipsPerformance
1 Does the company provide evidence of engaging with the following stakeholders in developing its nutrition strategy, policies and / or programs: (Tick all that apply)
International organizations (such as UN agencies) or regional institutions
National bodies and institutions
CSOs, including NGOs
Academic institutions or scientific experts
Other
Additional information: An essential element in order for stakeholder engagement to be credited for this indicator, and throughout Criterion G2 (unless stated otherwise), is that stakeholder engagement should be focused on, or include an element of, gathering input from stakeholders to develop or improve the company’s nutrition strategy, policies and programs. Engaging with stakeholders to explain or educate them on company programs, initiatives or approaches is not sufficient if the focus is only on providing information and not on receiving input or feedback.
Global Reporting Initiative (GRI) G4 guidelines defines stakeholders as follows: “According to GRI, stakeholders are defined as entities or individuals that can reasonably be expected to be significantly affected by the organisation’s activities, products, and services; and whose actions can reasonably be expected to affect the ability of the organisation to successfully implement its strategies and achieve its objectives” (see for more information: www2.globalreporting.org/standards/g4/Pages/default.aspx)
ATNI defines stakeholder engagement as the process by which the company involves individuals, entities, organizations, etc. who may be affected by its decisions / actions or who can influence these decisions. That individual / entity/ organization may support or oppose, hold influence in the company or outside of it, hold relevant official positions or may be affected in the long term via a non-paid relationship.
Further, consumer organizations or priority population-related associations or platforms are considered as examples of CSOs, and defined “to include all non-market and non-state organizations outside of the family in which people organize themselves to pursue shared interests in the public domain” (UNDP, 2015, “NGOs and CSOs: A note on terminology”). However, all forms of marketing, market research or marketing-related consumer insights research that involve engagement with these groups, or such engagement with (groups of) consumers, should not be considered under this indicator. Only engagement for the purpose of gathering input to develop the company’s nutrition strategy, policies and / or programs; or identifying and assessing any actual or potential adverse impacts to the realization of their right to adequate food resulting from business activity should be considered (following the UN Guiding Principles on Business and Human Rights, principle 18).
2 What form of engagement designed to improve or develop its nutrition strategy, policies or programs does the company have with stakeholders as evidenced by examples provided by the company?
Comprehensive, well-structured and focused engagement on business strategy and performance; with both international and local stakeholders
Comprehensive, well-structured and focused engagement on business strategy and performance; with (local) home country stakeholders
Limited; typically, one-way communication rather than engagement, and more ad-hoc; with either international or local stakeholders
No engagement
No information
Additional information: Stakeholder engagement refers to the process by which the company involves individuals, entities, organizations, etc. who may be affected by its decisions / actions or can influence these. For more information, please see the additional information under indicator 1, above.
Unde
r em
barg
o
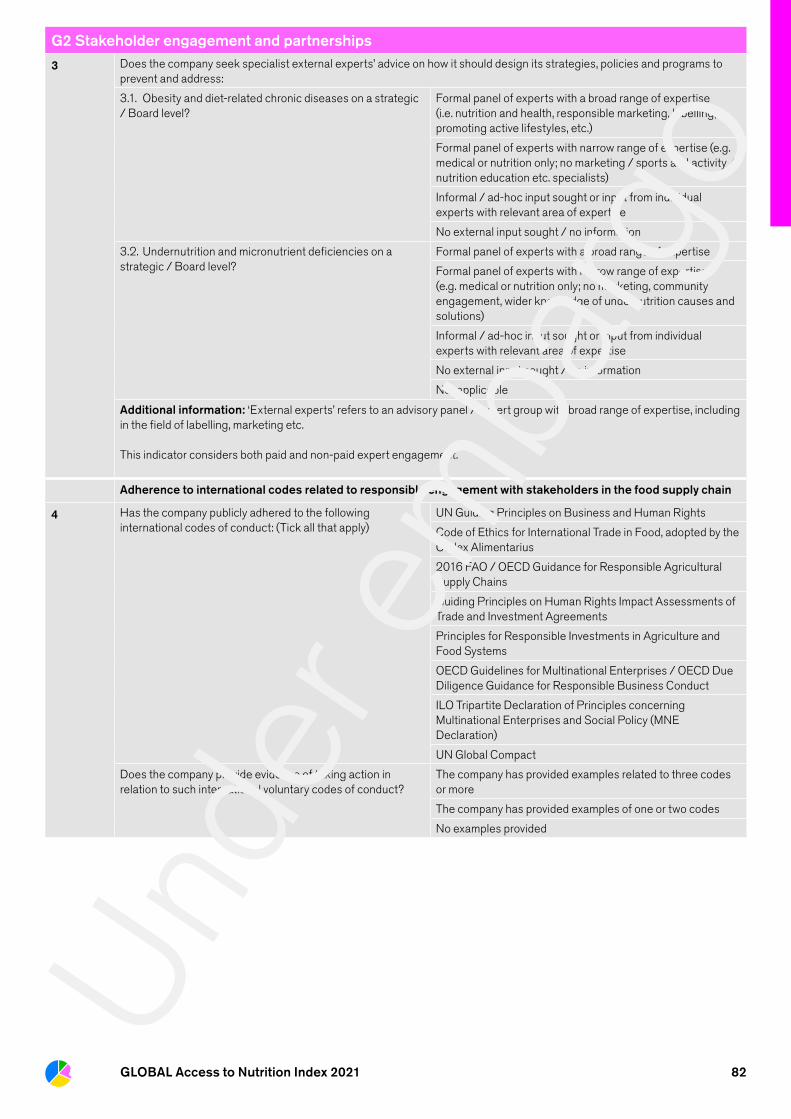
82GLOBAL Access to Nutrition Index 2021
G2 Stakeholder engagement and partnerships
3 Does the company seek specialist external experts’ advice on how it should design its strategies, policies and programs to prevent and address:
3.1. Obesity and diet-related chronic diseases on a strategic / Board level?
Formal panel of experts with a broad range of expertise (i.e. nutrition and health, responsible marketing, labelling, promoting active lifestyles, etc.)
Formal panel of experts with narrow range of expertise (e.g. medical or nutrition only; no marketing / sports and activity / nutrition education etc. specialists)
Informal / ad-hoc input sought or input from individual experts with relevant area of expertise
No external input sought / no information
3.2. Undernutrition and micronutrient deficiencies on a strategic / Board level?
Formal panel of experts with a broad range of expertise
Formal panel of experts with narrow range of expertise (e.g. medical or nutrition only; no marketing, community engagement, wider knowledge of undernutrition causes and solutions)
Informal / ad-hoc input sought or input from individual experts with relevant area of expertise
No external input sought / no information
Not applicable
Additional information: ‘External experts’ refers to an advisory panel / expert group with broad range of expertise, including in the field of labelling, marketing etc.
This indicator considers both paid and non-paid expert engagement.
Adherence to international codes related to responsible engagement with stakeholders in the food supply chain
4 Has the company publicly adhered to the following international codes of conduct: (Tick all that apply)
UN Guiding Principles on Business and Human Rights
Code of Ethics for International Trade in Food, adopted by the Codex Alimentarius
2016 FAO / OECD Guidance for Responsible Agricultural Supply Chains
Guiding Principles on Human Rights Impact Assessments of Trade and Investment Agreements
Principles for Responsible Investments in Agriculture and Food Systems
OECD Guidelines for Multinational Enterprises / OECD Due Diligence Guidance for Responsible Business Conduct
ILO Tripartite Declaration of Principles concerning Multinational Enterprises and Social Policy (MNE Declaration)
UN Global Compact
Does the company provide evidence of taking action in relation to such international voluntary codes of conduct?
The company has provided examples related to three codes or more
The company has provided examples of one or two codes
No examples provided
Unde
r em
barg
o

83GLOBAL Access to Nutrition Index 2021
G2 Stakeholder engagement and partnershipsAdditional information: In assessing this indicator, companies will be credited if they make an explicit reference to the international codes of conduct in their reporting, initiatives or other (internal or public) documentation. Implicit references to codes of conduct, or of action taken in relation to such codes, is only credited if the link to the code(s) of conduct is clear and unambiguous. The codes of conduct are described below: The UN Guiding Principles on Business and Human Rights (2011) are a set of guidelines that apply to States and companies to prevent, address and remedy human rights abuses committed in business operations. This instrument consists of 31 principles around the obligations to respect and protect human rights, as well as to remedy human rights abuses when these occur. Endorsed in 2011, the Guiding Principles provided the first global standard for preventing and addressing the risk of adverse impacts on human rights linked to business activity, and continue to provide the internationally accepted framework for enhancing standards and practice regarding business and human rights.
The Code of Ethics for International Trade in Food (Codex Alimentarius Code of Practice, CAC/RCP 20-1979, revised in 2010) aims to establish principles for the ethical conduct of international trade in food in order to protect the health of the consumers and ensure fair practices in the food trade, as per its article 1.
Likewise, 2016 FAO/OECD Guidance for Responsible Agricultural Supply Chains is a compilation of existing standards for responsible business conduct along supply chains developed to help companies observe such principles in order to mitigate adverse impacts and promote sustainable development. The Guidance — aimed at all enterprises, foreign and domestic, operating at all phases of the food supply chain — addresses several areas of risk, including respect for human rights, health and safety, food security and malnutrition, land rights and sustainable use of natural resources. It results from the understanding that enterprises operating along agricultural food supply chains can and have a responsibility to play a significant role in strengthening sustainable development, enhancing food and nutritional security (directly and indirectly) and helping achieve development goals of third countries. All of which is connected to the reduction of FLW.
The Guiding Principles on Human Rights Impact Assessments of Trade and Investment Agreements (2011) are intended to provide States with guidance on how best to ensure that the trade and investment agreements they conclude are consistent with their obligations under international human rights instruments. In addition, these guiding principles could serve as a source of inspiration for companies carrying out human rights due diligence, in order to identify, prevent, mitigate and account for the human rights impacts of their activities, particularly with regards to the right to adequate food, in the negotiation and conclusion of investment agreements with the host States in which they invest.
The Principles for Responsible Investments in Agriculture and Food Systems (2014) aim to promote responsible investment in agriculture and food systems that contribute to food security and nutrition, thus supporting the progressive realization of the right to adequate food in the context of national food security. The document seeks to address the core elements of what makes investment in agriculture and food systems responsible, and serves as a framework to guide the actions of all stakeholders engaged in agriculture and food systems (including business enterprises) by defining principles which can promote much needed responsible investment, enhance livelihoods, and guard against and mitigate risks to food security and nutrition.
OECD Guidelines for Multinational Enterprises (1976, updated in 2011) are recommendations addressed by governments to multinational enterprises operating in or from adhering countries. They provide non-binding principles and standards for responsible business conduct in a global context consistent with applicable laws and internationally recognized standards. The OECD Guidelines recommend that enterprises conduct due diligence in order to identify, prevent or mitigate and account for how actual and potential adverse impacts are addressed. Additionally, the OECD Due Diligence Guidance for Responsible Business Conduct (adopted in 2018) provides practical support to enterprises on the implementation of the OECD Guidelines for Multinational Enterprises by providing plain language explanations of its due diligence recommendations and associated provisions.
The ILO Tripartite Declaration of Principles concerning Multinational Enterprises and Social Policy (MNE Declaration) offer guidelines to multinational enterprises, among others, in such areas as employment, training, conditions of work and life, and industrial relations. The continued prominent role of multinational enterprises in the process of social and economic globalization renders the application of the principles of the MNE Declaration important and necessary in the context of foreign direct investment and trade, and the use of global supply chains. The principles of the MNE Declaration serve as guidelines for enhancing the positive social and labor effects of the operations and governance of multinational enterprises to achieve decent work for all. These guidelines can also be used in developing partnerships to address many of the challenges which neither governments nor companies can address on their own, including multi-stakeholder partnerships and international cooperation initiatives.
The UN Global Compact supports companies to: 1) do business responsibly by aligning their strategies and operations with Ten Principles on human rights, labor, environment and anti-corruption (see UN Global Compact Management Model, 2010); and 2) since 2017, take strategic actions to advance broader societal goals, such as the UN Sustainable Development Goals, with an emphasis on collaboration and innovation. Un
der e
mba
rgo

84GLOBAL Access to Nutrition Index 2021
G2 Stakeholder engagement and partnerships
5 Has the company publicly adhered to any of the following initiatives launched by institutions (from governmental to international bodies) to prevent FLW? (Tick all that apply)
United States 2030 Food Loss and Waste Reduction Goal
Malabo Declaration on Accelerated Agricultural Growth and Transformation for shared Prosperity and Improved Livelihoods
Asia-Pacific Economic Cooperation (APEC) Action Plan for Reducing Food Loss and Waste
Parliamentary Front against Hunger in Latin America and the Caribbean
Regional Alliance for Food Loss and Waste Production
EU Food Losses and Food Waste Platform
Other (e.g. local/ national /regional initiative)
Additional information: For more information on these initiatives, see: http://www.fao.org/3/ca1397en/CA1397EN.pdf
6 Stakeholder engagement and / or partnerships to combat obesity, undernutrition, micronutrient deficiencies and related diseases
6.1 Does the company have partnerships with, or formally support any of the following international initiatives / organizations to address malnutrition in priority populations? (Tick all that apply)
SUN Business Network
World Food Program
UNICEF
Save the Children
Zero Hunger Challenge
GAIN
Amsterdam Initiative against Malnutrition
Other relevant organization
Additional information: For a partnership to be acknowledged in this indicator, the company is required to provide evidence of a significant in-kind or financial investment and a long-term commitment (a year or more). The list is not exhaustive, therefore the answer option ‘Other relevant organization’ is in place for other organizations which may include Action Against Hunger, Power of Nutrition, HarvestPlus and many more. For reporting purposes, please provide a complete list of partnerships.
6.2 Can the company provide evidence of one-to-one discussions with key organizations working on malnutrition to solicit input on its commercial strategy / policy / approach?
Yes
No
No information
Additional information: Key organizations could include those listed in indicator 6.1, as well as FAO, Alive and thrive, etc.One-to-one meetings is regular dialogue, and meetings without promotional purpose. Being a member of these organizations is not sufficient.
Disclosure
7.1 Does the company publicly disclose: (Indicator 1)
Its commitment to engage with stakeholders in developing nutrition policies / programs
7.2 Does the company publicly disclose: (Indicator 2)
Specific examples of how input has been used to adapt nutrition-related policies / programs, i.e. to change business practices
Broad statement about the benefits of nutrition-related stakeholder dialog
No
8 Does the company publicly disclose: (Indicator 3)
Names and affiliations of members of its formal panel of experts / names of advisors with expertise on obesity and diet-related chronic diseases (indicator 3.1)
Names and affiliations of members of its formal panel of experts / names of advisors with expertise on undernutrition and micronutrient deficiencies (indicator 3.2)
Not applicable (indicator 3.2)
9 Does the company publicly disclose: A narrative about its stakeholder engagement activities related to malnutrition and priority populations (indicator 6.2) Un
der e
mba
rgo
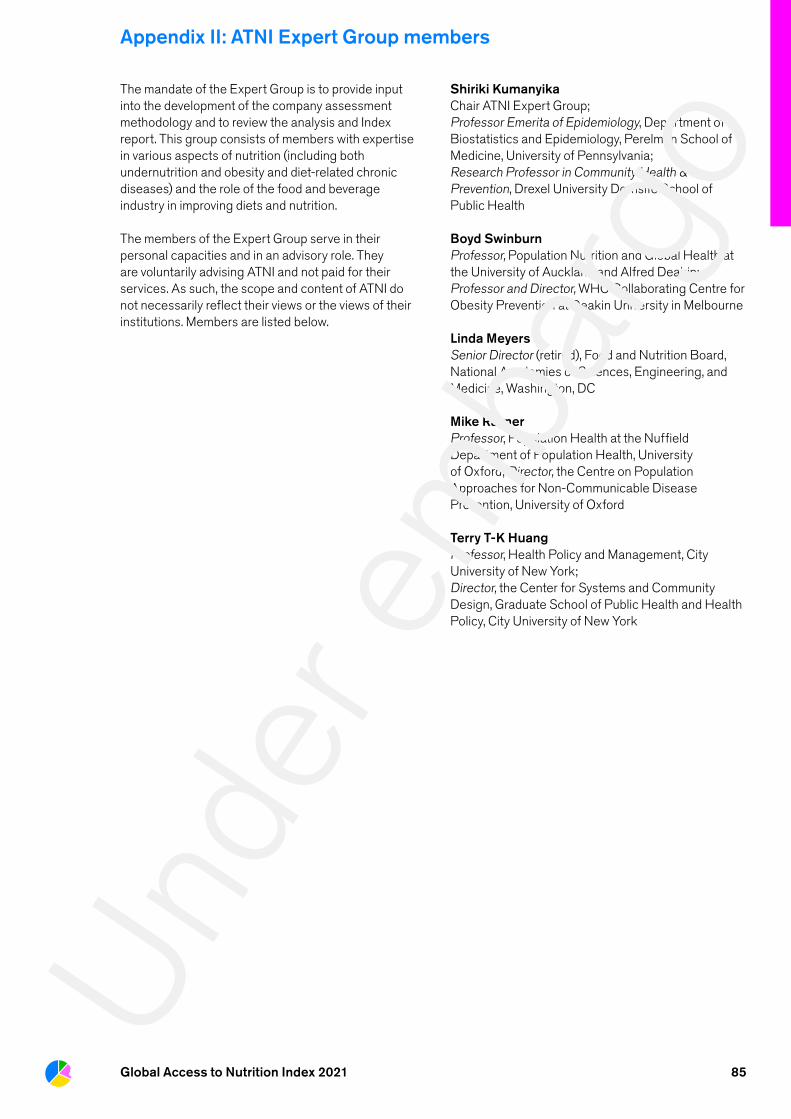
85Global Access to Nutrition Index 2021
The mandate of the Expert Group is to provide input into the development of the company assessment methodology and to review the analysis and Index report. This group consists of members with expertise in various aspects of nutrition (including both undernutrition and obesity and diet-related chronic diseases) and the role of the food and beverage industry in improving diets and nutrition.
The members of the Expert Group serve in their personal capacities and in an advisory role. They are voluntarily advising ATNI and not paid for their services. As such, the scope and content of ATNI do not necessarily reflect their views or the views of their institutions. Members are listed below.
Shiriki KumanyikaChair ATNI Expert Group; Professor Emerita of Epidemiology, Department of Biostatistics and Epidemiology, Perelman School of Medicine, University of Pennsylvania; Research Professor in Community Health & Prevention, Drexel University Dornsife School of Public Health
Boyd Swinburn Professor, Population Nutrition and Global Health at the University of Auckland and Alfred Deakin; Professor and Director, WHO Collaborating Centre for Obesity Prevention at Deakin University in Melbourne
Linda MeyersSenior Director (retired), Food and Nutrition Board, National Academies of Sciences, Engineering, and Medicine, Washington, DC
Mike RaynerProfessor, Population Health at the Nuffield Department of Population Health, University of Oxford; Director, the Centre on Population Approaches for Non-Communicable Disease Prevention, University of Oxford
Terry T-K HuangProfessor, Health Policy and Management, City University of New York;Director, the Center for Systems and Community Design, Graduate School of Public Health and Health Policy, City University of New York
Appendix II: ATNI Expert Group members
Unde
r em
barg
o

Access to Nutrition InitiativeArthur van Schendelstraat 6503511 MJ UtrechtThe Netherlands+31 (0)30 410 09 [email protected]
© 2021 Access to Nutrition Foundation – All rights reserved
Unde
r em
barg
o