Embed Size (px)
Citation preview

Development of zooplankton indicators for implementation of MSFD in the Baltic Sea
Elena Gorokhova, SU
CORESET II meeting, 29-30 September, 2014, Göteborg

Zooplankton community metrics are functions of continuous natural environmental factors and respond
to a gradient of mixed anthropogenic pressures
•Total abundance,
•Total biomass
•Copepod abundance
•%Copepod abundance
•Copepod biomass
•%Copepod biomass
•Microphagous species biomass
•%Microphagous species biomass
•Cladocera/Copepoda ratio
•(Rotifera+Cladocera)/Copepoda ratio
•Mean Size
Zooplankton Expert Network (ZEN), Coreset I
Eval
uat
ed fo
r in
dic
ato
r p
rop
erti
es

MSTS: Zooplankton mean size and total stock
- combination of metric scores for mean body size in zooplankton community and total biomass;
- discriminate well between reference and stressed conditions
►PLS-DA, GLM;
- ecologically meaningful (mechanisms of responses can be explained);
- are not redundant with each other.
Authored by HELCOM ZEN
High grazing, moderate food limitation for
zooplankton, high energy transfer efficiency, good feeding for fish
Low grazing, poor fish feeding conditions,
unproductive pelagic food web
Mea
nSi
ze
Total Stock
Efficient grazing on larger
phytoplankton, moderate fish
feeding conditions
Efficient grazing on bacteria and small
phytoplankton moderate feeding
conditions for larval fish, poor for postlarval fish
GES for Total Stock
GES fo
r Mean
Size

Metrics used to calculate MSTS
- Total zooplankton abundance (TZA)
- HELCOM guidelines
- Species, stages (size classes)
- Total zooplankton biomass (TZB)
- calculated using TZA and individual weights
(species- and stage-specific)
- Mean zooplankter size (MeanSize)
- TZB:TZA ratio

• Assessment Unit Level:
– 2 (Subbasins) – 3 (Subbasins with coastal
and offshore division)
• The indicator is applicable: – Where COMBINE-based
monitoring is implemented
• Currently data are available: BB, BS, GoF, NBP, GoR, GB, SEB, SB, K
Askö
Landsort
GoFFI
LHEI
BIOR
ÅlandFI
BoSFI
BoBFI
K32-41 J56-K18
BMPJ2
Bornholm
Anholt
MSTS: geographic applicability and data availability

Stage of development Indicator type
Core State
Primary importance Secondary importance
BSAP
Segment and
Objective
Thriving and balanced
communities of plants and
animals
MSFD
Descriptors and
Criteria
4.2. Abundance
/distribution of key trophic
groups and species
1.6. Habitat condition (condition of typical species or
communities, relative abundance and/or biomass,
physical, hydrological and chemical conditions)
Legislative linkage:
MSTS – a Food web indicator

In-GES communities have higher proportion of larger organisms, higher total biomass and
intermediate abundances
In-GES Sub-GES
All 12 datasets
Higher discrimination efficiency when: - Mean size is combined with stock size; - Biomass is used instead for abundance

- 2
- 1
0
1
2
3
B o t h n i a n B a y
- 2
- 1
0
1
2
3
Å l a n d
- 3
- 2
- 1
0
1
2
3
L a n d s o r t & A s k ö
1 9 8 0 1 9 9 0 2 0 0 0 2 0 1 0- 3
- 2
- 1
0
1
2
3
B o r n h o l m
Fat%
in h
erri
ng
Mea
nSi
ze
Landsort
H a r u f j ä d e n
0
2
4
6
8
Ä n g s k ä r s k l u b b
0
2
4
6
8
L a n d s o r t
0
2
4
6
8
U t l ä n g a n
1 9 8 0 1 9 9 0 2 0 0 0 2 0 1 0
0
2
4
6
8
Y e a r
Validation of Mean Size as relevant metric: lipid% in herring
decreases with decreasing MeanSize
(Gorokhova & Bignert, in prep.)

0 3 6 9 12 15 18 21 24 270
1
2
3
4
5
6
7
8
Mean size decrease with increased cyanobacterial blooms (=eutrophication)
Mea
n s
ize
B1 H4
Circle size is proportional to cyanobacteria biovolume
Total zooplankton biomass
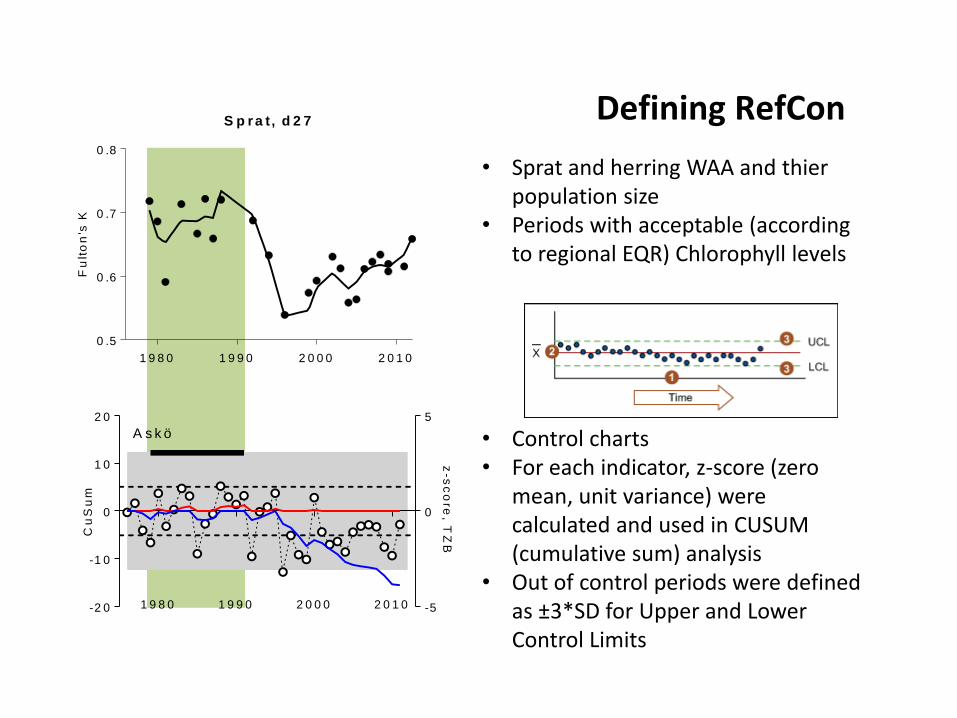
Defining RefCon
• Sprat and herring WAA and thier population size
• Periods with acceptable (according to regional EQR) Chlorophyll levels
1 9 8 0 1 9 9 0 2 0 0 0 2 0 1 0
0 .5
0 .6
0 .7
0 .8
S p r a t, d 2 7
Fu
lto
n's
K
1 9 8 0 1 9 9 0 2 0 0 0 2 0 1 0-2 0
-1 0
0
1 0
2 0
-5
0
5
A s k ö
Cu
Su
m
z-s
co
re, T
ZB
• Control charts • For each indicator, z-score (zero
mean, unit variance) were calculated and used in CUSUM (cumulative sum) analysis
• Out of control periods were defined as ±3*SD for Upper and Lower Control Limits

Concept/ design
Coordinated monitoring Assessment
Research needs for operationalization (in
relation to needs stated under the
coordinated monitoring and
assessment columns)
Data arrangements
Monitoring strategy (method, frequency, spatial resolution) in relation to relevant indicator parameters Technical guidelines Geographic scale
Assessment method
GES / assessment criteria (currently all GES are provisional)
A ) in place B) under development C ) not available, what needs - action level?
A ) monitoring in place B ) monitoring needs revision C ) monitoring not available, what needs - action level?
A ) in place B ) needs revision, what needs doing C ) not available, what needs - action level?
HELCOM assessment units: A ) identified B) Identified not described C) not identified, what needs - action level?
A ) available and described B ) available not described C ) not available, what needs - action level?
A ) proposed and described B ) proposed but needs more supporting data C ) not available, what needs - action level?
A ) in place B ) needs revision, what needs doing C ) not available, what needs - action level?
A B - frequency varies, national monitoring programmes with HELCOM COMBINE used and this manual is to be updated MORE
A A B - a clear method on how to interpret the result graph to be detailed
B - may require re-iteration - TM
Data needed for southern sub basins. Zooplankter size mainly calculated based on standard weights, direct measurements would be needed
B - data pooling and collecting needs to be outlined -TM, HELCOM
A B Recommendations for indicator assessment at varying sampling frequency
A
A
B Written guidelines for calculating and interpreting indicator values
A Improved biomass
assessment is needed
A
Be
gin
nin
g o
f C
OR
ESET
II
cu
rren
t si
tuat
ion
MSTS – current status

Issues that need to be
solved for the
indicator
What is hindering solving the issue
Standartization of
biomass calculations
Requirements to monitoring laboratories and funding
of methodological research in national monitoring
programmes
Coordination of
statistical evaluation of
the scoring system
among indicators
Funding and coordination
Short time series for
some areas
More efforts are needed to find archival data (data
rescue projects?)
MSTS: next steps