Embed Size (px)
Citation preview

Louisiana State UniversityLSU Digital Commons
LSU Doctoral Dissertations Graduate School
2003
Development of the neonatal rat as a model forSudden Infant Death Syndrome: cardiorespiratoryeffects of ethanolRhett Whitman StoutLouisiana State University and Agricultural and Mechanical College, [email protected]
Follow this and additional works at: https://digitalcommons.lsu.edu/gradschool_dissertations
Part of the Veterinary Pathology and Pathobiology Commons
This Dissertation is brought to you for free and open access by the Graduate School at LSU Digital Commons. It has been accepted for inclusion inLSU Doctoral Dissertations by an authorized graduate school editor of LSU Digital Commons. For more information, please [email protected].
Recommended CitationStout, Rhett Whitman, "Development of the neonatal rat as a model for Sudden Infant Death Syndrome: cardiorespiratory effects ofethanol" (2003). LSU Doctoral Dissertations. 624.https://digitalcommons.lsu.edu/gradschool_dissertations/624

DEVELOPMENT OF THE NEONATAL RATAS A MODEL FOR
SUDDEN INFANT DEATH SYNDROME:CARDIORESPIRATORY EFFECTS
OFETHANOL
A Dissertation
Submitted to the Graduate Faculty of the Louisiana State University and
Agricultural and Mechanical Collegein partial fulfillment of the
requirements for the degree ofDoctor of Philosophy
in
The Interdepartmental Program in Veterinary Medical Sciences
through
The Department of Pathobiological Sciences
byRhett Whitman Stout
B.S., Louisiana State University, 1982D.V.M., Louisiana State University, 1994
May, 2003

ii
Dedication
To God: Without the strength, wisdom, and grace bestowed upon me by God, this
dissertation would not have been possible. Through his grace, the future holds nothing but
promise.
“When the solution is simple, God is answering”
Albert Einstein, 1879-1955
To my wife who allowed me to pursue my dreams. Thank you for all your help,
patience and love. It is your turn now!!!

iii
Acknowledgments
First, I would like to thank my parents for their support, guidance, and love throughout
all the years of my life. I want to thank my children for the love and happiness they have
provided me.
Second, I would to extend a special thanks to Dr. W. Sheldon Bivin. Without his
insight and inspiration, this dissertation would not have been possible.
Third, I would like to thank my committee for allowing me to find my own way. A
special thanks to my mentor, Dr. David G. Baker, for his time, as well as knowing when to
pull on the reigns and apply the blinders.
Specific thanks to Michael T. Kearney and Dr. Giselle Hosgood for their help with
statistical analysis. Thanks to John Poumaroux for all of his help with scanning and data
analysis. Finally, I would like to thank Catherine L. Christensen, Essie B. Mack and Natalie
T. Simpson for their help with blood gas analysis.

iv
Table of Contents
Dedication................................................................................................................................ ii
Acknowledgments................................................................................................................... iii
List of Tables........................................................................................................................... vi
List of Figures......................................................................................................................... vii
Abstract.................................................................................................................................... ix
Chapter 1. Introduction and Literature Review........................................................................ 1Overview of Sudden Infant Death Syndrome (SIDS)......................................................... 2Epidemiology...................................................................................................................... 3Pathology............................................................................................................................ 4Vulnerable Infant (Triple Risk Model of SIDS)................................................................. 5Critical Developmental Period (Triple Risk Model of SIDS)............................................ 8Exogenous Stress (Triple Risk Model of SIDS)................................................................. 9Animal Models of SIDS.....................................................................................................15Endogenous Ethanol Production and SIDS....................................................................... 18Objectives.......................................................................................................................... 27Bibliography...................................................................................................................... 28
Chapter 2. Transcutaneous Blood Gas Monitoring in the Rat.................................................47Introduction....................................................................................................................... 48Materials and Methods...................................................................................................... 50Results............................................................................................................................... 61Discussion......................................................................................................................... 69Bibliography...................................................................................................................... 77
Chapter 3. Ontogeny of Cardiorespiratory Responses in Anesthetized Juvenile RatsBreathing Elevated Levels of CO2........................................................................ 81
Introduction....................................................................................................................... 82Materials and Methods...................................................................................................... 83Results............................................................................................................................... 89Discussion......................................................................................................................... 99Bibliography..................................................................................................................... 110

v
Chapter 4. Cardiorespiratory Responses to Ethanol and CO2 in Anesthetized Juvenile Rats........................................................................................................ 114
Introduction...................................................................................................................... 115Materials and Methods..................................................................................................... 118Results.............................................................................................................................. 124Discussion........................................................................................................................ 136Bibliography..................................................................................................................... 146
Chapter 5. Summary............................................................................................................... 151Bibliography..................................................................................................................... 155
Appendix. Letter of Permission..............................................................................................157
Vita......................................................................................................................................... 158

vi
List of Tables
Table 2.1: Summary statistics of transcutaneous gas data collected at five probe temperatures.......................................................................................................... 65
Table 2.2: Summary statistics of transcutaneous and arterial gas data collectedat three probe temperatures in adult rats............................................................... 68
Table 2.3: Summary statistics of transcutaneous and arterial gas data collected at three probe temperatures in juvenile rats.......................................................... 69
Table 2.4: Summary statistics of transcutaneous (44°C probe temperature) and arterial gas data collected in adult rats........................................................... 70
Table 2.5: Summary statistics of transcutaneous (42°C probe temperature) and arterial gas data collected in juvenile rats.......................................................71
Table 4.1: Percent of successfully completed two day trials by anesthetic regimen and treatment....................................................................................................... 126

vii
List of Figures
Figure 2.1: Illustration of the transcutaneous probe application procedures.......................... 52
Figure 2.2: Comparison of transcutaneous partial pressures at selected probe sites...............63
Figure 2.3: Comparison of mean PtcO2 at 5 different probe temperatures...............................64
Figure 2.4: Scatter plot with regression line, PaCO2 = 5.748 + 0.585(PtcCO2), using a probe temperature of 44.0°C .............................................................. 67
Figure 2.5: Comparison of mean PaCO2 and PtcCO2 (mm Hg) at various FICO2 values.........75
Figure 3.1: Comparison of weight gain between treatments over post embryonic days 30 - 35................................................................................... 91
Figure 3.2: Comparison of PZPtcCO2 by treatment, within each post embryonic (PE) day................................................................................. 92
Figure 3.3: Comparison of PZPtcCO2 by paired post embryonic (PPE) days, within each treatment...................................................................................... 93
Figure 3.4: Scatter plots comparing slopes of regression lines of PZPtcCO2 by paired post embryonic (PPE) days, within each treatment.............................. 94
Figure 3.5: Comparison of PZHR by treatment, within each post embryonic (PE) day..........96
Figure 3.6: Comparison of PZHR by paired post embryonic (PPE) days, within each treatment.......................................................................................97
Figure 3.7: Scatter plots comparing slopes of regression lines of PZHR by paired post embryonic (PPE) days, within each treatment.................................................98
Figure 3.8: Comparison of PZRR by treatment, within each post embryonic (PE) day........100
Figure 3.9: Comparison of PZRR by paired post embryonic (PPE) days, within each treatment.....................................................................................101
Figure 3.10: Comparison of PZAMP by treatment, within each post embryonic (PE) day....................................................................................... 103

viii
Figure 3.11: Comparison of PZAMP by paired post embryonic (PPE) days, within each treatment.................................................................................... 104
Figure 4.1: Comparison of weight gain between treatments over post embryonic days 30-33................................................................................... 127
Figure 4.2: Comparison fo PZPtcCO2 by treatment............................................................... 128
Figure 4.3: Comparison of slopes of PZPtcCO2 by treatment............................................... 130
Figure 4.4: Comparison of PZHR by treatment.................................................................... 132
Figure 4.5: Comparison of slopes of PZHR by treatment..................................................... 134
Figure 4.6: Comparison of PZRR by treatment.................................................................... 135
Figure 4.7: Comparison of PZAMP by treatment................................................................. 137

ix
Abstract
The current pathogenesis of Sudden Infant Death Syndrome (SIDS) is unknown.
Elevated endogenous ethanol production by gastrointestinal yeast has been proposed as a
possible mechanism for SIDS. To investigate the role of ethanol in SIDS, three studies were
undertaken. In the first study, transcutaneous blood gas technology was evaluated for repeated
monitoring of arterial blood gases. The second study identified the cardiorespiratory
responses to inhaled CO2 challenge in juvenile rats, to determine the age corresponding to the
age range of peak incidence of SIDS in human infants. Finally, utilizing the optimized
juvenile rat model, the cardiorespiratory responses to ethanol and CO2 challenge were
examined. The following observations were made: 1) A transcutaneous probe temperature of
44.5°C provided the best correlation with arterial blood gas levels, though extended skin
contact caused thermal burns. 2) The transcutaneous probe could be maintained in place for 3
hours utilizing probe temperatures of 44°C (adults) and 42°C (juveniles) without producing
thermal burns, while providing modest correlation between arterial and transcutaneous CO2.
3) On post embryonic (PE) days 30 & 31, pups exhibited higher heart rates and responded
more slowly to and recovered slower from CO2 challenge versus older ages tested. 4) On PE
days 30 and 31, pup respiratory rate was unchanged in response to 10 % inhaled CO2
challenge, whereas older animals decreased respiratory rate approximately 38 %. 5)
Simultaneous challenge with ethanol and CO2 inconsistently elevated transcutaneous CO2 to
levels over those observed for CO2 challenge alone. 6) Respiratory responses to modest levels

x
of CO2 and ethanol were ineffective in lowering transcutaneous CO2 levels. 7) Ethanol alone
elevated transcutaneous CO2 levels without a concurrent depression of respiration.
In summary, transcutaneous blood gas methodology provides an effective means of
serially monitoring changes in arterial CO2 concentrations in small rodents. Juvenile rats of
PE age 29 - 31 days (.post natal days 8- 10) provide a useful rodent model for future
investigations into the pathogenesis of SIDS. Finally, low blood ethanol concentrations may
exacerbate the effects of inhaled CO2 and should be further investigated as a mechanism for
the pathogenesis of SIDS.

1
Chapter 1
Introductionand
Literature Review

2
Overview of Sudden Infant Death Syndrome (SIDS)
The sudden and unexplained death of children has been known since antiquity. With
advancing medical knowledge, especially in the last 50 years, definitive diagnosis for the
cause of death has become more common. Yet even today there are a large number of
childhood deaths that remain undiagnosed. It is this subset of children that provided the
impetus for this research.
Our current definition of SIDS had its origins in the 1950s when the term “Cot Death”
was coined by A. M. Barret, a Cambridge pathologist. However, at the time the term also
included those deaths explained later by an autopsy (Limerick, 1992). Over time, the
definition narrowed with the introduction of the term Sudden Infant Death Syndrome in 1969
(Limerick, 1992). The World Health Organization (WHO) officially listed SIDS as a
registerable cause of death in 1979 (Limerick, 1992). At that time and until recently, deaths
attributed to SIDS involved children less than one year of age who died unexpectedly in bed,
where no cause of death could be found after pathologic examination. The definition of SIDS
has since been further modified. SIDS is currently defined as “the sudden death of an infant
under one year of age which remains unexplained after performance of a complete
postmortem investigation, including an autopsy, examination of the death scene, and review
of the case history” (Willinger et al., 1991).
Almost concurrent with the latest change in the definition of SIDS, side or supine
sleeping was endorsed by the American Academy of Pediatrics. Epidemiologic studies
established an association between prone sleeping and SIDS (Mitchell et al., 1991). With
these findings, as well as significant drops in the incidence of SIDS observed in countries

3
where supine sleeping was promoted, the “Back to Sleep Campaign” was launched in the
United States in 1994 to promote supine sleeping (Willinger et al., 1994).
Over the years, several etiologies have been proposed to explain SIDS. These include
infections (Blackwell et al., 1992; Howatson, 1992), metabolic disorders (Bonham and
Downing, 1992; Burchell et al., 1992), environmental perturbations (Kemp and Thach, 1993;
Lewis and Bosque, 1995), as well as cardiac (Schwartz et al., 1998; Ackerman et al., 2001)
and neurologic abnormalities (Kinney et al., 1991; O'Kusky and Norman, 1995; Carpentier et
al., 1998). Etiologies have often been intertwined and difficult to catagorize for discussion
purposes. Filiano and Kinney proposed the “Triple Risk Model”, in which SIDS cases are
thought to occur when a vulnerable infant (congenital defect, metabolic disorder, etc.), a
critical developmental period (2-4 months of age), and an exogenous stressor (infection, heat
stress, CO2 rebreathing, etc.) converge (Filiano and Kinney, 1994). This model was adopted
as the central hypothesis for the National Institute of Child Health and Human Development’s
(NICHD) strategic plan for SIDS research (Kinney et al., 2001b).
Epidemiology
SIDS, by current definition, occurs in children under one year of age, although deaths
after this time frame may also occur. Most cases have occurred between one month and six
months of age, with a peak around two to four months (Gibson, 1992; Carroll-Pankhurst and
Mortimer, 2001). The current incidence for SIDS reported in the United States and the United
Kingdom is roughly 0.75/ 1000 live births (Douglas et al., 1998; Malloy and Freeman Jr.,
2000). In the United States, the incidence varies between races (Native Americans, 1.51/1000;
African-Americans, 1.37/1000; Caucasians, 0.595/1000; Asian/Pacific Islanders, 0.394/1000;
Hispanics, 0.374/1000) (Mathews et al., 2000). Population characteristics have revealed

4
increased risk for males, low birth weight and/or gestational age, as well as young maternal
age and multiparity (Kohlendorfer et al., 1998; Malloy and Freeman Jr., 2000). The majority
of cases occurred during the night, were found in the prone position, occurred during the
winter, and often exhibited evidence of profuse sweating (Mitchell et al., 1991; Taylor et al.,
1996; Douglas et al., 1998; Gordon et al., 1999). Tobacco smoke has consistently been
identified as a risk factor for SIDS (Mitchell et al., 1991; Wigfield et al., 1994; Kattwinkel et
al., 2000). Other risk factors included formula feeding and maternal alcohol use (l'Hoir et al.,
1998; Alm et al., 1999).
Pathology
Conclusive diagnostic gross or microscopic lesions are absent. Certain lesions are
reported with greater frequency and can support a diagnosis of SIDS in the absence of a
definitive diagnosis (Byard and Krous, 2003). Externally, children appeared normal and in
good flesh with up to half of cases reported exhibiting frothy blood tinged fluid around the
nose (Berry, 1992; Krous et al., 2001a). Anterior hypostatic staining was often noted which
indicated death occurred in the prone position (Berry, 1992). Internal lesions included
intrathoracic petechia ($70 %), as well as prominent Peyer’s patches and lymph nodes
(Naeye, 1983; Berry, 1992; Becroft et al., 2001; Krous et al., 2001b). Other findings included
fully inflated lungs, liquid heart blood (80%), and an empty bladder (50%) (Berry, 1992).
Microscopically, mild pulmonary congestion, edema, and upper airway inflammation are
often noted along with occasional fibrinoid necrosis or thickening of the vocal chords (Berry,
1992; Shatz et al., 1994; Byard and Krous, 1995; Rambaud, 1997). Mild fatty changes and
persistent hematopoiesis have also be found in the liver (Berry, 1992).

5
Vulnerable Infant (Triple Risk Model of SIDS)
In recent years, perhaps no other area of SIDS research has stirred as much interest as
cardiac cycle abnormalities. The interest stems from a study by Schwartz et al. (1998), who
reported half of subsequent SIDS victims had elongated QT intervals when measured on the
third or fourth day of life, versus infants who died of other causes. Of equal interest was the
power of the study, where 34,442 infants had electrocardiograms recorded and 33,034 were
followed up one year later for interview (Schwartz et al., 1998). Increased or elongated QT
intervals are thought to promote cardiac arrhythmias, particularly ventricular arrhythmias,
with subsequent syncope and possibly death (Schwartz et al., 1998; Ackerman et al., 2001).
Long QT syndrome is a primary cardiac anomaly caused by mutations in ion channel genes
coding for sodium or potassium channels (Ackerman et al., 2001). Mutations in the sodium
channel gene (SCN5A) have been reported in two of 93 SIDS cases examined (Ackerman et
al., 2001). Long QT syndrome was shown to be heritable, while SIDS is not (Schwartz et al.,
1998).
Heart defects such as ventricular septal defects, vascular anomalies, and myocarditis
have been missed during initial autopsy (Shatz et al., 1994). Anomalies of the cardiac
conduction system have been reported including nodoventricular tracts, fasciculoventricular
tracts and fibromuscular hyperplasia of the nodal arteries, some of which have been found
infrequently in cases of SIDS. These anomalies may promote arrhythmias (Suarez-Mier and
Aguilera, 1998). To what extent cardiac anomalies are a direct cause of SIDS remains to be
elucidated.
Neuropathology has also received a great deal of attention in relation to SIDS. As
stated earlier, the “Triple Risk Model” is the central hypothesis of the NICHD strategic plan.

6
One third of this model involves an exogenous stress (i.e. cigarette smoke), while the other
two thirds address a critical developmental period along with some underlying vulnerability
(Filiano and Kinney, 1994). Many, including scientists in the NICHD relate the latter two
aspects of the Triple Risk Model to the brain or the conduction system, particularly those
areas involved in cardiorespiratory control (Filiano and Kinney, 1992; Kinney et al., 1992;
Kinney et al., 2001b). Early investigations focused on the ontogeny of myelination in the
brain and cranial nerves, where a delay in myelination was found in SIDS cases compared
with controls (Kinney et al., 1991; Becker et al., 1993). However, more recent investigations
reported no differences in myelination between SIDS cases and controls and this line of
investigation seems to have been abandoned (Lamont et al., 1995b; Pamphlett et al., 1996;
Weis et al., 1998). Discrete nuclei within the human brain stem have been shown to regulate
cardiorespiratory controls. These include the nucleus ambiguus, nucleus tractus solitarius,
pre-Bötzinger complex, reticular formation, and dorsal nucleus of the vagus (Sato et al., 1992;
O'Kusky and Norman, 1994; Rigatto et al., 1994). Chemosensitive zones reported to regulate
breathing in response to CO2 and hydrogen ions (H+) include the arcuate nucleus and nucleus
coterminalis (Filiano and Kinney, 1992). Early investigations, utilizing morphometric
analysis, found arcuate nucleus hypoplasia in a small subset of SIDS cases (Filiano and
Kinney, 1992). These findings were confirmed by others (Matturri et al., 2000). Increased
synaptic density with fewer neurons was reported within the hypoglossal nucleus of SIDS
cases compared with controls (O'Kusky and Norman, 1992). These reports inspired further
investigations in which increases in synaptic density were seen in the hypoglossal nucleus and
central reticular formation of children dying of SIDS (O'Kusky and Norman, 1994, 1995).
Furthermore, increased volume of the pons, nucleus pontis and medulla have also been

7
observed in children dying of SIDS (O'Kusky et al., 1995). It should be pointed out that
increases or decreases in volume, synaptic density, or neurons within the previously
mentioned nuclei were not found in all cases of SIDS. Additionally, other investigations
reported no differences within many of the same nuclei, utilizing similar methods of analysis
(Lamont et al., 1995a). Despite occasional conflicting results, investigations of the brain stem
have continued.
Somatostatin, a neuropeptide reported to be important in respiratory control, has been
shown to depress respiration in humans and animals (Saaresranta and Polo, 2002). Increases
in the density of somatostatin binding sites have been reported within respiratory nuclei of
SIDS cases, where elevations in binding are thought to be indicative of delayed CNS
maturation (Carpentier et al., 1998). Acetylcholine was shown to stimulate respiration and
appears to also modulate sleep. Binding sites for acetylcholine were found to be decreased
within the arcuate nucleus and hypothalamus in SIDS cases, versus controls (Sparks and
Hunsaker, 1991; Kinney et al., 1995; Saaresranta and Polo, 2002). Serotonin is another
neurotransmitter reported to stimulate ventilation and when lacking, may be associated with
obstructive sleep apneas (Di Pasquale et al., 1992; Morin et al., 1994). Utilizing tissue
autoradiography and a large data set (52 SIDS victims, 15 acute controls, 18 chronic
hypoxemia controls), Kinney and coworkers (2001a) demonstrated that serotonin binding
sites were decreased in SIDS cases versus controls. Furthermore, elevated levels of neuronal
apoptosis (> 20% positive neurons) were demonstrated in the brain stems of SIDS cases,
particularly within the nucleus tractus solitarius (Waters et al., 1999). In summary, these
reports suggest that CNS lesions may have a role in the pathogenesis of SIDS.

8
Lastly, inborn errors of metabolism have been proposed to account for 0.1-27% of
SIDS cases, yet controversy remains about the true incidence of these metabolic disorders
(Bonham and Downing, 1992; Wang et al., 2000). Disorders of fatty acid oxidation (FAO)
account for the bulk of research in this area with medium chain acyl CoA dehydrogenase
(MCAD) deficiency being the most prominent. Previously diagnosed SIDS cases have
subsequently been shown via DNA testing to have had MCAD deficiency, as well as other
FAO disorders (Kemp et al., 1996; Boles et al., 1998). To what extent congenital metabolic
deficiencies account for SIDS cases remains to be elucidated.
Critical Developmental Period (Triple Risk Model of SIDS)
As stated earlier, the peak incidence for SIDS is between two and four months of age
(Gibson, 1992; Carroll-Pankhurst and Mortimer, 2001). The first six months of human life are
reported to be a critical integration period for arousal and cardiorespiratory control. Stable
configuration of the system is established by approximately six months of age (Kinney et al.,
1992; Kralios and Kralios, 1996; Kahn et al., 1997; Patzak, 1999). Periodic breathing,
characterized by periods of deep breaths followed by short shallow breaths or cessation, are
reported to start during the first few days of human life and to decrease rapidly after the fourth
month of life (Patzak, 1999). Responses to CO2 challenge in infants are reported to vary with
age. Specifically, respiratory responses to challenge with CO2 are less robust in children three
months of age than for children one or six months of age (Campbell et al., 1998). SIDS cases
are reported to occur more often at night, with a peak around 4 A.M. (Kelmanson, 1991).
Circulating histamine levels are elevated while epinephrine is reported to be depressed at 4
A.M. (Kraft and Martin, 1995). Asthma attacks are reported more commonly at night than
during the day (Kraft and Martin, 1995). Furthermore, blood pressure and heart rate are

9
reported to be at their nadir in humans around 4-5 A.M. (Kraft and Martin, 1995). These
developmental changes and/or circadian rhythms, emphasize the vulnerability of infants
during the first few months of life, yet their role in SIDS remains to be determined.
Exogenous Stress (Triple Risk Model of SIDS)
To date no single infectious agent has been consistently associated with SIDS.
However, several organisms have been implicated as part of potential mechanisms for SIDS,
or have been found in association with SIDS cases more often than in control infants. Further
support of an infectious link resides with an increased incidence of SIDS in the winter
months, when common respiratory infections are more prevalent (Douglas et al., 1998;
Mitchell et al., 1999). Using extensive microbiological screening, one group reported that in
89% of SIDS cases, there was evidence consistent with, or suggestive of, various viral and
bacterial agents (Rambaud et al., 1999). Viral agents, including influenza, cytomegalovirus,
respiratory syncitial virus and others, have been implicated in a SIDS cascade where they set
the stage for bacterial infection or proliferation (Blackwell et al., 1992; Bajanowski et al.,
1996). Evidence for their inviolment stems from reports of mild snuffles or coughing prior to
death, in addition to finding mild upper respiratory inflammatory lesions (Berry, 1992;
Fleming, 1992; Raza and Blackwell, 1999). Alternatively, or in addition to setting the stage
for bacterial infections, viral infections have been shown to induce inflammatory cytokines
such as tumor necrosis factor " (TNF-"), interferon (IFN), and interleuken 1 (IL-1).
Elevations in the levels of these cytokines may play a direct role (hyperthermia, somnolence)
in the pathogenesis of SIDS (Howatson, 1992; Raza and Blackwell, 1999). Several bacterial
agents, including Staphylococcus aureus, Clostridium spp., Escherichia coli, and Bordetella
pertussis have been implicated in SIDS, primarily due to their ability to cause death by toxin

10
production while leaving little or no histologic evidence of their presence (Blackwell et al.,
1992; Heininger et al., 1996). Working alone or in concert with viral agents, bacterial
organisms may elevate inflammatory cytokines, exacerbating the effects of any toxins
produced. More recently a connection between prone sleeping and toxin production by
Staphylococcus aureus has been identified. Nasal temperatures were elevated while sleeping
prone, often to a level needed for toxin production by Staphylococcus (Molony et al., 1999).
Total bacterial colony counts of nasal swabs were also statistically elevated in the prone
versus supine sleeping position (Bell et al., 1996).
Helicobacter pylori has recently been associated with SIDS. Samples of lung, trachea,
and stomach were assessed by polymerase chain reaction (PCR) assay. Results revealed a
marked increase in H. pylori incidence in SIDS victims (25 of 28 cases) over controls (1 of 8
controls) (Kerr et al., 2000). While Kerr and coworkers provided compelling evidence of an
association between SIDS and H. pylori, others have found no association, or criticize the
choice of controls and proposed mechanism of action (Elitsur et al., 2000; Blackwell et al.,
2001; Leung et al., 2001; Marshall and Ho, 2001; Rowland and Drumm, 2001). It was
proposed H. pylori gained entry to the lungs via aspiration of gastric contents. Thereafter,
urease enzymes of H. pylori split plasma urea leading to ammonia toxicosis and death (Kerr et
al., 2000). Evidence of minor gastric aspiration has been found in 32.5% of SIDS cases
(Rambaud et al., 1999). However, aspiration pneumonia has not been associated with SIDS
and results reported by Kerr and coworkers (2000) may have resulted from terminal aspiration
at death.
Pneumocystis carinii is a fungal organism inhabiting the lungs of humans and other
species. P carinii causes disease primarily in immunocompromised patients (Latouche et al.,

11
1998). Recently, it was reported that 35% of SIDS cases in Santiago Chile and 14.8% of SIDS
cases in Oxford England had histologic confirmation of P. carinii, versus 2.9% of controls
(Vargas et al., 1999). A similar study in the United States revealed 14% of SIDS cases had
histologic confirmation of the same organism (Morgan et al., 2001). Whether or not P. carinii
is associated with SIDS remains to be demonstrated. P. carinii may reduce lung surfactant,
resulting in death of children with SIDS (Vargas et al., 1999). Previously, decreased lung
surfactant was demonstrated in SIDS cases when compared to levels found in controls (James
et al., 1990). Whether or not any of these infectious agents will be causally linked to SIDS
remains to be seen.
Iron was found to be significantly elevated in liver tissue from SIDS cases (Moore and
Worwood, 1989; Moore et al., 1994). A previous study reported no differences in iron levels
in SIDS versus controls, however their case selection included children as old as nine years of
age (Dahro et al., 1983). Plasma ferritin levels, which reflect iron storage concentrations,
were assessed retrospectively from blood obtained at birth. No differences were demonstrated
between controls and SIDS cases. These findings suggested that the accumulation of iron
appeared to occur after birth (Raha-Chowdhury et al., 1996). The risk of SIDS has been
shown to increase dramatically with exposure to environmental tobacco smoke, and
moderately with formula feeding (Mitchell et al., 1996; Kattwinkel et al., 2000). Many infant
formulas contained elevated iron levels in comparison to breast milk, while iron was
demonstrated in cigarette smoke which could be absorbed by the lungs. Both of these factors
may have elevated serum and liver iron (Weinberg, 2001). Regardless of the source, elevated
iron levels could promote growth of toxin-producing bacteria, possibly leading to a case of
SIDS (Moore et al., 1994; Weinberg, 2001).

12
Magnesium deficiency has also been implicated in SIDS cases. Caddell, in a series of
manuscripts, hypothesized that magnesium deficiency could be a major cause of SIDS
(Caddell, 2001c, 2001b, 2001a). Magnesium deficiency is reportedly associated with cardiac
arrhythmias, by increasing the QT interval, possibly leading to torsade de pointes (Singh et
al., 1992). Investigations have shown that depleted magnesium concentrations increased
vascular tone and constricted vessels within the myocardium and brain (Leary and Reyes,
1983). Futhermore, Caddell examined dietary magnesium consumption in relation to ethnicity
and found the incidence of SIDS to be inversely related to dietary magnesium levels,
regardless of socioeconomic status (Caddell, 2001a). Tissue magnesium levels have not been
measured in SIDS cases, though future investigations are warranted.
In the northern and southern hemispheres, SIDS occurs more commonly in the winter
months (Mitchell et al., 1991; Gibson, 1992). Recent studies have confirmed this finding,
even though the overall rate of SIDS has dropped in recent years (Douglas et al., 1998;
Mitchell et al., 1999). The reasons for a seasonal incidence remain unclear. However, two
branches of thought have attempted to explain this phenomenon. The first involves infectious
agents, as previously discussed. The second involves heating of the child’s room during the
winter months. Some have proposed that heating the child’s room, along with the use of
additional clothing and blankets may overwhelm the child’s ability to regulate body
temperature (Fleming et al., 1992; Ponsonby et al., 1992). Animal studies have demonstrated
adverse effects of elevated temperature on respiratory drive and rhythm (Ni et al., 1996;
Cameron et al., 2000).
The prone sleeping position is a known risk factor for SIDS (Mitchell et al., 1991;
Wigfield et al., 1994). In the United States and other countries, the incidence of SIDS has

13
dropped approximately 50% since programs began promoting the supine sleeping position
(Wigfield et al., 1994; Hirschfeld, 1995; Kattwinkel et al., 2000). Mechanisms proposed for
the increased risk of prone sleeping included elevated body temperatures and increased CO2
rebreathing. It has been shown that infants sleeping prone exhibited higher heart rates and
elevated skin temperatures compared with infants sleeping in the supine position (Skadberg
and Markestad, 1997a). Additionally, the elevated body temperatures recorded while sleeping
prone promote the growth of toxigenic bacteria (Molony et al., 1999). Alternatively, many
have investigated rebreathing of CO2 as a potential mechanism for SIDS. Mechanical and
computer modeling have demonstrated the potential for moderate to high (5 - 28 %)
concentrations of CO2 to accumulate in the microenvironment of children sleeping prone or
nestled deeply within blankets (Ryan, 1991; Skadberg et al., 1995; Carleton et al., 1998).
Furthermore, the potential for development of high CO2 levels is reported to be exacerbated
by soft bedding material (Kemp and Thach, 1993, 1995; Carleton et al., 1998). It has also
been demonstrated that the respiratory response to CO2 challenge is not as robust in infants
three months of age, versus infants one or six months of age (Campbell et al., 1998).
Additionally, infants two and one-half months of age demonstrated a decreased ability to
remove blankets covering their heads versus that observed in children five months of age
(Skadberg and Markestad, 1997b). The mechanism by which the prone sleeping position
increases the risk for SIDS remains to be elucidated, yet the association is clear and further
investigation is warranted.
The association between SIDS and smoking is well established. Risk varied with dose
(number of cigarettes/day) and location (inside the home, outside, in the child’s bedroom,
etc.) (Mitchell et al., 1991; Mitchell et al., 1995). Prenatal and postnatal exposure to cigarette

14
smoke are reported to be independent risk factors, where in utero exposure exhibited the
highest risk (Blair et al., 1996). Paternal smoking also represented an independent and
additive level of risk (Blair et al., 1996). Blair and coworkers (1996) proposed that up to two
thirds of deaths attributed to SIDS could be avoided if the parents did not smoke. The
mechanisms of the deleterious effects of tobacco smoke are unknown. The studies are
complicated by the fact that there are over 4000 compounds in tobacco smoke (Klus et al.,
1985; 1988; Smith and Hansch, 2000). Results from studies involving hypoxic or hypercapnic
challenge in infants of smoking mothers have yielded conflicting results. Lewis and Bosque
(1995) reported decreased hypoxia awakening responses for children of smoking mothers
versus non-smoking mothers. Moreover, they reported no differences between the two groups
when challenged with simultaneous hypoxia and hypercapnia (Lewis and Bosque, 1995).
More recent reports revealed no awakening response differences between groups following
hypoxic challenge, while children of smoking mothers had elevated awakening responses to
simultaneous hypoxic and hypercapnic challenge (Campbell et al., 2001). To our knowledge,
no animal studies have specifically addressed arousal or respiratory responses for animals
exposed to cigarette smoke before or after birth. In rats, prenatal and postnatal exposure to
cigarette smoke increased airway responsiveness and neuroendocrine cell numbers while
decreasing airway compliance (Joad et al., 1995). Increased airway hyperreactivity has also
been demonstrated in guinea pigs exposed to cigarette smoke (Lai et al., 1994).
The vast majority of reports which investigated the association of smoking and SIDS
concentrated on nicotine. Cotinine, the primary nicotine metabolite, was found at much higher
levels in the pericardial fluid of SIDS cases versus controls (Milerad et al., 1998). In rats,

15
prenatal exposure to nicotine decreased the number of successful autoresuscitations (anoxic
challenge), depressed resting ventilation (normoxia or hypoxia), and depressed the hypoxic
respiratory response (8% O2) (St.-John and Leiter, 1999; Fewell et al., 2001b). Additionally,
prenatal nicotine exposure increased mortality, increased norepinephrine release in the central
nervous system (CNS), and decreased catecholamine release from the rat adrenal gland in
response to hypoxic challenge (Slotkin et al., 1995). Control of catecholamine and
norepinephrine release is important for normal cardiorespiratory development and
cardiorespiratory homeostasis (Slotkin et al., 1995). Nicotine also increased synthesis and
release of dopamine at the carotid body, which depressed hypoxic ventilatory responses and
altered development of normal hypoxic response (Holgert et al., 1995).
Animal Models of SIDS
Animal models of human disease have been divided into two broad categories;
spontaneous and induced models. No spontaneous animal model of SIDS has been reported.
Swine were specifically investigated as a model for spontaneous SIDS, but without success
(Lavoue et al., 1994). Because the cause of SIDS is unknown, no induced models of SIDS
have been developed. Further complicating matters, developmental and environmental risk
factors reported for SIDS would need to be addressed in the animal model while
simultaneously investigating a given etiology (Blackwell et al., 1999). In spite of these
limitations, a few species have been proposed as either spontaneous or induced SIDS models,
while other species have been utilized to investigate specific risk factors of SIDS.
A line of German shepherd dogs is reported to exhibit sudden death around five
months of age. Death is thought to be due to ventricular arrhythmia similar to that reported
with long QT interval syndrome, though long QT intervals are not reported in these dogs

16
(Merot et al., 2000). Specific claims for use of these dogs as a spontaneous model for SIDS
have not been reported. However, because sudden unexpected death from acute cardiac
failure has been proposed for SIDS, further investigation of this canine line appears warranted
(Schwartz et al., 1998; Merot et al., 2000).
The stressed, magnesium deficient rat has been proposed as an induced model of SIDS
(Caddell, 2001c). In this model, juvenile rats (28-32 gm) were fed a magnesium deficient diet
for six days. This diet induced seizures, often followed by death. Moreover, lesions consistent
with SIDS such as lung edema, blood tinged froth at the nares, and cyanosis, were reported
(Caddell, 2001c). Furthermore, the author reported rats of this age were in a critical
developmental period, yet supporting evidence for that claim was not provided. Finally,
similar if not identical signs and lesions were reported in older rats tested under a similar
paradigm (Nakamura et al., 1995). Further investigation with tissues from SIDS cases should
provide evidence critical for future consideration of this model and hypothesis.
In addition to the previous model, rats have been used to investigate other hypotheses
regarding the pathogenesis of SIDS. Investigations of prenatal nicotine exposure in rats
revealed that nicotine decreased the respiratory response to hypoxia, possibly through
depression of adrenal catacholamine release (Slotkin et al., 1995; St.-John and Leiter, 1999;
Fewell et al., 2001a). Prenatal nicotine exposure also lowered dopamine content within the
carotid bodies, and when combined with hypoxia resulted in damage to cardiac myocytes
(Holgert et al., 1995; Tolson et al., 1995). Utilizing weanling gnotobiotic rats, combinations
of nasal bacterial isolates obtained from SIDS cases caused sudden death, with lesions similar
to those reported for SIDS (Lee et al., 1987). Using Swiss Webster mice, cardiac glycogen
levels have been shown to vary with age. Low concentrations of cardiac glycogen are thought

17
to be responsible for failure to autoresuscitate after exposure to acute hypoxia (Deshpande et
al., 1999). Guinea pigs have been extensively studied in respiratory physiology and pathology
(Friberg et al., 2001; Li et al., 2001b). Environmental tobacco smoke exposure excited
afferent lung C fibers, as well as nucleus tractus solitarius neurons, which prolonged
expiratory apnea in the young guinea pigs. This finding may help explain the association
between smoking and SIDS (Bonham et al., 2001). Adult and fetal rabbits have also been
used to investigate potential etiologies of SIDS. Studies have focused on cocaine exposure,
toxigenic bacteria, and rebreathing of CO2 (Gingras and Weese-Mayer, 1990; Kemp and
Thach, 1993; Siarakas et al., 1997). Rabbits are particularly useful models for investigating
potential relationships between enterotoxin production and SIDS (Siarakas et al., 1997).
Swine have also been utilized in attempts to create animal models for SIDS. Tong and others
(1995) (Tong et al., 1995) induced autonomic cardiac imbalance in swine via right or left
stellate ganglionectomy in a effort to induce SIDS. While results were encouraging, further
investigations using this surgically induced model have not been forthcoming. Because SIDS
may be associated with thermal stress, Elder and coworkers (1996) (Elder et al., 1996)
utilized 5 - 6 day old swine to investigate the effects of hyperthermia. They reported lung
edema and hemorrhage consistent with that reported in SIDS. As with the previous swine
model of SIDS, further reports of investigations with these models have not surfaced. Sheep
have also been used to investigate SIDS, where IV nicotine depressed arousal and respiratory
responses to hypoxic challenge (Hafstrom et al., 2000). It remains to be seen whether this
model will provide useful information on the pathogenesis of SIDS.
Animal models for human disease are often developed with full knowledge of the
disease etiology. Because this is not the case for SIDS, future animals models should mimic

18
normal cardiorespiratory and neurologic development reported for infants two to four months
of age. The model would be further enhanced if risk factors such as rebreathing of CO2,
exposure to cigarette smoke, thermal stress, and others, were incorporated into the model.
Discovery of the etiology of SIDS, will facilitate the development of multiple animal models
suitable for investigation of pathophysiologic mechanisms.
Endogenous Ethanol Production and SIDS
While many hypotheses have been proposed for SIDS, we now concentrate on one of
the more obscure. Heavy alcohol exposure in utero has long been associated with fetal alcohol
syndrome (FAS). Extensive research in this area has elucidated many details of transplacental
alcohol exposure, including levels and timing of alcohol exposure, organs affected,
phenotypic expression, and long term effects and sequelae of FAS. Alcohol consumption has
also been associated with SIDS. Current epidemiologic evidence supports an association with
alcohol when consumed during pregnancy in Native Americans (Iyasu et al., 2002). Increased
risk has also been recognized when the mother consumed alcohol just prior to the death of the
child (l'Hoir et al., 1998; Alm et al., 1999). It was suggested that alcohol consumption may
have depressed cognitive function of the mother, therefore lowering attentiveness to her child
(l'Hoir et al., 1998).
Bivin and Heinen (1985) reported that substantial levels of alcohol were produced in
vivo by various species of yeast, including Candida albicans, C. tropicalis, Saccharomyces
cerevisiae, and Torulopsis glabrata. These are known to inhabit the gastrointestinal tract of
humans. Their investigation was inspired by reports of excessive alcohol production by
overgrowth of gastrointestinal yeast in a condition known as “Auto-Brewery Syndrome” (Kaji
et al., 1976). More recently, new cases of this syndrome in adults have been reported (Kaji et

19
al., 1984). In their work, Bivin and Heinen (1985), assessed various glucose/sucrose
solutions, and three brands of infant formula, as substrates for ethanol production by the
above named fungi. The highest levels of ethanol were produced with infant formulas (up to
1.17 mg % at 24 hrs.). The authors proposed a relationship between endogenous ethanol
production and SIDS (Bivin and Heinen, 1985). This relationship has been supported by the
subsequent work of others (Mitchell et al., 1991; l'Hoir et al., 1998). Still others have
dismissed any link between endogenous ethanol production and SIDS, asserting that the liver
would metabolize ethanol at a much greater rate than it could be produced. Therefore, ethanol
levels in the intestine, and blood alcohol concentrations (BAC) would be essentially zero
(Geertinger et al., 1982). The same authors also reported maximal ethanol production of 1 mg
/ gm feces when glucose solutions were inoculated with fecal contents from SIDS cases
(Geertinger et al., 1982). Additionally, BAC levels were measured in eight SIDS cases and no
ethanol was detected (Geertinger et al., 1982). Prior toxicologic examinations of SIDS cases
were mixed while subsequent studies have not reported detectable levels of ethanol (Smialek
and Monforte, 1977; Finkle et al., 1979; Langlois et al., 2002). Although admitting that more
stringent detection methods by others revealed BAC of up to 0.08 mg/dl from endogenous
ethanol production, the connection between ethanol and SIDS was determined to be untenable
(Geertinger et al., 1982).
The assumptions of Geertinger and coworkers (1982) were based on adult liver
ethanol metabolizing capacity. Liver alcohol dehydrogenase (ADH) activity at two and seven
months of age is approximately 20% and 36% of adult levels respectively (Pikkarainen and
Raiha, 1967). Additionally, the levels of fecal or Candida spp. alcohol production reported
utilized glucose solutions as the substrate (Geertinger et al., 1982). Biven and Heinen (1985)

20
demonstrated that the highest levels of alcohol were produced using infant formula as a
substrate. Furthermore, in the study by Geertinger and coworkers (1982), fecal specimens and
blood samples were obtained from SIDS cases which were breast fed for at least two weeks,
with half of the cases still being breast fed at the time of death. Gastrointestinal fermentation
is different in breast fed compared to bottle fed infants (Lifschitz et al., 1990). Therefore, the
conclusions of Geertinger and coworkers (1982) should be brought into question.
Ethanol, whether endogenously produced or exogenously derived, has been shown to
affect several of the systems, organisms, and minerals implicated in, or associated with SIDS.
In an effort to further establish the potential link between ethanol and SIDS, the following
summary will address the effects of ethanol on these systems, organisms and minerals in the
same order as they were presented in the preceding text. Thereafter, sources of endogenous
ethanol will be addressed.
Schwartz and colleagues reported an increased risk for SIDS in infants which
exhibited long QT intervals when measured on the third or fourth day of life. Chronic or acute
ethanol exposure lengthens QT intervals in humans and rats (Hillbom and Von Boguslawsky,
1978; Otero-Anton et al., 1997; Rossinen et al., 1999). Reports in humans indicate that heart
rate is elevated by either acute or chronic ethanol exposure (Murata et al., 1994; van de Borne
et al., 1997). The effects of acute ethanol exposure on heart rate, and heart rate variability,
appeared to be induced by increased sympathetic tone, while chronic ethanol effects were
dominated by decreased parasympathetic tone (Murata et al., 1994; van de Borne et al., 1997).
Long QT interval as well as increased sympathetic or decreased parasympathetic tone have
been associated with potentiation of ventricular arrhythmias (Murata et al., 1994; Malik et al.,

21
1996; Otero-Anton et al., 1997). Therefore, the ability of ethanol to prolong the QT interval
appears to warrant further investigation in relation to SIDS.
Ethanol exposure is reported to decrease myelination in rat and mouse models of FAS
(Phillips et al., 1991; Parson and Sojitra, 1995). Ethanol exposure (BAC . 150 mg/dl) during
the brain growth spurt induces neuronal death within the cerebellum, hippocampus, and
sensory nucleus of the trigeminal nerve (Bonthius and West, 1991; Miller, 1995, 1996).
Neuronal death induced by ethanol administered during the brain growth spurt is mediated by
blockade of n-methyl-d-aspartate (NMDA) receptors, or activation of gamma-aminobutyric
acid (GABA) receptors. Both of these phenomena may lead to apoptosis (Bhave et al., 2000;
Ikonomidou et al., 2001). The hypoglossal nucleus, which reportedly innervates the upper
airways, is suppressed by 50 mM ethanol when applied to brain slices (Gibson and Berger,
2000). Ethanol doses as low as 3 mM suppressed hypoglossal, but not phrenic nerve activity
when applied to whole brain stems in vitro (Di Pasquale et al., 1995).
Muscarinic cholinergic receptors were reported to be decreased in the arcuate nucleus
in some cases of SIDS (Kinney et al., 1995). Muscarinic receptors, along with nicotinic
cholinergic receptors are reported to be important for respiratory drive and are found on
neurons which provide the chemosenitive drive for respiration (Shao and Feldman, 2000,
2001; Bellingham and Ireland, 2002). While reduction of cholinergic receptors from ethanol
toxicity has not been reported, ethanol was shown to depress muscarinic receptor-stimulated
phosphoinositide metabolism, and depressed nicotinic receptor-stimulated ion current (Nagata
et al., 1996; Yu et al., 1996).
Studies utilizing tissue autoradiography or immunohistochemistry have demonstrated
decreased serotonin receptor binding or immunoreactivity, respectively, within the arcuate

22
nucleus of SIDS cases (Kinney et al., 2001a; Ozawa and Okado, 2002). Serotonin is reported
to modulate respiration in rats and has been shown to increase the frequency of respiratory
action potentials in the ventral respiratory group (Di Pasquale et al., 1992). Moreover,
serotonin-induced action potentials were specifically generated within the pre-Bötzinger
complex, which is located within the ventral respiratory group (Schwarzacher et al., 2002).
Dose-dependent hypotension was induced by serotonin agonist injected within the nucleus
tractus solitarius. This suggested that serotonin may also play a role in baroreceptor reflexes
(N'Diaye et al., 2001). Acutely, ethanol increased serotonin levels in the medulla and pons
(Lafuente et al., 1992). Additionally, ethanol was shown via patch clamp techniques, to
potentiate the effects of serotonin at the serotonin receptor (Grant, 1995). In contrast, chronic
ethanol exposure in rats, as well as in human alcoholics, depressed serotonin levels and
decreased serotonin transporters and serotonergic nuclei (Gothoni and Ahtee, 1980; Halliday
et al., 1995; Heinz et al., 1998). Furthermore, rats and mice exposed prenatally to ethanol
were shown to have lower levels of serotonin and serotonin receptors, as well as poorly
differentiated serotonergic neurons (Druse et al., 1991; Zhou et al., 2001).
Ethanol is reported to depress the immune system. Specifically, prenatal ethanol
exposure depressed mitogenic responses of T- and B-cells, and lowered the total numbers of
B-cells in mice (Giberson and Blakley, 1994; Wolcott et al., 1995). Furthermore, ethanol
depressed chemotaxis and oxidative burst of human neutrophils in-vitro (Patel et al., 1996).
Ethanol also depressed T- and B-cell responses to Trichinella spiralis challenge in neonatal
rats (Seelig et al., 1996). With the recent association of P. carinii and SIDS, review of the
literature revealed ethanol suppression of immune responses to P. carinii in mice (Shellito,
23
1996; Shellito and Olariu, 1998). Therefore, depression of immune responses by endogenous
ethanol production may explain the association between SIDS and P. carinii.
Previously, we discussed elevated serum and hepatic iron levels in SIDS, as well as
the hypothetical role of low magnesium SIDS. Chronic exposure to ethanol elevates serum
and hepatic iron levels in humans and rats (Valerio et al., 1996; Whitfield et al., 2001)
(Fletcher, 1996). Chronic ethanol has been shown to deplete magnesium in humans and rats
(Wu and Kenny, 1996; Pasternak, 1999; Kisters et al., 2000). Acute ethanol also depletes
magnesium in cultured rat astrocytes (Li et al., 2001a). These reports further justify the
investigation of ethanol in the pathogenesis of SIDS.
In the preceding discussion the strong association of SIDS with sleeping in the prone
position was addressed, where many hypothesized rebreathing of CO2 as the final pathway
leading to SIDS. Ethanol depressed the response to CO2 challenge in adult humans, and
induces hypothermia and hypoxia in rats (Johnstone and Reier, 1973; Duffin et al., 1978;
Michiels et al., 1983; Murray et al., 1986). The combined effects of ethanol and CO2
challenge have not been reported in infants, nor have they been examined in adult or juvenile
rats.
Ethanol may exacerbate the risk of SIDS resulting from exposure to environmental
tobacco smoke. As with ethanol, the reported effects of nicotine on serotonergic neurons or
serotonin concentrations varied considerably. Studies have reported nicotine increased
discharge of dorsal raphe serotonergic neurons, elevated release of serotonin (dorsal raphe
nucleus, cortex, hippocampus, striatum and spinal chord) and increased densities of serotonin
transporter expression in the forebrain of prenatally exposed juvenile rats (Guzman-Marin et
al., 2001; Muneoka et al., 2001). In contrast, others have demonstrated that prenatal nicotine

24
exposure decreased serotonin transporter density in the cortex of rats (Xu et al., 2001).
Furthermore, immunohistochemistry revealed decreased serotonin positive cells in both the
dorsal and median raphe nuclei of juvenile rats exposed to nicotine and ethanol (Jang et al.,
2002).
Tobacco smoke and the products of ethanol metabolism are known to have a toxic
compound in common: acetaldehyde. Alcohol is primarily oxidized to acetaldehyde by
several isoenzymes, collectively called alcohol dehydrogenases (Riveros-Rosas et al., 1997).
Acetaldehyde is further oxidized to acetate by another group of enzymes, termed aldehyde
dehydrogenases (Riveros-Rosas et al., 1997). Other pathways are known to exist for ethanol
and acetaldehyde oxidation. Some of these are specific to certain body systems. However,
those previously mentioned are responsible for the majority of ethanol and acetaldehyde
metabolism (Riveros-Rosas et al., 1997). Elevated levels of acetaldehyde have been reported
in alcoholics (Shaskan and Dolinsky, 1985; Pratt et al., 1990). Acetaldehyde is more toxic
than ethanol. Modest levels of acetaldehyde were directly toxic in vitro to cortical neurons,
and low levels induced apoptosis in cultured rat astrocytes (Holownia et al., 1999; Wan et al.,
2000). Within the brain, mitochondrial aldehyde dehydrogenases were the predominate
enzyme system for removal of acetaldehyde (Zimatkin et al., 1992). Furthermore, the regional
distribution of mitochondrial aldehyde dehydrogenase revealed the highest levels of this
enzyme within the arcuate nucleus and hypothalamus (Zimatkin et al., 1992). A genetic defect
which rendered mitochondral aldehyde dehydrogenase ineffective would set the stage for
acetaldehyde neuronal toxicity precisely within the brain stem nuclei known to control
respiration. Acetaldehyde was also reported in tobacco smoke, where the average cigarette
contained 709 ug (Smith and Hansch, 2000). Circulating acetaldehyde levels in smokers are
25
not different than levels measured in non-smokers. This indicated that acetaldehyde was not
absorbed in the lungs, or alternatively, was metabolized prior to gaining entry to the blood
stream (McLaughlin et al., 1990). To our knowledge, circulating acetaldehyde levels have not
been measured in infants exposed to cigarette smoke.
We have presented multiple potential pathways whereby ethanol may exert effects
relevant to the pathogenesis of SIDS. Hereafter we reviewed potential sources of endogenous
ethanol production. Ethanol is reported to be produced endogenously, primarily by
gastroentestinal flora, with BAC concentrations ranging between 0.1 and 1 mM in adult
humans (Riveros-Rosas et al., 1997). BAC concentrations this low would normally be
dismissed as having no clinical or psychological effect. However, levels of ethanol in this
range administered for treatment of alcohol withdrawal symptoms were palliative (Lands,
1998). Bivin and Heinen (1985) suggested that there may be a connection between auto-
brewery syndrome and SIDS. In humans, BAC of .250 mg/dl have been reported in auto-
brewery syndrome cases after consuming a high carbohydrate meal, which provided substrate
for fungal ethanol fermentation (Kaji et al., 1976; Kaji et al., 1984). Recently, auto-brewery
syndrome induced by Candida glabrata and Sacchromyces cerevisiae, was reported in a
juvenile with short gut syndrome, where BAC of .300 mg/dl were measured (Dahshan and
Donovan, 2001). Auto-brewery syndrome, attributed to Torulopsis spp, has also been reported
in young animals consuming milk replacers, where BAC of .400 mg/dl were demonstrated
(White et al., 1972; White, 1974). The BAC generated in auto-brewery syndrome would equal
or often exceed ethanol levels required to generate the effects of ethanol previously described
in the nervous, cardiac and respiratory systems. Therefore, auto-brewery syndrome potentially
provides a source of elevated ethanol which may play a role in the pathogenesis of SIDS.

26
A thorough literature review revealed no prospective investigations examining the
effects of ethanol levels normally achieved by endogenous production, on any of the body
systems previously reviewed. Endogenous ethanol production may be modestly elevated in
formula fed children. Differences in gastrointestinal flora and carbohydrate fermentation have
been demonstrated between breast fed and formula fed infants (Lifschitz et al., 1990; Edwards
et al., 1994; Harmsen et al., 2000). Microbial ethanol production has been demonstrated in
glucose inoculated with fecal suspensions from exclusively breast fed infants and it was
suggested ethanol production should also be examined in exclusively bottle fed infants
(Wolin et al., 1998). Infant formulas were demonstrated in vitro to be a superior substrate
when compared to glucose for ethanol production by various enteric fungal organisms (Bivin
and Heinen, 1985). Should formula fed infants demonstrate higher endogenous ethanol
production levels versus that seen in breast fed infants, the elevated ethanol levels obtained
would provide further justification for future examination of the relationship between SIDS
and ethanol. Alternatively, elevated BAC may be achieved systemically or locally, if one or
more of the enzymes which metabolize ethanol were defective, leading to a slow rise in BAC.
Recently, the presence of the ADH2*3 allele of alcohol dehydrogenase Class I enzyme was
shown to confer protection from fetal alcohol effects in African-Americans (McCarver et al.,
1997). Furthermore, the level of protection provided by the ADH2*3 allele was not dependent
on the level of ethanol consumption (McCarver et al., 1997). Mitochondral Class II aldehyde
dehydrogenase also exhibits polymorphisms which are reported to be more common in certain
races. The ALDH2*2 allele of Class II aldehyde dehydrogenase has been demonstrated to be
defective, leading to a build up of acetaldehyde, which is associated with flushing after
alcohol consumption in Asian and some Native American populations (Riveros-Rosas et al.,

27
1997; Gill et al., 1999). Of equal interest, flushing is also seen in some Native Americans who
do not possess the ALDH2*2 allele (Gill et al., 1999). Variations in the ALDH2 genotype are
also reported to be strongly correlated with alcohol consumption in Japanese men (Okamoto
et al., 2001). We should reiterate, the rates of SIDS in African-Americans and Native
Americans were more than double the rates reported for other races in the United States
(Mathews et al., 2000).
In summary, we have proposed three potential mechanisms for elevation of ethanol
concentrations. Specifically, they include the auto-brewery syndrome, feeding of infant
formula, and atypical ethanol and/or acetaldehyde metabolizing enzymes. Taken together,
along with the effects of ethanol potentially associated with SIDS, they provide ample
justification for investigation of the role of ethanol in the pathogenesis of SIDS.
Objectives
The objectives of this project are two-fold. The first objective is to develop an induced
animal model of SIDS. The second objective is to initiate and investigate the effects of
ethanol and elevated inhaled levels of CO2 on cardiorespiratory responses thought to be
defective in SIDS. Further understanding of these interactions will not only serve our
investigation, but should expand the knowledge base concerning the effects of ethanol and
CO2 in rodents, as well as their potential effects in humans.
Specific Aims
1. Develop and/or validate a method to assess the arterial partial pressure of O2 and CO2 for
use in rodents. Such a method would minimize or eliminate blood sample collections
normally required for blood gas assessment. Assessment of blood gases are required to

28
measure the effectiveness of respiratory responses induced by the compounds in question.
2. Utilize the technology developed or validated for specific aim 1 to ascertain the optimum
age of the rat wherein cardiorespiratory responses to CO2 challenge mimic those seen in
human infants 2-4 months of age.
3. Utilize the technology and the optimum age rat determined in specific aims 1 and 2 to
investigate the cardiorespiratory responses to combined ethanol and CO2 challenge in an
effort to investigate their potential roles in the pathogenesis of SIDS.
Bibliography
1988. Chemical composition of new cigarette smoke. In: New Cigarette Prototypes That HeatInstead of Burn Tobacco. Winston-Salem: R.J. Reynolds Tobacco Company. p 119-180.
Ackerman MJ, Siu BL, Sturner WQ, Tester DJ, Valdivia CR, Makielski JC, Towbin JA.2001. Postmortem molecular analysis of SCN5A defects in sudden infant deathsyndrome. The Journal of the American Medical Association 286:2264-2269.
Alm B, Wennergren G, Norvenius G, Skjaerven R, Oyen N, Helweg-Larsen K, LagercrantzH, Irgens LM. 1999. Caffeine and alcohol as risk factors for sudden infant deathsyndrome. nordic epidemiological SIDS study. Archives of Disease in Childhood81:107-111.
Bajanowski T, Wiegand P, Cecchi R, Pring-Akerblom P, Adrian T, Jorch G, Brinkmann B.1996. Detection and significance of adenoviruses in cases of sudden infant death.Virchows Archiv 428:113-118.
Becker LE, Zhang W, Pereyra PM. 1993. Delayed maturation of the vagus nerve in suddeninfant death syndrome. Acta Neuropathologica 86:617-622.
Becroft DM, Thompson JM, Mitchell EA. 2001. Nasal and intrapulmonary haemorrhage insudden infant death syndrome. Archives of Disease in Childhood 85:116-120.
Bell S, Crawley BA, Oppenheim BA, Drucker DB, Morris JA. 1996. Sleeping position andupper airways bacterial flora: relevance to cot death. Journal of Clinical Pathology49:170-172.

29
Bellingham MC, Ireland MF. 2002. Contribution of cholinergic systems to state-dependentmodulation of respiratory control. Respiration Physiology & Neurobiology 131:135-144.
Berry PJ. 1992. Pathological findings in SIDS. Journal of Clinical Pathology 45:11-16.
Bhave SV, Snell LD, Tabakoff B, Hoffman PL. 2000. Chronic ethanol exposure attenuatesthe anti-apoptotic effect of NMDA in cerebellar granule neurons. Journal ofNeurochemistry 75:1035-1044.
Bivin WS, Heinen BN. 1985. Production of ethanol from infant food formulas by commonyeasts. Journal of Applied Bacteriology 58:355-357.
Blackwell CC, Saadi AT, Raza MW, Stewart J, Weir DM. 1992. Susceptibility to infection inrelation to SIDS. Journal of Clinical Pathology 45:20-24.
Blackwell CC, Weir DM, Busuttil A. 1999. Infection, inflammation and sleep: more pieces tothe puzzle of sudden infant death syndrome (SIDS). 107:455-473.
Blackwell CC, Weir DM, Busuttil A. 2001. The need for further evidence for the proposedrole of Helicobacter pylori in SIDS. Arch Dis Child 84:525.
Blair PS, Fleming PJ, Bensley D, Smith I, Bacon C, Taylor E, Berry J, Golding J, Tripp J.1996. Smoking and the sudden infant death syndrome: results from 1993-5 case-control study for confidential inquiry into stillbirths and deaths in infancy. confidentialenquiry into stillbirths and deaths regional coordinators and researchers. BritishMedical Journal Clinical Research Edition 313:195-198.
Boles RG, Buck EA, Blitzer MG, Platt MS, Cowan TM, Martin SK, Yoon H-r, Madsen JA,Reyes-Mugica M, Rinaldo P. 1998. Retrospective biochemical screening of fatty acidoxidation disorders in postmortem livers of 418 cases of sudden death in the first yearof life. The Journal of Pediatrics 132:924-933.
Bonham AC, Chen CY, Mutoh T, Joad JP. 2001. Lung C-fiber CNS reflex: role in therespiratory consequences of extended environmental tobacco smoke exposure inyoung guinea pigs. Environmental Health Perspectives 109 Suppl 4:573-578.
Bonham JR, Downing M. 1992. Metabolic deficiencies and SIDS. Journal of ClinicalPathology 45:33-38.
Bonthius DJ, West JR. 1991. Permanent neuronal deficits in rats exposed to alcohol duringthe brain growth spurt. Teratology 44:147-163.
Burchell A, Lyall H, Busuttil A, Bell E, Hume R. 1992. Glucose metabolism andhypoglycaemia in SIDS. Journal of Clinical Pathology 45:39-45.

30
Byard RW, Krous HF. 1995. Minor inflammatory lesions and sudden infant death: cause,coincidence, or epiphenomena? Pediatric Pathology & Laboratory Medicine 15:649-654.
Byard RW, Krous HF. 2003. Sudden infant death syndrome: overview and update. Pediatricand Developmental Pathology 6.
Caddell JL. 2001a. The apparent impact of gestational magnesium (Mg) deficiency on thesudden infant death syndrome (SIDS). Magnesium Research 14:291-303.
Caddell JL. 2001b. Magnesium deficiency promotes muscle weakness, contributing to the riskof sudden infant death (SIDS) in infants sleeping prone. Magnesium Research 14:39-50.
Caddell JL. 2001c. A triple-risk model for the sudden infant death syndrome (SIDS) and theapparent life-threatening episode (ALTE): the stressed magnesium deficient weanlingrat. Magnesium Research 14:227-238.
Cameron YL, Merazzi D, Mortola JP. 2000. Variability of the breathing pattern in newbornrats: effects of ambient temperature in normoxia or hypoxia. Pediatric Research47:813-818.
Campbell AJ, Bolton DP, Taylor BJ, Sayers RM. 1998. Responses to an increasing asphyxiain infants: effects of age and sleep state. Respiration Physiology 112:51-58.
Campbell AJ, Galland BC, Bolton DP, Taylor BJ, Sayers RM, Williams SM. 2001.Ventilatory responses to rebreathing in infants exposed to maternal smoking. ActaPaediatrica 90:793-800.
Carleton JN, Donoghue AM, Porter WK. 1998. Mechanical model testing of rebreathingpotential in infant bedding materials. Archives of Disease in Childhood 78:323-328.
Carpentier V, Vaudry H, Mallet E, Laquerriere A, LeRoux P. 1998. Increased density ofsomatostatin binding sites in respiratory nuclei of the brainstem in sudden infant deathsyndrome. Neuroscience 86:159-166.
Carroll-Pankhurst C, Mortimer EA, Jr. 2001. Sudden infant death syndrome, bedsharing,parental weight, and age at death. Pediatrics 107:530-536.
Dahro M, Gunning D, Olson JA. 1983. Variations in liver concentrations of iron and vitaminA as a function of age in young American children dying of the sudden infant deathsyndrome as well as of other causes. International Journal for Vitamin and NutritionResearch 53:13-18.

31
Dahshan A, Donovan K. 2001. Auto-brewery syndrome in a child with short gut syndrome:case report and review of the literature. Journal of Pediatric Gastroenterology andNutrition 33:214-215.
Deshpande P, Khurana A, Hansen P, Wilkins D, Thach BT. 1999. Failure of autoresuscitationin weanling mice: significance of cardiac glycogen and heart rate regulation. Journalof Applied Physiology 87:203-210.
Di Pasquale E, Monteau R, Hilaire G, Iscoe S. 1995. Effects of ethanol on respiratory activityin the neonatal rat brainstem-spinal cord preparation. Brain Research 695:271-274.
Di Pasquale E, Morin D, Monteau R, Hilaire G. 1992. Serotonergic modulation of therespiratory rhythm generator at birth: an in vitro study in the rat. Neuroscience Letters143:91-95.
Douglas AS, Helms PJ, Jolliffe IT. 1998. Seasonality of sudden infant death syndrome inmainland Britain and Ireland 1985-95. Archives of Disease in Childhood 79:269-270.
Druse MJ, Kuo A, Tajuddin N. 1991. Effects of in utero ethanol exposure on the developingserotonergic system. Alcoholism, Clinical and Experimental Research 15:678-684.
Duffin J, Jacobson ER, Orsini EC. 1978. The effect of ethanol on the ventilatory responsesmediated by the peripheral chemoreceptors in man. Canadian Anaesthetists' SocietyJournal 25:181-190.
Edwards CA, Parrett AM, Balmer SE, Wharton BA. 1994. Faecal short chain fatty acids inbreast-fed and formula-fed babies. Acta Paediatrica 83:459-462.
Elder DE, Bolton DP, Dempster AG, Taylor BJ, Broadbent RS. 1996. Pathophysiology ofoverheating in a piglet model: findings compared with sudden infant death syndrome.Journal of Paediatrics and Child Health 32:113-119.
Elitsur Y, Btriest W, Sabet Z, Neace C, Jiang C, Thomas E. 2000. Is sudden infant deathsyndrome associated with Helicobacter pylori infection in children? Helicobacter5:227-231.
Fewell JE, Smith FG, Ng VKY. 2001a. Prenatal exposure to nicotine impairs protectiveresponses of rat pups to hypoxia in an age-dependent manner. Respiration Physiology127:61-73.
Fewell JE, Smith FG, Ng VKY. 2001b. Threshold levels of maternal nicotine impairingprotective responses of newborn rats to intermittent hypoxia. Journal of AppliedPhysiology 90:1968-1976.

32
Filiano JJ, Kinney HC. 1992. Arcuate nucleus hypoplasia in the sudden infant deathsyndrome. Journal of Neuropathology and Experimental Neurology 51:394-403.
Filiano JJ, Kinney HC. 1994. A perspective on neuropathologic findings in victims of thesudden infant death syndrome: the triple-risk model. Biology of the Neonate 65:194-197.
Finkle BS, McCloskey KL, Kopjak L, Carroll JM. 1979. Toxicological analyses in cases ofsudden infant death: a national feasibility study. Journal of Forensic Sciences 24:775-789.
Fleming KA. 1992. Viral respiratory infection and SIDS. Journal of Clinical Pathology 45:29-32.
Fleming PJ, Azaz Y, Wigfield R. 1992. Development of thermoregulation in infancy: possibleimplications for SIDS. Journal of Clinical Pathology 45:17-19.
Fletcher LM. 1996. Alcohol and iron: one glass of red or more? Journal of Gastroenterologyand Hepatology 11:1039-1041.
Friberg SG, Olgart Hoglund C, Gustafsson LE. 2001. Nerve growth factor increases airwayresponses and decreases levels of exhaled nitric oxide during histamine challenge inan in vivo guinea-pig model. Acta Physiologica Scandinavica 173:239-245.
Geertinger P, Bodenhoff J, Helweg-Larson K, Lund A. 1982. Endogenous alcohol productionby intestinal fermentation in sudden infant death syndrome. Zeitschrift furRechtsmedizin 89:167-172.
Giberson PK, Blakley BR. 1994. Effect of postnatal ethanol exposure on expression ofdifferentiation antigens of murine splenic lymphocytes. Alcoholism: Clinical andExperimental Research 18:21-28.
Gibson AA. 1992. Current epidemiology of SIDS. Journal of Clinical Pathology 45:7-10.
Gibson IC, Berger AJ. 2000. Effect of ethanol upon respiratory-related hypoglossal nerveoutput of neonatal rat brain stem slices. Journal of Neurophysiology 83:333-342.
Gill K, Eagle Elk M, Liu Y, Deitrich RA. 1999. An examination of ALDH2 genotypes,alcohol metabolism and the flushing response in Native Americans. Journal of Studieson Alcohol 60:149-158.
Gingras JL, Weese-Mayer D. 1990. Maternal cocaine addiction. II: an animal model for thestudy of brainstem mechanisms operative in sudden infant death syndrome. MedicalHypotheses 33:231-234.

33
Gordon AE, Al Madani OA, Weir DM, Busuttil A, Blackwell C. 1999. Cortisol levels andcontrol of inflammatory responses to toxic shock syndrome toxin-1 (TSST-1): theprevalence of night-time deaths in sudden infant death syndrome (SIDS). FEMSImmunology and Medical Microbiology 25:199-206.
Gothoni P, Ahtee L. 1980. Chronic ethanol administration decreases 5-HT and increases 5-HIAA concentration in rat brain. Acta Pharmacologica et Toxicologica 46:113-120.
Grant KA. 1995. The role of 5-HT3 receptors in drug dependence. Drug Alcohol Depend38:155-171.
Guzman-Marin R, Alam MN, Mihailescu S, Szymusiak R, McGinty D, Drucker-Colin R.2001. Subcutaneous administration of nicotine changes dorsal raphe serotonergicneurons discharge rate during REM sleep. Brain Research 888:321-325.
Hafstrom O, Milerad J, Asokan N, Poole SD, Sundell HW. 2000. Nicotine delays arousalduring hypoxemia in lambs. Pediatric Research 47:646-652.
Halliday G, Baker K, Harper C. 1995. Serotonin and alcohol-related brain damage. MetabolicBrain Disease 10:25-30.
Harmsen HJ, Wildeboer-Veloo AC, Raangs GC, Wagendorp AA, Klijn N, Bindels JG,Welling GW. 2000. Analysis of intestinal flora development in breast-fed andformula-fed infants by using molecular identification and detection methods. Journalof Pediatric Gastroenterology and Nutrition 30:61-67.
Heininger U, Stehr K, Schmidt-Schlapfer G, Penning R, Vock R, Kleemann W, Cherry JD.1996. Bordetella pertussis infections and sudden unexpected deaths in children.European Journal of Pediatrics 155:551-553.
Heinz A, Ragan P, Jones DW, Hommer D, Williams W, Knable MB, Gorey JG, Doty L,Geyer C, Lee KS, Coppola R, Weinberger DR, Linnoila M. 1998. Reduced centralserotonin transporters in alcoholism. The American Journal of Psychiatry 155:1544-1549.
Hillbom ME, Von Boguslawsky KV. 1978. Effect of ethanol on cardiac function in ratsgenetically selected for their ethanol preference. Pharmacology, Biochemistry, andBehavior 8:609-614.
Hirschfeld JA. 1995. The 'back-to-sleep' campaign against SIDS. American Family Physician51:611-612.

34
Holgert H, Hokefelt T, Hertzberg T, Lagercrantz H. 1995. Functional and developmentalstudies of the peripheral arterial chemoreceptors in rat: effects of nicotine and possiblerelation to sudden infant death syndrome. Proceedings of the National Academy ofSciences of the United States of America 92:7575-7579.
Holownia A, Ledig M, Braszko JJ, Menez JF. 1999. Acetaldehyde cytotoxicity in cultured ratastrocytes. Brain Research 833:202-208.
Howatson AG. 1992. Viral infection and alpha interferon in SIDS. J Clin Pathol 45:25-28.
Ikonomidou C, Bittigau P, Koch C, Genz K, Hoerster F, Felderhoff-Mueser U, Tenkova T,Dikranian K, Olney JW. 2001. Neurotransmitters and apoptosis in the developingbrain. Biochemical Pharmacology 62:401-405.
Iyasu S, Randall LL, Welty TK, Hsia J, Kinney HC, Mandell F, McClain M, Randall B,Habbe D, Wilson H, Willinger M. 2002. Risk factors for sudden infant deathsyndrome among northern plains Indians. Journal of the American MedicalAssociation 288:2717-2723.
James D, Berry PJ, Fleming P, Hathaway M. 1990. Surfactant abnormality and the suddeninfant death syndrome--a primary or secondary phenomenon? Archives of Disease inChildhood 65:774-778.
Jang M-H, Shin M-C, Lee T-H, Kim Y-P, Jung S-B, Shin D-H, Kim H, Kim S-S, Kim E-H,Kim C-J. 2002. Alcohol and nicotine administration inhibits serotonin synthesis andtryptophan hydroxylase expression in dorsal and median raphe of young rats.Neuroscience Letters 329:141-144.
Joad JP, Ji C, Kott KS, Bric JM, Pinkerton KE. 1995. In utero and postnatal effects ofsidestream cigarette smoke exposure on lung function, hyperresponsiveness, andneuroendocrine cells in rats. Toxicology and Applied Pharmacology 132:63-71.
Johnstone RE, Reier CE. 1973. Acute respiratory effects of ethanol in man. ClinicalPharmacology and Therapeutics 14:501-508.
Kahn A, Franco P, Scaillet S, Groswasser J, Dan B. 1997. Development of cardiopulmonaryintegration and the role of arousability from sleep. Current Opinion in PulmonaryMedicine 3:440-444.
Kaji H, Asanuma Y, Ide H, Saito N, Hisamura M, Murao M, Yoshida T, Takahashi K. 1976.The auto-brewery syndrome--the repeated attacks of alcoholic intoxication due to theovergrowth of Candida (albicans) in the gastrointestinal tract. Materia Medica Polona8:429-435.

35
Kaji H, Asanuma Y, Yahara O, Shibue H, Hisamara M, Saito N, Kawakami Y, Murao M.1984. Intragastrointestinal alcohol fermentation syndrone: report of two cases andreview of the literature. Journal of the Forensic Science Society 24:461-471.
Kattwinkel J, Brooks JG, Keenan ME, Malloy M. 2000. Changing concepts of sudden infantdeath syndrome: implications for infant sleeping environment and sleep position.American Academy of Pediatrics. Task Force on Infant Sleep Position and SuddenInfant Death Syndrome. Pediatrics 105:650-656.
Kelmanson IA. 1991. Circadian variation of the frequency of sudden infant death syndromeand of sudden death from life-threatening conditions in infants. Chronobiologia18:181-186.
Kemp JS, Thach BT. 1993. A sleep position-dependent mechanism for infant death onsheepskins. American Journal of Diseases of Children 147:642-646.
Kemp JS, Thach BT. 1995. Quantifying the potential of infant bedding to limit CO2 dispersaland factors affecting rebreathing in bedding. Journal of Applied Physiology 78:740-745.
Kemp PM, Little BB, Bost RO, Dawson DB. 1996. Whole blood levels of dodecanoic acid, aroutinely detectable forensic marker for a genetic disease often misdiagnosed assudden infant death syndrome (SIDS): MCAD deficiency. American Journal ofForensic Medicine and Pathology 17:79-82.
Kerr JR, Al-Khattaf A, Barson AJ, Burnie JP. 2000. An association between sudden infantdeath syndrome (SIDS) and Helicobacter pylori infection. Archives of Disease inChildhood 83:429-434.
Kinney HC, Brody BA, Finkelstein DM, Vawter GF, Mandell F, Gilles FH. 1991. Delayedcentral nervous system myelination in the sudden infant death syndrome. Journal ofNeuropathology and Experimental Neurology 50:29-48.
Kinney HC, Filiano JJ, Harper RM. 1992. The neuropathology of the sudden infant deathsyndrome. A review. Journal of Neuropathology and Experimental Neurology 51:115-126.
Kinney HC, Filiano JJ, Sleeper LA, Mandell F, Valdes-Dapena M, White WF. 1995.Decreased muscarinic receptor binding in the arcuate nucleus in sudden infant deathsyndrome. Science 269:1446-1450.
Kinney HC, Filiano JJ, White WF. 2001a. Medullary serotonergic network deficiency in thesudden infant death syndrome: review of a 15-year study of a single dataset. Journal ofNeuropathology and Experimental Neurology 60:228-247.

36
Kinney HC, Ottolini MG, Beggs AH, Buck G, Corwin M, Dailey D, Eaglestaff ML, FiferWP, Jacobson J, Nattie E, Thach BT. 2001b. Targeting sudden infant death syndrome(SIDS): a strategic plan. In: National Institute for Child Health and HumanDevelopment.
Kisters K, Schodjaian K, Tokmak F, Kosch M, Rahn KH. 2000. Effect of ethanol on bloodpressure--role of magnesium. American Journal of Hypertension 13:455-456.
Klus H, Begutter H, Nowak A, Pinterits G, Ultsch I, Wihlidal H. 1985. Indoor air pollutiondue to tobacco smoke under real conditions. Preliminary results. The Tokai Journal ofExperimental and Clinical Medicine 10:331-340.
Kohlendorfer U, Kiechl S, Sperl W. 1998. Sudden infant death syndrome: risk factor profilesfor distinct subgroups. American Journal of Epidemiology 147:960-968.
Kraft M, Martin RJ. 1995. Chronobiology and Chronotherapy in Medicine. Disease-a-Month15:503-576.
Kralios FA, Kralios AC. 1996. Ventricular fibrillation in the neonate: elusive or illusive?Reproduction, Fertility, and Development 8:49-60.
Krous HF, Nadeau JM, Byard RW, Blackbourne BD. 2001a. Oronasal blood in sudden infantdeath. The American Journal of Forensic Medicine and Pathology 22:346-351.
Krous HF, Nadeau JM, Silva PD, Blackbourne BD. 2001b. Intrathoracic petechiae in suddeninfant death syndrome: relationship to face position when found. Pediatric andDevelopmental Pathology 4:160-166.
Lafuente MA, Melgar MJ, Veira JA, Aldegunde MA. 1992. Effects of acute ethanoladministration on regional serotonin turnover. Veterinary and Human Toxicoloy34:504-507.
Lai Y-L, Thacker A, Gairola CG. 1994. Sidestream cigarette smoke exposure and airwayreactivity during early life. Journal of Applied Physiology 77:1868-1874.
Lamont P, Murray N, Halliday G, Hilton J, Pamphlett R. 1995a. Brain Stem Nuclei in SuddenInfant Death Syndrome (SIDS): Volumes, Neuronal Numbers and Positions.Neuropathology and Applied Neurobiology 21:262-268.
Lamont P, Sachinwalla T, Pamphlett R. 1995b. Myelin in SIDS: assessment of developmentand damage using MRI. Pediatrics 95:409-413.
Lands WEM. 1998. A review of alcohol clearance in humans. Alcohol 15:147-160.

37
Langlois NEI, Ellis PS, Little D, Hulewicz B. 2002. Toxicologic analysis in cases of possiblesudden infant death syndrome: a worthwhile exercise? The American Journal ofForensic Medicine and Pathology 23:162-166.
Latouche S, Rabodonirina M, Mazars E. 1998. Pneumocystis: the 'carrier state': epidemiologyand transmission of human pneumocystosis. FEMS Immunology and MedicalMicrobiology 22:81-86.
Lavoue S, Dagorne M, Morvan H, Madec F, Durigon M. 1994. Is the piglet a useful animalmodel of sudden infant death syndrome? Biology of the Neonate 65:310-316.
Leary WP, Reyes AJ. 1983. Magnesium and sudden death. South African Medical Journal64:697-698.
Lee S, Barson AJ, Drucker DB, Morris JA, Telford DR. 1987. Lethal challenge of gnotobioticweanling rats with bacterial isolates from cases of sudden infant death syndrome(SIDS). Journal of Clinical Pathology 40:1393-1396.
Leung WK, Yu J, To KF. 2001. No association in a Chinese population. Archives of Diseasein Childhood 84:525.
Lewis KW, Bosque EM. 1995. Deficient hypoxia awakening response in infants of smokingmothers: possible relationship to sudden infant death syndrome. The Journal ofPediatrics 127:691-699.
l'Hoir MP, Engelberts AC, van Well GT, Westers P, Mellenbergh GJ, Wolters WH, Huber J.1998. Case-control study of current validity of previously described risk factors forSIDS in The Netherlands. Archives of Disease in Childhood 79:386-393.
Li W, Zheng T, Babu AN, Altura BT, Gupta RK, Altura BM. 2001a. Importance ofmagnesium ions in development of tolerance to ethanol: studies on cultured cerebralvascular smooth muscle cells, type-2 astrocytes and intact rat brain. Brain ResearchBulletin 56:153-158.
Li Y, Martin LD, Minnicozzi M, Greenfeder S, Fine J, Pettersen CA, Chorley B, Adler KB.2001b. Enhanced expression of mucin genes in a guinea pig model of allergic asthma.American Journal of Respiratory Cell and Molecular Biology 25:644-651.
Lifschitz CH, Wolin MJ, Reeds PJ. 1990. Characterization of carbohydrate fermentation infeces of formula-fed and breast-fed infants. Pediatric Research 27:165-169.
Limerick SR. 1992. Sudden infant death in historical perspective. Journal of ClinicalPathology 45:3-6.
38
Malik M, Bigger JT, Camm AJ, Kleiger RE, Malliani A, Moss AJ, Schwartz PJ. 1996. Heartrate variability: standards of measurement, physiological interpretation and clinicaluse. Task Force of the European Society of Cardiology and the North AmericanSociety of Pacing and Electrophysiology. Circulation 93:1043-1065.
Malloy MH, Freeman Jr. DH. 2000. Birth weight- and gestational age-specific sudden infantdeath syndrome mortality: United States, 1991 versus 1995. Pediatrics 105:1227-1231.
Marshall BJ, Ho GY. 2001. Controls not matched. Archives of Disease in Childhood 84:525.
Mathews TJ, Curtin SC, MacDorman MF. 2000. Infant mortality statistics from the 1998period linked birth/infant death data set. National Vital Statistics Reports 48:1-28.
Matturri L, Biondo B, Mercurio P, Rossi L. 2000. Severe hypoplasia of medullary arcuatenucleus: quantitative analysis in sudden infant death syndrome. ActaNeuropathologica 99:371-375.
McCarver DG, Thomasson HR, Martier SS, Sokol RJ, Li T. 1997. Alcohol dehydrogenase-2*3 allele protects against alcohol-related birth defects among African Americans. JPharmacol Exp Ther 283:1095-1101.
McLaughlin SD, Scott BK, Peterson CM. 1990. The effect of cigarette smoking on breath andwhole blood-associated acetaldehyde. Alcohol 7:285-287.
Merot J, Probst V, Debailleul M, Gerlach U, Moise NS, Le Marec H, Charpentier F. 2000.Electropharmacological characterization of cardiac repolarization in German shepherddogs with an inherited syndrome of sudden death: abnormal response to potassiumchannel blockers. Journal of the American College of Cardiology 36:939-947.
Michiels TM, Light RW, Mahutte CK. 1983. Effect of ethanol and naloxone on control ofventilation and load perception. Journal of Applied Physiology 55:929-934.
Milerad J, Vege A, Opdal SH, Rognum TO. 1998. Objective measurements of nicotineexposure in victims of sudden infant death syndrome and in other unexpected childdeaths. The Journal of Pediatrics 13:232-236.
Miller MW. 1995. Effect of pre- or postnatal exposure to ethanol on the total number ofneurons in the principal sensory nucleus of the trigeminal nerve: cell proliferation andneuronal death. Alcoholism: Clinical and Experimental Research 19:1359-1363.
Miller MW. 1996. Mechanisms of ethanol induced neuronal death during development: fromthe molecule to behavior. Alcoholism: Clinical and Experimental Research 20:128A-132A.

39
Mitchell EA, Clements M, Williams SM, Stewart AW, Cheng A, Ford RPK. 1999. Seasonaldifferences in risk factors for sudden infant death syndrome. Acta Paediatrica 88:253-258.
Mitchell EA, Esmail A, Jones DR, Clements M. 1996. Do differences in the prevalence ofrisk factors explain the higher mortality from sudden infant death syndrome in NewZealand compared with the UK? New Zealand Medical Journal 109:352-355.
Mitchell EA, Scragg L, Clements M. 1995. Location of smoking and the sudden infant deathsyndrome (SIDS). Australian and New Zealand Journal of Medicine 25:155-156.
Mitchell EA, Scragg R, Stewart AW, Becroft DM, Taylor BJ, Ford RP, Hassall IB, BarryDM, Allen EM, Roberts AP. 1991. Results from the first year of the New Zealand cotdeath study. New Zealand Medical Journal 104:71-76.
Molony N, Blackwell CC, Busuttil A. 1999. The effect of prone posture on nasal temperaturein children in relation to induction of staphylococcal toxins implicated in suddeninfant death syndrome. FEMS Immunology and Medical Microbiology 25:109-113.
Moore A, Worwood M. 1989. Iron and sudden infant death syndrome. BMJ 298:1248.
Moore CA, Raha-Chowdhury R, Fagan DG, Worwood M. 1994. Liver iron concentrations insudden infant death syndrome. Archives of Disease in Childhood 70:295-298.
Morgan DJ, Vargas SL, Reyes-Mugica M, Walterspiel JN, Carver W, Gigliotti F. 2001.Identification of Pneumocystis carinii in the lungs of infants dying of sudden infantdeath syndrome. The Pediatric Infectious Disease Journal 20:306-309.
Morin D, Di Pasquale E, Hilaire G, Monteau R. 1994. Possible involvement of serotonin inobstructive apnea of the newborn. Biology of the Neonate 65:176-181.
Muneoka K, Ogawa T, Kamei K, Mimura Y, Kato H, Takigawa M. 2001. Nicotine exposureduring pregnancy is a factor which influences serotonin transporter density in the ratbrain. European Journal of Pharmacology 411:279-282.
Murata K, Araki S, Yokoyama K, Sata F, Yamashita K, Ono Y. 1994. Autonomicneurotoxicity of alcohol assessed by heart rate variability. Journal of the AutonomicNervous System 48:105-111.
Murray KA, White WJ, Zagon IS. 1986. Ethanol exposure in rats: studies on blood gasconcentrations, pH and temperature. Alcohol 3:5-10.
Naeye RL. 1983. Pathologists' role in SIDS research: the unfinished task. In: Tildon JT,Roeder LM, Steinschneider A, editors. Sudden Infant Death Syndrome. London:Academic Press, Inc. p 161-167.

40
Nagata K, Aistrup GL, Huang C-S, Marszalec W, Song J-H, Yeh JZ, Narahashi T. 1996.Potent modulation of neuronal nicotinic acetylcholine receptor-channel by ethanol.Neuroscience Letters 217:189-193.
Nakamura M, Abe S, Goto Y, Chishaki A. 1995. Sudden sound-induced death in magnesium-deficient rats after repetitive episodes of seizures result from brain dysfunction.Magnesium Research 8:47-53.
N'Diaye A, Sevoz-Couche C, Nosjean A, Hamon M, Laguzzi R. 2001. Stimulation of 5-HT2receptors in the nucleus tractus solitarius enhances NMDA receptor-mediated reflex-evoked bradycardiac responses in the rat. Autonomic Neuroscience: Basic & Clinical92:45-55.
Ni H, Schechtman VL, Zhang J, Glotzbach SF, Harper RM. 1996. Respiratory responses topreoptic/anterior hypothalamic warming during sleep in kittens. Reproduction,Fertility, and Development 8:79-86.
Okamoto K, Murawaki Y, Yuasa AI, Kawasaki H. 2001. Effect of ALDH2 and CYP2E1 genepolymorphisms on drinking behavior and alcoholic liver disease in Japanese maleworkers. Alcoholism: Clinical and Experimental Research 25:19S-23S.
O'Kusky JR, Kosuki DE, Norman MG. 1995. Sudden infant death syndrome: postnatalchanges in the volumes of the pons, medulla and cervical spinal cord. Journal ofNeuropathology and Experimental Neurology 54:570-580.
O'Kusky JR, Norman MG. 1992. Sudden infant death syndrome: postnatal changes in thenumerical density and total number of neurons in the hypoglossal nucleus. Journal ofNeuropathology and Experimental Neurology 51:577-584.
O'Kusky JR, Norman MG. 1994. Sudden infant death syndrome: increased synaptic density inthe central reticular nucleus of the medulla. Journal of Neuropathology andExperimental Neurology 53:263-271.
O'Kusky JR, Norman MG. 1995. Sudden infant death syndrome: increased number ofsynapses in the hypoglossal nucleus. Journal of Neuropathology and ExperimentalNeurology 54:627-634.
Otero-Anton E, Gonzalez-Quintela A, Saborido J, Torre JA, Virgos A, Barrio E. 1997.Prolongation of the QTc interval during alcohol withdrawal syndrome. ActaCardiologica 52:285-294.
Ozawa Y, Okado N. 2002. Alteration of serotonergic receptors in the brain stems of humanpatients with respiratory disorders. Neuropediatrics 33:142-149.

41
Pamphlett R, Murray N, Louda C. 1996. Phrenic nerve maturation in the sudden infant deathsyndrome. Acta Neuropathologica 91:422-426.
Parson SH, Sojitra NM. 1995. Loss of myelinated axons is specific to the central nervoussystem in a mouse model of the fetal alcohol syndrome. Journal of Anatomy 187:739-748.
Pasternak K. 1999. Tissue concentrations of magnesium in rats receiving various dosages ofethanol. Magnesium Research 12:167-170.
Patel M, Keshavarzian A, Kottapalli V, Badie B, Winship D, Fields JZ. 1996. Humanneutrophil functions are inhibited in vitro by clinically relevant ethanolconcentrations. Alcoholism: Clinical and Experimental Research 20:275-283.
Patzak A. 1999. Short-term rhythms of the cardiorespiratory system and their significance inneonatology. Chronobiology International 16:249-268.
Phillips DE, Krueger SK, Rydquist JE. 1991. Short- and long-term effects of combined pre-and postnatal ethanol exposure (three trimester equivalency) on the development ofmyelin and axons in rat optic nerve. International Journal of DevelopmentalNeuroscience 9:631-647.
Pikkarainen PH, Raiha NC. 1967. Development of alcohol dehydrogenase activity in thehuman liver. Pediatric Reseach 1:165-168.
Ponsonby AL, Dwyer T, Gibbons LE, Cochrane JA, Jones ME, McCall MJ. 1992. Thermalenvironment and sudden infant death syndrome: case-control study. BMJ (ClinicalResearch Eddition) 304:277-282.
Pratt OE, Rooprai HK, Shaw GK, Thomson AD. 1990. The genesis of alcoholic brain tissueinjury. Alcohol & Alcoholism 25:217-230.
Raha-Chowdhury R, Moore CA, Bradley D, Henley R, Worwood M. 1996. Blood ferritinconcentrations in newborn infants and the sudden infant death syndrome. Journal ofClinical Pathology 49:168-170.
Rambaud C. 1997. Pathology of SIDS and new understandings. Pediatric Pulmonology.Supplement 16:120-122.
Rambaud C, Guibert M, Briand E, Gangeot-Keros L, Hermine AC-L, Dehan M. 1999.Microbiology in sudden infant death syndrome (SIDS) and other childhood deaths.FEMS Immunology and Medical Microbiology 25:59-66.
Raza MW, Blackwell CC. 1999. Sudden infant death syndrome, virus infections andcytokines. FEMS Immunology and Medicial Microbiology 25:85-96.

42
Rigatto H, Fitzgerald SF, Willis MA, Yu C. 1994. In search of the real respiratory neurons:culture of medullary fetal cells sensitive to CO2 and low pH. Biology of the Neonate65:149-155.
Riveros-Rosas H, Julian-Sanchez A, Pina E. 1997. Enzymology of ethanol and acetaldehydemetabolism in mammals. Archives of Medical Research 28:453-471.
Rossinen J, Sinisalo J, Partanen J, Nieminen MS, Viitasalo M. 1999. Effects of acute alcoholinfusion on duration and dispersion of QT interval in male patients with coronaryartery disease and in healthy controls. Clinical Cardiology 22:591-594.
Rowland M, Drumm B. 2001. Helicobacter pylori and sudden-infant-death syndrome. TheLancet 357:327.
Ryan EL. 1991. Distribution of expired air in carry cots - a possible explanation for somesudden infant deaths. Australasian Physical & Engineering Sciences in Medicine14:112-118.
Saaresranta T, Polo O. 2002. Hormones and breathing. Chest 122:2165-2182.
Sato M, Severinghaus JW, Basbaum AI. 1992. Medullary CO2 chemoreceptor neuronidentification by c-fos immunocytochemistry. Journal of Applied Physiology 73:96-100.
Schwartz PJ, Stramba-Badiale M, Segantini A, Austoni P, Bosi G, Giorgetti R, Grancini F,Marni ED, Perticone F, Rosti D, Salice P. 1998. Prolongation of the QT interval andthe sudden infant death syndrome. The New England Journal of Medicine 338:1709-1714.
Schwarzacher SW, Pestean A, Gunther S, Ballanyi K. 2002. Serotonergic modulation ofrespiratory motoneurons and interneurons in brainstem slices of perinatal rats.Neuroscience 115:1247-1259.
Seelig LL, Jr., Steven WM, Stewart GL. 1996. Effects of maternal ethanol consumption onthe subsequent development of immunity to Trichinella spiralis in rat neonates.Alcoholism: Clinical and Experimental Research 20:514-522.
Shao XM, Feldman JL. 2000. Acetylcholine modulates respiratory pattern: effects mediatedby M3-like receptors in preBotzinger complex inspiratory neurons. Journal ofNeurophysiology 83:1243-1252.
Shao XM, Feldman JL. 2001. Mechanisms underlying regulation of respiratory pattern bynicotine in preBotzinger complex. Journal of Neurophysiology 85:2461-2467.

43
Shaskan EG, Dolinsky ZS. 1985. Elevated endogenous breath acetaldehyde levels amongabusers of alcohol and cigarettes. Progress in Neuro-Psychopharmacology andBiological Psychiatry 9:267-272.
Shatz A, Hiss Y, Hammel I, Arensburg B, Variend S. 1994. Age-related basement membranethickening of the vocal cords in sudden infant death syndrome (SIDS). Laryngoscope104:865-868.
Shellito JE. 1996. Host defense against Pneumocystis carinii: more than the CD4+lymphocyte. The Journal of Laboratory and Clinical Medicine 128:448-449.
Shellito JE, Olariu R. 1998. Alcohol decreases T-lymphocyte migration into lung tissue inresponse to Pneumocystis carinii and depletes T-lymphocyte numbers in the spleensof mice. Alcoholism: Clinical and Experimental Research 22:658-663.
Siarakas S, Damas E, Murrell WG. 1997. The effect of enteric bacterial toxins on thecatecholamine levels of the rabbit. Pathology 29:278-285.
Singh BN, Hollenberg NK, Poole-Wilson PA, Robertson JIS. 1992. Diuretic-inducedpotassium and magnesium deficiency: relation to drug-induced QT prolongation,cardiac arrhythmias and sudden death. Journal of Hypertension 10:301-316.
Skadberg BT, Markestad T. 1997a. Behaviour and physiological responses during prone andsupine sleep in early infancy. Archives of Disease in Childhood 76:320-324.
Skadberg BT, Markestad T. 1997b. Consequences of getting the head covered during sleep ininfancy. Pediatrics 100:E6.
Skadberg BT, Oterhals A, Finborud K, Markestad T. 1995. CO2 rebreathing: a possiblecontributory factor to some cases of sudden infant death? Acta Paediatrica 84:988-995.
Slotkin TA, Lappi SE, McCook EC, Lorber BA, Seidler FJ. 1995. Loss of neonatal hypoxiatolerance after prenatal nicotine exposure: implications for sudden infant deathsyndrome. Brain Research Bulletin 38:69-75.
Smialek JE, Monforte JR. 1977. Toxicology and sudden infant death. Journal of ForensicSciences 22:757-762.
Smith CJ, Hansch C. 2000. The relative toxicity of compounds in mainstream cigarette smokecondensate. Food and Chemical Toxicology 38:637-646.
Sparks DL, Hunsaker JC, 3rd. 1991. Sudden infant death syndrome: altered aminergic-cholinergic synaptic markers in hypothalamus. Journal of Child Neurology 6:335-339.

44
St.-John WM, Leiter JC. 1999. Maternal nicotine depresses eupneic ventilation of neonatalrats. Neuroscience Letters 267:206-208.
Suarez-Mier MP, Aguilera B. 1998. Histopathology of the conduction system in sudden infantdeath. Forensic Science International 93:143-154.
Taylor BJ, Williams SM, Mitchell EA, Ford RP. 1996. Symptoms, sweating and reactivity ofinfants who die of SIDS compared with community controls. New Zealand NationalCot Death Study Group. Journal of Paediatrics and Child Health 32:316-322.
Tolson CM, Seidler FJ, McCook EC, Slotkin TA. 1995. Does concurrent or prior nicotineexposure interact with neonatal hypoxia to produce cardiac cell damage? Teratology52:298-305.
Tong S, Ingenito S, Anderson JE, Gootman N, Sica AL, Gootman PM. 1995. Development ofa swine animal model for the study of sudden infant death syndrome. LaboratoryAnimal Science 45:398-403.
Valerio LG, Jr., Parks T, Petersen DR. 1996. Alcohol mediates increases in hepatic and serumnonheme iron stores in a rat model for alcohol-induced liver injury. Alcoholism:Clinical and Experimental Research 20:1352-1361.
van de Borne P, Mark AL, Montano N, Mion D, Somers VK. 1997. Effects of alcohol onsympathetic activity, hemodynamics, and chemoreflex sensitivity. Hypertension29:1278-1283.
Vargas SL, Ponce CA, Hughes WT, Wakefield AE, Weitz JC, Donoso S, Ulloa AV, MadridP, Gould S, Latorre JJ, Avila R, Benveniste S, Gallo M, Belletti J, Lopez R. 1999.Association of primary Pneumocystis carinii infection and sudden infant deathsyndrome. Clinical Infectious Diseases 29:1489-1493.
Wan JY, Wang JY, Wang Y. 2000. A comparison between acute exposures to ethanol andacetaldehyde on neurotoxicity, nitric oxide production and NMDA-inducedexcitotoxicity in primary cultures of cortical neurons. The Chinese Journal ofPhysiology 43:131-138.
Wang SS, Fernhoff PM, Khoury MJ. 2000. Is the G985A allelic variant of medium-chainAcyl-CoA dehydrogenase a risk factor for sudden infant death syndrome? a pooledanalysis. Pediatrics 105:1175-1176.
Waters KA, Meehan B, Huang JQ, Gravel RA, Michaud J, Cote A. 1999. Neuronal apoptosisin sudden infant death syndrome. Pediatric Research 45:166-172.
Weinberg ED. 2001. Iron, infection and sudden infant death. Medical Hypotheses 56:731-734.

45
Weis J, Weber U, Schroder JM, Lemke R, Althoff H. 1998. Phrenic nerves and diaphragms insudden infant death syndrome. Forensic Science International 91:133-146.
White RW. 1974. In vivo and in vitro ethanolic fermentation of milk replacers by thenaturally occurring yeast Torulopsis glabrata. Journal of Agricultural Science 83:185-187.
White RW, Lindsay DB, Ash RW. 1972. Ethanol production from glucose by Torulopsisglabrata occurring naturally in the stomachs of newborn animals. Journal of AppliedBacteriology 35:631-646.
Whitfield JB, Zhu G, Heath AC, Powell, Lw, Martin NG. 2001. Effects of alcoholconsumption on indices of iron stores and of iron stores on alcohol intake markers.Alcoholism, Clinical and Experimental Research 25:1037-1045.
Wigfield R, Gilbert R, Fleming PJ. 1994. SIDS: risk reduction measures. Early HumanDevelopment 38:161-164.
Willinger M, Hoffman HJ, Hartford RB. 1994. Infant sleep position and risk for sudden infantdeath syndrome: report of meeting held January 13 and 14, 1994, National Institutesof Health, Bethesda, MD. Pediatrics 93:814-819.
Willinger M, James LS, Catz C. 1991. Defining the sudden infant death syndrome (SIDS):deliberations of an expert panel convened by the National Institute of Child Healthand Human Development. Pediatric Pathology 11:677-684.
Wolcott RM, Jennings SR, Chervenak R. 1995. In utero exposure to ethanol affects postnataldevelopment of T- and B- lymphocytes, but not natural killer cells. Alcoholism:Clinical and Experimental Research 19:170-176.
Wolin MJ, Yerry S, Miller TL, Zhang Y, Bank S. 1998. Changes in production of ethanol,acids and H2 from glucose by the fecal flora of a 16- to 158-d-old breast-fed infant.The Journal of Nutrition 128:85-90.
Wu C, Kenny MA. 1996. Circulating total and ionized magnesium after ethanol ingestion.Clinical Chemistry 42:625-629.
Xu Z, Seidler FJ, Ali SF, Slikker W, Jr., Slotkin TA. 2001. Fetal and adolescent nicotineadministration: effects on CNS serotonergic systems. Brain Research 914:166-178.
Yu D, Zhang L, Eisele J-L, Bertrand D, Changeux J-P, Weight FF. 1996. Ethanol inhibitionof nicotinic acetylcholine type alpha 7 receptors involves the amino-terminal domainof the receptor. Mol Pharmacol 50:1010-1016.

46
Zhou FC, Sari Y, Zhang JK, Goodlett CR, Li T. 2001. Prenatal alcohol exposure retards themigration and development of serotonin neurons in fetal C57BL mice. BrainResearch. Developmental Brain Research 126:147-155.
Zimatkin SM, Rout UK, Koivusalo M, Buhler R, Lindros KO. 1992. Regional distribution oflow-Km mitochondrial aldehyde dehydrogenase in the rat central nervous system.Alcoholism: Clinical and Experimental Research 16:1162-1167.

47
Chapter 2
Transcutaneous Blood Gas Monitoringin the Rat*
*Reprinted by permission of “Comparative Medicine”

48
Introduction
Current methodology for assessing O2 or CO2 partial pressures or saturation within the
blood stream utilizes three common techniques, standard blood gas analysis (SBGA), pulse
oximetry (PO) and capnography. A fourth technique, transcutaneous blood gas (TCBG)
analysis, with more limited use, has been used in human clinical and research settings for
almost 30 years (Huch et al., 1973; Carter and Banham, 2000).
In support of ongoing efforts to establish the juvenile rat as a model for Sudden Infant
Death Syndrome (SIDS), there was a need for a technique that would allow us to monitor
blood gases over time in response to compounds that are reported to depress respiration. The
ideal technique would also require minimal, if any blood sampling. Pulse oximetry would be a
candidate for trend monitoring without a blood sample; however, only O2 is monitored.
Additionally, PO is not as sensitive in the relatively flat upper portion of the hemoglobin
dissociation curve (Leasa, 1992; Brudin et al., 1994). Capnography measures the end-tidal
partial pressure of CO2 (PetCO2) without a blood sample, which in general accurately reflects
the arterial partial pressure of CO2 (PaCO2); however, patients are usually intubated and when
not, has limited usefulness (Szaflarski, 1996). Remote telemetry would be ideal for these
types of experiments where anesthesia or restraint could be avoided. At this time, telemetric
devices that measure the arterial partial pressure of O2 (PaO2) or PaCO2 are not available. The
research model (the suckling rat) has a limited blood volume, making serial sampling for
SBGA difficult. Additionally, arterial access is technically difficult. Lastly, SBGA provides
information only at specific time points, thus transient changes might be missed. The
objective of the study reported here was to validate the TCBG method in the rat.

49
Briefly the TCBG analysis instrument utilizes a heated (37 to 45° C) probe which is
applied to the skin. The probe is comprised of a Stowe-Severinghaus electrode, which
measures the partial pressure of CO2 (PCO2), as well as a Clark-type polarographic electrode,
which measures the partial pressure of O2 (PO2). The heat supplied by a thermistor, causes an
increase in blood flow to the probe site, which increases the amount of O2 that is brought to
and released at the probe site (Rithalia, 1991; Huch, 1995b). The heat also shifts the O2 and
CO2 dissociation curves to the right, thus increasing the partial pressures of both gases
(Rithalia, 1991; Rochat and Mann, 1994). In humans, transcutaneous partial pressure of O2
(PtcO2) readings should be slightly below PaO2 and the transcutaneous partial pressure of CO2
(PtcCO2) should be slightly above the PaCO2. The PtcO2 is lower due to heat-induced increases
in metabolic demand by the cells and due to a diffusion gradient established by the O2
consumed by the polarographic electrode (Huch, 1995a). The PtcCO2 is higher, also due to
heat-induced increases in cell metabolism (Rithalia, 1991).
Use of TCBG analysis in species other than humans appears to be growing. The
TCBG analysis has been utilized in a variety of species, including canines (Gottrup et al.,
1988; Brothers et al., 1993; Wilhelm et al., 1995), mice (Kamler et al., 1993), rats (Furset et
al., 1987; Yamamoto and Kida, 1996), cats (Mann et al., 1998), rhesus monkeys (Fall et al.,
1979; Mueller-Heubach and Battelli, 1982), sheep (Bergmans et al., 1997), guinea pigs
(Braems et al., 1996), rabbits (Ovadia et al., 1995; Raposio and Santi, 1998), swine (Barker et
al., 1991; Sundin et al., 2000), and horses (Warren et al., 1984; Wagner et al., 1990).
Furset and coworkers (1987) (Furset et al., 1987) used TCBG analysis to monitor the
PtcCO2 in rats within a hyperbaric chamber. Their PtcCO2 measurements correlated well with

50
the PaCO2; however, PtcCO2 measurements were always higher than PaCO2 (Furset et al.,
1987). Additionally, the PtcCO2 response time was slower than that of PaCO2 when inspired
levels of CO2 were changed (Furset et al., 1987). In another report (Yamamoto and Kida,
1996), TCBG analysis was assessed for use during magnetic resonance imaging (MRI) of the
rat. The technique was found to be acceptable for trend monitoring of CO2 during MRI
procedures with no adverse effects on imaging; however, TCBG readings again lagged behind
changes measured by use of SBGA analysis. These findings agree with those of other
published reports (Furset et al., 1987; Carter and Banham, 2000). Correlation between PtcCO2
and PaCO2 was high, but the PtcO2 and PaO2 correlated poorly (Yamamoto and Kida, 1996).
Materials and Methods
Animals
Sprague- Dawley rats were bred and housed in the vivarium of the School of
Veterinary Medicine at Louisiana State University. The facility is operated by the Division of
Laboratory Animal Medicine and is accredited by the Association for Assessment and
Accreditation of Laboratory Animal Care, International. The study reported here was
approved by the Institutional Animal Care and Use Committee.
Rats were housed in polycarbonate cages on corn cob bedding, (Bed-O’Cobs, The
Andersons, Maumee, OH) with a 12/12-h light/dark cycle. Room temperature was maintained
between 20 to 22.2°C and humidity between 40 to 60%. Feed (Lab Diet® 5001, PMI®
International, Inc., Brentwood, MO) and water (via water bottles) were provided ad libitum.
Sentinel rats housed within the facility were tested quarterly for Sendai, sialodacryoadenitis,

51
and Kilham’s rat viruses, pneumonia virus of mice, and Mycoplasma pulmonis. In addition,
animals were tested annually for murine bacteria, as well as internal and external parasites.
Transcutaneous Blood Gas Monitoring
A transcutaneous blood gas monitor (Model TINA TCM3,Radiometer, Copenhagen,
Denmark) was used for the validation study. Manufacturer specifications include a range of 0-
800 mm Hg (PO2) and 0-200 mm Hg (PCO2), as well as 1 mm Hg accuracy at 25°C for both
parameters. The probe (Model E5280 Radiometer), is a combined transcutaneous PO2 and
PCO2 probe reported by the manufacture to have a drift of < 1 mm Hg/h and a 90% response
time of 20 seconds for PO2 and 50 seconds for PCO2 when used on humans.
Prior to calibration, two membranes were applied to the probe surface to exclude ions
and charged molecules. Two drops of electrolyte solution containing propanediol,
propanetriol, potassium chloride, potassium hydrogen carbonate, and deionized water
(Radiometer) were applied to the ventral surface of the probe. The membranes were then
applied, followed by inspection for trapped air bubbles. If any air bubbles were observed, the
probe was re-membraned. The probe was re-membraned every two weeks during this study
per manufacturer’s recommendations. The TCBG monitor was calibrated against a standard
calibration gas supplied by the manufacturer which contained 5.0% CO2, 20.90% O2, with the
balance N2. The unit was calibrated at start up and each time the probe site or probe
temperature was changed. Calibration values for O2 and CO2 were programmed daily during
testing. Values were derived from standard tables supplied by the manufacturer, and
corresponded to barometric pressures taken and recorded daily.

52
For experiment one, probe site preparation consisted of initial clipping of the hair
followed by application of a depilatory agent (Nair®, Carter-Wallace, Inc., New York, NY).
Nair® was applied and left in place for approximately 2 minutes. After Nair® removal, the
probe site was cleaned with alcohol and dried to facilitate adhesion of the fixation ring. Later
experiments included only hair clipping. The calibrated probe was attached to the skin by use
of a fixation ring (Radiometer). Once the fixation ring was applied on a flat, horizontal area of
skin, three to five drops of contact liquid, 1, 2- propanediol and deionized water,
(Radiometer) were placed within the ring. The calibrated probe was then attached to the ring
by a 45° clockwise turn, which locked the probe to the fixation ring (Fig 2.1). Thereafter, the
animal can be moved if needed without leakage of the contact fluid. However, in our study, a
position change was made. Daily, after testing and removal of the probe, antibiotic ointment
(Fougera®Triple Antibiotic Ointment, Melville, NY) was applied to the probe site to lubricate
the skin and prevent infections.
Figure 2.1: Illustration of the transcutaneous probe application procedures. The adhesive ringis applied (A) followed by placement of five to seven drops of contact liquid within the wellformed by the ring (B). The probe is then screwed into the threads of the well by a 45°clockwise motion (C). The well design excludes air, retains the contact fluid and providessolid attachment of the probe. Illustration reprinted with permission of Radiometer AmericaInc., Westlake, Ohio.

53
Catheter Placement
Adult animals were anesthetized in a chamber into which 5% isoflurane (IsoFlo®,
Abbott Lab.; Chicago, Ill.) flowed, using 100% O2 as the carrier gas. Once recumbent,
animals were removed from the chamber and anesthesia was maintained via a nose cone
supplying O2 and isoflurane at 2.5%. Buprenorphine HCL (Buprenex®, Rickett & Coleman,
Hull) was administered subcutaneously at a dose of 0.05 mg/kg of body weight for post
operative analgesia. Hair over the incision sites (left femoral triangle, dorsal interscapular)
was clipped, and the skin was prepared for aseptic surgery. Using the method of Wayneforth
and Flecknell (1992), femoral artery catheters were placed, using either a 2-F (0.3 mm ID x
0.6 mm OD) or 3-F (0.6 mm ID x 0.9 mm OD) polyurethane catheter (Access Technologies,
Skokie, Ill.) filled with heparinized saline (62 IU/ml).
Juvenile animals were anesthetized with isoflurane (2.5%) via nose cone, using room
air (0.6 liter/minute) as the carrier gas. Once the animal was anesthetized, the skin was
prepared for aseptic surgery. The left carotid artery was visualized via a 1 cm incision and
blunt dissection, followed by insertion of a 1-F (0.18 mm ID x 0.41 mm OD) polyurethane
catheter (Access Technologies) filled with heparinized saline (62 IU/ml), and secured in place
with 6-0 silk suture. Buprenorphine HCL was not administered because these were terminal
surgeries, post operative analgesia was not needed, and the drug has been documented to
lower blood pressure in animals under isoflurane anesthesia (Martinez et al., 1997).
Inspired Gases
Room air or 100 % O2 were used as the primary anesthetic carrier gases for all
experiments. They were chosen to simulate what might be encountered under standard gas

54
anesthesia conditions, or normally breathed in the environment. To each of the primary gases
was added O2 or CO2 to assess the ability of the transcutaneous instrument to reflect changes
within the blood as assessed by SBGA. Additionally, the varying concentrations of CO2
reflect concentrations that may be easily attained under normal conditions while infants are
laying prone on soft bedding material and appear to be associated with SIDS (Carleton et al.,
1998). Specific carrier gases and mixtures were addressed for each experiment.
Standard Blood Gas Analysis
For adult animals, blood samples (0.2 ml)for SBGA were collected into a heparinized
1-ml syringe. Pre-samples of 0.2 ml were collected, then were re-injected after the SBGA
sample was taken. Finally, the catheter was flushed with heparinized saline (0.1 ml). The
collected blood sample was analyzed within 15 min of collection to prevent equilibration of
the blood in the syringe with room air. The SBGA unit (Model 238 pH/Blood Gas Analyzer,
Ciba-Corning, Medfield, MA) was calibrated daily by use of two point calibration, and hourly
by use of single point calibration. Blood samples and pre-samples for juvenile animals were
0.12 ml each and were analyzed and handled similarly as were those from the adults.
Experiment 1
The purpose of this experiment was to establish the optimal site for the transcutaneous
probe. The optimal site would be the location at which PtcO2 and PtcCO2 closely approximated
or equaled their arterial reference counterparts. Two male (mean body weight, 568 gm; mean
age, 40 weeks) and two female (mean body weight, 322 gm; mean age, 56 weeks) retired
Sprague-Dawley breeder rats were used. Animals were anesthetized with Isoflurane mixed in

55
100% O2 as previously described. Anesthetic depth was monitored and adjusted as needed to
maintain a light plane of anesthesia.
Three probe sites were tested. Site 1 was 2 cm lateral to the umbilicus on the right
ventral aspect of the abdomen. Site 2 was 2 cm lateral to the linea alba just caudal to the rib
cage. Site 3 was just caudal to slightly overlapping the xyphoid process at midline. The PtcO2
and PtcCO2 readings were taken at probe temperatures of 37 and 43°C, with calibration between
temperature changes. PtcO2 values recorded at 37 and 43°C were combined for statistical
analysis as were PtcCO2 values. At a given probe temperature, values were recorded when the
readings from the instrument stabilized, usually between 12 and 20 minutes. Once values were
taken for one site, the probe was moved to the next site, followed by recalibration and data
acquisition. The process was repeated until all three sites had been tested.
Experiment 2
The purpose of this experiment was to establish the optimal probe temperature at which
PtcO2 and PtcCO2 values most closely approximated their arterial reference counterparts and
evaluate any carry over effects that may have resulted from daily use of the same animal and
probe site.
Four female (mean body weight, 213 g) and four male (mean body weight, 306 g)
Sprague-Dawley rats (mean age, 9 weeks) were tested with a single probe temperature once a
day for 10 days. Testing was done at the same time each day. One of five probe temperatures
(41, 43, 43.5, 44, and 44.5°C) were randomly selected daily and assigned to each animal. Using
100% O2 as the carrier gas, rats were anesthetized as previously described and were positioned
in dorsal recumbency. The xyphoid region was selected as the probe site. The hair was clipped

56
by use of a standard clipper followed by an electric razor to remove as much hair as possible
from the probe site. On subsequent days, the probe site was shaved as needed, using an electric
razor. The probe was applied each day, and transcutaneous values were collected an average of
33 minutes after probe application. After data collection, the rats were allowed to recover from
anesthesia and were monitored in their cages. After a 5 day rest period, testing was repeated;
however, room air was used as the carrier gas in place of O2.
Experiment 3
The purpose of this experiment was to establish the maximal probe temperature that
could be applied for three to four hours without damaging the skin of the animal. Initially, two
adult Sprague-Dawley rats were tested. The animals were anesthetized, and the skin was
prepared as previously described. Buprenorphine HCL was given subcutaneously at a dose of
0.05 mg/kg for analgesia. The probe temperature was set at the highest temperature (44.5°), then
was calibrated. The probe was then applied and left in place for the allotted time. The following
day, one animal was humanely euthanatized via CO2 asphyxiation and tissues were harvested for
histologic examination. The second animal was observed for two more days to watch for lesion
development at the probe site. If lesions were detected either grossly or microscopically, two
more rats were tested at the next lower probe temperature, stepping down in 0.5°C decrements
until a probe temperature was reached at which lesions were not observed grossly or
microscopically. Ten adult rats with a mean age of 12 weeks were used in this experiment.
For juvenile animals (mean age, 11 days) it was assumed probe temperatures that
damaged the skin of adults would damage juvenile skin too. Using the probe temperature found
in adults not to cause damage at 3 h, juveniles were tested like the adults and were similarly

57
examined for skin damage. Additional juvenile rats were tested as needed until a probe
temperature was found that would not damage the skin during the allotted application time
frame. Six juvenile rats were used in this experiment.
Experiment 4
The purpose of this experiment was to compare partial pressure gas values of O2 and
CO2 measured by use of TCBG analysis versus SBGA in adult and juvenile rats while varying
probe temperature. Ten male (mean body weight, 278 g) and 14 female (mean body weight, 196
g) Sprague-Dawley rats ( mean age, 8 weeks) were assigned to three groups. Group 1 consisted
of 12 rats (five males, seven females) in which a probe temperature of 42.5°C was used. Group
2 contained six rats (two males, four females) subjected to a probe temperature of 43°C, and
group 3 consisted six rats (three males and three females) exposed to a probe temperature of
44°C. Testing began five to seven days after catheter implantation, as previously described.
Room air contains 20.95% O2 at sea level and will be rounded to 21.00% hereafter. Room air
contains 0.03% CO2 at sea level and will be referred to as 0.00% hereafter. A single pair of
animals were tested daily, over six days with two of three possible inspired gas mixtures
delivered under isoflurane (2%) anesthesia (treatment 1: room air at 0.6 liter/min, 21.00%
fraction of inspired O2 (FIO2), 0.00 % fraction of inspired CO2 (FICO2); treatment 2: room air at
0.6 liter/min plus 50 ml of O2/min, 27.00% FIO2, 0.00% FICO2; treatment 3: room air at 1
liter/min plus 50 ml of CO2/min, 19.88% FIO2, 4.76% FICO2 ).
For the first three days of testing, the pair were anesthetized by use of treatment 1, and a
blood sample was collected for SBGA approximately 30 minutes after probe application. The
TCBG values were recorded at the time of blood collection. Thereafter followed initiation of

58
treatment 2, and approximately 20 minutes later, TCBG values and a blood sample were
collected. The following three days (the same pair of animals), treatments 1 and 3 were applied
and data were collected, followed by euthanasia on day six. The next pair of animals was then
tested with treatments 1 and 3 for three days, followed by a three-day rotation with treatments 1
and 2. Each subsequent pair was tested switching the aforementioned treatment order as
described previously.
Sixteen male and 14 female (mean body weight, 25 g; age, 10 days) juvenile rats were
assigned to three groups of 10 by probe temperature (42, 43 and 44°C). Five animals in each
group received treatment 1 followed by treatment 2, and the other five animals received
treatment 1 followed by treatment 3. Treatments 1-3 are the same as those applied to the adult
animals. Animals were anesthetized with isoflurane (2.5%) via nose cone, using room air (0.6
liter/minute) as the carrier gas. After catheter placement, the isoflurane level was decreased to
1.5%, followed by application of the probe to the abdomen on midline at the level of the
umbilicus. After simultaneous blood sample and TCBG data collection for each treatment (time
points as in adults), animals were humanely euthanatized by cervical dislocation.
Experiment 5
The purpose of this experiment was to define the sensitivity of the TCBG instrument by
comparison of TCBG data and SBGA data while testing progressively lower concentrations of
inspired CO2 in adult and juvenile animals. Five female (mean body weight, 167 g; mean age,
7.5 weeks) and five male adult Sprague-Dawley rats (mean body weight, 196 g; mean age, 7.5
weeks) were tested daily for 5 days, using a probe temperature of 44°C. Animals were
anesthetized as described in experiment 4, using room air (0.6 liter/min) as the carrier gas. At

59
approximately 30 min, TCBG and SBGA readings were taken, followed by application of one of
five randomized CO2/room air concentrations (A = 5.00% FICO2, 19.95 % FIO2; B = 2.50%
FICO2, 20.47% FIO2; C = 1.25% FICO2, 20.74% FIO2; D = 0.62% FICO2,20.85% FIO2; E =
0.31% FICO2, 20.94% FIO2) at the rate of 1 L/min. Approximately 20 min after application of
the second treatment, TCBG and SBGA readings were taken, followed by recovery of the
animal. On the last treatment day after data collection, the animals were humanely euthanatized
via CO2 inhalation followed by skin specimen collection of the probe site for histologic
examination.
Twenty-four female ( mean body weight, 21 g) and 26 male ( mean body weight, 22 g)
juvenile Sprague-Dawley rats, 10 days old, were tested at a probe temperature of 42.0°C.
Animals were tested in groups of 10 and were anesthetized initially with isoflurane and room air
as previously described for juveniles in experiment 4. Approximately 30 minutes later, TCBG
and SBGA readings were taken. Groups then received one of the five treatments previously
mentioned for the adults (group 1, treatment A; group 2, treatment B; group 3, treatment C;
group 4, treatment D; and group 5, treatment E) followed by data collection for TCBG and
SBGA analysis approximately 20 minutes later. Animals were then humanely euthanatized by
cervical dislocation.
Statistical Analysis
For experiment 1, mean PtcO2 and PtcCO2 were compared between probe sites by use of
analysis of variance (ANOVA). The Bonferroni post-hoc test was used to examine differences
between each probe site. Mean PtcO2 and PtcCO2 for each probe site were compared to mean
PaO2 and PaCO2 reference values derived from samples collected from in preliminary trails from

60
17 adult rats (8 male, 9 female, 97 blood gas samples) under the same anesthetic and carrier gas
conditions. Mean ± SEM PaO2 reference values while breathing 100 % O2 are 370.53 ± 4.59
mmHg. Mean ± SEM PaCO2 reference values while breathing 100% O2 are 39.51 ± 0.56 mmHg.
For experiment 2, mean PtcO2 data were compared by probe temperature by use of
ANOVA along with Bonferroni’s post-hoc test to examine differences between probe
temperatures. PtcCO2 data were similarly examined. Summary statistics are presented in Table
2.1. Mean PtcO2 and PtcCO2 for each probe temperature while animals were breathing 100% O2
were compared to reference values established for experiment 1. Mean PtcO2 and PtcCO2 for each
probe temperature while animals were breathing room air were compared to reference values
established from data collected in experiments 4 and 5 with those for anesthetized adult animals
breathing room air only (15 male, 17 female, 166 blood gas samples). For PaO2 reference values
while breathing room air, mean ± SEM values were 78.03 ± 0.72 mmHg. For PaCO2 reference
values while breathing room air, mean ± SEM values were 37.76 ± 0.50 mmHg. The effect of
probe temperature, prior probe temperature, and treatment (O2 or room air) on the PtcO2 and the
PtcCO2 were evaluated for carry over effects, using a mixed effect linear model where the
random variance of rat and anesthesia time were included with the aforementioned fixed effects.
Proc Mixed (SAS version 6.12, SAS Institute, Cary, NC) was used for analysis.
For experiment 4, PaO2 and PtcO2 as well as PaCO2 and PtcCO2 data were subjected to
regression analysis for each probe temperature, and Pearson correlation coefficients (r) are
reported. Using the General Linear Model (GLM) with PaCO2 as the dependent variable, we
looked for the effects of PtcCO2, anesthesia time, sex, body weight, and treatment for each probe
temperature and multivariate correlation coefficients (R) are reported. Significant variables were

61
then further analyzed by use of Tukey’s post hoc test. Using GLM with PaO2 as the dependent
variable we tested for the effects of PtcO2, anesthesia time, sex, body weight, and treatment for
each probe temperature with Tukey’s post hoc test applied where appropriate. Summary
statistics (Tables 2.2 and 2.3) are reported, along with differences between means determined by
use of ANOVA, with treatment as the independent variable along with Bonferroni’s post-hoc
test.
For experiment 5, PaO2 and PtcO2 as well as PaCO2 and PtcCO2 data were analyzed by use
of regression analysis by group and correlation coefficients (r) are reported. Groups were
assigned according to the second treatment applied, and analysis of a given group’s contained
the first and second treatments on a given day. The GLM procedure was used as described in
experiment 4; however, either group or treatment was used in a model, and probe temperature
was never used in either model. Tukey’s post-hoc test was applied where appropriate. Summary
statistics are reported (Tables 2.4 and 2.5), with differences between means determined by use
of ANOVA, with treatment as the independent variable, along with Tukey’s post-hoc test.
Probability of P # 0.05 was considered significant in all experiments. Statistical analysis was
performed, using Systat (Version 9, SPSS, Inc., Chicago, Ill.) unless otherwise indicated.
Results
Experiment 1
Site 3 (xyphoid area) was determined to be the probe location of choice when 100% O2
was used as the carrier gas for the anesthetic. Mean ± SEM PtcO2 at site 3 (191.89 ± 50.36
mmHg) most closely approximated mean reference PaO2 (370.53 ± 4.59 mmHg). Mean PtcPO2 at
site 3 differed (higher) from that at sites 1 and 2 (Fig 2.2). Differences were not evident between

62
probe sites for PtcCO2, although the mean PtcCO2 at site 3 (68.44 ± 2.42 mmHg) most closely
approximated mean reference PaCO2 (39.51 ± 0.56 mmHg).
Experiment 2
The optimal probe temperature was determined to be 44.5°C where PtcO2 and PtcCO2
most closely approximate arterial reference blood gas values. When 100% O2 was used as the
carrier gas, as probe temperature increased mean PtcO2 values also rose (Fig 2.3). Mean PtcO2 at
44.5°C (260.00 ± 16.61 mmHg) most closely approximated mean reference PaO2 (370.53 ± 4.59
mmHg). Mean PtcO2 values at 44 and 44.5°C were different (higher) from those at the other
three temperatures tested. When room air was used as the carrier gas, only mean PtcO2 at 44.5°C
(86.92 ± 5.02 mmHg) differed (higher) from values at the other temperatures.
The optimal probe temperature for mean PtcCO2 (53.13 ± 1.99 mmHg) was 44.5°C where
transcutaneous values most closely approached mean reference PaCO2 (39.51 ± 0.56 mmHg). At
44.5°C, PtcCO2 values were different (lower) from readings taken at the other probe
temperatures tested with 100% O2. While breathing room air, a difference could not be detected
between probe temperatures for PtcCO2 means. Results for all carrier gases and probe
temperatures are presented in Table 2.1. Regarding carry over effect from the previous day’s
treatment, an effect for prior probe temperature, or prior treatment (O2 or room air) was not
apparent for PtcCO2 or PtcO2 (data not shown).
Experiment 3
The highest probe temperature that could be used for at least three hours without damage
to the skin in an adult rat was 42.5°C. In juvenile rats, the maximal probe temperature for a
three-hour exposure was 42.0°C. Damage to the skin was not always grossly apparent

63
Figure 2.2: Comparison of transcutaneous partial pressures at selected probe sites. Barsrepresent means (± SEM) of PtcO2 and PtcCO2 at each probe site. Four anesthetized rats weretested while breathing 100% O2. Data were collected for two probe temperatures (37° and 43°C) at each of three probe sites, with calibration between each temperature or probe site change(6 data points per animal). Mean reference values for PaO2 = 370.53 mm Hg (solid line), meanPaCO2 = 39.51 mm Hg (dotted line). Site 1: 2 cm lateral to the umbilicus on the right, site 2: 2cm lateral to the linea alba on the right side just caudal to the rib cage, site 3: Just caudal orslightly overlapping the xyphoid process on midline. No differences in partial gas pressurescould be demonstrated for probe sites with superscripts in common within a giventranscutaneous parameter.
immediately after probe removal. In adults, lesions when present were limited to edema and
erythema. Gross lesions were more apparent 24 h after probe removal. At 24 h after probe
removal (44.5°C, four-hour treatment), an eschar covered the entire probe site. Gross lesions
diminished as the probe temperature and application time decreased, in subsequent animals,
until they were absent when the probe was applied at 43.0°C for three hours. Testing in
juveniles started at 43°C for three hours were revealed only slight erythema at 24 h after
treatment. Gross lesions were not observed 24 h after a three-hour test period at 42.5°C.
Microscopic lesions in adults consisted of coagulative necrosis with occasional
ulceration of the epidermis (44.5°C, four hours). A sharp line of demarcation was present at the

64
Figure 2.3: Comparison of mean PtcO2 at 5 different probe temperatures (42, 43, 43.5, 44, and44.5 °C) using 100% O2 as the anesthetic carrier gas. The dotted line represents mean (±SEM)PtcO2 at each probe temperature. Mean PaO2 reference value (370.53 mm Hg) is represented by asolid line and shown only for comparison. Eight adult rats were tested daily with a single probetemperature randomly selected each day for 5 days. No differences could be demonstrated forprobe temperatures with subscripts in common.
borders of the probe site. Occasional sebaceous glands and blood vessels exhibited coagulative
necrosis deeper in the dermis where mild hemorrhage was also present. Inflammatory cells
consisted principally of neutrophils and were most often seen in ulcerated areas. When the probe
was applied for three hours at 43.0°C, microscopic lesions were restricted to the epidermis and
consisted of mild karyorrhexis and occasional karyolysis of the basal cells. The basement
membrane remained intact. Similar mild lesions were observed in juveniles at low probe
temperatures (42.5°C, three hours).
Experiment 4
Comparison of correlation coefficients for TCBG versus SBGA values while varying
probe temperature yielded the following results. In adult rats at a probe temperature of 42.5°C,

65
41°C 43°C 43.5°C 44.0°C 44.5°C
100% O2PtcO2 (mmHg) Mean 96.18a 84.18a 105.12a 197.64b 260.00c
SEM ±12.69 ±8.87 ±16.67 ±20.46 ±16.60Range 35-216 36-199 39-318 73-340 172-400
PtcCO2(mmHg) Mean 63.94a 61.18a 58.44a,b 56.21a,b 53.12b
SEM ±1.62 ±1.33 ±2.50 ±2.04 ±2.00Range 54-76 51-68 44-86 43-69 39-71
Room AirPtcO2 (mmHg) Mean 61.50a 59.94a 72.43a,b 68.90a,b 86.92b
SEM ±5.33 ±5.88 ±5.48 ±7.93 ±5.02Range 25-99 17-103 26-113 24-116 65-128
PtcCO2(mmHg) Mean 65.93a 66.87a 57.79a 59.60a 56.31a
SEM ±1.73 ±3.11 ±2.27 ±5.31 ±2.72Range 55-76 48-91 48-77 49-105 44-71
Table 2.1. Summary statistics of transcutaneous gas data collected at five probe temperatures(41.0, 43.0, 43.5, 44.0 and 44.5°C) under isoflurane anesthesia with either 100% O2 or room airas the carrier gas in adult rats (n=8).
PtcO2- transcutaneous partial pressure of O2, PtcCO2- transcutaneous partial pressure of CO2,SEM-Standard error of the mean. Within a row, no differences could be demonstrated betweentreatment means with superscripts in common(p>0.05).
the correlation coefficient for PaO2 versus PtcO2 was poor ( r = 0.344). Good correlation was
found between PaCO2 and PtcCO2 ( r = 0.812). Inflammation was not evident at the probe site in
any animal. Animals were anesthetized for an average of 92 min, and the probe was in place for
an average of 69 min. At a probe temperature of 43°C, PaO2 correlated poorly with PtcO2 ( r =
0.148); however, PaCO2 versus PtcCO2 correlation improved ( r = 0.873).
Occasionally, erythema was seen at the probe site; however, this did not persist from day
to day. In this phase of the study, rats were anesthetized for 90 min, and the probe was in contact
with the animal for a mean time of 73 min. Using a probe temperature of 44°C, PaO2 versus
PtcO2 correlation was modest ( r = 0.530), whereas PaCO2 versus PtcCO2 correlation was high ( r
= 0.924) (Fig 2.4). Mean anesthesia and probe contact time at 44°C were 90 and 72 min,

66
respectively. Differences between treatments by probe temperature for adult animals are
presented in Table 2.2.
When juveniles were tested at 42.0°C, the correlation for PaO2 and PtcO2 was poor ( r = -
0.135). Correlation between PaCO2 and PtcCO2 was much higher ( r = 0.892). During this stage,
the mean anesthesia time was 76 min and mean probe application time was 53 min. At 43.0°C,
juvenile PaO2 and PtcO2 still correlated poorly ( r = 0.122); however, PaCO2 and PtcCO2
correlation decreased ( r = 0.465). At 43.0°C, juvenile rats were anesthetized for a mean 88 min,
and mean probe application time was 60 min. Finally, at 44.0°C with a mean anesthesia time of
88 min and mean probe application time of 59 min, PaO2 and PtcO2 again correlated poorly but
improved ( r = 0.531). The PaCO2 correlated well with PtcCO2 ( r = 0.899), but was only slightly
better than results at 42.0°C. Differences between treatments by probe temperature for juvenile
animals are presented in Table 2.3.
When all probe temperature data were combined for adult animals, PtcO2, anesthesia
time, probe temperature, sex and treatment affected prediction of PaO2 ( r = 0.603), whereas
body weight did not. The PtcCO2, probe temperature, anesthesia time, and treatment affected
prediction of PaCO2 (R= 0.899). Effects of sex or body weight in adults could not be
documented.
When all probe temperature data were combined for juveniles, the variables, PaO2 probe
temperature, anesthesia time, and treatment affected prediction of PtcO2 positively ( r = 0.541),
whereas sex and body weight did not. The PtcCO2, probe temperature, and body weight were
useful in prediction of PaCO2 and improved correlation ( r = 0.833). Effects could not be
demonstrated for anesthesia time, sex, or treatment in prediction of PaCO2 for juvenile animals.

67
Figure 2.4: Scatter plot with regression line, PaCO2 = 5.748 + 0.585(PtcCO2), using a probetemperature of 44.0°C ( r = 0.924). Six adult rats were tested daily for six days with two of threeinspired gas treatments which differ in the concentration of O2 and CO2 (treatment 1: room air;and treatment 2: 27% FIO2, 0.00% FICO2 ;or treatment 3: 19.88% FIO2 , 4.7% FICO2 ).Transcutaneous data and SBGA samples were collected simultaneously for a total of 64samples.
Experiment 5
Sensitivity assessment of TCBG technology indicated that PaO2 versus PtcO2 correlation
in adults was poor for individual groups (A: r = 0.025, B: r = 0.065, C: r = 0.056, D: r = 0.225,
and E: r = 0.270) and when all groups were combined (r= 0.099). Correlation coefficients for
PaCO2 versus PtcCO2 for adult animals varied between groups (A: r = 0.440, B: r = 0.466, C: r =
0.643, D: r = 0.489, and E: r = 0.344). Overall PaCO2 versus PtcCO2 correlation for all groups ( r
= 0.493) was moderate. Mean anesthesia time and probe contact time was 66 and 53 min,
respectively for all groups combined. Differences between treatments for adult animals are
presented in Table 2.4.
The PaO2 versus PtcO2 correlation in juveniles varied for individual groups (A: r = 0.172,
B: r = 0.497, C: r = 0.130, D: r = 0.289, and E: r = 0.560) and when all groups were combined

68
42.5°C 43.0°C 44.0°C
Treatment Treatment Treatment1 2 3 1 2 3 1 2 3
PaO2(mmHg)Mean 80.46a 86.81a 80.32a 80.09a 90.30b 88.67b 68.16a 86.00b 75.79c
SEM ±1.29 ±2.54 ±2.95 ±1.48 ±1.57 ±2.81 ±1.31 ±2.04 ±2.38Range 52-96 68-113 48-110 65-98 78-98 72-106 52-83 68-100 62-92
PtcO2(mmHg)Mean 54.27a 60.63a 61.60a 53.12a 55.76a 69.87b 53.03a 75.50b 72.71b
SEM ±2.35 ±3.79 ±4.36 ±3.64 ±5.69 ±5.29 ±2.74 ±4.91 ±4.78Range 20-104 25-110 23-105 12-100 10-82 37-118 13-89 45-131 28-98
PaCO2(mmHg)Mean 36.00a 37.78a 43.28b 39.62a 41.13a 53.27b 43.22a 46.00a 57.14b
SEM ±0.86 ±1.18 ±1.55 ±1.06 ±1.88 ±2.01 ±1.774 ±1.55 ±1.88Range 23-56 28-50 29-59 28-50 29-53 36-63 31-59 28-56 47-68
PtcCO2(mmHg)Mean 57.08a 59.89a 69.60b 59.00a 61.47a 77.76b 64.94a 68.29a 86.27b
SEM ±1.43 ±2.11 ±3.02 ±1.63 ±3.07 ±4.06 ±1.77 ±2.70 ±2.77Range 32-87 42-78 45-107 39-73 40-85 30-91 45-92 40-89 72-106
Table 2.2. Summary statistics of transcutaneous and arterial gas data collected at three probetemperatures (42.5°C, n=12; 43.0°, N=6; 44.0°C, n=6) in adult rats under isoflurane anesthesia(2%) while varying carrier gas FIO2 and FICO2 (treatments 1-3).
PaO2 = arterial partial pressure of O2, PtcO2 = transcutaneous partial pressure of O2, PaCO2 =arterial partial pressure of CO2, PtcCO2 = transcutaneous partial pressure of CO2, FIO2 = Fractionof inspired O2; FICO2 = Fraction of inspired CO2, treatment 1 = 21% FIO2, 0.00% FICO2;treatment 2 = 27.00% FIO2, 0.00% FICO2; treatment 3 = 19.88% FIO2, 4.76% FICO2. Within aprobe temperature and row, no differences could be demonstrated between treatment means withsuperscripts in common(p>0.05).
( r = 0.083) was low. The PaCO2 versus PtcCO2 correlation coefficients for juvenile animals also
varied among groups (A: r = 0.869, B: r = 0.310, C: r = 0.767, D: r = -0.043, and E: r = 0.826).
Mean anesthesia time and probe contact time were 75 and 53 min, respectively; overall PaCO2
versus PtcCO2 correlation for all groups ( r = 0.634) was moderate to good. Differences between
treatments for juvenile animals are presented in Table 2.5.
Using GLM with all groups combined, correlation was poor ( r = 0.225); however,
improved with only body weight serving as a predictor for PaO2 in adults. PaCO2 correlation.
improved ( r = 0.629), with PtcCO2, anesthesia time, and group serving as useful predictors.
Then juveniles were evaluated with GLM, correlation improved to a moderate level ( r = 0.579),

69
42.0°C 43.0°C 44.0°C
Treatment Treatment Treatment1 2 3 1 2 3 1 2 3
PaO2(mmHg)Mean 44.20a 52.00a 49.40a 47.40a 46.60a 62.20b 43.80a 56.20a 44.00a
SEM ±2.59 ±2.10 ±4.82 ±3.33 ±4.06 ±3.15 ±2.99 ±2.20 ±5.79Range 32-56 45-57 35-61 29-60 35-55 55-70 23-54 48-61 27-58
PtcO2(mmHg)Mean 1.50a 1.60a 1.00a 2.60a 6.40a 3.00a 14.20a 36.40a 12.80a
SEM ±0.72 ±0.75 ±0.55 ±1.01 ±2.60 ±2.02 ±4.83 ±8.08 ±7.79Range 0-7 0-4 0-3 0-9 1-15 0-11 0-46 19-59 1-43
PaCO2(mmHg)Mean 32.90a 37.40a 44.60a 34.40a 39.80a 40.40a 35.10a 33.40a 45.40a
SEM ±2.48 ±2.98 ±5.69 ±1.77 ±2.96 ±2.66 ±2.02 ±1.96 ±4.67Range 21-49 31-48 34-66 27-44 32-47 35-50 27-48 30-41 29-54
PtcCO2(mmHg)Mean 79.50a 93.60a 95.40a 79.50a 83.00a 85.20a 64.70a 58.20a 85.40b
SEM ±2.83 ±5.82 ±7.71 ±3.03 ±6.29 ±3.22 ±5.08 ±4.32 ±5.83Range 67-94 80-115 82-124 66-94 62-93 76-94 48-103 51-75 70-103
Table 2.3. Summary statistics of transcutaneous and arterial gas data collected at three probetemperatures (42.0°C, n=10; 43.0°, N=10; 44.0°C, n=10) in juvenile rats under isofluraneanesthesia (1.5%) while varying carrier gas FIO2 and FICO2 (treatments 1-3).
Within a probe temperature and row, differences could not be detected between treatment meanswith superscripts in common (P>0.05). See table 2.2 for key.
with only group being useful for prediction of PaO2. For PaCO2, correlation improved ( r =
0.791), with PtcCO2 and group serving as useful predictors. When GLM was applied using the
same variables with the exception of swapping treatment for group, results were similar.
Discussion
The objective of this study was to validate non-invasive methodology to assess changes
in arterial blood levels of O2 and CO2 in the rat. Analysis of SBGA requires blood samples;
determination of PetCO2 ideally requires intubation, and PO does not provide PaCO2 assessment.
Our future experimental animal model (suckling rat) has a small blood volume, and difficult
venous access. The TCBG method correlates well with PaO2 and PaCO2 in humans, particularly
infants, as well as providing trend data over time without the need for venous access (Brudin et
al., 1994; Tobias et al., 1999).

70
Treatment
RoomAir A B C D EPaO2(mmHg)
Mean 80.50a 88.89b 85.10a,b 82.18a,b 80.30a,b 81.70a
SEM ±0.89 ±1.84 ±2.18 ±1.87 ±2.41 ±1.97Range 60-92 82-97 75-95 71-92 70-91 72-93
PtcO2(mmHg)Mean 22.90a 40.89a,b 42.50b 44.18b 35.50a,b 34.60a,b
SEM ±2.38 ±8.25 ±6.60 ±5.30 ±6.69 ±5.44Range 3-64 16-81 14-89 11-64 10-66 12-68
PaCO2(mmHg)Mean 34.92a 44.00b 39.20a,b 38.73a,b 35.70a 34.40a
SEM ±0.62 ±2.13 ±1.70 ±1.39 ±1.81 ±1.02Range 25-44 35-55 32-47 34-50 28-47 30-40
PtcCO2(mmHg)Mean 63.66a 73.77b 68.70a,b 60.27a 62.80a,b 59.20a
SEM ±1.29 ±2.89 ±3.48 ±2.64 ±2.93 ±2.49Range 29-88 58-90 52-84 45-79 51-76 43-72
Table 2.4. Summary statistics of transcutaneous (44°C probe temperature) and arterial gas datacollected in adult rats (n=10) under isoflurane anesthesia (2%) while varying carrier gas FICO2(treatments: room air-E).
Room air = 21% FIO2, 0.00% FICO2; A = 19.95% FIO2, 5.00% FICO2; B = 20.27% FIO2, 2.50%FICO2; C = 20.74% FIO2, 1.25% FICO2; D= 20.85% FIO2, 0.62% FICO2; E = 20.94% FIO2,0.31% FICO2. Within a row, differences could not be detected between treatment means withsuperscripts in common (p>0.05). See table 2 for key.
Several factors, such as skin thickness, presence of hair, skin lesions, and perfusion
influence the diffusion of O2 and CO2 through the skin (Takiwaki, 1994). Skin thickness is
inversely related to the diffusion of the gases through the skin (Falstie-Jensen et al., 1988). Skin
thickness influences O2 diffusion more than CO2 since O2 is 16 times less liposoluable than is
CO2 (Braems et al., 1996). In quadrupeds such as the rat, the skin is thinner on the ventrum and
medial aspects of the limbs. For this reason we chose the three probe sites tested in experiment
1. Additionally, each of the sites chosen provide a relatively flat surface for probe attachment.
Differences were found in probe sites for pony foals (Warren et al., 1984) and humans
(Takiwaki, 1994), and were attributed to skin thickness variation between sites probe locations.
The presence of hair presents another problem for gas diffusion through the skin of the
rat since the only glabrous areas are the soles of the feet, nose, tail, and the ears , none of which

71
Treatment
RoomAir A B C D EPaO2(mmHg)
Mean 64.16a 47.80a,b 77.80a,c 60.80a 69.80a 64.00a
SEM ±2.72 ±4.54 ±4.95 ±7.42 ±2.73 ±4.82Range 30-100 13-60 51-106 32-100 57-80 42-81
PtcO2(mmHg)Mean 1.36a 2.40a 0.50a 0.30a 1.70a 1.10a
SEM ±0.29 ±0.75 ±0.17 ±0.30 ±0.99 ±0.55Range 0-8 0-6 0-1 0-3 0-8 0-5
PaCO2(mmHg)Mean 29.68a 45.50b 33.70a 34.90a 29.10a 33.10a
SEM ±0.84 ±2.36 ±1.37 ±2.31 ±1.28 ±1.41Range 19-43 37-60 29-43 23-45 24-36 29-43
PtcCO2(mmHg)Mean 82.08a 101.00b 90.90a,b 98.70b,c 82.70a,c 89.80a,c
SEM ±1.54 ±3.47 ±3.91 ±6.59 ±2.46 ±4.36Range 57-110 87-119 76-117 52-127 70-96 72-112
Table 2.5. Summary statistics of transcutaneous (42°C probe temperature) and arterial gas datacollected in juvenile rats (n=50) under isoflurane anesthesia (1.5%) while varying carrier gasFICO2 (treatments: room air-E).
Within a row, differences could not be detected between treatment means with superscripts incommon (p>0.05). See Tables 2 and 4 for key.
are large enough for probe placement. Hair can be removed as was done in these experiments;
however, the hair above the skin surface may not be all of the problem. Takiwaki (1994)
(Takiwaki, 1994) reported much lower PtcO2 and modestly higher PtcCO2 readings taken from
the human cheek (male), when compared to glabrous sites. He speculated the presence of pilo-
sebaceous glands, which release oily secretions, may inhibit the diffusion of O2 to the skin
surface. We also speculate that hair follicles, which are extensions of the epidermis deep into the
dermis may also inhibit the flow of gases to the surface. While the surface hair can be removed,
we still have the remaining hair shaft within the follicle, the pilo-sebaceous glands, and the
dense number of follicles extending into the dermis, all of which would inhibit gas flow to the
surface, especially O2. In experiment 1, Nair was used to remove hair from the surface. This
method of depilation was discontinued after finding this depilatory agent caused cutaneous
inflammation that became apparent on the second day after application. Depilatory use did not

72
adversely affect experiment 1 since all data was collected on the day of depilatory application.
Inflammation principally affected PtcO2 readings, but PtcCO2 values also were altered (data not
shown). The use of depilatory agents is not recommended for studies in which PtcO2 or PtcCO2 is
measured from day to day in the same animal. Two other studies concerned with correlation of
SBGA and TCBG, depilatory agents were used with good results for PtcCO2; however, in those
studies, rats were not tested serially at the same probe site (Furset et al., 1987; Yamamoto and
Kida, 1996).
Perfusion of the skin can also alter TCBG levels (Huch, 1995a). Heat from the probe
increases perfusion to the probe site, and additionally shifts the O2 and CO2 dissociation curves
to the right, thus increasing the partial pressures of both gases (Rithalia, 1991; Rochat and
Mann, 1994), both of which serve to enhance the accuracy of the instrument. The link between
TCBG technology and skin perfusion can be used to advantage in certain situations, such as skin
graft assessment and diabetic limb ischemia (Raposio and Santi, 1998; Peirce et al., 2000;
Petrakis and Sciacca, 2000). On the other hand, skin perfusion can also be a problem in patients
with low blood pressure due to cardiac failure, severe dehydration, or hypovolemia. In these
situations, TCBG technology should be used with caution. Additionally, many commonly used
pharmacologic agents may alter blood pressure, cardiac output, or skin perfusion (Cowan et al.,
1977; Martinez et al., 1997). While establishing methods for this experiment, atropine sulfate
(Atropine SA, Butler®, Columbus, OH) and glycopyrrolate (Robinul-V®, Fort Dodge®, Fort
Dodge, IO) were used to control mucous secretions that might adversely affect respiration.
However, reduction in PtcO2 was occasionally observed following their use. Further evaluation
of the literature revealed that anticholinergics may alter skin vasodilation in rate and magnitude

73
in response to heat (Kellogg et al., 1995); and cutaneous blood flow in response to noxious
stimuli (Low and Westerman, 1989). Therefore the use of anticholinergics was discontinued.
Other drugs such as halothane and nitrous oxide, commonly used in anesthesia, are both reduced
at the polarographic O2 electrode of the TCBG probe and falsely elevate PtcO2 values (Rochat
and Mann, 1994). We did not find reported direct effects of isoflurane on the polarographic O2
electrode. However, isoflurane is a respiratory depressant and will lower blood pressure at
increased values, as reported by the manufacturer (IsoFlo®, Abbott Lab.; Chicago, Ill.). The
potential effects of any pharmacologic agent on skin perfusion should be investigated prior use
when TCBG analysis will be implemented and the appropriate controls should be in place.
Experiment 3 was conducted to evaluate the thermal burn potential of the heated probe.
To our knowledge, data on thermal burn potential in relationship to TCBG probe temperature
and contact time in the rat have not been published; however, it has been reported in humans
(Rithalia, 1991; Huch, 1995b). We have documented that 42°C and 42.5°C probe temperatures
can be successfully used for three hours in juvenile and adult rats, respectively, without damage
to the skin. These findings are important for future research applications, wherein daily TCBG
analysis will be performed. Others have reported thermal burns in adult rats using a 44°C probe
temperature (Furset et al., 1987). The authors attributed the burns to hypovolemia due to
multiple blood sampling, but did not report the probe contact time.
In experiment 4 we examined correlations between TCBG and SBGA, while evaluating
different probe temperatures and carrier gas mixtures. In adult rats, PtcO2 and PaO2 correlated
poorly, and this is in agreement with another report (Yamamoto and Kida, 1996). PtcO2 and PaO2
also correlated poorly in juvenile rats at all probe temperatures. Table 2.2 and 2.3 reveal the

74
wide range and SEM of PtcO2, compared to PaO2 values. It is unclear why the mean PtcO2 values
in juvenile animals are so low. Although the PaO2 values are also low in juvenile animals, the
difference is greater between juvenile PaO2 and PtcO2 values than those in the adult. It is possible
that skin perfusion is still undergoing some degree of development. This should be investigated
in future studies.
In general, PtcCO2 and PaCO2 correlation was much better than PtcO2 and PaO2, regardless
of probe temperature. In adult rats the correlation improved as probe temperature increased. At
43°C, our correlation of 0.873 was lower than in another study, in which a correlation
coefficient of 0.93 at 43°C was reported (Furset et al., 1987). It should be pointed out their
animals were ventilated and were subjected to only one inspired gas concentration per day,
which would serve to decrease variability and increase correlation. We chose spontaneous
ventilation and at least three different gas mixtures in anticipation of future studies with drugs
that may alter ventilatory drive in the rat.
This study is believed to be the first to report and validate TCBG use in juvenile rats. In
juvenile animals, PtcCO2 to PaCO2 correlation was almost identical at 42 and 44°C; however, it
was lower at 43°C. The reason for the decrease in correlation at 43°C is unclear. Since
correlation was still very good at 42°C, it was chosen over 44°C to eliminate the possibility of
thermal burns in future studies.
In experiment 5, we tested the sensitivity of the TCBG unit to reflect PaO2 and PaCO2
changes by incrementally lowering inspired CO2 concentrations in a spontaneously ventilated
rat. Figure 2.5 depicts the differences between PaCO2 and PtcCO2 at variable FICO2 values in
juvenile rats. Again, PtcO2 and PaO2 correlations were extremely poor for both adults and

75
Figure 2.5: Comparison of mean PaCO2 and PtcCO2 (mm Hg) at various FICO2 values, inanesthetized 10 day old Sprague-Dawley rats. Data represents simultaneously collected SBGAsamples and TCBG data for each animal (24 male and 26 female). Lines represent the means(±SEM) for PaCO2 and PtcCO2.
juveniles. In adult rats PtcCO2 and PaCO2 correlation fell from that seen in experiment 4, with
correlation varying between inspired gas concentrations. The fluctuation was more pronounced
in juvenile rats. This was unexpected and stimulated further review of the data. In adults and
juveniles, we found differences in anesthesia time and probe contact time from experiment 4 to
experiment 5, in which each parameter decreased. Furthermore, there was a downward trend for
anesthesia time in juvenile animals within experiment 5 between groups, as CO2 concentration
decreased (data not shown). Apparently, as our technique improved over time, catheterization as
well as instrumentation became faster, and the juvenile animals did not have as much time to
stabilize before the first sample was taken. Previous rodent studies did not mention an anesthetic
stabilization period; however, TCBG instrument stabilization was accounted for (Furset et al.,
1987; Yamamoto and Kida, 1996). In future studies, an anesthetic stabilization period should be

76
incorporated before application of the probe, especially when using the TCBG unit on
spontaneously breathing animals, and probe positions kept constant.
An additional question was raised at the close of the experiment concerning the poor
correlation of PaO2 and PtcO2. Specifically, must mean PaO2 or PaCO2 levels differ by treatment
for their transcutaneous counterparts to correlate reasonably well? The answer appears to be no
for PaCO2, and possibly for PaO2. Tables 2.4 and 2.5 present means, SEM, and ranges for the
variables in question. We see, in Table 2.4 statistical differences between PaO2 means for some
of the treatments even though the actual changes in inspired O2 were small. In this instance,
correlation was poor with PtcO2. On the other hand, similar differences were seen in PaCO2
means between treatments, yet correlation with PtcCO2 was much higher. Table 2.5 reinforces
this argument using juvenile animals. Only treatment A yielded a statistically different mean
PaCO2, yet correlation with PtcCO2 was better than that for PaO2 and PtcO2. Tables 2.2 and 2.3
present similar data for experiment 4. Only in Table 2.2 at a probe temperature of 44°C was
correlation modest for PaO2 and PtcO2 in adult animals. In this instance, not only were there
differences between treatment means, but they were rather large. PaCO2 means for adults (Table
2.2) were different for treatment 3 as expected. However for juveniles, means were not different
(Table 2.3). Yet in each instance, correlation was better for PaCO2 and PtcCO2.
In conclusion, we can say that PtcCO2 correlates much better with its arterial counterpart
and appears to be considerably more sensitive than PtcO2 in rats. Further use of TCBG as a tool
to evaluate small changes in PaO2 in the rat appears unwarranted. However, it may be of use for
other research, such as skin graft assessment (Rochat et al., 1993; Frick et al., 1999) or perfusion
77
after detorsion of an organ (Kram et al., 1989), where alterations in blood flow cause large
differences in O2 delivered to the tissue.
Use of TCBG analysis is warranted in rats under controlled conditions. The correlation
between PtcCO2 and PaCO2 is not sufficiently strong for use as a clinical tool for individual
animals. However, this technology is capable of trend monitoring, which enables the
investigator to gather information that would otherwise be unobtainable in situations where
blood volume would limit or exclude the use of conventional methods. Additionally, the
technology is non-invasive, which allows daily data collection. This attribute opens up the
possibility of repeated measures analysis, thus minimizing animal numbers needed for
experimentation.
Bibliography
Barker S, Hyatt J, Clarke C, Tremper K. 1991. Hyperventilation reduces transcutaneous oxygentension and skin blood flow. Anesthesiology 75:619-624.
Bergmans M, Stevens G, Keunen H, Hasaart T. 1997. Transcutaneous and arterial carbondioxide tension at various conditions of fetal stress in lambs. Gynecologic and ObstetricInvestigation 43:1-5.
Braems G, Lang U, Kunzel W. 1996. Skin blood flow influences the transcutaneous PCO2 (tcPO2) during stress in the guinea pig. Journal of Perinatal Medicine 24:155-161.
Brothers TE, Wakefield TW, Jacobs LA, Lindenauer SM. 1993. Effects of lumbarsympathectomy on canine transcutaneous oxygen tension. Surgery 113:433-437.
Brudin L, Berg S, Ekberg P, Castenfors J. 1994. Is transcutaneous PO2 monitoring duringexercise a reliable alternative to arterial PO2 measurements? Clinical Physiology 14:47-52.
Carleton JN, Donoghue AM, Porter WK. 1998. Mechanical model testing of rebreathingpotential in infant bedding materials. Archives of Disease in Childhood 78:323-328.

78
Carter R, Banham SW. 2000. Use of transcutaneous oxygen and carbon dioxide tensions forassessing indices of gas exchange during exercise testing. Respiratory Medicine 94:350-355.
Cowan A, Doxey JC, Harry EJ. 1977. The animal pharmacology of buprenorphine, an oripavineanalgesic agent. British Journal of Pharmacology 60:547-554.
Fall O, Johnson M, Nilsson BA, Rooth G. 1979. Continuous transcutaneous oxygen tensionmeasurements in experiments with juvenile rhesus monkeys and pregnant ewes. BirthDefects: Original Article Series 15:629-632.
Falstie-Jensen N, Spaun E, Brochner-Mortensen J, Falstie-Jensen S. 1988. The influence ofepidermal thickness on transcutaneous oxygen pressure measurements in normalpersons. Scandinavian Journal of Clinical Laboratory Investigation 48:519-523.
Frick A, Baumeister RGH, Menger MD, Vollmar B, Wohllaib U, Wiebecke B. 1999. Secondaryischaemia in experimental free flaps - treatment by long acting prostacyclin analogues.British Journal of Plastic Surgery 52:392-398.
Furset K, Aanderud L, Segadal K, Tyssebotn I. 1987. Transcutaneous measurement of pCO2 athigh ambient pressure (41 bar). Undersea Biomedical Research 14:51-62.
Gottrup F, Gellet S, Kirkegaard L, Hansen ES, Johannsen G. 1988. Continuous monitoring oftissue oxygen tension during hyperoxia and hypoxia: Relation of subcutaneous,transcutaneous, and conjunctival oxygen tension to hemodynamic variables. CriticalCare Medicine 16:1229-1234.
Huch A. 1995a. Transcutaneous blood gas monitoring. Acta Anaesthesiologica Scandinavica.Supplementum 39:87-90.
Huch R. 1995b. Review: perinatal monitoring. Acta Anaesthesiologica Scandinavica.Supplementum 39:91-94.
Huch R, Huch A, Lubbers DW. 1973. Transcutaneous measurement of blood Po2 (tcPo2) --Method and application in perinatal medicine. Journal of Perinatal Medicine 1:183-191.
Kamler M, Lehr HA, Barker JH, Saetzler RK, Galla TJ, Messmer K. 1993. Impact of ischemiaon tissue oxygenation and wound healing: intravital microscopic studies on the hairlessmouse ear model. European Surgical Research 25:30-37.
Kellogg DL, Pergola PE, Piest KL, Kosiba WA, Crandall CG, Grossman M, Johnson JM. 1995.Cutaneous active vasodilation in humans is mediated by cholinergic nervecotransmission. Circulation Research 77:1222-1228.

79
Kram HB, Miyamoto E, Rajfer J, Appel PL, Shoemaker WC. 1989. Testicular oximetry: a newmethod for the assessment of tissue perfusion and viability following torsion anddetorsion. Journal of Pediatric Surgery 24:1297-1302.
Leasa DJ. 1992. Noninvasive blood gas monitoring: a review for use in the adult critical careunit. Canadian Medical Association Journal 146:703-712.
Low A, Westerman RA. 1989. Neurogenic vasodilation in the rat hairy skin measured using alaser doppler flowmeter. Life Sciences 45:49-57.
Mann FA, Wagner-Mann CC, Branson KR. 1998. Transcutaneous oxygen and carbon dioxidemonitoring in normal cats. The Journal of Veterinary Emergency and Critical Care 7:99-109.
Martinez EA, Hartsfield SM, Melendez LD, Matthews NS, Slater MR. 1997. Cardiovasculareffects of buprenorphine in anesthetized dogs. American Journal of Veterinary Research58:1280-1284.
Mueller-Heubach E, Battelli AF. 1982. Variable heart rate decelerations and transcutaneous PO2during umbilical cord occlusion in fetal monkeys. American Journal of Obstetrics andGynecology 144:796-802.
Ovadia Z, Kornowski R, Gavish B, Chayen D, Walden R, Varda-Bloom H, Battler A, Eldar M.1995. Noninvasive evaluation of microcirculatory hemodynamic changes duringhemorrhage followed by saline or blood transfusion. Shock 4:96-101.
Peirce SM, Skalak TC, Rodeheaver GT. 2000. Ischemia-reperfusion injury in chronic pressureulcer formation: A skin model in the rat. Wound Repair and Regeneration 8:68-76.
Petrakis IE, Sciacca V. 2000. Spinal cord stimulation in diabetic lower limb critical ischaemia:transcutaneous oxygen measurement as predictor for treatment success. EuropeanJournal of Vascular and Endovascular Surgery 19:587-592.
Raposio E, Santi PL. 1998. Pharmacological enhancement of cutaneous flap survival withtopical dimethyl sulphoxide and hydrogen peroxide. British Journal of Plastic Surgery51:551-554.
Rithalia SVS. 1991. Developments in transcutaneous blood gas monitoring: a review. Journal ofMedical Engineering & Technology 15:143-153.
Rochat MC, Mann FA. 1994. Transcutaneous blood gas monitoring. Compendium onContinuing Education for the Practicing Veterinarians 16:1181-1186.

80
Rochat MC, Pope ER, Payne JT, Pace LW, Wagner-Mann CC. 1993. Transcutaneous oxygenmonitoring for predicting skin viability in dogs. American Journal of VeterinaryResearch 54:468-475.
Sundin BM, Hussein MA, Glasofer S, El-Falaky MH, Abdel-Aleem SM, Sachse RE, KlitzmanB. 2000. The role of allopurinol and deferoxamine in preventing pressure ulcers in pigs.Plastic and Reconstructive Surgery 105:1408-1421.
Szaflarski NL. 1996. Emerging technology in critical care: Continuous intra-arterial blood gasmonitoring. American Journal of Critical Care 5:55-65.
Takiwaki H. 1994. Transcutaneous PO2 and PCO2 measurement in dermatology. Acta Dermato-Venereologica Supplementum 185:21-25.
Tobias JD, Wilson WR, Meyer DJ. 1999. Transcutaneous monitoring of carbon dioxide tensionafter cardiothoracic surgery in infants and children. Anesthesia and Analgesia 88:531-534.
Wagner AE, Bednarski RM, Muir WW, 3rd. 1990. Hemodynamic effects of carbon dioxideduring intermittent positive- pressure ventilation in horses. American Journal ofVeterinary Research 51:1922-1929.
Warren R, Webb A, Kosch P, Coons L. 1984. Evaluation of transcutaneous oxygen monitoringin anaesthetised pony foals. Equine Veterinary Journal 16:359-361.
Wayneforth HB, Flecknell PA. 1992. Chronic catheterization of blood vessels. In: Experimentaland surgical technique in the rat, 2nd ed. San Diego: Academic Press, Inc. p 212-234.
Wilhelm JA, Veng-Pedersen P, Zakszewski TB, Osifchin E, Waters SJ. 1995. Duration ofopioid antagonism by nalmefene and naloxone in the dog. A nonparametricpharmacodynamic comparison based on generalized cross- validated spline estimation.International Journal of Clinical Pharmacology and Therapeutics 33:540-545.
Yamamoto T, Kida I. 1996. Application of transcutaneous blood carbon dioxide monitoring tothe magnetic resonance imaging of rat. Journal of Medical Engineering & Technology20:164-168.

81
Chapter 3
Ontogeny of Cardiorespiratory Responses in Anesthetized JuvenileRats Breathing Elevated Levels of CO2

82
Introduction
Despite the dramatic reduction in Sudden Infant Death Syndrome (SIDS) in recent years,
the syndrome remains one of the leading causes of postnatal mortality in children (Mathews et
al., 2000; Kinney et al., 2001). The decline in incidence is primarily attributed to a national
campaign promoting the supine sleeping position for infants (Kinney et al., 2001; Kum-Nji et al.,
2001). While hypotheses about the pathogenesis of SIDS are broad, the focus narrows when
examining putative relationships between prone sleeping and SIDS. These include the effects of
toxic gases from bedding material (Richardson, 1994), hyperthermia (Mitchell, 1997), bacterial
toxins (Molony et al., 1999), and re-breathing of CO2 (Kemp, 1996). Re-breathing of CO2 and its
relation to SIDS provided the impetus for the experiment reported here.
Three observations support a link between re-breathing of CO2 and SIDS. First, infants
may have a blunted respiratory and/or arousal response to elevated inspired levels of CO2
encountered during prone sleep (Folgering and Boon, 1986; Katz-Salamon and Milerad, 1998;
Kinney et al., 2001). Second, inspired CO2 levels may rise to 8-10%. These levels may be high
enough to depress the respiratory drive, leading to hypercarbia and hypoxia (Bach and Mitchell,
1998; Katz-Salamon and Milerad, 1998). Third, inspired CO2 levels may rise high enough to
cause direct asphyxiation (Kemp and Thach, 1993; Carleton et al., 1998). One or all of these
phenomena may be involved in the pathogenesis of SIDS.
As part of ongoing efforts to develop the juvenile rat as a model of SIDS, we chose to
further characterize the affects of hypercarbia on the respiration of the juvenile rat. Saetta and
Mortola (Saetta and Mortola, 1985) reported that 2-4 day old rats responded to short duration
hypercapnia (5 or 10% CO2) by increasing minute ventilation ( JVE) and tidal volume (VT).
Juvenile rats chronically exposed to 7.0 % CO2 from post natal (PN) day one to PN day seven
83
sustained increased JVE for the duration of the study (Rezzonico and Mortola, 1989). It has been
reported by others that elevated inspired levels of CO2 depressed JVE in one day old rats but
increased JVE in pups two to 12 days of age (Coates and Silvis, 1999).
We chose to investigate rats 9-14 days of age. SIDS typically occurs between one and six
months of age, with a peak around the third to fourth month of life (Gibson, 1992). The rat brain
growth spurt starts at birth and ends around 28 days of age (Dobbing and Sands, 1973). The most
rapid period of brain growth in humans occurs during the third trimester, and correlates with the
first 10 days of life in the rat (Phillips et al., 1991; Lancaster, 1994). Additionally, locomotor
development in the rat begins around PN day 10 and reaches adult levels by PN day 15 (Ba and
Seri, 1995). Therefore, rats of PN age 9-14 days should be developmentally equivalent to human
infants 1-6 months of age. To further characterize the rat in this narrow window we chose to
measure elements of respiratory mechanics, heart rate, and transcutaneous blood gas
measurements in response to varying levels of inspired CO2. We wanted to more fully elucidate
the response to inspired CO2 during this stage of development, and to expose potential age
differences that would develop this model for future use in SIDS research.
Materials and Methods
Animals
Timed pregnant Sprague- Dawley rats (Harlan, Indianapolis, USA) were purchased and
housed in the vivarium of the School of Veterinary Medicine at Louisiana State University. The
facility is operated by the Division of Laboratory Animal Medicine and is accredited by the
Association for Assessment and Accreditation of Laboratory Animal Care, International. The
study reported here was approved by the Louisiana State University Institutional Animal Care
and Use Committee.

84
Animals were serologically determined to be free of the following organisms: Sendai
virus, sialodacryoadenitis virus, Kilham’s rat virus, H-1 virus, rat parvovirus, pneumonia virus of
mice, reovirus 3, Hantaan virus, transmissible murine encephalomyelitis virus, adenovirus, and
lymphocytic choriomeningitis virus. Other serologically excluded agents included Mycoplasma
pulmonis, Clostridium piliforme, and Encephalitozoon cuniculi. Polymerase chain reaction assay
revealed no evidence of cilia-associated respiratory (CAR) bacillus or Helicobacter bilis. No
endo or ectoparasites were found, nor were any respiratory or enteric bacterial pathogens
cultured. Rats were housed in polycarbonate cages on corn cob bedding, (Bed-O’Cobs, The
Andersons, Maumee, OH) with a 12 : 12 light cycle. Room temperature was maintained between
68 and 72°F, and humidity between 40 and 60%. Feed (Lab Diet® 5001, PMI® International, Inc.,
Brentwood, MO) and water (via water bottles) were provided ad libitum. After pups were born
they were maintained with the dam for the duration of the study, except during testing.
To standardize neurologic developmental time, post embryonic (PE) day rather than PN
day was used to determine age, since gestation can vary from 21 to 23 days in the rat (Kohn and
Barthold, 1984). Post embryonic day zero was the day vaginal plugs were found in the dams.
Within a litter, pups were tested in multiples of six. Five of the six received one of five
randomly assigned treatments. The sixth animal was maintained as a control. Any remaining
pups within a litter were maintained with the dam and were treated as additional controls. A total
of 140 juvenile rats were used in this study (88 treatment, 52 controls). Pups were tested on
either PE days 30, 32, and 34 or days 31, 33, and 35. All pups were weighed daily from PE days
30 through 35.
85
Experimental Procedures
On the first day of testing, all littermates were individually anesthetized with 2.5 %
isoflurane (IsoFlo®, Abbott Lab.; Chicago, Ill.) in room air flowing at 0.7 liters/min. Each pup
was tattooed on the footpads for identification, weighed, and then returned to the dam.
Thereafter, each pup was anesthetized as previously described. With the pup’s head in a nose
cone, laying in dorsal recumbency on a heating pad, the pup was instrumented as follows. After
placement of electrode gel (Spectra 360, Parker Lab., Fairfield, NJ.) three electrodes (alligator
clamps) were attached to the skin, one on the right side just cranial to the scapula, a second on
the left side of the thorax caudal to the elbow, and the third on the tail approximately two cm
from the base. A lubricated temperature probe (Mon-a therm® Myocardial, Mallinckrodt
Medical Inc., St. Louis, MO) was inserted approximately 18 mm into the rectum. The electrode
and temperature probe leads were attached to a vital signs monitor (Escort Prism™, MDE Inc.,
Arletta, CA) which recorded electrocardiogram (ECG, lead 3); respiratory waves via impedance
pneumography (right and left leads), and temperature on a 15 second strip with the sweep speed
set at 25mm/second.
Transcutaneous instrumentation was applied as previously described (Stout et al., 2001).
Transcutaneous values were expressed as the transcutaneous partial pressure of CO2 (PtcCO2) and
transcutaneous partial pressure of O2 (PtcO2). Correlation of PtcO2 with arterial pressure of O2 is
poor in rats and will not be reported in this study (Yamamoto and Kida, 1996; Stout et al., 2001).
Following instrumentation, isoflurane levels were lowered to 1.75% for the duration of the test
period.
Using room air as the balance gas, one of five treatments (Trt) were applied (Trt 1=
10.00% CO2 , Trt 2= 5.00% CO2 , Trt 3= 2.50% CO2, Trt 4= 1.25% CO2, Trt 5= 0.00% CO2=

86
room air). Each treatment mixture served as the carrier gas for delivery of 1.75% isoflurane at
0.7 liters/minute throughout. Treatments randomly assigned for each pup on the first day of
testing were retained during subsequent test periods. Pups were humanely euthanatized for tissue
collection by intraperitoneal overdose of pentobarbital Na+ (Buthanasia-D, Schering-Plough
Animal Health Corp., Union, NJ) the day after their last treatment.
Testing was conducted for a period of 100 minutes. The initial 40 minutes allowed for
body temperature and transcutaneous equilibration as well as minor lead adjustments to obtain
optimal tracings from the vital signs monitor. Starting at -40 minutes and every five minutes
thereafter, heart rate, respiratory waves, and temperature were recorded with the vital signs
monitor. Heat supplied by a heating pad and lamp were adjusted prior to transcutaneous probe
application to achieve a core body temperature of 37°C by time 0. At -30 minutes the calibrated
transcutaneous probe was applied to the animal and transcutaneous data were recorded every 5
minutes thereafter. No further adjustments were made to the leads or heat source after time 0.
After recording baseline data at time 0, a treatment was applied for 40 minutes. After data were
recorded at 40 minutes, the pup was switched to the pretreatment gas mixture for an additional
20 minute washout period, followed by discontinuation of anesthesia and recovery with the dam.
Data Processing
Heart rate (HR, beats per minute), respiratory rate (RR, breaths per minute), and
temperature were determined from the 15 second strip printed by the vital signs monitor.
Transcutaneous partial pressure of CO2 values were recorded from the display of the
transcutaneous monitor. Pups not completing their three day test period were excluded from
data analysis. Exclusion was based on either movement of a lead necessitated by signal loss or,
respiratory mucous secretions that interfered with normal breathing. Airway obstruction was

87
usually detected first as irregular breathing movements by the pup or irregular respiratory wave
display on the vital signs monitor. Airway obstruction was confirmed audibly.
The vital signs data strips (3-4 per image file) were scanned on a Hewlett-Packard
ScanJet 6100C (Hewlett-Packard, Palo Alto, CA) using the manufacturer’s software (HP Desk
Scan II, vs 2.9) set at 75 dpi resolution and saved as JPEG files. Due to scanner limitations only
the first nine seconds of strip data were available for digitizing. Only strips from time 0 to time
60 were scanned. Digitizing software (UN-SCAN-IT™, vs. 5.1, Silk Scientific, Orem, UT)
converted the scanned respiratory waves to x and y coordinates, according to the manufacturer’s
instructions. The resultant x and y coordinates were imported (Igor Pro 4, WaveMetrics, Inc.,
Lake Oswego, OR) and analyzed for wave amplitude, area under the curve, and peak position. If
a “sigh” respiratory wave (a physiologically normal deep breath which opens closed alveoli) was
present in the data strip, analysis was modified to retain respiratory data from the side of the strip
containing the greatest number of normal respiratory waves while excluding the sigh. Although a
sigh is normal, it adds unwanted variability, primarily affecting amplitude and area calculations.
If respiratory waves exhibited negative polarity instead of the standard positive polarity , the “y”
component of the data was inverted. The peak parameters were then imported into Excel
(Microsoft ® Excel 2000, Microsoft Corporation, Redmond, WA) where peak-to-peak interval
was calculated. Finally, peak amplitude as well as peak-to-peak interval mean and standard
deviations were calculated for each time point (0-60)(Systat vs 10.2, Systat Software Inc.,
Richmond, CA).
Statistical Analysis
All data were analyzed by split plot design utilizing the General Linear Model (GLM)
(Systat®, vs 10.2). With GLM procedures utilizing split plot designs, hypothesis testing must be

88
performed after initial ANOVA using the correct error terms and degrees of freedom. When
significance was found, differences were further evaluated with Bonferroni’s post hoc test and
was applied when six or fewer means were examined, while Tukey’s post hoc test was applied
where greater than six means were examined.
For the dependent variable, body weight, between plot effects were analyzed for the
effect of treatment (Trt), and within plot effects were analyzed for the effect of PE Day. All
treatment animals as well as controls were used in the analysis. Utilizing only treated animals,
the dependent variables PtcCO2, HR, RR and amplitude of the respiratory wave (AMP) were
transformed and expressed as percentage of time zero (PZPtcCO2, PZHR, PZRR, and PZAMP
respectively). Since each pup was tested only three of six possible days, the within plot variable
PE Day could not be directly utilized. The study design called for an additional between plot
variable termed day group (DayGrp 1 = tested on PE days 30, 32, and 34; DayGrp 2 = tested on
PE days 31, 33, and 35). The design also called for an additional within plot variable termed
paired post embryonic (PPE) day (PPE 1 = PE days 30 and 31; PPE 2 = PE days 32 and 33; PPE
3 = PE days 34 and 35) which categorized the three test days for each pup, regardless of which
day group they belonged in. The interaction of the between plot variable DayGrp and the within
plot variable PPE day is statistically equivalent to PE day. Thus, utilizing interactions of the
between plot variables Trt and DayGrp, and the within plot variable PPE, we were able to
examine the effects of Trt on the dependent variables over time. All 13 time points (0-60) were
initially utilized in the model.
To determine whether treatment had affected our model and may have masked subtle
interactions of interest, we re-analyzed the data by restricted groups of time points (0-40 or 40-
60) within each treatment for the dependent variables PZPtcCO2, PZHR, PZRR, and PZAMP.

89
Additional analysis of the dependent variables PZPtcCO2 and PZHR included calculation of the
slope from time 0 through 40 and from time 40 through 60, for individual animals. Using the
GLM with a split plot design, the within plot effect of PPE day as well as mixed effect of
DayGrp x PPE day were examined within each treatment. All data are reported as means ± SE
unless otherwise indicated. P values # 0.05 were considered significant.
Results
Manipulation of the pups during the test period was well tolerated by the dams. Pups
exhibited no apparent ill effects from the procedures and continued to nurse normally after
recovery from anesthesia. A total of 4923, 15 second, data strips were recorded during the
experiment. Of these, 3043 included data from time points 0-60. After exclusion due to signal
loss or respiratory obstruction, 2106 data strips were retained. These represented data for 54
animals (26 males, 28 females; Trt 1, n = 11; Trt 2, n = 10; Trt 3, n = 11; Trt 4, n = 11; Trt 5, n =
11) from 11 dams. Daily body weights from 55 (26 female, 29 male) non-treatment controls
from the same dams were included only for weight gain analysis. Testing began 8.82 ± 0.07 days
after birth for animals tested on PE days 30, 32, and 34 (DayGrp 1). For animals tested on PE
days 31, 33, and 35 (DayGrp 2), testing began 9.92 ± 0.05 days after birth. From initiation of
anesthesia to the first recording required 15.65 ± 1.12 minutes. Fifty-one data strips (2.45% of
cases) contained waves with reversed polarity which had to be inverted for analysis. Seventy-
eight data strips (3.70%) contained a wave recognized as a sigh, requiring exclusion of the sigh
as well as all adjacent respiratory waves.
Body Weight
Weight gains by PE day are illustrated in Figure 3.1. No differences could be detected
between groups in weight gain over the six day test period. For all groups, weight gain was

90
significant between days. On PE day 30, mean body weight was 18.56 ± 0.19gm. Thereafter,
pups gained 1.75 ± 0.03 gm day.
Transcutaneous Partial Pressure of CO2 (PZPtcCO2)
Within a PE day, Trt had significant effects on PZPtcCO2 (Fig 3.2). Treatment 1
consistently elevated PZPtcCO2 levels when compared to other treatments. Treatment 2 appeared
to elevate PZPtcCO2 above Trts 3, 4, and 5, yet only from PE day 34 onward was the elevation
consistently significant. While PZPtcCO2 appeared to increase daily, especially for Trt 1,
differences were not detected within any treatment from PE day to PE day. The effect of
individual treatments on PZPtcCO2 by PPE days are illustrated in Fig 3.3. A vertical dotted line
separates data analysis into two components (0-40 and 40-60 min). For Trt 1, the increase in
PZPtcCO2 was lower on PPE days 30 and 31 than for other PPE days. Likewise, under Trt 2
conditions, PZPtcCO2 for PPE days 30 and 31 was lower than PPE days 34 and 35, but only
during the first 40 minutes of testing. A scatter plot with regression lines for PZPtcCO2 by PPE
days, within each treatment, is shown in Fig 3.4. Differences between PPE day slopes yielded
similar but not identical results as those represented in Fig 3.3. Slopes were more shallow before
and after time point 40, for PPE days 30 and 31 compared to other PPE days under Trt 2
conditions. Otherwise, differences detected between PPE days are identical between the two
methods of analysis. To further appreciate the rate of change in PZPtcCO2 slope data were re-
expressed as follows. Where differences in PZPtcCO2 slopes by PPE day were found (Fig 3.4),
the slope for PPE days 30 and 31 was expressed as a percentage of the combined mean slope of
the other PPE days (32 and 33; 34 and 35). When challenged with Trt 1 (time points 0-40),
PZPtcCO2 rose 33.14 % slower during PPE days 30 and 31 compared with older test ages. After
Trt 1 was discontinued (time points 40-60), PZPtcCO2 fell 50.98% slower during PPEdays 30 and

91
Figure 3.1- Comparison of weight gain between treatments over post embryonic days 30 - 35.Rat pups were weighed daily prior to testing. Control pups included all non-treated litter mates (n= 55). Treatments (10.0 % CO2, n = 11; 5.0 % CO2, n = 10; 2.5 % CO2, n = 11; 1.25% CO2, n =11; room air, n = 11) were delivered under anesthesia (isoflurane, 1.75%) using room air as thecarrier gas. No differences in body weight were demonstrated between treatments or controls (P>0.05). Values are means ± SE.
31 than at older ages tested. Challenge with Trt 2 resulted in PZPtcCO2 rising 30.42% slower
during treatment and falling 60.13% slower after discontinuation of treatment during PPE days
30 and 31 compared with older ages tested. No differences in slopes were detected for other
treatments.
Heart Rate (PZHR)
On PE day 34, treatment was a significant variable for PZHR. However, post hoc testing
detected no differences between PZHR means by treatment (Fig 3.5). No differences were
detected between PZHR means by treatment group for the other PE days. When PZHR data were
examined by PE day within a treatment the following was found. Examining time points 40-60
under treatment 4 conditions, mean PZHR on PE day 30 (1.07± 0.02) was significantly higher
than for PE days 31 (0.97± 0.01), 32 (0.95± 0.01) and 34 (0.95± 0.01). Under treatment 5
conditions at time points 40-60, the mean PZHR for PE day 30 (1.06± 0.02) was significantly
higher than for PE days 31 (0.94± 0.01), 32 (0.96± 0.01), and 33 (0.97± 0.003). No differences

92
Figure 3.2- Comparison of PZPtcCO2 by treatment, within each post embryonic (PE) day.Treatments (1 = 10.0 % CO2, n = 11; 2 = 5.0 % CO2, n = 10; 3 = 2.50% CO2, n = 11; 4 = 1.25%CO2, n = 11; 5 = room air, n = 11) were delivered under anesthesia (isoflurane, 1.75%) usingroom air as the carrier gas. Individual rat pups were tested every other day (PE days 30, 32, 34, n= 28 or PE days 31, 33, 35, n = 26). No differences were demonstrated between treatments withletters in common (P >0.05). Values are means ± SE.
were demonstrated for the other treatments or for time points 0-40 with any treatment data was
compared by PE day. Differences in PZHR by PPE days within each treatment are depicted in
Fig 3.6. Differences in PZHR were detected for treatments 2, 3, and 4. Paired post embryonic

93
Figure 3.3- Comparison of PZPtcCO2 by paired post embryonic (PPE) days, within eachtreatment. Treatments were delivered under anesthesia (isoflurane, 1.75%) using room air as thecarrier gas. Individual rat pups were tested every other day (PE days 30, 32, 34 or PE days 31,33, 35). Analysis and results of time points 0-40 and 40-60 are presented separately, indicatedby the vertical dotted lines. No differences were demonstrated between treatments with letters incommon (0- 40 min) or numbers in common (40-60 min) (P >0.05). Values are means ± SE.
days 30 and 31 reveal significantly less depression of the heart rate compared to the other PPE
days during the first 40 minutes of testing with treatments 2 and 3. During time points 40-60, HR
was significantly higher on PPE days 30 and 31 than on the other PPE days for Trt 3, with mixed

94
Figure 3.4- Scatter plots comparing slopes of regression lines of PZPtcCO2 by paired postembryonic (PPE) days, within each treatment. Treatments were delivered under anesthesia(isoflurane, 1.75%) using room air as the carrier gas. Individual rat pups were tested every otherday (PE days 30, 32, 34 or PE days 31, 33, 35). Analysis and results of time points 0-40 and 40-60 are presented separately, indicated by the vertical dotted lines. No differences weredemonstrated between treatments with letters in common (0- 40 min) or numbers in common(40-60 min)(P >0.05). Values are means ± SE.
results for Trts 2 and 4. Additionally, HR on PPE days 30 and 31 appeared to climb above
baseline (time 0) after time 40 (Trts 1- 4), yet differences were only detected for Trt 3. No
differences in PZHR were detected between PPE days for groups receiving Trts 1 or 5.

95
Regression lines of PZHR grouped by PPE days within treatment are plotted in Figure 3.7. As
with PZPtcCO2, slope analysis produced similar but not identical results as those illustrated in
Figure 3.6. Under Trt 2 conditions, no differences were detected in PZHR between PPE days for
time points 0-40 or 40-60 (Fig 3.7). This is similar to the data presented in Figure 3.6. In
contrast, under Trt 4 conditions, the slope of PZHR on PPE days 30 and 31 was significantly
steeper than on the other PPE days (time points 40- 60). These results differ from those
illustrated in Figure 3.6. Otherwise, results were the same between the two methods of analysis.
PZHR slopes for PPE days 30 and 31 were expressed as percentages of the combined mean
PZHR slopes of the other PPE days (32 and 33; 34 and 35). Challenge with Trt 3 caused PZHR
to fall 68.24% faster at older test ages, compared to values recorded at PPE days 30 and 31.
After discontinuation of Trt 3 (time points 40-60), PZHR rose 60.36% faster during PPE days 30
and 31 than at older ages tested. Additionally, after discontinuation of Trt 4 (time points 40-60),
PZHR rose 87.88 % faster during PPE days 30 and 31 than at older ages tested.
Respiratory Rate (PZRR)
Results for PZRR by treatment within PE day are shown in Fig 3.8. As rats aged,
respiratory rate was further depressed by Trt 1, becoming consistently less than for all other
treatments by PE Day 34. PZRR on PE day 33 (0.81± 0.02) was lower during time points 0-40
than on PE day 35 with Trt 2 (1.06± 0.02). No other differences were detected for PZRR when
examining data by PE day within each treatment. Comparison of PZRR by PPE days within each
treatment are shown in Fig 3.9. Not only was PZRR on PPE days 30 and 31 significantly higher
than on the other paired days, but the respiratory rate remained static, while the rate fell for older
animals exposed to Trt 1. After time point 40, when Trt 1 was discontinued, all of the PPE day’s

96
Figure 3.5- Comparison of PZHR by treatment, within each post embryonic (PE) day.Treatments (1 = 10.0 % CO2, n = 11; 2 = 5.0 % CO2, n = 10; 3 = 2.50% CO2, n = 11; 4 = 1.25%CO2, n = 11; 5 = Room Air, n = 11)were delivered under anesthesia (isoflurane, 1.75%) usingroom air as the carrier gas. Individual rat pups were tested every other day (PE days 30, 32, 34, n= 28 or PE days 31, 33, 35, n = 26) No differences were demonstrated between treatments (P>0.05). Values are means ± SE.

97
Figure 3.6 - Comparison of PZHR by paired post embryonic (PPE) days, within each treatment.Treatments were delivered under anesthesia (isoflurane, 1.75%) using room air as the carriergas. Individual rat pups were tested every other day (PE days 30, 32, 34 or PE days 31, 33, 35).Analysis and results of time points 0-40 and 40-60 are presented separately, indicated by thevertical dotted lines. No differences could be demonstrated between treatments with letters incommon (0- 40 min) or numbers in common (40-60 min) (P >0.05). Values are means ± SE.

98
Figure 3.7 - Scatter plots comparing slopes of regression lines of PZHR by paired postembryonic (PPE) days, within each treatment. Treatments were delivered under anesthesia(isoflurane, 1.75%) using room air as the carrier gas. Individual rat pups were tested every otherday (PE days 30, 32, 34 or PE days 31, 33, 35). Analysis and results of time points 0-40 and 40-60 are presented separately, indicated by the vertical dotted lines. No differences weredemonstrated between treatments with letters in common (0- 40 min) or numbers in common(40-60 min) (P >0.05). Values are means ± SE.

99
respiratory rates moved back towards baseline. Significant differences between PZRR by PPE
day were also noted within the other treatments, however different relationships appeared. In
contrast to PZRR results from exposure to Trt 1, pups exposed on PPE days 34 and 35 exhibited
less depression of their respiratory rates than the younger animals, particularly past time point 40
when the CO2 was discontinued.
Respiratory Wave Amplitude (PZAMP)
The effect of Trt on PZAMP by PE day is shown in Fig 3.10. Differences in PZAMP by
treatment were not detected on PE Day 30. Additionally, amplitude did not increase above
baseline regardless of treatment. Large variation in PZAMP values complicated demonstration of
consistent differences in PZAMP results between Trt 1 and Trt 2, versus the other treatments.
When PZAMP was examined by PE day within treatment, no differences were detected. Results
for PZAMP by PPE days within each treatment are shown in Fig 3.11. During the first 40
minutes, under Trt 5 conditions, respiratory amplitude was higher for PPE days 30 and 31 (1.11±
0.03) when compared to PPE days 34 and 35 (0.92± 0.02). Differences in PZAMP could not be
demonstrated between the PPE days for any other treatment. From time 0 through time 40,
PZAMP was elevated above time 0 for all three PPE days in rat pups exposed to Trt 1 and Trt 3.
With Trt 2, PZAMP was elevated above time 0 during the first 40 minutes only on PPE day 34
and 35. Variance in PZAMP was apparently too great to detect differences for the youngest pairs
during time Points 0 through 40.
Discussion
We studied age related respiratory and cardiac responses to varying levels of inspired
CO2 in the juvenile rat. Characterization of these physiologic variables provides valuable

100
Figure 3.8 - Comparison of PZRR by treatment, within each post embryonic (PE) day.Treatments (1 = 10.0 % CO2, n = 11; 2 = 5.0 % CO2, n = 10; 3 = 2.50% CO2, n = 11; 4 = 1.25%CO2, n = 11; 5 = Room Air, n = 11), were delivered under anesthesia (isoflurane, 1.75%) usingroom air as the carrier gas. Individual rat pups were tested every other day (PE days 30, 32, 34, n= 28 or PE days 31, 33, 35, n = 26) No differences were demonstrated between treatments withletters in common (P >0.05). Values are means ± SE.
information concerning the ontogeny of response to CO2 challenge. Also, these findings
demonstrate the optimum age range of juvenile rats for use as a model of SIDS. Typically, SIDS

101
Figure 3.9 - Comparison of PZRR by paired post embryonic (PPE) days, within each treatment.Treatments were delivered under anesthesia (isoflurane, 1.75%) using room air as the carriergas. Individual rat pups were tested every other day (PE days 30, 32, 34 or PE days 31, 33, 35).Analysis and results of time points 0-40 and 40-60 are presented separately, indicated by thevertical dotted lines. No differences were demonstrated between treatments with letters incommon (0- 40 min) or numbers in common (40-60 min) (P >0.05). Values are means ± SE.between treatments with letters in common (P >0.05). Values are means ± SE.
cases occur within a relatively narrow period of human development. An appropriate model
should reflect this narrow developmental time frame. We tested a broad range of inspired CO2
concentrations with the goal that one or more of the gas mixtures would reveal age related
differences in respiratory and/or cardiac response. Additionally, CO2 concentrations tested were

102
within the physiologic range expected to be encountered by a human infant (Ryan, 1991;
Malcolm et al., 1994; Mosko et al., 1997; Carleton et al., 1998).
In humans, age and sex related ventilatory changes in response to hypercapnia or
asphyxia have been reported, with mixed results. Ventilatory responses to hypercapnia (5.0%
CO2) were greater in older children (4-17 years) than in adults (18-49 years). Also, the CO2
threshold for initiation of a protective ventilatory response was lower in females than for males
(Marcus et al., 1994). Anesthetized children less than six months of age showed no increase in
JVE when challenged with 3.71% CO2. In contrast, JVE increased 34.0% following the same
challenge in older children (Olsson and Lindahl, 1985). Ventilatory asphyxial sensitivity (VAS)
is expressed as the fraction of inspired CO2 over JVE with higher values indicating a decreased
ventilatory response to inspired CO2 (Campbell et al., 1998). Ventilatory asphyxial sensitivity
was significantly higher in children three months versus one or six months of age (Campbell et
al., 1998). Elevations in JVE were primarily due to increased VT and not RR confirming results of
earlier findings (Haddad et al., 1980). Children with apnea of infancy, thought to be at risk for
SIDS, vary considerably in their response to CO2 challenge, occasionally showing no respiratory
response at all or a depression in HR (Folgering and Boon, 1986; Katz-Salamon and Milerad,
1998). Taken together, children less than six months appear to have a diminished respiratory
response to CO2 challenge compared with older children. More importantly, in normal children
the diminished response appears to have a nadir around three months of age, precisely during the
peak time frame for SIDS cases. In our opinion, apnea of infancy or some other unknown
predisposing factor might act synergistically with the apparently normal increase in VAS around
three months of age, leading to SIDS.

103
Figure 3.10 - Comparison of PZAMP by treatment, within each post embryonic (PE) day.Treatments (1 = 10.0 % CO2, n = 11; 2 = 5.0 % CO2, n = 10; 3 = 2.50% CO2, n = 11; 4 = 1.25%CO2, n = 11; 5 = Room Air, n = 11) were delivered under anesthesia (isoflurane, 1.75%) usingroom air as the carrier gas. Individual rat pups were tested every other day (PE days 30, 32, 34, n= 28 or PE days 31, 33, 35, n = 26) No differences could be demonstrated between treatmentswith litters in common (p >0.05). Values are means ±SE.
To our knowledge, transcutaneous blood gas has not been used to assess the ontogeny of
respiratory response to CO2 in rats. Transcutaneous CO2 measurements allow serial assessment

104
Figure 3.11- Comparison of PZAMP by paired post embryonic (PPE) days, within eachtreatment. Treatments were delivered under anesthesia (isoflurane, 1.75%) using room air as thecarrier gas. Individual rat pups were tested every other day (PE days 30, 32, 34 or PE days 31,33, 35). Analysis and results of time points 0-40 and 40-60 are presented separately, indicatedby the vertical dotted lines. No differences were demonstrated between treatments with letters incommon (0- 40 min) or numbers in common (40-60 min) (P >0.05). Values are means ± SE.
of blood gases without obtaining blood samples. The method is therefore useful in small rodents
where blood volume and vascular access are limited (Stout et al., 2001). Our results (Fig 3,4)
105
show a clear difference in PZPtcCO2 for PPE days 30 and 31 compared to older animals, when
exposed to 10.0% inspired CO2. The differences in PZPtcCO2 are still present with 5.0% inspired
CO2, yet consistent age effects on PZPtcCO2 were only revealed by comparison of slopes
generated during CO2 exposure, and after CO2 was discontinued. A portion of the differences
noted were attributed to differences in initial PtcCO2 levels, which decreased with age (data not
shown). After treatment with 5.0% or 10.0% CO2 was discontinued on PPE days 30 and 31,
PZPtcCO2 levels declined approximately 55.0 % more slowly than for older pups. These results
suggest that overall, younger pups have a decreased ability to respond to and recover from
hypercapnic challenge.
Differences in HR were also apparent on PPE days 30 and 31when compared to HR
values measured in older pups. With the exception of pups exposed to 10.0% CO2, HR was
generally less depressed after exposure to CO2 on PPE days 30 and 31 than on later PPE days.
After CO2 exposure was discontinued, HR appeared to climb above baseline only in rat pups 30
and 31 PPE days of age. However, consistent elevations in HR after time 40 were not detectable,
presumably due to the large variation in HR. Elevated levels of inspired CO2 for extended
periods may have conflicting affects on HR. Breathing elevated CO2 levels for extended periods
should cause acidosis and depress HR (Aberra et al., 2001). Alternatively, stress induced by
breathing elevated levels of CO2, along with subsequent acidosis, should activate the
sympathetic nervous system, thereby elevating the HR (Fukuda et al., 1989). While pH was not
measured, acidosis may have predominated over any stress induced for the older animals during
the CO2 treatment period. In contrast to our findings, others have reported no effect of 5.0% CO2
on HR in rats seven or 14 days of age, while HR was depressed in rats 21 days of age (Liu et al.,
2000). Rats in that experiment were challenged for 10 minutes under urethane anesthesia,
106
compared to a 40 minute challenge period under isoflurane anesthesia in our study. Our results
were recalculated using only the first 10 minutes of data, when animals were treated with 5.0%
CO2 to compare our results more closely with Liu et al (Liu et al., 2000). Using the truncated
data, HR was still significantly higher on PPE days 30 and 31 when compared to our oldest
group of animals (PPE days 34 and 35 .PN days 13 and 14). Differences between this study and
Liu et al may be attributed to differences in anesthetic regimen. While urethane anesthesia is
commonly used in physiologic experiments, it may be inappropriate for use, particularly while
investigating the effects of inhaled CO2 on respiration or heart rate. Urethane is known to cause
metabolic acidosis and depress heart rate which could confound responses to inhaled CO2 (Folle
and Levesque, 1976; Wixon and Smiler, 1997). Additionally, as pointed out in their study,
supplemental heat provided was below the thermoneutral zone and may have led to hypothermia
by the time CO2 challenge was instituted (Liu et al., 2000). Hypothermia would depress heart
rate and likely obtund cardiovascular responses to CO2 challenge (Tanaka et al., 2001). Our
ability to demonstrate differences in HR was likely due to our maintaining core temperature, as
well as our use of isoflurane anesthesia, since isoflurane does not cause metabolic acidosis.
While overall changes in HR due to hypercapnic challenge in our study appear clinically minor,
the elevation of HR seen in our youngest pups points to a higher level of stress than that seen in
older pups tested. More importantly, this stress response of elevated HR seen in our younger
pups is similar to human infants of SIDS age under comparable conditions, except for anesthesia
(Skadberg and Markestad, 1997b, 1997a; Katz-Salamon and Milerad, 1998).
Numerous groups have reported respiratory responses to hypercapnia in neonatal rats,
primarily utilizing flow or barometric plethysmography. Initial reports noted an increase in JVE,
primarily due to increased VT, in 2-4 day old rats exposed to 5.0 or 10.0% CO2. This response

107
was blunted by anesthesia (Saetta and Mortola, 1985; Saetta and Mortola, 1987). Expanding the
age range to 2-7 days of age, chronic exposure to 7.0% inspired CO2 caused similar responses,
with no changes in respiratory response due to age (Rezzonico and Mortola, 1989). More
recently, while studying the Hering- Breuer reflex, inhibitory reflexes were found to be lower for
eight day old rats than for two day old rats, which indicated a decreased vagal sensitivity to 3.0%
CO2 in the younger rats (Matsuoka and Mortola, 1995). While testing pups 1-12 PN days of age,
one day old rats decreased JVE when exposed to 30 second bursts of 6.0 or 8.0 % CO2 (Coates
and Silvis, 1999). No differences in respiratory response were detected between pups 2-12 days
of age which responded with an increase in JVE (Coates and Silvis, 1999).
With the exception of the study by Coates and Silvis, our animals were older than those
used in previous studies. Results of our study differ from the findings of Coates and Silvis, at
similar CO2 levels ( 5.0 vs 6.0 %) and ages (PN days 9-12). At 6.0% CO2, those authors report
increased JVE, primarily due to elevations in RR (Coates and Silvis, 1999). With our pups
breathing 5.0% CO2, RR remained basically static, or fell slightly, during the treatment period,
and between days, while there was a general trend for AMP to rise similar to earlier reports with
younger animals (Saetta and Mortola, 1985; Saetta and Mortola, 1987; Rezzonico and Mortola,
1989). It is likely that the short bursts of CO2 utilized in the Coates and Silvis study did not allow
sufficient time for VT to increase. In contrast to Coates and Silvis, Liu et al., examined
respiratory and cardiac responses to hypoxia and hypercapnia in anesthetized 7 and 14 day old
rat pups (Liu et al., 2000). Our results support their finding that with 5.0% inspired CO2, RR
remained relatively stable while AMP climbed during a 10 minute exposure period (Liu et al.,
2000). None of the studies cited challenged pups with 10.0% CO2, as was done in our study.
Although CO2 levels of 10% or higher have not been measured in the microenvironment of
108
children sleeping prone under covers, these levels are feasible via mechanical or fluid dynamic
models (Ryan, 1991; Carleton et al., 1998; Djupesland and Borresen, 2000). When we exposed
rat pups to 10.0% inspired CO2 on PPE days 30 and 31, AMP increased, while RR was
unchanged. In contrast, as animals aged they responded to challenge with 10.0% CO2 with a
decrease in RR and elevation of AMP. When data collected on PE days 30 and 31 (10.0% CO2)
were examined individually, it appeared as if RR increased only on PE day 30, while AMP
increased only on PE day 31. However, no age related differences were found for PZRR or AMP
for tests conducted on PE days 30 and 31. This may have been a function of the short analysis (9
seconds) period, which provided approximately 8 breaths to analyze at each time point. Despite
the short analysis period, challenge of pups with 10% inspired CO2 exposed a previously
undescribed difference in respiratory ontogeny of juvenile rats. Respiratory rate decreased while
AMP increased in pups PPE days 32 and 33 or older, possibly due to increased inspiratory and
expiratory time. While JVE was not measured in this study, AMP and RR results point to a
weaker respiratory response to 10% inspired CO2 on PPE days 30 and 31, compared to
responses generated in neonatal life.
Previous citations reported no differences in HR or any other respiratory parameter in
response to inspired CO2, regardless of methodology, within the age range targeted in this study.
Recently, Stunden and coworkers challenged unanesthetized rats 1-21 days with up to 5.0%
inspired CO2. They reported a depression in CO2 chemosensitivity with a nadir at PN day 8,
which started to rise again at PN day 10 (Stunden et al., 2001). Chemosensitivity was defined as
the slope of JVE in response to stepwise increases of CO2. To compare our results with Studen et
al, we multiplied RR by AMP to provide an estimate of JVE in arbitrary units as described by

109
others (Folgering and Boon, 1986). At time point 40, estimated JVE on PPE days 30 and 31 was
lower than that measured later as pups aged in response to inspired CO2 (data not shown). These
findings suggest a depression in respiratory response or chemosensitivity in our youngest group
of pups. Our results therefore support those of Stunden et al, although we found the respiratory
response to inspired CO2 began rising one day later, on approximately PN day 11. This minor
difference could be explained by our use of PE day rather than PN day.
The influence of anesthesia cannot be ignored in our model. Isoflurane is known to
depress respiration (Canet et al., 1994; Imai et al., 1999) and depress heart rate (Lee et al., 2002).
However, maintaining normothermia as we did can abrogate cardiorespiratory depression
brought on by anesthesia-induced hypothermia (Dardai and Heavner, 1987). While breathing
room air, there were few changes over the 60 minute recording period for any dependent
variable, with the exception of RR, where there was a slow progressive depression over time in
pups exposed on PPE days 30 and 31. It is possible that anesthesia blunted responses to CO2 in
our study, as reported for other anesthetic agents (Saetta and Mortola, 1985). Had we not
measured PtcCO2, we could have avoided anesthesia and used plethysmography to measure
respiratory responses, and telemetry to measure HR. Although anesthesia was not a requirement
for transcutaneous technology use, it did facilitate accurate measurements of transcutaneous CO2
partial pressures.
In summary, anesthetized rats of PPE days 30 and 31 reacted to CO2 challenge differently
than older animals. Young rats challenged with moderate (#5.0%) levels of CO2 showed higher
HR, indicating a higher level of stress, which may be analogous to responses seen in infants at
the peak age of SIDS (Skadberg and Markestad, 1997b). Additionally, rat pups exposed to 5.0 or
10.0% CO2 on PPE days 30 and 31 responded more slowly to, and recovered more slowly from,

110
CO2 than older animals tested. Our findings indicate that 8-10 day old rat pups are incapable of
optimally responding to elevated levels of inspired CO2. These findings may be analogous to the
increase of VAS reported for human infants at three months of age (Campbell et al., 1998), and
should be examined further. Taken together, our study establishes the juvenile rat (PN days 8-10)
as a useful model for future investigations into the pathogenesis of SIDS.
Bibliography
Aberra A, Komukai K, Howarth FC, Orchard CH. 2001. The effect of acidosis on the ECG of therat heart. Experimental Physiology 86:27-31.
Ba A, Seri BV. 1995. Psychomotor functions in developing rats: ontogenetic approach tostructure-function relationships. Neuroscience and biobehavioral reviews 19:413-425.
Bach KB, Mitchell GS. 1998. Hypercapnia-induced long-term depression of respiratory activityrequires alpha2-adrenergic receptors. Journal of Applied Physiology 84:2099-2105.
Campbell AJ, Bolton DP, Taylor BJ, Sayers RM. 1998. Responses to an increasing asphyxia ininfants: effects of age and sleep state. Respiration Physiology 112:51-58.
Canet J, Sanchis J, Zegri A, Llorente C, Navajas D, Casan P. 1994. Effects of halothane andisoflurane on ventilation and occlusion pressure. Anesthesiology 81:563-571.
Carleton JN, Donoghue AM, Porter WK. 1998. Mechanical model testing of rebreathingpotential in infant bedding materials. Archives of Disease in Childhood 78:323-328.
Coates EL, Silvis ML. 1999. Age-related changes in the ventilatory response to inspired CO2 inneonatal rats. Respiration Physiology 118:173-179.
Dardai E, Heavner JE. 1987. Respiratory and cardiovascular effects of halothane, isoflurane andenflurane delivered via a Jackson-Rees breathing system in temperature controlled anduncontrolled rats. Methods and Findings in Experimental and Clinical Pharmacology9:717-720.
Djupesland PG, Borresen BA. 2000. Computational simulation of accumulation of expired air inthe infant cot. Acta Otolaryngologica Supplementum 543:183-185.
Dobbing J, Sands J. 1973. Quantitative growth and development of human brain. Archives ofDisease in Childhood 48:757-767.
111
Folgering H, Boon J. 1986. Ventilatory response to CO2 in infants with alleged sleep apnoea.European Journal of Pediatrics 144:539-544.
Folle LE, Levesque RI. 1976. Circulatory, respiratory and acid-base balance changes producedby anesthetics in the rat. Acta Biologica et medica Germanica 35:605-612.
Fukuda Y, Sato A, Suzuki A, Trzebski A. 1989. Autonomic nerve and cardiovascular responsesto changing blood oxygen and carbon dioxide levels in the rat. Journal of the AutonomicNervous System 28:61-74.
Gibson AA. 1992. Current epidemiology of SIDS. Journal of Clinical Pathology 45:7-10.
Haddad GG, Leistner HL, Epstein RA, Epstein MA, Grodin WK, Mellins RB. 1980. CO2-induced changes in ventilation and ventilatory pattern in normal sleeping infants. Journalof Applied Physiology 48:684-688.
Imai A, Steffey EP, Farver TB, Ilkiw JE. 1999. Assessment of isoflurane-induced anesthesia inferrets and rats. American Journal of Veterinary Research 60:1577-1583.
Katz-Salamon M, Milerad J. 1998. The divergent ventilatory and heart rate response to moderatehypercapnia in infants with apnoea of infancy. Archives of Disease in Childhood 79:231-236.
Kemp JS. 1996. Rebreathing of exhaled gases: importance as a mechanism for the causalassociation between prone sleep and sudden infant death syndrome. Sleep 19:S263-266.
Kemp JS, Thach BT. 1993. A sleep position-dependent mechanism for infant death onsheepskins. American Journal of Diseases of Children 147:642-646.
Kinney HC, Filiano JJ, White WF. 2001. Medullary serotonergic network deficiency in thesudden infant death syndrome: review of a 15-year study of a single dataset. Journal ofNeuropathology and Experimental Neurology 60:228-247.
Kohn DF, Barthold SW. 1984. Biology and diseases of rats. In: Fox JG, Cohen BJ, Loew FM,editors. Laboratory Animal Medicine, 1 ed. San Diego: Academic Press. p 91-122.
Kum-Nji P, Mangrem CL, Wells PJ. 2001. Reducing the incidence of sudden infant deathsyndrome in the Delta region of Mississippi: a three-pronged approach. Southern MedicalJournal 94:704-710.
Lancaster FE. 1994. Alcohol and white matter development--a review. Alcoholism: Clinical andExperimental Research 18:644-647.
Lee JS, Morrow D, Andresen MC, Chang KS. 2002. Isoflurane depresses baroreflex control ofheart rate in decerebrate rats. Anesthesiology 96:1214-1222.

112
Liu J, Boujedaini N, Cazin L, Mallet E, Clabaut M. 2000. Developmental changes in cardio-respiratory responses to hypoxia and hypercapnia in anesthetized low-birth-weight rats.Respiration Physiology 123:189-199.
Malcolm G, Cohen G, Henderson-Smart D. 1994. Carbon dioxide concentrations in theenvironment of sleeping infants. Journal of Paediatrics and Child Health 30:45-49.
Marcus CL, Glomb WB, Basinski DJ, Davidson SL, Keens TG. 1994. Developmental pattern ofhypercapnic and hypoxic ventilatory responses from childhood to adulthood. Journal ofApplied Physiology 76:314-320.
Mathews TJ, Curtin SC, MacDorman MF. 2000. Infant mortality statistics from the 1998 periodlinked birth/infant death data set. National Vital Statistics Reports 48:1-28.
Matsuoka T, Mortola JP. 1995. Effects of hypoxia and hypercapnia on the Hering-Breuer reflexof the conscious newborn rat. Journal of Applied Physiology 78:5-11.
Mitchell EA. 1997. The changing epidemiology of SIDS following the national risk reductioncampaigns. Pediatric Pulmonology. Supplement 16:117-119.
Molony N, Blackwell CC, Busuttil A. 1999. The effect of prone posture on nasal temperature inchildren in relation to induction of staphylococcal toxins implicated in sudden infantdeath syndrome. FEMS Immunology and Medical Microbiology 25:109-113.
Mosko S, Richard C, McKenna J, Drummond S, Mukai D. 1997. Maternal proximity and infantCO2 environment during bedsharing and possible implications for SIDS research.American Journal of Physical Anthropology 103:315-328.
Olsson AK, Lindahl SG. 1985. Ventilation, dynamic compliance and ventilatory response toCO2. Effects of age and body weight in infants and children. Anaesthesia 40:229-236.
Phillips DE, Krueger SK, Rydquist JE. 1991. Short- and long-term effects of combined pre- andpostnatal ethanol exposure (three trimester equivalency) on the development of myelinand axons in rat optic nerve. International Journal of Developmental Neuroscience 9:631-647.
Rezzonico R, Mortola JP. 1989. Respiratory adaptation to chronic hypercapnia in newborn rats.Journal of Applied Physiology 67:311-315.
Richardson BA. 1994. Sudden infant death syndrome: a possible primary cause. Journal-Forensic Science Society 34:199-204.
Ryan EL. 1991. Distribution of expired air in carry cots - a possible explanation for some suddeninfant deaths. Australasian Physical & Engineering Sciences in Medicine 14:112-118.

113
Saetta M, Mortola JP. 1985. Breathing pattern and CO2 response in newborn rats before andduring anesthesia. Journal of Applied Physiology 58:1988-1996.
Saetta M, Mortola JP. 1987. Interaction of hypoxic and hypercapnic stimuli on breathing patternin the newborn rat. Journal of Applied Physiology 62:506-512.
Skadberg BT, Markestad T. 1997a. Behaviour and physiological responses during prone andsupine sleep in early infancy. Archives of Disease in Childhood 76:320-324.
Skadberg BT, Markestad T. 1997b. Consequences of getting the head covered during sleep ininfancy. Pediatrics 100:E6.
Stout RW, Cho D-Y, Gaunt SD, Taylor HW, Baker DG. 2001. Transcutaneous blood gasmonitoring in the rat. Comparative Medicine 51:524-533.
Stunden CE, Filosa JA, Garcia AJ, Dean JB, Putnam RW. 2001. Development of in vivoventilatory and single chemosensitive neuron responses to hypercapnia in rats.Respiration Physiology 127:135-155.
Tanaka M, Nagasaki G, Nishikawa T. 2001. Moderate hypothermia depresses arterial baroreflexcontrol of heart rate during, and delays its recovery after, general anesthesia in humans.Anesthesiology 95:51-55.
Wixon SK, Smiler KL. 1997. Anesthesia and analgesia in rodents. In: Kohn DF, Wixon SK,White WJ, Benson GJ, editors. Anesthesia and Analgesia in Laboratory Animals. NewYork: Academic Press. p 165-203.
Yamamoto T, Kida I. 1996. Application of transcutaneous blood carbon dioxide monitoring tothe magnetic resonance imaging of rat. Journal of Medical Engineering & Technology20:164-168.

114
Chapter 4
Cardiorespiratory Responses to Ethanol and CO2 in
Anesthetized Juvenile Rats

115
Introduction
Sleeping in the prone position has been identified as a consistent risk factor for
Sudden Infant Death Syndrome (SIDS) (Dwyer et al., 1995; Oriot et al., 1998; Kattwinkel et
al., 2000). Hypotheses concerning the relationship between SIDS and sleeping in the prone
position include bacterial toxins (Molony et al., 1999), hyperthermia (Mitchell, 1997), toxic
gases from bedding material (Richardson, 1994) and rebreathing of CO2 (Kemp, 1996). While
rebreathing of CO2 by infants has not yet been proven as a definitive cause of SIDS,
mechanical and computer models have demonstrated the potential for elevated CO2 (5.0 -
25.0%) levels in the microenvironment of children sleeping in soft bedding with blankets
around the head (Ryan, 1991; Skadberg et al., 1995; Carleton et al., 1998). Moderate
elevations in CO2 have the potential to depress respiration with resultant hypercarbia while
the highest levels may cause direct asphyxiation (Kemp and Thach, 1993; Bach and Mitchell,
1998; Carleton et al., 1998; Katz-Salamon and Milerad, 1998).
Elevated levels of CO2 represent a potential risk factor for SIDS. For this to be the
case, the infant would have to be unable to respond to elevations in CO2. During sleep, while
covered with or nested deeply within blankets, CO2 could rise rapidly (Ryan, 1991; Skadberg
et al., 1995). The primary response to elevated levels of inhaled CO2 seen in normal infants is
an increase in JVE (Rigatto, 1984; Folgering and Boon, 1986). Additionally, to relieve any
perceived stress, the infant will likely move in an attempt to eliminate the stressor. However,
some normal infants fail to move from the prone position in spite of observed increases in
heart rate, a drop in O2 saturation, and/or marked pallor (Skadberg and Markestad, 1996).
Furthermore, blankets covering the head, which might trap CO2, are much easier removed
when infants are in the supine position (41.5 % success) than when laying prone (2.0%)

116
(Skadberg and Markestad, 1997). While the association between prone sleeping and SIDS
appears strong, and the hypothesis of CO2 rebreathing as an etiology seems plausible, the fact
remains many cases of SIDS are found in the supine position, not covered by blankets.
Therefore, deaths attributed to SIDS may be caused by multiple etiologies. In fact, as
improved diagnostic methods became available, deaths previously attributed to SIDS were
later attributed to other causes (Kemp et al., 1996; Boles et al., 1998; Ackerman et al., 2001).
Alternatively, several seemingly unrelated stressors may converge at once giving rise to
SIDS. The convergence of risk factors has been proposed in the “Triple Risk Model” where a
vulnerable infant, during a critical developmental period, is exposed to an exogenous stress
leading to sudden death (Filiano and Kinney, 1994). Epidemiologic evidence suggests the
critical developmental period for SIDS is 2-4 months of age (Kattwinkel et al., 2000). The
exogenous stress of CO2 may be accentuated in infants three months of age when responses to
inhaled CO2 are least effective (Campbell et al., 1998). Considering the Triple Risk Model of
SIDS, we propose to investigate what constitutes a vulnerable infant, utilizing the juvenile rat
as a model.
In our previous work (Chapter 3), we identified differences in cardiorespiratory
responses to CO2 in the juvenile rat. Our results suggested that rats of post natal (PN) days 8-
10 reacted to CO2 challenge in a manner similar to children approximately three months of
age. Others have reported that while children three months of age responded by increasing
minute ventilation ( JVE) in response to inhaled CO2, their response was not as robust as that
seen for younger children (1 month of age) or older children (6 months of age) (Campbell et
al., 1998). The depression in CO2 response at three months of age coincided with the peak
incidence age for SIDS (Gibson, 1992; Lazoff and Kauffman, 1995; Kattwinkel et al., 2000).

117
In our study, we found that rat pups of post embryonic (PE) days 9-10 responded to inhaled
CO2 with an elevation in heart rate over that seen for older pups (Chapter 3). Additionally,
pups (PE days 9-10) exhibited a decreased ability to remove excess circulating CO2, after CO2
was discontinued, when compared to responses of older pups (PE days 11-14, Chapter 3).
Stunden and coworkers (2001) reported a depressed chemosensitivity in response to inhaled
CO2 in rat pups eight days of age in contrast to higher levels of chemosensitivity for younger
and older rat pups. The similar responses to inhaled CO2 exhibited in 8-10 day old rats and
three month old children further justify use of the juvenile rat as a model for investigations on
the pathogenesis of SIDS.
In Chapter 1 potential etiologies for SIDS were reviewed. Here we concentrate on the
potential role of endogenous ethanol (EtOH) production in the pathogenesis of SIDS. In a
previous study by others, substantial levels of EtOH were produced in vitro by various species
of yeast known to inhabit the gastrointestinal tract of humans, using infant formula as a
substrate (Bivin and Heinen, 1985). At the time, bottle fed children exhibited an increased
risk of SIDS versus that observed among breast fed children (Biering-Sorensen et al., 1978;
Arnon et al., 1982). It was proposed that high levels of EtOH produced with infant formula in
vitro may be similar to previous reports of “Auto Brewery Syndrome”, and taken together,
should be further investigated in relationship to SIDS (Kaji et al., 1976; Bivin and Heinen,
1985). Along with various species of yeast, EtOH can be produced by bacteria in the
gastrointestinal tract of infants (Wolin et al., 1998). Ethanol is known to depress the central
nervous and respiratory systems (Johnstone and Reier, 1973; Murray et al., 1986). At modest
blood alcohol concentrations (BAC), respiratory depression in adult humans has been
inconsistent. However, depression of the hypercapnic ventilatory response appeared to be a

118
consistent feature (Duffin et al., 1978; Michiels et al., 1983; Dawson et al., 1993). Clearance
of EtOH has been found to be mediated by several enzymes (Riveros-Rosas et al., 1997;
Lands, 1998). More important to this investigation, the ability to metabolize EtOH is low in
infants, and adult levels of EtOH metabolism are not obtained until about five years of age
(Pikkarainen and Raiha, 1967; Pikkarainen and Raiha, 1969). Similarly, young rats clear
EtOH more slowly than adult rats, with maximum clearance rates achieved by around 60 days
of age (Kelly et al., 1987).
If modest levels of EtOH can depress the hypercapnic ventilatory drive of adult
humans, would similar or lower doses produce the same effect in infants? Also, with CO2
sensitivity at its lowest level in infants three months of age, would EtOH further depress the
sensitivity such that subsequent CO2 challenge would be met with a respiratory response
insufficient to maintain life? To initiate the investigation into the potential role of
endogenously produced EtOH in SIDS, we chose to measure elements of respiratory
mechanics, heart rate and transcutaneous blood gas levels in the juvenile rat in response to
various levels of EtOH, with and without simultaneous CO2 challenge.
Materials and Methods
Animals
Pups were obtained from timed pregnant Sprague-Dawley rats (Harlan, Indianapolis,
USA). Husbandry, pathogen status, as well as animal care and use issues were as previously
described in Chapter 3. Neurologic development of the pups was standardized by PE day as in
Chapter 3. On PE day three, litters with over 10 pups were reduced to 10, while litters with
less than 10 pups were reduced to six pups. On PE day 29, pups were tattooed on their foot
pads under isoflurane anesthesia (IsoFlo®, Abbott Lab.; Chicago, Ill.). Thereafter, pups were

119
returned to the dam for recovery. Rat pups were tested on either PE days 30 and 32, or 31 and
33. All pups were weighed daily from PE days 30 through 33.
Experimental Procedures
On PE day 30, each animal was randomly assigned to one of eight treatment (Trt)
groups or maintained as controls for growth comparisons. Treatments consisted of four levels
of EtOH in vehicle combined with one of two levels of inspired CO2 (Trt 1= 1.80 mg/kg
EtOH, 0.00% CO2; Trt 2 = 1.80 mg/kg EtOH, 5.00% CO2; Trt 3= 0.90 mg/kg EtOH, 0.00%
CO2; Trt 4 = 0.90 mg/kg EtOH, 0.00% CO2; Trt 5 = 0.18 mg/kg EtOH, 0.00% CO2; Trt 6 =
0.18 mg/kg EtOH, 5.00%; Trt 7= 0.00 mg/kg EtOH, 0.00% CO2; Trt 8= 0.00 mg/kg EtOH,
5.00% CO2). The maximum EtOH dosage was designed to achieve a BAC equivalent to the
legal limit in humans operating a motor vehicle (100 mg%). The lowest level was selected to
achieve a BAC of 10 mg%, which is at least double the maximum background level BAC
found in normal human circulation (Riveros-Rosas et al., 1997). In Chapter 3, the lowest level
of inspired CO2 which consistently induced cardiorespiratory change was 5.00%.
Additionally, 5.00% CO2 is slightly above the range measured 3-4 cm in front of and at the
level of the forehead while children were sleeping with their heads under blanketing, but on
the lower end of the range measured or calculated with mechanical or computer models
(Ryan, 1991; Malcolm et al., 1994; Skadberg et al., 1995; Skadberg and Markestad, 1997;
Carleton et al., 1998). Therefore, 5.00% CO2 was chosen for our investigation.
Preparation and administration of EtOH was in accordance with the methods of Light
et al. with the following exceptions (Light et al., 1998). Ethanol (Gem Clear, Quality Control
Distilling Co., Bardstown KY, 190 proof) was mixed with vehicle (Ensure®, Abbott
Laboratories, Columbus OH) at 120, 60, 12, and 0 mg/ml (w/v). Preparations were made

120
isocaloric by the addition of dextrose as needed. While under brief isoflurane (3.0%)
anesthesia, EtOH treatments were delivered by gavage needle (22 gauge, 1.5 inch, 1.25 mm
ball tip, Popper & Sons, Inc., New Hyde Park, NY) 90 minutes prior to data collection at a
dosage of 1.5% of body weight at time of treatment. Following gavage, pups were allowed to
recover with the dam. CO2 was delivered via nose cone under isoflurane (1.75%) anesthesia
using room air as the carrier gas. Total gas flow was maintained at 0.7 liters/minute
throughout all procedures.
Fifty minutes after gavage each pup was anesthetized via nose cone with 2.5 %
isoflurane (anesthetic regimen 1) utilizing room air as the carrier gas (0.7 liters/min). Once
anesthetized, each pup was placed in dorsal recumbency and instrumented as follows. Five
leads were attached via needle electrodes. One lead each was attached to the right and left
ventro-lateral chest wall for impedance pneumography. Impedance pneumography leads were
connected to an impedance pneumograph (Resp 1, UFI, Morro Bay CA). Three leads ( right
lateral shoulder, left lateral shoulder, left lateral stifle) for electrocardiogram (ECG) were
connected to a bio-amplifier (ML136, ADInstruments, Castle Hill, NSW, Australia). A
lubricated temperature probe (IT-18 Thermocouple, Physitemp Instruments Inc., Clifton NJ)
was placed approximately 18 mm into the rectum for monitoring core temperature.
Following instrumentation, isoflurane levels were gradually lowered to 1.75% by -10
minutes and maintained at that level for the duration of the test period. Analog signals for
ECG, temperature, respiratory pneumography, and PtcCO2 were captured utilizing a
PowerLab® System (PowerLab 8SP and Chart v 4.1.2, ADInstruments, ADInstruments,
Castle Hill, NSW, Australia) connected to and running on a desk top computer. Signals
measured in volts were recorded at four kHz for all channels. Temperature voltage was
121
converted to °C. PtcCO2 voltage signals were converted to mm/Hg. All other signals were
retained in volts.
A test period lasted for 100 minutes. The initial 40 minutes allowed for core
temperature and TCBG stabilization as well as minor lead adjustments to optimize traces for
each signal on the monitor. Heat supplied by a heating pad and lamp were adjusted prior to
transcutaneous probe application to achieve a core body temperature of 36.8°C at probe
application and 37.5°C by time 0. At -30 minutes the calibrated transcutaneous probe was
applied to the pup as described in Chapter 2. Transcutaneous values were expressed as the
transcutaneous partial pressure of CO2 (PtcCO2) and transcutaneous partial pressure of O2
(PtcO2). Correlation of PtcO2 with arterial pressure of O2 is poor in rats and will not be reported
in this study (Yamamoto and Kida, 1996; Stout et al., 2001). At -30 seconds, data were
recorded for one minute, and every five minutes thereafter for one hour. At time 0, a
treatment gas mixture was administered for 40 minutes (0.0% or 5.0% CO2). After values
were recorded at 40 minutes, treatment was discontinued and the pretreatment gas mixture
was administered for an additional 20 minutes followed by discontinuation of anesthesia and
recovery with the dam. Animals were humanely euthanatized for tissue collection, by an
overdose of pentobarbital Na+ (Buthanasia-D, Schering-Plough Animal Health Corp., Union,
NJ) on PE day 34.
Approximately one third of the way into the study, the anesthetic regimen was
changed due to the inability to consistently complete testing sessions of several pups.
Thereafter, pups were induced with 1.0% isoflurane (anesthetic regimen 2) followed by
instrumentation as previously described. Isoflurane was then gradually increased to 1.75% as

122
opposed to gradually lowering the anesthetic level to 1.75% by -10 minutes. Thereafter, the
isoflurane was maintained at the same level and flow rate as the initial protocol.
Data Processing
Animals not completing their two days of testing were excluded from data analysis.
Exclusion occurred due to forced movement of a lead, resulting in signal loss, or to the
accumulation of respiratory mucous secretions that interfered with normal breathing.
Detection of airway obstruction was usually detected first by irregular breathing movements
by the animal, or irregular wave display on the computer monitor. Confirmation was achieved
audibly.
Utilizing the PowerLab® System software (Chart v 4.1.2), each minute of data
recorded at each of the 13 time points (0-60) were analyzed individually for each pup. Peak
detection sensitivity was adjusted within the appropriate channel to detect the peak of the
cardiac QRS wave, as well as respiratory wave. Variables recorded include mean heart rate in
beats per minute (HR), mean respiratory rate in breaths per minute (RR), mean maximum
respiratory amplitude (AMP), mean core temperature and mean PtcCO2. Values were then
imported into statistical software for final analysis.
Statistical Analysis
All data were analyzed by split plot design utilizing the General Linear Model (GLM)
(Systat®, vs 10.2) as described in Chapter 3. For the dependent variable body weight, between
plot effects were analyzed for the effect of treatment (Trt) and anesthesia (Anes), and within
plot effects were analyzed for the effect of PE Day. All treatment and control animals were
used in the analysis.

123
Utilizing only treated animals, the dependent variables PtcCO2, HR, RR and AMP
were transformed and expressed as percentage of time zero (PZPtcCO2, PZHR, PZRR, and
PZAMP respectively). Data were analyzed by restricted groups of time points (0-40 or 40-
60). Due to the change in anesthetic regimen, all possible combinations of Anes, Trt, and day
group (DayGrp 1= tested on PE days 30 and 32, DayGrp2= tested on PE days 31 and 33)
were not represented in the final data set. Because there were a few missing combinations, the
between plot effect of Anes could not be directly analyzed for all Trts. To investigate the
effect of Anes, data corresponding to Trt 5 were excluded so that Anes could be included as a
between plot effect in a restricted model. The Trt restricted model allowed analysis of Anes
effects on the dependent variables PZPtcCO2, PZHR, PZRR, and PZAMP. When Anes
demonstrated a statistically significant effect on a dependent variable, Anes was included as a
main effect in the final model, which included all Trts. Otherwise, Anes was excluded.
Data were analyzed for the effects of the following independent variables. Between
plot (main) effects included Trt, and DayGrp. Within plot effects included paired post
embryonic (PPE day 1= PE days 30 and 31, PPE day 2 = PE days 32 and 33) day and time
point (Tpnt). The interaction effects of DayGrp and PPE day, PPE day and Trt, as well as
DayGrp and PPE day and Trt were also examined. Additional analysis of the dependent
variables PZPtcCO2 and PZHR included calculation of the slope from time 0 through 40, and
from time 40 through 60. Slope data were analyzed using the same GLM split plot design as
above, though Tpnt was excluded from the model.
When significance was found, all differences were further evaluated with Tukey’s post
hoc test. All data are reported as means ± SE unless otherwise indicated. P values # 0.05 were
considered significant.
124
Results
Manipulation of the pups was well tolerated by the dams throughout the course of the
study. A total of 204 pups were used in this study, 48 (26 female, 22 male) of which were
controls. Of 156 pups receiving a Trt, 73 animals failed to complete their two days of testing
due to respiratory obstruction, signal loss, or death. Thus, data from 83 pups remained for
analysis. Further examination of the data revealed that three animals received anesthetic
regimen 1 on their first day of testing and anesthetic regimen 2 on their second day of testing.
These three animals were excluded from final data analysis. The final data set included 80
pups (40 females, 40 males; Trt 1, n = 10; Trt 2, n = 9; Trt 3, n = 10; Trt 4, n = 9; Trt 5, n =
10; Trt 6, n = 9; Trt 7, n = 11; Trt 8, n = 12), 32 of which were tested with the original
anesthetic regimen and 48 tested with the modified anesthetic regimen. Testing began 7.88 ±
0.09 days after birth for animals tested on PE days 30 and 32 (DayGrp 1). For animals tested
on PE days 31 and 33 (DayGrp 2) testing began 8.90 ± 0.11 days after birth. Mean time from
gavage to Time 0 was 108.43 ± 6.78 minutes. Mean time from the start of anesthesia to time 0
was 79.56 ± 4.72 minutes. Seven pups died as a result of gavage. Three pups died after
completion of a test period. Excluding these 10 pups, 44.44% of pups completed their two
days of testing utilizing anesthetic regimen 1 while 64.86% of pups completed their two days
of testing with anesthetic regimen 2. Success testing rate in percent by anesthetic regimen and
Trt are illustrated in table 4.1.
Body Weight
Weight gains by PE day are illustrated in figure 4.1. No differences in body weight
could be detected between Trt groups over the four day test period, nor was there a significant
effect of anesthetic regimen. For all groups, weight gain was significant between days. On PE

125
day 30, mean body weight was 18.23 ± 0.15 gm. Thereafter, pups gained 2.25 ± 0.21 gm per
day.
Transcutaneous Partial Pressure of CO2 (PZPtcCO2)
PZPtcCO2 was higher during time points 0-40 when testing with anesthetic regimen 1
(1.18 ± 0.008) than for anesthetic regimen 2 (1.16 ± 0.007). Similar results were noted for
time points 40-60 (anesthetic regimen 1, 1.24 ± 0.009; anesthetic regimen 2, 1.23 ± 0.01). In
the same manner, the slope of PZPtcCO2 was steeper with anesthetic regimen 1 (0.04 ± 0.003)
than with anesthetic regimen 2 (0.03 ± 0.003) during the time points 0-40. Likewise, during
time points 40-60, the slope of PZPtcCO2 was steeper for anesthetic regimen 1 (-0.02 ± 0.006)
than for anesthetic regimen 2 (-0.01 ± 0.004). Anesthesia was only significant as a main
effect. No differences in PZPtcCO2 were found between anesthetic regimens within a given
Trt. Since Anes was significant as a main effect for the dependent variable PZPtcCO2, the
following results included Anes as a main effect in the model.
The effects of Trt on PZPtcCO2 are illustrated in figure 4.2. Vertical dotted lines separate the
analysis and results into two components (0-40 and 40-60 min). For illustration purposes,
individual levels of EtOH, both with and without the addition of CO2, were compared with the
two treatment controls (Trt 7 = 0.00 mg/kg EtOH, 0.00% CO2; Trt 8= 0.00 mg/kg EtOH,
5.00% CO2) in panels A, B, and C for their effect on PZPtcCO2. The effects of
all EtOH Trts on PZPtcCO2 with no added CO2 are compared in panel D. All EtOH Trts
combined with CO2 are compared for their effects on PZPtcCO2 (panel E). During the first 40
minutes, Trts with CO2 elevated PZPtcCO2 significantly higher than those treatments without
CO2 (panels A, B, and C). Despite EtOH plus CO2 treatments (Trt 2,4, and 6) appearing to

126
Table 4.1. Percent of successfully completed two day trials by anesthetic regimen andtreatment. Ethanol was delivered under anesthesia (isoflurane) by gavage 90 minutes prior todata collection. CO2 was delivered along with anesthetic (isoflurane, 1.75%) utilizing roomair as the carrier gas (0.7 l / min).
AnestheticRegimen
Trt 1 Trt 2 Trt 3 Trt 4 Trt 5 Trt 6 Trt 7 Trt 8
Regimen 1- Induction with 2.5% isoflurane, lowered to 1.75% isoflurane by -10 minutes
Attempts 9 9 10 8 8 9 10 9
% Success 55.55 77.77 50.00 37.5 25.00 22.22 50.00 33.33
Regimen 2- Induction with 1% isoflurane, raised to 1.75% isoflurane by -10 minutes
Attempts 8 2 8 10 10 13 9 14
% Success 62.50 100.00 62.50 60.00 80.00 53.85 66.66 64.28
Overall %Success
58.82 81.82 55.55 50.00 55.55 40.91 57.89 52.17
Treatments: Trt 1= 1.80 mg/kg EtOH, 0.00% CO2; Trt 2 = 1.80 mg/kg EtOH, 5.00% CO2; Trt3= 0.90 mg/kg EtOH, 0.00% CO2; Trt 4 = 0.90 mg/kg EtOH, 0.00% CO2; Trt 5 = 0.18 mg/kgEtOH, 0.00% CO2; Trt 6 = 0.18 mg/kg EtOH, 5.00%; Trt 7= 0.00 mg/kg EtOH, 0.00% CO2;Trt 8= 0.00 mg/kg EtOH, 5.00% CO2.
elevate PZPtcCO2 consistently higher than CO2 alone (Trt 8), only Trt 4 elevated PZPtcCO2
higher than Trt 8 during time points 0-40 (panels B and E). No differences could be
demonstrated between Trt effects on PZPtcCO2 for those Trts containing no CO2 (Trt 1,3,5,
and 7) during time points 0-40 (panel D). No differences could be demonstrated between
DayGrp, PE day, PPE day, nor the interaction of PPE day and Trt or DayGrp and Trt, on
PZPtcCO2 during time points 0-40. The effects of Trt on PZPtcCO2 during the last 20 minutes
differ from those of the first 40 minutes (Fig 4.2). Unlike the first 40 minutes, those Trts
utilizing CO2 (Trt 2, 4, 6 and 8) did not consistently elevate PZPtcCO2 to higher levels over
those Trts without CO2 (Trt 1, 3, 5, 7) during time points 40-60. Treatment 2 did not elevate
PZPtcCO2 higher than that seen for Trt 1 (panel A), nor did Trt 4 elevate PZPtcCO2 higher than
Trt 3 (panel B). However, PZPtcCO2 was lower for Trt 5 than Trt 6 during the last 20 minutes

127
Figure 4.1- Comparison of weight gain between treatments over post embryonic days 30-33.Rat pups were weighed daily prior to testing. Controls represent non-treated litter mates. CO2was delivered under anesthesia (isoflurane, 1.75%) using room air as the carrier gas. Ethanol(EtOH) was delivered by gavage 90 minutes prior to data collection utilizing Ensure® as thevehicle. Treatments: Trt 1= 1.80 mg/kg EtOH, 0.00% CO2n , n = 10; Trt 2 = 1.80 mg/kgEtOH, 5.00% CO2, n = 9; Trt 3= 0.90 mg/kg EtOH, 0.00% CO2, n = 10; Trt 4 = 0.90 mg/kgEtOH, 0.00% CO2, n = 9; Trt 5 = 0.18 mg/kg EtOH, 0.00% CO2, n = 10; Trt 6 = 0.18 mg/kgEtOH, 5.00% CO2, n = 9; Trt 7= 0.00 mg/kg EtOH, 0.00% CO2, n = 11; Trt 8= 0.00 mg/kgEtOH, 5.00% CO2, n = 12. No differences in body weight were demonstrated betweentreatments or controls (P >0.05), Values are means ± SE.
of testing, as was seen in the first 40 minutes (panel C). Additionally, Trt 8 always elevated
PZPtcCO2 above levels induced by Trt 7 during time points 40-60, as it did during time points
0-40 (panels A, B, and C). No differences in PZPtcCO2 could be demonstrated during time
points 40-60, between the effects of Trts which did not contain CO2 (Trt 1, 3, 5, and 7).
Likewise, differences in PZPtcCO2 were not demonstrated for those Trts containing CO2 (Trt
2, 4, 6, and 8), during time points 40-60 (panels D and E). DayGrp and PPE day represented
significant main effects on PZPtcCO2 during time points 40-60. PZPtcCO2 levels for DayGrp 1
(1.26 ± 0.01) were higher than for DayGrp 2 (1.18 ± 0.01). Likewise, PZPtcCO2 levels for PPE
day 1 (1.28 ± 0.01) were higher than for PPE day 2 (1.19 ± 0.01) during time points 40-60.

128
Figure 4.2- Comparison of PZPtcCO2 by treatment. CO2 was delivered under anesthesia(isoflurane, 1.75%) using room air as the carrier gas. Ethanol (EtOH) was delivered by gavage90 minutes prior to time 0 utilizing Ensure® as the vehicle. Treatments: Trt 1= 1.80 mg/kgEtOH, 0.00% CO2n , n = 10; Trt 2 = 1.80 mg/kg EtOH, 5.00% CO2, n = 9; Trt 3= 0.90 mg/kgEtOH, 0.00% CO2, n = 10; Trt 4 = 0.90 mg/kg EtOH, 0.00% CO2, n = 9; Trt 5 = 0.18 mg/kgEtOH, 0.00% CO2, n = 10; Trt 6 = 0.18 mg/kg EtOH, 5.00% CO2, n = 9; Trt 7= 0.00 mg/kgEtOH, 0.00% CO2, n = 11; Trt 8= 0.00 mg/kg EtOH, 5.00% CO2, n = 12. The vertical dottedlines separate the analysis and results into their respective components. No differences weredemonstrated between treatments with letters in common (P > 0.05). Values are means ± SE.
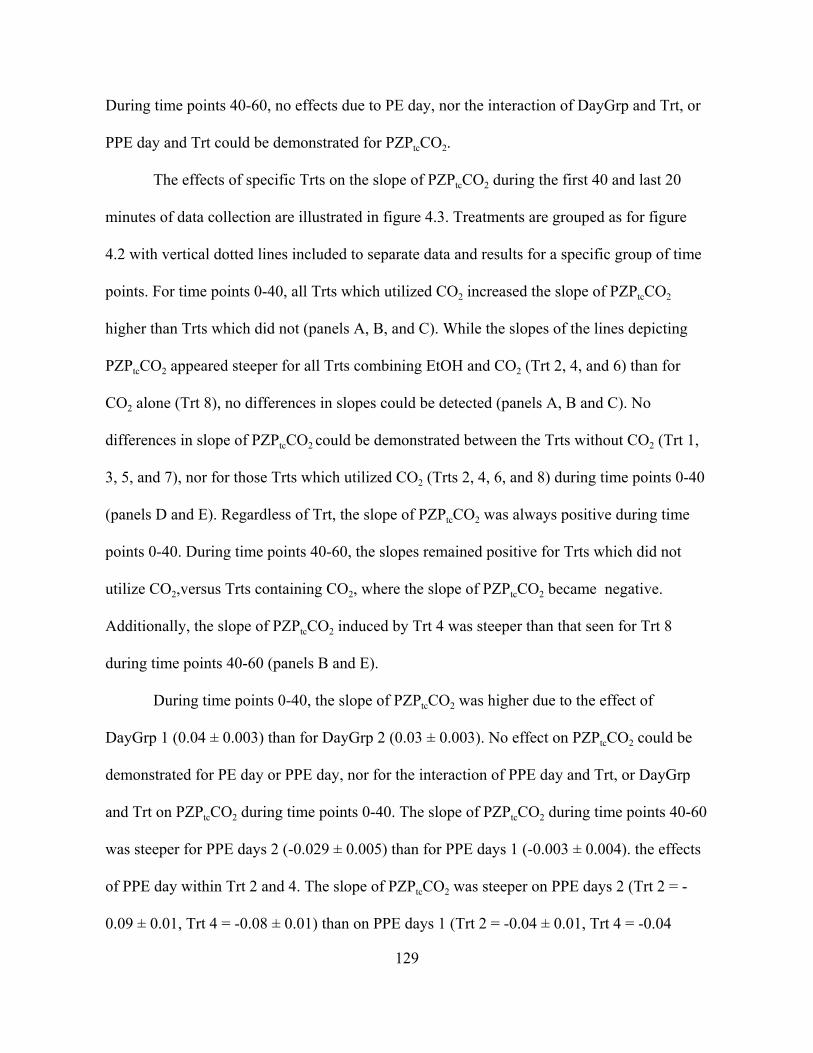
129
During time points 40-60, no effects due to PE day, nor the interaction of DayGrp and Trt, or
PPE day and Trt could be demonstrated for PZPtcCO2.
The effects of specific Trts on the slope of PZPtcCO2 during the first 40 and last 20
minutes of data collection are illustrated in figure 4.3. Treatments are grouped as for figure
4.2 with vertical dotted lines included to separate data and results for a specific group of time
points. For time points 0-40, all Trts which utilized CO2 increased the slope of PZPtcCO2
higher than Trts which did not (panels A, B, and C). While the slopes of the lines depicting
PZPtcCO2 appeared steeper for all Trts combining EtOH and CO2 (Trt 2, 4, and 6) than for
CO2 alone (Trt 8), no differences in slopes could be detected (panels A, B and C). No
differences in slope of PZPtcCO2 could be demonstrated between the Trts without CO2 (Trt 1,
3, 5, and 7), nor for those Trts which utilized CO2 (Trts 2, 4, 6, and 8) during time points 0-40
(panels D and E). Regardless of Trt, the slope of PZPtcCO2 was always positive during time
points 0-40. During time points 40-60, the slopes remained positive for Trts which did not
utilize CO2,versus Trts containing CO2, where the slope of PZPtcCO2 became negative.
Additionally, the slope of PZPtcCO2 induced by Trt 4 was steeper than that seen for Trt 8
during time points 40-60 (panels B and E).
During time points 0-40, the slope of PZPtcCO2 was higher due to the effect of
DayGrp 1 (0.04 ± 0.003) than for DayGrp 2 (0.03 ± 0.003). No effect on PZPtcCO2 could be
demonstrated for PE day or PPE day, nor for the interaction of PPE day and Trt, or DayGrp
and Trt on PZPtcCO2 during time points 0-40. The slope of PZPtcCO2 during time points 40-60
was steeper for PPE days 2 (-0.029 ± 0.005) than for PPE days 1 (-0.003 ± 0.004). the effects
of PPE day within Trt 2 and 4. The slope of PZPtcCO2 was steeper on PPE days 2 (Trt 2 = -
0.09 ± 0.01, Trt 4 = -0.08 ± 0.01) than on PPE days 1 (Trt 2 = -0.04 ± 0.01, Trt 4 = -0.04

130
Figure 4.3- Comparison of slopes of PZPtcCO2 by treatment. CO2 was delivered underanesthesia (isoflurane, 1.75%) using room air as the carrier gas. Ethanol (EtOH) wasdelivered by gavage 90 minutes prior to time 0 utilizing Ensure® as the vehicle. Treatments:Trt 1= 1.80 mg/kg EtOH, 0.00% CO2n , n = 10; Trt 2 = 1.80 mg/kg EtOH, 5.00% CO2, n = 9;Trt 3= 0.90 mg/kg EtOH, 0.00% CO2, n = 10; Trt 4 = 0.90 mg/kg EtOH, 0.00% CO2, n = 9;Trt 5 = 0.18 mg/kg EtOH, 0.00% CO2, n = 10; Trt 6 = 0.18 mg/kg EtOH, 5.00% CO2, n = 9;Trt 7= 0.00 mg/kg EtOH, 0.00% CO2, n = 11; Trt 8= 0.00 mg/kg EtOH, 5.00% CO2, n = 12.The vertical dotted lines separate the analysis and results into their respective components.No differences were demonstrated between treatments with letters in common (P > 0.05).Values are means ± SE.
±0.01) during time points 40-60. Examination of the interaction of PPE day and Trt revealed
significant differences between the effects of PPE day within Trt 2 and 4. The slope of

131
PZPtcCO2 was steeper on PPE days 2 (Trt 2 = -0.09±0.01, Trt 4 = -0.08±0.01) than on PPE
days 1 (Trt 2 = -0.04±0.01, Trt 4 = -0.04±0.01) during time points 40-60. The slope of
PZPtcCO2 was not affected by DayGrp or the interaction of DayGrp and PPE day during time
points 40-60.
Heart Rate (PZHR)
Initial analysis of the data using a restricted model revealed no effect of Anes on
PZHR. Therefore, Anes was not included as a main effect in the statistical model utilized to
test for the effects of Trt, DayGrp, PE day, or PPE day on PZHR. The effects of Trt on PZHR
are illustrated in figure 4.4. During time points 0-40, no differences in effect on PZPtcCO2
could be demonstrated between Trts (panels A-D). However, during time points 40-60 Trt 1
elevated PZHR above Trt 8 (panel A). No differences in effect on PZHR could be
demonstrated between Trts which utilized CO2 (Trts 2, 4, 6, and 8), or those Trts which did
not utilize CO2 (Trts 1, 3, 5, and 7). Differences in PZHR were demonstrated for the main
effect of PPE day, where PZHR was elevated on PPE days 30 and 31 (1.01 ± 0.001) versus
PPE days 32 and 33 (0.99 ± 0.001) during time points 0-40. PPE day also affected PZHR
during time points 40-60, where PZHR on PPE days 30 and 31 (1.04 ± 0.003) was higher than
on PPE days 32 and 33 (0.99 ± 0.002). No effect on PZHR could be demonstrated for
DayGrp, or for the interactions of DayGrp and PPE day, or PPE day and Trt, during any time
points.
The effects of Trt on the slope of PZHR are illustrated in figure 4.5. Although Trt was
significant as a main effect on the slope of PZHR, no differences could be demonstrated
between Trts with Post hoc testing during time points 0-40. Treatment did not affect the slope
of PZHR during time points 40-60. No effects could be demonstrated for DayGrp on the slope
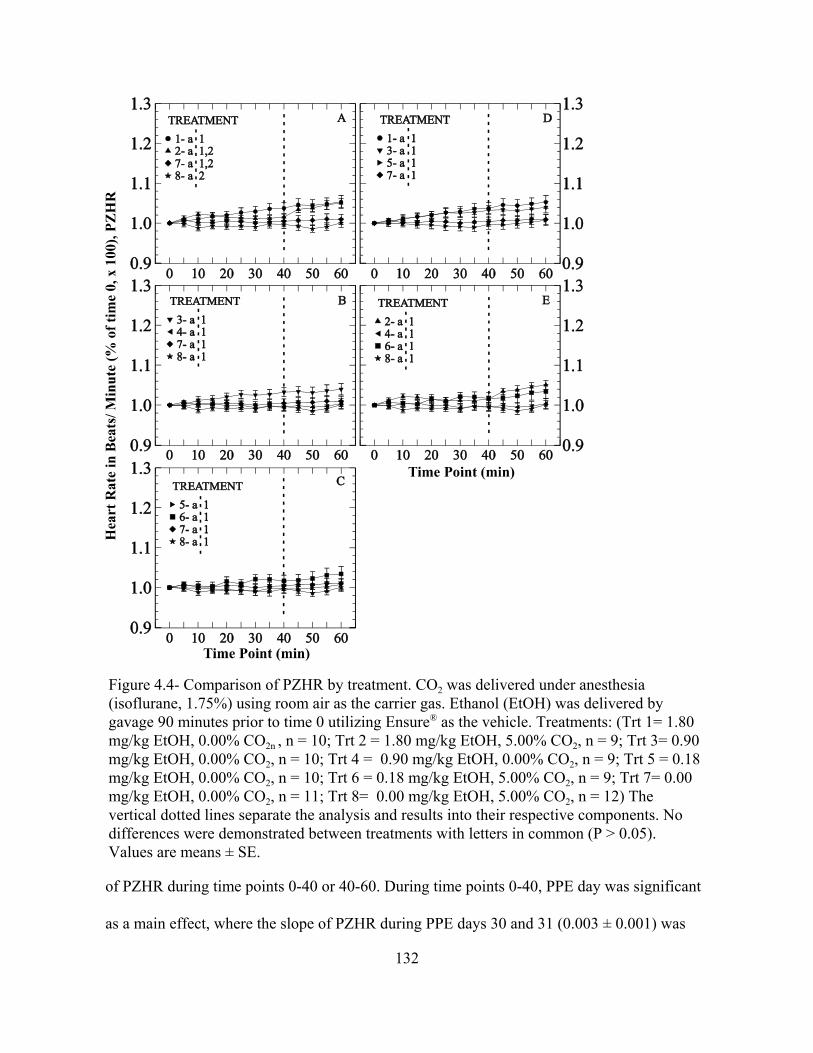
132
Figure 4.4- Comparison of PZHR by treatment. CO2 was delivered under anesthesia(isoflurane, 1.75%) using room air as the carrier gas. Ethanol (EtOH) was delivered bygavage 90 minutes prior to time 0 utilizing Ensure® as the vehicle. Treatments: (Trt 1= 1.80mg/kg EtOH, 0.00% CO2n , n = 10; Trt 2 = 1.80 mg/kg EtOH, 5.00% CO2, n = 9; Trt 3= 0.90mg/kg EtOH, 0.00% CO2, n = 10; Trt 4 = 0.90 mg/kg EtOH, 0.00% CO2, n = 9; Trt 5 = 0.18mg/kg EtOH, 0.00% CO2, n = 10; Trt 6 = 0.18 mg/kg EtOH, 5.00% CO2, n = 9; Trt 7= 0.00mg/kg EtOH, 0.00% CO2, n = 11; Trt 8= 0.00 mg/kg EtOH, 5.00% CO2, n = 12) Thevertical dotted lines separate the analysis and results into their respective components. Nodifferences were demonstrated between treatments with letters in common (P > 0.05).Values are means ± SE.
of PZHR during time points 0-40 or 40-60. During time points 0-40, PPE day was significant
as a main effect, where the slope of PZHR during PPE days 30 and 31 (0.003 ± 0.001) was

133
positive, in contrast to PPE days 32 and 33 (-0.0006 ± 0.0005) where the slope of PZHR was
negative. The interaction of PPE day and Trt 1 on PZHR was also significant, where the slope
of PZHR on PPE days 30 and 31 (0.01 ± 0.002) was steeper than the slope on PPE days 32
and 33 (0.0002 ± 0.001) during time points 0-40. Differences in the slope of PZHR,
attributable to the interaction of PPE day by Trt, were not observed for Trts 2-8.
During time points 40-60, the main effect of PPE day as well as PE day influenced
PZHR. The slope of PZHR was steeper during PPE day 30 and 31 (0.005 ± 0.001) than during
PPE days 32 and 33 (0.0007 ± 0.0009) during time points 40-60. The slope of PZHR on PE
day 30 (0.007 ± 0.001) was steeper than on PE day 32 (0.0002 ± 0.001), as well as on PE day
33 (0.001 ± 0.001), but not steeper than on PE day 31 (0.002 ± 0.001) during time points 40-
60. No effect could be demonstrated for the interaction of PPE day and Trt, on the slope of
PZHR for time points 40-60.
Respiratory Rate (PZRR)
In our restricted model, where Anes could be tested as a main effect, PZRR was lower
for anesthetic regimen 2 (0.86 ± 0.01) than for anesthetic regimen 1 (0.98 ± 0.01) during time
points 0-40. PZRR was also lower for anesthetic regimen 2 (0.78 ± 0.01) than for anesthetic
regimen 1 (0.91 ± 0.01) during time points 40-60. At no time did the interaction of Anes and
Trt have a significant effect on PZRR. Due to Anes having an effect on PZRR, Anes was
included as a main effect in the final model, the results of which follow (Fig 4.6). No
differences in PZRR could be detected between the Trts during time points 0-40 or 40-60 (Fig
4.6, panel A). Furthermore, no other Trts affected PZRR during time points 0-40 or 40-60. No
effect on PZRR could be demonstrated during time points 0-40 or 40-60 for DayGrp, PPE
days, or PE day, as well as the interaction of DayGrp and Trt, or PPE day and Trt.

134
Figure 4.5- Comparison of slopes of PZHR by treatment. CO2 was delivered under anesthesia(isoflurane, 1.75%) using room air as the carrier gas. Ethanol (EtOH) was delivered bygavage 90 minutes prior to time 0 utilizing Ensure® as the vehicle. Treatments: Trt 1= 1.80mg/kg EtOH, 0.00% CO2n , n = 10; Trt 2 = 1.80 mg/kg EtOH, 5.00% CO2, n = 9; Trt 3= 0.90mg/kg EtOH, 0.00% CO2, n = 10; Trt 4 = 0.90 mg/kg EtOH, 0.00% CO2, n = 9; Trt 5 = 0.18mg/kg EtOH, 0.00% CO2, n = 10; Trt 6 = 0.18 mg/kg EtOH, 5.00% CO2, n = 9; Trt 7= 0.00mg/kg EtOH, 0.00% CO2, n = 11; Trt 8= 0.00 mg/kg EtOH, 5.00% CO2, n = 12. The verticaldotted lines separate the analysis and results into their respective components. No differencesin the slope of PZHR were demonstrated between treatments (P > 0.05). Values are means ±SE.
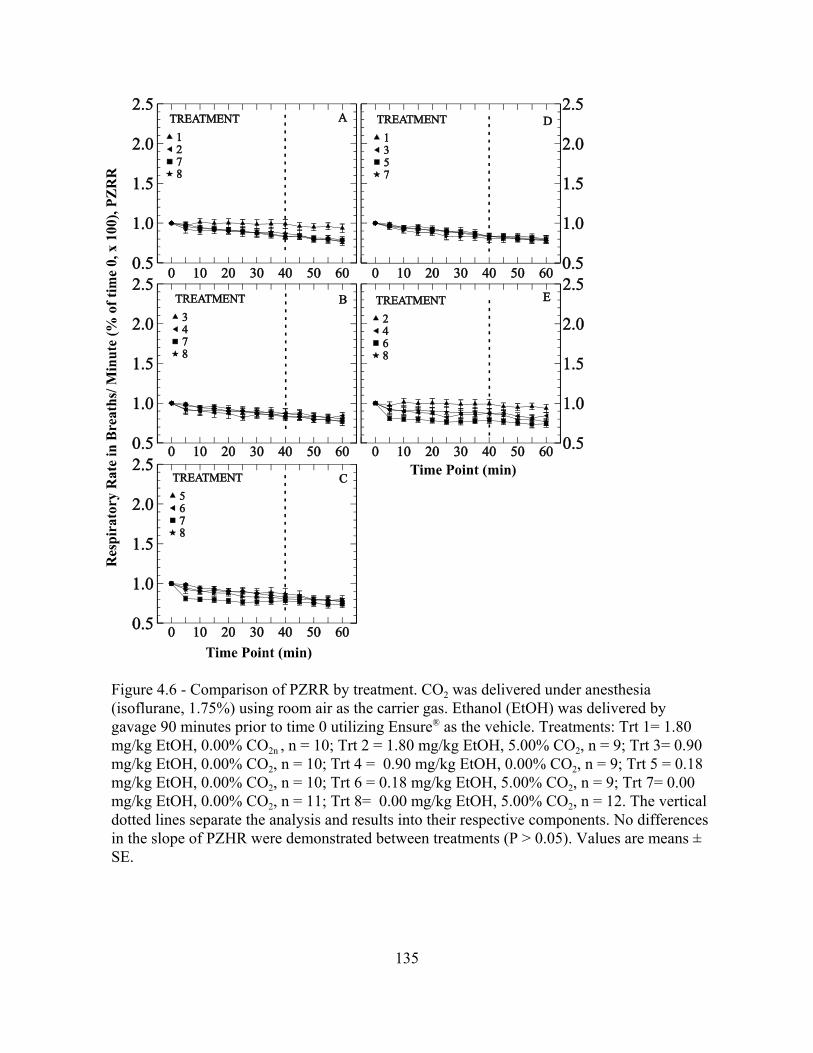
135
Figure 4.6 - Comparison of PZRR by treatment. CO2 was delivered under anesthesia(isoflurane, 1.75%) using room air as the carrier gas. Ethanol (EtOH) was delivered bygavage 90 minutes prior to time 0 utilizing Ensure® as the vehicle. Treatments: Trt 1= 1.80mg/kg EtOH, 0.00% CO2n , n = 10; Trt 2 = 1.80 mg/kg EtOH, 5.00% CO2, n = 9; Trt 3= 0.90mg/kg EtOH, 0.00% CO2, n = 10; Trt 4 = 0.90 mg/kg EtOH, 0.00% CO2, n = 9; Trt 5 = 0.18mg/kg EtOH, 0.00% CO2, n = 10; Trt 6 = 0.18 mg/kg EtOH, 5.00% CO2, n = 9; Trt 7= 0.00mg/kg EtOH, 0.00% CO2, n = 11; Trt 8= 0.00 mg/kg EtOH, 5.00% CO2, n = 12. The verticaldotted lines separate the analysis and results into their respective components. No differencesin the slope of PZHR were demonstrated between treatments (P > 0.05). Values are means ±SE.

136
Respiratory Wave Amplitude (PZAMP)
Examination of the data with the restricted model revealed no effect of Anes on
PZAMP. Therefore, Anes was not included as a main effect in the final statistical model for
investigation of the dependent variable PZAMP. The difference between Trt effects on
PZAMP are illustrated in figure 4.7 where vertical dotted lines separate the analysis and
results into their respective components, as in previous figures. Treatment 2 elevated PZAMP
above that seen for Trt 7 during time points 0-40 (panel A). Additionally, Trt 6 elevated
PZAMP above levels induced by Trts 5 and 7 during time points 0-40 (panel C). No other
differences were seen between Trt effects on PZAMP during time points 0-40 or 40-60. All
Trts which utilized CO2 elevated PZAMP above baseline (Time 0) during time points 5-40
(panel E).
Differences in the level of PZAMP were attributed to the main effect of PPE day,
where PZAMP on PPE days 30 and 31 (1.09 ± 0.007) was lower than on PPE days 32 and 33
(1.19 ± 0.01) during time points 0-40. No effects on PZAMP were observed for the
independent variables DayGrp or PE day during time points 0-40 or 40-60. Furthermore, no
effects on PZAMP could be attributed to the interaction of DayGrp and Trt, or PPE day and
Trt during time points 0-40 or 40-60.
Discussion
In this initial investigation into the pathogenesis of SIDS, we examined
cardiorespiratory responses to EtOH challenge, with and without inhaled CO2, in the juvenile
rat. Characterization of the effects of EtOH on cardiorespiratory responses in the juvenile rat
not only serves our investigation on SIDS, but provides insight into previously unexplored
aspects of the effect of EtOH on juvenile rats. Furthermore, these findings should provide

137
Figure 4.7 - Comparison of PZAMP by treatment. CO2 was delivered under anesthesia(isoflurane, 1.75%) using room air as the carrier gas. Ethanol (EtOH) was delivered bygavage 90 minutes prior to time 0 utilizing Ensure® as the vehicle. Treatments: Trt 1= 1.80mg/kg EtOH, 0.00% CO2n , n = 10; Trt 2 = 1.80 mg/kg EtOH, 5.00% CO2, n = 9; Trt 3= 0.90mg/kg EtOH, 0.00% CO2, n = 10; Trt 4 = 0.90 mg/kg EtOH, 0.00% CO2, n = 9; Trt 5 = 0.18mg/kg EtOH, 0.00% CO2, n = 10; Trt 6 = 0.18 mg/kg EtOH, 5.00% CO2, n = 9; Trt 7= 0.00mg/kg EtOH, 0.00% CO2, n = 11; Trt 8= 0.00 mg/kg EtOH, 5.00% CO2, n = 12. The verticaldotted lines separate the analysis and results into their respective components. Nodifferences were demonstrated between treatments with letters in common (P > 0.05). Valuesare means ± SE.

138
insight into the potential effects of endogenously or exogenously derived EtOH on human
infants.
In the previous experiment (Chapter 3) where pups had to complete three days of
testing for retention in the data set, approximately 70.0% of animals tested successfully
completed the experiment. In contrast, approximately 55.0 % of animals tested successfully
completed the current experiment, yet only two days of testing were required for retention in
the data set. The lower success rate achieved in this experiment was unexpected. Experience
gained in the previous experiment, as well as the reduced number of days required for
inclusion in the data set, should have resulted in more pups successfully completing testing.
The primary difference between the two experiments was the act of gavaging the animals.
Gavage procedures may have irritated the epiglottis and other laryngeal or tracheal structures.
Irritation of these structures may have increased mucus secretion in the laryngeal region.
Initially, anesthetic regimens were similar between the two experiments. The level of inspired
CO2 used in this experiment (5.0%) was also utilized in the previous experiment. Two of the
eight treatments did not include EtOH (Trt 7 and 8), yet the percent of success for those
Treatments was approximately the same as those treatments which included EtOH. Therefore,
we cannot conclude that EtOH was the cause of the reduced success in the current
experiment. Animals in this experiment were briefly anesthetized for gavage approximately
90 minutes prior to testing, an extra anesthetic period not included in the previous experiment.
Although unlikely, we cannot rule out the added anesthetic period as a cause for the reduced
success. Nor can the vehicle (Ensure®) be ruled out, which was administered to all pups
except controls. Only further experimentation including controls for the vehicle, as well as the
139
added anesthetic period, would definitively reveal why the rate of success declined in this
experiment compared with the previous experiment.
Regardless of the inciting cause for the poor success, modifying the anesthetic
regimen substantially increased the percent of successfully tested pups over that observed at
the start of the experiment (Table 3.1). Modifying the anesthetic regimen undoubtedly
introduced unwanted variation into the experiment. However, we felt the change was
warranted, not only to expedite completion of the study, but also to reduce animal use. In our
previous experiment, those animals not completing their three days of testing were excluded,
primarily due to mucus obstruction leading to abnormal breathing patterns. Additionally,
during the previous experiment as well as the current experiment, we occasionally noticed
serous nasal discharge during or after anesthesia. Animals recovered normally with no
observed after effects. Others have reported that volatile gas anesthetics may irritate the nasal
mucosa in a concentration dependant manner (Nishino et al., 1991). Additionally, the level of
mucosal irritation varies between anesthetic gases (Doi and Ikeda, 1993; Delgado-Herrera et
al., 2001). No evidence of serous discharge under the modified anesthetic regimen was
observed. Perhaps irritation caused by the higher isoflurane concentration used at the
beginning of the experiment, along with irritation due to gavage, were additive or even
synergistic. After anesthetic modification, the rate of successful completion approached that
seen in the previous experiment.
Changing the anesthetic regimen also complicated statistical analysis in that every
combination of Trt and DayGrp was not represented in each regimen. Without representatives
from each Trt and DayGrp, the effect of Anes could not be fully quantified for every
treatment. Additionally, in those treatments where the effect of Anes could be statistically

140
examined, treatments were not equally distributed within each anesthetic regimen. However,
inclusion of Anes as a main effect in the statistical model, where Anes exhibited an effect
(PZPtcCO2, PZRR), should serve to account for variability introduced by the change in
anesthetic regimen. Differences in PZPtcCO2 levels and slope of PZPtcCO2 were observed
between anesthetic regimens. Anesthetic regimen 1 induced a steeper slope for PZPtcCO2, as
well as higher levels of PZPtcCO2, compared to anesthetic regimen 2. Results observed for
PZPtcCO2 are compatible with induction of a deeper plane of anesthesia. However, in contrast
to PZPtcCO2, PZRR was higher during anesthetic regimen 1 versus anesthetic regimen 2. If
the pups where anesthetized more deeply during anesthetic regimen 1 than for anesthetic
regimen 2, we would have expected PZRR to have been lower during regimen 1, and
PZPtcCO2 to have been elevated. The apparent discrepancy between PZRR and PZPtcCO2
responses, in relation to anesthetic regimen, can be explained. For anesthetic regimen 1, 62.5
% of pups retained in the data set received the two highest levels of EtOH, versus anesthetic
regimen 2, where only 37.5% of pups received the two highest levels of EtOH. It is known
that EtOH lowers plasma pH and ultimately is metabolized to CO2, which further lowers pH
(Murray et al., 1986; Lands, 1998). As pH decreases, the body should respond by increasing
JVE to eliminate CO2, in an effort to correct the insult (Guyton and Hall, 1996). Higher doses
of EtOH should lower pH more than lower doses. Differences in PZPtcCO2 or PZRR between
anesthetic regimens are therefore likely due to the uneven distribution of samples per
treatment group within the two anesthetic regimens. Prior to future investigations into the role
of EtOH on the pathogenesis of SIDS, anesthetic regimens should be further refined to reduce
or eliminate their effects on the variables in question.
141
The effects of EtOH on human respiration has been investigated (Higgins, 1917; van
de Borne et al., 1997). The ability to detect EtOH effects on respiration varies between
detection methods and test conditions (Dickerman et al., 1968; Bobo, 1972). Moreover, the
effect of EtOH on respiration varies widely with dose, from no detectable effect to respiratory
arrest and death (Dickerman et al., 1968; Bobo, 1972; van de Borne et al., 1997). Modest
doses of EtOH, ranging from 40 -160 mg/dl, appear useful for discerning subtle effects on the
cardiorespiratory system in vivo. There is agreement that modest doses of EtOH depress the
response to CO2 challenge in humans. Whether the effect is mediated through peripheral or
central chemoreceptors is currently unknown (Johnstone and Reier, 1973; Duffin et al., 1978).
Additionally, there is evidence that the effect of EtOH may be mediated through endorphins,
because naloxone administration reversed EtOH induced respiratory depression (Michiels et
al., 1983; Olive et al., 2001). Further complicating matters, EtOH also increases upper airway
resistance, induces apnea, and worsens existing obstructive sleep apnea (Mitler et al., 1988;
Dawson et al., 1993). Finally, as previously noted, EtOH induces metabolic acidosis in
rodents and humans, thereby providing a respiratory stimulus, which may further confound
investigation into the respiratory effects induced by EtOH (Murray et al., 1986; Lien and
Mader, 1999). Adult rats also exhibit hypothermia and hypoxia in response to EtOH at
modest to high levels (100-160 mg/dl) (Murray et al., 1986). To our knowledge, the
cardiorespiratory effects of EtOH, with or without supplemental CO2, have not been
investigated in juvenile rats or human infants.
Results of this study are mixed regarding the effects of EtOH on respiration.
Treatments containing EtOH alone, regardless of dose, never elevated PZPtcCO2 or increased
the slope of PZPtcCO2 above that observed for pups receiving no EtOH or CO2 (Trt 7). Our

142
results agree with those of Murray and coworkers, who measured the arterial partial pressure
of CO2 (PaCO2) in response to moderate EtOH administration in adult rats (Murray et al.,
1986). Their results differed with earlier findings in which EtOH induced elevations in PaCO2;
a difference attributed to their ability to correct for body temperature when hypothermia
falsely elevated PaCO2 (Murray et al., 1986). Ethanol-induced hypothermia was not a factor in
our study, since we controlled the core body temperature throughout the study. While our
results agree with Murray et al., our results suggest a biological difference in PZPtcCO2
between the highest EtOH dose, compared to lower doses or no EtOH. Additionally, Murray
et al. utilized data collected immediately after treatment in their calculations, yet their data
suggested that differences did not start to appear until 60 minutes after gavage (Murray et al.,
1986). Other studies have suggested that EtOH reaches peak BAC levels approximately 1.5
hours after gavage, regardless of the age of the rat (Kelly et al., 1987; Pierce et al., 1993). For
these reasons, we started data collection approximately 90 minutes after gavage. For this
study, results reported included all treatments simultaneously in the statistical model.
However, if we had examined only those treatments without CO2 (Trt 1,3,5, and 7), the
highest dose of EtOH (Trt 1) elevated PZPtcCO2 above that seen for no EtOH (Trt 7) during
time points 0-40 and higher than treatment 5 and treatment 7 during time points 40-60 (data
not shown). If in fact there is a difference in PZPtcCO2 levels induced by the highest does of
EtOH above other treatments not utilizing CO2, then data presented for PZRR (Fig 4.6, panel
D) and PZAMP (Fig 4.7, panel D) suggest that rat pups did not respond effectively to
elevations in PZPtcCO2. Results for PZRR and PZAMP do not suggest that respiration was
suppressed by the highest dose of EtOH, leading to elevations in PZPtcCO2. Rather, results

143
suggest EtOH elevated PZPtcCO2 and simultaneously may have suppressed the ability to
respond by increasing JVE. To our knowledge, this phenomenon has not been reported.
When levels of PZPtcCO2 induced by treatments containing CO2 (Trt 2, 4, 6, and 8) are
compared, results are similar, but not identical, to those reported for treatments lacking CO2.
Only 0.9 mg/kg of EtOH with CO2 (Trt 4) elevated PZPtcCO2 above that seen for CO2 alone
(Trt 8) during time points 0-40. All pups treated with EtOH and CO2, as well as CO2 alone,
responded by increasing PZAMP over baseline at time 0 in an effort to relieve the insult, yet
variation was apparently too great to detect differences between treatments. As for treatments
without CO2, no differences in PZRR could be detected between treatments containing CO2.
We can conclude that EtOH combined with 5.0% CO2 inconsistently elevated PZPtcCO2
above that observed for CO2 alone, and where it did (Trt 4), respiratory responses were
ineffective in relieving the insult, possibly due to the EtOH. Results presented here are
compatible with those observed in adult humans where EtOH decreased the response to CO2
challenge (Johnstone and Reier, 1973; Duffin et al., 1978).
Overall, few treatment effects could be demonstrated for PZHR. Current results are in
general agreement with those in Chapter 3, where PZHR remained unchanged with 5.0% CO2
(Trt 8) or no CO2 (Trt 7) during time points 0-40. In Chapter 3, PZHR elevated significantly
after discontinuation of 5.0 % CO2 during time points 40-60, whereas in the current study
during time points 40-60, PZHR was not significantly elevated after discontinuation of 5.0%
CO2 (Trt 8). The reason for these conflicting findings between the two experiments is unclear.
Anesthesia did not represent a main effect for PZHR during this experiment, however
anesthetic regimen differed between the two experiments, excluding treatments which
contained EtOH. Ethanol doses similar to those used in the current study have been shown to

144
modestly elevate heart rate in humans (Bobo, 1972; van de Borne et al., 1997). Effects in
adult rats are mixed, where EtOH did not alter heart rate in anesthetized rats, but did elevate
heart rate in response to EtOH in unanesthetized non-stressed rats, and conversely depressed
stress-induced tachycardia in unanesthetized rats (Sparrow et al., 1987). Ethanol also
depressed baroreceptor control of heart rate (el-Mas and Abdel-Rahman, 1993). Elevations in
blood CO2 should cause acidosis and depress heart rate (Aberra et al., 2001). Taken together,
the effects of CO2, EtOH, and anesthesia may have opposed one another such that differences
induced by one variable were offset by the others. Ethanol is known to alter heart rate
variability, which is controlled by the combined affects of the sympathetic and
parasympathetic nervous systems (Murata et al., 1994; van de Borne et al., 1997). Data were
collected at four kHz per second to optimize electrocardiographic tracings. As more
sophisticated software is available, the effects of EtOH and CO2 on heart rate variability will
be examined retrospectively using our data.
Unlike our previous study (Chapter 3), comparison of slopes induced by EtOH or
EtOH and CO2 on PZPtcCO2, did not increase our ability to detect differences in PZPtcCO2
over methods utilizing means at each time point. Visually, differences in the slope of
PZPtcCO2 between treatments containing EtOH and CO2 compared with CO2 alone seemed to
exist, yet statistical differences were few. Calculation of slope was primarily useful in Chapter
3 where differences in age were examined. Methods of data capture improved in this
experiment, where data were collected in one minute blocks versus nine second strips in
Chapter 3. Additionally, needle electrodes were used in this experiment, versus alligator
clamp electrodes in the previous experiment. The use of needle electrodes optimized signal
tracings. Identical statistical models were used in both experiments to examine changes in

145
slope. Prior to publication of this data, additional methods of regression analysis will be
evaluated to insure avoidance of type 2 statistical errors.
Results in Chapter 3 revealed clear differences in PZPtcCO2, PZHR and PZRR
between PPE day groups. In the present study, age related changes were not obvious, nor
were they expected to be, since the mean age of animals was lower in this experiment
compared with pups used in Chapter 3. Additionally, pups is this study entered into the testing
paradigm nearly one full postnatal day earlier than in the previous experiment, despite
initiating testing at the same PE days (30 or 31). Differences in PN age were not expected, but
may have resulted from longer average gestation length during the current experiment, or less
likely, from improperly recorded dates of birth. However, subtle-age related differences were
detected for PZPtcCO2, PZHR, and PZAMP as main effects in the statistical model. Generally,
PPE days 30 and 31 exhibited higher PZPtcCO2 and PZHR, and lower PZAMP, versus PPE
days 32 and 33. Additionally, the slope of PZPtcCO2 was steeper for PPE days 32 and 33
versus PPE days 30 and 31, during time points 40- 60. Treatment-specific differences were
only observed for treatments 2 and 4 during time points 40-60, where the slope of PZPtcCO2
was reduced for PPE days 30 and 31, versus PPE days 32 and 33. Results obtained in this
experiment further reinforce conclusions drawn in Chapter 3. Specifically, pups of PE days 30
and 31 have a decreased ability to respond to, as well as recover from, CO2 challenge.
Impaired response and recovery may have been exacerbated by EtOH.
In summary, EtOH combined with CO2 challenge inconsistently elevated PZPtcCO2
more than elevations observed for CO2 challenge alone in rat pups PE days 30-33 days of age.
Furthermore, the respiratory response to elevated PZPtcCO2 was ineffective is lowering
PZPtcCO2, possibly due to attenuation of the respiratory response by EtOH. Finally, EtOH

146
alone elevated PZPtcCO2 without a concurrent depression of respiration, indicating that at the
doses tested, the mechanism by which EtOH elevated PZPtcCO2 is not dependent upon
respiratory depression. These findings suggest that low levels of EtOH may exacerbate the
effects of inhaled CO2 and should be investigated further in relation to their roles in the
pathogenesis of SIDS.
Bibliography
Aberra A, Komukai K, Howarth FC, Orchard CH. 2001. The effect of acidosis on the ECG ofthe rat heart. Experimental Physiology 86:27-31.
Ackerman MJ, Tester DJ, Driscoll DJ. 2001. Molecular autopsy of sudden unexplained deathin the young. American Journal of Forensic Medicine and Pathology 22:105-111.
Arnon SS, Damus K, Thompson B, Midura TF, Chin J. 1982. Protective role of human milkagainst sudden death from infant botulism. The Journal of Pediatrics 100:568-573.
Bach KB, Mitchell GS. 1998. Hypercapnia-induced long-term depression of respiratoryactivity requires alpha2-adrenergic receptors. Journal of Applied Physiology 84:2099-2105.
Biering-Sorensen F, Jorgensen T, Hilden J. 1978. Sudden infant death in Copenhagen 1956--1971. I. Infant feeding. Acta Paediatrica Scandinavica 67:129-137.
Bivin WS, Heinen BN. 1985. Production of ethanol from infant food formulas by commonyeasts. Journal of Applied Bacteriology 58:355-357.
Bobo MW. 1972. Effects of alcohol upon maximum oxygen uptake, lung ventilation, andheart rate. Research Quarterly 43:1-6.
Boles RG, Buck EA, Blitzer MG, Platt MS, Cowan TM, Martin SK, Yoon H-r, Madsen JA,Reyes-Mugica M, Rinaldo P. 1998. Retrospective biochemical screening of fatty acidoxidation disorders in postmortem livers of 418 cases of sudden death in the first yearof life. The Journal of Pediatrics 132:924-933.
Campbell AJ, Bolton DP, Taylor BJ, Sayers RM. 1998. Responses to an increasing asphyxiain infants: effects of age and sleep state. Respiration Physiology 112:51-58.
Carleton JN, Donoghue AM, Porter WK. 1998. Mechanical model testing of rebreathingpotential in infant bedding materials. Archives of Disease in Childhood 78:323-328.

147
Dawson A, Lehr P, Bigby BG, Mitler MM. 1993. Effect of bedtime ethanol on totalinspiratory resistance and respiratory drive in normal nonsnoring men. Alcoholism:Clinical and Experimental Research 17:256-262.
Delgado-Herrera L, Ostroff RD, Rogers SA. 2001. Sevoflurane: approaching the idealinhalational anesthetic. a pharmacologic, pharmacoeconomic, and clinical review.CNS Drug Reviews 7:48-120.
Dickerman JD, Bishop W, Marks JF. 1968. Acute ethanol intoxication in a child. Pediatrics42:837-840.
Doi M, Ikeda K. 1993. Airway irritation produced by volatile anaesthetics during briefinhalation: comparison of halothane, enflurane, isoflurane and sevoflurane. CanadianJournal of Anaesthesia 40:122-126.
Duffin J, Jacobson ER, Orsini EC. 1978. The effect of ethanol on the ventilatory responsesmediated by the peripheral chemoreceptors in man. Canadian Anaesthetists' SocietyJournal 25:181-190.
Dwyer T, Ponsonby A-L, Blizzard L, Newman NM, Cochrane JA. 1995. The contribution ofchanges in the prevalence of prone sleeping position to the decline in sudden infantdeath syndrome in Tasmania. Journal of the American Medical Association 273:783-789.
el-Mas MM, Abdel-Rahman AA. 1993. Direct evidence for selective involvement of aorticbaroreceptors in ethanol-induced impairment of baroreflex control of heart rate. TheJournal of Pharmacology and Experimental Therapeutics 264:1198-1205.
Filiano JJ, Kinney HC. 1994. A perspective on neuropathologic findings in victims of thesudden infant death syndrome: the triple-risk model. Biology of the Neonate 65:194-197.
Folgering H, Boon J. 1986. Ventilatory response to CO2 in infants with alleged sleep apnoea.European Journal of Pediatrics 144:539-544.
Gibson AA. 1992. Current epidemiology of SIDS. Journal of Clinical Pathology 45:7-10.
Guyton AC, Hall JE. 1996. Regulation of acid-base balance. In: Guyton AC, editor. Textbookof Medical Physiology, 9 ed. Philadelphia: W.B. Saunders Company. p 385-403.
Higgins HL. 1917. Effect of alcohol on the respiration and the gaseous metabolism in man.Journal of Pharmacology 9:441-472.
Johnstone RE, Reier CE. 1973. Acute respiratory effects of ethanol in man. ClinicalPharmacology and Therapeutics 14:501-508.

148
Kaji H, Asanuma Y, Ide H, Saito N, Hisamura M, Murao M, Yoshida T, Takahashi K. 1976.The auto-brewery syndrome--the repeated attacks of alcoholic intoxication due to theovergrowth of Candida (albicans) in the gastrointestinal tract. Materia Medica Polona8:429-435.
Kattwinkel J, Brooks JG, Keenan ME, Malloy M. 2000. Changing concepts of sudden infantdeath syndrome: implications for infant sleeping environment and sleep position.American Academy of Pediatrics. Task Force on Infant Sleep Position and SuddenInfant Death Syndrome. Pediatrics 105:650-656.
Katz-Salamon M, Milerad J. 1998. The divergent ventilatory and heart rate response tomoderate hypercapnia in infants with apnoea of infancy. Archives of Disease inChildhood 79:231-236.
Kelly SJ, Bonthius DJ, West JR. 1987. Developmental changes in alcohol pharmacokineticsin rats. Alcoholism: Clinical and Experimental Research 11:281-286.
Kemp JS. 1996. Rebreathing of exhaled gases: importance as a mechanism for the causalassociation between prone sleep and sudden infant death syndrome. Sleep 19:S263-266.
Kemp JS, Thach BT. 1993. A sleep position-dependent mechanism for infant death onsheepskins. American Journal of Diseases of Children 147:642-646.
Kemp PM, Little BB, Bost RO, Dawson DB. 1996. Whole blood levels of dodecanoic acid, aroutinely detectable forensic marker for a genetic disease often misdiagnosed assudden infant death syndrome (SIDS): MCAD deficiency. American Journal ofForensic Medicine and Pathology 17:79-82.
Lands WEM. 1998. A review of alcohol clearance in humans. Alcohol 15:147-160.
Lazoff M, Kauffman F. 1995. Sudden infant death syndrome--Part I: General features.Academic Emergency Medicine 2:926-933.
Lien D, Mader TJ. 1999. Survival from profound alcohol-related lactic acidosis. The Journalof Emergency Medicine 17:841-846.
Light KE, Kane CJM, Pierce DR, Jenkins D, Ge Y, Brown G, Yang H, Nyamweya N. 1998.Intragastric intubation: important aspects of the model for administration of ethanol torat pups during the postnatal period. Alcoholism: Clinical and Experimental Research22:1600-1606.
Malcolm G, Cohen G, Henderson-Smart D. 1994. Carbon dioxide concentrations in theenvironment of sleeping infants. Journal of Paediatrics and Child Health 30:45-49.
149
Michiels TM, Light RW, Mahutte CK. 1983. Effect of ethanol and naloxone on control ofventilation and load perception. Journal of Applied Physiology 55:929-934.
Mitchell EA. 1997. The changing epidemiology of SIDS following the national risk reductioncampaigns. Pediatric Pulmonology. Supplement 16:117-119.
Mitler MM, Dawson A, Henriksen SJ, Sobers M, Bloom FE. 1988. Bedtime ethanol increasesresistance of upper airways and produces sleep apneas in asymptomatic snorers.Alcoholism, Clinical and Experimental Research 12:801-805.
Molony N, Blackwell CC, Busuttil A. 1999. The effect of prone posture on nasal temperaturein children in relation to induction of staphylococcal toxins implicated in suddeninfant death syndrome. FEMS Immunology and Medical Microbiology 25:109-113.
Murata K, Araki S, Yokoyama K, Sata F, Yamashita K, Ono Y. 1994. Autonomicneurotoxicity of alcohol assessed by heart rate variability. Journal of the AutonomicNervous System 48:105-111.
Murray KA, White WJ, Zagon IS. 1986. Ethanol exposure in rats: studies on blood gasconcentrations, pH and temperature. Alcohol 3:5-10.
Nishino T, Tanaka A, Ishikawa T, Hiraga K. 1991. Respiratory, laryngeal, and trachealresponses to nasal insufflation of volatile anesthetics in anesthetized humans.Anesthesiology 75:441-444.
Olive MF, Koenig HN, Nannini MA, Hodge CW. 2001. Stimulation of endorphinneurotransmission in the nucleus accumbens by ethanol, cocaine, and amphetamine.The Journal of Neuroscience 21:RC184.
Oriot D, Berthier M, Saulnier J-P, Blay D, Fohr J-P, Vuillerme V, Saulnier J-B. 1998. Proneposition may increase temperature around the head of the infant. Acta Paediatrica87:1005-1007.
Pierce DR, Serbus DC, Light KE. 1993. Intragastric intubation of alcohol during postnataldevelopment of rats results in selective cell loss in the cerebellum. Alcoholism:Clinical and Experimental Research 17:1275-1280.
Pikkarainen P, Raiha NCR. 1969. Change in alcohol dehydrogenase isoenzyme pattern duringdevelopment of human liver. Nature 222:563-564.
Pikkarainen PH, Raiha NC. 1967. Development of alcohol dehydrogenase activity in thehuman liver. Pediatric Research 1:165-168.
Richardson BA. 1994. Sudden infant death syndrome: a possible primary cause. Journal-Forensic Science Society 34:199-204.

150
Rigatto H. 1984. Control of ventilation in the newborn. Annual Review of Physiology46:661-674.
Riveros-Rosas H, Julian-Sanchez A, Pina E. 1997. Enzymology of ethanol and acetaldehydemetabolism in mammals. Archives of Medical Research 28:453-471.
Ryan EL. 1991. Distribution of expired air in carry cots - a possible explanation for somesudden infant deaths. Australasian Physical & Engineering Sciences in Medicine14:112-118.
Skadberg BT, Markestad T. 1996. Infant behaviour in response to a change in body positionfrom side to prone during sleep. European Journal of Pediatrics 155:1052-1056.
Skadberg BT, Markestad T. 1997. Consequences of getting the head covered during sleep ininfancy. Pediatrics 100:E6.
Skadberg BT, Oterhals A, Finborud K, Markestad T. 1995. CO2 rebreathing: a possiblecontributory factor to some cases of sudden infant death? Acta Paediatrica 84:988-995.
Sparrow MG, Roggendorf H, Vogel WH. 1987. Effect of ethanol on heart rate and bloodpressure in nonstressed and stressed rats. Life Sciences 40:2551-2559.
Stout RW, Cho D-Y, Gaunt SD, Taylor HW, Baker DG. 2001. Transcutaneous blood gasmonitoring in the rat. Comparative Medicine 51:524-533.
van de Borne P, Mark AL, Montano N, Mion D, Somers VK. 1997. Effects of alcohol onsympathetic activity, hemodynamics, and chemoreflex sensitivity. Hypertension29:1278-1283.
Wolin MJ, Yerry S, Miller TL, Zhang Y, Bank S. 1998. Changes in production of ethanol,acids and H2 from glucose by the fecal flora of a 16- to 158-d-old breast-fed infant.The Journal of Nutrition 128:85-90.
Yamamoto T, Kida I. 1996. Application of transcutaneous blood carbon dioxide monitoringto the magnetic resonance imaging of rat. Journal of Medical Engineering &Technology 20:164-168.

151
Chapter 5
Summary

152
Significant scientific and/or practical contributions were derived from each of the
experiments performed. Validation of transcutaneous blood gas monitoring in juvenile rats
provided a practical method for serially monitoring arterial CO2 changes in response to CO2
or ethanol challenge. We suspect that correlation coefficients reported in Chapter 2 for
transcutaneous CO2, were actually higher in subsequent experiments due to our improved
ability to monitor and control body temperature (Peabody et al., 1978). While transcutaneous
blood gas monitoring of CO2 provided valuable data crucial for our results, limitations did
exist. These included slow response times, extended initial stabilization periods, and the
requirement for anesthetic restraint of the rat pup to maintain transcutaneous probe contact.
These limitations were discussed in previous chapters or by others (Yamamoto and Kida,
1996). Isoflurane anesthesia presents an additional limitation for future studies of the
potential role of ethanol in the pathogenesis of SIDS. In Chapter 1 we reviewed the ability of
ethanol to cause apoptosis within the CNS. Isoflurane is one of several anesthetics known to
cause apoptosis in the developing brain. The effect should be addressed prior to future
investigations (Olney et al., 2000).
Our ability to differentiate cardiorespiratory responses in juvenile rats (Chapter 3),
allowed for selection of the appropriately aged pups, for which cardiorespiratory responses
mimicked those reported for 2-4 month old infants. Furthermore, utilization of the juvenile rat
as a model for SIDS benefits from a large literature concerning the metabolism and/or effects
of ethanol. To our knowledge, none of the proposed animal models of SIDS specifically
investigated, or related, the appropriateness of their model to responses observed in normal
infants during the peak incidence period for SIDS.

153
The cardiorespiratory effects of ethanol, with or without supplemental inhaled CO2,
have not been reported in juvenile rats or human infants. Additionally, the potential role of
endogenously produced ethanol in the pathogenesis of SIDS has not been mentioned in the
literature since 1985 (Bivin and Heinen, 1985). Our current literature review, along with
results presented in Chapter 4, suggest a connection between SIDS and endogenous ethanol
production. Unfortunately, differences in cardiorespiratory responses between treatments
which utilized ethanol and CO2, versus CO2 alone, were not as robust as we had hoped for.
This may have been due to variation induced by a change in anesthetic regimen necessary
during the course of the experiment. Alternatively, statistical power may have been too low to
detect subtle differences between treatments. Statistical results from Chapter 4 should be
utilized for statistical power analysis to determine the appropriate numbers of animals needed
for future studies.
Our literature review, as well as experimental results and observations, evoked several
questions worthy of future investigation. In Chapter 2, we discussed the mechanisms of
transcutaneous blood gas technology whereby the heated transcutaneous probe increased O2
and CO2 evolution through the skin for sensing by the probe. Recently, a number of topical
gel compounds were demonstrated to enhance transdermal drug delivery (Willimann et al.,
1992; Orienti et al., 2000; Namdeo and Jain, 2002).These observations may be explained by
alterations of intercellular adhesion in the stratum corneum (Saunders et al., 1999). Oxygen is
reported to be 16 times less liposoluble than CO2 (Braems et al., 1996). Topical gels may also
facilitate the movement of O2 and CO2 toward the transcutaneous probe, thereby shortening
the response time and stabilization period required for transcutaneous data acquisition.
Decreasing the response time and stabilization period might also improve correlation with the

154
partial pressures of O2 and CO2. Therefore, the use of topical gel compounds with
transcutaneous methodology deserves further investigation.
The disadvantages of anesthesia, as well as the need for their use, were discussed in
Chapters 2 - 4. Ideally, further investigations should avoid anesthesia whenever possible.
Remote telemetry has been utilized to measure heart rate, blood pressure, body temperature
and activity levels in a number of species including rats (Schaub and Prinzinger, 1999; Harkin
et al., 2002). There are no currently available commercial systems for measurement of the
partial pressures of O2 or CO2 in any species, nor are there systems available to obtain
multichannel electrocardiograms in rodents. Recently, a telemetric sensor was used to
measure subcutaneous O2 tension in rabbits (Ward et al., 2002). Additionally, Holter
monitors, which record multichannel electrocardiograms, have been used in human and
canines (Saidi et al., 2000; Calvert and Wall, 2001). Holter monitors were found to be ideal
for long term data capture for assessment of heart rate variability (Malik et al., 1996). The
ability to remotely measure changes in arterial O2 and CO2, as well as heart rate variability,
would facilitate future assessment of the relationships between endogenous ethanol, CO2
rebreathing, and SIDS.
Future investigations into the potential role of ethanol, with or without inhaled CO2, in
the pathogenesis SIDS should concentrate on two questions. First, would chronic ethanol
exposure in the juvenile rat (post natal days 2-8), followed by acute inhaled CO2 challenge on
post natal day 9, consistently elevate transcutaneous CO2 levels above levels observed in
Chapter 4? Second, what is the lowest concentration of inhaled CO2 required to cause death in
the juvenile rat model of SIDS, when challenged with the same ethanol doses utilized in
Chapter 5? While many other questions can be formulated, investigation of these questions

155
should provide valuable insight into the potential role of endogenous ethanol production in
the pathogenesis of SIDS.
Bibliography
Bivin WS, Heinen BN. 1985. Production of ethanol from infant food formulas by commonyeasts. Journal of Applied Bacteriology 58:355-357.
Braems G, Lang U, Kunzel W. 1996. Skin blood flow influences the transcutaneous PCO2 (tcPO2) during stress in the guinea pig. Journal of Perinatal Medicine 24:155-161.
Calvert CA, Wall TM. 2001. Correlations among time and frequency measures of heart ratevariability recorded by use of a Holter monitor in overtly healthy Doberman pinscherswith and without echocardiographic evidence of dilated cardiomyopathy. AmericanJournal of Veterinary Research 62:1787-1792.
Harkin A, O'Donnell JM, Kelly JP. 2002. A study of VitalView for behavioural andphysiological monitoring in laboratory rats. Physiology & Behavior 77:65-77.
Malik M, Bigger JT, Camm AJ, Kleiger RE, Malliani A, Moss AJ, Schwartz PJ. 1996. Heartrate variability: standards of measurement, physiological interpretation and clinicaluse. Task Force of the European Society of Cardiology and the North AmericanSociety of Pacing and Electrophysiology. Circulation 93:1043-1065.
Namdeo A, Jain N. 2002. Liquid crystalline pharmacogel based enhanced transdermaldelivery of propranolol hydrochloride. Journal of Controlled Release 82:223-236.
Olney JW, Farber NB, Wozniak DF, Jevtovic-Todorovic V, Ikonomidou C. 2000.Environmental agents that have the potential to trigger massive apoptoticneurodegeneration in the developing brain. Environmental Health Perspectives 108Suppl 3:383-388.
Orienti I, Di Pietra A, Luppi B, Zecchi V. 2000. Crosslinked polyvinylalcohol hydrogels asvehicles for hydrophilic drugs. Archiv der Pharmazie 333:421-424.
Peabody JL, Willis MM, Gregory GA, Tooley WH, Lucey JF. 1978. Clinical limitations andadvantages of transcutaneous oxygen electrodes. Acta AnaesthesiologicaScandinavica. Supplementum 68:76-82.

156
Saidi AS, Moodie DS, Garson A, Jr., Lipshultz SE, Kaplan S, Lai WW, Colan SD, Starc TJ,Shanbhag S, Easley KA, Bricker JT. 2000. Electrocardiography and 24-hourelectrocardiographic ambulatory recording (Holter monitor) studies in childreninfected with human immunodeficiency virus type 1. The Pediatric Pulmonary andCardiac Complications of Vertically Transmitted HIV-1 Infection Study Group.Pediatric Cardiology 21:189-196.
Saunders JCJ, Davis HJ, Coetzee L, Botha S, Kruger AE, Grobler A. 1999. A novel skinpenetration enhancer: evaluation by membrane diffusion and confocal microscopy.Journal of Pharmacy & Pharmaceutical Sciences 2:99-107.
Schaub R, Prinzinger R. 1999. Long-term telemetry of heart rates and energy metabolic rateduring the diurnal cycle in normothermic and torpid African blue-naped mousebirds(Urocolius macrourus). Comparative Biochemistry and Physiology. Part A, Molecularand Integrative Physiology 124:439-445.
Ward WK, Wood MD, Slobodzian EP. 2002. Continuous amperometric monitoring ofsubcutaneous oxygen in rabbit by telemetry. Journal of Medical Engineering &Technology 26:158-167.
Willimann H, Walde P, Luisi PL, Gazzaniga A, Stroppolo F. 1992. Lecithin organogel asmatrix for transdermal transport of drugs. Journal of Pharmaceutical Sciences 81:871-874.
Yamamoto T, Kida I. 1996. Application of transcutaneous blood carbon dioxide monitoringto the magnetic resonance imaging of rat. Journal of Medical Engineering &Technology 20:164-168.

157
Appendix: Letter of Permission

158
Vita
Rhett Whitman Stout was born in Ft. Belvar, Virginia. Shortly thereafter, he moved back
to Oakdale, Louisiana. Rhett moved to DeRidder, Louisiana, in 1970 and graduated from
DeRidder High School in 1977. After graduation, he attended Louisiana State University where
he graduated in 1982 with a Bachelor of Science in horticulture. Following college, Rhett
worked as a Sales Manager for a wholesale nursery. He married Celeste F. Washispack in 1985.
In 1988, Rhett and Celeste moved back to Baton Rouge, Louisiana, for Rhett to pursue
his veterinary medical education. Rhett entered the LSU-School of Veterinary Medicine in 1990
and graduated in 1994 with honors. During the same time frame, Rhett and Celeste had two
children, Cameron (1990)and Mallory (1994). Immediately after graduating from veterinary
school, Rhett entered a residency program in Laboratory Animal Medicine within the Division of
Laboratory Animal Medicine (DLAM), at the LSU- School of Veterinary Medicine. Rhett
completed his residency program in 1996 and was promoted to Chief Clinical Veterinarian for
the DLAM and to an Instructor in the Department of Pathology. Simultaneously, Rhett pursued
his doctorate within the Department of Pathology, which later became the Department of
Pathobiological Sciences.
He is currently a candidate for the Doctor of Philosophy degree in Veterinary Medical
Sciences under the direction of Dr. David G. Baker. Rhett plans to sit for the Laboratory Animal
Medicine board examination in hopes of becoming a Diplomate of the American College of
Laboratory Animal Medicine, as well as continuing his pursuit of future research interest.


![Development of Glucagon Sensitivity Neonatal Rat Liver · activity of ['3P]ATP. Protein was determined fluorometri-cally (18) and adenylate cyclase activity was expressed as picomoles](https://img.dokumen.tips/doc/110x75/5cc4ce6288c993474e8c3ac5/development-of-glucagon-sensitivity-neonatal-rat-liver-activity-of-3patp.jpg)