Embed Size (px)
Citation preview

Development of the Electrical Power System in the Northwest
• Dependence on hydropower - Atlas p. 101
• Early non-federal projects - Skagit, Elwha
• Federal programs: Columbia/Snake R.– rural electrification– job creation– Columbia Basin Project– Bonneville Power Act - 1937– role of BPA vs. BuRec or COE – the BPA preference clause - (1) public utilities, (2) private utilities, (3) DSI’s

Public
InvestorOwnedSystems

Hydro System Principles & Development
• Annual water runoff probabilities
• “Critical water”
• Storage dams w/winter peak snowpack
• Canadian Storage Agreement
• Demand forecasts - PNUCC, BPA
• B:C Analysis & Congressional Support 1940’s through 1960’s
• Role of the Aluminum Industry & DSI’s.


An Historic Drawing of Dam Elevations on the Columbia / Snake
Hanford Reach


Source: Hyde, p. 10


1994 Firm Power Demand
COMMERCIAL 24%
OTHER 1%
RESIDENTIAL 35%
DSI FIRM 11%
NON-DSI FIRM 25%
IRRIGATION 4%
INDUSTRIAL
36%
Source: NWPPC 4th Electric Power Plan, Appendix D

Firm & Non-Firm Electricity Sales
0
10000
20000
30000
40000
50000
1990
1994
1995
2000
2005
2010
2015
Ave
rag
e M
egaw
atts
Non-Firm
Firm
Source: NWPPC 4th Electric Power Plan, Appendix D

Seasonal Load Patterns, 1995
0
5000
10000
15000
20000
25000
30000
35000
40000
45000
50000
Jan. Feb. Mar. Apr. May Jun. Jul. Aug. Sept Oct. Nov. Dec.
Meg
awat
ts
0
10
20
30
40
50
60
70
80
90
100
Loa
d Fa
ctor
PeakAverage EnergyLoad Factor
Source: NWPPC 4th Electric Power Plan, Appendix D

Source: NWPCC 6th Northwest Power Plan, Appendix C

Source: NWPCC 6th Power Plan, Appendix C

Source: NPPC 5th Northwest Electric Power and Conservation Plan,Demand Forecast Appendix

Typical Winter and Summer Weekday Load Shapes
Winter Weekday Load Shape
0
5000
10000
15000
20000
25000
30000
1 3 5 7 9 11 13 15 17 19 21 23
Hour of the Day
Meg
awat
ts
Summer Weekday Load Shape
0
5000
10000
15000
20000
25000
1 3 5 7 9 11 13 15 17 19 21 23
Hour of the Day
Megaw
att
s
Source: NWPPC 4th Electric Power Plan, Appendix D


Evolution of Planning
• PNUCC method of forecasting
• WEC lawsuit
• City Light Energy 1990 Study
• BPA studies vs. NRDC forecast
• Collapse of WPPSS projects - bond defaults in the wake of new forecasts
• Congress creates the NWPPC (Now NPCC)
• NPCC reliance on conservation


The Hydro-Thermal Program• Exhaustion of hydro sites by the late 1960’s
• The Northwest-Southwest Intertie
• Concept of the hydro-thermal program
• Washington Public Power Supply System 0r WPPSS
• BPA Notice of Insufficiency
• Impact of hydro-thermal system on river flows; fisheries/environmentalist lawsuits


BPA vs. NRDC Forecast
Forecast and Reality in Northwest Electrical Power Use
0
20
40
60
80
100
120
140
1950
1960
1970
1975
1980
1990
1995
Actual
- 198
9
bil
lio
ns
of
kw
y/y
r
Residential
Commercial
Industrial
Irrigation
Other

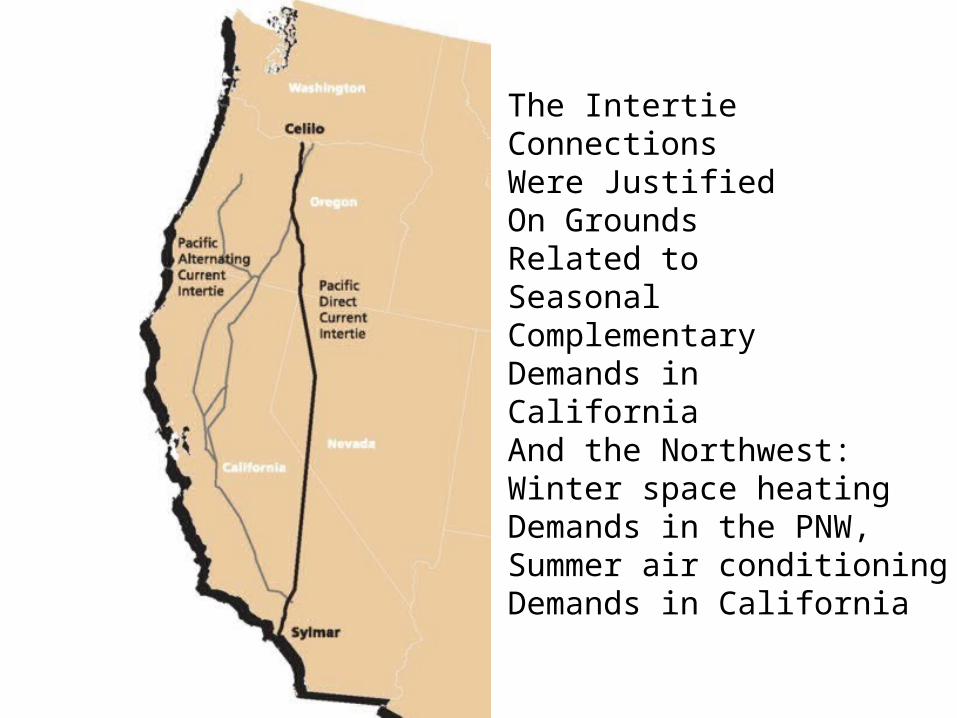
The Intertie ConnectionsWere JustifiedOn Grounds Related to SeasonalComplementaryDemands inCaliforniaAnd the Northwest:Winter space heating Demands in the PNW,Summer air conditioningDemands in California

Source: Draft 6th PWPCC Power Plan, Appendix C

Source: NWPCC 6th Northwest Power Plan, Appendix C

Forecast Demand Growth Compared to Long-term Historical Trends
-2.00
-1.00
0.00
1.00
2.00
3.00
4.00
5.00
6.00
7.00
8.00
1950-60 1960-70 1970-80 1980-94 Low Medlo Medium Medhi High
Ann
ual P
erce
nt G
row
th
1994-2015
Source: NWPPC Draft 4th Electric Power Plan, Appendix D

Source: PWPCC Draft 6th Power Plan, Appendix C

Source: NWPCC 6th Northwest Power Plan, Chapter 1

Source: NWPCC 6th Northwest Power Plan, Chapter 1

Source: NWPCC 6th Northwest Power Plan

Source: NWPCC 6th Northwest Power Plan, Chapter 3

Source: NWPCC Draft 6th Northwest Power Plan, Chapter 3

Source: NWPCC 6th Northwest Power Plan, Chapter 4

Source: NWPCC 6th Northwest Power Plan

Source: NWPCC 6th Northwest Power Plan, Chapter 1

Source: NWPCC 6th Northwest Power Plan, Chapter 2
RPS – Renewable Resource Portfolio Standard

An updated electricity demand forecast from PNPCC

This figure is from the NWPCCmidterm assessmentof the 6th Plan
Much wind power isexported to California
NWPCC expects slower growth in theseexports as photovoltaics areused to meetthe Californiarenewable resource requirement

Other Issues
• Firm versus Interruptible Power
• Traditional long-term sales contracts versus “spot markets”
• Alternative energy sources:–wind, solar, wood
• Deregulation & multi-source competition
• NPCC options approach
• Fish versus power

Old Slides
• The following slides are not for use in class
• They are kept for reference purposes only


Source: NPPC 5th Northwest Electric Power and Conservation Plan,Demand Forecast Appendix