Embed Size (px)
Citation preview

Pharmaceutical Sciences, 2021, 27(1), 76-85doi:10.34172/PS.2020.24https://ps.tbzmed.ac.ir/
Research Article
Development of Sodium Sulfate Induced Water Based Dispersive Liquid–Liquid Microextraction for the Extraction of Four Tricyclic Antidepressants in Urine Samples Prior to Their Determination by Gas Chromatography–Mass Spectrometry
*Corresponding Author: Mohammad Reza Afshar Mogaddam, E-mail: [email protected]; [email protected]©2021 The Author(s). This is an open access article and applies the Creative Commons Attribution License (http://creativecommons.org/licenses/by-nc/4.0/), which permits unrestricted use, distribution, and reproduction in any medium, as long as the original authors and source are cited.
Ali Mohebbi1 , Mir Ali Farajzadeh1,2 , Abolghasem Jouyban3 , Mahboob Nemati4,5 , Mohammad Reza Afshar Mogaddam4,6*
1Department of Analytical Chemistry, Faculty of Chemistry, University of Tabriz, Tabriz, Iran.2Engineering Faculty, Near East University, 99138, Nicosia, North Cyprus, Mersin 10, Turkey.3Pharmaceutical Analysis Research Center and Pharmacy Faculty, Tabriz University of Medical Sciences, Tabriz, Iran.4Food and Drug Safety Research Center, Tabriz University of Medical Sciences, Tabriz, Iran.5Halal Research Center, Ministry of Health and Medical Education, Tehran, Iran.6Drug Applied Research Center, Tabriz University of Medical Sciences, Tabriz, Iran.
AbstractBackground: Because of the narrow therapeutic range of tricyclic antidepressant drugs, their determination in biological samples is of great importance. In this work, a fast and environment friendly sample pretreatment method based on a dispersive liquid–liquid microextraction was developed for the extraction and preconcentration of four tricyclic antidepressants including nortriptyline, amitriptyline, desipramine, and clomipramine in urine prior to their determinations by gas chromatography–mass spectrometry. Methods: In the suggested method, an appropriate mixture of Na2SO4 solution (as phase separation agent and disperser) containing isopropanol (extraction solvent) is rapidly injected into an alkaline aqueous sample solution containing Na2SO4 and the analytes. As a result, a cloudy mixture is formed and the tiny droplets of the extractant containing the extracted analytes are collected on the surface of the aqueous phase after centrifuging. Finally, an aliquot of the collected organic phase is removed and injected into the separation system for the quantitative analysis.Results: Under the optimum conditions, the enrichment factors and extraction recoveries were in the ranges of 380–440 and 76–88%, respectively. The limits of detection and quantification were obtained in the ranges of 11–24, and 41–75 ng/L, respectively. The relative standard deviations of the proposed method were ≤ 6.1% for intra– (n=6) and inter–day (n=4) precisions at a concentration of 100 ng/L of each analyte.Conclusion: The introduced method was satisfactorily utilized for the simultaneous determination of the selected tricyclic antidepressant drugs in the patient’s urine samples.
Article Info
Article History:Received: 11 October 2019Accepted: 14 December 2019ePublished: 18 March 2020
Keywords:-Tricyclic antidepressants-Dispersive liquid–liquid microextraction-Urine-Gas chromatography–mass spectrometry
IntroductionAntidepressant drugs are widely utilized in psychiatric clinics to treat the depression and improve the quality of patient’s life.1 Tricyclic antidepressants (TCAs) are belong to the first generation of psychotropic drugs which are still widely utilized throughout the world in order to treat depression.2 These drugs inhibit the reuptake of serotonin and norepinephrine in the central nervous system.3
Therapeutic drug monitoring is highly recommended to achieve the best therapeutic concentration with at least overdose and adverse problems. The narrow therapeutic
ranges of TCAs has multiplied the importance of their determination in biological samples (plasma, serum or urine) of patients. Therefore, the development of an efficient, environmental friendly, and rapid analytical approach for the quantification of TCAs in biological samples is of great importance. The concentration of these drugs in biological fluids are mostly quantified using chromatographic techniques such as liquid4,5 and gas6, 7 chromatography. However, because of the complex matrices of biological samples and trace levels of the

Mohebbi et al.
77 | Pharmaceutical Sciences, 2021, 27(1), 76-85
analytes in them, an efficient and sensitive pretreatment approach is required before their analysis by above–mentioned analytical instruments. Conventionally, sample preparation is carried out by liquid–liquid extraction or solid–phase extraction. However, both of them have various disadvantages such as consumption of extensive hazardous organic solvents and being tedious and time–consuming8,9 In order to overcome these problems, several pretreatment methods based on solid phase microextraction (SPME)10 and liquid phase microextraction (LPME)11,12 have been developed. SPME is a novel microextraction method that has been used for TCAs.13 This technique is simple, fast, solventless, and efficient but suffers from some drawbacks like fragility and limited life time of fibers and sample carry over. Single drop microextraction (SDME) is the first LPME method in which a single drop of organic solvent is exposed to the headspace or directly into the sample matrix and the analytes can be concentrated into this droplet. Up to now, several reports on the application of this method in determination of TCAs in biological samples14,15 and wastewater16 were published. SDME is limited by the relatively long extraction time as well as droplet instability resulting from the attachment of the microdroplet from the needle when changing extraction conditions. Hollow–fiber liquid–phase microextraction (HF–LPME) is the other sample preparation method in which the analytes are transferred from sample solution into the organic layer filled in the pores of a suspended or directly contacted hollow fiber.17,18 In 2006, a new mode of LPME named dispersive liquid–liquid microextraction (DLLME) has been developed.19 In DLLME, a mixture of extraction and disperser solvents is hastily injected into a sample solution. Consequently, the small droplets of the extractant is formed and the analytes are extracted into them.20-23 DLLME shows several advantages like rapidity, low cost, simplicity of operation, and relatively high recovery and enrichment factors (EFs). Therefore, this method has been used for the determination of organic compounds,19 metal ions,24 and drugs25-28 in different samples. Also, DLLME was used for determination of TCAs in biological samples in the previously published papers.27,29-41 Even though, these method removes the main deficiencies of the customary extraction approaches but it also requires toxic organic solvents like chlorinated or aromatic solvents howbeit much less compared to the previous methods.The aim of the present work was to suggest a new and green version of DLLME without using common disperser and extraction solvents. The proposed method was utilized for the extraction and preconcentration of four TCAs from urine samples before their quantification by gas chromatography–mass spectrometry (GC–MS) in order to achieve high EFs and low limits of detection (LODs). In this method a low toxic organic solvent named isopropanol is used instead of halogenated, aromatic or other toxic solvents consumed in the traditional DLLME. On the other hand, water is used as a disperser solvent in this study. Indeed, in this work a green DLLME method is performed in the presence of Na2SO4 in which water is
used as a disperser in DLLME. As far as we know, this is the first time that water is used as a disperser which makes the proposed method environment friendly. In addition, isopropanol is used as an extraction solvent which is much safer than halogenated solvents utilized in the traditional DLLME. Because of the low density of extractant compared to water, a home–made device was designed and utilized as an extraction vessel to simplify the collection of the extractant after performing the suggested approach.
Materials and MethodsReagents and solutionsDesipramine was supplied from Pars Darou Co. (Tehran, Iran). Amitriptyline and nortriptyline were purchased from Daroupakhsh Co. (Tehran, Iran). Clomipramine and imipramine which used as internal standard (IS) were supplied from Amin Pharmaceutical Co. (Isfahan, Iran). Sodium sulfate (Na2SO4), ammonia (25%), hydrochloric acid (37%), sodium hydroxide, methanol, isopropanol, acetonitrile (ACN), and n–propanol were from Merck (Darmstadt, Germany). A stock solution of analytes was prepared in methanol (10 mg/L of each drug). This solution was diluted with deionized water to prepare working standard solutions. To increase the repeatability of the suggested approach and provide an acceptable precision, imipramine (as an IS) at a concentration of 5 mg/L was added into the extraction solvent throughout this study.
ApparatusThe quantification of the analytes was carried out on an Agilent 6890N gas chromatograph (Agilent Technologies, CA, USA) coupled to a 5973 mass–selective detector. Injection was performed in a pulsed spilt mode (split ratio of 1:10) with a sampling time of 1 min. Helium (99.9999%, Gulf Cryo, United Arab Emirates) was utilized as the carrier gas (at a constant flow rate of 1.0 mL/min). An HP–5MS fused–silica capillary column (5% diphenyl–95% dimethylsiloxane, 30 m × 0.25 mm i.d., and a film thickness of 0.5 µm) (Agilent Technologies, Illinois, USA) was utilized for separation the drugs. The column oven temperature programming was as follows: primary temperature 60 °C (held for 3 min), then ramped at a rate of 15 °C/min to 300 °C (held for 4 min). The ionization was made by electronic impact at 70 eV. The other operational conditions of MS were: ionic source temperature: 250 °C; mass range: m/z 30–400; transfer line temperature: 260 °C; detector voltage: –1700 V; and acquisition rate: 20 Hz. To analysis the analytes, the following ions were opted: m/z 44, 114, and 208 for desipramine; m/z 58, 202, and 215 for amitriptyline; m/z 58, 85, and 269 for clomipramine; m/z 44, 214, and 232 for nortriptyline; and m/z 58, 193, and 234 for IS. Metrohm pH meter model 654 (Herisau, Switzerland) was used in pH measurements. A Hettich centrifuge (model D–7200, Kirchlengern, Germany) was utilized in order to speed up phase separation procedure.
SamplesBlank urine samples were collected from volunteers who had not consumed any drug for about two months. The other samples were obtained from patients who treated

Development of Sodium Sulfate Induced Water Based DLLME
Pharmaceutical Sciences, 2021, 27(1), 76-85 | 78
with a tablet containing 25 mg of each drug, twice a day. All of the samples were collected within 24 h from the first oral administration. The pH of urine samples were adjusted at 10.0 using an ammoniacal buffer (0.5 M) and after that introduced to the suggested approach. All sample donors have been informed on details of the drugs and signed a consent form which was confirmed by the Ethical Committee of Tabriz University of Medical Sciences which was confirmed by the Ethical Committee of Tabriz University of Medical Sciences and registered with the approval code of IR.TBZMED.REC.1397.492.
ProcedureTo 5 mL of ammoniacal buffer (C=0.1 M, pH=10.0) spiked with 20 µg/L of the drugs or pretreated urine sample (see Sec. 2.3) placed into a 10–mL glass test tube, 1.5 g Na2SO4 was added and manually shaken to dissolve. Afterward, 1.0 mL deionized water containing Na2SO4 (30%, w/v) was mixed with 120 µL isopropanol containing 5 mg/L IS and rapidly injected into the sample solution. Consequently, the fine droplets of isopropanol containing the extracted analytes were formed. After centrifuging for 5 min at 5000 rpm, 10 ± 0.5 µL of the organic solvent was collected on the surface of the aqueous phase. 1 μL of this solvent was taken and injected into the GC–MS. The suggested microextraction procedure is schematically presented in Figure 1.
Results and DiscussionIn this step, different experimental parameters affecting the proposed method performance and efficiency such as extraction solvent type and volume, disperser volume, salt concentration in disperser and aqueous phase, pH of aqueous phase, and centrifuging rate and time were carefully investigated and optimized.
Optimization of extraction solvent type and volume Opting an appropriate extractant has a great role in all microextraction methods including DLLME. The performance and selectivity of the proposed method for the studied analytes are strongly affected by this parameter. The selected extraction solvents in the proposed method must meet several criteria including high extraction capability of the selected analytes, the ability to form a separate organic
Figure 1. Procedure and extraction vessel used in the presented method.
phase in the presence of a salt, low solubility in water, being environment friendly, and density lower than water. Considering these characteristics, ACN, isopropanol, and n–propanol were investigated as the extraction solvent in this study. For investigating this parameter, 130 µL of each solvent containing 5 mg/L of IS, is mixed separately with 0.75 mL deionized water containing Na2SO4 (25%, w/v). This solution was rapidly injected into an alkaline aqueous solution (pH=10.0) spiked with the analytes (20 µg/L, each drug) containing Na2SO4 (25%, w/v). By this action, the extraction solvent was dispersed and the tiny droplets of extractant containing the extracted analytes were formed and collected on the surface of the aqueous phase after centrifuging. According to the results (Figure 2), by comparing the ratio of the analyte peak area to the IS peak area for various extraction solvents, isopropanol is the best extractant among the evaluated solvents. Thus, isopropanol was opted for the further experiments.The volume of extractant is another vital parameter that can affect the extraction recoveries (ERs) and EFs of the analytes and subsequently LODs of the proposed approach. To investigate this parameter, different volumes of isopropanol (130, 140, 150, and 160 µL) were investigated.
Figure 2. Selection of extraction solvent. Extraction conditions: aqueous sample volume, 5 mL ammoniacal buffer (C=0.1 M, pH=10.0) spiked with the selected analytes at 20 µg/L of each analyte; extraction solvent volume, 130 µL; disperser solvent (volume), deionized water (0.75 mL); Na2SO4 concentration in disperser and aqueous solution (25%, w/v); centrifugation rate, 5000 rpm; and centrifugation time, 5 min. The error bars show the minimum and maximum of three repeated determinations.

Mohebbi et al.
79 | Pharmaceutical Sciences, 2021, 27(1), 76-85
Considering the outcomes by increasing the volume of isopropanol from 130 to 150 µL, the volume of the collected organic phase was increased (from 10 to 29 µL) and thereby, analytical signals of the proposed method decreased which can be attributed to the dilution effect. Therefore, 130 μL was chosen as the optimum volume of the extractant.
Optimizaton of disperser solvent volumeTo reach high preconcentration of analytes in the suggested method, the optimization of disperser volume is necessary. The main role of the disperser solvent is dispersing the extraction solvent into the aqueous phase in order to afford a very large contact area and accelerates the extraction of the analytes into the extraction solvent. In this work, deionized water was used as a green, environment friendly, and low–cost disperser solvent for dispersing isopropanol into the sample solution as tiny droplets in the presence of Na2SO4. To optimize the volume of disperser, various volumes of deionized water (0.25, 0.50, 0.75, 1.00, and 1.25 mL) were evaluated while the other experimental conditions except isopropanol volume (101, 112, 130, 144, and 157 μL for 0.25, 0.50, 0.75, 1.00, and 1.25 mL of deionized water, respectively) were kept constant. The obtained results (Figure 3) indicate that the extraction efficiency of the proposed method for the target analytes enhances as the volume of the deionized water increases from 0.25 to 1.00 mL and then decreases. So, 1.00 mL of deionized water was opted for the accomplishment of the next experiments.
Salt addition Salt addition is one of the important factors that should be investigated in the microextraction procedures. This phenomenon can decrease the solubility of the extraction solvent into the aqueous sample, which leads to an increase in the volume of the collected phase. Also, salting out effect can be observed for the analytes by reducing the solubility as a result of ionic strength enhancement. The salt addition was used in two parts of the presented work. In this work, Na2SO4 was selected due to its higher solubility into the aqueous sample (0.44 g/mL at 20 °C) compared to the other salts like sodium chloride (0.36 g/mL) and potassium chloride (0.25 g/mL).42 This phenomenon leads to more
Figure 3. Optimization of disperser volume. Extraction conditions: are the same as used in Fig. 2, except iso–propanol was used as the extraction solvent. The error bars show the minimum and maximum of three repeated determinations.
ionic strength enhancement in the presence of Na2SO4. In the first part, Na2SO4 was added into deionized water (disperser) to prevent the reduction of ionic strength of aqueous sample after injection of the mixture of deionized water and isopropanol into it. To optimize this parameter, various concentrations of Na2SO4 (15–40%, w/v) were added into deionized water, while the other parameters, except isopropanol volume (160, 152, 144, 134, 126, and 120 μL of isopropanol for 15, 20, 25, 30, 35, and 40 % w/v, of Na2SO4, respectively) were kept constant during the microextraction procedure. The obtained outcomes (Figure 4) indicate that the extraction efficiency of analytes enhances with increasing Na2SO4 concentration till 30% (w/v) and after that decreases. Thus, 30% (w/v) Na2SO4 was opted for the accomplishment of the next experiments.In the second part, Na2SO4 was added into the aqueous solution in order to evaluate the effect of ionic strength on the extraction efficiency of the selected analytes. In this step, different concentrations of Na2SO4 (15–40%, w/v) were added into the aqueous sample solution. To reach a constant volume of the collected phase (10 µL), the following studies were carried out using various volumes of isopropanol (165, 149, 134, 120, 112, and 105 μL of isopropanol for 15, 20, 25, 30, 35, and 40 %, w/v, of Na2SO4, respectively). As
Figure 4. Optimization of Na2SO4 concentration in disperser. Extraction conditions: are the same as used in Fig. 3, except 1.0 mL deionized water was used as the disperser solvent.
Figure 5. Optimization of ionic strength of aqueous phase. Extraction conditions: are the same as used in Fig. 4, except 30%, w/v, Na2SO4 was dissolved into the disperser.

Development of Sodium Sulfate Induced Water Based DLLME
Pharmaceutical Sciences, 2021, 27(1), 76-85 | 80
shown in Figure 5, the extraction efficiency of the analytes increases with the concentration of Na2SO4 up to 30% and then decreases. So, 30%, w/v, Na2SO4 was selected as the optimum. It should be mentioned that in both parts, in the concentrations less than 15%, w/v of Na2SO4, no organic layer was collected on the aqueous phase.
Study of pHThe pH of aqueous solution can possesses significant influence on the ERs of the analytes which are susceptible to hydrolysis due protonation including the studied drugs. The influence of pH was investigated using different experiments designed by changing pH of aqueous solution from 6 to 12 with the help of 0.1 M HCl or NaOH solutions. The obtained data demonstrated that (Figure 6), the extraction efficiency of drugs improved with the increasing pH till 10.0 and then remained approximately constant. Considering the pKa values of analytes,43,44 at pHs lower than pKa, the analytes were converted to the related conjugated acids and they will have less tendency to be extracted into the extractant. Therefore, the pH of samples was adjusted at 10.0 for subsequent experiments. In the following experiments, an ammoniacal buffer (C=0.5 M, pH=10.0) was utilized for the pH adjustment.
Figure 6. Study of pH effect. Extraction conditions: are the same as used in Fig. 5, except 30%, w/v, Na2SO4 was dissolved into the aqueous phase and its pH was changed in the range of 6–12.
Investigation of centrifuging rate and time Centrifugation is noteworthy procedure in order to achieve a rapid and complete separation of the extractant droplets from sample solution. Rate and time of centrifugation were investigated in the ranges of 2000–7000 rpm and 1–6 min, respectively. The outcomes revealed that the extraction capability of analytes enhanced with increasing centrifugation rate and time till 5000 rpm and 5 min, respectively, and after that remain unchanged. Therefore, 5000 rpm and 5 min were selected for the accomplishment of the next studies.
Method validationIn this step, international guidelines and protocols 45,46 were utilized to validate the suggested approach considering parameters including LOD, limit of quantification (LOQ), intra– and inter–day precisions, linearity, selectivity, EFs and ERs.
Linearity and calibration curvesThe linearity of the developed approach was investigated by preparing matrix–matched calibration curves based on peak area ratio (analyte to IS) versus the analyte concentration. The LOD and LOQ values were evaluated on the basis of the signal–to–noise ratios (S/N) of 3 and 10, respectively. The lower limit of quantification (LLOQ) was reported as the lowest concentration on the calibration curve that could be determined with a relative standard deviation (RSD) ≤ 20% and an accuracy of 80–120%. The outcomes are listed in Table 1. Broad linearities were achieved with coefficients of determination ≥0.9993.
SelectivitySelectivity studies evaluate the effects of interferences which can potentially be available in urine to indicate the ability of the approach to measure the analytes in the presence of these components. In order to investigate this parameter, six urine samples from various volunteers who expressed that they had not taken drugs were analyzed. The responses of the analytes were compared with those of the analytes at the LLOQ. No significant interference was observed at the retention times and peaks areas of the analytes.
Analyte LOD a) LOQ b) LLOQ c) LR d) r2 e)RSD% f)
EF ± SD g) ER ± SD h) Intra–day Inter–day
Amitriptyline 13 47 22 22–2000000 0.9996 4.2 5.5 440 ± 25 88 ± 5
Nortriptyline 24 75 37 37–2000000 0.9994 3.3 6.1 380 ± 15 76 ± 3
Desipramine 11 41 19 19–2000000 0.9993 2.3 5.4 380 ± 15 76 ± 3
Clomipramine 15 49 26 26–2000000 0.9993 4.1 5.3 405 ± 20 81 ± 4a) Limit of detection (S/N=3) (ng/L). b) Limit of quantification (S/N=10) (ng/L).c) Lower limit of quantification (S/N=5) (ng/L).d) Linear range (ng/L).e) Coefficient of determination. f) Relative standard deviation for intra– (n=6) and for inter–day (n=4) precisions at a concentration of 100 ng/L of each analyte.g) Enrichment factor ± standard deviation (n=3).h) Extraction recovery ± standard deviation (n=3).
Table 1. Quantitative features of the developed method for the selected TCAs.

Mohebbi et al.
81 | Pharmaceutical Sciences, 2021, 27(1), 76-85
Precision and accuracyIn fact, the precision is expressed as the measurement of the random errors. The precision of the approach defined as RSD was investigated by doing the approach on six (for intra–day) and four (for inter–day) quality control (QC) samples at a concentration of 100 ng/L of each drug and ranged from 2.3–4.2 and 5.3–6.1%, respectively.
Calculation of EF and EREF and ER have been utilized for investigating theperformance of the suggested approach. EF is expressed as
Table 2. Study of matrix effect in the proposed method in the blank urine sample spiked at different concentrations.
Analyte Added(ng/L
Found (ng/L)
Mean relative recovery ± standard deviation (n=3)
Amitriptyline100 82 ± 3 82 ± 3200 188 ± 8 94 ± 4500 450 ± 15 90 ± 3
Nortriptyline100 91 ± 3 91 ± 3200 186 ± 4 93 ± 2500 455 ± 20 91 ± 4
Desipramine100 89 ± 2 89 ± 2200 186 ± 6 93 ± 3500 450 ± 15 90 ± 3
Clomipramine100 89 ± 3 89 ± 3200 168 ± 10 84 ± 5500 450 ± 10 90 ± 2
Figure 7. Typical GC–SIM–MS chromatograms of (a) blank urine sample, (b) urine sample of a patient treated with amitriptyline, (c) urine sample of a patient treated with nortriptyline, (d) urine sample of a patient treated with desipramine (e) urine sample of a patient treated with clomipramine, and (f) direct injection of standard solution of the selected analytes at a concentration of 10 mg/L of each analyte and IS at a concentration of 5 mg/L prepared in methanol. Peak identification, 1) amitriptyline, 2) nortriptyline, 3) imipramine (IS), 4) desipramine, 5) clomipramine.
found concentrations of clomipramine, desipramine, nortriptyline, and amitriptyline in the mentioned urine samples were 6.3 ± 0.4, 4.8 ± 0.2, 5.9 ± 0.1, and 7.3 ± 0.3 µg/L, respectively. To investigate matrix effect in blank urine sample, the added–found method was utilized and sample was spiked with drugs at three concentrations (100, 200, and 500 ng/L). Mean relative recoveries (the recoveries obtained for the analytes in the urine sample compared to those obtained in deionized water spiked at the related concentrations) were calculated and summarized in Table 2. Considering the outcomes, this method presents good relative recoveries ranging from 82–94%.
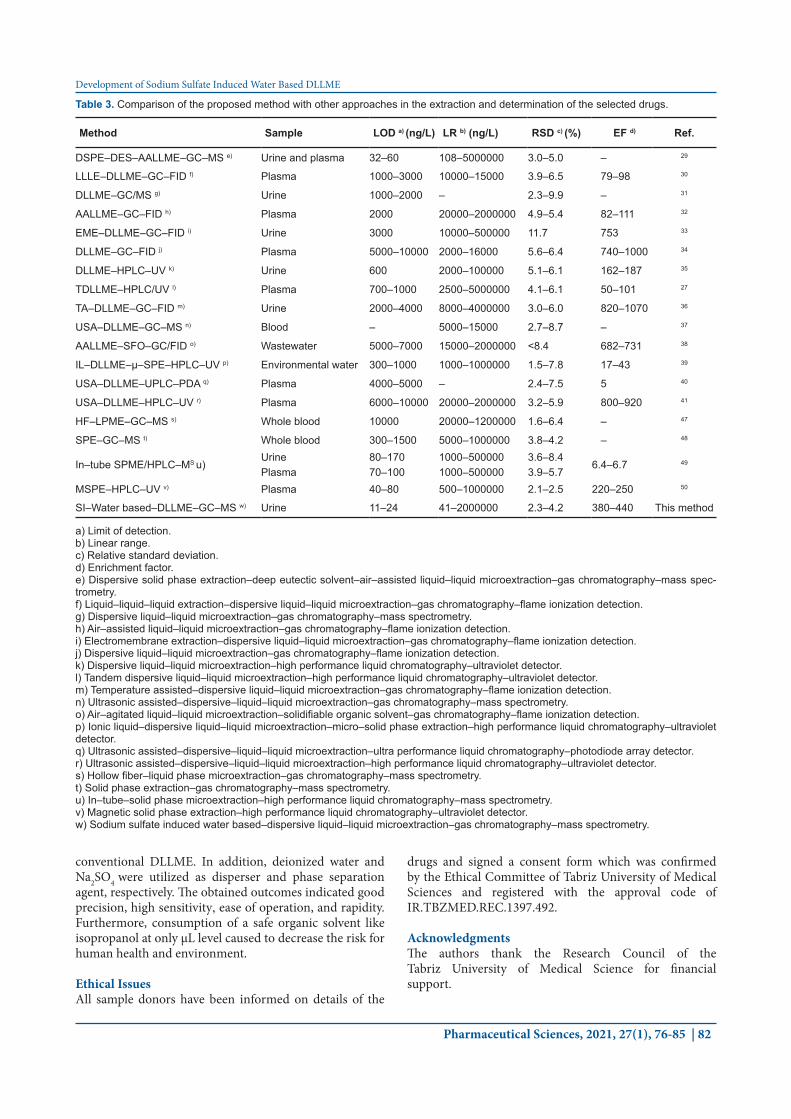
Comparison of the developed approach with othersThe figures of merit of the introduced approach in quantification of studied drugs were compared with those of the published approaches considering LOD, LR, RSD, and EF and the data are summarized in Table 3. As it can be seen, the RSDs, LODs, and EFs of the suggested approach are comparable or better than those reported for the other approaches. These outcomes indicate that the introduced approach is efficient, sensitive, and reliable technique for the extraction of the analytes from urine samples. ConclusionIn this study, an efficient and green microextraction method in combination with GC–MS was introduced for extraction and determination of four TCAs in human urine samples. In the suggested approach isopropanol was utilized as an extractant instead of highly toxic solvents utilized in
/ 0EF C Ccoll=
100 100 1000 0
n c v vcoll coll coll collER EFn c v vaq aq
×= × = × = × ×
×
the ratio of the analyte concentration in the collected phase (Ccoll) found from calibration curve equation to its primary concentration in the aqueous solution (C0): ER is expressed as the percentage of the total analyte amount (n0) which is extracted into the collected phase (ncoll):Where Vcoll and Vaq are volumes of the collected organic phase and aqueous solution, respectively. As it can be seen from Table 1, high EFs and ERs in the ranges of 380–440 and 76–88%, respectively, are obtainable.
Real samples analysisUsability of the introduced approach was evaluated by analyzing four urine samples collected from patients who had treated with a tablet containing 25 mg of each drug twice a day. It should be mentioned that each patient only had consumed one of the studied drugs. Figure 7 reveals typical GC–selected ions monitoring (SIM)–MS chromatograms of patients urine samples after carrying out the introduced approach along with a blank urine sample and direct injection of a standard solution of analytes (25 mg/L) and IS (5 mg/L) prepared in methanol. After three determinations of each sample using standard addition method, the
Eq. (1)
Eq. (2)
Development of Sodium Sulfate Induced Water Based DLLME
Pharmaceutical Sciences, 2021, 27(1), 76-85 | 82
Table 3. Comparison of the proposed method with other approaches in the extraction and determination of the selected drugs.
Method Sample LOD a) (ng/L) LR b) (ng/L) RSD c) (%) EF d) Ref.
DSPE–DES–AALLME–GC–MS e) Urine and plasma 32–60 108–5000000 3.0–5.0 – 29
LLLE–DLLME–GC–FID f) Plasma 1000–3000 10000–15000 3.9–6.5 79–98 30
DLLME–GC/MS g) Urine 1000–2000 – 2.3–9.9 – 31
AALLME–GC–FID h) Plasma 2000 20000–2000000 4.9–5.4 82–111 32
EME–DLLME–GC–FID i) Urine 3000 10000–500000 11.7 753 33
DLLME–GC–FID j) Plasma 5000–10000 2000–16000 5.6–6.4 740–1000 34
DLLME–HPLC–UV k) Urine 600 2000–100000 5.1–6.1 162–187 35
TDLLME–HPLC/UV l) Plasma 700–1000 2500–5000000 4.1–6.1 50–101 27
TA–DLLME–GC–FID m) Urine 2000–4000 8000–4000000 3.0–6.0 820–1070 36
USA–DLLME–GC–MS n) Blood – 5000–15000 2.7–8.7 – 37
AALLME–SFO–GC/FID o) Wastewater 5000–7000 15000–2000000 <8.4 682–731 38
IL–DLLME–µ–SPE–HPLC–UV p) Environmental water 300–1000 1000–1000000 1.5–7.8 17–43 39
USA–DLLME–UPLC–PDA q) Plasma 4000–5000 – 2.4–7.5 5 40
USA–DLLME–HPLC–UV r) Plasma 6000–10000 20000–2000000 3.2–5.9 800–920 41
HF–LPME–GC–MS s) Whole blood 10000 20000–1200000 1.6–6.4 – 47
SPE–GC–MS t) Whole blood 300–1500 5000–1000000 3.8–4.2 – 48
In–tube SPME/HPLC–MS u)Urine 80–170 1000–500000 3.6–8.4
6.4–6.7 49
Plasma 70–100 1000–500000 3.9–5.7MSPE–HPLC–UV v) Plasma 40–80 500–1000000 2.1–2.5 220–250 50
SI–Water based–DLLME–GC–MS w) Urine 11–24 41–2000000 2.3–4.2 380–440 This method
a) Limit of detection.b) Linear range. c) Relative standard deviation.d) Enrichment factor.e) Dispersive solid phase extraction–deep eutectic solvent–air–assisted liquid–liquid microextraction–gas chromatography–mass spec-trometry.f) Liquid–liquid–liquid extraction–dispersive liquid–liquid microextraction–gas chromatography–flame ionization detection.g) Dispersive liquid–liquid microextraction–gas chromatography–mass spectrometry.h) Air–assisted liquid–liquid microextraction–gas chromatography–flame ionization detection.i) Electromembrane extraction–dispersive liquid–liquid microextraction–gas chromatography–flame ionization detection.j) Dispersive liquid–liquid microextraction–gas chromatography–flame ionization detection.k) Dispersive liquid–liquid microextraction–high performance liquid chromatography–ultraviolet detector. l) Tandem dispersive liquid–liquid microextraction–high performance liquid chromatography–ultraviolet detector.m) Temperature assisted–dispersive liquid–liquid microextraction–gas chromatography–flame ionization detection.n) Ultrasonic assisted–dispersive–liquid–liquid microextraction–gas chromatography–mass spectrometry.o) Air–agitated liquid–liquid microextraction–solidifiable organic solvent–gas chromatography–flame ionization detection.p) Ionic liquid–dispersive liquid–liquid microextraction–micro–solid phase extraction–high performance liquid chromatography–ultraviolet detector.q) Ultrasonic assisted–dispersive–liquid–liquid microextraction–ultra performance liquid chromatography–photodiode array detector. r) Ultrasonic assisted–dispersive–liquid–liquid microextraction–high performance liquid chromatography–ultraviolet detector. s) Hollow fiber–liquid phase microextraction–gas chromatography–mass spectrometry.t) Solid phase extraction–gas chromatography–mass spectrometry.u) In–tube–solid phase microextraction–high performance liquid chromatography–mass spectrometry.v) Magnetic solid phase extraction–high performance liquid chromatography–ultraviolet detector. w) Sodium sulfate induced water based–dispersive liquid–liquid microextraction–gas chromatography–mass spectrometry.
conventional DLLME. In addition, deionized water and Na2SO4 were utilized as disperser and phase separation agent, respectively. The obtained outcomes indicated good precision, high sensitivity, ease of operation, and rapidity. Furthermore, consumption of a safe organic solvent like isopropanol at only µL level caused to decrease the risk for human health and environment.
Ethical IssuesAll sample donors have been informed on details of the
drugs and signed a consent form which was confirmed by the Ethical Committee of Tabriz University of Medical Sciences and registered with the approval code of IR.TBZMED.REC.1397.492.
AcknowledgmentsThe authors thank the Research Council of the Tabriz University of Medical Science for financial support.

Mohebbi et al.
83 | Pharmaceutical Sciences, 2021, 27(1), 76-85
Conflict of InterestThe authors declare that they have no conflict of interest.
References 1. Parfitt K, Martindale E. The Complete Drug Reference.
33rd edition, London: Pharmaceutical Press, 2002.2. Furlanut M, Benetello P, Spina E. Pharmacokinetic
optimization of tricyclic antidepressant therapy. Clin Pharmacokinet. 1993;24:301-18. doi:10.2165/00003088 –199324040–00004
3. Stahl SM. Basic psychopharmacology of antidepressants, part 1: Antidepressants have seven distinct mechanisms of action. J Clin Psychiatry. 1998;59:5-14.
4. Woźniakiewicz M, Wietecha–Posłuszny R, Garbacik A, Kościelniak P. Microwave–assisted extraction of tricyclic antidepressants from human serum followed by high performance liquid chromatography determination. J Chromatogr A. 2008;1190:52–6. doi:10.1016/j.chroma.2008.03.013
5. Fernández–Navarro JJ, Ruiz–Ángel MJ, García–Álvarez–Coque MC. Reversed–phase liquid chromatography without organic solvent for determination of tricyclic antidepressants. J Sep Sci. 2012;35:1303-9. doi:10.1002/jssc.201101106
6. Gifford LA, Turner P, Pare CMB. Sensitive method for the routine determination of tricyclic antidepressants in plasma using a specific nitrogen detector. J Chromatogr A. 1975;105:107–13. doi:10.1016/S0021–9673(01)81094–3
7. Mohebbi A, Farajzadeh MA, Yaripour S, Afshar Mogaddam MR. Determination of tricyclic antidepressants in human urine samples by the three–step sample pretreatment followed by HPLC–UV analysis: an efficient analytical method for further pharmacokinetic and forensic studies. EXCLI J. 2018;17:952-63. doi:10.17179/excli2018–1613
8. Yazdi AS, Amiri A. Liquid–phase microextraction. Trends Anal Chem. 2010;29:1-14. doi:10.1016/j.trac.2009.10.003
9. Plotka–Wasylka J, Szczepanska N, Guardia M, Namiesnik J. Miniaturized solid–phase extraction techniques. Trends Anal Chem. 2015;73:19-38. doi:10.1016/j.trac.2015.04.026
10. Penalver A, Pocurull E, Borrull F, Marce RM. Trends in solid–phase microextraction for determining organic pollutants in environmental samples. Trends Anal Chem. 1999;18:557-62. doi:10.1016/S0165–9936(99)00145–4
11. Farajzadeh MA, Mohebbi A, Pazhohan A, Nemati M, Afshar Mogaddam MR. Air–assisted liquid–liquid microextraction; principles and applications with analytical instruments. Trend Anal Chem. 2020;122:115734. doi:10.1016/j.trac.2019.115734
12. Yilmaz E, Soylak M. Latest trends, green aspects and innovations in liquid–phase–based microextraction techniques: a review. Turk J Chem. 2016;40:868-93. doi:10.3906/kim–1605–26
13. Xu R, Lee HK. Application of electro–enhanced solid phase microextraction combined with gas chromatography–mass spectrometry for the determination of tricyclic antidepressants in environmental water samples. J Chromatogr A. 2014;1350:15-22. doi:10.1016/j.chroma.2014.05.024
14. Yazdi AA, Razavi N. Separation and determination of amitriptyline and nortriptyline in biological samples using single–drop microextraction with GC. Chromatographia. 2011;73:549-57. doi:10.1007/ s10337–010–1900–7
15. Wu HF, Kailasa SK, Yan JY, Chin CC, Ku HY. Comparison of single–drop microextraction with micro–volume pipette extraction directly coupled with capillary electrophoresis for extraction and separation of tricyclic antidepressant drugs. J Ind Eng Chem. 2014;20:2071-6. doi:10.1016/j.jiec.2013.09.034
16. Hamed Mosavian MT, Es’haghi Z, Razavi N, Banihashemi S. Pre–concentration and determination of amitriptyline residues in waste water by ionic liquid based immersed droplet microextraction and HPLC. J Pharm Anal. 2012;5:361-65. doi:10.1016/j.jpha.2012.07.007
17. Esrafili A, Yamini Y, Shariati S. Hollow fiber–based liquid phase microextraction combined with high–performance liquid chromatography for extraction and determination of some antidepressant drugs in biological fluids. Anal Chim Acta. 2007;604:127-33. doi:10.1016/j.aca.2007.10.012
18. Ghambarian M, Yamini Y, Esrafili A. Three–phase hollow fiber microextraction based on two immiscible organic solvents for determination of tricyclic antidepressant drugs: Comparison with conventional three–phase hollow fiber microextraction. J Chromatogr A. 2012;1222:5-12. doi:10.1016/j.chroma.2011.11.055
19. Rezaee M, Assadi Y, Hosseini MRM, Aghaee E, Ahmadi F, Berijani S. Determination of organic compounds in water using dispersive liquid–liquid microextraction. J Chromatogr A. 2006;1116:1-9. doi:10.1016/j.chroma.2006.03.007
20. Jouyban A, Farajzadeh MA, Afshar Mogaddam MR. Dispersive liquid–liquid microextraction based on solidification of deep eutectic solvent droplets for analysis of pesticides in farmer urine and plasma by gas chromatography–mass spectrometry. J Chromatogr B 2019;1124:114-21. doi:10.1016/j.jchromb.2019.06.004
21. Mousa A, Basheer C, Al–Arfaj AR. Determination of phthalate esters in bottled water using dispersive liquid–liquid microextraction coupled with GC–MS. J Sep Sci. 2013;36:2003-9. doi:10.1002/jssc.201300163
22. Xiong C, Ruan J, Cai Y, Tang Y. Extraction and determination of some psychotropic drugs in urine samples using dispersive liquid–liquid microextraction followed by high–performance liquid chromatography. J Pharm Biomed Anal. 2009;49:572-8. doi:10.1016/j.jpba.2008.11.036

Development of Sodium Sulfate Induced Water Based DLLME
Pharmaceutical Sciences, 2021, 27(1), 76-85 | 84
23. Suh JH, Lee YY, Lee HJ, Kang M, Hur Y, Lee SN, Yang DH, Han S.B. Dispersive liquid–liquid microextraction based on solidification of floating organic droplets followed by high performance liquid chromatography for the determination of duloxetine in human plasma. J Pharm Biomed Anal. 2013;75:214-9. doi:10.1016/j.jpba.2012.11.041
24. El–Shahawi MS, Al–Saidi HM. Dispersive liquid–liquid microextraction for chemical speciation and determination of ultra–trace concentrations of metal ions. Trend Anal Chem. 2013;44:12-24. doi:10.1016/j.trac.2012.10.011
25. Akramipour R, Fattahi N, Pirsaheb M, Gheini S. Combination of counter current salting–out homogenous liquid–liquid extraction and dispersive liquid–liquid microextraction as a novel microextraction of drugs in urine samples. J Chromatogr B. 2016;1012-1013:162-8. doi:10.1016/j.jchromb.2016.01.031
26. Ezoddin M, Abdi K. Monitoring of antifungal drugs in biological samples using ultrasonic–assisted supramolecular dispersive liquid–liquid microextraction based on solidification of a floating organic droplet. J Chromatogr B. 2016;1027:74-80. doi:10.1016/j.jchromb.2016.05.025
27. Bazregar M, Rajabi M, Yamini Y, Saffarzadeh Z, Asghari A. Tandem dispersive liquid–liquid microextraction as an efficient method for determination of basic drugs in complicated matrices. J Chromatogr A. 2016;1429:13-21. doi:10.1016/j.chroma.2015.11.087
28. Safari M, Shamsipur M, Zohrabi P, Ebrahimzadeh H. Solid–phase extraction combined with dispersive liquid–liquid microextraction/HPLC–UV as a sensitive and efficient method for extraction, pre–concentration and simultaneous determination of antiretroviral drugs nevirapine, efavirenz and nelfinavir in pharmaceutical formulations and biological samples. J Pharm Biomed Anal. 2019;166:95-104. doi:10.1016/j.jpba.2019.01.003
29. Mohebbi A, Yaripour S, Farajzadeh MA, Afshar Mogaddam MR. Combination of dispersive solid phase extraction and deep eutectic solvent–based air–assisted liquid–liquid microextraction followed by gas chromatography–mass spectrometry as an efficient analytical method for the quantification of some tricyclic antidepressant drugs in biological fluids. J Chromatogr A. 2018;1571:84-93. doi:10.1016/j.chroma.2018.08.022
30. Farajzadeh MA, Abbaspour M. Development of new extraction method based on liquid–liquid–liquid extraction followed by dispersive liquid–liquid microextraction for extraction of three tricyclic antidepressants in plasma samples. Biomed Chromatogr. 2018;32:e4251. doi:10.1002/bmc.4251
31. Ito R, Ushiro M, Takahashi Y, Saito K, Ookubo T, Iwasaki Y, Nakazawa H. Improvement and validation the method using dispersive liquid–liquid microextraction with in situ derivatization followed
by gas chromatography–mass spectrometry for determination of tricyclic antidepressants in human urine samples. J Chromatogr B. 2011;879:3714-20. doi:10.1016/j.jchromb.2011.10.012
32. Mofazzeli F, Asaadi Shirvan H, Mohammadi F. Extraction and determination of tricyclic antidepressants in real samples using air–dispersed liquid–liquid microextraction prior to gas chromatography and flame ionization detection. J Sep Sci. 2018;41:4340-7. doi:10.1002/jssc.201800359
33. Seidi S, Yamini Y, Rezazadeh M. Combination of electromembrane extraction with dispersive liquid–liquid microextraction followed by gas chromatographic analysis as a fast and sensitive technique for determination of tricyclic antidepressants. J Chromatogr B. 2013;913-914:138-46. doi:10.1016/j.jchromb.2012.12.008
34. Sarafraz Yazdi A, Razavi N, Raouf Yazdinejad S. Separation and determination of amitriptyline and nortriptyline by dispersive liquid–liquid microextraction combined with gas chromatography flame ionization detection. Talanta. 2008;75:1293-9. doi:10.1016/j.talanta.2008.01.039
35. Shamsipur M, Mirmohammadi M. High performance liquid chromatographic determination of ultra traces of two tricyclic antidepressant drugs imipramine and trimipramine in urine samples after their dispersive liquid–liquid microextraction coupled with response surface optimization. J Pharm Biomed Anal. 2014;100:271-8. doi:10.1016/j.jpba.2014.08.008
36. Alizadeh Nabil AA, Nouri N, Farajzadeh MA. Determination of three antidepressants in urine using simultaneous derivatization and temperature–assisted dispersive liquid–liquid microextraction followed by gas chromatography–flame ionization detection. Biomed Chromatogr. 2015;29:1094-102. doi:10.1002/bmc.3396
37. Chen X, Zheng S, Le J, Qian Z, Chai Y. Ultrasound–assisted low–density solvent dispersive liquid–liquid microextraction for the simultaneous determination of 12 new antidepressants and 2 antipsychotics in whole blood by gas chromatography–mass spectrometry. J Pharm Biomed Anal. 2017;142:19-27. doi:10.1016/j.jpba.2017.04.032
38. Asghari A, Saffarzadeh Z, Bazregar M, Rajabi M, Boutorabi L. Low–toxic air–agitated liquid–liquid microextraction using a solidifiable organic solvent followed by gas chromatography for analysis of amitriptyline and imipramine in human plasma and wastewater samples. Microchem J. 2017;130:122-8. doi:10.1016/j.microc.2016.08.014
39. Ge D, Kee Lee H. Ionic liquid based dispersive liquid–liquid microextraction coupled with micro–solid phase extraction of antidepressant drugs from environmental water samples. J Chromatogr A. 2013;1317:217-22. doi:10.1016/j.chroma.2013.04.014
40. Fernández P, Taboada V, Regenjo M, Morales L. Lorenzo

Mohebbi et al.
85 | Pharmaceutical Sciences, 2021, 27(1), 76-85
RA. Optimization of ultrasound assisted dispersive liquid–liquid microextraction of six antidepressants in human plasma using experimental design. J Pharm Biomed Anal. 2016;124:189-97. doi:10.1016/j.jpba.2016.02.041
41. Vaghar–Lahijani G, Aberoomand–Azar P, Tehrani MS, Soleimani M. Application of ionic liquid–based ultrasonic–assisted microextraction coupled with HPLC for determination of citalopram and nortriptyline in human plasma. J Liq Chromatogr Relat Technol. 2017;40:1-7. doi:10.1080/10826076.2016.1274999
42. Bharmoria P, Gehlot Singh P, Gupta Hariom, Kumar A. Temperature-dependent solubility transition of Na2SO4 in water and the effect of NaCl therein: solution structures and salt water dynamics. J Phys Chem B. 2014;118(44):12734-42. doi:10.1021/jp507949h
43. Ruiz–Angel MJ, Carda–Broch S, Simo–Alfonso EF, Garcıa–Alvarez–Coque MC. Optimised procedures for the reversed–phase liquid chromatographic analysis of formulations containing tricyclic antidepressants. J Pharm Biomed Anal. 2003;32:71-84. doi:10.1016/S0731–7085(03)00048–7
44. Samant TS, Lukacova V, Schmidt S. Development and qualification of physiologically based pharmacokinetic models for drugs with atypical distribution behavior: a desipramine case study. CPT Pharmacometrics Syst Pharmacol. 2017;6:315-21. doi:10.1002/psp4.12180
45. U.S. Food and Drug Administration, Guidance for Industry: Bioanalytical Method Validation. http://www.fda.gov/downloads/drugs/ guidance compliance
regulatory information/guidances/ucm368107.pdf. 46. European Medicines Agency, Guideline on
Bioanalytical Method Validation. http:// www.ema.europa.eu/docs/en_GB/document_library/Scientific_guideline WC500109686.pdf.
47. dos Santos MF, Ferri CC, Seulin SC, Leyton V, Pasqualucci CAG., Munoz DR, Yonamine M. Determination of antidepressants in whole blood using hollow–fiber liquid–phase microextraction and gas chromatography–mass spectrometry. Forensic Toxicol. 2014;32:214-24. doi:10.1007/s11419–014–0226–9
48. Papoutsis I, Khraiwesh A, Nikolaou P, Pistos C, Spiliopoulou C, Athanaselis S. A fully validated method for the simultaneous determination of 11 antidepressant drugs in whole blood by gas chromatography–mass spectrometry. J Pharm Biomed Anal. 2012;70:557-62. doi:10.1016/j.jpba.2012.05.007
49. Zheng MM, Wang ST, Hu WK, Feng YQ. In–tube solid–phase microextraction based on hybrid silica monolith coupled to liquid chromatography–mass spectrometry for automated analysis of ten antidepressants in human urine and plasma. J Chromatogr A. 2010;1217:7493-501. doi:10.1016/j.chroma.2010.10.002
50. Zare F, Ghaedi M, Daneshfar A. Solid phase extraction of antidepressant drugs amitriptyline and nortriptyline from plasma samples using core–shell nanoparticles of the type Fe3O4@ZrO2@N–cetylpyridinium and their subsequent determination by HPLC with UV detection. Microchim Acta. 2015;182:1893-902. doi:10.1007/s00604-015-1499-3