Embed Size (px)
Citation preview

Louisiana State UniversityLSU Digital Commons
LSU Doctoral Dissertations Graduate School
3-18-2019
Development of Sheath Blight-Resistant BreedingLines for Southern U.S. Environments andMorphological and Genetic Survey of GiantSalvinia Populations in Louisiana and TexasDominique Clark GalamLouisiana State University and Agricultural and Mechanical College, [email protected]
Follow this and additional works at: https://digitalcommons.lsu.edu/gradschool_dissertations
Part of the Agronomy and Crop Sciences Commons, Plant Breeding and Genetics Commons,and the Plant Pathology Commons
This Dissertation is brought to you for free and open access by the Graduate School at LSU Digital Commons. It has been accepted for inclusion inLSU Doctoral Dissertations by an authorized graduate school editor of LSU Digital Commons. For more information, please [email protected].
Recommended CitationGalam, Dominique Clark, "Development of Sheath Blight-Resistant Breeding Lines for Southern U.S. Environments andMorphological and Genetic Survey of Giant Salvinia Populations in Louisiana and Texas" (2019). LSU Doctoral Dissertations. 4881.https://digitalcommons.lsu.edu/gradschool_dissertations/4881

DEVELOPMENT OF SHEATH BLIGHT-RESISTANT BREEDING LINES FOR SOUTHERN U. S. ENVIRONMENTS AND
MORPHOLOGICAL AND GENETIC SURVEY OF GIANT SALVINIA POPULATIONS
IN LOUISIANA AND TEXAS
A Dissertation
Submitted to the Graduate Faculty of the Louisiana State University and
Agricultural and Mechanical College in partial fulfillment of the
requirements for the degree of Doctor of Philosophy
in
The School of Plant, Environmental Sciences and Soil Sciences
by Dominique Clark Galam
B.S., Central Luzon State University, Philippines, 1998 M.S., Iwate University, Japan, 2009
May 2019

ii
To my loving parents, Rolando and Clarita This dissertation is humbly dedicated

iii
ACKNOWLEDGEMENTS
My deepest gratitude to my adviser, Dr. James H. Oard, for his invaluable support,
assistance and guidance whilst doing my dissertation work. Also, for giving me the opportunity
to pursue my graduate studies, the encouragements and wisdom are commendable, for without
him this work would have not been completed.
My graduate committee members, Dr. Steven Linscombe, Dr. Stephen Harrison, Dr.
Aaron Smith, Dr. Jong Ham, and Dr. Philipp Lynn Kennedy, for their constructive criticism
while preparing this dissertation and for their commitment for both my general exam and
research, their assistance is highly appreciated.
My heartfelt gratitude to Dr. Donald Groth and the whole staff and workers of the H.
Rouse Caffey Rice Research Station at Crowley, Louisiana for providing me support and help
during the conduct of my field experiments. The financial support extended by Louisiana Rice
Research Board for without their endeavors, this work would not been possible.
My current labmates, Democrito, Lenard, Paola, and Anna and to my former labmates,
Yamid, Christian, Manuel, Roberto and Federico for sharing their knowledge, assistance,
friendship and the fun times shared together during the conduct of my field, greenhouse and
laboratory experiments, I am indebted to all of them. Also, Dr. James Silva for providing the
SAS codes for my statistical analysis, thank you.
My sincerest thanks also to Dr. Samuel Ordonez and family for inviting me to come to
LSU to pursue my PhD degree. My friends, Ronald, Teresa, Marilyn and Ate Evelyn who
became my refuge and second family away from home, their encouragements and matured
suggestions during the stressful times, are whole-heartedly appreciated. My newly found relative
here in Baton Rouge, Kuya Al and Madam Rowena Mangaoil and Ma’am Rowena Cruz and

iv
family for their moral and spiritual support, I thank you sincerely. To Democ who became my
big brother, spiritual adviser and gym partner, thank you for the inspiration.
I would also thank the whole Filipino community for the friendship and support during
my time here in LSU.
My grandparents, uncle and aunts, and my friends from all over thank you for the
unending encouragement and support.
My deepest and genuine gratitude to my family for their unwavering love and support
throughout my life for without them I would not be what I am today. My dad and mom, Rolando
and Clarita, my siblings, Dwayne Mark, Dwight Lark and Dunstan Rodney, thank you for the
unconditional love care, support and understanding through the duration of my studies. My
sisters-in-law, Maricris and Mariel, my nieces, Chelsea Dane, Clarisse and Daeneris Marienne,
you are all my inspiration and constant source of strength.
Finally, to the LORD, my GOD, who gives me strength and my health. The hope,
wisdom and blessings bestowed on me to conquer the challenges during the whole duration of
my PhD program.
THANK YOU…….

v
TABLE OF CONTENTS ACKNOWLEDGEMENTS………………………………………………………………………iii LIST OF TABLES…………………………………………………………………………….....vii LIST OF FIGURES……………………………………………………………………………….x ABSTRACT ……………………………………………………………………………………..xi CHAPTER 1. GENERAL INTRODUCTION …………………………………………………... 1
1.1. Global Rice Situation ....……………………………………………………………...1 1.2. Rice Breeding in Asia and the United States………………………………………....2 1.3. Rice Sheath Blight Disease …………………………………………………………..3 1.4. Molecular Breeding for Rice Diseases……………………………………………….4 1.5. Salvinia molesta, Noxious Aquatic Weed in Louisiana and Texas….……………….6 1.6. Research Objectives…………………………………………………………………..9 1.7. References…………………………………………………………………………….9
CHAPTER 2. DEVELOPMENT OF DISEASE RESISTANT GERMPLASM………………...14 2.1. Introduction………………………………………………………………………….14 2.2. Materials and Methods………………………………………………………………17 2.3. Results and Discussion ……………………………………………………………...23
2.4. References…………………………………………………………………………...45 CHAPTER 3. IDENTIFICATION AND EVALUATION OF NON-SYNONYMOUS
SNPs MARKERS FOR SHEATH BLIGHT RESISTANT GERMPLASM ..…………. 48 3.1. Introduction………………………………………………………………………….48 3.2. Materials and Methods……………………………………………………………....52 3.3. Results ……………………………………………………………………………....53 3.4. Discussion ………………………………………………………………………......65
3.5. References …………………………………………………………………………..70
CHAPTER 4. GENETIC ANALYSIS OF NOXIOUS AQUATIC WEED IN LOUISIANA AND TEXAS …………………….……………………………………....77
4.1. Introduction………………………………………………………………………….77 4.2. Materials and Methods……………………………………………………………....79 4.3. Results ………………………………………………………………………………85
4.4. Discussion …………………………………………………………………………..92 4.5. References …………………………………………………………………………..94
CHAPTER 5. SUMMARY AND CONCLUSION ……………………………………………..98 5.1. Identification and Development of Breeding Lines and Populations ……………....98
5.2. Identification and Evaluation of Non-synonymous SNP Markers for SB Resistance……...………………………………………………………………...98 5.3. Genetic and Phenotypic Diversity of S. molesta in Louisiana and Texas .……….... 9

vi
APPENDIX A. RANKING OF 136 nsSNPs MARKERS ACROSS 20 SUSCEPTIBLE RILs OF THE RICECAP SB2 MAPPING POPULATION BASED ON RAW P, HOCHBERG, BONFERRONI, FALSE DISCOVERY AND R-SQUARED VALUES (Sanabria, 2015) ……………………………..101
APPENDIX B. PRIMER SEQUENCES FOR SNP-BASED MARKERS
LOCATED IN PREVIOUSLY REPORTED QTL’S FOR SHEATH BLIGHT RESISTANCE (Sanabria, 2015) ………………………...104
APPENDIX C. EIGENVALUES AND PROPORTIION OF TOTAL VARIABILITY
AMONG S. MOLESTA AS EXPLAINED BY FIRST THREE PRINCIPAL COMPONENTS USING THE MORPHOLOGICAL DATA …………………………………………………108
APPENDIX D. CORRELATION BETWEEN THE MORPHOLOGICAL DATA
AND THE FIRST THREE PRINCIPAL COMPONENTS…………………...108 APPENDIX E. CORRELATION BETWEEN DISSIMILARITY MATRICES
OBTAINED WITH DIFFERENT MARKER TYPES (MANTEL TEST)……………..........................................................................108
APPENDIX F. SUMMARY OF PEARSON’S LINEAR CORRELATION OF AFLP
MARKER AND GAPCP GENE TO MORPHOLOGICAL TRAITS …………………………..……………………108
APPENDIX G. EIGENVECTORS, EIGENVALUES, INDIVIDUAL AND
CUMULATIVE PERCENTAGE OF VARIATION EXPLAINED BY THE FIRST FIVE PRINCIPAL COMPONENTS (PC) A FTER ASSESSING MORPHOLOGICAL TRAITS OF S. MOLESTA FROM LOUISIANA AND TEXAS ………………………………………….119
APPENDIX H. PERMISSION LETTER……………………………………………………...110 VITA……………………………………………………………………………………………112

vii
LIST OF TABLES 2.1 Pedigree, generation and number of lines of sheath blight lines initially
evaluated during the 2013 Field Season at H. Rouse Caffey Rice Research Station, Crowley, Louisiana ……………………………………………………………..17
2.2 Sheath blight rating, plant height, and pedigrees, 33 F4-F5 sheath blight lines,
four check varieties, 2013 SB field trial, H. Rouse Caffey Rice Research Station, Crowley, Louisiana ……………………………………………………………..24
2.3 Analysis of variance on SB disease rating of the selected SB resistant lines
and resistant and susceptible checks from the 2013 SB field evaluation trial, H. Rouse Caffey Rice Research Station, Crowley, Louisiana …………………………..25
2.4 Analysis of variance on plant height of the selected SB resistant lines and
resistant and susceptible checks from the 2013 SB field evaluation trial, H. Rouse Caffey Rice Research Station, Crowley, Louisiana…………………………...25
2.5 Sheath blight rating, plant height, and pedigree of 39 selected F5
sheath blight lines, 4 SB inbred lines and four check varieties from 2014 SB field evaluation trial, H. Rouse Caffey Rice Research Station, Crowley, Louisiana…………………………………………………...26
2.6 Analysis of variance of SB disease rating of the selected SB
resistant lines and resistant and susceptible checks from the 2014 SB field evaluation trial, H. Rouse Caffey Rice Research Station, Crowley, Louisiana …………………………………………………..28
2.7 Analysis of variance of plant height of the selected SB
resistant lines and resistant and susceptible checks from the 2014 SB field evaluation trial, H. Rouse Caffey Rice Research Station, Crowley, Louisiana …………………………………………………..28
2.8 Sheath blight rating, plant height, and pedigree of 31 selected
lines including 16 F6, 4 F3 and 5 inbred sheath blight lines and four check varieties from 2015 SB field evaluation trial, H. Rouse Caffey Rice Research Station, Crowley, Louisiana …………………………..29
2.9 Analysis of variance of SB disease rating of the selected SB
resistant lines and resistant and susceptible checks from the 2015 SB field evaluation trial, H. Rouse Caffey Rice Research Station, Crowley, Louisiana …………………………………………………..30
2.10 Analysis of variance of plant height of the selected SB
resistant lines and resistant and susceptible checks from the 2015 SB field evaluation trial, H. Rouse Caffey Rice

viii
Research Station, Crowley, Louisiana …………………………………………………..31 2.11 Plant height and SB ratings for F4 and F7 selections evaluated at the RRS, 2016……….31 2.12 Analysis of variance of SB disease rating of the selected SB
resistant lines and resistant and susceptible checks from the 2016 SB field evaluation trial, H. Rouse Caffey Rice Research Station, Crowley, Louisiana…………………………………………………...32
2.13 Analysis of variance of plant height of the selected SB
resistant lines and resistant and susceptible checks from the 2016 SB field evaluation trial, H. Rouse Caffey Rice Research Station, Crowley, Louisiana …………………………………………………..32
2.14 Plant height and SB ratings for F3, F4 derived F8 and BC2F3
selections evaluated at the RRS, 2017 …………………………………………………..33 2.15 Analysis of variance of SB disease rating of the selected SB
resistant lines and resistant and susceptible checks from the 2016 SB field evaluation trial, H. Rouse Caffey Rice Research Station, Crowley, Louisiana …………………………………………………..35
2.16 Analysis of variance of plant height of the selected SB resistant lines and resistant and susceptible checks from the 2016 SB field evaluation trial, H. Rouse Caffey Rice Research Station, Crowley, Louisiana …………………………………………………..36
2.17 Maturity, plant height and 0-9 SB ratings for F3, F4, F4 derived F9
and BC2F3, BC3F2 selections evaluated at the RRS, 2018 ………………………………36 2.18 Analysis of variance on 50% days to heading of the selected SB
resistant lines and resistant and susceptible checks from the 2018 SB field evaluation trial, H. Rouse Caffey Rice Research Station, Crowley, Louisiana ………………………………………………….40
2.19 Analysis of variance of on SB disease rating of the selected SB
resistant lines and resistant and susceptible checks from the 2018 SB field evaluation trial, H. Rouse Caffey Rice Research Station, Crowley, Louisiana ………………………………………………….40
2.20 Analysis of variance on plant disease rating of the selected SB
resistant lines and resistant and susceptible checks from the 2018 SB field evaluation trial, H. Rouse Caffey Rice Research Station, Crowley, Louisiana ………………………………………………….40
2.21 Yield reduction of the selected resistant lines from 2016

ix
and 2017 (combined data)………………………………………………………………..43 2.22 Correlation analysis of days to heading, disease score, plant
height and grain weight of the resistant check, selected sheath blight lines and the susceptible checks ………………………………………………………....45
3.1 SNP genotypes of selected resistant and susceptible lines from 2014 SB field evaluation plots, RRS, Crowley, Louisiana ………………………..56
3.2 Genotyping results of the selected resistant lines including
2 resistant and 6 susceptible checks in 2015 SB field evaluation ……………………….59 3.3 Genotypes of the 7 selected lines from the 2016-2017 field evaluation
at RRS, Crowley, Louisiana ……………………………………………………………..62
4.1 Geographic location of S. molesta populations and description of collection sites……...80 4.2 Analysis of variance (ANOVA) of five morphological characteristics;
colony width (mm), ramets per colony, rhizome length per colony (mm), leaf width per colony (mm), root length per colony (mm) for five populations of S. molesta …………………………………………………………...86
4.3 Correlation matrix of five morphological traits of the five populations of S. molesta from Louisiana and Texas …………………………………………………...89
4.4 Analysis of molecular variance using AFLP marker and the gapCp gene sequence for six populations of S. molesta from Louisiana and Texas………………….91

x
LIST OF FIGURES 2.1 F1 seedlings grown in the greenhouse and F1 nursery field; a. F1 seedlings
growing in peat pots inside the greenhouse; b. 30-day seedlings growing in the F1 nursery; c. seedlings at tillering stage growing in F1 nursery ………………….22
4.1 Principal Component Analysis (PCA) of the five traits from S. molesta evaluated in this study. Pyramid = Gheens, LA; Cylinder = Bell River, LA; Cube = Thibodaux, LA; Club = Caddo Lake, LA; Balloon = Lake Bistineau, LA. Green = Cluster 1; Black = Cluster 2; Red = Cluster 3; Magenta = Cluster 4; Purple = Cluster 5 ……………………………………………………………………….88
4.2 Box plot for root length (mm) for 20 individuals each of S. molesta at
Gheens, LA; Bell River, LA; Thibodaux, LA; Caddo Lake, LA………………………...90

xi
ABSTRACT
The southern US environment is a very conducive environment for agriculture and
fisheries. Rice farming, shrimping and water related activities help drive the local economy.
However, there are several factors that impede the success of these activities. Sheath blight (SB)
disease caused by Rhizoctonia solani is one of the major biotic constraints to high grain yield and
quality for most commercial U.S. rice varieties. Although different breeding lines with high
levels of "partial resistance" have been developed none has been used directly as a commercial
variety. The first research objective of this research was to identify and develop advanced
breeding lines for sheath blight resistance with high grain yield and quality through traditional
breeding methods. The second research objective was to identify and evaluate non-synonymous
SNP markers for SB resistance. Seven elite breeding lines showed relatively high yields vs
commercial checks in inoculated field plots. The selected lined carried SNP markers within
candidate genes for sheath blight resistance including a regulatory gene on chromosome 9 was
shown in RNA-Seq studies to play a role in resistance. This research demonstrated that a
combination of traditional breeding and genomic approaches can facilitate rapid development of
elite breeding lines with high grain yield and quality traits for southern U.S. environments.
The third research objective was focused on Salvinia molesta, giant aquatic fern which
invades bayous, large lagoons and lakes and is considered as a major problem to Louisiana and
Texas. Genetic and phenotypic diversity study of S. molesta in these locations showed a
significant variation for all five morphological traits measured both within and across collection
sites. Although substantial morphological and molecular variations were detected both within
and among populations, all data from this study suggested that these six populations were
derived originally from the same clonal or related populations. A practical implication of this

xii
result is that different and location-specific control strategies for S. molesta most likely will be
needed.

43
CHAPTER 1. GENERAL INTRODUCTION
1.1. Global Rice Situation
Rice (Oryza sativa L.) is an important crop of stable food security for more than half of
the world’s population (Jia et al. 2009). The majority of developing countries, especially from
the Asia-Pacific region, depends on rice as their primary calorie source and main livelihood crop.
During the crop year of 2016-2017, ~ 161million hectares were devoted for rice cultivation
worldwide. In 2017, global rice production was ~ 489 million metric tons and around 478
million metric tons of rice was consumed during that time (http://www. fas.usda.gov/psdonline/
psdAvailability.aspx).
Total U.S. rice production in 2017 dropped 20 percent from the previous year with ~ 10
million tons harvested from 960,000 hectares with an average yield of 9.2 tons per hectare
(https://www.ers.usda.gov/data-products/rice-yearbook.aspx#57007). Child (2017) reported that
the drop of rice production in the US was attributed to three primary factors: a weak price
outlook for long grain rice, heavy rainfall and flooding in the spring, both in the mid-South and
California, and the effects of Gulf Coast hurricanes during the late summer.
As the human population is expected to rise to ~ nine billion by 2050, rice crop yields will
need to at least double by that time (Khush, 2005; Skamnioti and Gurr, 2010; Li et al. 2014). In
major Asian countries rice consumption will increase faster than the population growth.
Similarly, with the ensuing effects of urbanization, farms intended for rice production have
diminished in number due to conversion for commercial purposes. Moreover, a 25 to 30 percent
annual yield loss caused by disease, insect, and weed pressure will be exacerbated by climate
change (http://www.fao.org/news/story/en/item/1062612/icode/). Therefore, improvement of

2
yield is a logical approach to counteract losses by biotic and abiotic stresses (Delteil et al. 2010;
Godfray, 2010; Lobell et al. 2011).
1.2. Rice Breeding in Asia and the United States
Rice is the basic staple for the majority of Asian nations including the region’s 560
million poor (http://ricepedia.org/rice-around-the-world/asia). Asia contributes up to 88 percent
and 91 percent of the world’s rice area and production, respectively. In addition, it is in this
region where 90% of the rice is produced and consumed. Moreover, more than 140 million
farming households rely on rice as their primary source of livelihood (FAO 2014). From the start
of the 21st century, rice production in Asia has increased continuously through the introduction
and adoption of new and high-yielding varieties. China is the world’s largest rice producer, with
~142 million tons generated in 2016 that accounts for as much as 35% of the total world rice
production (FAO 2017).
Utilization of hybrid vigor in Chinese rice breeding has made a significant impact to the
country as a whole. In 1974 the first hybrid rice was commercially released in China and yields
were about 15 to 20 percent greater than those of improved or high-yielding varieties of the same
growth duration. With the success of hybrid rice technology in China, rice growing countries in
the region – Vietnam, India, the Philippines and Bangladesh have attempted commercial
production of hybrid rice (Hu et al. 2000; Jin et al. 2002; Virmani and Kumar, 2004; Shi and Hu,
2017). However, adoption of the technology has been slow. For example, the total hybrid rice
area planted was 4.5 million hectares distributed across several Asian countries outside of China
that represent 1 to 9 % of the total rice area in each country (FAO, 2014). In the Philippines, only
9 % of the total area for rice production was planted with hybrid rice (Bordey et al. 2016).
3
In the US, rice is grown in six states - Arkansas, California, Louisiana, Mississippi, Texas
and Missouri. Arkansas accounts for ~ 50 percent of all rice produced in the United States,
primarily long and medium grain varieties. The first hybrid rice line was released in the Mid-
South in 2000 with the substantial benefit of increased yields associated with its adoption. Thus,
rice producers in the region have been adopting hybrids since their commercial release. Hybrid
acreage has increased from 15% in 2005 to over 40% in 2013 (Nalley et al. 2017). Clearfield
hybrids have been widely adopted as a control measure for weedy red rice.
1.3. Rice Sheath Blight Disease
A major impediment to high grain yield and quality for rice producers is sheath blight
disease caused by the soilborne fungal pathogen Rhizoctonia solani Kuhn, second only to rice
blast in reducing both grain yield and quality (Lee et al. 1983; Ou, 1985; Rush et al. 1992;
Savary et al. 2006). Sheath blight has been regarded as a serious threat to stable rice production
and is found in many rice production areas around the world. The pathogen has a wide host
range, often infecting legume crops grown in rotation with rice (Pan et al. 1999; Zou at al. 2000;
Mew et al. 2004; Pinson et al. 2005). One major constraint in sheath blight management is the
inability to identify genetic sources, from either cultivated or wild varieties of rice, which
provide adequate levels of durable and inheritable sheath blight resistance that can be readily
transferred to commercial varieties (Bonman et al. 1992; Taguchi-Shiobara et al. 2013).
In the southern United States, yield losses up to 50% were reported when susceptible
cultivars were planted (http://www.knowledgebank.irri.org/ipm/sheath-blight/economic-
importance.html). Management and cultural practices include the use of semi-dwarf cultivars,
intensive nitrogen fertilization, high plant density and rotation with soybean which is an
alternative host for the pathogen. These factors favor disease build-up and high severity of sheath

4
blight disease (Biswas, 2001; Singh et al. 2004; Groth and Bond, 2007). Fungicide application is
the most common practice to manage the disease, but this approach is generally not sustainable
nor cost effective (Nicolaisen et al. 2018). There are also preventive low-cost measures and
practices which include burning of crop residues and avoiding excess nitrogen-based fertilizers.
However, even these low-impact control measures are not always successful under disease-
favorable conditions (Skamnioti and Gurr, 2009). Although various cultural practices have been
used to manage the disease, it is advantageous and important to screen rice germplasm and to
develop rice cultivars with adequate levels of disease resistance to reduce or eliminate losses
caused by the disease. Therefore, utilization of host resistance is the most economical and
environment-friendly strategy to manage this disease (Liu et al. 2009).
1.4. Molecular Breeding for Rice Diseases
The subsequent development of molecular markers – simple sequence repeats (SSR),
insertion-deletions (InDel), single nucleotide polymorphisms (SNPs) and functional genomics
has led to increased genetic studies of diseases in rice. In a review by Collard and Mackill
(2008), efficiency and precision of conventional plant breeding can be greatly improved by
marker-assisted selection (MAS) for certain trats.
MAS has been shown to be successful in developing disease resistant varieties of rice –
bacterial leaf blight (BB) resistant rice, tungro-resistant rice, and blast resistance (Amante-
Bordeos et al. 1992; Brar and Khush, 1997; Ashkani et al. 2015). Linked markers pTA248,
RG136 and RG556 associated to BB resistance genes Xa21, xa13 and xa5 were successfully
introgressed into BB-susceptible Basmati variety CSR-30 through MAS without compromising
the Basmati traits (Baliyan et al. 2018). Similarly, Suh et al (2011) developed multiple brown
plant hopper (BPH) - resistance introgressions (ILs) or near-isogenic lines (NILs) through

5
molecular assisted backcrossing using a Bph18-cosegregation marker 7312. T4A for positive
selection, and 260 SSR markers across all 12 rice chromosomes for background selection, Bph18
was transferred into an elite japonica variety ‘Junambyeo’ and ILs with enhanced BPH
resistance. Recently, three dominant blast resistance genes were successfully introgressed into an
aromatic rice cultivar, Musk Budji through MAS (Khan et al. 2018). Background selection was
carried out using 78 SSR and STS markers to reduce linkage drag around resistance genes Pi54,
Pi1 and Pita. The LSU AgCenter H. Rouse Caffey Rice Research Station has recently developed
SNP markers for traits such as blast resistance, plant height (sd1), resistance to Newpath and
Provisia herbicides, amylose content, grain length, aroma and others (Famoso, unpublished
results).
Significant progress has also been made via next-generation high-throughput DNA
sequencing technologies (Nadeem et al. 2018). A coordinated research, education, and extension
project was initiated in 2005 for the application of genomic discoveries to improve rice in the
United States (RiceCAP Project, https://ricecap.hosted.uark.edu/index.html). Chu et al (2006)
developed the SB2 doubled-haploid mapping population from a cross of the susceptible
Louisiana variety Cocodrie (PI 606331) with the resistant line MCR010277 (PI 641932). A total
of 325 doubled-haploid lines were produced from this cross.
One important contribution of the RiceCAP project was whole-genome sequencing of 13
japonica and indica lines that represented elite breeding materials used in modern varietal
development in the U.S. and Asia. Evaluation of the sequencing data resulted in the
identification of 136 non-synonymous SNPs markers associated with sheath blight resistance.
(Silva et al. 2012). In subsequent research, extreme phenotypes from the SB2 population were
screened using a subset of markers identified by Silva et al (2012) (Yamid Sanabria, unpublished

6
results). A total of 37 candidate nsSNPs markers from four loci on chromosomes 6, 8, 9 and 12
were identified for subsequent research.
A method that has become very popular in elucidating molecular mechanisms involved
in plant stress resistance and the crosstalk that occurs between different signaling pathways is
RNA-sequencing (RNA-Seq) (Qi et al. 2011; Mochida and Shinozaki 2011; AbuQamar et al.
2016; Nasr Esfahani et al. 2017). Several studies have already been conducted on host-
pathogen interactions for major plant diseases using RNA-Seq including Magnaporthe oryzae
(Oh et al. 2008), Ustilago maydis (Skibbe et al. 2010) and Phytophthora infestans (Gao et al.
2013).
Dr. Pankaj Jaiswal at Oregon State University has carried out an RNA-Seq experiment in
cooperation with Dr. Oard’s laboratory on sheath blight (unpublished results). The SB
susceptible variety, Cocodrie (PI 606331) and the resistant line MCR010277 (PI 641932) was
inoculated with R. solani under greenhouse condition at LSU. Leaf samples were collected at 0,
1, 3, 5 hours post-inoculation, and subjected to RNA-Seq analysis by Jaiswal’s laboratory. Three
genes were postulated to be involved in the sheath blight defense response: chitin elicitor binding
protein (CEBiP), chitin elicitor receptor kinase (CERK), and wall-associated kinase gene family
(WAK91). A non-synonymous SNP in WAK91 on chromosome 9 was identified as a candidate
marker for sheath blight resistance breeding.
1.5. Salvinia molesta, Noxious Aquatic Weed in Louisiana and Texas
Louisiana and Texas contain many slow-moving bayous, large lagoons, lakes and the
Mississippi river. The climate of these areas is humid subtropical, but most of the year it is warm
to hot along the Gulf Coast. Favorable to agriculture and fisheries, rice farming, fishing, and

7
shrimping contribute to the southern Gulf Coast economy. In addition, recreational activities like
boating, swimming and other water activities abound.
One major reason that impedes such activities is the persistent growth of the noxious
weed, Giant salvinia (Salvinia molesta D.S. Mitchell) in these bodies of water. In 1995, S.
molesta was first observed in South Carolina and was later reported from Louisiana and Texas in
1998 (McFarland et al. 2004; Mukherjee et al. 2014). Giant salvinia was first identified in the
Houston area in the spring 1998, but was discovered in Toledo Bend Reservoir, Texas’s largest
body of water, later that same year (https://tpwd.texas.gov/huntwild/wild/species/exotic/
salvinia.phtml).
By the time giant salvinia was reported in Texas in 1998, waterways and inland waters in
Louisiana had also experienced infestation of this weed. It was seen in Cameron Parish in 2000
and in the Atchafalaya Basin in 2006. In a report by the Louisiana Department of Agriculture
and Forestry, by 2008 most lakes in northwest Louisiana had a severe infestation, and the
freshwater marsh from Lafitte to Morgan City had unmanageable infestations. (https://www.
lsuagcenter.com/portals/communications/publications/agmag/archive/2010/fall/invasive-aquatic-
weeds-in-louisiana).
In a report published online by Scott Jackson (2016; http://nwdistrict .ifas.ufl.edu
/nat/2016/02/26/nisaw-2016-working-together-to-remove-giant-salvinia-salvinia-molesta-from-
northwest-florida/), a University of Florida/IFAS Extension Agent, an infestation of giant
salvinia in Northwest Florida was observed. The 2.5 acre infestation was on a 3.6 acre divided
pond which was precariously close to Deer Point Lake, a 5,000 acre water body that is the main
source of drinking water for Panama City and surrounding Bay County. The occurrence of Giant

8
Salvinia in the area was the second only reported enormous infestation and a high control of this
fern is a priority for the state of Florida due to its high invasive potential.
The gulf coast’s warm climate and mild winter are very conducive to exponential growth
of S. molesta (Mitchell and Tur 1975, Rani and Bharnbie 1983, Madsen and Wersal, 2008).
Another factor affecting S. molesta’s growth success is eutrophication, the high the concentration
of nutrients in the water. Al-Hamdani and Sirna (2008) observed an increased growth rate of S.
molesta grown under laboratory conditions by accumulating nitrogen and phosphorus under
different imitating eutrophic environments.
Dense mats of S. molesta fill in waterbodies as a result, significantly affect the
diversity of native aquatic plants and animals (Mitchell 1979). Conversely, exponential growth
of S. molesta impedes access to waterways for human activities like boating, fishing and
swimming which results in substantial economic losses and to crop production. S. molesta was
observed to clog water intakes and interfere with agricultural irrigation and farmlands. Moreover,
S. molesta is considered as a weed in certain rice growing regions that reduces production by
competing for water, nutrients and space (Anon., 1987). In a 1987 economic impact assessment
of S. molesta to irrigated rice in Sri Lanka, crop losses in affected areas were 2-3% (Doeleman,
1989).
Did the current infested areas of Louisiana and Texas arise from the same or from
different populations of S. molesta? To develop effective control and management strategies for
Louisiana and Texas, it is important to understand the population diversity of S. molesta both at
the genetic and whole-plant level.

9
1.6. Research Objectives
1. Identify and develop advanced breeding lines and populations for sheath blight resistance
through traditional breeding methods.
2. Identify and evaluate non-synonymous SNP markers for sheath blight resistance
germplasm for southern US environments through development of allele-specific DNA
markers identified by SNP databases and selective genotyping.
3. Determine genetic and phenotypic diversity of S. molesta in Louisiana and Texas.
1.7. References
AbuQamar SF, Moustafa K, Tran LS (2016) ‘Omics’ and plant responses to Botrytis cinereal. Front Plant Sci.15;7:1658 (Review). doi: 10.3389/fpls.2016.01658.
Al-Hamdani SH, Sirna CB (2008) Physiological responses of Salvinia minima to different
Phosphorus and Nitrogen concentrations. American Fern J.Vol. 98, No. 2 pp. 71-82.
Amante-Bordeos A, Sitch L, Nelson R, Dalmacio R, Oliva N, Aswidinnoor H, et al. (1992). Transfer of bacterial blight and blast resistance from the tetraploid wild rice Oryza minuta to cultivated rice, Oryza sativa. Theor Appl Genet. 84, 345–354. doi: 10.1007/BF002 29493.
Anonymous (1987) Indonesia girds to battle Salvinia molesta. Weedwatcher 2:1-2. (Publication of Southeast Asian Weed Information Centre, Bogor, Indonesia.)
Ashkani S, Rafii MY, Shabanimofrad M, Miah G, Sahebi M, Azizi P, Tanweer FA, Sayeed Akhtar M, Nasehi A (2015) Molecular breeding strategy and challenges towards improvement of blast disease resistance in rice crop. Front Plant Scie. Vol 6, Article 886 doi:10.3389/fpls.2015.00886.
Baliyan N, Malik R, Rani R, Mehta K, Vashisth U, Dhillon S, Boora KS (2018) Integrating marker-assisted background analysis with foreground selection for pyramiding bacterial blight resistance genes into Basmati rice. C R Biologies 341 (2018) 1–8.
Biswas A (2001) Efficacy of biotos: a new botanical against sheath blight disease of rice. Mycology J Plant Path Journal 31: 360-361.
Bonman J, Khush G, Nelson R (1992) Breeding rice for resistance to pests. Annu Rev
Phytopathol. 30, 507–528.

10
Bordey FH, Beltran JC, Moya PF, Manalili RG, San Valentin MRL, Rebong DB II (2016) Helping the Philippines become competitive thru improved hybrid rice seed production. Science City of Muñoz, Nueva Ecija (Philippines): Philippine Rice Research Institute, and Los Baños, Laguna (Philippines): International Rice Research Institute. 31p.
Brar D, Khush G (1997). Alien introgression in rice. Plant Mol. Biol. 35, 35–47. doi: 10.1023/A:1005825519998.
Child N (2017) U.S. Rice Market Faces Tighter Supplies and Higher Prices in 2017/18. University of Arkansas Webinar Series October 26, 2017.
Chu QR, Linscombe SD, Rush MC, Groth DE, Oard J (2006) Registration of a C/M doubled haploid mapping population of rice. Crop Sci 46: 1417.
Collard CY, Mackill DJ (2008) Marker-assisted selection: an approach for precision plant breeding in the twenty-first century. Bertrand Phil. Trans. R. Soc. B 363, 557–572 doi:10.1098/rstb.2007.2170.
Delteil A, Zhang J, Lessard P, Morel JB (2010) Potential candidate genes for improving rice disease resistance. Rice 3:56-71.
Doeleman JA (1989) Biological Control of Salvinia molesta in Sri Lanka: An assessment of costs and benefits. The Australian Centre for Agricultural Research Technical Report 12. Australian Centre for International Research. Canberra, Australia.
Gao L, Tu ZJ, Millett BP, Bradeen JM (2013) Insights into organ-specific pathogen defense responses in plants: RNA-seq analysis of potato tuber-Phytophthora infestans interactions. BMC Genomics.14: 340. doi: 10.1186/1471-2164-14-340.
Lobell DB, Schlenker W, Costa-Roberts J (2011). Climate trends and global crop production since
1980. Science (Report) Vol. 333:6042 pp. 616-620; doi 10.1126/science.1204531. Godfray HCJ, Beddington JR, Crute IR, Haddad L, Jules Pretty DL, Muir JF, Robinson S, Thomas
SM, Toulmin C (2010) Food security: The challenge of feeding 9 billion people. Science (Review) 12 Vol. 327: 5967 pp. 812-818; doi: 10.1126/science.1185383.
Groth DE, Bond JA (2007) Effects of cultivars and fungicides on rice sheath blight, yield, and
quality. Plant Diseases. 91:1647-1650. Hu RF, Huang JK, Jin SQ, Rozelle S (2000) Assessing the contribution of research system and
CG genetic materials to the total factor productivity of rice in China. Jour of Rural Dev. 23, 33–70.
Jia Y, Liu GJ, Costanzo S, Lee SH, Dai YT (2009) Current progress on genetic interactions of rice with rice blast and sheath blight fungi. Front Agric China 3(3):231–239. doi: 10.1007/s11703-009-0062-6.

11
Jin SQ, Huang JK, Hu RF, Rozelle S (2002) The creation and spread of technology and total factor productivity in China. American Journal of Agricultural Economics. 11, 916–930.
Khan MB, Shikari AB, Vaishnavi R, Najeeb S, Padder BA, Bhat ZA, Parray GA, Bhat MA, Kumar R, Singh NK (2018) Marker-assisted introgression of three dominant blast resistance genes into an aromatic rice cultivar. Scien Rep. 8:4091. doi:10.1038/s41598-018-22246-4.
Khush G (2005) What it will take to feed 5.0 billion rice consumers in 2030. Plant Mol Biol 59 (1):1-6.
Khush GS (1997) Pyramiding of bacterial blight resistance genes in rice: marker-assisted selection
using RFLP and PCR. Theor Appl Genet. 95, 313–320. doi:10.1007/s001220050565.
Lee FN, Rush MC (1983) Rice sheath blight: a major rice disease. Plant Diseases 67:829-832.
Li JY, Wang J, Zeigler RS (2014) The 3,000 rice genomes project: new opportunities and challenges for future rice research GigaScience 3:8 https://doi.org/10.1186/2047-217X-3-8.
Liu GJ, Jia YL, Correa-Victoria FJ, Prado GA, Yeater KM, McClung AM, Correll JC (2009) Mapping quantitative trait loci responsible for resistance to rice sheath blight disease using greenhouse assays. Phytopathol 99:1078–1084.
Madsen JD, Wersal RM (2008) Growth regulation of Salvinia molesta by pH and available water column nutrients. Journ of Freshw Ecol. 23:2, 305-313, doi:10.1080/02705060.2008.9664203.
McFarland DG, Nelson LS, Grodowitz MJ, Smart RM, Owens CS (2004) Salvinia molesta D.S.
Mitchell (Giant Salvinia) in the United States: A review of species ecology and approaches to management. U.S. ACE Pub. ERDC/EL SR-04-2.
Mew TW, Leung H, Savary S, Vera Cruz CM, Leach JE (2004) Looking ahead in rice disease
research and management. CRT Critical Review in Plant Science 23:103-127. Mitchell DS (1979) The incidence and management of Salvinia molesta in Papua New Guinea.
Draft Report, Office of Environmental Conservation, Papua, New Guinea. Mitchell DS, Tur NM (1975) The rate of growth of Salvinia molesta (S. auriculata Auct.) in
laboratory and natural conditions. J. Appl. Ecol. 12, 213-225.
Mukherjee A, Knutson A, Hahn DA, Heinz KM (2014) Biological control of giant salvinia (Salvinia molesta) in a temperate region: cold tolerance and low temperature oviposition of Cyrtobagous salviniae. BioControl 59:781–790 DOI 10.1007/s10526-014-9617-4.

12
Mochida K, Shinozaki K (2011) Advances in omics and bioinformatics tools for systems analyses of plant functions. Plant Cell Physiol. 52(12): 20172038. doi: 10.1093/pcp/pcr153.
Nadeem MA, Nawaz MA, Shahid MQ, Doğan Y, Comertpay G, Yıldız M, Hatipoğlu R, Ahmad F, Alsaleh A, Labhane N, Özkan H, Chung G, Baloch FS (2018) DNA molecular markers in plant breeding: current status and recent advancements in genomic selection and genome editing. Biotech. and Biotechnological Equip., 32:2, 261-285, doi: 10.1080/13102818.2017.1400401.
Nalley L, Tack J, Durand A, Thoma G, Tsiboe F, Shew A, Barkley A (2017) The Production, consumption, and environmental impacts of rice hybridization in the United States. Agron. J. 109:193–203 doi:10.2134/agronj2016.05.0281.
Nasr Esfahani M, Inoue K, Chu HD, Nguyen KH, Van Ha C, Watanabe Y, Burritt DJ, Herrera-Estrella L, Mochida K, Tran LP (2017) Comparative transcriptome analysis of nodules of two Mesorhizobium-chickpea associations with differential symbiotic efficiency under phosphate deficiency. Plant J. 91(5):911-926. doi: 10.1111/tpj.13616.
Nicolaisen MH, Cuong NDu, Herschend J, Jensen B, Loan LC, Du PV, Sørensen J, Sørensen H,
Olsson S (2018) Biological control of rice sheath blight using hyphae- associated bacteria: development of an in planta screening assay to predict biological control agent performance under field conditions. BioControl. 63:843–853; doi.org/10.1007/s10526-018-09908-y(0123456789.().,-volV()0123458697
Oh Y, Donofrio N, Pan H, Coughlan S, Brown DE, Meng S, Mitchell T, Dean RA (2008)
Transcriptome analysis reveals new insight into appressorium formation and function in the rice blast fungus Magnaporthe oryzae. Genome Biol. 9(5):R85. doi: 10.1186/gb-2008-9-5-r85.
Ou SH (1985). Rice Diseases. Farnham Royal, UK: CAB Int. 2nd ed.
Qi YX, Liu YB, Rong WH (2011) [RNA-Seq and its applications: a new technology for
transcriptomics]. [Article in Chinese] Yi Chuan.;33(11):1191-202. Pan XB, Zou JH, Chen ZX, Lu JF, Yu HX, Li HT, Wang ZB, Pan XY, Rush MC, Zhu LH (1999)
Tagging major quantitative trait loci for sheath blight resistance in a rice variety, Jasmine 85. Chinese Scientific Bulletin 44(19): 1783–1789.
Pinson SRM, Capdevielle FM, Oard JH (2005) Confirming QTLs and finding additional loci
conditioning sheath blight resistance in rice using recombinant inbred lines. Crop Sci. 45, 503–510.
Rani VU, Bhambie S (1983). A study on the growth of Salvinia molesta Mitchell in relation to
light and temperature. Aquatic Botany 17:119-124.

13
Rush MC, Lee FN (1992) Sheath blight. In: Webster, R. K. and P. S. Gunnel (eds.) Compendium of Rice Diseases. APS Press, Minnesota, pp. 22-23.
Savary S, Teng PS, Willocquet L, Nutter FW Jr. (2006) Quantification and modeling of crop
losses: a review of purposes. Annu. Rev. Phytopathol. 44:89–112. Silva J, Scheffler B, Sanabria Y, De Guzman C, Galam DCA, Farmer A, Woodward J, May G,
Oard JH (2012) Identification of candidate genes in rice for resistance to sheath blight disease by whole genome sequencing. Theor Appl Genet. 124:63–74.
Singh SK, Shukla V, Singh H, Sinha AP (2004) Current status and impact of sheath blight in rice
(Oryza sativa L.). Agric Rev 25 (4):289 – 297.
Shi X, Hu R (2017) Rice variety improvement and the contribution of foreign germplasms in China. J. of Integ Agric. 16(10): 2337–2345.
Skamnioti P, Gurr SJ (2009) Against the grain: safeguarding rice from rice blast disease. Trends in Biotehn. (Review) 27: 141-150.
Skibbe DS, Doehlemann G, Fernandes J, Walbot V (2010) Maize tumors caused by Ustilago
maydis require organ-specific genes in host and pathogen. Science. 328:89–92. doi: 10.1126/science.1185775.
Suh JP, Yang SJ, Jeung JU, Pamplona A, Kim JJ, Lee JH et al (2011) Development of elite breeding lines conferring Bph18 gene-derived resistance to brown planthopper (BPH) by marker-assisted selection and genome-wide background analysis in japonica rice (Oryza sativa L.). Field Crop Res 120:215–222.
Taguchi-Shiobara F, Ozaki H, Sato H, Maeda H, Kojima Y, Ebitani T, Yano M (2013) Mapping and validation of QTLs for rice sheath blight resistance. Breeding Sci. 63, 301–308.
Virmani SS, Kumar I (2004) Development and use of hybrid rice technology to increase rice productivity in the tropics. Int. Rice Res. Notes, 29: 10-19.
Zou JH, Pan XB, Chen ZX, Xu JY, Lu JF, Zhai WX, Zhu LH (2000) Mapping quantitative trait
loci controlling sheath blight resistance in two rice cultivars (Oryza sativa L.). Theor App Genet. 101:569–575.
14
CHAPTER 2. DEVELOPMENT OF DISEASE RESISTANT GERMPLASM
2.1. Introduction
Breeding for sheath blight (SB) disease has achieved limited success in the U.S. and
elsewhere due to use of only a few highly resistant accessions with complex inheritance patterns
(Eizenga et al. 2002; Wang et al. 2011). Germplasm stocks and associated mapping populations
for breeding and study of sheath blight have been released in the U.S. for public use (Chu et al.
2006; Groth et al. 2007; Pinson et al. 2008, Groth et al. 2011; Rush et al. 2011; Jia et al. 2012;
Jia et al. 2015). The information below identifies and describes sources of resistance used in my
research to develop elite adapted lines with resistance to SB disease.
In cooperation with the USDA-funded RiceCAP project (http://www.uark.edu/ua/
ricecap), the SB2 mapping population was developed as a resource for mapping QTLs for sheath
blight resistance and other traits (Chu et al. 2006). SB2 consists of 325 true-breeding doubled-
haploid (DH) lines (Genetic Stocks Oryza (GSOR) accessions 200001 to 200325) developed
from susceptible parent Cocodrie (PI 606331) and the moderately-resistant breeding line
MCR010277 (PI 641932). Four DH lines from the SB2 population (SB2-3, SB2-102, SB2-174,
SB2-225; http://www.uark.edu/ua/ricecap) were used as sources of resistance in my breeding
efforts.
MCR010277 was selected with at least two sources of partial resistance in the F7-F8
generation from the cross LSBR-5/Lemont//Katy/3/ Cypress/Teqing (Nelson et al., 2011). The
resistance rating (0-9 scale; where 0=no disease and 9=very susceptible) for MCR10277 has
varied from 3-5 across multiple years at the H. Rouse Caffey Rice Research Station, Crowley,
LA (Oard, unpublished results). Three putative sources of resistance are present in the pedigree
of MCR10277. The first is LSBR-5, reported to be derived from somaclonal tissue of the U.S.

15
long-grain cultivar Labelle (Xie et al. 1992), but subsequent DNA marker analysis showed that
LSBR-5 was most likely derived from an unknown indica source (Nelson et al. 2012). The
second source is the long-grain Arkansas variety Katy (PI527707) derived from the cross Bonnet
73/CI9722// Starbonnet/Tetep/3/Lebonnet that produced a SB rating of 5 in Arkansas
(Moldenhaur et al. 1990) and ratings of 5 to 6 in Louisiana (Oard, unpublished results). The
Vietnamese long-grain variety Tetep (PI280682) in the pedigree of Katy is a known source for
SB resistance (Moldenhauer et al. 1990). The third source is the medium-grain cultivar Teqing
(PI536047), reported to carry a single dominant gene for resistance (Pan et al. 1999). Teqing has
shown consistently high levels of resistance to SB with ratings typically ranging from 3 to 4 in
multiple inoculated field trials at the RRS (Oard, unpublished results). The susceptible varieties
Lemont (PI475833) and Cypress (PI 561734) have shown susceptible SB ratings of 7 to 9 in
various inoculated field trials at the RRS (unpublished results).
The long-grain indica variety Jasmine 85 (PI 595927) was initially developed at the
International Rice Research Institute (IRRI), Philippines, from the cross ‘Peta*3/Taichung
Native 1’ and released in the U.S. by the USDA-ARS and the Texas Agricultural Experiment
Station in 1998 (Marchetti et al. 1998). Jasmine 85 is known to exhibit high levels of resistance
to SB in Louisiana, Texas, and Arkansas (Marchetti et al. 1998; Jia and Liu, 2011).
Unfortunately, Jasmine 85 has exhibited high levels of seed dormancy in Louisiana soils, so field
evaluation of this material is currently restricted at the RRS. The Vietnamese indica line WSS2,
derived from Tetep, was reported to show high levels of resistance (Wasano, 1998). H4/CODF is
a cobalt radiation-induced mutation derived from the Sri Lankan cultivar H4 (Rush et al. 2011)
and is partial resistant to SB disease (Sha, 1998). The long-grain resistant indica varieties
Taducan and Azmil were introduced into the U.S. from the Philippines with good SB resistance

16
(Rush et al. 2011). Similarly, Yangdao 6 is an elite indica line bred through irradiation induced
mutation showing resistance to multiple diseases (Dai et al. 2006). The restorer line Minghui 63,
developed by Xie et al (1987), is a Chinese indica variety derived from the cross IR30×Gui 630
with good resistance to SB. IR30 is a semi-dwarf variety from IRRI with good plant type, high
resistance to blast, bacterial blight, and brown plant hoppers and a good restorer for WA CMS A-
lines. The other parent, Gui 630, is an imported rice line from Guyana with high grain weight,
desirable grain quality and high yield potential (Xie et al. 1987). Starbonnet and Nortai were
developed and released cooperatively by the Agricultural Research Service, USDA and the
Arkansas Agricultural Experiment Station (Johnston, et al, 1968, 1973). Starbonnet was selected
in 1960 from the F6 generation from a cross between `Century Patna 231' (C.I. 8993) and
`Bluebonnet' (C.I. 8322) in Arkansas (Johnston, et al, 1968). Nortai was developed from the
cross ‘Northrose’ x P.I. 215936 (Johnston et al, 1973). CIAT 4 (Oryzica Llanos 5) developed by
the International Center for Tropical Agriculture, Cali, Colombia, was developed from the cross
P5269/P2060-F4-2-5-2. CIAT 7 (Araure 3) from Venezuela was derived from the cross
IR8/Peta5//Belle Patna and released as a variety 1984. Both indica cultivars show resistance to
SB disease in south America and Louisiana (personal communication, Y. Sanabria; Oard,
unpublished results). Drs. Rush, Groth, and Sha released 25 SB resistant lines in 2011 including
PI6658321 (Cypress/4/LSBR-5/Lemont//Teqing/3 /H4CODF) showing an average SB rating of 5
in field inoculated trials from 2007 to 2009 at Crowley. PI658327 (LSBR-5/LMNT//Teqing/
3/Cocodrie/4/Priscilla) produced an average resistance rating of 3.3 across the same field trials.
Field evaluations of different populations at RRS-Crowley, LA from 2013 to 2018
showed different sources of resistance. In the lines with the following pedigrees:
CIAT7/MCR010277, CPRS//CIAT4/ MCR010277, CCDR//CIAT8/ MCR010277, MCR010277

17
and CIAT 4 and CIAT 7 are the sources of resistance (Nelson et al. 2011);
KATY/CPRS/J85//CTHL line, the sources of SB resistance were from KATY (Moldenhauer, et
al. 1990) and J85 (Marchetti et al. 1998) and a line of this pedigree,
JODN/3/TDCN/SBNT//LSBR5/LMNT have the sources of resistance from Taducan (Rush et al.
2011) and LSBR5 (Xie et al. 1992). A line from the CCDR/SB5 RIL 46 cross: one of the
parents, SB5 RIL 46 is a recombinant inbred line developed from the cross Lemont/Jasmine 85.
The Lemont/Jasmine 85 mapping population, or SB5 mapping population, was developed under
the Rice Coordinated Agricultural Project (RiceCAP) and released on August 31, 2009 by USDA
ARS and University of Arkansas, Division of Agriculture. Another line developed for the
RiceCAP project was a doubled haploid mapping population (SB2 mapping population) from the
cross Cocodrie/MCR01027.
2.2. Materials and Methods
2.2.1. Plant materials
For the 2013 field season, approximately 700 F4-F5 sheath blight lines developed by Drs.
Oard and Rush (Table 2.1) were planted at the LSU AgCenter H. Rouse Caffey Rice Research
Station (RRS), Crowley, Louisiana. Previous research by Oard and Rush showed these lines
produced moderate to high levels of resistance in inoculated plots (unpublished results).
Table 2.1. Pedigree, generation and number of lines of sheath blight lines initially evaluated during the 2013 Field Season at H. Rouse Caffey Rice Research Station, Crowley, Louisiana.
Pedigree Generation No. of lines 09DN/RUSH072 F4-F5 30 09DN/RUSH222 F4-F5 35 09DN/RUSH222//SBR174 F4-F5 35 09DN157//TRP545/CL161 F4-F5 30 09SB131/SB125 F4-F5 30 35-9/41-3 F4-F5 30
Table 2.1 continued

18
2.2.2. Field evaluation of elite breeding lines
Thirty-three selections from the 700 F4-F5 sheath blight lines described above were
planted and advanced in the summers of 2014-2018at the H. Rouse Caffey Rice Research
Station, LSU AgCenter, Crowley, Louisiana. The breeding material was typically planted in late
March or in early April of each year with the Hege 90 Magazine planter in 2-meter rows, 0.025
meter row width, with approximately 50 seeds per row. The number of rows per population or
line varied with seed availability. High plant density was desired for better disease induction.
Management of the crop, pests and diseases was based on the LSU Rice Production handbook.
Nitrogen application consisted of 120 kg/ha on dry soil pre-flood, and herbicide application was
carried out at the 2 to 4-leaf stage for control of broad-leaf and grassy weeds.
Pedigree Generation No. of lines CIAT 4/MCR010277 F4-F5 35 CIAT 7/MCR010277 F4-F5 35 CIAT 8/MCR010277 F4-F5 35 GSOR101019 F4-F5 35 JODN/3/TDCN/SBNT//LSRR5/LMNT F4-F5 30 KATY/CPRS/J85//CTHL F4-F5 30 PI658321 Inbred 10 PI658327 Inbred 10 RUSH C99-1166 Inbred 10 RUSHSBR4 F4-F5 30 RUSHSBR4/09125 F4-F5 30 SB125/SB131 F4-F5 30 SB2-102 F4-F5 30 SB2-174 F4-F5 30 SB2-225 F4-F5 30 SB2-3 F4-F5 30 SB5 RIL 46 F4-F5 30 WELLS/CANTORSB51//97URN128/96CR921 F4-F5 30

19
Plants in each row were inoculated with isolate LR172 of R. solani at the late-tillering –
joint elongation stage. The inoculum was prepared by Dr. Groth at the RRS (inoculum
preparation discussed below). Disease scoring was recorded at the soft-dough stage using the 0 -
9 rating where 0 = highly resistant and 9 =highly susceptible. From five to eight panicles from
each selected row were harvested by hand at maturity, threshed, cleaned, and dried to 12%
moisture for storage at 4C.
For the 2016 and 2017 field seasons, the 7 best lines selected from the 2015 field
evaluation was planted in 3 rows plot with one replication for inoculated plot and the other in
uninoculated in a completely randomized block design. Susceptible checks, CL151, CL111,
CL152, CL153, Cocodrie, and Catahoula, as well as Teqing and MCR010277 were planted. This
was done to determine the percent (%) yield reduction in an inoculated SB plot.
2.2.3. R. solani – LR172 inoculum preparation
Isolate LR172 was originally identified from a naturally infected rice plant (cv.
Lebonnet) in Louisiana by the late Dr. Rush in 1972 (Groth and Bond, 2006). Briefly, the
inoculum was produced on a moist, autoclaved rice grain/rice hull mixture (1:2 vol/vol)
incubated in the dark for 12 to 14 days at 30°C. The grain-hull inoculum was broken into small
(3- to 7-mm diameter) particles, consisting of several rice grains held together by fungal mycelia.
Approximately 100 ml (17 ml m-2) were distributed evenly over each row by hand except for
non-inoculated controls.
2.2.4. Crosses of elite lines to Louisiana varieties
Louisiana commercial varieties are known to be moderately to highly susceptible to SB
disease (Rush et al., 2011). Traditionally bred Louisiana varieties, such as Cypress (Linscombe
et al. 1993), Cocodrie (Linscombe et al. 2000), Catahoula (Blanche et al. 2009) and the

20
Clearfield varieties CL111 (Oard et al. 2013), CL151 (Blanche et al. 2010), CL152 (Oard et al.
2013), CL153 (Famoso et al. 2016) and CL161 (Blanche et al. 2011) were used as recurrent
parents for the breeding activities. Selected SB lines from the field evaluation were used as
pollen donors.
The designated female parent (recurrent parent) must have its anthers removed before
being pollinated with pollen donor (male parent). Briefly, the anthers were emasculated with hot
water treatment and vacuum suction. First, the spikelets of the recurrent parent was treated with
hot water treatment in a water bath, 45o for 5 minutes. Immediately after being removed from the
hot water, the spikelets were allowed to air dry before clipping. The panicle was trimmed from
the bottom upward to leave 25-35 well-spaced spikelets to be emasculated. One-third of the
glume was clipped off of each spikelet, and remaining spikelets that have not opened were cut
off with a pair of scissors. An opening is then cut on each of the selected spikelets separately so
that the anthers come free to be vacuumed out of the spikelet through suction force by using a
small vacuum pump. The emasculated panicle was then covered with a labeled glassine crossing
bag before the plant was moved back into the greenhouse ready for pollination.
Immediately after emasculation cross pollination was done inside the greenhouse when
available pollen from a donor plant was readily available for pollination. Pollination was done by
slowly and carefully swirling the flowering male panicle of the donor plant above the
emasculated female panicle of the recurrent parent in a glassine crossing bag. After pollination,
the appropriate information on the parent donor plant was written on the glassine cross bag and
the bag is placed back over the recurrent parent panicle. The F1 seeds from each cross were
allowed to mature and harvested in about 28-34 days. For this study, a total of 102 crosses were
made for each year from 2014 to 2018 using 17 original donor lines (SB5 RIL 46, SB2-174,

21
SB2-3, CIAT4/MCR010277, CIAT7/MCR010277, SB2-102, SB2-225,
JODN/3/TDCN/SBNT//LSRR5/LMNT, PI658321 - C99-1249
CPRS/4/LSBR5/LMNT//TQNG/3/H4CODF, PI658327 - C99-1166
LSBR5/LMNT//TQNG/3/CCDR/4/PSCL, PI658335 - COO-1700 LSBR5/LMNT//TQNG
/4/LSBR5/LMNT/3/ H4CODF//NTAI(03-10993-11019, RUSH C99-1166 (LSBR5),
KATY/CPRS/J85//CTHL, 09DN/RUSH222//SBR174, RUSHSBR4, RUSHSBR4/09125, 35-
9/41-3, GSOR101019) and 7 recurrent parents (Catahoula, Cocodrie, CL111, CL151, CL153 and
CL161). Breeding material was advanced from the F1 to the BC2F3 generation from 2014 to
2018.
2.2.5. F1 nursery
The F1 seeds produced from each of the crosses including the parents were sown in the
greenhouse in a 11.29 cm2 x 5.08 cm peat pots tall with garden soil mixed with ShowScape
potting soil in a 1:1 ratio until the seedlings are ready to be transplanted in the F1 nursery field.
Twenty-one to 30 day old rice seedlings were planted in a slightly flooded field in 5 seedlings
per 1 m row, 30.48 cm apart per seedlings (Figure 2.1) to produce good amount of tillers and
spikelets needed for crossing activities.
2.2.6. Population development of SB lines F1 seeds produced from the different crosses were planted in the F1 nursery at RRS in
2014. Plants in the F1 with good plant height and plant type were selected and tagged with a
white painted wooden stake marked with its parental cross for identification. F2 seeds were
harvested from individual selected plants from each row. Twenty to 30 grams of seeds from the
selected F2 plants were planted in the Puerto Rico off-season nursery in July 2014. F2 plants were
selected based on maturity, height, tillering, panicle size, panicle exsertion, grain shape, disease

22
Figure 2.1. F1 seedlings grown in the greenhouse and field at Crowley; a. F1seedlings growing in peat pots inside the greenhouse; b. 30-day old seedlings growing in the field nursery; c. seedlings at tillering stage growing in field nursery. resistance and overall plant type. Panicles harvested in the off-season nursery were sent back to
Crowley and planted for the 2015 summer field evaluation experiments. The breeding materials
(F3) were grown as panicle (head) rows and the best rows were selected to advance to the next
generation.
2.2.7. Data analyses
During the field evaluations, sheath blight disease score was recorded at the soft-dough
stage using the 0 - 9 rating where 0 = highly resistant and 9 =highly susceptible. Three rows per
line were scored. Plant height of 3 random plants in each row was measured. For the 2016 and
2017 field season where there was inoculated and inoculated plots, 3 rows per replication were
harvested to determine the grain yield.
Analysis of variance (ANOVA) was computed with Fisher’s Least Significant Difference
(L.S.D.) post hoc test, coefficient of variation (C.V.), and standard error (S.E.). Correlation
analysis was also computed on days to heading, disease score, plant height and grain weight of
a b
c

23
the resistant donor plants, selected sheath blight lines and the susceptible plants in the inoculated
conditions.
2.3. Results and Discussion 2.3.1. Field evaluation of elite breeding lines
2013 Field Trial
Both SB sources MCR and Teqing showed resistant SB ratings of 1.0 as shown in Table
2.2 that were consistent with previous field research at the RRS (Rush et al. 2011; Groth et al.
2013). SB lines PI658321 and PI658327 produced moderately-resistant ratings of 4.0 that were
comparable to the respective ratings of 4.9 and 3.3 as reported by Rush et al. in 2011 at the RRS.
The susceptible checks Catahoula and Cocodrie produced susceptible rating of 7.5 and 8.0 in
2013 that were akin to previous field trials at the RRS (Groth et al. 2013).
From a total of 700 lines inoculated with R. solani in 2013 at the RRS, 29 selected
breeding lines produced moderate to high levels of resistance with ratings varying from 3.5 to
5.0 (Table 2.2). A total of 17 SB sources were used as parents to develop the selected lines.
Resistant parents CIAT 8 and MCR presumably contributed to resistance in lines 3, 6, 9, 27, and
29. MCR was crossed to resistant CIAT 4 and 7 and to susceptible Cocodrie and Trenasse in
selected lines 7, 8, 10, 25, 26, 28 with ratings that varied from 4.0 to 5.0. These selected lines
produced similar disease reactions to PI658321 and PI658327, but the lines were on average 2 to
5 cm taller, most likely due to the tall CIAT accessions from South America. RiceCAP RILs
SB5-46 (line 4) produced a resistant response of 3.5 and good height of 98 cm. Lines 20 and 21
exhibited moderate resistance levels of 4.0 with good plant heights of 93 and 94 cm,
respectively. SB2-3 crossed to Catahoula in line 5 showed moderate resistance, but with a tall
plant height of 121 cm.
24
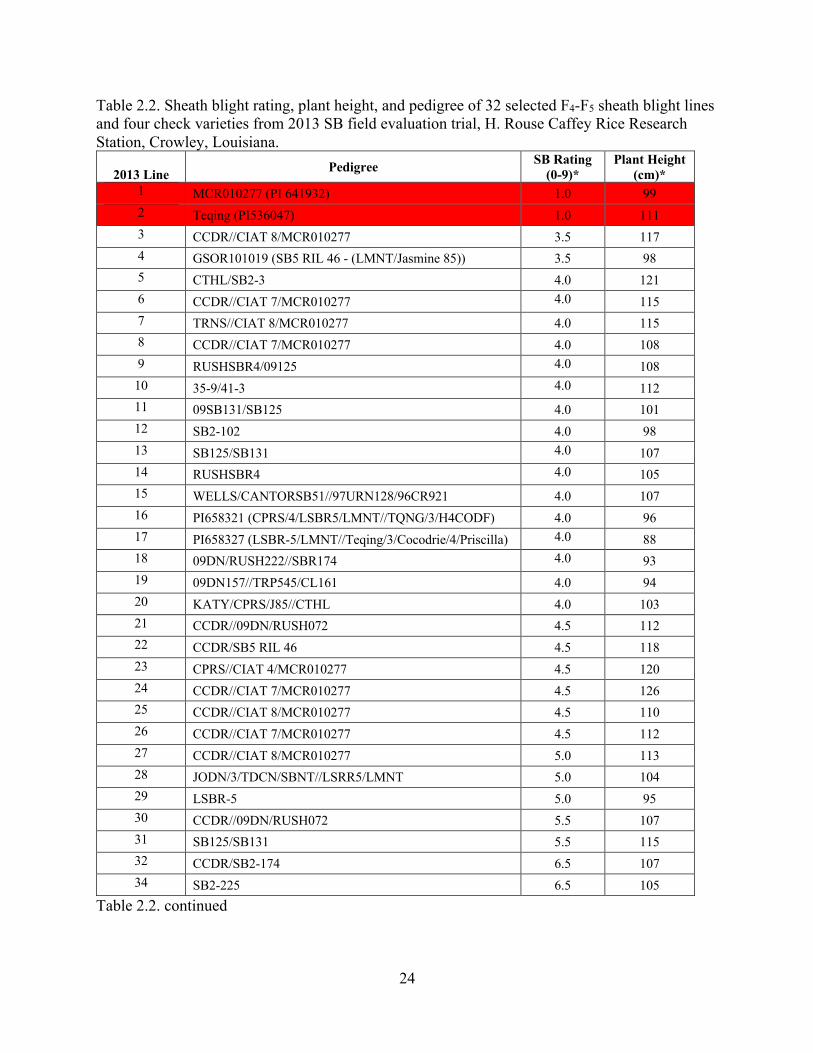
Table 2.2. Sheath blight rating, plant height, and pedigree of 32 selected F4-F5 sheath blight lines and four check varieties from 2013 SB field evaluation trial, H. Rouse Caffey Rice Research Station, Crowley, Louisiana.
2013 Line Pedigree SB Rating
(0-9)* Plant Height
(cm)* 1 MCR010277 (PI 641932) 1.0 99 2 Teqing (PI536047) 1.0 111 3 CCDR//CIAT 8/MCR010277 3.5 117 4 GSOR101019 (SB5 RIL 46 - (LMNT/Jasmine 85)) 3.5 98 5 CTHL/SB2-3 4.0 121 6 CCDR//CIAT 7/MCR010277 4.0 115 7 TRNS//CIAT 8/MCR010277 4.0 115 8 CCDR//CIAT 7/MCR010277 4.0 108 9 RUSHSBR4/09125 4.0 108 10 35-9/41-3 4.0 112 11 09SB131/SB125 4.0 101 12 SB2-102 4.0 98 13 SB125/SB131 4.0 107 14 RUSHSBR4 4.0 105 15 WELLS/CANTORSB51//97URN128/96CR921 4.0 107 16 PI658321 (CPRS/4/LSBR5/LMNT//TQNG/3/H4CODF) 4.0 96 17 PI658327 (LSBR-5/LMNT//Teqing/3/Cocodrie/4/Priscilla) 4.0 88 18 09DN/RUSH222//SBR174 4.0 93 19 09DN157//TRP545/CL161 4.0 94 20 KATY/CPRS/J85//CTHL 4.0 103 21 CCDR//09DN/RUSH072 4.5 112 22 CCDR/SB5 RIL 46 4.5 118 23 CPRS//CIAT 4/MCR010277 4.5 120 24 CCDR//CIAT 7/MCR010277 4.5 126 25 CCDR//CIAT 8/MCR010277 4.5 110 26 CCDR//CIAT 7/MCR010277 4.5 112 27 CCDR//CIAT 8/MCR010277 5.0 113 28 JODN/3/TDCN/SBNT//LSRR5/LMNT 5.0 104 29 LSBR-5 5.0 95 30 CCDR//09DN/RUSH072 5.5 107 31 SB125/SB131 5.5 115 32 CCDR/SB2-174 6.5 107 34 SB2-225 6.5 105
Table 2.2. continued

25
2013 Line Pedigree SB Rating
(0-9)* Plant Height
(cm)* 35 Catahoula 7.5 104 36 Cocodrie 8.0 84
LSD 0.05 1.07 13.78 Std. dev 1.35 9.54
*Mean values from 3 replications, 3 rows per replication; red cells – resistant check varieties; yellow cells – susceptible check varieties 2014 Field Trial
SB lines MCR and Teqing showed ratings of 3 to 4 in 2014 Crowley field trials as shown
in Table 2 that were consistent with the 2013 field trials (Table 2.). Similarly, susceptible checks
Cocodrie and Catahoula produced high ratings of 7 and 9 in 2014 that were comparable to the
2013 results. Lines 17 (WELLS/CANTORSB51//97URN128/96CR921), 19 (PI658327), and 27
(CCDR//CIAT 8/MCR010277) showed consistency in disease response as the 2014 SB rating of
4 for this material was identical to those in the 2013 trial. On the other hand, several
Table 2.3. Analysis of variance on SB disease rating of the selected SB resistant lines and resistant and susceptible checks from the 2013 SB field evaluation trial, H. Rouse Caffey Rice Research Station, Crowley, Louisiana.
Source of Variation SS df MS F P-value F crit
Between Groups 45.57 2 22.78 43.73 7.0299E-10 3.29
Within Groups 16.67 32 0.52
Total 62.24 34 Table 2.4. Analysis of variance on plant height of the selected SB resistant lines and resistant and susceptible checks from the 2013 SB field evaluation trial, H. Rouse Caffey Rice Research Station, Crowley, Louisiana.
Source of Variation SS df MS F P-value F crit
Between Groups 343.19 2 171.60 1.99 0.15 3.29
Within Groups 2749.54 32 85.92
Total 3092.74 34
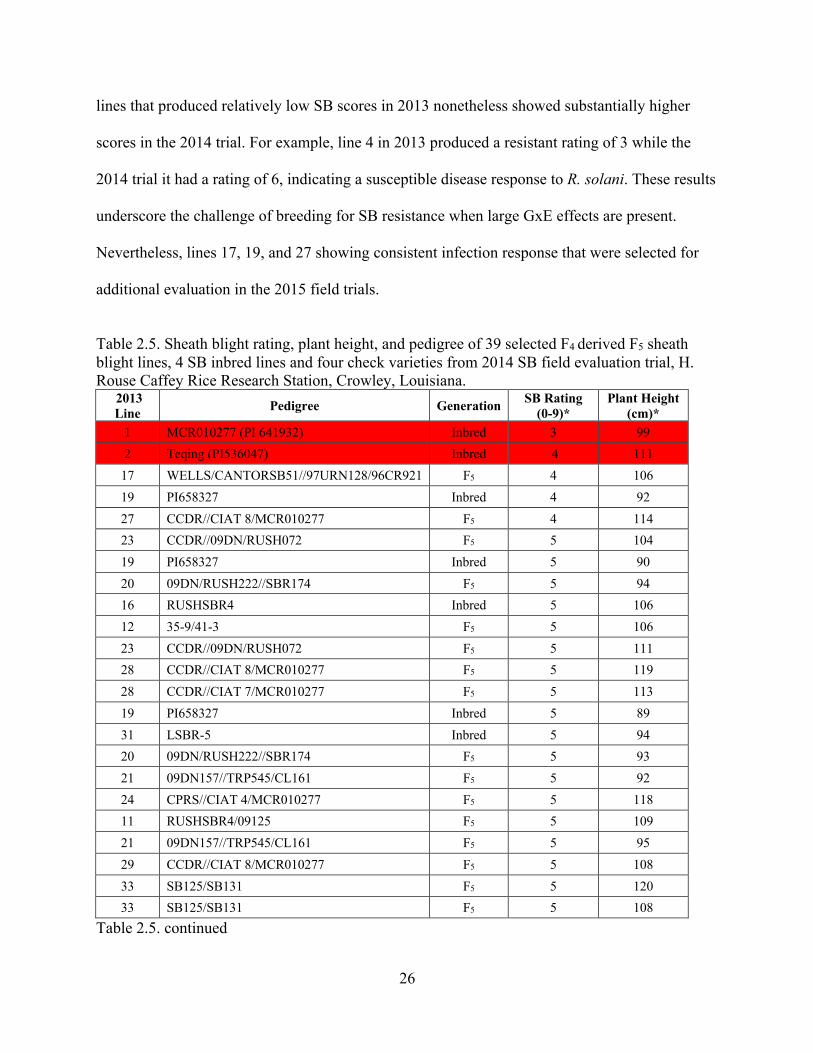
26
lines that produced relatively low SB scores in 2013 nonetheless showed substantially higher
scores in the 2014 trial. For example, line 4 in 2013 produced a resistant rating of 3 while the
2014 trial it had a rating of 6, indicating a susceptible disease response to R. solani. These results
underscore the challenge of breeding for SB resistance when large GxE effects are present.
Nevertheless, lines 17, 19, and 27 showing consistent infection response that were selected for
additional evaluation in the 2015 field trials.
Table 2.5. Sheath blight rating, plant height, and pedigree of 39 selected F4 derived F5 sheath blight lines, 4 SB inbred lines and four check varieties from 2014 SB field evaluation trial, H. Rouse Caffey Rice Research Station, Crowley, Louisiana.
2013 Line Pedigree Generation SB Rating
(0-9)* Plant Height
(cm)* 1 MCR010277 (PI 641932) Inbred 3 99
2 Teqing (PI536047) Inbred 4 111
17 WELLS/CANTORSB51//97URN128/96CR921 F5 4 106
19 PI658327 Inbred 4 92
27 CCDR//CIAT 8/MCR010277 F5 4 114
23 CCDR//09DN/RUSH072 F5 5 104
19 PI658327 Inbred 5 90
20 09DN/RUSH222//SBR174 F5 5 94
16 RUSHSBR4 Inbred 5 106
12 35-9/41-3 F5 5 106
23 CCDR//09DN/RUSH072 F5 5 111
28 CCDR//CIAT 8/MCR010277 F5 5 119
28 CCDR//CIAT 7/MCR010277 F5 5 113
19 PI658327 Inbred 5 89
31 LSBR-5 Inbred 5 94
20 09DN/RUSH222//SBR174 F5 5 93
21 09DN157//TRP545/CL161 F5 5 92
24 CPRS//CIAT 4/MCR010277 F5 5 118
11 RUSHSBR4/09125 F5 5 109
21 09DN157//TRP545/CL161 F5 5 95
29 CCDR//CIAT 8/MCR010277 F5 5 108
33 SB125/SB131 F5 5 120
33 SB125/SB131 F5 5 108
Table 2.5. continued

27
2013 Line
Pedigree Generation SB Rating
(0-9)* Plant Height
(cm)* 18 PI658321 Inbred 5 97
28 CCDR//CIAT 7/MCR010277 F5 5.5 115
28 CCDR//CIAT 7/MCR010277 F5 6 110
24 CCDR/SB5 RIL 46 F5 6 123
28 CCDR//CIAT 8/MCR010277 F5 6 105
28 CCDR//CIAT 8/MCR010277 F5 6 112
26 CCDR//CIAT 7/MCR010277 F5 6 121
26 CCDR//CIAT 7/MCR010277 F5 6 115
35 SB2-225 F5 6 103
33 SB125/SB131 F5 6 107
28 CCDR//CIAT 7/MCR010277 F5 6 113
5 CTHL/SB2-3 F5 7 119
14 SB2-102 F5 6 96
29 CCDR//CIAT 8/MCR010277 F5 6 118
13 09SB131/SB125 F5 6 100
4 GSOR101019 F5 6 100
9 TRNS//CIAT 8/MCR010277 F5 6 117
34 CCDR/SB2-174 F5 6 109
26 CCDR//CIAT 7/MCR010277 F5 6 124
4 GSOR101019 F5 6 97
28 CCDR//CIAT 7/MCR010277 F5 7 114
28 CCDR//CIAT 8/MCR010277 F5 7 116
23 CCDR//09DN/RUSH072 F5 9 108
36 Catahoula Inbred 7 105
37 Cocodrie Inbred 9 93 LSD 0.05 1.12 14.69 Std. dev 0.98 10.05
*Mean values from 3 replications, 3 rows per replication; red cells – resistant check varieties; yellow cells – susceptible check varieties 2015 Field Trial
Table 2.8 shows that MCR and Teqing produced resistant reactions in 2015 as in the
previous two years at Crowley. Susceptible checks Cocodrie and Catahoula also exhibited
consistent results across the three years of field trials. The average SB rating across the 25
selected lines in 2015 was 4.3 vs. 7.5 for the Cocodrie and Catahoula susceptible checks and

28
3.0 for resistant MCR and Teqing. The majority of the selected lines evaluated in 2015 produced moderate to resistant SB reactions of 3 to 5 that were similar to those observed in 2014 (Table
2.5) and in 2013 (Table 2.2). Certain lines such as 5 (CTHL/SB2-3) were inconsistent in their
disease reactions across the three years. Mean plant height of the 25 selected lines in 2015 was
Table 2.6. Analysis of variance of SB disease rating of the selected SB resistant lines and resistant and susceptible checks from the 2014 SB field evaluation trial, H. Rouse Caffey Rice Research Station, Crowley, Louisiana.
Source of Variation SS df MS F P-value F crit
Between Groups 20.65 2 10.33 17.19
1.96353E-06 3.18
Within Groups 30.64 51 0.60
Total 51.29 53 Table 2.7. Analysis of variance of plant height of the selected SB resistant lines and resistant and susceptible checks from the 2014 SB field evaluation trial, H. Rouse Caffey Rice Research Station, Crowley, Louisiana.
Source of Variation SS Df MS F P-value F crit
Between Groups 96.82 2 48.41 0.47 0.63 3.18
Within Groups 5251.54 51 102.97
Total 5348.37 53
111 cm vs. 105 for resistant lines Teqing and MCR and 97 cm for Cocodrie and Catahoula.
Selection 17 (WELLS/ CANTORSB51//97URN128/96CR921) showed a mean disease rating of
4.0 across the three years with an average height of 104 cm.
The eight new lines 38 to 45 shown in Table 2.8 were comprised of additional Plant
Introductions (Rush et al. 2011) such as PI658335 (line 39) and crosses of original selections
(Table 2.2) to susceptible varieties such as line 38 or new sources of resistance such as line 41.
29
Disease ratings for the new lines in 2015 ranged from 4 to 6 and plant height varied greatly from
93 to 122 cm. New line 38 (CCDR/PI658335) produced the identical disease rating of 4 as the
donor parent PI 658335 with a substantial height reduction of 12 cm at 95 cm.
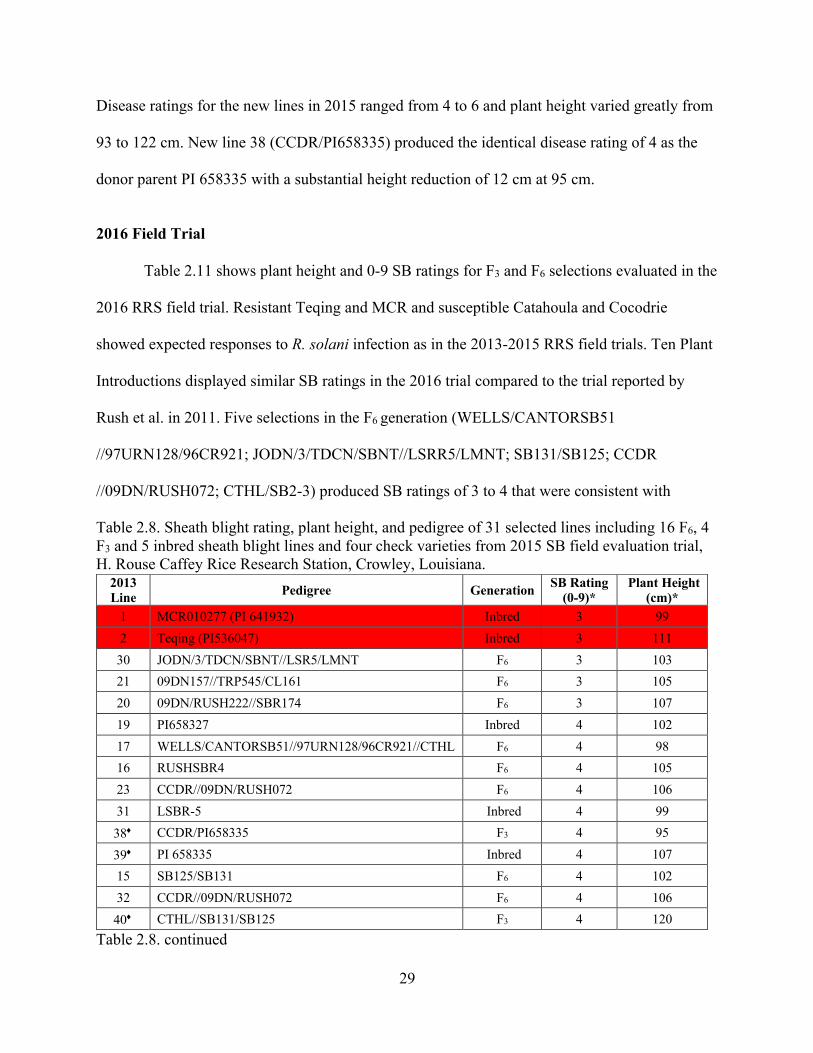
2016 Field Trial Table 2.11 shows plant height and 0-9 SB ratings for F3 and F6 selections evaluated in the
2016 RRS field trial. Resistant Teqing and MCR and susceptible Catahoula and Cocodrie
showed expected responses to R. solani infection as in the 2013-2015 RRS field trials. Ten Plant
Introductions displayed similar SB ratings in the 2016 trial compared to the trial reported by
Rush et al. in 2011. Five selections in the F6 generation (WELLS/CANTORSB51
//97URN128/96CR921; JODN/3/TDCN/SBNT//LSRR5/LMNT; SB131/SB125; CCDR
//09DN/RUSH072; CTHL/SB2-3) produced SB ratings of 3 to 4 that were consistent with
Table 2.8. Sheath blight rating, plant height, and pedigree of 31 selected lines including 16 F6, 4 F3 and 5 inbred sheath blight lines and four check varieties from 2015 SB field evaluation trial, H. Rouse Caffey Rice Research Station, Crowley, Louisiana.
Table 2.8. continued
2013 Line Pedigree Generation SB Rating
(0-9)* Plant Height
(cm)* 1 MCR010277 (PI 641932) Inbred 3 99
2 Teqing (PI536047) Inbred 3 111
30 JODN/3/TDCN/SBNT//LSR5/LMNT F6 3 103
21 09DN157//TRP545/CL161 F6 3 105
20 09DN/RUSH222//SBR174 F6 3 107
19 PI658327 Inbred 4 102
17 WELLS/CANTORSB51//97URN128/96CR921//CTHL F6 4 98
16 RUSHSBR4 F6 4 105
23 CCDR//09DN/RUSH072 F6 4 106
31 LSBR-5 Inbred 4 99
38¨ CCDR/PI658335 F3 4 95
39¨ PI 658335 Inbred 4 107
15 SB125/SB131 F6 4 102
32 CCDR//09DN/RUSH072 F6 4 106
40¨ CTHL//SB131/SB125 F3 4 120

30
*Mean values from 3 replications, 3 rows per replication; red cells – resistant check varieties; yellow cells – susceptible check varieties; ¨additional lines added in 2015 trial at Crowley. previous RRS trials in 2015. The F3 selection CCDR/12:964-1 (PI 658335) exhibited a SB rating
of 5 that was identical to the original resistant donor line PI 658325. Plant height of the selected
lines ranged from 89 cm to 105 cm which was acceptable for parental breeding germplasm.
Table 2.9. Analysis of variance of SB disease rating of the selected SB resistant lines and resistant and susceptible checks from the 2015 SB field evaluation trial, H. Rouse Caffey Rice Research Station, Crowley, Louisiana.
Source of Variation SS df MS F P-value F crit
Between Groups 25.88 2 12.94 31.87 5.2768E-09 3.23
Within Groups 16.24 40 0.41
Total 42.12 42
2013 Line Pedigree Generation
SB Rating (0-9)*
Plant Height (cm)*
7 CCDR//CIAT 7/MCR010277 F6 4 126
12 35-9/41-3 F6 4 119
6 CCDR//CIAT 8/MCR010277 F6 5 113
7 CCDR//CIAT 7/MCR010277 F6 5 118
21 09DN157//TRP545/CL161 F6 5 129
41¨ MCR010277/YANGDAO 4 F3 5 104
42¨ PI 658320 Inbred 5 110
25 CPRS//CIAT 4/MCR010277 F6 5 119
43¨ CCDR/RUSH8:247 F3 5 114
28 CCDR//CIAT 7/MCR010277 F6 5 125
44¨ CTHL//SB131/SB125 F3 5 122
45¨ PI658321 Inbred 6 93
5 CTHL/SB2-3 F6 6 93
37 Catahoula Inbred 7 104
37 Cocodrie Inbred 8 90 LSD 0.05 0.93 13.82 Std. dev 1.00 9.53

31
Table 2.10. Analysis of variance of plant height of the selected SB resistant lines and resistant and susceptible checks from the 2015 SB field evaluation trial, H. Rouse Caffey Rice Research Station, Crowley, Louisiana.
Source of Variation SS df MS F P-value F crit
Between Groups 256.60 2 128.30 1.44 0.24 3.23
Within Groups 3556.41 40 88.91
Total 3813.00 42 Table 2.11. Plant height and SB ratings for F4 and F7 selections evaluated at the RRS, 2016
Pedigree Generation SB Rating (0-9)*
Plant Height (cm)*
Teqing (PI536047) Inbred 3 110
MCR010277 (PI 641932) Inbred 4 99
WELLS/CANTORSB51//97URN128/96CR921 F7 3 98
JODN/3/TDCN/SBNT//LSRR5/LMNT F7 3 89
SB131/SB125 F7 3 96
CCDR//09DN/RUSH072 F7 4 102
PI 658320 Inbred 3 94
SB125/SB131 F7 4 96
SB2-225 F7 4 94
PI658327 Inbred 4 80
SB125/SB132 F7 4 103
CTHL/SB2-3 F7 4 105
PI 658327 Inbred 4 85
PI 658331 Inbred 4 85
CL111/GSOR101021 F4 4 97
PI 658330 Inbred 4 86
PI 658314 Inbred 5 105
CCDR/PI 658335 F4 5 100
PI 658321 Inbred 5 81
PI 658329 Inbred 5 101
PI 658325 Inbred 5 79
Catahoula Inbred 8 100
Cocodrie Inbred 9 92
LSD 0.05 0.56 7.78 Std. dev 0.95 5.37
*Mean values from 3 replications, 3 rows per replication; red cells – resistant check varieties; yellow cells – susceptible check varieties

32
Table 2.12. Analysis of variance of SB disease rating of the selected SB resistant lines and resistant and susceptible checks from the 2016 SB field evaluation trial, H. Rouse Caffey Rice Research Station, Crowley, Louisiana.
Source of Variation SS df MS F P-value F crit
Between Groups 54.68 2 27.34 187.56 1.1553E-21 3.22
Within Groups 6.12 42 0.15
Total 60.8 44 Table 2.13. Analysis of variance of plant height of the selected SB resistant lines and resistant and susceptible checks from the 2016 SB field evaluation trial, H. Rouse Caffey Rice Research Station, Crowley, Louisiana.
Source of Variation SS df MS F P-value F crit
Between Groups 80.47 2 40.24 1.42 0.25 3.22
Within Groups 1188.84 42 28.31
Total 1269.31 44 2017 Field Trial
Table 2.14 shows plant height and 0-9 SB ratings for F3, F8 and BC2F3 selections
evaluated at the RRS in 2017. As in previous trials, the resistant and susceptible checks produced
expected SB ratings. Six selections in the F8 generation (09DN157//TRP545/CL161;
CTHL/SB2-3; CCDR/PI 658335; SB131/SB125; CCDR//09DN/RUSH072;
WELLS/CANTORSB51//97URN128/96CR921) showed good levels of resistance (SB ratings =
3) that were similar to previous trials in 2015 and 2016. Several F2 and BC2F2 selections
displayed apparent high levels of resistance, but this early-generation material will require
additional field testing to confirm the 2017 results.

33
Table 2.14. Plant height and SB ratings for F3, F4 derived F8 and BC2F3 selections evaluated at the RRS, 2017.
Pedigree Generation SB Rating (0-9)*
Plant Height (cm)*
Teqing (PI536047) Inbred 1 111
MCR010277 (PI 641932) Inbred 3 98
RUSH C99-1166 (LSBR-5) F 3 95
09DN157//TRP545/CL161 F8 3 92
JODN/3/TDCN/SBNT//LSRR5/LMNT F8 3 91
CTHL/SB2-3 F8 3 91
CCDR/PI 658335 F5 3 93
PI 658327 Inbred 3 96
PI 658335 Inbred 3 89
SB131/SB125 F8 3 95
CCDR//09DN/RUSH072 F8 3 104
WELLS/CANTORSB51//97URN128/96CR921 F8 3 97
15HB125/SB125/SB131 F8 3 101
15HB180/PI658327 F3 3 94
15HB181/09DN157//TRP545/CL161 F3 3 101
15HB114/SB125/SB131 F3 3 100
15HB017/09DN/RUSH222//SBR174 F3 3 88
15HB017/09DN157//TRP545/CL161 F3 3 90
15HB180/PI658327 F3 3 100
15HB017/CTHL/SB2-3 F3 3 91
15HB180/09DN/RUSH222//SBR174 F3 3 102
15HB017/RUSHSBR4 F3 3 96
15HB114/JODN/3/TDCN/SBNT//LSRR5/LMNT F3 3 101
15HB127/PI658327 F3 3 97
15HB128/PI658327 F3 3 98
15HB180/09SB131/SB125 F3 3 98
15HB128/JODN/3/TDCN/SBNT//LSRR5/LMNT F3 4 107
15HB180/09DN157//TRP545/CL161 F3 4 97
15HB181/RUSH C99-1166 (LSBR-5) F3 4 93
15HB017/09DN/RUSH222 F3 4 92
15HB017/WELLS/CANTORSB51//97URN128/96CR921//CTHL F3 4 90
Table 2.14. continued

34
Pedigree Generation SB Rating
(0-9)* Plant Height
(cm)*
15HB050/SB131/SB125 F3 4 104
CL161//CL161/PI 658314 BC2F3 4 98
CCDR//09DN/RUSH072 BC2F3 4 98
CCDR//CCDR/PI658327 BC2F3 4 103
CCDR//CPRS//CIAT 4/MCR010277 BC2F3 4 95
CCDR//WELLS/CANTORSB51//97URN128/96CR921 BC2F3 4 102
CCDR//JODN/3/TDCN/SBNT//LSRR5/LMNT BC2F3 4 97
CCDR//SB125/SB131 BC2F3 4 100
CCDR//CCDR/09DN/RUSH222 BC2F3 4 94
CCDR//CCDR/PI 658314 BC2F3 4 94
CTHL//WELLS/CANTORSB51//97URN128/96CR921 BC2F3 4 102
CTHL//JODN/3/TDCN/SBNT//LSRR5/LMNT BC2F3 4 103
CTHL//CTHL/RUSHSBR4 BC2F3 4 103
CTHL//SB125/SB131 BC2F3 4 101
CTHL//CTHL/SB2-225 BC2F3 4 98
CTHL//CTHL/RUSH C99-1166 (LSBR-5) BC2F3 4 102
CTHL//09DN/RUSH222 BC2F3 4 96
CTHL//WELLS/CANTORSB51//97URN128/96CR921 BC2F3 4 96
CTHL//SB131/SB125 BC2F3 4 97
CTHL//CPRS/Oryzica Llanos 5 BC2F3 4 96
CTHL//RUSHSBR4/09125 BC2F3 4 98
CTHL//SB131/SB125 BC2F3 4 101
CTHL//SB125/SB131 BC2F3 4 108
CTHL//CTHL/PI658327 BC2F3 4 98
CTHL//WELLS/CANTORSB51//97URN128/96CR921 BC2F3 4 101
CTHL//CTHL/RUSHSBR4 BC2F3 4 97
CL161//09DN/RUSH222//SBR174 BC2F3 4 95
CL161//CL161/PI 658321 BC2F3 4 101
JODN/3/TDCN/SBNT//LSRR5/LMNT F3 4 97
15HB172/PI658327 F3 4 97
15HB180/SB2-225 F3 4 101
CL151//CPRS/Oryzica Llanos 5 F3 4 93
CL151//CCDR/PI658335 F3 4 107
CCDR/PI658335 F4 4 105
Table 2.14. continued

35
Pedigree Generation SB Rating
(0-9)* Plant Height
(cm)*
CTHL//CCDR/PI658335 BC2F3 4 104
PI 658320 Inbred 4 105
CTHL/SB2-3 F8 4 113
CL111/GSOR101021 F4 4 100
15HB172/RUSHSBR4 F3 4 100
CCDR//CCDR/RUSH C99-1166 (LSBR-5) BC2F3 5 100
CCDR/PI658335 F4 5 106
CPRS/Oryzica Llanos 5 F3 5 112
CCDR//CPRS/Oryzica Llanos 5 F3 6 111
SB125/SB132 F8 6 100
CL152 Inbred 6 95
CL153 Inbred 6 84
CL111 Inbred 7 88
CL151 Inbred 8 102
Catahoula Inbred 8 86
Cocodrie Inbred 8 89 LSD 0.05 0.90 8.28 Std. dev 0.83 6.10
*Mean values from 3 replications, 3 rows per replication; red cells – resistant check varieties; yellow cells – susceptible check varieties Table 2.15. Analysis of variance of SB disease rating of the selected SB resistant lines and resistant and susceptible checks from the 2016 SB field evaluation trial, H. Rouse Caffey Rice Research Station, Crowley, Louisiana.
Source of Variation SS Df MS F P-value F crit
Between Groups 62.57 2 31.28 75.40 8.2144E-26 3.04
Within Groups 93.77 226 0.41
Total 156.34 228

36
Table 2.16. Analysis of variance of plant height of the selected SB resistant lines and resistant and susceptible checks from the 2016 SB field evaluation trial, H. Rouse Caffey Rice Research Station, Crowley, Louisiana.
Source of Variation SS df MS F P-value F crit
Between Groups 579.83 2 289.92 8.28 0.0003 3.036
Within Groups 7905.05 226 34.98
Total 8484.89 228 2018 Field Trial
Table 2.17 below shows 50% heading date, plant height and 0-9 SB ratings for F3, F4, F9,
BC2F3 and BC3F2 selections evaluated at the RRS in 2018. As in previous trials, the resistant and
susceptible checks produced expected SB ratings. Ten selections in the F8 generation
(JODN/3/TDCN/SBNT//LSRR5/LMNT, 09DN157//TRP545/CL161, CTHL/SB2-3, CCCDR/PI
658335, CCDR//09DN/RUSH072, SB131/SB125, CL111/GSOR101021,
CCDR//09DN/RUSH072, WELLS/CANTORSB51//97URN128/96CR921, SB125/SB132)
showed good levels of resistance (SB ratings = 3) that were similar to previous trials in 2015,
2016, or 2017 at the RRS.
Several F3, F4 and BC2F3 and BC3F2 selections displayed apparent high levels of
resistance, desirable maturity, and plant height, but this early-generation material will require
additional field testing to confirm the 2018 results.
Table 2.17. Maturity, plant height and 0-9 SB ratings for F3, F4, F4 derived F9 and BC2F3, BC3F2 selections evaluated at the RRS, 2018.
Pedigree Generation 50%
Heading
Plant Height (cm)*
SB Rating (0-9)*
MCR010277 Inbred 102 90 3 TEQING Inbred 110 111 3 CCDR//CCDR/PI658327 BC2F3 103 100 4 CCDR//CCDR/PI658327 BC2F3 103 102 5
Table 2.17. continued

37
Pedigree Generation 50%
Heading
Plant Height (cm)*
SB Rating (0-9)*
CCDR//CPRS//CIAT 4/MCR010277 BC2F3 97 99 4 CCDR//CPRS//CIAT 4/MCR010277 BC2F3 97 106 4 CCDR//WELLS/CANTORSB51//97URN128/96CR921 BC2F3 99 97 5 CCDR//JODN/3/TDCN/SBNT//LSRR5/LMNT BC2F3 95 99 5 CCDR//JODN/3/TDCN/SBNT//LSRR5/LMNT BC2F3 95 103 4 CCDR//JODN/3/TDCN/SBNT//LSRR5/LMNT BC2F3 95 102 4 CCDR//JODN/3/TDCN/SBNT//LSRR5/LMNT BC2F3 95 101 3 CCDR//SB125/SB131 BC2F3 95 104 4 CCDR//SB125/SB131 BC2F3 105 103 3 CCDR//SB125/SB131 BC2F3 103 102 4 CCDR//SB125/SB131 BC2F3 103 102 5 CCDR//SB125/SB131 BC2F3 103 109 3 CCDR//CCDR/09DN/RUSH222 BC2F3 103 100 4 CCDR//RUSHSBR4/09125 BC2F3 103 101 4 CCDR//RUSHSBR4/09125 BC2F3 103 98 5 CCDR//RUSHSBR4/09125 BC2F3 101 93 5 CCDR//SB131/SB125 BC2F3 98 100 5 CTHL//WELLS/CANTORSB51//97URN128/96CR921 BC2F3 99 101 5 CTHL//WELLS/CANTORSB51//97URN128/96CR921 BC2F3 99 93 5 CTHL//WELLS/CANTORSB51//97URN128/96CR921 BC2F3 99 97 3 CTHL//WELLS/CANTORSB51//97URN128/96CR921 BC2F3 99 99 4 CTHL//WELLS/CANTORSB51//97URN128/96CR921 BC2F3 99 99 3 CTHL//WELLS/CANTORSB51//97URN128/96CR921 BC2F3 99 99 4 CTHL//JODN/3/TDCN/SBNT//LSRR5/LMNT BC2F3 95 95 4 CTHL//JODN/3/TDCN/SBNT//LSRR5/LMNT BC2F3 95 99 3 CTHL//JODN/3/TDCN/SBNT//LSRR5/LMNT BC2F3 95 101 3 CTHL//JODN/3/TDCN/SBNT//LSRR5/LMNT BC2F3 95 98 5 CTHL//JODN/3/TDCN/SBNT//LSRR5/LMNT BC2F3 95 100 5 CTHL//CTHL/RUSHSBR4 BC2F3 97 103 4 CTHL//SB125/SB131 BC2F3 101 103 4 CTHL//SB131/SB125 BC2F3 98 105 4 CTHL//CPRS/Oryzica Llanos 5 BC2F3 98 93 4 CTHL//RUSHSBR4/09125 BC2F3 103 100 4 CTHL//SB131/SB125 BC2F3 101 101 4 CTHL//SB125/SB131 BC2F3 101 108 4 CL161//09DN157//TRP545/CL161 BC2F3 100 100 4 CL161//CL161/PI 658314 BC2F3 100 101 4 15HB017/09DN/RUSH222 F3 98 93 4 15HB017/09DN/RUSH222 F3 98 100 4 15HB017/WELLS/CANTORSB51//97URN128/96CR921//CTHL F3 98 96 3 15HB017/CTHL/SB2-3 F3 96 101 4 15HB017/RUSHSBR4/09125 F3 99 89 4 15HB017/09DN157//TRP545/CL161 F3 101 91 4 15HB050/WELLS/CANTORSB51//97URN128/96CR921//CTHL F3 99 97 4
Table 2.17. continued

38
Pedigree Generation 50%
Heading
Plant Height (cm)*
SB Rating (0-9)*
15HB050/SB131/SB125 F3 101 95 4 15HB114/JODN/3/TDCN/SBNT//LSRR5/LMNT F3 95 98 4 15HB017/09DN157//TRP545/CL161 F3 95 103 3 15HB017/RUSHSBR4/09125 F3 100 98 4 15HB127/PI658327 F3 103 107 3 CCDR//09DN/RUSH072 F4 105 98 4 SB125/SB131 F4 103 103 4 CTHL//CTHL/PI 658320 (17SB 28-3) BC3F2 97 107 4 CTHL//CTHL/PI 658320 (17SB 29-4) BC3F2 97 111 3 CTHL//CTHL/PI 658320 (17SB 31-4) BC3F2 97 106 3 CTHL//CTHL/PI 658335 (17SB 37-1) BC3F2 97 94 5 CTHL//CCCDR/PI 658335 (17SB 48-1) BC3F2 106 112 3 CTHL//CTHL/SB2-3 (bulk) BC3F2 99 100 5 CTHL//CTHL/SB2-3 (17SB 53-2) BC3F2 99 102 5 CTHL//CTHL/SB2-3 (17SB 55-2) BC3F2 99 93 5 CTHL//CTHL/SB2-3 (17SB 56-2) BC3F2 99 98 4 CTHL//CTHL/SB2-3 (17SB 57-1) BC3F2 99 100 4 CL152//CL152/RUSH C99-1166 (17SB 70-4) BC3F2 99 90 5 CL152//CTHL/SB2-3 (17SB 85-1) BC3F2 99 101 4 CL152//CL152/PI 658327 (bulk) BC3F2 99 103 4 CL152//CL152/ PI 658327 (17SB 91-3) BC3F2 99 93 4 CL152//CL152/ PI 658327 (17SB 93-1) BC3F2 99 94 5 CL152//CL152/09DN157//TRP545/CL161 (17SB 94-7) BC3F2 99 95 4 CL152//CL152/09DN157//TRP545/CL161 (17SB 94-8) BC3F2 99 101 3 CL152//CL152/PI 658320 (17SB 97-4) BC3F2 99 96 5 CL152//CL152/PI 658320 (17SB 98-1) BC3F2 99 94 4 CL152//CL152/PI 658320 (17SB 101-2) BC3F2 99 100 5 CL152//CL152/PI 658320 (bulk) BC3F2 99 103 5 CL151//CL151/LSRR5 (bulk) BC3F2 101 90 5 CL151//CL151/C99-1166 (17SB 114-2) BC3F2 101 89 5 CL151//CL151/09DN157//TRP545/CL161 (17SB 132-1) BC3F2 101 88 4 CL151//CL151/09DN157//TRP545/CL161 (17SB 132-7) BC3F2 101 108 5 CL151//CL151/09DN157//TRP545/CL161 (17SB 133-1) BC3F2 101 99 4 CL151//CL151/PI 658320 (bulk) BC3F2 101 104 5 CL151//CL151/PI 658320 (17SB 136-2) BC3F2 101 106 4 CL151//CL151/PI 658320 (17SB 138-2) BC3F2 101 105 4 CL151//CL151/PI 658320 (17SB 139-1) BC3F2 101 100 3 CL151//CL151/PI 658320 (17SB 140-4) BC3F2 101 97 4 CL151//CL151/PI 658320 (17SB 144-1) BC3F2 101 100 5 CL151//CL151/PI 658320 (bulk) BC3F2 101 107 5 CL151//CTHL/SB2-3 (bulk) BC3F2 101 98 5 CL151//CTHL/SB2-3 (17SB 162-1) BC3F2 101 94 4 CL111//CL111/09DN157//TRP545/CL161 (17SB 195-2) BC3F2 95 91 4 CL111//CL111/PI 658335 (17SB 201-5) BC3F2 95 98 5
Table 2.17. continued

39
Pedigree Generation 50%
Heading
Plant Height (cm)*
SB Rating (0-9)*
CL111//CL111/PI 658335 (17SB 208-4) BC3F2 95 94 6 CL111//CTHL/SB2-3 (bulk) BC3F2 95 99 4 CL111//CTHL/SB2-3 (17SB 221-5) BC3F2 98 91 5 CL111//CTHL/SB2-3 (17SB 223-4) BC3F2 98 102 4 CL111//CL111/PI 658320 (17SB 235-15) BC3F2 98 102 5 CTHL//CTHL/LSRR5 (17SB 15-3) BC3F2 93 94 3 CTHL//CTHL/PI 658320 (bulk) BC3F2 98 103 5 CTHL//CTHL/PI 658320 (17SB 29-4) BC3F2 98 104 4 CTHL//CCCDR/PI 658335 (17SB 50-3) BC3F2 96 94 5 CTHL//CTHL/SB2-3 (bulk) BC3F2 97 99 4 CTHL//CTHL/SB2-3 (17SB 53-4) BC3F2 97 100 3 CTHL//CTHL/SB2-3 (17SB 54-4) BC3F2 97 106 4 CTHL//CTHL/SB2-3 (17SB 55-4) BC3F2 97 100 5 CL152//CTHL/SB2-3 (17SB 85-5) BC3F2 104 101 4 CL152//CTHL/SB2-3 (17SB 87-2) BC3F2 104 99 5 CL152//CL152/PI 658327 (bulk) BC3F2 104 102 3 CL152//CL152/PI 658327(17SB 90-3) BC3F2 104 101 3 CL152//CL152/PI 658327 (17SB 92-3) BC3F2 104 102 5 JODN/3/TDCN/SBNT//LSRR5/LMNT F9 95 101 4 LSBR5 Inbred 104 84 3 09DN157//TRP545/CL161 F9 102 86 3 CTHL/SB2-3 F9 110 98 4 CCDR/PI 658335 F9 114 81 3 PI 658327 Inbred 103 83 3 PI 658320 Inbred 99 103 3 PI 658335 Inbred 103 97 3 CCDR//09DN/RUSH072 F9 99 101 4 SB131/SB125 F9 105 97 3 CTHL/SB2-3 F9 97 96 5 CTHL/SB2-3 F4 97 104 5 CL111/GSOR101021 F4 95 90 5 CCDR//09DN/RUSH072 F9 99 99 5 WELLS/CANTORSB51//97URN128/96CR921 F9 99 97 3 SB131/SB125 F9 107 93 3 SB125/SB132 F9 107 101 3 CL152 Inbred 100 97 6 CL111 Inbred 94 84 9 CL151 Inbred 95 91 7 CL153 Inbred 95 85 7 CTHL Inbred 97 93 7 CCDR Inbred 99 96 6 LSD 0.05 4.80 7.90 1.10 Std. dev 3.52 5.80 0.99
*Mean values from 3 replications, 3 rows per replication; red cells – resistant check varieties; yellow cells – susceptible check varieties

40
Table 2.18. Analysis of variance on 50% days to heading of the selected SB resistant lines and resistant and susceptible checks from the 2018 SB field evaluation trial, H. Rouse Caffey Rice Research Station, Crowley, Louisiana.
Source of Variation SS Df MS F P-value F crit
Between Groups 133.30 2 66.65 5.76 0.004 3.07
Within Groups 1503.53 130 11.57
Total 1636.83 132 Table 2.19. Analysis of variance of on SB disease rating of the selected SB resistant lines and resistant and susceptible checks from the 2018 SB field evaluation trial, H. Rouse Caffey Rice Research Station, Crowley, Louisiana.
Source of Variation SS Df MS F P-value F crit
Between Groups 133.30 2 66.65 5.76 0.004 3.066
Within Groups 1503.53 130 11.57
Total 1636.83 132 Table 2.20. Analysis of variance on plant disease rating of the selected SB resistant lines and resistant and susceptible checks from the 2018 SB field evaluation trial, H. Rouse Caffey Rice Research Station, Crowley, Louisiana.
Source of Variation SS Df MS F P-value F crit
Between Groups 360.59 2 180.30 5.74 0.004 3.07
Within Groups 4082.61 130 31.40
Total 4443.20 132
Two years of field trials at the RRS showed that the seven selected sheath blight lines
were virtually identical as a group for sheath blight resistance compared to the two donor lines
MCR and Teqing (Table 12.21). Mean sheath blight score of the selected lines at 3.3 was nearly
identical to the 3.5 average of the two donor lines. In contrast, the six known susceptible checks
displayed sheath blight scores of 6 to 8 that were higher than the seven selections and donors

41
based on LSD0.05. As a group, the seven selected SB lines showed improvement for several key
agronomic traits in 2016 and 2017 trials vs. the two known resistant lines MCR and Teqing
(Table 12.21). For example, heading dates for the selected lines were 15 to 25 days vs. the
resistant donor lines in both inoculated and non-inoculated plots. Two of the SB selections
(Catahoula//Cocodrie/MCR, PI 658335) were within two to six days of 50% heading vs. the
earlier maturing MCR donor. Similarly, mean plant height of the selected resistant material was
eight cm shorter compared to the two donor lines across all plots.
Ability of the selected material, donors, and susceptible recipient lines to produce grain
under disease and disease-free conditions was determined by evaluation and comparison of grain
yields in inoculated and non-inoculated plots (Table 2.21). Resistant donor Teqing produced
relatively high grain yields compared to all lines tested in both inoculated and non-inoculated
plots, even though its own percent yield reduction was surprisingly high at 21%. Teqing has been
used extensively as a donor for germplasm development as shown by the pedigrees of MCR and
three of the SB selected lines evaluated in this study. Mean percent yield reduction for the seven
selected lines at 13% was comparable to 17% for the two donor lines, although the range for the
selections varied substantially from 4% to 30%. Selections PI 658320 and PI 658335 were noted
for relative high grain yields in both disease and disease-free environments. The two selections
also produced higher grain yield than the commercial susceptible checks in inoculated plots.
PI658335 produced similar or higher yield than four of the checks under disease-free conditions.
These results underscore the importance of evaluating and selecting breeding material under both
disease and disease-free conditions.
Correlation analyses for days to heading, disease score, plant height and grain weight of
the two resistant checks, the 7 selected SB lines and the six susceptible checks are shown in

42
(Table 2.22). The results showed that days to heading was negatively correlated with disease
score. In other words, later-maturing lines were correlated with reduced amount of disease
caused by R. solani infection. This result has been reported previously in the literature. (Lee and
Rush, 1983). Delayed maturity was also associated with increased plant height and grain yield
for the material evaluated in this study.
Plant height was positively correlated to the days to 50% heading as observed with the
plants evaluated. The shorter maturity time the plant is, the shorter in height as observed in the
susceptible checks, while the taller the plants showed longer the maturity as observed in the SB
resistant plants and the resistant check. The mean difference in plant height between the SB lines
was 6 cm longer than the susceptible check of 90 cm. Moreover, plant height was strongly
correlated with the observed disease response. The tall the plants were resistant in the selected

43
Table 2.21. Yield reduction of the selected resistant lines from 2016 and 2017 (combined data).
1 Disease Score: 1 = no disease, 9 = dead plant 4 Grain Wt. (gm)/0.5 m2 = Mean rough rice, of 3 reps, 0.5m2/plot
2 Days to 50% heading = days from planting to 50% heads emerged. 5 % Yield Reduction = [(GW uninoculated-GW inoculated)/GW inoculated]*100 3 Plant height = distance in cm from soil to tip of longest panicle.
Inoculated Non-inoculated
Line Pedigree Generation Disease Score (0-9)2
Days to 50%
heading1
Plant height (cm)3
Grain Wt. (gm) / 0.5 m2
Disease Score (0-9)2
Days to 50%
heading
Plant height (cm)3
Grain Wt. (gm) / 0.5 m2
% Yield Reduction5
% Yield Reduction (MEAN)
MCR010277 LSBR-5/Lemont//Katy/3/ Cypress/Teqing
Inbred 4 86 98 163 0 86 99 187 13 17
Teqing Teqing Inbred 3 113 111 192 0 113 110 243 21
(LSBR-5) LSBR-5 Inbred 3 95 95 123 0 97 90 139 12 13
09DN157//TRP545/CL161 09DN157//TRP545/CL161 F7 3 90 92 152 0 90 91 161 6
Catahoula//Cocodrie/MCR Catahoula//Cocodrie/MCR F7 4 98 91 144 0 98 93 185 22
Cocodrie/PI 658335 Cocodrie/PI 658335 F7 3 90 93 115 0 98 97 164 30
PI 658327 C99-1166 LSBR-5/LMNT/TQNG/3/CCDR/4PSCL
Inbred 3 90 96 155 0 90 96 176 12
PI 658320 C98-974 CPRS/AZMIL Inbred 4 88 105 178 0 90 104 185 4
PI 658335
COO-1700 LSBR5/LMNT//TQNG/LSBR5/LMNT/3/H4CODF//NTA(03-10993-11019)
Inbred 3 92 100 191 0 92 98 199 4
CL152 CL152 Inbred 6 80 95 141 0 82 91 187 25 26
CL111 CL111 Inbred 7 74 88 141 0 75 87 197 29
CL151 CL151 Inbred 7 77 89 145 0 79 89 204 29
CL153 CL153 Inbred 6 76 84 126 0 78 89 152 17
Catahoula Catahoula Inbred 8 76 96 141 0 79 98 210 33
Cocodrie Cocodrie Inbred 8 77 89 131 0 80 80 177 26
L.S.D.0.05 1.22 10.78 9.24 36.24
0 11.08 9.68 39.58 21.45
C.V. 0.41 0.12 0.73 0.16 0 0.12 0.08 0.14 3.88
S.E.mean
0.51 2.74 1.77 6.02 0 2.64 1.9 6.7 0.6

44
SB lines with a mean height of 96 and with a disease score range from 3-5 that was similar to the
disease resistant checks. The susceptible checks on the other hand, were shorter than the SB
resistant lines with a mean height 90 cm that showed disease ratings of 6-8. My findings
confirmed those of Sharma et al. (2009) in families derived from a cross between two
tropical japonica U.S. rice cultivars, Rosemont (semi-dwarf, SB susceptible) and Pecos (tall, SB
resistant). The families were evaluated for disease reactions, plant height (PH), and heading date
(HD) in replicated field trials for 2 years and genotyped with 149 simple sequence repeat
markers. Correlation analysis between SB ratings with PH and HD showed that both agronomic
traits were significantly correlated with SB resistance.
Grain weight was moderately correlated to days to 50% heading as observed within the
plants evaluated; however, it was negatively correlated to the disease score. The correlation
value of disease score to grain weight was -0.37, considered as a relatively weakly correlation.
On the contrary, plant height was highly correlated to grain weight. The selected SB resistant
lines were comparable to the heights of the resistant checks, with plant height mean of 6 cm
taller than the average height of the susceptible check. The grain weight of SB resistant lines and
the resistant checks ranged from 151 to 178 grams while the susceptible checks exhibited a mean
grain weight of 138 grams. This finding was similar to the report of Zhang et al. (2017) who
identified a novel MYB-like transcription factor OsMPH1 (MYB-like gene of Plant Height 1)
involved in the regulation of plant height in rice. Overexpression of OsMPH1 lead to increased
plant height and grain yield in rice. The plant height - grain weight correlation was also observed
in other crops such as sorghum. In a report by the Texas Sorghum Producers (2018), plant height
was positively correlated with grain yield as observed for every production region in Texas
(http://texassorghum.org/hybrid-selection-plant-height-and-grain-yield.html).

45
Table 2.22. Correlation analysis of days to heading, disease score, plant height and grain weight
of the resistant check, selected sheath blight lines and the susceptible checks.
Morphological traits
Days to 50%
heading
Disease score
(0-9)
Plant height
(cm)
Grain weight
(gm)
Days to 50% heading 1 -0.80 0.70 0.50
Disease Score (0-9) 1 -0.50 -0.37
Plant height (cm) 1 0.78
Grain weight (gm) 1
*a=0.05
2.4. References
Blanche SB, Linscombe SD, Sha X, Bearb KF, Groth DE, White LM and Harrell DL (2009)
Registration of ‘Catahoula’ rice. Crop Science Vol. 3 No. 2, p. 146-149.
doi:10.3198/jpr2008.11.0677crc.
Blanche SB, Sha X, Harrell DL, Groth DE, Bearb KF, White LM and Linscombe, SD (2010)
Registration of ‘CL151’ rice. Crop Science Vol. 5 No. 2, p. 177-180.
doi:10.3198/jpr2010.05.0245crc.
Dai Z, Li A, Huang L, Liu G, Zhou C, Zhang H (2006) Utilization of an elite rice germplasm-
Yangdao 6 with high combining ability created by 60Co γ-irradiation. Acta Agriculturae
Nucleatae Sinica. ISSN 1000-8551 v. 20(2); p. 83-86.
Famoso AN, Oard JH, Harrell DL, Groth DE, Bearb KF, White III LM, Zaunbrecher RE and
Linscombe SD (2016) Registration of ‘CL153’ rice. Crop Science Vol. 11 No. 1, p. 38-
41. doi:10.3198/jpr2016.04.0023crc.
Groth DE, Hollier CA, Olaya G, Tally A, Lanclos D and Zaunbrecher J (2013) Management of
QoI-Resistant Rhizoctonia solani, the Causal Agent of Rice Sheath Blight, in Southern
Louisiana. In: Fungicide Resistance in North America, Second Edition, APS Press,
Minneapolis, MN.
Johnston TH and Henry SE (1965) Registration of ‘Northrose’ rice. Crop Science Society of
America 5:285.
Johnston TH, Webb BD, and Evans KO (1968) Registration of ‘Starbonnet’ rice. Crop Science
Society of America. Received March 6, 1968.
Johnston TH, Webb BD, and Evans KO (1973) Registration of ‘Nortai’ rice. Crop Science
Society of America. Received September 7, 1973.

46
Marchetti M, Bollich C, Webb B, Jackson B, McClung A, Scott J, Hung H (1998). Registration
of ‘Jasmine’85 rice. Crop Science Vol.38 pp. 895-896.
McClung AM, Fjellstrom RG, Bergman CJ, Bormans CA, Park WD and Marchetti MA (2004)
Registration of ‘Saber’ rice. Crop Sci. 44:493.
Moldenhauer KAK, Lee FN, Norman RJ, Helms RS, Wells BR, Dilday RH, Rohman PC,
Marchetti MA (1990) Registration of ‘Katy’ rice. Crop Science Vol.30 No.3 ref.6
pp.747-748
Nelson JC, Oard JH, Groth D, Utomo HS, Jia Y, Liu G, Moldenhauer KAK, Correa-Victoria FJ,
Fjellstrom RG, Scheffler B, Prado GA (2011) Sheath-blight resistance QTLS in japonica
rice germplasm. Euphytica DOI 10.1007/s10681-011-0475-1.
Linscombe SD, Jodari F, Bollich PK, Groth DE, White III LM, Chu QR, Dunand RT, Sanders
DE (2000). Registration of `Cocodrie' rice. Crop Science 40(1):294.
doi:10.2135/cropsci2000.0007rcv.
Oard JH, Harrell DL, Groth DE, Bearb KF, White III LM and Linscombe SD (2013)
Registration of ‘CL111’ rice. Crop Science Vol. 8 No. 1, p. 5-8.
doi:10.3198/jpr2013.06.0035crc.
Oard JH, Harrell DL, Groth DE, Bearb KF, White III LM and Linscombe SD (2013)
Registration of ‘CL152’ rice. Crop Science Vol. 8 No. 1, p. 9-12.
doi:10.3198/jpr2013.06.0029crc.
Pan XB, Rush MC, Sha XY, Xie QJ, Linscombe SD, Stetina SR, Oard JH (1999) Major gene,
nonallelic sheath blight resistance from the rice cultivars Jasmine 85 and Teqing. Crop
Sci 39:338–346.
Rice Coordinated Agricultural Project (RiceCAP), USDA ARS and University of Arkansas,
Division of Agriculture. (http://www.uark.edu/ua/ricecap).
Rush MC, Groth DE., Sha X (2011) Registration of 25 sheath blight disease resistant germplasm
lines with good agronomic traits. Journal of Plant Registrations, Vol.5 No.3; p. 400-402.
Wasano K (1988) The resistance to the rice diseases of bacterial leaf blight (Xanthomonas campestris pv. Oryzae) and sheath blight (Rhizoctonia solani), and some problems in
breeding of disease resistance of crops. In “Recent Advances in Research on Plant
Breeding vol. 30” Japanese Society of Breeding (ed.), Yokendo, Tokyo. p. 103-121.
Xie H, Zheng J, Zhang S (1987) Rice breeding for the hybrid combination of Shanyou 63 and its
restorer line Minghui 63. Fujian J Agric Sci 2(1):32–38 (in Chinese).
Xie F and Zhang J (2018) Shanyou 63: An elite mega rice hybrid in China. Rice 11:17;
doi.org/10.1186/s12284-018-0210-9.

47
Xie Q, Linscombe SD, Rush MC (1992) Registration of LSBR-33 and LSBR-5 sheath light-
resistant germplasm lines of rice. Crop Science 32: 507; doi:10.1094/Phyto-06-10-0151
Xie QJ, Rush MC, Cao J (1990) Somaclonal variation for disease resistance in rice (Oryza sativa L.). Pest Management in Rice. 491-509. B.T.Grayson, M.B.Green, and L.G.Copping
(Ed.) Elsevier Applied Science. London.
Zhang Y, Yu C, Lin J, Liu J, Liu B, Wang J, Huang A, Li H, Zhao T (2017) OsMPH1 regulates
plant height and improves grain yield in rice. PLoS One 2017; 12(7): e0180825.

48
CHAPTER 3. IDENTIFICATION AND EVALUATION OF NON-SYNONYMOUS SNPs MARKERS FOR SHEATH BLIGHT
RESISTANT GERMPLASM 3.1. Introduction
Resistance breeding against sheath blight disease has achieved limited success in part due
to existence of only a few highly resistant accessions (Eizenga et al. 2002; Wang et al. 2011).
Teqing, Jasmine 85, Minghui 63, WSS2, and Tetep are some of the lines that have been used as
donors to develop near-isogenic lines (NILs) or chromosome segment substitution lines (CSSLs)
to identify QTLs that can measurably improve resistance (Li et al. 1995; Pan et al. 1999; Zou et
al. 2000; Han et al. 2002; Sato et al, 2004; Pinson et al. 2005; Liu et al. 2009;
Channamallikarjuna et al. 2010). Moreover, germplasm stocks and associated mapping
populations for breeding and study of sheath blight have been released in the U.S. for public use
(Chu et al. 2006; Groth et al. 2007; Pinson et al. 2008, Groth et al. 2011; Rush et al. 2011; Jia et
al. 2012; Jia et al. 2015). In cooperation with the USDA-funded RiceCAP project
(http://www.uark.edu/ua/ricecap), the SB2 mapping population was developed as a resource to
map QTLs for sheath blight resistance and other traits (Chu et al. 2006). SB2 consists of 325
true-breeding doubled-haploid (DH) lines from the Genetic Stocks Oryza Collection (GSOR
accessions 200001 to 200325) developed from susceptible parent Cocodrie (PI 606331) and the
moderately-resistant breeding line MCR010277 (PI 641932).
Resistance to rice sheath blight is considered a quantitative trait controlled by multiple
genes of small effect referred to as quantitative trait loci (QTL) (Zhou et al. 2000; Pinson et al.
2005; Jia et al. 2009). Li et al. (1995) identified six QTL contributing to sheath blight-resistance
in two years of field evaluation using an F4 bulked population from a cross between the
susceptible variety Lemont and the resistant variety Teqing. The QTL Qsbr3a detected between

49
markers RG348 and RG944 on rice chromosome three exhibited the largest effect. Pan et al.
(1999) identified three QTLs for sheath blight resistance on chromosomes 2, 3, and 7 using an F2
population derived from a cross between resistant variety Jasmine 85 and Lemont by bulk
segregant analysis. In the following year, Zou et al. (2000) reported six QTL conferring sheath
blight resistance on chromosomes 2, 3, 7, 9 and 11 using the same Jasmine 85/Lemont F2
population.
Various populations, including segregating F2 populations, double haploids (DHs) and
recombinant inbred lines (RILs), have been developed to identify QTLs associated with sheath
blight resistance on rice chromosomes 2, 3, 5, 7, 9 and 11 (Pan et al. 1999; Zou et al. 2000; Han
et al. 2002; Kunihiro et al, 2002; Che et al. 2003; Sato et al. 2004; Pinson et al. 2005; Tan et al.
2005; Liu et al. 2009). Han et al. (2002) identified two sheath blight resistance QTLs on
chromosomes 5 and 9 using a RIL population derived from Zhenshan 97B and Minghui 63
parents. A DH population derived from a cross between Zhaiyeqing 8 and Jingxi 17, Kunihiro et
al. (2002) detected four sheath blight QTLs on chromosomes 2, 3, 7 and 11. The QTL, qSBR-7,
detected between the markers RG511 and TCT122 on chromosome 7 showed the largest effect.
Sato et al. (2004) identified two sheath blight QTLs on chromosomes 3 and 12 using a BC1F1
population derived from a cross of Hinohikari/WSS2//Hinohikari. The two QTLs identified
explained 30% of the phenotypic variation, and the resistance alleles were derived from the
resistant parent WSS2.
Pinson et al. (2005) confirmed the locations and effects of six sheath blight–resistance
QTLs that were identified by previous researchers and detected eight new loci using a RIL
population derived from the Lemont/Teqing cross. Xie et al. (2008) performed a QTL analysis
using reciprocal introgression line populations derived from Lemont/Teqing evaluated in 2006–

50
2007. A total of 10 main-effect QTLs and 13 epistatic QTLs were mapped using data obtained
from different years and genetic backgrounds. They also verified six main effect QTLs
identified in 2006 that were successfully detected in 2007, suggesting stable expression across
years.
Li et al. (2009) identified sheath blight QTLs using different introgression lines
containing chromosome segments from Tarom Molaii and Binam in IR64 and Teqing
backgrounds. In the same year, Liu et al. (2009) identified 10 QTLs on chromosomes 1, 2, 3, 5,
6, and 9 using an F5 RIL population derived from Lemont/Jasmine 85 by measuring inoculated
seedlings using micro chamber and mist-chamber assays under greenhouse conditions.
Recent research has identified certain “large effect” QTLs in progeny from different
japonica x indica crosses. For example, 12 QTL mapping studies, as summarized in Zuo et al.
2014a, identified a large region of ~ 2 Mbp associated with sheath blight resistance at the bottom
of the long arm of chromosome 9. A subsequent fine mapping study reported a substantially
smaller region (146 kb) in the same chromosomal region (Zuo et al. 2014b).
Recent advances in biotechnology, genome research and molecular marker applications
with conventional breeding practices have proved beneficial in some cases for crop improvement
(Moose and Mumm, 2008). For example, using RL-SAGE and microarray technologies, Venu et
al. (2007) isolated RNA isolated from R. solani-infected leaves of Jasmine 85. A large
percentage (70%) of the genes responsive to sheath blight fungal infection were located in
known sheath blight resistance QTL regions. Zhao et al. (2008) identified numerous defense-
related genes induced by R. solani through the suppression subtractive hybridization method.
However, none of the candidate genes reported in the literature using these technologies has been
validated in subsequent studies.

51
Silva et al. (2012) previously identified 333 candidate nsSNPs on 11 chromosomes
associated with sheath blight resistance using whole genome sequencing. Yamid Sanabria of Dr.
Oard’s lab (unpublished results) evaluated certain selected candidate SNPs associated with
sheath blight resistance from the work of Silva et al. (2012) by using the RiceCAP SB2 mapping
population and a panel of elite varieties with known reaction to R. solani. Ten each of extreme
resistant and susceptible sheath blight lines from the SB2 mapping population were used to
evaluate 136 candidate nsSNPs that were ranked by ANOVA based on phenotypic and genotypic
profiles. SNPs in reported genomic regions for sheath blight resistance were identified including
eight markers located on chromosomes 6, 8, 9, and 12 that were used in a marker-assisted
backcrossing strategy by crossing seven different resistant lines to four susceptible U.S.
commercial varieties. A total of 45 doubled-haploid (DH) lines were developed from 28 BC2F1
individuals containing different combinations of selected SNPs.
One promising approach for studying regulatory mechanisms and signaling networks of
plant defense responses and identifying the genes involved in disease response is RNA
sequencing (Wise et al. 2007). A microarray study was recently conducted by Yuan et al. (2018)
to understand the mechanisms underlying YSBR1 resistance to R. solani compared to the R.
solani-susceptible Lemont cultivar. They observed dynamic and different responses of the two
rice cultivars during R. solani infection. YSBR1 exhibited stronger and earlier transcriptional
response to R. solani than Lemont. Genes that encode cell wall-modifying and glycosyl-
degrading enzymes or anti-microbial proteins were specifically induced in YSBR1. MapMan
analysis also revealed that more differentially expressed genes related with cell wall, β-
glucanases, respiratory burst, phenylpropanoids and lignin were highly induced by R. solani in
YSBR1 than in Lemont.

52
Dr. Pankaj Jaiswal at Oregon State University has carried out an RNA-Seq experiment in
cooperation with Dr. Oard’s laboratory on sheath blight (unpublished results). The SB
susceptible variety, Cocodrie (PI 606331) and the resistant line MCR010277 (PI 641932) was
inoculated with R. solani under greenhouse condition at LSU. Leaf samples were collected at 0,
1, 3, 5 hours post-inoculation, and subjected to RNA-Seq analysis by Jaiswal’s laboratory. Three
genes were postulated to be involved in the sheath blight defense response: chitin elicitor binding
protein (CEBiP), chitin elicitor receptor kinase (CERK), and a wall-associated kinase (WAK91).
A non-synonymous SNP in WAK91 on chromosome 9 was identified as a candidate marker for
sheath blight resistance breeding.
Hence, this study will identify and evaluate non-synonymous SNP markers for sheath
blight resistance germplasm for southern US environments through development of allele-
specific DNA markers identified by SNP databases and selective genotyping.
3.2. Materials and Methods
3.2.1. DNA extraction and polymerase chain reaction
Leaf tissue of 15 lines which inclues the 7 best line from the field evaluation: RUSH
C99-1166 (LSBR5), 09DN157//TRP545/CL161, CTHL/SB2-3, CCDR/PI 658335, PI 658327, PI
658320, PI 65833; 6 susceptible checks, CL111, CL151, CL152, CHENEIRE, COCODRIE and
CTHL and 2 resistant checks, TEQING and MCR010277 was collected 40 to 50 days after
planting and oven-dry at 50°C for three days. DNA isolation was conducted using the modified
CTAB method described by Lorieux (2002); and Murray and Thompson (1980). Briefly,
approximately 150 mg of oven-dried leaf tissue was ground using the Mini-Bead Beater by
Biospec followed by addition of pre-heated 480 μL of extraction buffer at 74°C. The extraction
buffer is a mixture of 20 mM EDTA, 100 mM Tris, 1.4 M NaCl, 1% PEG 6000, 2% MATAB

53
and 0.5% sodium bisulfite. The mixture was incubated in water bath for 25 to 30 min at 74°C.
Subsequently, 480 μL chloroform:isoamyl (24:1) was added, mixed slowly by par inversion for 5
min, and centrifuged at 4000 rpm for 15 min at room temperature. The supernatant was
precipitated with 270 μL isopropanol, mixed by hand inversion until an evident formation of a
thread was visible and stored at -20 °C for at least 15 min and re-centrifuged at 4000 rpm for 15
min. The DNA pellets were obtained and washed with 100 μL ethanol and centrifuged for 4000
rpm for 10 min. The supernatant was again discarded and the remaining pellet was air-dried and
resuspended to 50 μL 10% TE buffer. The isolated DNA was stored in -20°C for future use.
A 10 uL reaction mixture was prepared for polymerase chain reaction (PCR), containing
3 μL of DNA template (20 to 30 ng/μL), 3 μL REDTaq Ready Mix from Sigma Aldrich (20 mM
Tris-HCl (pH 8.3), 100 mM KCl, 3 mM MgCl2, 0.002 % gelatin, 0.4 mM dNTP mix (dATP,
dCTP, dGTP, TTP), stabilizers and 0.06 unit/mL of Taq DNA Polymerase), 0.2 μL each of the
forward and reverse primers (20 μM) and 3.6 μL sterile distilled water. Sequences of the primer
pairs are shown in Appendix Table 3.2. The PCR conditions were as follows: 95 °C denaturation
for 3 min, followed by 95 °C for 30 sec, 62 °C for 30 sec, 72 °C for 30 sec, repeat previous three
steps for 32X, and 72 °C for 5 min. The final holding temperature was set at 4 °C. Amplified
PCR products were visualized on a 2% agarose gel stained with ethidium bromide.
3.3. Results
Genotyping of 29 polymorphic nsSNP on chromosomes 2, 4, 6, 8, 9 and 12 was carried
out using the selected SB lines from the 2014 SB field evaluation trial at RRS plus the 2 resistant
checks (Teqing and MCR010277), and 6 susceptible cultivars (Catahoula, Cocodrie, CL111,
CL151, and CL152). These lines were selected on SB resistance, plant type, plant height and
maturity. The selected resistant lines are from the selections from 2013 field evaluation at RRS

54
for SB resistance (Table 2.1). These materials were genotyped using non-synonymous SNPs
markers developed previously by Yamid Sanabria in Dr. Oard’s laboratory (Sanabria, 2015).
These nsSNPs markers were identified and developed by comparing DNA sequences of Lemont
and Teqing at http://oryzasnp.org/iric-portal/. Initially, a subset of markers based on R2 value
were used to genotype the selected lines (Appendix Table 3.1). These markers are
representatives of the QTL markers associated with sheath blight resistance that were previously
published: QTLs on chromosomes 2, 6, 8, 9 and 12. LOC_Os09g32860, LOC_Os09g37800,
LOC_Os12g13100, LOC_Os02g34850, LOC_Os06g13040, LOC_Os06g22460 and
LOC_Os08g20020 are the markers identified (Table 3.1).
Genotyping of the best lines including 2 resistant cultivars, Teqing and MCR010277, and
6 susceptible cultivars: 3 conventional varieties, Catahoula, Cocodrie, and Mermentau and 3
Clearfield hybrids, CL111, CL151, and CL152, showed polymorphism between the resistant and
the susceptible cultivars (Table 3.1). Teqing and MCR010277 are varieties known to be
moderately resistant to sheath blight under field conditions. Genotyping results of the resistant
Teqing and MCR010277 showed the resistant allele across the markers tested. The susceptible
check cultivars, Catahoula, Cocodrie, Mermentau, CL111, CL151, and CL152, on the other
hand, showed the susceptible allele as expected. Although susceptible varieties CL111 and
Mermentau were showing some resistant alleles, the presence of few resistant alleles would not
give enough resistance to these cultivars against the disease.
Likewise, each of the selected resistant SB lines showed the resistant allele/s in different
genotypic profiles. Accumulation of resistant alleles in the best SB lines for SB resistance is
evident. One of the selected line, CCDR/SB2-174 cross with SB score of 6, contained 18

55
resistant alleles including 8 out 8 from chromosome 12, 3 from chromosome 9, 4 from
chromosome 6 and 3 from chromosome 4 (Table 3.1). Another line,
CCDR//CIAT8/MCR010277 showed 14 resistant alleles including 2 from chromosomes 2, 3
from chromosome 4, 3 from chromosome 6 and 6 out of 10 from chromosome 9. For line
CCDR//09DN/RUSH072, a combination of resistant alleles from chromosomes 4 and 12 was
observed; for CIAT7/MCR010277 line, the resistant alleles were from 3 from chromosomes

56
Table 3.1. SNP genotypes of selected resistant and susceptible lines from 2014 SB field evaluation plots, RRS, Crowley, Louisiana.
*Markers identified from the ranking of nsSNPs markers using their R2 value; fuschia; resistant varieties; blue: SB selected lines; green: susceptible varieties; red: resistant nsSNP; yellow: susceptible nsSNP.
PEDIGREE
Dise
ase
Rat
ing
(0- 9
) Chr. 2 Chr. 4 Chr. 6 Chr. 8 Chr. 9 Chr. 12
LOC
_Os0
2g34
490
LOC
_Os0
2g34
850*
LOC
_Os0
4g10
460
LOC
_Os0
4g15
650
LOC
_Os0
4g20
680
LOC
_Os0
6g13
040*
LOC
_Os0
6g22
020
LOC
_Os0
6g22
460*
LOC
_Os0
6g28
124
LOC
_Os0
8g19
694
LOC
_Os0
8g20
020*
LOC
_Os0
9g32
860*
LOC
_Os0
9g34
180
LOC
_Os0
9g36
900
LOC
_Os0
9g37
590
LOC
_Os0
9g37
800*
LOC
_Os0
9g37
880
LOC
_Os0
9g38
700
L OC
_Os0
9g38
850
LOC
_Os0
9g38
970
LOC
_Os0
9g39
620
LOC
_Os1
2g06
980
LOC
_Os1
2g07
950
LOC
_Os1
2g09
710
LOC
_Os1
2g10
180
LOC
_Os1
2g10
330
LOC
_Os1
2g10
410
LOC
_Os1
2g13
100*
LOC
_Os1
2g15
460
MCR010277 3.5 R R R R R R R R R R R R R R R R R R R R R R R R R R R R R
TEQING 3.5 R R R R R R R R R R R R R R R R R R R R R R R R R R R R R
RUSH C99-1166 4 S S S S S S S S S S S S S S S S S S S S S R R S S S S S S
PI658327 4 S S S S S S S S S S S S S S S S S S S S S S S S S S S S S
WELLS/CANTORSB51//97URN 4 S S S S S S S S S S S S S S S S S S S S S S S S S S S S S
JODN/3TDCN/SBNT//LSRR5/ 4 S S S S S S S S S S S S S S S S S S S S S S S S S S S S S
09DN/RUSH222//SBR174 4 S S S S S S S S S S S S S S S S S S S S S S S S S S S S S
CIAT7/MCR010277 4 S S S S S S R R R S S S S S S S S S S S R S S S S S S S S
CCDR//CIAT8/MCR010277 4 R R R R R S R R R S S S S R R S R R R R S S S S S S S S S
CCDR//09DN/RUSH072 5 S S S R R R S S S S S S S S S S S S S S S R R S S S S S S
PI658321 5 S S S S S S S S S S S S S S S S S S S S S S S S S S S S S
09SB131-1/SB125-1 6.5 S S R R R S S S S S S S S S S S S S S S S R R R R R R S S
CCDR/SB2-174 6 S S R R R R R R R S S R R R S S S S S S S R R R R R R R R
GSOR101019 6 S R S S S S S S S S S S S S S S S S S S S S S S S S S S S
CATAHOULA 8 S S S S S S S S S S S S S S S S S S S S S S S S S S S S S
COCODRIE 8 S S S S S S S S S S S S S S S S S S S S S S S S S S S S S
CL152 8 S S S S S S S S S S S S S S S S S S S S S S S S S S S S S
CL111 8 S S S S S S S S S S S S S S S S S S S S S S S S S S S S S
MERMENTAU 8 S S S S S S R S S S S S S S S S S S S S S S S S S S S S S
CL151 8 S S S S S S S S S R R S S S S R S S S S S S S S S S S S S

57
6 and 1 from chromosome 9. For RUSH C99-1166 (‘LSBR5’) and GSOR101019 lines however,
the resistant alleles are from chromosomes 9 and 2 only. Finally, there are lines (PI658327,
PI658321, WELLS/CANTORSB51//97URN, JODN/3TDCN/SBNT//LSRR5/,
09DN/RUSH222//SBR174) that were scored 4, considered moderately resistant to the disease,
but did not contain any of my genotyped alleles. These results suggest that additional loci not
evaluated in this study were associated with resistance in these particular lines.
During the 2015 field season, some selected SB lines from the previous year showed
severe susceptibility to the disease. For example, breeding lines WELLS/CANTORSB51 //
97URN, JODN/3TDCN/SBNT//LSRR5/, 09DN/RUSH222//SBR174 and ‘PI 658321’ were
scored 4 to 6 during 2014 season, but were scored 7 to 8 in the 2015 field trials at the RRS.
However, RUSH C99-1166 (‘LSBR5’) and ‘PI 658327’ from the 2014 field evaluation showed
the same disease score of 4 and 5 the following year. Similarly, the susceptible check varieties
showed the susceptible allele as expected (Table 3.2).
Six nsSNPs markers on chromosome 11 were added to the list of markers previously
tested because the new selected lines did not yield polymorphism to some of the nsSNPs markers
previously tested. Genotyping of the resistant check varieties, Teqing and MCR010277 showed
the expected resistant alleles across the markers. Resistant alleles on chromosome 11 were
observed in 09DN157//TRP545/CL161, ‘PI 658327” and RUSH C99-1166 (‘LSBR5’).
However, two additional genes on LOC_Os12g06980 and LOC_Os12g07950 were present only
in RUSH C99-1166 (‘LSBR5’). The resistant alleles in CCDR/PI 658335 and ‘PI 658335’
exhibited the same genotypic profiles on chromosomes 2, 6, 8 and 9. The only difference was
that some resistant alleles present in ‘PI 658335’on chromosomes 4, 6 11 and 12 were not
present in CCDR/PI 658335 cross. This difference could be attributed to recombination. On the

58
other hand, no resistant alleles were found on CTHL/SB2-3 cross and PI658320 using the tested
SNP-based markers.
A total of 136 non-synonymous SNP markers were tested in 2016 and 2017, but only 83
markers, which included the 36 markers genotyped in 2015 evaluation, showed clear
polymorphism between and among the lines tested (Table 3.3). Non-synonymous SNPs markers
on chromosomes 2, 4, 6, 8, 9, 11, and 12 showed polymorphisms between the resistant and
susceptible varieties. The resistant check varieties, Teqing and MCR010277 consistently showed
the resistant alleles. As expected, MCR010277 (PI 641932), which was developed by M.C.
Rush (2011), was known to have high levels of resistance to sheath blight, and Teqing, an indica
variety which was used to identify the nsSNPs (Silva et al. 2012). The susceptible check varieties
(Cocodrie, Catahoula, Mermentau, CL111, CL151, CL152), on the other hand, consistently
showed the susceptible alleles.

59
Table 3.2. Genotyping results of the selected resistant lines including 2 resistant and 6 susceptible checks in 2015 SB field evaluation.
Table 3.2 continued
PEDIGREE
SB R
atin
g (0
-9)
Chr.2 Chr. 4 Chr. 6 Chr. 8 Chr. 9
LOC
_Os0
2g34
490
LOC
_Os0
2g34
850
LOC
_Os0
4g10
460
LOC
_Os0
4g20
680
LOC
_Os0
6g13
040
LOC
_Os0
6g22
020
LOC
_Os0
6g22
460
LOC
_Os0
6g28
124
LOC
_Os0
8g19
694
LOC
_Os0
8g20
020
LOC
_Os0
9g32
860
LOC
_Os0
9g34
180
LOC
_Os0
9g36
900
LOC
_Os0
9g37
230
LOC
_Os0
9g37
590
LOC
_Os0
9g37
800
LOC
_Os0
9g37
880
LOC
_Os0
9g38
700
LOC
_Os0
9g38
710
LOC
_Os0
9g38
850
LOC
_Os0
9g38
970
LOC
_Os0
9g39
620
MCR010277 3 R R R R R R R R R R R R R R R R R R R R R R TEQING 3 R R R R R R R R R R R R R R R R R R R R R R RUSH C99-1166 (LSBR5) 4 S S S S S S S S S S S S S S S S S S S S S S 09DN157//TRP545/CL161 3 S S S S S S S S S S S S S S S S S S S S S S CTHL/SB2-3 6 S S S S S S S S S S S S S S S S S S S S S S CCDR/PI 658335 4 R R S S S R R R R R S S R R R R R R R R R R PI 658327 5 S S S S S S S S S S S S S S S S S S S S S S PI 658320 5 S S S S S S S S S S S S S S S S S S S S S S PI 658335 4 R R R R R R R R R R S S R R R R R R R R R R CTHL 8 S S S S S S S S S S S S S S S S S S S S S S CCDR 9 S S S S S S S S S S S S S S S S S S S S S S CLI52 8 S S S S S S S S S S S S S S S S S S S S S S CL111 7 S S S S S S S S S S S S S S S S S S S S S S MRMT 8 S S S S S R S S S S S S S S S S S S S S S S CL151 8 S S S S S S S S S S S S S S S R S S S S S S

60
* Fuschia; resistant varieties; blue: SB selected line; green: susceptible varieties; red: resistant allele; yellow: susceptible allele.
Similarly, genotyping results of the selected lines using the candidate polymorphic
markers showed 5 different haplotypes (Table 3.3): on chromosomes 9 and 11; chromosomes 2
and 12; chromosomes 2, 6, 8, 9; chromosomes 2 and 12, chromosomes 4, 8; and on
chromosomes 2, 4, 6, 8, 9, 11, 12. The resistance allele on PI 658320, C98-974 CPRS/AZMIL
(Rush et al., 2011) are on chromosomes 4 and 8 and are only specific to Azmil, the source of
resistance. RUSH C99-1166 (‘LSBR5’), 09DN157//TRP545/CL161, ‘PI 658327’ and ‘PI
658335’ have common resistant alleles from chromosomes 9 and 11. The resistant donor of these
resistant alleles are from ‘LSBR5’ (Rush et al, 2011). LSBR5 is a somaclonal mutant presumably
PEDIGREE D
iseas
e R
atin
g (0
- 9)
Chr. 11 Chr. 12
LOC
_Os1
1g24
060
LOC
_Os1
1g24
770
Loc_
Os1
1g13
650
Loc_
Os1
1g19
700
Loc_
Os1
1g24
180
Loc_
Os1
1g28
950
LOC
_Os1
2g06
980
LOC
_Os1
2g07
950
LOC
_Os1
2g09
710
LOC
_Os1
2g10
180
LOC
_Os1
2g10
330
LOC
_Os1
2g10
410
LOC
_Os1
2g13
100
LOC
_Os1
2g15
480
MCR010277 3 R R R R R R R R R R R R R R
TEQING 3 R R R R R R R R R R R R R R
RUSH C99-1166 (LSBR5) 4 R R S R R R R R S S S S S S
09DN157//TRP545/CL161 3 R R S R R R S S S S S S S S
CTHL/SB2-3 6 S S S S S S S S S S S S S S
CCDR/PI 658335 4 S S S S S S S S S S S S S S
PI 658327 5 R R S R R R S S S S S S S S
PI 658320 5 S S S S S S S S S S S S S S
PI 658335 4 R R R R R R R R R R S R R S
CTHL 8 S S S S S S S S S S S S S S
CCDR 9 S S S S S S S S S S S S S S
CLI52 8 S S S S S S S S S S S S S S
CL111 7 S S S S S S S S S S S S S S
MRMT 8 S S S S S S S S S S S S S S
CL151 8 S S S S S S R R S S S S S S
61
derived from the susceptible japonica variety Labelle (Xia et al., 1992). However, Nelson et al.,
(2012) further studied LSBR5 and found that it carried eight resistant alleles of the fourteen
markers evaluated suggesting that the origin of LSBR5 maybe from an indica source rather than
from Labelle. CTHL/SB2-3 line contained resistant alleles from chromosomes 2 and 12, where
SB2-3 mapping population is the product of Cocodrie (PI 606331) X MCR010277 (PI 641932)
cross.
The resistant alleles in ‘PI 658335’ (COO-1700 LSBR5/LMNT//TQNG/4/ LSBR5/
LMNT/3/H4CODF//NTAI (03-10993-11019) (Rush et al., 2011), are from chromosomes 2, 4, 6,
8, 9, 11 and 12. Resistant alleles from chromosome 9 are the most abundant in this line with
‘LSBR5’, TQNG and H4CODF as the presumed donors. H4CODF is a mutant derived from Sri
Lanka cultivar H4 by cobalt radiation and is partially resistant to sheath blight disease (Sha,
differenober1998). A Cocodrie/PI 658335 cross carries 39 resistance alleles including 11 out of
16 from chromosome 2, 14 from chromosome 6, one allele on 8 and 13 out 17 evaluated on
chromosome 9. This is slightly different from the DH line from the same cross produced by Y.
Sanabria (unpublished result). This result suggests that through recombination, potential new
combinations of alleles are produced that can prove beneficial for breeding purposes. In addition,
a haplotype on chromosomes 9 and 11 was specific only to LSBR5; the haplotype on
chromosome 2 and 12 was specific to 'SB2-3' and a haplotype on chromosomes 2, 6, 8 and 9
specific to PI 658335 was detected.

62
Table 3.3. Genotypes of the 7 selected lines from the 2016-2017 field evaluation at RRS, Crowley, Louisiana.
Table 3.3 continued
PED
IGR
EE
TE
QIN
G
MC
R010277
RU
SH
C99- 1
166 (
LS
BR
5)
09D
N157//
TR
P545/C
L161
CT
HL
/SB
2- 3
CC
DR
/PI
658335
PI
658327
PI
658320
PI
658335
CA
TA
HO
UL
A
CO
CO
DR
IE
CH
EN
IER
E
CL
111
CL
151
CL
152
CL
153
Disease Rating (0-9) 3 4 3 3 4 4 4 3 3 8 9 8 7 7 6 6
LOC_Os02g02650 R R S S R S S S S S S R S S S S
LOC_Os02g11820 R R S S S R S S R S S S S S S S
LOC_Os02g34490 R R S S S R S S R S S S S S S S
LOC_Os02g34850 R R S S S R S S R S S S S S S S
LOC_Os02g35210 R R S S S R S S R S S S S S S S
LOC_Os02g39590 R R S S R R S S R S S S S S S S
LOC_Os02g43460 R R S S R S S S S S S S S S S S
LOC_Os02g44730 R R S S R S S S S S S S S S S S
LOC_Os02g45160 R R S S R S S S S S S S S S S S
LOC_Os02g51900 R R S S S S S S R S S S S S S S
LOC_Os02g54330 R R S S R R S S R S S S S S S S
LOC_Os02g54500 R R S S R R S S R S S S S S S S
LOC_Os02g55180 R R S S R R S S R S S S S S S S
LOC_Os02g56380 R R S S R R S S R S S S S S S S
LOC_Os02g56480 R R S S R R S S R S S S S S S S
LOC_Os02g58540 R R S S S R S S R S S S S S S S
LOC_Os04g05030 R R S S S S S R R S S S S S S S
LOC_Os04g11970 R R S S S S S S R S S S S S S S
LOC_Os04g15650 R R S S S S S S R S S S S S S S
LOC_Os04g23620 R R S S S S S S R S S S S S S S
LOC_Os04g23890 R R S S S S S S R S S S S S S S
LOC_Os04g56250 R R S S S S S S S S S S S S S S
LOC_Os04g58910 R R S S S S S S S S S S S S S S
LOC_Os04g59060 R R S S S S S S S S S S S S S S
LOC_Os04g59540 R R S S S S S S S S S S S S S S
LOC_Os06g13140 R R S S S R S S R S S S S S S S
LOC_Os06g15170 R R S S S S S S S S S S S S S S

63
PED
IGR
EE TE
QIN
G
MC
R010277
RU
SH
C99- 1
166 (
LS
BR
5)
09D
N157//
TR
P545/C
L161
CT
HL
/SB
2- 3
CC
DR
/PI
658335
PI
658327
PI
658320
PI
658335
CA
TA
HO
UL
A
CO
CO
DR
IE
CH
EN
IER
E
CL
111
CL
151
CL
152
CL
153
Disease Rating (0-9) 3 4 3 3 4 4 4 3 3 8 9 8 7 7 6 6
LOC_Os06g22020 R R S S S R S S R S S S S S S S
LOC_Os06g22020 R R S S S R S S R S S S S S S S
LOC_Os06g22460 R R S S S R S S R S S S S S S S
LOC_Os06g23530 R R S S S R S S R S S S S S S S
LOC_Os06g28124 R R S S S R S S R S S S S S S S
LOC_Os06g28670 R R S S S R S S R S S S S S S S
LOC_Os06g29700 R R S S S R S S R S S S S S S S
LOC_Os06g29844 R R S S S R S S R S S S S S S S
LOC_Os06g31070 R R S S S R S S R S S S S S S S
LOC_Os06g32350 R R S S S R S S R S S S S S S S
LOC_Os06g35850 R R S S S R S S R S S S S S S S
LOC_Os06g37500 R R S S S R S S R S S S S S S S
LOC_Os06g44820 R R S S S S S S S S S S S S S S
LOC_Os06g57670 R R S S S S S S S S S S S S S S
LOC_Os08g19694 R R S S S R S S R S S S R S S S
LOC_Os08g30910 R R S S S S S R R S S S R S S S
LOC_Os08g35310 R R S S S S S S R S S S S S S S
LOC_Os08g36320 R R S S S S S S R S S S S S S S
LOC_Os08g42930 R R S S S S S S S S S S S S S S
LOC_Os09g17600 R R S S S S S S S S S S S S S S
LOC_Os09g17630 R R S S S S S S R S S S S S S S
LOC_Os09g25620 R R R R S R R S R S S S S S S S
LOC_Os09g25890 R R R R S R R S R S S S S S S S
LOC_Os09g26300 S R R R S R R S R S S S S S S S
LOC_Os09g27570 R R S S S R S S R S S S S S S S
LOC_Os09g32860 R R S S S S S S S S S S S S S S
LOC_Os09g33710 R R S S S R S S R S S S S S S S
Table 3.3 continued

64
PED
IGR
EE
TE
QIN
G
MC
R010277
RU
SH
C99- 1
166 (
LS
BR
5)
09D
N157//
TR
P545/C
L161
CT
HL
/SB
2- 3
CC
DR
/PI
658335
PI
658327
PI
658320
PI
658335
CA
TA
HO
UL
A
CO
CO
DR
IE
CH
EN
IER
E
CL
111
CL
151
CL
152
CL
153
Disease Rating (0-9) 3 4 3 3 4 4 4 3 3 8 9 8 7 7 6 6
LOC_Os09g36900 R R S S S R S S R S S S S S S S
LOC_Os09g37590 R R S S S R S S R S S S S S S S
LOC_Os09g37880 R R S S S R S S R S S S S S S S
LOC_Os09g38700 R R S S S R S S R S S S S S S S
LOC_Os09g38710 R R S S S R S S R S S S S S S S
LOC_Os09g38850 R R S S S R S S R S S S S S S S
LOC_Os09g38970 R R S S S R S S R S S S S S S S
LOC_Os09g39620 R R S S S R S S R S S S S S S S
LOC_Os11g19700 R R R R S S R S R S S S S S S S
LOC_Os11g24060 R R R R S S R S R S S S S S S S
LOC_Os11g24180 R R R R S S R S R S S S S S S S
LOC_Os11g24770 R R R R S S R S R S S S S S S S
LOC_Os11g28950 R R R R S S R S R S S S S S S S
LOC_Os11g28950 R R S S S S R S R S S S S S S S
LOC_Os12g03554 R R S S R S S S S S S R S S S S
LOC_Os12g04660 R R S S S S S S S S S S S S S S
LOC_Os12g06740 R R S S S S S S R S S S S S S R
LOC_Os12g06980 R R S S S S S S R S S S S S S R
LOC_Os12g07800 R R S S S S S S R S S S S S S R
LOC_Os12g07950 R R S S S S S S R S S S S S S R
LOC_Os12g09000 R R S S S S S S R S S S S S S R
LOC_Os12g09710 R R S S S S S S R S S S S S S R
LOC_Os12g10180 R R S S S S S S R S S S S S S R
LOC_Os12g10410 R R S S S S S S R S S S S S S R
LOC_Os12g13100 R R S S S S S S S S S S S S S S
LOC_Os12g15460 R R S S S S S S R S S S S R S R
* Legend: fuschia - resistant checks; blue - SB selected lines; green - susceptible checks; red - resistant nsSNP allele; yellow - susceptible nsSNP allele.

65
3.4. Discussion
Sheath blight resistance in rice is a quantitatively inherited trait. There is no known single
validated major gene that is effective across multiple germplasm sources. Instead, multiple genes
with small effect control resistance levels suitable for resistance breeding. Several accessions
with complex gene control have shown moderate resistance to SB disease (Eizenga et al. 2002;
Wang et al. 2011). Breeding for this trait is of utmost importance in south Louisiana because
most commercial varieties are known to be moderately to highly susceptible.
Molecular marker applications with conventional breeding have proved beneficial in
some cases for crop improvement (Moose and Mumm, 2008). DNA markers consisting of Single
nucleotide polymorphisms (SNPs) markers are robust, scalable, and relatively easy to use
(Thomson et al. 2017). Non-synonymous SNPs marker on 11 chromosomes associated with
sheath blight resistance using whole genome sequencing were previously identified in Oard’s
laboratory by by Silva et al. (2012). The markers developed by Y. Sanabria (Sanabria, 2015) was
used in genotyping the selected lines described in this study. The nsSNPs markers identified for
SB resistance in my study on chromosomes 2, 4, 6, 8, 9, 11, and 12 mapped in or near several
QTLs reported in the literature (Li et al. 1995; Pan et al. 1999; Zou et al. 2000; Han et al. 2002;
Kunihiro et al. 2002; Che et al. 2003; Sato et al. 2004; Pinson et al. 2005; Tan et al. 2005; Xie et
al. 2008; Liu et al. 2009; Channamallikarjuna et al. 2009; Sharma et al. 2009; Nelson et al. 2012;
Tagushi-Shiobara et al. 2013; Zuo et al. 2014).
Selected SB lines from the field evaluations of advanced lines at the RRS showed
moderate resistance compared to the disease reaction of the susceptible varieties. Genotyping
using the nsSNPs markers revealed one or more resistant allelic combinations in the selected SB
lines. A haplotype specific to only one source of resistance was observed. One example is PI

66
658320 (CPRS/AZMIL (Rush et al. 2011), with a haplotype combination on chromosomes 4 and
8 while CTHL/SB2-3 produced resistance alleles from chromosomes 2 and 12 (Table 3.3).
Resistance alleles from chromosomes 9, 11 and 12 were observed for donor RUSH C99-1166
(LSBR5) and lines CCDR/PI 658335, PI 658327, and PI 658335.
PI 658335 with SB score of 3 showed slightly higher levels of resistance than the cross,
CCDR/PI 658335 with SB score of 4 (Table 3.3). This slight increase in resistance may be due to
presence of two or more resistance alleles on chromosomes 2, 8, and 9. Moreover, PI 658335
carried resistant alleles on chromosomes 4, 11 and 12 that were absent in the CCDR/PI 658335
cross. The SB line PI 658335 was developed from LSBR5, TEQING and H4CODF as resistant
donors (COO-1700 LSBR5/LMNT//TQNG/4/LSBR5/LMNT/3/ H4CODF//NTAI (03-10993-
11019) (Rush et al. 2011). A DH line with the same cross, CCDR/PI 658335, developed by Y.
Sanabria from Dr. Oard’s lab (unpublished result), was different with the resistant allele
composition of the CCDR/PI 658335 line evaluated in my study.
Similar haplotypes were also observed from the selections evaluated in 2014 which
corresponded to the MCR010277 source of resistance. Resistance alleles on chromosomes 4, 6, 9
and 12 was observed in CCDR/SB2-174 cross while the resistance alleles from CCDR//CIAT8/
MCR010277 were found on chromosomes 2, 4, 6 and 9. Another haplotype was detected on
chromosomes 2, 6, and 9, which corresponded to reported disease resistance loci RPM1
(LOC_Os06g22460), OsWAK14 (LOC_Os02g42150), and OsWAK91 (LOC_Os09g38850)
specific only to CCDR/PI 658335 and ‘PI 658335’ (Rush et al. 2011).
The different selected SB lines in this study identified through marker evaluation were
found to carry resistant alleles on chromosomes 2, 4, 6, 8, 9, 11 and 12. QTLs on chromosome 9
related to sheath blight resistance have been found to have a moderate effect on resistance to SB

67
among different sources of resistance (Srinivasachary et al. 2011) including Teqing (Li et
al.1995; Pinson et al. 2005), Jasmine 85 (Liu et al. 2009; Pan et al. 1999; Zou et al. 2000),
Minghui 63 (Han et al. 2002; Zuo et al. 2014), WSS2 (Sato et al. 2004), Tetep
(Channamallikarjuna et al. 2010), Pecos (Sharma et al. 2009) and MCR010277 (Nelson et al.
2012). Although effects for SB resistance were detected previously on chromosome 9 (Nelson et
al., 2012), the combined contributions of chromosomes 2, 4, 6, 8, 9, 11 and 12 most likely were
associated with increased resistance compared to the susceptible parents.
Three resistant alleles on chromosome 9 (LOC_Os09g25620, LOC_Os09g25890,
LOC_Os09g26300), combined with the five resistant alleles on chromosome 11
(LOC_Os11g19700, LOC_Os11g24060, LOC_Os11g24180, LOC_Os11g24770,
LOC_Os11g28950), were common to the five best lines, RUSH C99-1166 (LSBR5),
09DN157//TRP545/CL161, CCDR/PI 658335, PI 658327, and PI 658335. LOC_Os09g25890
encoides trehalose-6-phosphate synthase, reported to play a role in response to infection by the
rice blast fungus Magnaporthe oryzae (Fernandez and Wilson, 2011) while the ankyrin repeat
domain containing protein LOC_Os11g24770 presumably plays a role in rice immunity (Mou et
al. 2013).
The QTL associated with SB resistance on chromosome 9 that has been previously
reported by Nelson et al. (2012) at the bottom of the long arm of chromosome 9 have been
confirmed to exert a moderate effect on SB resistance. Dr. Pankaj Jaiswal of Oregon State
University recently postulated that the following three genes, based on RNA-Seq studies, may be
involved in the sheath blight defense response: CeBIP (Chitin elicitor-binding protein), CERK
(Chitin elicitor receptor kinase 1) and WAK91 (Wall associated kinase). Delteil et al. (2016)

68
reported that the WAK91 gene in rice was one of the several wall-associated kinases involved in
basal defense against the rice blast disease. WAK91 protein belongs to the Receptor-like Kinase
(RLK) gene family that may play key roles in basal immunity, characterized by an extracellular
domain composed of one or several repeats of the Epidermal Growth Factor (EGF) domain
(Cayrol et al. 2016). The EGF domain is known in animals to bind to a very large range of small
peptides and to dimerize upon calcium binding (Hynes and MacDonald, 2009). In maize, two
distinct wall-associated kinases were shown to be responsible for a QTL for resistance to soil-
borne fungus Sporisorium reilianum (ZmWAK) (Zuo et al. 2015) and one against the foliar
fungal pathogen Exserohilum turcicum (Htn) (Hurni et al. 2015). Receptor-like kinases have
been associated with resistance to Magnaporthe grisea and Xanthomonas oryzae diseases.
Therefore, LOC_Os09g38850 may play a role in the host defense response to R. solani. Another
member of the WAK gene family was found on chromosome 2 specifically at LOC_Os02g42150
(OsWAK21) which encodes a wall-associated receptor like cytoplasmic kinase (OsWAK-
RLCK). According to Zhang et al. (2005), the physical location of OsWAK21 is at the bottom of
the long arm of chromosome 2. The resistance alleles of this gene were observed in CTHL/SB2-
3, PI 658335, and CCDR/PI 658335.
Fine mapping of qSB-9TQ, a major quantitative trait locus that confers significant
resistance to rice sheath blight (SB) has yielded 12 candidate genes in this region (Zuo et al.
2014). Conversely, LOC_Os09g38850 was not identified in the fine mapped QTL, although
another protein kinase (LOC_Os09g37230) was found in that region. Essentially, the mapping
population used in the fine mapping and the sources of resistance used in my breeding
population are totally different. The fine-mapped QTL containing the LOC_Os09g37230 might

69
work for the Lemont x Teqing population used by Zuo et al., (2014), but is not significant in the
lines generated in my study or in those lines described by Rush et al. (2011).
Of the SB resistant lines identified in this study, RUSH C99-1166 (LSBR5),
09DN157//TRP545/CL161, PI 658327 and PI 658335, have resistant alleles from chromosome
11. This region contains genes that encodes for receptor-like protein kinases, the same gene
family where WAK91 gene belongs. RLKs have been identified to act in both broad-spectrum,
elicitor-initiated defense responses and as dominant resistance (R) genes in race-specific
pathogen defense (Goff and Ramonell, 2007). However as mentioned above, to increase the
resistance levels against SB, interaction with resistant alleles from other chromosomes may be
required. A gene on LOC_Os02g58540 which encodes for RING-H2 finger protein, was
identified and is common to PI 658335 and CCDR/PI 658335. RING H2- finger protein, is an E3
ubiquitin ligase that is induced by chitin and involved in basal resistance to the biotrophic fungal
pathogen, Golovinomyces cichoracearum (G. cichoracearum) Deng et al. (2017). It was reported
that ectopic expression of the rice OsRHC1, encoding a RING finger protein other than the ATL
family members, in Arabidopsis thaliana shows enhanced disease resistance and elevated
expression of defense related genes (Cheung et al. 2007). The other 5 resistant lines, RUSH C99-
1166 (LSBR5), 09DN157//TRP545/CL161, CTHL/SB2-3, PI 658327 and PI 658320 did not
carry the resistant allele of LOC_Os02g58540, but contained resistant alleles from the other
chromosomes, resulting in a resistant response. The gene on LOC_Os02g58540 alone cannot
exert increased defense response unless associated with other defense related genes. Hence, a
positive interaction with resistant alleles from other chromosomes may be required to improve
resistance to SB disease.

70
Candidate nsSNPS markers identified in this study may be beneficial for development of
SB resistant rice germplasm in conjunction with traditional breeding practices. To identify other
possible resistant alleles involved in the SB resistance, further research will be required to
identify additional makers not covered in this study. Identifying the specific combination of
resistant alleles from specific sources of resistant is also necessary to understand the mechanisms
of resistance to SB and increase efficiency of markers-assisted selection. There has been little
progress toward understanding the genetic mechanisms involved in sheath blight resistance in
rice. Hence, traditional breeding methods coupled with SNP-based markers used in this study
resulted in considerable gains in SB resistance that represents a valuable source of information to
direct future applied research on resistance to R. solani in rice. RNA-Seq technology appeared to
be an important biological tool to understand mechanisms involved in SB resistance. The genetic
material and marker information produced from this study may also facilitate future studies to
investigate mechanisms of rice-R. solani interactions.
3.5. References
Adair CR, Bollich CN, Bowman DH, Jodon NE, Johnston TH, Webb BD, Atkins JG (1973) Rice breeding and and testing methods in the United States, in: Rice in the United States: Varieties and Production. USDA Handbook 289, 19-64.
Arai-Kichise Y, Shiwa Y, Nagasaki H, Ebana K, Yashikawa H, Yano M and Wakasa K (2011) Discovery of genome-wide DNA polymorphisms in a land race cultivar of Japonica rice by whole genome sequencing. Plant Cell Physiol. 52 274–282.
Biswas A (2001) Efficacy of biotos: a new botanical against sheath blight disease of rice.
Mycology Journal Plant Pathology Journal 31: 360-361. Bollich CN, Webb BD, Marchetti MA, Scott JE (19850 Registration of ‘Lemont’ rice. Crop Sci.
25:883–885. Bonman, J, Khush G and Nelson R (1992) Breeding rice for resistance to pests.
Annu. Rev. Phytopathol. 30, 507–528.

71
Carlson CS, Eberle MA, Kruglyak L, Nickerson DA (2004) Mapping complex disease loci in whole-genome association studies. Nature 429(6990):446-452.
Castro AJ, Capettini F, Corey AE, Filichkina T, Hayes PM, Kleinhofs A, Kudrna D, Richardson
K, Sandoval-Islas S, Rossi C, Vivar H (2003) Mapping and pyramiding of qualitative and quantitative resistance to stripe rust in barley. Theor. Appl. Genet. 107, 922–930. doi:10.1007/s00122-003-1329-6.
Cayrol B, Delteil A, Gobbato E, Kroj T, Morel J-B (2016) Three wall-associated kinases
required for rice basal immunity form protein complexes in the plasma membrane, Plant Signaling & Behavior, 11:4, DOI: 10.1080/15592324.2016.1149676
Channamallikarjuna V, Sonah H, Prasad M, Rao GJN, Chand S, Upreti HS, Singh NK, Sharma
TR (2010) Identification of major quantitative trait loci qSBR11-1 for sheath blight resistance in rice. Molecular Breeding 25:155-166.
Che KP, Zhan QC, Xing QH, Wang ZP, Jin DM, He DJ and Wang B (2003) Tagging and
mapping of rice sheath blight resistant gene. Theor. Appl. Genet. 106: 293–297. Chen H, He, H, Zou Y, Chen W, Yu R, Liu X, Yang Y, Gao Y-M, Xu J-L, Fan L-M, Li Y, Li Z-
K, Deng ZW (2011) Development and application of a set of breeder-friendly SNP marker for genetic analyses and molecular breeding in rice (Oryza sativa L.). Theoretical Applied Genetics 123:869-879.
Chu QR, Linscombe SD, Rush MC, Groth DE, Oard J. (2006) Registration of a C/M doubled haploid mapping population of rice. Crop Sci 46: 1417.
Delteil A, Zhang J, Lessard P, Morel JB (2010) Potential candidate genes for improving rice disease resistance. Rice 3:56-71.
Duran C, Appleby N, Clark T, Wood D, Imellbrt M, Batley J, Edwards D (2009) AutoSNPdb: an
annotated single nucleotide polymorphism database for crop plants. Nucleic Acids Research 37:D951-953.
Edwards D and Batley J (2010) Plant genome sequencing: applications for plant improvement.
Plant Biotechnology Journal 8: 2-9. Eizenga GC, Lee FN, Rutger JN (2002) Screening Oryza species plants for rice sheath blight
resistance. Plant Disease ,86:808812. Falconer DS and TFC Mackay (1996) Introduction to quantitative genetics.
Ganal MW, Polley A, Graner E-M, Plieske J, Wieseke R, Luerssen H, Durstewitz G (2012)
Large SNP arrays for genotyping in crop plants. J. Biosci. 37(5), November 2012, 821–828.

72
Godfray H.CJ, Beddington JR, Crute IR, Haddad L, Jules Pretty DL, Muir JF, Robinson S, Thomas SM, Toulmin C (2010) Food security: The challenge of feeding 9 billion people.
Science (Review) 12 Vol. 327: 5967 pp. 812-818; doi: 10.1126/science.1185383.
Goff SA, Ricke D, Lan TH, Presting G, Wang R, Dunn M, Glazebrook J, Sessions A, Oeller P, Varma H, Hadley D, Hutchinson D, Martin C, Katajiri F, Lange BM, Moughamer T, Xia Y, Budworth P, Zhong J, Miguel T, Paszkowski U, Zhang S, Colbert M, Sun W, Chen L, Cooper B, Park S, Wood TC, Mao L, Quail P, Wing R, Dean R, Yu Y, Zharkikh A, Shen R, Sahasrabudhe S, Thomas A, Canning R, Gutin A, Pruss D, Reid J, Tavtigian S, Mitchell J, Eldredge G, Scholl T, Miller RM, Bhatnagar S, Adey N, Rubano T, TusneemN, Robinson N, Feldhouse J, Macalma T, Oliphant A, Briggs S (2002) A draft
sequence of the rice genome (Oryza sativa L. ssp. japonica). Science 296:92-100.
Groth DE and Bond JA (2007) Effects of cultivars and fungicides on rice sheath blight, yield, and quality. Plant Diseases. 91:1647-1650.
Han Y-P, Xing Y-Z, Chen Z-X, Gu S-L, Pan X-B, Chen X L, Zhang Q-F (2002) Mapping QTLs
for horizontal resistance to sheath blight in an elite rice restorer line, Minghui 63. Acta Genet. Sinica 29: 622–626.
Hattori Y, Nagai K, Furukawa S, Song X-J, Kawano R, Sakakibara H, Wu J, Matsumoto T,
Yoshimura A, Kitano H, Matsuoka M, Mori H and Ashikari M (2009) The ethylene response factors SNORKEL1 and SNORKEL2 allow rice to adapt to deep water. Nature.
460:1026-1030.
Hayashi K, Yoshida H, Ashikawa I (2006) Development of PCR-based allele-specific and InDel marker sets for nine rice blast resistance genes. Theor Appl Genet.,113:251–260; doi:10.1007/s00122-006-0290-6.
Hao W, Lin HX (2010) Toward understanding genetic mechanisms of complex traits in
rice. J. Genet. Genomics. 37(10): 653-66. Huang N, Angeles ER, Domingo J, Magpantay G, Singh S, Zhang G, Kumaravadivel N, Bennett
J, Khush GS (1997) Pyramiding of bacterial blight resistance genes in rice: marker-assisted selection using RFLP and PCR. Theor. Appl. Genet. 95, 313–320. doi:10.1007/s001220050565.
Huang X, Feng Q, Qian Q, Zaho Q, Wang L, Wang A, Guan J, Fan D, et al. (2009) High-
throughput genotyping by whole-genome resequencing. Genome Res. 19 1068–1076.
Hurni S, Scheuermann D, Krattinger SG, Kessel B, Wicker T, Herren G, et al. (2015) The maize disease resistance gene Htn1 against northern corn leaf blight encodes a wall-associated receptor-like kinase. Proc Natl Acad Sci U S A. 2015;112(28):8780–5.
Jia Y, Liu GJ, Costanzo S, Lee SH, Dai YT (2009) Current progress on genetic interactions of rice with rice blast and sheath blight fungi. Frontier Agriculture China 3(3):231–239.

73
Jia L, Yan W, Zhu C, Agrama H, Jackson A, Yeater K, Li X, Huang B, Hu B, McClung A, Wu D (2012) Allelic analysis of sheath blight resistance with association mapping in rice.
PLoS ONE 7(3): e32703. doi:10.1371/journal.pone.0032703.
Jia Y, Liu G, Jia MH, McClung AM (2015) Registration of a rice gene mapping population of Lemont × Jasmine 85 recombinant inbred lines. J. Plant Reg. 9:128–132.
Khush G (2005) What it will take to feed 5.0 billion rice consumers in 2030. Plant Molecular
Biology 59 (1):1-6. Kump KL, Bradbury PJ, Wisser RJ, Buckler ES, Belcher AR, Oropeza-Rosas MA, Zwonitzer J
C, Kresovich S, McMullen M D, Ware D (2011) Genome-wide association study of quantitative resistance to southern leaf blight in the maize nested association mapping population. Nature Genetics 43: 163–168.
Kunihiro Y, Qian Q, Sato H, Teng S, Zeng D-L, Fujimoto K, Zhu L-H (2002) QTL analysis of
sheath blight resistance in rice (Oryza sativa L.) Yi Chuan Xue Bao 29: 50–55 Lai J, Li R, Xu X, Jin W, Xu M, Zhao H, Xiang Z, Song W, et al. (2010) Genome-wide patterns
of genetic variation among elite maize inbred lines. Nat. Genet. 42 1027–1030. Lee FN and Rush MC (1983) Rice sheath blight: a major rice disease. Plant Diseases 67:829-
832. Li ZK, Pinson SRM, Marchetti MA, Stansel JW, Park WD (1995) Characterization of
quantitative trait loci (QTLs) in cultivated rice contributing to field resistance to sheath blight (Rhizoctonia solani). Theoretical Applied Genetics 91: 382–388.
Li F, Cheng LR, Xu MR, Zhou Z, Zhang F, Sun Y, Zhou YL, Zhu LH, Xu JL, Li ZK (2009)
QTL mining for sheath blight resistance using the backcross selected introgression lines for grain quality in rice. Acta Agron Sin. 35(9): 1729–1737. (in Chinese with English abstract).
Liu GJ, Jia YL, Correa-Victoria FJ, Prado GA, Yeater KM, McClung AM, Correll JC (2009)
Mapping quantitative trait loci responsible for resistance to rice sheath blight disease using greenhouse assays. Phytopathology 99:1078–1084.
Lobell DB, Schlenker W, Costa-Roberts J (2011) Climate trends and global crop production
since 1980. Science (Report) Vol. 333:6042 pp. 616-620; doi 10.1126/science.1204531. Marchetti MA, Bollich CN, Webb BD, Jackson BR, McClung AM,Scott JE, Hung HH (1998)
Registration of ‘Jasmine 85’ rice. Crop Sci.38:896. doi:10.2135/cropsci1998.0011183X003800030072x

74
McCouch SR, Zhao K, Wright M, Tung C-W, Ebana K, Thomson M, Reynolds A, Wang D, DeClerck G, Ali Md. L, McClung A, Eizenga G, Bustamante C (2010) Development of genome-wide SNP assays for rice. Breeding Science 60:524-535.
Metzker ML (2010) Sequencing technologies — the next generation. Nature Reviews Genetics
11, 31-46; doi:10.1038/nrg2626.
Mew T W, Leung H, Savary S, Vera Cruz CM, Leach JE (2004) Looking ahead in rice disease research and management. CRT Critical Review in Plant Science 23:103-127.
Moose SP and Mumm RH (2008) Molecular plant breeding as the foundation for 21st century
crop improvement. Plant Physiology Vol. 147, pp. 969-977. Neeraja CN1, Maghirang-Rodriguez R, Pamplona A, Heuer S, Collard BC, Septiningsih EM,
Vergara G, Sanchez D, Xu K, Ismail AM, Mackill DJ (2007) A marker-assisted backcross approach for developing submergence-tolerant rice cultivars. Theor Appl Genet. 115(6):767-76.
Pinson SRM, Capdevielle FM, Oard JH (2005) Confirming QTLs and finding additional loci conditioning sheath blight resistance in rice using recombinant inbreed lines. Crop Science 45:503-510.
Ou SH (1985) Rice Diseases. Farnham Royal, UK: CAB Int. 2nd ed. Pan XB, Zou JH, Chen ZX, Lu JF, Yu HX, Li HT, Wang ZB, Pan XY, Rush MC, Zhu LH (1999)
Tagging major quantitative trait loci for sheath blight resistance in a rice variety, Jasmine 85. Chinese Scientific Bulletin 44(19): 1783–1789.
Poland JA, Balint-Kurti PJ, Wisser RJ, Pratt RC, Nelson RJ (2009) Shades of gray: The world of
quantitative disease resistance. Trends Plant Science14:21–29. Rafalski A (2002) Applications of single nucleotide polymorphisms in crop genetics. Current
Opinion in Plant Biology Vol. 5 Issue 2, 94–100. Ramdeen S, Rampersad SN (2013) Intraspecific differentiation of Colletotrichum gloeosporioides
sensu lato based on in silico multilocus PCR-RFLP fingerprinting. Mol. Biotech. 53, 170-81.
Rush MC and Lee FN (1992) Sheath blight. In: Webster, R. K. and P. S. Gunnel (eds.)
Compendium of Rice Diseases. APS Press, Minnesota, pp. 22-23. Sato H, Ideta IO, Ando I, Kunihiro Y, Hirabayashi H, Iwano M, Miyasaka A, Nemoto H, Imbe T
(2004) Mapping QTLs for sheath blight resistance in the rice line WSS2. Breeding Science 54: 265–271.

75
Silva J, Scheffler B, Sanabria Y, De Guzman C, Galam DCA, Farmer A, Woodward J, May G, Oard JH (2012) Identification of candidate genes in rice for resistance to sheath blight disease by whole genome sequencing. Theoretical Applied Genetics 124:63–74.
Pinson SRM, Capdevielle FM, Oard JH (2005) Confirming QTLs and finding additional loci
conditioning sheath blight resistance in rice (Oryza sativa L.) using recombinant inbred lines. Crop Science 45: 503–510.
Sanabria, YG (2015) Development of disease resistant rice using whole genome sequencing and standard breeding methods. LSU Doctoral Dissertations. 3870.
https://digitalcommons.lsu.edu/gradschool_dissertations/3870.
Sha, X (1998) Measurement and inheritance of resistance to sheath blight caused by Rhizoctonia Solani Kuhn in rice. LSU Historical Dissertations and Theses. 6790.
https://digitalcommons.lsu.edu/gradschool_disstheses/6790
Singh SK, Shukla V, Singh H, Sinha AP (2004) Current status and impact of sheath blight in rice (Oryza sativa L.). Agricultural Review 25 (4):289 – 297.
Skamnioti P, and Gurr SJ (2010) Against the grain: safeguarding rice from rice blast disease.
Trends in Biotehnology (Review) 27: 141-150. St.Clair D (2010) Quantitative disease resistance and quantitative resistance loci in breeding.
Annu. Rev. Phytopathol. 48:247–68. Takagi H, Abe A, Yoshida K, Kosugi S, Natsume S, Mitsuoka C, Uemura A, Utsushi H, Tamiru
M, Takuno S, Innan H, Cano LM, Kamoun S and Terauchi R (2013) QTL-seq: rapid mapping of quantitative trait loci in rice by whole genome resequencing of DNA from two bulked populations. The Plant Journal. 74, 174–183.
Tan CX, Ji XM, Yang Y, Pan XY, Zuo SM, Zhang YF, Zou JH, Chen ZX, Zhu LH, Pan XB
(2005) Identification and marker assisted selection of two major quantitative genes controlling rice sheath blight resistance in backcross generations. Acta Genet Sin, 32: 399–405.
Venu RC, Jia YL, Gowda M, Jia MH, Jantasuriyarat C, Stahlberg E, Li H, Rhineheart A,
Boddhireddy P, Singh P, Rutger N, Kudrna D, Wing R, Nelson JC, Wang GL (2007) RL-SAGE and microarray analysis of the rice transcriptome after Rhizoctonia solani infection. Molecular Genetics and Genomics 278: 421–431
Wang L, Huang W W, Liu L-M, Fu Q, Huang S-W (2011) Evaluation of resistance to sheath
blight (Rhizoctonia solani) in partial indica hybrid rice combinations from Southern China Acta Agron Sin, 37(2): 263–270.
Wise RP, Moscou MJ, Bogdanove AJ, Whitham SA (2007) Transcript profiling in host-pathogen interactions. Annu Rev Phytopathol 45:329−369.

76
Xie X-W, Xu M-R, Zang J-P, Sun Y, Zhu L-H, Xu J-L, Zhou Y-L, Li Z-K (2008) Genetic background and environmental effects on QTLs for sheath blight resistance revealed by reciprocal introgression lines in rice. Acta Agron. Sin. 34:1885–1893; doi:10.1016/S1875-2780(09)60013-4.
Zhang Q (2007) Strategies for developing Green Super Rice. Proceedings National Academy of
Sciences U. S. A. 104: 16402-16409. Zhao CJ, Wang AR, Shi YJ, Wang LQ, Liu WD, Wang ZH, Lu GD (2008) Identification of
defense-related genes in rice responding to challenge by Rhizoctonia solani. Theoretical Applied Genetics 16: 501–516.
Zou JH, Pan XB, Chen ZX, Xu JY, Lu JF, Zhai WX, Zhu LH (2000) Mapping quantitative trait
loci controlling sheath blight resistance in two rice cultivars (Oryza sativa L.). Theoretical Applied Genetics. 101:569–575.
Zuo W, Chao Q, Zhang N, Ye J, Tan G, Li B, et al. (2015) A maize wall-associated kinase confers quantitative resistance to head smut. Nat Genet. 2015;47:151–7.
Yuan Z, Zhang Y, Xu G, Bi D, Qu H, Zou X, Gao X, Yang H, He H, Wang X, Bao J, Zuo S, Pan X, Zhou B, Wang G-L, Qu S (2018) Comparative transcriptome analysis of Rhizoctonia solani-resistant and -susceptible rice cultivars reveals the importance of pathogen recognition and active immune responses in host resistance. J. Plant Biol. 61:143-158 DOI 10.1007/s12374-017-0209-6.

77
CHAPTER 5. GENETIC ANALYSIS OF NOXIOUS AQUATIC WEED IN LOUISIANA AND TEXAS
4.1. Introduction
Salvinia molesta Mitchell [Salviniaceae] is a floating, rootless aquatic fern introduced
from South America that has been found at more than 150 locations since 1995 in 69 freshwater
sites in Alabama, Arizona, California, Florida, Georgia, Hawaii, Louisiana, Mississippi, North
Carolina, Puerto Rico, South Carolina, Texas, and Virginia (http://www.gri.msstate.edu/ipams
/species.php?CName=Giant%20salvinia). S. molesta is considered a noxious weed in Louisiana
and other states because it out-competes water hyacinths (Eichhornia crassipes (Mart.) Solms)
and indigenous aquatic species. Moreover, rapid, dense growth of S. molesta restricts penetration
of oxygen and light below surface water negatively affecting all plants and animals beneath.
Decomposition of S. molesta leads to substantial reductions in dissolved oxygen required by fish
and other aquatic life (Thomas and Room, 1986). The growth rate of S. molesta varied from 5 to
41 days in doubling time depending on environmental and nutrient conditions (Mitchell and Tur,
1975). Without competitive factors during summer months, S. molesta can be colonized by
sedges, grasses, and even small trees to create a floating island of vegetation.
S. molesta is a pentaploid neotropical species considered a member of the “Salvinia
auriculata complex” that also includes S. auriculata Aublet, S. biloba Raddi, and S. herzogii de
la Sota (Loyal and Grewal, 1966). Vegetative reproduction of S. molesta by stem fragments has
been reported (McFarland et al., 2004), but fertility of the fruiting bodies or sporocarps is still
not known. The basic vegetative reproductive unit is referred to as the “ramet” consisting of a
rhizomatous structure connected to three leaves in a whorl, two of which are floating and green,
This chapter previously appeared in Morphological and genetic survey of Giant Salvinia populations in Louisiana
and Texas, Galam D et al., Elsevier: Aquatic Botany, 2015.

78
while the remaining leaf is white, submersed and often misidentified as a root. The apparent
inability of S. molesta to reproduce sexually may result in proliferation of separate and distinct
clonal lineages.
In Louisiana, S. molesta was first observed in 1998 at the Toledo Bend Reservoir and at
the Sabine River (McFarland et al. 2004). This invasive fern was subsequently detected in
Cameron Parish in 2001 (http://www.seagrantfish .lsu.edu/ pdfs/ giantsalvinia_control.pdf) and
in Lake Bistineau in 2005 and in Caddo Lake in 2006 (http://www.doi.gov/ocl/hearings/112
/GiantSalvinia_062711.cfm). The first infestation sites in Texas were found at Toledo Bend and
at Swinney Marsh in 1998 (Jacono 1999; Jacono and Pitman 2001).
The control of S. molesta by herbicides may be inconsistent or ineffective due to presence
of below-water buds and stems, “unwettable” hair-covered leaves, and a thick layer of vegetation
formed on the surface of the water (McFarland et al. 2004). Many conventional aquatic
herbicides are completely ineffective (unpublished data). Success of C. salviniae as a biological
control agent for S. molesta in Florida varied with swings in population levels of C. salviniae and
the aquatic fern (Room, 1990). Release of C. salviniae into infested areas of Louisiana and Texas
has shown potential as a biocontrol strategy (Tipping et al. 2008). Large-scale rearing and release
of C. salviniae is currently used in Louisiana and Texas to help suppress growth of S. molesta in
concert with herbicides (http://cise. tamu.edu/ media/355740/gs_manual_10-15-12.pdf).
Madeira et al. (2003) conducted a genetic survey of the related S. minima, an introduced
clonally propagated fern that has a U.S. distribution range similar to that of S. molesta. RAPD
Ramdonly Amplifed Polymorphic DNA (RAPD) markers located at 88 different genomic
regions of S. minima were used to evaluate diversity of 38 different populations within and
outside of Florida. Their study showed that S. minima essentially belonged to the same genetic

79
population, although samples from Mississippi may have been genetically distinct from those in
Florida.
The nuclear encoded glyceraldehyde 3-phosphate dehydrogenase gene (gapCp) has been
used to examine population diversity in various species including bacteria (Figge et al. 1999),
insects (Ishiyama et al. 2006), a fungal plant pathogen (Ramdeen and Rampersad, 2013), and the
mangrove Bruguiera gymnorhiza (Minobe et al. 2010). Schuettpelz et al. 2008 examined gapCp
sequence diversity to study the evolutionary history of polyploid ferns.
The effects of nitrogen level and water temperature on growth rate of S. molesta were
previously investigated under greenhouse conditions (Cary and Weerts, 1983a). Over a period of
19 days, S. molesta increased maximum biomass 38-fold when grown at 22°C and supplied with
20 mg NH4-N l-1. Under these conditions, doubling time for leaf number occurred in ~ 2.2 days.
In a related study (Cary and Weerts, 1983b), maximum growth rate of the fern occurred 32-fold
under greenhouse conditions at 22°C when provided 1 to 10 mg PO4-P l-1.
No morphological or genetic diversity study of S. molesta has been conducted in the
southern U.S.
4.2. Materials and Methods
4.2.1. Collection of S. molesta samples and morphological data
Salvinia molesta was first observed in Louisiana in1998 at the Toledo Bend Reservoir
and at the Sabine River (McFarland et al., 2004). This invasive fern was subsequently detected in
Cameron Parish in 2001 (http://www.seagrantfish.lsu.edu/pdfs/giantsalvinia_control.pdf,
accessed March 4, 2015) and in Lake Bistineau in 2005 and in Caddo Lake in 2006
(http://www.doi.gov/ocl/hearings/112 /GiantSalvinia_062711.cfm, accessed March 4, 2015). In
Texas, the first infestation sites were found at Toledo Bend and at Swinney Marsh in 1998
(Jacono, 1999; Jacono and Pitman, 2001).

80
Leaves and lateral buds were collected at each of six sites in Louisiana and Texas from
May 26 to June 10, 2009. The collection sites (Table 4.1) for this study because are recognized
by the Louisiana Department of Wildlife and Fisheries and the Texas Parks and Wildlife
Department as historical or persistent infestations at ecologically diverse locations in both states.
Table 4.1. Geographic location of S. molesta populations and description of collection sites.
At each site, 40 individual colonies of S. molesta were collected a minimum of 10 m
apart, washed thoroughly with distilled water before collecting measurements from each colony
Collection Site
GPS Coordinates
Description
Caddo Lake, Louisiana
N 32.734874°; W 94.021751°
Large lake ~ 108 km in length that stretches across into Texas consisting of interconnecting sloughs, bayous and ponds.
Lake Bistineau, Louisiana
N 32.440811°; W 93.380742°
Long (23 km) and narrow (2 km) lake presumably created in 1800 from a log jam on the Red river.
Gheens, Louisiana
N 29.410802°; W 90.265386°
Slow moving streams (bayous) in south Louisiana with dense infestations of S. molesta
Thibodaux, Louisiana
N 29.394169°; W 90.433939°
Slow moving streams (bayous) in south Louisiana with dense infestations of S. molesta.
Belle River, Louisiana
N 29.553052°; W 91.142103°
Popular boat launch for fishing in south Louisiana with S. molesta infestation detected at the river’s edge.
Toledo Bend, Texas
N 31.298415°; W 93.753011°
Fifth largest man-made body of water in the U.S; located on the Texas side along the Sabine River between Louisiana and Texas.

81
for width, ramets/colony, rhizome length, leaf width, and root length. A total of 20 randomly
selected colonies from each site were used to measure the five traits from each colony. For each
trait, three independent measurements per colony were collected. Colonies were examined for
presence of fruiting bodies (sporocarps) and the weevil C. salviniae. Samples were then blotted
dry and placed in individual 50 mL sterilized centrifuge tubes containing desiccated silica gel.
The centrifuge tubes were subsequently stored in the laboratory at room temperature in the dark
until DNA extraction. Except for the Toledo Bend Reservoir, a one-liter sample of water at each
site was taken to determine pH and N, P, and K concentrations. Samples were analyzed ~ 24 hr
after collection by the Department of Agricultural Chemistry, Louisiana State University
AgCenter, Baton Rouge, LA.
4.2.2. DNA extraction, amplified fragment length polymorphism (AFLP) and gapCp gene sequence analysis
A range of 36 to 42 silica-dried aerial leaves and lateral buds from individual colonies
across locations were collected for DNA extraction using the Qiagen DNeasy Plant Mini Kit
(QIAGEN, Valencia, CA, USA) as recommended by the manufacturer. AFLP marker analysis
was carried out on 40 S. molesta samples from each collection site using the basic protocol of
Vos et al. (1995). Briefly, ~ 200 ng DNA/μL from each sample was digested with EcoRI and
MseI restriction enzymes. Digested fragments were ligated to EcoRI and MseI adaptors, and
pre-selective amplification was carried out with with EcoRI+A and MseI+C primers. Amplified
PCR products were diluted 10-fold as templates for selective amplification. Eight AFLP primer
pairs (E-ACC/M-CAA, E-AAC/M-CAA, E-ACC/CAC, E-AAC/M-CAC, E-AGA/M-CAG, E-
AGG/M-CAG, E-AAA/M-CCC, E-AAA/M-CGC) were labeled with IR dye (700 and 800 P:
MWG, Germany) with three selective nucleotides used for fingerprinting of 10 samples from
each population. Two AFLP primer pairs, E-AAC/M-CAC and E-AAA/M-CCC, produced

82
repeatable and scorable fragments that were used to genotype all samples. Selective
amplifications were conducted with 10 μL final volume containing 2 μL diluted pre-
amplification product, 1.0 μL 1 μM IR-labeled EcoRI primer, 1.0 μL 1 μM IR-labeled MseI
primer, 0.2 μL 5 U/μL Taq DNA polymerase (Promega, Madison, WI), 1.0 μL 5 mM dNTPs, 3.2
μL 5x PCR buffer (Promega, Madison, WI), and 0.6 μL sterilized water. Amplified products
were combined with 5 μL 5x Bromo-phenol Blue loading dye and denatured at 95°C for 5
minutes. A total of 0.75 μL was loaded onto 6.5% polyacrylamide denaturing gels using the
LiCor 4300 DNA Analyzer (LiCor Inc., Lincoln, NE). Clear and unambiguous AFLP fragments
were manually scored as ‘1’ for presence and ‘0’ for absence.
Conserved regions as described by Ebihara et al, (2005) from Pinus sylvestris gapCp
exons and introns 8, 9, 10, and 11 (GenBank accession AJ001706; Meyer-Gauen et al., 1998)
were used to design primers (see below) for PCR amplification of corresponding S. molesta
fragments. PCR reactions consisted of 10X PCR Buffer containing MgCl2, 10 μM each dNTP, 5
U/µl AmpliTaq® DNA Polymerase (Life Technologies, USA), 20 μM primer ESGAPCP8F1 (5’
to 3’ = ATYCCAAGYTCAACTGGTGCTGC), 20 μM primer ESGAPCP11R1 (5’ to 3’ =
TATCCC CAYTCRTTGTCRTACC), 1 µl template DNA in 20 µl reaction. PCR conditions
consisted of initial denaturation step (94°C for 5 min), denaturation, annealing, and elongation
step (94°C for 1 min, 59°C for 1 min, 72°C for 2 min) for 35 cycles and elongation step (72°C
for 10 min).
PCR products were resolved on a 4% agarose gel and subsequently cloned using the
TOPO TA Cloning kit (Invitrogen by Life Technologies, USA). Cloning reactions included 0.4
µl salt from the cloning kit, 0.4 µl TOPO vector, and 0.7 µl PCR product with incubation for 30
min at room temperature. Transformations were carried out with 0.7 µl cloning mixture and 16.7

83
µl One Shot TOP10 competent cells as recommended by the manufacturer’s protocol.
Transformed cells were grown on plates containing Luria broth, 50 mg/L ampicillin and X-gal
(Gold Biotechnology, USA) for 16 hr at 37°C. Cells from 15 or more white colonies from each
plate were added to 20 µl PCR reactions prepared as above, but with the M13 Forward (-20) and
M13 Reverse primers (Life Technologies, Grand Island, NY, USA). PCR was carried out as
described above with isolated amplified fragments of ~ 650 bp in length selected for sequencing.
Selected PCR products were submitted to the Louisiana State University Pennington Biomedical
Research Center-CORE facility for sequencing using the M13 Forward (-20) and M13 Reverse
primers.
Selected PCR products were purified using the QIAquick PCR Purification Kit
(QIAGEN, Valencia, CA, USA) following the manufacturer’s protocol. Sequencing of the PCR
products was carried out with the BigDye Terminator v3.1 Cycle Sequencing Kit (Life
Technologies, Grand Island, NY, USA) per the manufacturer’s instructions. Each 10 μL reaction
incorporated 0.375x BigDye Terminator Ready Reaction Mix (Life Technologies, Grand Island,
NY, USA), 0.625x BigDye Terminator Sequencing Buffer (Life Technologies, Grand Island,
NY, USA), 1 μM primer [M13 Forward (-20) and M13 Reverse primers] and 2 μL purified PCR
product. Sample electrophoresis and analysis were performed using an ABI 3130xL DNA
Analyzer (Life Technologies, Grand Island, NY, USA).
4.2.3. Analyses of morphological and molecular data
Morphological traits like root length, colony width, rhizome length, leaf width and
number of ramets per colony were collected from 20 randomly-selected colonies at each site.
Principal component analysis of the five traits and polymorphic AFLP loci and the was carried
out using PROOC PRINCOMP of SAS v9.3 with default settings (SAS Institute Inc., 2010). The

84
Analysis of Variance (ANOVA) and Tukey’s Studentized Range (HSD) Test for the
morphological traits was computed using PROC GLM. PROC CLUSTER was implemented to
group observations together when the underlying structure was unknown. This was carried out
with average linkage analysis where distance between two clusters was the average between
pairs of observations or one in each cluster. Data points with the smallest average distances
between them were grouped together. Data with the next smallest distances were added to each
group until all observations clustered together into one group.
Nei’s average number of pairwise allelic differences within and between populations (Nei
and Li, 1989) for both AFLP binary fragments and gapCp sequence data were computed using
Arlequin v3.5.1.3 (Excoffier and Lischer, 2010). AMOVA of raw AFLP binary and gapCp
sequence data was performed using GenAlEx6.5 software with the Codom – Genotypic
(Haploid) option for distance calculation based on Peakall and Smouse, 2012. A nonparametric
permutation procedure with 9999 pairwise-permutations was carried out to test the significance
of the variable components associated with possible levels of genetic structure.
Nucleotide diversity (π) of gapCp data was computed by the average number of
nucleotide substitutions per site (DXY) between populations and the number of net nucleotide
substitutions per site between populations (DA) based on Nei (1987) using DnaSP 5.10 software
(Rozas et al., 2003). Arlequin v3.5.1.3 software (Excoffier and Lischer, 2010) was used to
calculate π for the AFLP data, Wright’s fixation index (Fst) (Wright, 1951) and measure of
polymorphism per nucleotide (θ) under the finite sites model (Tajima, 1996).
Cloned PCR products of S. molesta described above were sequenced from 237
individuals ranging from 36 to 42 individuals across the six populations of this study. Individual
sequences per population were subjected to multiple sequence alignments with the exons and

85
introns the P. sylvestris gapCp gene using the ClustalW v2.1 software (www.clustal.org). The
NCBI BLAST search tool was utilized to identify regions of similarity. For both AFLP marker
data and gapCp sequences, Mantel’s isolation by distance test (Mantel, 1967) was conducted
using GenAlEx v6.5 (Peakall and Smouse, 2012). Nei’s pairwise genetic distance between
populations (Nei and Li, 1989) based on AFLP and gapCp sequence data was used to generate
genetic distance matrices.
4.3. Results
4.3.1. Phenotypic diversity of S. molesta in Louisiana
The ANOVA carried out for the five traits evaluated in this study produced significant F
values (P < 0.0001) for all traits, suggesting substantial phenotypic variability was present for the
morphological characters evaluated across collection sites (Table 4.2). S. molesta from
Bistineaux, Louisiana had the highest colony width with 164 mm while samples from BellRiver
and Thibodaux, LA had the lowest colony width. For the number of ramets per colony, samples
from Caddo, LA had the highest number of ramets per colony across the sampling sites. Caddo
Lake and Bistineaux, LA showed the longest rhizome length per colony with 15mm respectively
while samples from Gheens, LA had the shortest rhizome per colony across the sites.
Additionaly, leaf width per colony from Caddo and Bistineaux, LA were significantly higher
with a range of 30 -33mm than the samples from BellRiver, Thibodaux and Gheens, Louisiana.
Lastly, samples from Bistineaux, LA had significantly higher root length per colony with 344mm
across the sampling site while samples from Thibodaux and BellRiver, LA had the shortest root
length per colony with 40 and 48mm respectively. Pearson’s linear correlation (r) values
between traits showed that root length was moderately associated with colony width, rhizome
length, and leaf width (r > 0.5, p < 0.001, Table 4.3). However, when each site was analyzed

86
separately, only ramets/colony was associated with colony width at the Gheens, Bell River, and
Lake Bistineau sites (r > 0.5, p < 0.001).
Table 4.2. Analysis of variance (ANOVA) of five morphological characteristics; colony width (mm), ramets per colony, rhizome length per colony (mm), leaf width per colony (mm), root length per colony (mm) for five populations of S. molesta.
Letter notation indicates Tukey’s mean comparison test with means indicated by the same letter is not significantly different at the 0.05 probability level.
Principal Component Analysis (PCA) was used to identify clustering of the five traits in
one or more of the study sites. The PCA generated five clusters with PC1, PC2, and PC3
eigenvalues explaining a combined 85% of the observed variation (Fig. 4.1). The Bistineau
location formed two distinct clusters, but the remaining groups were formed by an overlap
between different populations. Moreover, a single cluster was not always associated with a
single location as was observed for the Bistineau site. A similar pattern was observed where two
clusters were detected at each of the Gheens and Caddo Lake sites. Based on the morphological
traits, root length per colony (mm) was detected to have the highest observed variation value
(PC1 = 53%) while ramets per colony (mm) had the lowest (PC1 = 28%).
Both Lake Bistineau and Caddo Lake produced greater median root lengths than the three
southern locations (Fig. 4.2). The Thibodaux site produced the smallest median value as was
Sources of variation
Populations Gheens,
LA BellRiver,
LA Thibodaux,
LA Caddo,
LA Bistineaux,
LA
Colony width (mm) 116b 70c 58c 96b 164a
Number of ramets per colony 25 23 24 41a 27
Rhizome length per colony (mm) 7c 10b 10b 15a 15a
Leaf width per colony (mm) 26b 30a 21c 30a 33a
Root length per colony (mm) 65c 48c 40c 163b 344a

87
observed for colony width and leaf width. Tukey’s analysis showed that the two northern sites
were each assigned to separate clusters while the three southern locations formed a second
group.
Bistineau site in north Louisiana that contrasted with the smallest range and median value
at the Thibodaux site in south Louisiana. Colony width at Lake Bistineau in north Louisiana
produced the greatest mean value (164 mm) that was statistically different based on Tukey’s test
from the second (Gheens, 116 mm; Caddo Lake, 96 mm) and third group (Bell River, 70 mm;
Thibodaux, 58 mm). The same trend was observed in the number ramets per colony, leaf width
(mm), and length of rhizomes per colony (mm), where substantial variations were detected at all
locations. Median values for ramets per colony ranged from 23.3 to 41.1 mm across locations.
Similar trends were observed for the other morphological traits (data not shown). For example,
the greatest range and median values for colony width (mm) were observed at the Lake northern
sites at Lake Bistineau and Caddo Lake generated the widest median leaf widths at 29.6 to 33.0
mm compared to the three southern locations with overall median value of 28.0 mm. The
greatest range and median values for the number of rhizome per colony was detected at the two
north Louisiana sites vs. the three southern locations, particularly at Gheens that exhibited the
smallest median value.

88
Figure 4.1. Principal Component Analysis (PCA) of the five traits from S. molesta evaluated in this study. Pyramid = Gheens, LA; Cylinder = Bell River, LA; Cube = Thibodaux, LA; Club = Caddo Lake, LA; Balloon = Lake Bistineau, LA. Green = Cluster 1; Black = Cluster 2; Red = Cluster 3; Magenta = Cluster 4; Purple = Cluster 5.
4.3.2 Molecular diversity of S. molesta in Louisiana and Texas
Using the AFLP DNA marker and gapCp gene sequence information collected within
and across Louisiana and Texas sites, significant differences (P<0.0005) were detected by
AMOVA both within and among the populations (Table 4). When considering total AFLP
marker information, the vast majority of the variation was detected within populations (93%) as
compared to variation among populations (7%). A similar trend was observed for exon and
intron sequences of the gapCp gene where most of the variability (87%) was attributed to within-
population variation.

89
Table 4. 3. Correlation matrix of five morphological traits of the five populations of S. molesta from Louisiana and Texas. Values above the diagonal are the P-values with 999 permutations and the Pearson correlation coefficient values between pairs of traits below the diagonal. P values were significant at < 0.05.
Morphological Traits
Colony width
Ramets per
colony
Rhizome length per
colony
Leaf width
Root length
Colony width - 0.000 0.000 0.000 <0.000
Ramets per colony 0.34 - 0.000 0.218 0.158
Rhizome length per colony
0.37 0.37 - <0.000 <0.000
Leaf width 0.34 0.12 0.45 - <0.000
Root length 0.62 0.14 0.66 0.52 -
Principal Component Analysis (PCA) was performed with AFLP data for the six
collection sites of this study. PC1, PC2, and PC3 eigenvalues explained a combined 42 % of the
observed variation that produced five distinct clusters. One large cluster consisted of 86% of all
individuals originating from all six collection sites. The remaining clusters were small, loose
groups containing few (3 to 13) individuals. The Mantel test (Mantel, 1967) was used to evaluate
geographical and genetic relationships among the six collection sites in Louisiana and Texas. No
correlation between genetic and geographical distances was detected by AFLP data (P = 0.290)
or the gapCp sequences (P=0.374). Similar to the AFLP data, PCA analysis of the S. molesta
gapCp sequence data produced 85% of the total variation that revealed four major clusters each
comprised of individuals from more than one collection site. The Mantel test revealed no
correlation between sequence and geographical distance for the gapCp gene.

90
Overall pairwise analysis of nucleotide diversity (π) of gapCp sequences at 0.25
suggested relatively high levels of variability for the six collection sites. The average number of
gapCp nucleotide substitutions per site between populations was relatively high. For example,
Figure 4.2. Box plot for root length (mm) for 20 individuals each of S. molesta at Gheens, LA; Bell River, LA; Thibodaux, LA; Caddo Lake, LA; and Lake Bistineau, LA. The top and bottom of the colored boxes represent the 75th and 25th percentile, respectively, while the horizontal band in a box represents the 50th percentile (median). Vertical lines with horizontal “caps” above and below the boxes denote the smallest and largest values. Black dots outside the boxes represent individual values considered as “outliers” (< or > 3/2 value of 75th or 25th percentile). Letter notation above the plot indicates Tukey’s mean comparison test with means indicated by the same letters are not significantly different at the 0.05 probability level.
the Thibodaux, LA and Toledo Bend sites exhibited the highest average number of nucleotide
substitutions per site with 0.54, followed by Caddo Lake, LA vs Toledo Bend, BellRiver
Landing, LA vs Toledo Bend and Bell River Landing, LA vs Lake Bistineau, LA with values
ranging for 0.50 to 0.53. The comparison of Gheens, LA vs Lake Bistineau, LA revealed the
lowest average of nucleotide substitutions at 0.24.

91
Table 4.4. Analysis of molecular variance using AFLP marker and the gapCp gene sequence for six populations of S. molesta from Louisiana and Texas.
Sources of variation Degrees of
freedom Percentage of
variation
AFLP
Among Population 5 6.58
Within Population 234 93.42
Total 239
GapCp sequence
Among Population 5 12.68
Within Population 227 87.31
Total 232
Haplotype analysis of gapCp sequences by DnaSP 5.10 software (Rozas et al., 2003)
revealed a total of 108 haplotypes across locations of which 23 (21%) haplotypes were detected
at Bell River Landing, LA, Thibodaux, LA and Toledo Bend, TX. The number of haplotypes
ranged on average from 1 to 6 across locations while the number of individuals per haplotype
across locations varied from 1 to 63. A total of 122 nucleotide substitutions and 82 indels were
detected among/across the sampled individuals. Non-synonymous substitutions were
substantially greater in number than synonymous variants across exons and across locations
except for the Thibodaux, LA and Caddo Lake, LA sites. The gapCp haplotypes were used to
estimate population differentiation as measured by Wright’s Fst fixation index that produced an
overall value of 0.033. This low value indicates the absence of distinct populations that were
evaluated in this study. Moreover, variance component analysis of gapCp sequences (Table 4)
indicated that the vast majority of variation occurred within populations (87%) which is
consistent with AFLP marker results as described above.
PCA of molecular and morphological traits showed that PC1 eigenvalues for AFLP
markers accounted for 32% of variation observed for root length across all locations while PC1

92
eigenvalues for ramets per colony, rhizome length per colony, and leaf width per colony ranged
from 24% to 27%. In contrast, PC1 eigenvalues for gapCp sequences accounted for only small
percentages of observed variation for the five traits varying from 1% to 8%.
4.4. Discussion
Morphological and molecular variation of S. molesta were examined at diverse infested
locations in Louisiana and Texas. Significant levels of variation in both morphological
characters and molecular markers were detected at each of the collection sites. We observed a
general pattern where morphological traits tended to exhibit greater values from the two sites in
north Louisiana vs. the remaining locations in the south. This outcome may be explained in part
by specific environmental conditions at each location. For example, open waters of the two lakes
in north Louisiana likely afforded greater opportunity for increased growth of individual ramets
and colonies vs. the limited growth conditions in the small bayous at Gheens or Thibodaux or at
the edge of Belle River in south Louisiana. Our low correlation values between the traits suggest
that those measured characteristics associated with growth and size of S. molesta acted
independently of each other in a location-specific manner.
PCA of the five traits evaluated in this study revealed more than one cluster within a
single location, the most prominent example found at Lake Bistineau as shown in Fig. 1. Two
clusters were also observed within the remaining sites with the exception of Thibodaux. Presence
of more than one cluster suggests that subpopulations of S. molesta may exist at the different
collection sites, but larger sample sizes and detailed analysis of population structure would be
required to confirm these findings.
The AMOVA results showed that there was considerably more molecular variation
within each population than across collection sites. We interpret this result to mean that each

93
population was variable, but none on average was significantly different than the other. With
similar levels of molecular variation, we suggest that the six populations of S. molesta were
originally introduced and dispersed from common or related sources. Madeira et al. (2003) also
detected relatively high levels of molecular diversity for the related S. minima collected in seven
southern U.S. states, and found low levels of variance (8%) between the regions surveyed.
PCA detected moderate associations of 25% to 30% for AFLP markers and root length,
ramets per colony, rhizome length per colony, and leaf width per colony. These results are not
unexpected given that only 46 polymorphic AFLP loci were used in this study. Future studies
that evaluate more loci or utilize genomic sequences may reveal additional information to link
molecular diversity and reproductive success of S. molesta. In contrast, high levels of gapCp
variation were not associated with any trait evaluated in our study. The lack of association was
most likely due to sampling of only a single locus for traits governed by complex genetic control.
If the S. molesta clones from the six locations originated from a single clonal source,
what is the cause(s) of the extensive molecular and morphological variation observed in this
study? The first factor that may explain the observed variation is numerous somatic mutations
across the genome of S. molesta that could affect reproductive capacity and adaption to changing
environments. Our study uncovered high levels of molecular variation using AFLP markers, and
we detected high levels of variants within gapCp at each location that can impact protein
structure, function, and adaption. Relatively high levels of morphological diversity have been
reported in other clonally propagated species (Clark-Tapia et al., 2005; Ellstrand and Roose,
1987; Widen et al., 1994).
The second factor associated with high diversity levels in S. molesta may be the different
environments encountered during this study. Each environment most likely exerted an important

94
but different impact on genetic makeup and expression of traits of S. molesta at each location.
The practical implication is that different and location-specific control strategies for S. molesta
most likely will be needed. A recent Australian study by Schooler et al. (2011) suggested that
greater attention to the growth dynamics of both S. molesta and C. salviniae, at each infested site
may provide a useful strategy for long-term control of this noxious weed. Consistent with that
assessment was a recent study that showed temperature at different infestation sites had a
dramatic impact on winter survival rates of C. salviniae in north vs. south Louisiana (Tipping et
al., 2012).
4.5. References
Clark-Tapia R, Alfonso-Corrado C, Eguiarte L, Molina-Freaner F (2005) Clonal diversity and distribution in Stenocereus eruca (Cactaceae), a narrow endemic cactus of the Sonoran desert. Amer. J. Bot. 92, 272–278.
D’hoop BB, Paulo MJ, Kowitwanich K, Sengers M, Visser RGF, Van Eck HJ, Van Eeuwijk, FA (2010) Population structure and linkage disequilibrium unraveled in tetraploid potato. Theor. Appl. Genet. 121:1151-1170.
Ebihara A, Ishikawa H, Matsumoto S, Lin S, Iwatsuki K, Takamiya M, Watano Y, Ito M (2005)
Nuclear DNA, chloroplast, DNA, and ploidy analysis clarified biological complexity of the Vandenboschia radicans complex (Hymenophyllaceae) in Japan and adjacent areas. Am. J. Bot. 92, 1535-1547.
Ellstrand NC and Roose MJ (1987) Patterns of genotypic diversity in clonal plant species. Am. J.
Bot. 74, 123-131. Excoffier L and Lischer HEL (2010) Arlequin suite ver 3.5: a new series of programs to
perform population genetics analyses under Linux and Windows. Mol. Ecol. Res. 10, 564–567.
Figge RM, Schubert M, Brinkmann H, Cerff R (1999) Glyceraldehyde-3-phosphate dehydrogenase gene diversity in eubacteria and eukaryotes: evidence for intra- and inter-
kingdom gene transfer. Mol. Biol. Evol. 16, 429-40. Huang WK, Guo GY, Wan FH, Gao BD, Xie BY (2008) AFLP Analyses on genetic diversity
and structure of Eupatorium adenophorum populations in China. Chin J Agric Biotechnol 5: 33-41.

95
Ishiyama H, Inomata N, Yamazaki T, Ab Shukor N, Szmidt AE (2006) Demographic history and interspecific hybridization of four Shorea species (Dipterocarpaceae) from Peninsula Malaysia inferred from nucleotide polymorphism in nuclear gene regions. Can.
J. For. Res. 38, 996–1007. Jacono CC (1999) Salvinia molesta (Salviniaceae), new to Texas and Louisiana. Sida 18, 927- 928. Jacono C and Pitman B (2001) Salvinia molesta: Around the world in 70 years. Aqua. Nuisance
Species Digest 4, 13-16. Loyal DS, Grewal RK (1966) Cytological study on sterility in Salvinia auriculata Aublet with
bearing on its reproductive mechanism. Cytologia 31, 330-338. Madeira PT, Jacono CC, Tipping P, Van TK, Center TD (2003) A genetic survey of
Salvinia minima in the southern United States. Aqua. Bot. 76, 127–139.
Mantel N (1967) The detection of disease clustering and a generalized regression approach. Cancer Res. 27:220.
McFarland DG, Nelson LS, Grodowitz MJ, Smart RM, Owens CS (2004) Salvinia molesta D.S. Mitchell (Giant Salvinia) in the United States: A review of species ecology and approaches to management. U.S. ACE Pub. ERDC/EL SR-04-2.
Meyer-Gauen G, Herbrand H, Pahnke J, Cerff R and Martin W (1998) Gene structure,
expression in Escherichia coli and biochemical properties of the NAD1-dependent glyceraldehyde-3-phosphate dehydrogenase from Pinus sylvestris chloroplasts. Gene 209, 167–174.
Michalski SG, Durka W, Jentsch A, Kreyling J, Pompe S, Schwieger O, Willner E,
Beigerkuhnlein C (2010) Evidence for genetic differentiation and divergent selection in an autotetraploid forage grass (Arrhenatherum elatius). Theor. Appl. Genet. 120: 1151-1162.
Minobe S, Fukui S, Saiki R, Kajita T, Changtragoon S, Shukor NAB, Latiff A,
Ramesh BR, Koizumi O, Yamazaki T (2010) Highly differentiated population structure of a Mangrove species, Bruguiera gymnorhiza (Rhizophoraceae) revealed by one nuclear gapCp and one chloroplast intergenic spacer trnF–trnL. Conserv. Genet. 11, 301–310.
Mitchell DS and Tur NM (1975) The rate of growth of Salvinia molesta (S. Auriculata Auct.) in
laboratory and natural conditions. J. Appl. Ecol. 12, 213-225.
Nei M (1987) Molecular Evolutionary Genetics. Columbia University Press, New York. Nei M and Jin L (1989) Variances of the average numbers of nucleotide substitutions within and
between populations. Mol. Biol. Evol. 6: 240-300.

96
Peakall R and Smouse PE (2012) GenAlEx 6.5: genetic analysis in Excel. Population genetic
software for teaching and research-an update. Bioinformatics 28, 2537-2539. Ramdeen S and Rampersad SN (2013) Intraspecific differentiation of Colletotrichum
gloeosporioides sensu lato based on in silico multilocus PCR-RFLP fingerprinting. Mol. Biotech. 53, 170-81.
Room PM (1990) Ecology of a simple plant-herbivore system: biological control of Salvinia. Trends Ecol. Evol. 5, 74-79.
Rozas J, Sanches-DelBarrio JC, Messeguer X, Rozas R (2003) DnaSP, DNA polymorphism
analyses by the coalescent and other methods. Bioinformatics 19, 2496-2497. Schooler SS, Salau B, Julien MH and Ives AR (2011) Alternative stable states explain
unpredictable biological control of Salvinia molesta in Kakadu. Nature 470: 86–89. Schuettpelz E, Grusz AL, Windham MD, Pryer KM (2008) The utility of nuclear gapCp
in resolving polyploid fern origins. Syst. Bot. 33, 621-629. Subudhi PK, Parami NP, Harrison SA, Materne MD, Murphy JP, Nash D (2005) An AFLP-
based survey of genetic diversity among accessions of sea oats (Uniola paniculata, Poaceae) from the southeastern Atlantic and Gulf coast states of the United States. Theor. Appl. Genet. 111:1632-1641.
Tajima F (1996) The amount of DNA polymorphism maintained in a finite population when the
neutral mutation rate varies among sites. Genetics143, 1457–1465. Thomas PA and Room PM (1986) Taxonomy and control of Salvinia molesta. Nature 320, 581-
584. Tipping PW, Martin MR, Center TD, Davern TM (2008) Suppression of Salvinia molesta
Mitchell in Texas and Louisiana by Cyrtobagous salviniae Calder and Sands. Aqua. Bot. 88, 196–202.
Tipping PW, Martin MR, Center TD (2012) Weevils versus no weevils: a comparison of S. minima populations in Florida and Louisiana. Florida Entomol. 95, 779-782. Vos P, Hogers R, Bleeker M, Reijans M, van de Lee T, Fornes M, Frijters A, Pot J,
Peleman J, Kuiper M, Zabeau M (1995) AFLP: A new technique for DNA fingerprinting. Nuc. Acids Res. 23, 4407-4414.
Widen B, Cronberg N, Widen M (1994) Genotypic diversity, molecular markers and spatial
distribution of genets in clonal plants, a literature survey. Folia Geobot. Phytotaxon. 29:245–263.

97
Wright S (1951) The genetical structure of populations. Ann. Eugen. 15, 323-354.

98
CHAPTER 5. SUMMARY AND CONCLUSION
5.1. Identification and Development of Breeding Lines and Populations
Sheath blight (SB) disease caused by the fungus Rhizoctonia solani is one of most
important disease in rice causing important losses in southern U.S. especially in Louisiana where
environmental conditions is very conducive for the growth and proliferation of the fungus.
Several sources of resistance exist but are not adapted to the southern U.S. environment.
Louisiana commercial varieties are highly susceptible to the disease. Hence, it is necessary to
introgress the resistance to our adapted germplasm. Field evaluation of different populations
against SB disease, I was able to identify promising lines with good disease resistance, desirable
plant height and the days to maturity are comparable to the Louisiana varieties. These promising
lines have a significant decrease yield reduction ranges from 4 to 43% as compared to the
susceptible Louisiana varieties. The lines have different sources of resistance (RUSH C99-1166
– ‘LSBR 5’, 09DN157//TRP545/CL161, CTHL/SB2-3, CCDR/PI 658335, PI 658327, PI
658320, PI 658335) and are crossed six susceptible Louisiana varieties (Cocodrie, Catahoula,
CL111, CL151, CL152, CL153). Several generations, F3, F4, and BC2F3, BC3F2 have already
been produced and the progenies of these crosses have already been evaluated. Because the
populations are at early generation stages, further evaluation is needed to advance this material.
5.2. Identification and Evaluation of Non-synonymous SNP Markers for SB Resistance
Resistance to sheath blight disease is a quantitative trait controlled by several genes with
small effects. Many QTLs related to SB resistance have been identified in several populations.
The use of different types of markers with varying levels of polymorphism were used to
genotype populations with hundreds of individuals. Single nucleotide polymorphic (SNPs)

99
markers are the marker of choice because it is more affordable and ease of use. In my study, 83
non-synonymous SNP-based markers with clear polymorphism between and among the lines
selected in Chapter 2 were identified. These non-synonymous SNPs markers mapped to
chromosomes 2, 4, 6, 8, 9, 11, and 12 that were within QTLs previously reported (Nelson et al.
2012; Sanabria, 2015). These markers may be used efficiently in the development of SB resistant
lines through marker-assisted selection strategy.
5.3. Genetic and Phenotypic Diversity of S. molesta in Louisiana and Texas.
The southern Gulf Coast is surrounded with bayous, large lagoons and lakes is favorable
to agriculture and fisheries, rice farming, fishing, and shrimping. However, these industries and
human activities are being slowed down due to the invasive growth of giant aquatic fern called
Salvinia molesta. To develop effective control and management strategies for Louisiana and
Texas, it is important to understand the population diversity of S. molesta both at the genetic and
whole-plant level. Both morphological characters and molecular markers detected on S. molesta
in diverse infested locations in Louisiana and Texas were significantly different at each of the
collection sites. We observed a general pattern where morphological traits tended to exhibit
greater values from the two sites in north Louisiana vs. the remaining locations in the south.
This outcome may be explained in part by specific environmental conditions at each location.
Analysis of molecular variance (AMOVA) showed considerably more molecular variation within
each population than across collection sites. PCA detected moderate associations of 25% to 30%
for AFLP markers and root length, ramets per colony, rhizome length per colony, and leaf width
per colony. On the other hand, high levels of gapCp variation were not associated with any trait
evaluated in our study.

100
But what is the cause(s) of the extensive molecular and morphological variation observed
in this study? If the S. molesta clones from the six locations originated from a single clonal
source. The first factor that may explain the observed variation is numerous somatic mutations
across the genome of S. molesta that could affect reproductive capacity and adaption to changing
environments. Our study uncovered high levels of molecular variation using AFLP markers, and
we detected high levels of variants within gapCp at each location that can impact protein
structure, function, and adaption. Relatively high levels of morphological diversity have been
reported in other clonally propagated species (Clark-Tapia et al., 2005; Ellstrand and Roose,
1987; Widen et al., 1994). The second factor associated with high diversity levels in S. molesta
may be the different environments encountered during this study. Each environment most likely
exerted an important but different impact on genetic makeup and expression of traits of S.
molesta at each location. The practical implication is that different and location-specific control
strategies for S. molesta most likely will be needed.

101
APPENDIX A. RANKING OF 136 nsSNPs MARKERS ACROSS 20 SUSCEPTIBLE RILs OF THE RICECAP SB2 MAPPING POPULATION BASED ON RAW P, HOCHBERG, BONFERRONI, FALSE DISCOVERY AND R-SQUARED VALUES (Sanabria, 2015).
Rank
Marker
F Value
Raw_P-Value
Hochberg
p-value
Stepdown Bonferroni
False Discovery
Rate p-value
R-Squared
1 LOC_Os09g32860 149.154 0 0 0 0 0.892315 2 LOC_Os09g33710 61.04 0 0.00004 0.00004 0 0.772268 3 LOC_Os09g34180 61.04 0 0.00004 0.00004 0 0.772268 4 LOC_Os09g36900 61.04 0 0.00004 0.00004 0 0.772268 5 LOC_Os09g37230 61.04 0 0.00004 0.00004 0 0.772268 6 LOC_Os09g37240 61.04 0 0.00004 0.00004 0 0.772268 7 LOC_Os09g37590 61.04 0 0.00004 0.00004 0 0.772268 8 LOC_Os09g37800 61.04 0 0.00004 0.00004 0 0.772268 9 LOC_Os09g37880 61.04 0 0.00004 0.00004 0 0.772268 10 LOC_Os09g38700 61.04 0 0.00004 0.00004 0 0.772268 11 LOC_Os09g38710 61.04 0 0.00004 0.00004 0 0.772268 12 LOC_Os09g38850 61.04 0 0.00004 0.00004 0 0.772268 13 LOC_Os09g38970 61.04 0 0.00004 0.00004 0 0.772268 14 LOC_Os12g10330 41.633 0 0.00052 0.00053 0.00004 0.698154 15 LOC_Os12g10410 41.633 0 0.00052 0.00053 0.00004 0.698154 16 LOC_Os12g13100 41.633 0 0.00052 0.00053 0.00004 0.698154 17 LOC_Os12g15460 41.633 0 0.00052 0.00053 0.00004 0.698154 18 LOC_Os09g39620 37.145 0.00001 0.00106 0.00106 0.00008 0.673587 19 LOC_Os12g09710 33.113 0.00002 0.00211 0.00211 0.00016 0.56581 20 LOC_Os12g10180 33.113 0.00002 0.00211 0.00211 0.00016 0.56581 21 LOC_Os09g32020 23.457 0.00013 0.01449 0.01462 0.00097 0.483682 22 LOC_Os12g06980 23.457 0.00013 0.01449 0.01462 0.00097 0.483585 23 LOC_Os12g09000 16.856 0.00066 0.07303 0.07303 0.00468 0.449908 24 LOC_Os12g07950 14.722 0.00121 0.13166 0.13166 0.00807 0.351999 25 LOC_Os06g13040 9.778 0.00583 0.62916 0.62916 0.03699 0.3322 26 LOC_Os06g15170 8.954 0.00781 0.83613 0.83613 0.04726 0.284212 27 LOC_Os12g03554 7.147 0.0155 0.9835 1 0.08949 0.263827 28 LOC_Os12g04660 7.147 0.0155 0.9835 1 0.08949 0.263827 29 LOC_Os02g34490 6.283 0.02201 0.9835 1 0.10351 0.258734 30 LOC_Os02g34850 6.283 0.02201 0.9835 1 0.10351 0.258734 31 LOC_Os02g35210 6.283 0.02201 0.9835 1 0.10351 0.258734 32 LOC_Os12g07800 6.451 0.02053 0.9835 1 0.10351 0.255983 33 LOC_Os12g06740 6.451 0.02053 0.9835 1 0.10351 0.242599 34 LOC_Os08g19694 6.193 0.02284 0.9835 1 0.10361 0.241195 35 LOC_Os08g20020 5.721 0.02788 0.9835 1 0.11423 0.241195 36 LOC_Os08g30850 5.721 0.02788 0.9835 1 0.11423 0.187053 37 LOC_Os08g30910 5.765 0.02736 0.9835 1 0.11423 0.187053 38 LOC_Os06g19110 3.852 0.06535 0.9835 1 0.20748 0.17626 39 LOC_Os06g22020 3.852 0.06535 0.9835 1 0.20748 0.17626 40 LOC_Os06g22460 3.852 0.06535 0.9835 1 0.20748 0.17626 41 LOC_Os06g23530 3.852 0.06535 0.9835 1 0.20748 0.17626 42 LOC_Os06g28124 3.852 0.06535 0.9835 1 0.20748 0.17626 43 LOC_Os06g28670 3.852 0.06535 0.9835 1 0.20748 0.17626 44 LOC_Os06g29700 3.852 0.06535 0.9835 1 0.20748 0.17626 45 LOC_Os06g29844 4.142 0.05684 0.9835 1 0.20748 0.17626 46 LOC_Os03g43684 4.142 0.05684 0.9835 1 0.20748 0.165702 47 LOC_Os06g31070 3.575 0.07486 0.9835 1 0.23189 0.120051 48 LOC_Os06g32350 2.204 0.15499 0.9835 1 0.33529 0.120051 49 LOC_Os04g10460 2.204 0.15499 0.9835 1 0.33529 0.117506 50 LOC_Os04g11640 2.204 0.15499 0.9835 1 0.33529 0.117506
APPEDIX A. continued

102
Rank
Marker
F Value
Raw_P-Value
Hochberg
p-value
Stepdown Bonferroni
False Discovery
Rate p-value
R-Squared
51 LOC_Os04g11970 2.204 0.15499 0.9835 1 0.33529 0.117506 52 LOC_Os04g15650 2.397 0.13899 0.9835 1 0.33529 0.117506 53 LOC_Os04g20680 2.397 0.13899 0.9835 1 0.33529 0.117506 54 LOC_Os04g21890 2.397 0.13899 0.9835 1 0.33529 0.117506 55 LOC_Os04g23620 2.397 0.13899 0.9835 1 0.33529 0.117506 56 LOC_Os04g23890 2.397 0.13899 0.9835 1 0.33529 0.117506 57 LOC_Os09g16540 2.397 0.13899 0.9835 1 0.33529 0.109532 58 LOC_Os09g17600 2.397 0.13899 0.9835 1 0.33529 0.109532 59 LOC_Os09g17630 2.397 0.13899 0.9835 1 0.33529 0.109532 60 LOC_Os03g30130 2.456 0.13451 0.9835 1 0.33529 0.109069 61 LOC_Os03g37720 2.456 0.13451 0.9835 1 0.33529 0.109069 62 LOC_Os03g39150 2.166 0.1584 0.9835 1 0.33529 0.109069 63 LOC_Os03g40250 2.166 0.1584 0.9835 1 0.33529 0.109069 64 LOC_Os08g10560 2.214 0.15407 0.9835 1 0.33529 0.107387 65 LOC_Os08g12800 2.214 0.15407 0.9835 1 0.33529 0.107387 66 LOC_Os08g13870 2.214 0.15407 0.9835 1 0.33529 0.107387 67 LOC_Os03g63110 1.475 0.24022 0.9835 1 0.46294 0.076657 68 LOC_Os02g42412 1.473 0.24058 0.9835 1 0.46294 0.075747 69 LOC_Os02g44730 1.473 0.24058 0.9835 1 0.46294 0.075636 70 LOC_Os02g45160 1.473 0.24058 0.9835 1 0.46294 0.075636 71 LOC_Os02g45980 1.473 0.24058 0.9835 1 0.46294 0.075636 72 LOC_Os02g48210 1.494 0.2373 0.9835 1 0.46294 0.075636 73 LOC_Os08g42930 1.203 0.2872 0.9835 1 0.54439 0.062643 74 LOC_Os11g13650 1.043 0.32068 0.9835 1 0.59891 0.062643 75 LOC_Os02g58540 0.929 0.34792 0.9835 1 0.63123 0.054766 76 LOC_Os01g13300 0.929 0.34792 0.9835 1 0.63123 0.049072 77 LOC_Os04g56250 0.898 0.35586 0.9835 1 0.63654 0.049072 78 LOC_Os08g35310 0.851 0.36855 0.9835 1 0.64118 0.04752 79 LOC_Os02g39590 0.851 0.36855 0.9835 1 0.64118 0.045129 80 LOC_Os02g51900 0.753 0.39685 0.9835 1 0.68108 0.045129 81 LOC_Os02g52060 0.615 0.44303 0.9835 1 0.70947 0.045129 82 LOC_Os02g02650 0.536 0.47334 0.9835 1 0.70947 0.04017 83 LOC_Os02g43460 0.536 0.47334 0.9835 1 0.70947 0.033049 84 LOC_Os02g53970 0.536 0.47334 0.9835 1 0.70947 0.02894 85 LOC_Os02g54330 0.536 0.47334 0.9835 1 0.70947 0.02894 86 LOC_Os02g54500 0.533 0.47484 0.9835 1 0.70947 0.02894 87 LOC_Os02g55180 0.533 0.47484 0.9835 1 0.70947 0.02894 88 LOC_Os04g57670 0.533 0.47484 0.9835 1 0.70947 0.028746 89 LOC_Os04g58720 0.533 0.47484 0.9835 1 0.70947 0.028746 90 LOC_Os04g58820 0.533 0.47484 0.9835 1 0.70947 0.028746 91 LOC_Os04g58910 0.533 0.47484 0.9835 1 0.70947 0.028746 92 LOC_Os04g59060 0.508 0.48531 0.9835 1 0.71668 0.028746 93 LOC_Os04g59540 0.433 0.51884 0.9835 1 0.74688 0.028746 94 LOC_Os05g50660 0.424 0.5234 0.9835 1 0.74688 0.028746 95 LOC_Os09g26300 0.424 0.5234 0.9835 1 0.74688 0.027427 96 LOC_Os04g05030 0.343 0.56525 0.9835 1 0.74778 0.023491 97 LOC_Os05g37040 0.343 0.56525 0.9835 1 0.74778 0.022989 98 LOC_Os05g39760 0.356 0.55839 0.9835 1 0.74778 0.022989 99 LOC_Os08g36320 0.362 0.55499 0.9835 1 0.74778 0.020628 100 LOC_Os08g36760 0.379 0.54578 0.9835 1 0.74778 0.020628 101 LOC_Os09g27570 0.379 0.54578 0.9835 1 0.74778 0.020628 102 LOC_Os06g44820 0.379 0.54578 0.9835 1 0.74778 0.019706 103 LOC_Os02g49986 0.137 0.71588 0.9835 1 0.85611 0.019372
APPENDIX A. continued

103
Rank
Marker
F Value
Raw_P-Value
Hochberg
p-value
Stepdown Bonferroni
False Discovery
Rate p-value
R-Squared
104 LOC_Os02g09820 0.137 0.71588 0.9835 1 0.85611 0.018711 105 LOC_Os02g10120 0.137 0.71588 0.9835 1 0.85611 0.018711 106 LOC_Os02g56380 0.127 0.7261 0.9835 1 0.85611 0.007887 107 LOC_Os02g56480 0.143 0.70964 0.9835 1 0.85611 0.007887 108 LOC_Os02g57960 0.143 0.70964 0.9835 1 0.85611 0.007887 109 LOC_Os06g35850 0.143 0.70964 0.9835 1 0.85611 0.007887 110 LOC_Os06g37500 0.143 0.70964 0.9835 1 0.85611 0.007887 111 LOC_Os01g52330 0.112 0.74152 0.9835 1 0.85611 0.007538 112 LOC_Os01g52880 0.112 0.74152 0.9835 1 0.85611 0.007538 113 LOC_Os01g53420 0.112 0.74152 0.9835 1 0.85611 0.007538 114 LOC_Os09g25620 0.143 0.70964 0.9835 1 0.85611 0.007307 115 LOC_Os09g25890 0.143 0.70964 0.9835 1 0.85611 0.007307 116 LOC_Os02g10900 0.139 0.71698 0.9835 1 0.85611 0.006985 117 LOC_Os05g40790 0.132 0.7201 0.9835 1 0.85611 0.006195 118 LOC_Os05g41130 0.132 0.7201 0.9835 1 0.85611 0.006195 119 LOC_Os05g41290 0.132 0.7201 0.9835 1 0.85611 0.006195 120 LOC_Os11g19700 0.042 0.83928 0.9835 1 0.89571 0.002629 121 LOC_Os11g24060 0.042 0.83928 0.9835 1 0.89571 0.002629 122 LOC_Os11g24180 0.042 0.83928 0.9835 1 0.89571 0.002629 123 LOC_Os11g24770 0.042 0.83928 0.9835 1 0.89571 0.002629 124 LOC_Os11g28950 0.047 0.83001 0.9835 1 0.89571 0.002629 125 LOC_Os03g53220 0.047 0.83001 0.9835 1 0.89571 0.002347 126 LOC_Os03g56400 0.047 0.83001 0.9835 1 0.89571 0.002347 127 LOC_Os03g57160 0.047 0.83001 0.9835 1 0.89571 0.002347 128 LOC_Os03g58390 0.047 0.83001 0.9835 1 0.89571 0.002347 129 LOC_Os04g55760 0.031 0.86218 0.9835 1 0.91248 0.00172 130 LOC_Os02g11820 0 0.9835 0.9835 1 0.9835 0.000065 131 LOC_Os01g54350 0 0.9835 0.9835 1 0.9835 0.000024 132 LOC_Os01g54515 0 0.9835 0.9835 1 0.9835 0.000024 133 LOC_Os01g55050 0 0.9835 0.9835 1 0.9835 0.000024 134 LOC_Os01g56040 0 0.9835 0.9835 1 0.9835 0.000024 135 LOC_Os01g57230 0 0.9835 0.9835 1 0.9835 0.000024 136 LOC_Os01g57900 0.001 0.97305 0.9835 1 0.9835 0.000024

104
APPENDIX B. PRIMER SEQUENCES FOR SNP-BASED MARKERS LOACTED IN PREVIOUSLY REPORTED QTL’S FOR SHEATH BLIGHT RESISTANCE (Sanabria, 2015).
Gene
Function
SNP Position
Ref. Allele
Var. Allele
Ref. AA
Var. AA
Primer Ref Forward (Susceptible Allele)
Primer Ref Reverse (Susceptible Allele)
Primer Alt Forward (Resistant Allele)
Primer Alt Reverse (Resistant Allele)
LOC_Os02g02650 THION21 - Plant thionin family protein precursor
975892 T G N T GATGACTGCAGCCCCAACACGAA TGATATGTTGTTGACAGACATCAGCGTGAAT
GGATGACTGCAGCCCCAACAACAC TGATATGTTGTTGACAGACATCAGCGTGAAT
LOC_Os02g11820 GTPase-activating protein, putative, expressed
6114451 T A V E AGCCTGCTAGTGCACAGCCCGT AAAAATGAAGAATGTGACTGCCCCATCA
CAGCCTGCTAGTGCACAGCCACA AAAGAAATGGAAGGTACACAGATCGACTTCTGATA
LOC_Os02g34490 Leucine Rich Repeat family protein, expressed
20661950 G C W S TTGAAGCTCTGAGAGGGAGGTGATCTCTC
ATGTGTATCGGCTCCCATATTGCTTGTTATC
AGCTCTGAGAGGGAGGTGATCTGCG
ATGTGTATCGGCTCCCATATTGCTTGTTATC
LOC_Os02g34850 histone-lysine N-methyltransferase ASHH2, putative, expressed
20899450 T A V D CAAGTACTTCCTCAGCATCCTCCTGCA
GAGATAATTTGTGCAAATGAAACGTATCCTTCAGT
GCACCAAGTACTTCCTCAGCATCCTCCTTAT
CCACATGCAAAAGACCCCAATTCAAG
LOC_Os02g35210 resistance protein, putative 21160861 G A D N GGACTCTGTCCTCAGCAAGCTCATCG CATCTCCTTGGCAATTTGGTAGTGATTCC
ATGGACTCTGTCCTCAGCAAGCTCAACA
CATCTCCTTGGCAATTTGGTAGTGATTCC
LOC_Os02g39590 GDSL-like lipase/acylhydrolase, putative
23887432 T A K M CATGGCCGAGCTTCTGTACCACCA AGCTGAAGTGTTCATTCTTCAGTAGTACATTGTGG
TGGCCGAGCTTCTGTACCGCAT TATGGTTGTAAGCCTGGTGCTCCTGTGTAAT
LOC_Os02g43460 required to maintain repression 1, putative
26228789 C G A G TCGGCGTACGGTGGGGATTGTAC TTTGGTCCATTGTTTCTGACGCATTGT
GGCGTACGGTGGGGATTGAGG TTCCTCCTCTGAGCAATCTTTACATTTCTCTTG
LOC_Os02g44730 tetracycline transporter protein, putative, expressed
27099654 T A M K GGGCAATCTGGTGCAAGTGGGAT TACAACAAGCTGGGCTGGCTTCTATGAC
AGGGCAATCTGGTGCAAGTGAGGA TGGCATTAACTCATGTCTGAAGCTCCG
LOC_Os02g45160 aluminum-activated malate transporter, putative, expressed
27387949 A G S P TGACGGTGCCGGAGGGCTAGT TCGAAGACCACGACAACCGTCATG GACGGTGCCGGAGGGCTCAC AAACACGGTGAGGAACACAGCAAACTG
LOC_Os02g51900 cytokinin-O-glucosyltransferase 2, putative, expressed
31782340 G C H D CAGGCCCGACCTCGTCGCTA TTGCTTTCGCTCTCATATCCTTGCTTTTC
CAGGCCCGACCTCGTCGCTG TTGCTTTCGCTCTCATATCCTTGCTTTTC
LOC_Os02g54330 OsFBDUF14 - F-box and DUF domain containing protein
33307448 C G R T GGATACAGGTGACGAGGAATCCCCTTC
CACGCCATGATCAACCTCCGGT TACAGGTGACGAGGAATCCCCACG CACGCCATGATCAACCTCCGGT
LOC_Os02g54500 WD40-like, putative, expressed
33367587 A G T A CACCCTGCTGCACAGGGAATTACA CAACTATCCACCAGAAAATTAGGCAGTAACAGCTAT
CCTGCTGCACAGGGAATTCGG CAACTATCCACCAGAAAATTAGGCAGTAACAGCTAT
LOC_Os02g55180 ubiquitin carboxyl-terminal hydrolase domain containing protein, expressed
33794880 C T T I CTGTTAACTTGCCCATGAAAACAGAGCATAC
AGTGAGCTTCAGATGCCTGGCCATT
TGTTAACTTGCCCATGAAAACAGAGCAACT
AGTGAGCTTCAGATGCCTGGCCATT
LOC_Os02g56380 OsWAK21 - OsWAK receptor-like cytoplasmic kinase OsWAK-RLCK
34511349 C A A S GATGACAAGCTCAACGCCAAAGTCG CATGAGGAGGTCTGCAATCTCTGTTGC
TTGATGACAAGCTCAACGCCAAAGTCT
CATGAGGAGGTCTGCAATCTCTGTTGC
LOC_Os02g56480 PB1 domain containing protein, expressed
34568863 T C H R GGAGGACGCTGGTGTAGTAGATGGGGT
TCCTACCGGTGCCGGGAAGGTATA GGAGGACGCTGGTGTAGTAGATGGCTC
AGTACTACTTGCCCAAGTACCAGGAGAAGCC
LOC_Os02g58540 RING-H2 finger protein, putative, expressed
35778055 G A A V ATCTGCGTCGCCGGCCTGTC CGTGGGTCCCCAGCCACGTA ATCTGCGTCGCCGGCCTTGT GGCCGGGGAGAGGGAGGAATAAT
LOC_Os04g05030 serine-rich 25 kDa antigen protein, putative, expressed
2441294 G A D N GAGCTGCCAAAGAAAGGTGCCG TTGCACAGCAACAGAAGATGACAAATCTG
CGTGAGCTGCCAAAGAAAGGTGCTA
TTGCACAGCAACAGAAGATGACAAATCTG
LOC_Os04g11970 O-methyltransferase, putative, expressed
6560546 G A A T CGTGGTTCAGGGATGGACGAAATG TATCCTCAAACATGTCGCCAGCGATAA
CGTGGTTCAGGGATGGACGAAAGA TATCCTCAAACATGTCGCCAGCGATAA
LOC_Os04g15650 Leucine Rich Repeat family protein, expressed
8505140 G T G C CAGTGGCATGCCCAGTATGCCTG GGTTTTCGTGGTCCAATGTTGAGCATAG
GCAGTGGCATGCCCAGTATGCTCT GGTTTTCGTGGTCCAATGTTGAGCATAG
LOC_Os04g21890 disease resistance protein RPM1, putative, expressed
12387967 A C Q P AGGATATTATGAAGTGGTGTTGTGGTCGACA
ATAAGTAATCATGCGCTAGCTCTTCCATCGTAGT
AAAGGATATTATGAAGTGGTGTTGTGGTCTTCC
ATAAGTAATCATGCGCTAGCTCTTCCATCGTAGT
LOC_Os04g23620 D-mannose binding lectin family protein
13514379 A C S A CTGCGCCCCACCCTGCCTAT GCAATGACTGCCCAGGGACCAAT CTGCGCCCCACCCTGCCTTG GCAATGACTGCCCAGGGACCAAT
LOC_Os04g23890 AGC_PVPK_like_kin82y.10 - ACG kinases include homologs to PKA, PKG
13640560 T C Q R CAGGGAGGCCATCAGGGAGGA TTGAAGCTCCCCCTGCACTCACA CAGGGAGGCCATCAGGGAGGG TTGAAGCTCCCCCTGCACTCACA
LOC_Os04g56250 OsFBX152 - F-box domain containing protein, expressed
33349688 G A T I AAGGATTCCATCTTCTCCCACTCCAATG
GATTCAAGACGAGGACGGCGAGTG
CAAGGATTCCATCTTCTCCCACTCCAATA
GATTCAAGACGAGGACGGCGAGTG
LOC_Os04g58910 receptor protein kinase TMK1 precursor, putative, expressed
34856814 T C N D TGGGTCGAACTACTGTTGCCATCATTTTT
GTGTGAAGGTGAATGTGACCGGCA GGGTCGAACTACTGTTGCCATCATTCTC
GTGTGAAGGTGAATGTGACCGGCA
APPENDIX B. continued

105
Gene
Function
SNP Position
Ref. Allele
Var. Allele
Ref. AA
Var. AA
Primer Ref Forward (Susceptible Allele)
Primer Ref Reverse (Susceptible Allele)
Primer Alt Forward (Resistant Allele)
Primer Alt Reverse (Resistant Allele)
LOC_Os04g59060 heat shock protein DnaJ, putative, expressed
34943898 T G I L GCAGCCTTGAGGACATTGCGGAT ATTTCTGTATGGCACTACAAGTAGGTGCTCCA
GCAGCCTTGAGGACATTGCCGAG ATTTCTGTATGGCACTACAAGTAGGTGCTCCA
LOC_Os06g13040 WD domain, G-beta repeat domain containing protein, expressed
7208678 C A G C CACCTCGTCCTGCACGTCCGA CCAAGTTGATGTACGGCTCAGGGTTCT
CCACCTCGTCCTGCACGTCCTT ATTTTATGCTTAACTAGCTTGATGTGATCATGCAAA
LOC_Os06g15170 3-ketoacyl-CoA synthase, putative, expressed
8598272 T C I V CAGGCTGCAGTTGACGACGAGGAT CTCGAGCACGCGAGGCAGGT CAGGCTGCAGTTGACGACGAGTCC CGGCCACCGTGTACCTCGTGAT
LOC_Os06g22020 cytochrome P450, putative 12751175 A G M V TGCCCCACATCTCCCTCCGAG CGCCGCCTCAGTGATCCTGG CTTGCCCCACATCTCCCTCCGTA CGCCGCCTCAGTGATCCTGG
LOC_Os06g22460 disease resistance protein RPM1, putative, expressed
13056419 T C S G CATGGTGGTCAGTGTGTGGGGAATTA
CATCTTCAAATGCATCTTTGCTATCGAACC
TGGTGGTCAGTGTGTGGGGAATTG CATCTTCAAATGCATCTTTGCTATCGAACC
LOC_Os06g23530 pre-mRNA-splicing factor ATP-dependent RNA helicase, putative, expressed
13725000 A C D E AGTGGCGTGATATCAGGAACGACGAT
ACTTGATTGTCACGAACAGCTTCGATAAGC
AGTGGCGTGATATCAGGAACGAGGTG
GTGTAACCTGGGTTGTTTTCCCTGAACC
LOC_Os06g28124 glycosyltransferase, putative, expressed
15968674 T C K R CATCGTCGACTTCAACCAGGACAGCTA
ACCACCCGGGAGAACTCCTCGA TCGTCGACTTCAACCAGGACAGAGG
ACCACCCGGGAGAACTCCTCGA
LOC_Os06g28670 polygalacturonase, putative, expressed
16329889 G T V F CACGGTCACGTCCGACACCAC ACCATACAGAACAGCGCCAGGTTCC
GCACGGTCACGTCCGACACAAA AGAGCACGAACGTGGCGGTGA
LOC_Os06g29700 OsFBD11 - F-box and FBD domain containing protein, expressed
17044919 A G H R CGTCTTCAGCTGATCGTCCGCA GGCTTTCGCATGACAAATAACACAGCTAAATA
CGTCTTCAGCTGATCGTCCGCG GGCTTTCGCATGACAAATAACACAGCTAAATA
LOC_Os06g29844 MATE efflux family protein, putative, expressed
17195755 T G S A GCCCAGGAGATGATACTGCCGGTC CTCACATATTTTCTCTGTCCAAGACTCTTCCTGTT
GCCCAGGAGATGATACTGCCGTGA CAAGCAAATCCGTGTCGCAATTTTG
LOC_Os06g31070 PROLM24 - Prolamin precursor, expressed
18071409 T A K N CAAGAACCGCAATGACCAGTAGCACCT
GGGAGCAGTCACGCAGGCTACAAC CAAGAACCGCAATGACCAGTAGCAAGA
AACCCGTGCAATGAGTTCGTGAGG
LOC_Os06g32350 THION12 - Plant thionin family protein precursor
18827854 A C N K GGACACAACGGTGACAGTCTGAGCTACA
CAATATTTCTGGCTCAATCATTCTTGCCTG
CACAACGGTGACAGTCTGAGCTGCC
CAATATTTCTGGCTCAATCATTCTTGCCTG
LOC_Os06g35850 lectin protein kinase family protein, putative, expressed
20916895 G C R T GCAAAGCAGTGTCATGACTAGATTAAGAGGGAG
TCCAGGATTTTGACCACCATGGACAT
GCAAAGCAGTGTCATGACTAGATTAAGAGGCTC
TCCAGGATTTTGACCACCATGGACAT
LOC_Os06g37500 cytokinin dehydrogenase precursor, putative
22193618 C T V I GATCACCGAGAGCCGACATGTGAAC TGGCGTCCTCACTAGTTACGATGTTTCTTC
GATCACCGAGAGCCGACATGTCATT
TCGTCACTAGCTTCCTCTCTACTGTCCCCTA
LOC_Os06g44820 PPR repeat domain containing protein, putative
27075561 G A E K ATCAAAGATGCTCAGAGGATCCTACCCG
CAGACACTTAAGCTTTGGCGTAGTAGCTTATCTACC
GATCAAAGATGCTCAGAGGATCCTACCCA
CAGACACTTAAGCTTTGGCGTAGTAGCTTATCTACC
LOC_Os08g19694 NB-ARC domain containing protein, expressed
11786501 A C D E AACAGGATACTGTCCCTGAGCTTCGGT
ATGGGAAGTAGTCACCATCATGCAGCTC
CAGGATACTGTCCCTGAGCTTCGCG
ATGGGAAGTAGTCACCATCATGCAGCTC
LOC_Os08g30910 YDG/SRA domain containing protein, expressed
19085103 T C I T TGGCGGGCAAGGACAACCTTCT AGGTCAACTCTTCGAATCTTCAATGAACCC
TGGCGGGCAAGGACAACCTTTC GCTCAACTCTGTACATAAATTCGTCACCAACTTC
LOC_Os08g35310 O-methyltransferase, putative
22277158 C A G C CAGAGCTCTGGTGCCACACTTTCG CCAATACCATCAACAAGGAGGCGAGATAC
GCAGAGCTCTGGTGCCACACTTTCT
GGTTGATTGGCATGTGTGCTCAGTGT
LOC_Os08g36320 decarboxylase, putative, expressed
22876630 T C D G CCTTGGTGGCGTTCTCGCTCAAGTA CAGTACGCGAAGATCTCCCTCTCGG
CTTGGTGGCGTTCTCGCTCAAGAG CAGTACGCGAAGATCTCCCTCTCGG
LOC_Os08g42930 disease resistance protein RGA1, putative, expressed
27130720 A G H R AAGTTTGGCCTGATGGAGCGCA CAAGTCGCCTTCGCAACAACTCAATT
AAGTTTGGCCTGATGGAGCCCG CAAGTCGCCTTCGCAACAACTCAATT
LOC_Os09g16540 protein kinase, putative, expressed
10153331 A G R G CTGACAAAGACCGACATCAGCGAGA GACATGGTTGCCATCCTTCTCCCA GCTGACAAAGACCGACATCAGCGAAG
GACATGGTTGCCATCCTTCTCCCA
LOC_Os09g17600 membrane protein, putative, expressed
10766714 G A R K GAGTTGGCATCTCAAACATGATTCATCG
CAATGTGAATATGTGATACATGCTGTACTGGCTT
GGAGTTGGCATCTCAAACATGATTCAAAA
CAATGTGAATATGTGATACATGCTGTACTGGCTT
LOC_Os09g17630 receptor-like protein kinase 2, putative, expressed
10792494 T C I T TTGAGCCTGCTTGAGGGGCAGAT TCACTATCCTAAAGATTTAAGCAGAGTGTCCATCTT
TTGAGCCTGCTTGAGGGGCAAAC TCACTATCCTAAAGATTTAAGCAGAGTGTCCATCTT
LOC_Os09g25620 CPuORF8 - conserved peptide uORFcontaining transcript, expressed
15385777 A G L S CATCACCGCATCGCAGCTTCAT ACGGCGGGACCATAAATGCCAT CATCACCGCATCGCAGCTTGTC ACGGCGGGACCATAAATGCCAT
LOC_Os09g25890 trehalose-6-phosphate synthase, putative, expressed
15532799 T A F I CATGTCGACGCCGACGGAGAGTAA CGCGTCGGGTTTTTCCTCCACT CATGTCGACGCCGACGGAGAGTAT GCGCGTCGTCGAGGTGCTCT
LOC_Os09g26300 hypro1, putative, expressed 15891490 A G V A GGTGGACGCGCAGCTGGTTGT ACACGACGTAGCCCATCCCGTG GTGGACGCGCAGCTGGTGAC CGTGCGTGTCGTTGTACCGCA
LOC_Os09g27570 OsFBA3 - F-box and FBA domain containing protein, expressed
16748987 A G F S CACAGCAACAAATACAAGGTGGCTAGATGTTT
GCTAGCGTCTCACTGAAAAAGCAAGCAC
CACAGCAACAAATACAAGGTGGCTAGATGTTC
GCTAGCGTCTCACTGAAAAAGCAAGCAC
APPENDIX B. continued

106
Gene
Function
SNP Position
Ref. Allele
Var. Allele
Ref. AA
Var. AA
Primer Ref Forward (Susceptible Allele)
Primer Ref Reverse (Susceptible Allele)
Primer Alt Forward (Resistant Allele)
Primer Alt Reverse (Resistant Allele)
LOC_Os09g32860 OsFBX336 - F-box domain containing protein, expressed
19591594 C T L F GGTTGATACACCAATATTGCCTAGCAAAGTCC
TAGAAACCGGTGATCTCCACACTCCG
ATGGTTGATACACCAATATTGCCTAGCAAAGTCT
TAGAAACCGGTGATCTCCACACTCCG
LOC_Os09g33710 Os9bglu33 - beta-glucosidase homologue, expressed
19913544 T G N H CCCAGCATTTGGGACACCTTCTTCA TCATATCTGAACTTATCACTGACCTTGTAATGGTGA
CCAGCATTTGGGACACCTTCAACC CCATGTCATACATAAGCTTTACATCCTCCTGAAA
LOC_Os09g36900 WD domain, G-beta repeat domain containing protein, expressed
21279866 C T P L GGCACGAGTCATCATCATTGTCACG GCCCAACTGAAACTAAAGCCTGCATTCT
GGGCACGAGTCATCATCATTGTCAAA
CCCACTGACATGATAGATTGATAGATTCCTGC
LOC_Os09g37590 OsFBDUF47 - F-box and DUF domain containing protein, expressed
21666818 T C M T AGTGACTTCCACGACGCCTCGC CTCTGTGAACTGGATATTAACTTCCAAAAGCTCC
GACGTAAGTGACTTCCACGACGCCTACT
CTCTGTGAACTGGATATTAACTTCCAAAAGCTCC
LOC_Os09g37880 serine/threonine-protein kinase receptor precursor, putative, expressed
21841580 G C V L GAACACCAGCGCCATTGTCTTCC TGCACGGCCAAGAAGCCGTC CGTCGGTGTCGATGATCGCGTC ATGAACACCGGCAACCTCGTCG
LOC_Os09g38700 STRUBBELIG-RECEPTOR FAMILY 5 precursor, putative, expressed
22245913 C T * * AATGCTCCAGTGACTTCATGTTGACCG
TGATAGCTGTGCTTCTTGCAGCTCTGATT
GAATGCTCCAGTGACTTCATGTTGGCTA
TGATAGCTGTGCTTCTTGCAGCTCTGATT
LOC_Os09g38710 HEAT repeat family protein, putative, expressed
22252462 G A * * GCAGCGCCACCATCCCCATATC ATGGTTGGTCCCTTCTTGTCTTGCG GCAGCGCCACCATCCCCATAAT TCAACAAGATTGCAGACAGGGACACCTAC
LOC_Os09g38850 OsWAK91 - OsWAK receptor-like protein kinase, expressed
22317968 T C * Q GAACACTTTCGAGTGTCATCTCCACCAA
CATTCCAGCTGAACAAACTGGGATAACAAC
ACACTTTCGAGTGTCATCTCCACCCG
CATTCCAGCTGAACAAACTGGGATAACAAC
LOC_Os09g38970 zinc finger family protein, putative, expressed
22381404 T A S R ACGCTGGAAGGCATTAGGAGGATGA ACATCTTATGTTCGGGAGAACCGGAGAG
CACGCTGGAAGGCATTAGGAGGAACT
ACATCTTATGTTCGGGAGAACCGGAGAG
LOC_Os09g39620 protein kinase family protein, putative, expressed
22736162 G A A T CCCTTGTCTCCTCAGCCGGTAGTACTTG
ATGGAAATACAACCGTTGTTGCCTGCT
CCCTTGTCTCCTCAGCCGGTAGTACATA
ATGGAAATACAACCGTTGTTGCCTGCT
LOC_Os11g19700 cycloeucalenol cycloisomerase, putative, expressed
11342380 C A N K CTTGCATGGTTCCAGGTGCAGATC AGTATCTGTCCGGCTGTCGGCTCA TGCATGGTTCCAGGTGCAGCAA CTCCCTAAAACAGGGCGCAACGA
LOC_Os11g24060 permease domain containing protein, putative, expressed
13199356 T C V A CCGGCGTTCGTCACCATCGT GCCCTGTCCAAATTCATCAGGGATCT
CCGGCGTTCGTCACCATGTC GCCCTGTCCAAATTCATCAGGGATCT
LOC_Os11g24180 OsSCP50 - Putative Serine Carboxypeptidase homologue, expressed
13321629 A T V E CTGGTTCGAGGTGGACGTGGACA CAGCAAGCTCGAAACTAATCCGGTGAT
TCTGGTTCGAGGTGGACGTGGTTT ACGCAGGGTCCAGACTCCACCA
LOC_Os11g24770 ankyrin repeat domain containing protein
13648166 T A S C CGCTGCGTGGAAAGGGCAGA CGCACTGACCCGCTCATCACTG ATCGCTGCGTGGAAAGGGCTCT CGCACTGACCCGCTCATCACTG
LOC_Os11g28950 pollen signalling protein with adenylyl cyclase activity, putative, expressed
16287232 T C E G GAAGGCACCTCAGTTTGCAACGGT TGGCTTGTTGCACCCAACTACCTGATAT
GGAAGGCACCTCAGTTTGCAACGAC
TTTGGGTGTTCACTGCCAAATTGGA
LOC_Os12g03554 zinc finger C-x8-C-x5-C-x3-H type family protein
1411478 C T R W AGGGGTGTCCTTGATTGCATGCC CCACCATGCGTTGAAGAAGTGGGT TCATTAGGGGTGTCCTTGATTGCATTGT
CCACCATGCGTTGAAGAAGTGGGT
LOC_Os12g04660 zinc finger, C3HC4 type domain containing protein, expressed
1973059 G C T R ATGCGAGCAGGGCATCCACG TCGCCCAGGTAGTCGGACGCT AATGCGAGCAGGGCATCCACC TCGCCCAGGTAGTCGGACGCT
LOC_Os12g06740 F-box domain containing protein, expressed
3280174 A G I V TCCCCGGCCACGAAAGACGTA CCATGTATCCAATACCTGCGGAAAATCA
CTCCCCGGCCACGAAAGACAAT CCATGTATCCAATACCTGCGGAAAATCA
LOC_Os12g06980 SAP domain containing protein, expressed
3410207 G T Q K CCCATGTACTTCTGAATTCACCCCCTG
TTTCTGACAGGCAAAAATCCAGGAAGC
ACCCATGTACTTCTGAATTCACCCGCTT
AAAACGGAGAAGAACTTCAATGGAAATGTCA
LOC_Os12g07800 S-locus-like receptor protein kinase, putative, expressed
3941715 T C M T CTACACAGAGCAACAAAGGAACGGGAAT
CATATCGCCCACGGCCAAGCT CACAGAGCAACAAAGGAACGGGGAC
CTCGGCCTCACCTTGCTTCACATC
LOC_Os12g07950 transcriptional regulator Sir2 family protein, putative, expressed
4033132 C T R H GCAATTCAACTGGCTTACTCCCAGCTC
TGCTCTCCTCATTTGTCCAAATCAGCTTAC
GCAATTCAACTGGCTTACTCCCAGGAT
TGCTCTCCTCATTTGTCCAAATCAGCTTAC
LOC_Os12g09000 phosphomethylpyrimidine kinase/thiaminphosphate pyrophosphorylase, putative
4709578 T C L S GCAGATGGTGTCCATGTTGGTCAGTT ATGCCGCCAATAGCGACCACAG GCAGATGGTGTCCATGTTGGTCAAAC
TTTCTTGTTTCGGCTACGACACTCGG
LOC_Os12g09710 NBS-LRR disease resistance protein, putative
5128266 T A I N GACTTCTCCCACAAGCCTAGTGAAGCTATGA
GCGCAAGAGCAAAGATGTGGCTG TCCCACAAGCCTAGTGAAGCTGGGT
GCGCAAGAGCAAAGATGTGGCTG
LOC_Os12g10180 NBS-LRR type disease resistance protein Rps1-k-2, putative, expressed
5378630 T G M L CCTCGAGACCAAGTCATCCAGGGTG CTTCTCCAACACCAGCTCAGAAAGATGC
TCGAGACCAAGTCATCCAGGCCC CTTCTCCAACACCAGCTCAGAAAGATGC
LOC_Os12g10410 NB-ARC domain containing protein, expressed
5508921 G C A G GTTCAATTGGCAGCCTAGACATACTCCATG
GATTGTAAGGGGCCCTGGAGGTGA GAGTTCAATTGGCAGCCTAGACATACTCCTTC
GATTGTAAGGGGCCCTGGAGGTGA
APPENDIX B. continued

107
Gene
Function
SNP Position
Ref. Allele
Var. Allele
Ref. AA
Var. AA
Primer Ref Forward (Susceptible Allele)
Primer Ref Reverse (Susceptible Allele)
Primer Alt Forward (Resistant Allele)
Primer Alt Reverse (Resistant Allele)
LOC_Os12g13100 WW domain containing protein, expressed
7284433 C T R C CTACCCAGCCAACCGTCGTCCTC GCAAGCAAGCAAGCACCAACTGC CTACCCAGCCAACCGTCGTCGAT GCAAGCAAGCAAGCACCAACTGC
LOC_Os12g15460 pentatricopeptide, putative, expressed
8826281 A G * * GTTCCAGCATTCCATCAAACGCCT GCCTGTGGAAAGGCCTGCGAC TGTTCCAGCATTCCATCAAACAGCC
GCCTGTGGAAAGGCCTGCGAC

108
APPENDIX C. EIGENVALUES AND PROPORTIION OF TOTAL VARIABILITY AMONG S. MOLESTA AS EXPLAINED BY FIRST THREE PRINCIPAL COMPONENTS USING THE MORPHOLOGICAL DATA.
APPENDIX D. CORRELATION BETWEEN THE MORPHOLOGICAL DATA AND THE FIRST THREE PRINCIPAL COMPONENTS. Morphological Traits PC1 PC2 PC3 Colony width (mm) 0.46 0.12 0.73*
Number of ramets per colony 0.28 0.86* 0.22
Rhizome length per colony 0.49* 0.03 0.40
Leaf width per colony (mm) 0.42 -0.39 0.45*
Root length per colony (mm) 0.53* -0.28 -0.21
*Values with the most significant trait that contributes to the variation in each PC
.
APPENDIX E. CORRELATION BETWEEN DISSIMILARITY MATRICES OBTAINED WITH DIFFERENT MARKER TYPES (MANTEL TEST). Morphology AFLP gapCp
Morphology 0.02 0.09
AFLP 0.09
p=0.001 APPENDIX F. SUMMARY OF PEARSON’S LINEAR CORRELATION OF AFLP MARKER AND GAPCP GENE TO MORPHOLOGICAL TRAITS. Morphological Traits AFLP GapCp Colony width (mm) 0.01 0.30
Number of ramets per colony 0.04 0.15
Rhizome length per colony 0.01 0.19
Leaf width per colony (mm) 0.06 0.33
Root length per colony (mm) 0.12 0.06
p < 0.01
Axis Eigenvalue Percent of variation Cumulative
1 2.65 0.53 0.53
2 0.96 0.19 0.72
3 0.66 0.13 0.85

109
APPENDIX G. EIGENVECTORS, EIGENVALUES, INDIVIDUAL AND CUMULATIVE PERCENTAGE OF VARIATION EXPLAINED BY THE FIRST FIVE PRINCIPAL COMPONENTS (PC) AFTER ASSESSING MORPHOLOGICAL TRAITS OF S. MOLESTA FROM LOUISIANA AND TEXAS.
*Values correspond to the most significant variation that contributes in each PC.
Morphological Traits AFLP marker gapCp gene
PC1 PC2 PC3 PC4 PC5 PC1 PC2 PC3 PC4 PC5 Colony width (mm) 0.16 0.37 0.40* 0.02 -0.21 0.02 0.11* -0.01 0.02 -0.03 Number of ramets per colony 0.27 0.36 0.41* 0.14 -0.06 0.02 0.04 0.00 -0.07* -0.05 Rhizome length per colony 0.24* 0.18 0.04 0.13 -0.08 0.00 0.05* 0.04 0.00 0.00 Leaf width per colony (mm) 0.25* 0.18 -0.07 0.07 0.17 0.08* -0.04 0.00 -0.01 -0.01 Root length per colony (mm) 0.32* 0.07 -0.06 -0.15 0.26 0.08* -0.04 0.00 -0.01 0.00 Eigenvalue 13.94 3.18 2.46 1.88 1.61 148.16 50.24 9.58 6.91 2.33 Individual percent 30.31 6.91 5.35 4.09 3.50 60.72 20.59 3.93 2.83 0.95 Accumulated variation (%) 30.31 37.22 42.57 46.66 50.15 60.72 81.31 85.24 88.07 89.03

110
APPENDIX H. PERMISSION LETTER
Dear Dr. Galam Thank you for your email. Please use the below link and choose the appropriate dropdowns to secure permission: https://s100.copyright.com/AppDispatchServlet?publisherName=ELS&contentID=S0304377015300103&orderBeanReset=true Govind Mohan Journal Manager Global Journals Production Tel: +9144 4299 4666 ELSEVIER Ascendas International Tech Park (Crest, 12th Floor), Taramani road, Taramani, Chennai 600 113 Find out some simple ways to share your research data, including features that are directly available when you submit your research article to an Elsevier journal. For assistance, please visit our Customer Support site where you can search for solutions on a range of topics and find answers to frequently asked questions.
From:Elsevier Author FormsDate:28/11/2018 04.46 AM
From:Galam,Dominique<[email protected]>Sent:Tuesday,November27,201811:05PM

111
To:Article_Status(ELS)<[email protected]>Subject:Re:PermissionRequest
*** External email: use caution ***
Sir/Madam,
Iwouldliketorequestyoutokindlygrantthepermissiontousethebelowcitedpublicationaspartofdissertationwork.
Articletitle:MorphologicalandGeneticSurveyofGiantSalviniaPopulationsinLouisianaandTexas
Reference::AQBOT2805
Journaltitle:AquaticBotany
Correspondingauthor:Dr.JamesH.Oard
Firstauthor:Dr.DominiqueGalam
Acceptedmanuscript(uneditedversion)availableonline:29-JUL-2015DOIinformation:10.1016/j.aquabot.2015.07.005
Regards,
DominiqueClarkA.Galam
GraduateStudent
RiceGeneticsLab
SchoolofPlant,EnvironmentalandSoilSciences
104MadisonB.SturgisHall
LouisianaStateUniversity
BatonRouge,LA70803
Thiscommunicationisconfidentialandmaybeprivileged.Anyunauthorizeduseordisseminationofthismessageinwholeorinpartisstrictlyprohibitedandmaybeunlawful.Ifyoureceivethismessagebymistake,pleasenotifythesenderbyreturnemailanddeletethismessagefromyoursystem.ElsevierB.V.(includingitsgroupcompanies)shallnotbeliableforanyimproperorincompletetransmissionoftheinformationcontainedinthiscommunicationordelayinitsreceipt.Anypricequotescontainedinthiscommunicationaremerelyindicativeandmaynotberelieduponbytheindividualorentityreceivingit.Anyproposedtransactionsorquotescontainedinthiscommunicationwillnotresultinanylegallybindingorenforceableobligationorgiverisetoanyobligationforreimbursementofanyfees,expenses,costsordamages,unlessanexpressagreementtothateffecthasbeenagreedupon,deliveredandexecutedbytheparties.©2018,ElsevierBV.Allrightsreserved.
[---001:002305:35465---]

112
VITA
Dominique Clark Anolin Galam was born and grew up in Dibuluan, Jones, Isabela, Philippines.
The eldest of the four children of Rolando and Clarita Galam. Graduated with the degree of
Bachelor of Science in Biology at Central Luzon State University, Science City of Munoz,
Nueva Ecija.
In 1999, he started his first job as a Research Assistant at the Philippine Rice Research Institute
where he worked there for 5 years. While working as a research assistant, he was accepted for
Panasonic Scholarships Japan for graduate studies. In the summer of 2006, he started his
Masteral studies where he obtained his Master in Agro-Bioscience in March 2009 at Iwate
University, Iwate, Japan.
He then went back to the Philippine Rice Research Institute and worked as Senior Science
Researcher at the Plant Breeding and Biotechnology Division and worked there for a few
months. At the same year, he was offered by Dr. James Oard of Louisiana State University
Agricultural Center to work in his project -rice breeding and germplasm development.
He was then accepted in the Doctoral program at Louisiana State University in 2012 and was
awarded an assistantship through the School of Plant, Environmental and Soil Sciences under the
supervision of Dr. James H. Oard. After 7 years, he is graduating in the spring of 2019