Embed Size (px)
Citation preview

DEVELOPMENT OF PURE ELECTRIC VEHICLE (EV) USING LEAD
ACID BATTERY/ LI-ION BATTERY
LEOW ENG CHAI
A project report submitted in partial fulfilment of the
requirements for the award of the degree of
Bachelor (Hons.) of Electrical and Electronic Engineering
Faculty of Engineering and Science
UniversitiTunku Abdul Rahman
September 2011

ii
DECLARATION
I hereby declare that this project report is based on my original work except for
citations and quotations which have been duly acknowledged. I also declare that it
has not been previously and concurrently submitted for any other degree or award at
UTAR or other institutions.
Signature : _________________________
Name : LEOW ENG CHAI
ID No. : 08UEB00652
Date : 29th
August 2011

iii
APPROVAL FOR SUBMISSION
I certify that this project report entitled “DEVELOPMENT OF PURE ELECTRIC
VEHICLE (EV) USING LEAD ACID BATTERY/ LI-ION BATTERY”
prepared by LEOW ENG CHAI has met the required standard for submission in
partial fulfilment of the requirements for the award of Bachelor of Electronic and
Communications Engineering (Hons.) at Universiti Tunku Abdul Rahman.
Approved by,
Signature : ______________________
Supervisor : Dr. Chew Kuew Wai
Date : _ ___

iv
The copyright of this report belongs to the author under the terms of the
copyright Act 1987 as qualified by Intellectual Property Policy of University Tunku
Abdul Rahman. Due acknowledgement shall always be made of the use of any
material contained in, or derived from, this report.
© 2011, Leow Eng Chai. All right reserved.

v
Specially dedicated to
my beloved parents and friends.

vi
ACKNOWLEDGEMENTS
First, I am grateful and appreciating for those who had assisted and guided me in
completing this project, especially my project supervisor, Dr. Chew Kuew Wai.
From him, I learnt to research in the project title and transforming knowledge of
electric vehicle technology into more detailed experiments and physical hardware. I
am grateful for the close guidance and knowledge gained from him.
I am grateful for my course mates for providing me everything, such as
encouragement, so that I am able to carried out the research and project smoothly and
easily. Also, thanks to master students whose were taking master program under the
same research supervisor, Dr. Chew Kuew Wai. They are very helpful and sharing
their knowledge with me. Their help in various stages is gratefully acknowledged.
Last but not the least; I am thankful for UTAR management for preparing the
suitable environment and all the equipment and lab for carrying out the research.
Equipment, devices and materials have been prepared well.
vii
DEVELOPMENT OF PURE ELECTRIC VEHICLE (EV) USING LEAD
ACID BATTERY/ LI-ION BATTERY
ABSTRACT
The weakness of GPS navigation system coordinating with electric vehicle (EV)
battery management system to estimate battery capacity always leads to inaccurate
estimated range. A new system known as Contour Positioning System (CPS) had
been introduced to improve the existing EV technology; it considers the contour
condition along a selected route line. Total forces acting on a car during uphill
condition are calculated and further related to current calculation to estimate battery
capacity. An inclined plane experiment had been carried out to support the
calculation method. Motor speed monitoring system had been done with a sensorless
configuration, with a 16-bits microcontroller used as core controller. PIC24 with 10-
bits ADC feature is used to convert analogue voltage to digital signal for further
display on LCD display and transmitted to computer through serial ports. RS-232
communication protocol is used for serial communication between microcontroller
and computer serial ports. Graphical User Interface of an EV intelligent monitoring
system with data logging feature has been designed using Adobe Flash and the data
reading from a text file is done using LoadVars method.

viii
TABLE OF CONTENTS
DECLARATION ii
APPROVAL FOR SUBMISSION iii
ACKNOWLEDGEMENTS vi
ABSTRACT vii
TABLE OF CONTENTS viii
LIST OF TABLES xi
LIST OF FIGURES xii
LIST OF SYMBOLS / ABBREVIATIONS xv
LIST OF APPENDICES xvii
CHAPTER
1 INTRODUCTION 1
1.1 Background 1
1.2 Advantages of Electric Vehicle 3
1.3 Disadvantages of Electric Vehicle 5
1.4 Aims and Objectives 5
1.5 Scope of Project 6
2 LITERATURE REVIEW 8
2.1 About Electric Motor 8
2.2 Brushless DC Motor 12
2.3 GPS modules on Electric Vehicles 14
2.4 Great Circle Distance 16
2.5 Google Earth for Elevation level 16

ix
2.6 Battery Management System (BMS) 18
3 CONTOUR POSITIONING SYSTEM (CPS) 19
3.1 Background 19
3.2 Introduction to CPS 20
3.3 Research Methodology 21
3.3.1 Data Collection and Calculations 21
3.3.2 Inclined Plane Experiment 26
3.4 Results and Discussion 29
3.5 Suggestions for Improvements 32
4 MOTOR SPEED MONITORING 34
4.1 Introduction 34
4.2 Research Methodology 35
4.2.1 Microcontroller with multiple I/O options 35
4.2.2 ADC Conversion and LCD display 38
4.3 Results and Discussion 40
4.3.1 Problems encountered 40
4.4 Suggestions for Improvements 41
5 DATA LOGGING AND GRAPHICAL USER INTERFACE 42
5.1 Introduction 42
5.2 Research Methodology 42
5.2.1 Data Logging 43
5.2.2 Recommended Standard 232 (RS-232) 43
5.2.3 LoadVars Method in Adobe Flash 46
5.2.4 Graphical User Interface Design 49
5.3 Results and Discussion 50
5.4 Suggestions for Improvements 53
6 COMPETITIONS AND ACHIEVEMENTS 55
6.1 1MALAYSIA Solar Competition 55
6.2 JamesDyson Award 56

x
6.3 Manuscript Submission 57
6.4 MSC Malaysia APICTA Awards 2011 57
7 CONCLUSION AND RECOMMENDATIONS 58
7.1 Conclusion 58
7.2 Recommendation 58
REFERENCES 60
APPENDICES 62

xi
LIST OF TABLES
TABLE TITLE PAGE
1 Comparisons between brushed DC motors and
brushless motor 12
2 Experimental value 29
3 Calculated results based on CPS calculation
method 31

xii
LIST OF FIGURES
FIGURE TITLE PAGE
1.1 Nissan‟s LEAF 2
1.2 Tesla Roaster 2
1.3 Chevrolet‟s VOLT 3
2.1 Schematic of internal systems of an EV 9
2.2 Difference between geared motors (transmission
involved) and gearless motors (direct coupled) 10
2.3 A regenerative-braking system configuration 11
2.4 GPS satellites constellation 14
2.5 On-board navigation system in an electric vehicle 15
2.6 Sample interface of Google Earth 17
2.7 Intel desktop board used in EV BMS 18
3.1 The overall view of route line along Genting
Highland as shown on the reference website
[www.flashearth.com] 22
3.2 Red circle sticker on laptop screen used to ensure
constant distance between two points on the map 22
3.3 Sets of latitude and longitude collected 23
3.4 Javascript based coordinate distance calculator 23
3.5 Inclined plane built for experimental use 27
3.6 Inclined plane experiment with a RC car running
on 20° slope angle 27

xiii
3.7 Current versus Slope Angle graph based on
experimental results 30
4.1 PIC24FJ64GA002 35
4.2 Schematic between microcontroller and DC motor 36
4.3 Self-built PICKit2 programmer 37
4.4 MPLAB IDE user interface 37
4.5 PICkit2 v2.61 programmer interface 38
4.6 JHD162A LCD display 39
4.7 LCD display showing updated back-EMF voltage
reading and calculated rounds-per-minute (RPM) 40
5.1 MAX232 schematic diagram 44
5.2 MAX232 circuit with RS-232 cable 44
5.3 Motor speed monitoring through HyperTerminal 45
5.4 Motor speed monitoring through SerialTerm 45
5.5 Motor speed monitoring through PuTTY 46
5.6 Initial design of speed monitoring SWF file 48
5.7 Error message during serial-communication failure 48
5.8 Main page of EV control system GUI 49
5.9 Main page of CPS interface 50
5.10 Point of interest selection page 50
5.11 Calculation results displaying page 51
5.12 Battery status checking page 51
5.13 Navigation page with CPS results updated 52
5.14 Motor monitoring page 52
5.15 Phone calling and media playing feature on
computer 54

xiv
6.1 1Malaysia Solar Competition (Solar Car)
certificate 55
6.2 JamesDyson Award project listing 56
7.1 Current versus Angle graph plotting 62

xv
LIST OF SYMBOLS / ABBREVIATIONS
EV Electric Vehicle
ICE Internal Combustion Engine
PM Permanent Magnet
GPS Global Positioning System
BMS Battery Management System
CPS Contour Positioning System
SOC State of Charge
F|| Hill climbing force
Frr Rolling resistance force
FD Aerodynamic drag
Cd Drag coefficient
A Frontal area
v Travelling velocity
ρ Air density
T Temperature
p Pressure
h Altitude above sea level
L Temperature lapse rate
p0 Sea level standard atmospheric pressure
M Molar mass of dry air
R Universal gas constant
g Gravity constant
τ Torque
G Gear ratio
Rwheel Wheel size
kt Torque constant
I Current

xvi
RC Radio-controlled
Vsupply Supply Voltage
RPMno-load(max) Motor‟s maximum no-load RPM
Rm Terminal resistance
Ino-load No-load current
kb Voltage constant
EMF Electromotive force
MCU Microcontroller
ADC Analog-to-Digital Converter
RPM Rounds-per-minute
GUI Graphical user interface
EEPROM Electrically Erasable Programmable Read-Only Memory

xvii
LIST OF APPENDICES
APPENDIX TITLE PAGE
A Graph 62
B Computer Programme Listing 63

CHAPTER 1
1 INTRODUCTION
1.1 Background
An electric vehicle (EV) is a car powered by an electric motor rather than a gasoline
engine. From the definition, an electric car is converted from a gasoline-powered
vehicle. The major difference between both vehicles is the way a car is powered; an
electric vehicle is powered by electric motor and the conventional one is powered by
gasoline engine. Another important component for an electric car is the rechargeable
battery. There is a controller between the electric motor and the battery.
The early development of electric motive power was started since 1828 by Ányos
Jedlik, the invention of a small scale model car powered by an electric motor. It was
then followed by the invention of the first crude electric carriage powered by non-
rechargeable primary cells by Robert Anderson from Scotland.
There was a significant weakness of electric motor powered vehicles at the early
development stage, which is the lack of power. For example, the electric locomotive
built by Robert Davidson in 1838 could only achieve a speed of 6km/hour. Electric
vehicles were dominating the early automobiles field until the replacement by more
powerful ICE (Internal Combustion Engine). Gasoline-powered vehicles were taking
over the main role of transportation, globally.
It is the trend of modern world automobile industry where they are trying to bring
back an old technology, make it new by further development, and that‟s the

introduction of an electric vehicle. The commercially available pure electric cars in
the market nowadays include the Nissan‟s LEAF, the Chevrolet‟s VOLT, and the
Tesla Roaster.
Figure 1.1: Nissan‟s LEAF
Figure 1.2: Tesla Roaster

Figure 1.3: Chevrolet‟s VOLT
1.2 Advantages of Electric Vehicle
Great Performance
The electric car is silent, as compared to a conventional gasoline-powered car which
is using an internal combustion engine (ICE).
Reduce greenhouse gases emission
The most significant difference between an EV and a conventional gasoline-powered
car is that an EV does not produce emissions. Hence it does not contribute to the
greenhouse gases emission which leads to the depletion of ozone layer.
There are many people pointing that the charging of EV battery will also
create emission at the power station; but it actually depends on the power source
generating technology. Other than coal power plant that is utilizing fossil-fuel, there
are some alternative power sources such as hydroelectricity, solar panel and wind
farms.

As comparison, a conventional gasoline-powered car will produce much
higher ratio of greenhouse gases. An EV produces only 5% to 10% of the emissions
of an ICE per mile travelled.
Low cost (On the road)
Since the charging of battery will need the household 240 Volt outlet, the electricity
calculations have been carried out for the comparison with petrol expenses.
A rough calculations to compare a gasoline powered car (Toyota Vios) and
electric vehicle (Nissan Leaf) have been carried out:
a. EV: RM 0.047 per kilometre
b. Gasoline car: RM 0.14 per kilometre
Also, an EV car does not need maintenance fees as needed by a conventional
gasoline-powered car. For instance the frequent oil changes, replacements of filters,
and exhaust system repairs. Some components replacement, though less frequent,
should be taken into considerations as well. For example the water pump, fuel pump,
alternator, etc.
More future jobs opportunities
It can be predicted that there are growing job opportunities in the future. Just imagine
that there will be numbers of recharging stations available nationwide, as frequent as
petrol stations along a city route.
Also, a lot of skilful technician will be needed for the battery replacement
process. Services and maintenance of an EV is definitely different from a
conventional gasoline-powered car, hence more efforts should be carried out by
related industries to produce more work force on this field.

1.3 Disadvantages of Electric Vehicle
Limited mileage
It is due to the current battery technology limitation. Common electric cars are using
lead-acid battery array where it can support a driving range from 70-100km per
single charge. An EV that is using Lithium-ion battery array (great example: Tesla
Roadster) can travel up to 350km per single charge. Of course, the Li batteries are
much more expensive as comparable.
Long Recharging period
It is considered long as compared relatively to the time spent at petrol station. A
petrol refilling process might only take up to 3-4 minutes; while a battery recharging
will take roughly 4-5 hours on a 240 Volts system.
Example: Lead-acid battery packs with 14700Watts capacity (196 Volts DC, 75AH)
will take 4 hours on Malaysia 240 Volts system (240Volt supply with 15A circuit
breaker).
Limited Recharging Stations
Recharging stations should be as many as petrol stations are, if electric vehicles are
taking over the role of conventional gasoline-powered vehicles. Also, the recharging
stations should have developed technology to recharge batteries within a short
moment or else it will end up with a super long queue at recharging stations.
1.4 Aims and Objectives
i. Develop a precise system to accurately calculate battery capacity by
considering different factors acting on electric vehicle along a journey
ii. Study about motor behaviors and develop a motor speed monitoring system

iii. Develop a data logging system and Graphical User Interface of electric
vehicle smart control system
iv. Serve as platform for UTAR continuous development in electric vehicle
1.5 Scope of Project
The scope of this project includes the battery power management, converters and
controller, motor characteristics and selection studies, regenerative braking and real
time monitoring system. This research project can be divided into three main
portions:
Part 1: Gather all required information about the electric car such as:
• Battery type: Lead Acid battery
• Battery voltage: 192V
• Maximum speed: 130km/h
• Maximum Torque: 210Nm
• Range: 300km
• Motor type: DC brushless motor
Part 2: Studies and enhance the currently available battery power management and
distribution system which includes the ultrafast charging and discharging system,
charging methods, comparison for rechargeable batteries based on the use of Lead
Acid battery. The whole system will be monitor through real time operation platform.
The study also includes the controller which includes converters (DC-DC), inverters
(DC-AC), four quadrant high frequency power electronics switching circuit for
maximum power transfer factor from the battery to motor and base drive circuit,
phase converter driver circuits and regenerative braking system. The motor controller
and base driver circuits is to control speed, direction, torque and regenerative braking
system.

Part 3: To assemble and convert a normal IC engine car into an electric car as a
primary platform for further testing on the battery energy usage, real time controller,
feedback system and on road performance profile. These studies will provide a
fundamental platform for further studies on commercially available electric cars in
market.
CHAPTER 2
2 LITERATURE REVIEW
2.1 About Electric Motor
Other than the battery pack, another main feature of an electric vehicle is the electric
motor. The electric motor gives the name of “Electric Vehicle”; while battery pack is
used to power up the electric motor. Electric motors replace the role of internal
combustion engine in conventional gasoline-powered car.
A proper selection of electric motor in an EV is an important issue; these
requirements should be considered:
i) High efficiency over wide speed range
ii) High efficiency for regenerative braking
iii) High instant power and high power density
iv) High torque at low speed; high power at high speed
v) Cooling method
vi) Fast torque response
vii) Downsizing and weight reduction
viii) Reasonable costs
ix) High reliability and robustness over various driving conditions
When an electric motor is required to operate over wide speed range, the
efficiency issue becomes an important issue. A loss caused by inefficiency can
contribute to the calculation failure or calculation inaccuracy. An efficient electric

motor means that it could be smaller due to smaller heat disposal would be needed. A
lighter weight electric motor is definitely a better choice in an electric vehicle.
Downsizing and weight reduction can be achieved by choosing a higher efficiency
electric motor; various electric motor requirements are actually inter-related.
Figure 2.1: Schematic of internal systems of an EV
The difference between cooling methods is always an important factor. A
motor with air-cooling method must be large enough to dispose heat generated due to
losses. A smaller motor can remove same amount of heat losses if liquid cooling
method is used.
As with the case of motor efficiency, the electric motor type chosen is much
less important than other factors when it comes to the specific power and power
density of an electric motor. The one exception to this is the brushed DC motor
because a high proportion of the losses are generated in the rotor.
An electric motor with higher speed leads to a higher power density. The size
of electric motor is strongly depending on the motor torque; the motor power does
not influence the motor size much as compared with the motor torque. An electric
motor with higher torque and lower speed will be larger, for instance those electric
motors used in electric forklift.
For electric vehicles, lighter and smaller motors are desired; hence high speed
electric motors with gearbox are used. Gearbox is used with a high speed motor
whenever a low speed rotation is needed. Gearbox is not necessary used with an
electric motor; hence it is possible to use a high speed motor directly coupled to the
axle.
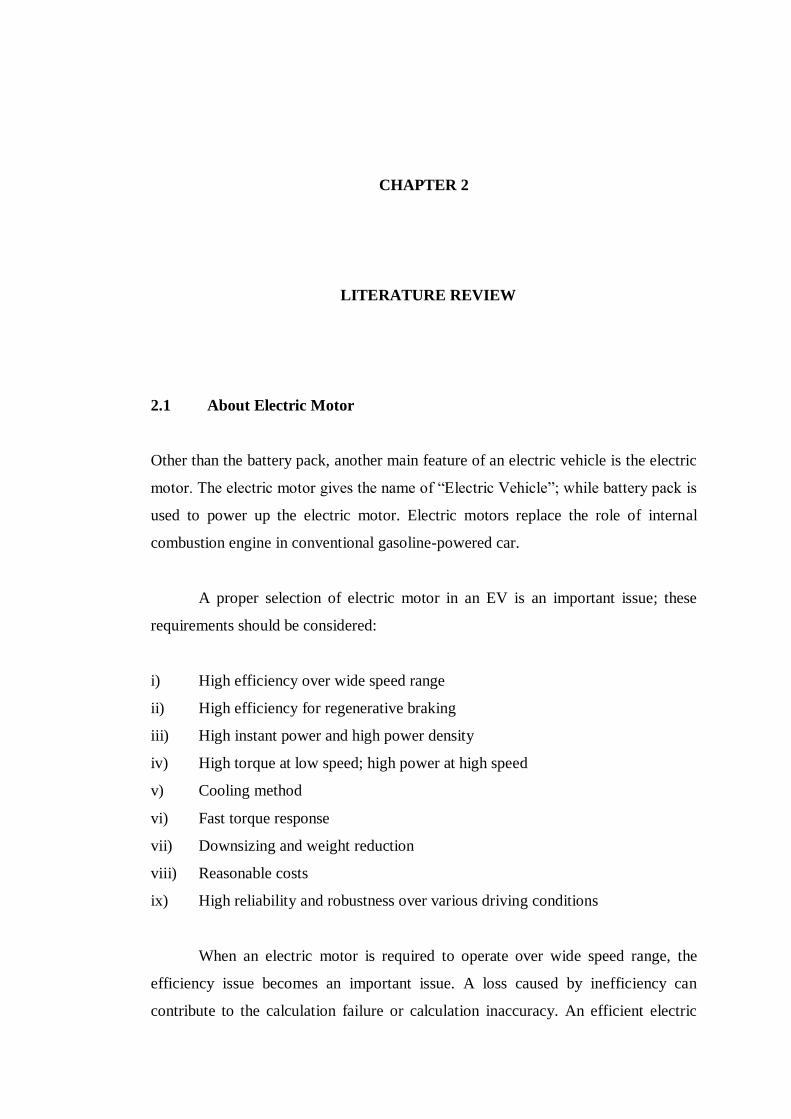
Geared motors and gearless motors are different in their configurations;
where the geared motors need transmission between the motor and the wheel. Yet,
this transmission between motor and wheels means that another consideration should
be taken into account, which is the transmission loss. The reason is due to a
transmission can never be 100% perfect.
Figure 2.2: Difference between geared motors (transmission involved) and gearless
motors (direct coupled)
Selection of electric motors shall consider the system voltage of the particular
electric vehicle because different electric vehicles types will adopt different system
voltage levels. System voltage level is governed by the battery pack used; while a
battery pack weight is nearly 30% of the total curb weight. Hence, choose a higher
power motor means that higher voltage levels are needed.
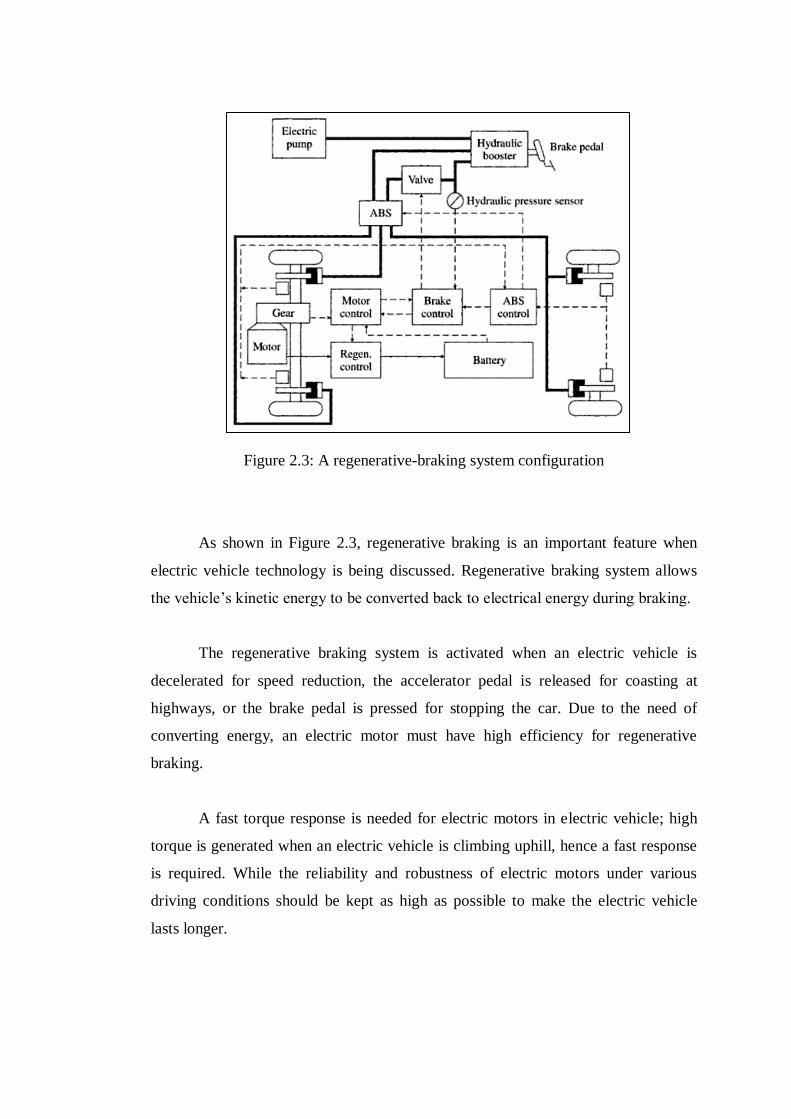
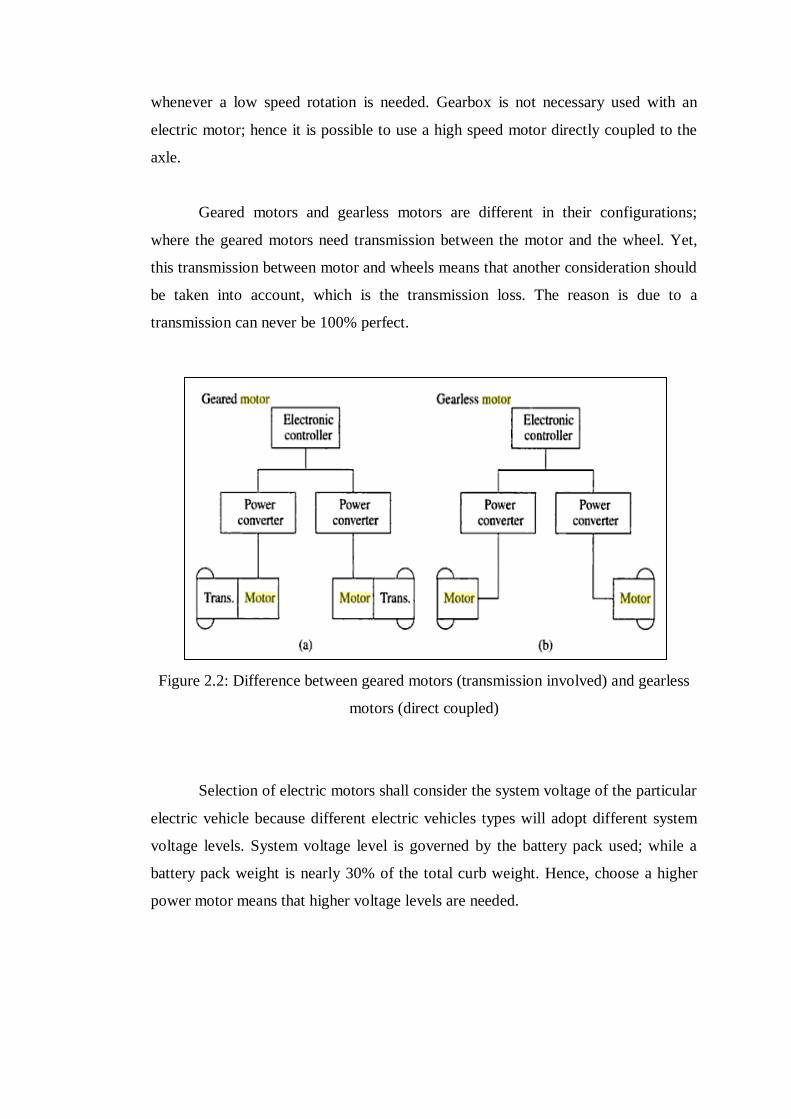
Figure 2.3: A regenerative-braking system configuration
As shown in Figure 2.3, regenerative braking is an important feature when
electric vehicle technology is being discussed. Regenerative braking system allows
the vehicle‟s kinetic energy to be converted back to electrical energy during braking.
The regenerative braking system is activated when an electric vehicle is
decelerated for speed reduction, the accelerator pedal is released for coasting at
highways, or the brake pedal is pressed for stopping the car. Due to the need of
converting energy, an electric motor must have high efficiency for regenerative
braking.
A fast torque response is needed for electric motors in electric vehicle; high
torque is generated when an electric vehicle is climbing uphill, hence a fast response
is required. While the reliability and robustness of electric motors under various
driving conditions should be kept as high as possible to make the electric vehicle
lasts longer.

2.2 Brushless DC Motor
By considering waveform feeding into the motor terminal, permanent magnet (PM)
brushless motor drives can be classified as:
i. PM DC motor drives
ii. PM AC (synchronous) motor drives
They are called brushless motor drives because they have no brushes,
commutator and slip rings. The reasons for not considering brushed DC motors are
shown in the table below:
Table 1: Comparisons between brushed DC motors and brushless motor
Brushed motor Brushless motor
1. Need brush/commutator
assembly
Uses electronic controller (precise,
efficient)
2. The brushes eventually wear
out
No brushes to wear out
3. Sparking and electrical noise
by brushes
No sparking and much less electrical
noise
4. Harder to cool due to the
electromagnet in the centre of
motor
Easy to cool with the electromagnets
on the stator
5. Uses of brushes limit poles of
armature
Can have a lot of electromagnet on
stator for precise control
PM synchronous motor drives are fed by sinusoidal or near sinusoidal ac
waves and uses continuous rotor position feedback signals to control the
commutation. The difference between these two motor drives is that the PM
brushless DC motors are fed by rectangular ac waves and uses discrete rotor position
feedback signals to control the commutation.

As comparison, PM brushless DC motor is preferred in an electric vehicle.
The reason is due to the higher power density than PM synchronous motor drives.
The interaction between rectangular field and rectangular current in the motor can
produce higher torque product; hence PM brushless DC motors have higher power
density.
PM brushless DC motor drive is one of the good choices for electric vehicle
because it is most capable to compete with induction motors for electric propulsion
among modern motor drives. Advantages of PM brushless DC motor drives include:
i) Due to the magnetic field is excited by high-energy permanent magnets, the
overall weight and volume can be reduced for a given output power (high
power density)
ii) Higher efficiency than induction motors due to the absence of rotor copper
losses
iii) Higher efficiency in dissipating heat to surroundings due to the heat mainly
arises in the stator
iv) The rotor acceleration at a given output power can be increased due to the
lower electromechanical time constant of the rotor
A DC motor can run in a range from 96V to 192V. It can consist of 8-16
batteries in series (each 12V). DC installation is simpler and less expensive as
compared to the AC motor.
A significant advantage of DC motor is that it can overdrive up to a factor of
10-to-1 for a short moment. For instance, a 10kW motor can accept 50kWatt for a
short moment and deliver output 5 times higher than its rated horsepower. Hence, it
is good for acceleration. This feature can help to deliver a high output torque
whenever it is needed, for instance during an uphill condition.
Yet, an extra monitoring should be included due to the heating of motor
(caused by overdriving) to avoid the self-destruction of the DC motor.

14
2.3 GPS modules on Electric Vehicles
Since the early 1970s, the Global Positioning System (GPS) was developed by the
U.S. Department of Defence (DoD). GPS is a satellite-based navigation system
developed as a military system initially. Since Bill Clinton announced to release the
restriction on accuracy of Global Positioning System (GPS) on May 2000, the GPS
has become widely used in the positioning system of vehicular technology.
GPS consists of a constellation of 24 operational satellites. To ensure
continuous worldwide coverage, GPS satellites are arranged so that four satellites are
place in each of six orbital planes. With this constellation geometry, four to ten GPS
operational satellites can be visible anywhere globally. Since only four satellites are
needed to provide positioning information, an uninterrupted service can be ensured.
GPS provides continuous positioning and timing information to unlimited
number of users globally, as long as the users are holding GPS receiver modules.
Figure 2.4: GPS satellites constellation

15
Built-in GPS receivers are usually available in an EV; hence computations
can be done to show the vehicle positions in three dimensions and the time.
According to the exact vehicle position, the map-matching technology and the
current traffic information, the navigation system will recommend the shortest and/or
most energy efficient route (minimum traffic jam). Prediction of the residual driving
range for EV is done by on-board computer with information obtained from the GPS.
GPS navigation system on electric vehicle consists of the GPS receiver, GPS
antenna, navigation computer, display screen (touch screen panels are common) and
audio speaker. Once a destination is selected by EV driver, the navigation will start
computation for both range and time estimation to provide visual display and audio
prompts to assist the driver heading to the desired destination.
GPS navigation systems can be implemented on both internal combustion
engine vehicle (ICEV) and electric vehicle; the difference among them is that an
extra feature is available on electric vehicle only. Electric vehicles have battery
management system (BMS) to coordinate with the navigation system to compute
remaining battery capacity after a pre-selected destination. These computations are
done based on some assumptions like travelling in city area and travel under constant
speed conditions.
Figure 2.5: On-board navigation system in an electric vehicle

16
2.4 Great Circle Distance
The great circle distance refers to the shortest distance between two points on a
sphere surface. There is a unique great circle between two points on a sphere that are
not directly opposite to each other. Hence these two points will separate the great
circle into two arcs; the length of the shorter arc is the great circle distance between
these two points.
Calculations to find out the surface distance between two horizontal positions
are performed by assuming spherical Earth; several steps are required by
manipulating the latitudes and longitudes.
A calculation method having good accuracy for both long distance and short
distance is used to determine the great circle distance, known as the Haversine
formula. R refers to the Earth‟s radius (mean radius = 6,371km).
a = sin2 (Δlat/2) + cos(lat1) · cos(lat2) · sin
2(Δlong/2)
c = 2·atan2(√a·√(1-a))
d =R·c
2.5 Google Earth for Elevation level
Google Earth is a virtual globe, map and geographical information program
gathering global information allowing users to see 3 dimensions buildings, imagery
and terrain.
Users are allowed to find cities, places and local businesses by installing
Google Earth on their personal computers. Google Earth maps the Earth by the
superimposition of images gathered from satellite images, aerial photography and
Geographical Information System (GIS) 3D globe.

17
The Google Earth programs has an extra credit as compared to other websites
providing satellite images which is the ability to show sea elevation level for a
selected point on Earth surface.
Figure 2.6: Sample interface of Google Earth
The World Geodetic System (WGS) 84 is highly acceptance as a primary
reference coordinate system because the Global Positioning System (GPS) derives
coordinates from the broadcast ephemeris by referring to World Geodetic System 84.
It is geocentric and globally consistent within ±1 m.
This reference system incorporates more data, better computational
techniques, a better knowledge of Earth, and improved accuracy as compared to the
earlier standards like WGS 66 and WGS 72.

18
2.6 Battery Management System (BMS)
Electric vehicles need BMS, just like they need battery pack and electric motor.
Monitoring the battery pack under various conditions is a crucial task to be done in
real-time. Some batteries can be damaged or destroyed if they are over-charged;
hence BMS is necessary as a basic requirement in electric vehicles.
BMS can be categorized into the following choices:
i) Small embedded system with simple LED display, low cost and no operating
system involved.
ii) Small to medium level computer with real time operating system, lots of
input/output (I/O) options, LCD display and storage capability.
iii) Commercial computers with common features of a personal computer
iv) Commercial BMS with high price
Figure 2.7: Intel desktop board used in EV BMS

19
CHAPTER 3
3 CONTOUR POSITIONING SYSTEM (CPS)
3.1 Background
The heart of an electric car is the battery technology which is causing the invisible
wars among giant car makers. While enjoying the zero-emission technology from
electric cars, the awareness of having sufficient battery capacity for completing a
certain journey is important. Electric cars using different battery technology will
have different drive distance; different battery charging profiles will also lead to
varied charging time needed.
Yet, battery life estimation is an important idea in the electric vehicle
development since it will directly determine the car performance. Just imagine that
an electric car owner is wishing to reach a destination 50km away from his current
location; yet due to his battery life estimation system is not accurate enough and
finally end-up with the car stalled half way. It is a condition where all the electric car
owners do not wish to face.
Range estimator on an EV dashboard will always get high attention and is
one of the main topics people are arguing and complaining about. There are
some stories shared by EV drivers about of how their EVs have let them down by
predicting longer ranges than they were actually able to drive. All these cases have
even lead to a new term among EV drivers, known as “Range Anxiety”. Yet, the
approximation of State of Charge (SOC) is still an approximation. What can be done
20
is to cut down the estimation percentage and increase the accuracy of so-called
“calculation”.
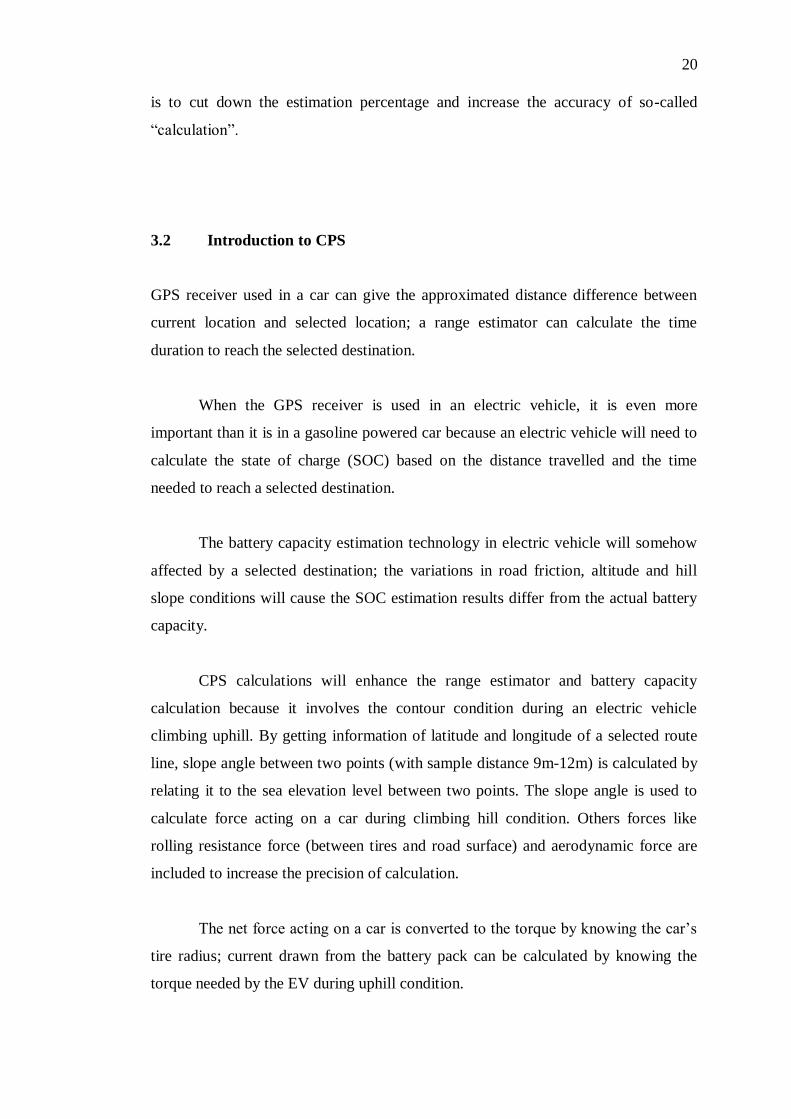
3.2 Introduction to CPS
GPS receiver used in a car can give the approximated distance difference between
current location and selected location; a range estimator can calculate the time
duration to reach the selected destination.
When the GPS receiver is used in an electric vehicle, it is even more
important than it is in a gasoline powered car because an electric vehicle will need to
calculate the state of charge (SOC) based on the distance travelled and the time
needed to reach a selected destination.
The battery capacity estimation technology in electric vehicle will somehow
affected by a selected destination; the variations in road friction, altitude and hill
slope conditions will cause the SOC estimation results differ from the actual battery
capacity.
CPS calculations will enhance the range estimator and battery capacity
calculation because it involves the contour condition during an electric vehicle
climbing uphill. By getting information of latitude and longitude of a selected route
line, slope angle between two points (with sample distance 9m-12m) is calculated by
relating it to the sea elevation level between two points. The slope angle is used to
calculate force acting on a car during climbing hill condition. Others forces like
rolling resistance force (between tires and road surface) and aerodynamic force are
included to increase the precision of calculation.
The net force acting on a car is converted to the torque by knowing the car‟s
tire radius; current drawn from the battery pack can be calculated by knowing the
torque needed by the EV during uphill condition.

21
By performing a series of battery capacity calculation, CPS can give a higher
precision and accuracy of remaining battery life for reaching the desired location. An
onboard touch-screen panel will be embedded on the electric car dashboard with
comfortable graphical user interface showing the car user remaining battery life after
reaching the destination.
The ultimate purpose of introducing this system is to boost up the reliability
of EV range estimation system in the existing EV intelligent control system. A few
more steps/calculations done by the on-board computers can be a new step indicating
a new technology.
3.3 Research Methodology
A series of calculation steps has been performed to calculate the current drawn from
battery pack of an electric vehicle during uphill condition. An inclined plane
experiment has been carried out to collect experimental result. Both results from
calculation method and inclined plane experiment are compared to prove the CPS
calculation method.
3.3.1 Data Collection and Calculations
A route line with significant change of slope angle along the route is needed as the
target of data collection; Genting Highland has been selected as the target destination
for this purpose. A total distance of 6.424km along the route line heading to Genting
Highland has been selected.
The following website [URL: http://www.flashearth.com/] has been referred
to obtain latitudes and longitudes information. This website is able to provide
sufficient data with accuracy up to meter range. Sets of data are collected with

22
sample distance of 9m to 12m between two points selected. There are total of 607
points with total distance of 6.426km for the route line selected.
Figure 3.1: The overall view of route line along Genting Highland as shown on the
reference website [www.flashearth.com]
A transparent sticker with a red circle is used to ensure constant distance
between two points selected along the route line as shown on Figure 3.2.
Figure 3.2: Red circle sticker on laptop screen used to ensure constant distance
between two points on the map

23
Figure 3.3: Sets of latitude and longitude collected
The selected route line which have different angle of uphill slopes is the
uphill route to Genting Highland. Using the sets of data collected as shown in Figure
3.3, Haversine Formula is used to calculate the distance between two coordinates
with Rearth = earth‟s radius (mean radius = 6,371km).
a = sin2 (Δlat/2) + cos(lat1) · cos(lat2) · sin
2(Δlong/2) (1)
c = 2·atan2(√a·√(1-a)) (2)
d =R·c (3)
Figure 3.4: Javascript based coordinate distance calculator

24
For the sake of time-saving, a coordinate-calculator built using JavaScript is
used to obtain the calculated distance. As shown in Figure 3.4, the JavaScript based
coordinate calculator was built based on Haversine Formula. Programming
languages like HTML code and JavaScript are combined to build this coordinate
calculator.
Hence, for a set of latitudes and longitudes selected, the distance calculator
can be used to show the exact distance between them.
The next step is to make use Google Earth which provides a platform to view
the location and the elevation level of that particular coordination. The elevation
difference between two points is calculated and it is repeated for the whole route map
selected.
With a set of distance differences and elevation differences, the angle (θ)
between two coordinates can be calculated by using the following formula:
θ = Tan-1
(Rise / Run) (4)
First, by ignoring the friction force, the hill climbing force (F ||) pulling down
a car along the inclined plane can be figured out.
F|| = mg· sin (θ) (5)
By using gravity constant g= 9.81 m/s2 and assuming the selected car has a
curb weight 1000kg, eq.(5) can be written as:
F|| = 9810·sin (θ) (6)
The next scenario is to look into the rolling resistance force calculation.
Frr = µrr.mg (7)
By assuming good tires are used with rolling resistance coefficient µrr =
0.005, the rolling resistance force can be calculated by using the selected curb weight
of 1000kg.
Frr = 0.005(9810) (8)

25
The aerodynamic drag (FD) is the force due to the friction of vehicle body
moving through the air.
FD = 0.5 ρ·v2·Cd·A (9)
Some assumptions need to be made for the calculations of aerodynamics
force:
i) Drag coefficient (Cd) is assumed to be 0.29
ii) Frontal area (A) is assumed to be 2.27m2.
iii) Travelling velocity up a hill is assumed to be constantly 50km/h (no
accelerating force is involved).
The air density (ρ) can be calculated by first figuring out the temperature (T)
and pressure (p) at certain altitude above sea level (h).
Some constants value used in the calculation for aerodynamic drag (FD):
i) The sea level standard temperature T0 is 288.15
ii) The temperature lapse rate L = 0.0065 K/m.
iii) The sea level standard atmospheric pressure p0 = 101325 Pa.
iv) Molar mass of dry air M is 0.0289644 kg/mol.
v) Universal gas constant R is 8.31447 J/(mol·K).
vi) Gravity constant (g) is 9.81 m/s2.
The following formulas are used to calculate the air density (ρ):
T = T0 – (L·h) (10)
p = p 0 · (1- (11)
ρ = (12)
The particular aerodynamic drag (FD) acting on the electric vehicle along the
uphill journey (Genting Highland) can be calculated using air density at a certain
latitude above sea level using (12).

26
By combining the hill climbing force, rolling resistance force and
aerodynamic force, the net force (Fnet) required for the car to climb uphill can be
determined.
Fnet = F|| + Frr + FD (13)
The force can be related with torque (τ) by the following formula:
τ = Fnet · (Rwheel/G) (14)
Gear ratio (G) of the car shall be determined for the calculation of torque. The
selected wheel size (Rwheel) determines the finally available torque. By knowing the
wheel radius, torque can be calculated as by applying (14).
The data for a distance over 6.4km along the route line towards Genting
Highland has been collected and the current needed by the extra torque can be
calculated by knowing torque constant (kt) for the particular electric motor.
τ = kt · I (15)
The calculation can be used on any electric vehicle in order those needed
parameters for force calculation are known. The torque calculated through this
method is the extra torque needed to climb up this particular route line. Hence
current consumption can be linked for enhancement in the battery capacity
estimation module in electric vehicle. The table showing steps for calculating extra
current drawn from the latitude and longitude data are attached as Appendix.
3.3.2 Inclined Plane Experiment
As shown in Figure 3.5, an incline plane with variable angle is built as the
track of a RC model car to simulate the scenario of an electric vehicle driving uphill
with certain slope angle.

27
The inclined plane was built from scrap items like table surface, wood sticks,
and iron sticks. Recycled items are used for environmental saving purpose and cost
saving purpose.
Figure 3.5: Inclined plane built for experimental use
The inclined plane was built to have variable angle selections. It was done by
drilling holes at pre-calculated heights to have angle with steps of 5°. Two iron sticks
are used to select the desired slope angle.
Figure 3.6: Inclined plane experiment with a RC car running on 20° slope angle

28
A radio controlled (RC) car with 9.6V supply voltage is used to climb up
slope with angle from 5° to 40° as shown in Figure 3.6.
The RC car weight is 0.825167kg. Motor in the RC car is the small scale DC
motor with 9.6V supply voltage requirement. The battery pack used is the Ni-CD cell
with 2800mAh capacity. The inclined plane is built from normal wooden table and
the table surface does not provide good friction (plywood). The inclined plane
surface is then further tested by adding sand paper to increase the friction coefficient.
The sand papers tend to function like asphalt road‟s friction force onto the car wheels.
There are several methods to express slope or grading systems around the
world, mainly is by degree, which is the angle of the slope; and percentage, which is
“grade” of the slope degree. The percentage of the grade is calculated by the formula
100 , where rise is the elevation difference or the vertical difference of the two
points of interest and run is the horizontal length difference of the points.
The torque constant is not given by the motor manufacturer, hence the supply
voltage (Vsupply) motor‟s maximum no-load RPM (RPMno-load(max)), terminal
resistance (Rm) and no-load current (Ino-load) are measured to calculate the torque
constant. The following are the measurements taken:
i) Ino-load = 0.79A
ii) RPMno-load(max) = 16.652k
iii) Rm = 8.48/0.79 = 10.73Ω
iv) Vsupply = 10V
The above readings were taken to calculate torque constant (kt) for the
particular RC car used in the inclined plane simulation experiment.
kt=kb · 1.345 (13)
Imotor = [Vsupply-(kb · kRPM)]/Rm (14)
Equation (14) can be rearranged as follow:
kb = [Vsupply- (Imotor · Rm)]/ kRPM (15)

29
Where kb is the voltage constant in unit of V·kRPM-1
, Vsupply is the voltage
supplied to the motor and Rm is the resistance across the motor terminal.
By applying (15),
kb = 0.09.
Then by applying (13), torque constant for the particular DC motor is found.
kt = 0.12 Nm/A.
The torque constant is calculated and it can be used to calculate the current
needed to climb up a hill with certain slope angle. The calculated value will then
compared with the measured value in the inclined plane experiment.
3.4 Results and Discussion
Table 2: Experimental value
Plane
Angle(˚)
Holding
Current (A)
5 1.740
10 2.650
15 3.480
20 4.240
25 5.010
30 5.820
35 6.590
40 7.240
Based on the RC model car with inclined plane experiment, measured values
indicating the relationship between current and slope angle are shown in Table 2.
The graph plotted based on these results is shown in Figure 3.7 (a full size graph will

30
be attached in Appendix section). Graph plotted gives an equation for the particular
RC model car:
I = 0.15711905θ + 1.0610714 (16)
This equation gives the relationship between current and slope angle for the
particular RC car; each electric vehicle is expected to have a unique equation for this
relationship.
Figure 3.7: Current versus Slope Angle graph based on experimental results
I vs A f(x)=0.15711905*x+1.0610714; R2=0.9988
5 10 15 20 25 30 35 40 45 50
1
2
3
4
5
6
7
8
9
10
11
12
Angle
Current
(5,1.740)
(10,2.650)
(15,3.480)
(20,4.240)
(25,5.010)
(30,5.820)
(35,6.590)
(40,7.240)

31
Table 3: Calculated results based on CPS calculation method
Value 1: Calculated current
Theoretical values of current needed under different slope angle are
calculated by applying equations (5) – (15).
Slope condition with angle 15° is used for the comparison.
Icalc = 3.14A
Value 2: Experimental value
Experimental results are obtained by measuring current across the RC car
motor terminals. Under inclined plane experiment, recorded holding current (Imeasure)
on 15° slope angle is 3.48A (refer to Table 2).
Error percentage between calculated current value and experimental current
value is calculated:
%Error = = 9.77% (16)
The difference between theoretical value and measured value is caused by
those assumptions made in the calculations using RC car parameters. Elements like
drag coefficient of the particular RC car, exact speed travelling uphill, tires‟ rolling
resistance coefficient shall be known in order to give more accurate calculations.
Angle(°) F|| (N) Frr(N) FD
(N)
Net
force
Torque
(Nm)
Current (A)
5 0.7055 0.4047 0.0035 1.1137 0.1676 1.396797883
10 1.4057 0.4047 0.0035 1.8139 0.2730 2.274898407
15 2.0951 0.4047 0.0035 2.5033 0.3767 3.139581929
20 2.7686 0.4047 0.0035 3.1768 0.4781 3.984267687
25 3.4210 0.4047 0.0035 3.8293 0.5763 4.802527111
30 4.0474 0.4047 0.0035 4.4557 0.6706 5.588132753
35 4.6430 0.4047 0.0035 5.0512 0.7602 6.33510568
40 5.2033 0.4047 0.0035 5.6115 0.8445 7.037760977

32
3.5 Suggestions for Improvements
Calculation on the net force applied on the car climbing uphill should consider the
frictional force more precisely by applying exact friction coefficient on the particular
route line selected.
Another aspect should be considered by taking account the effect of air
resistance (drag force, FD) on the car. Every car has different cross-sectional area (A)
and drag coefficient (Cd) and these values are constant values for the particular car.
Hence for the calculation of air resistance, values of square of velocity (v) and air
density (ρ) shall be determined precisely. The problem when it comes to real-time
calculations arises where a selected journey involves a trip from suburban area to a
highland area.
The air density will change along the journey and hence a way to choose air
density value shall be pre-determined during the system design stage.
To further calculate other forces acting on the electric vehicle during uphill condition,
the acceleration force is another element to be analyzed. Yet, it shall be considered
under the condition where the car is not travelling at constant speed. Due to the CPS
calculation assumes that the car is travelling at constant speed, this acceleration force
is not considered.
The comparison between measured value and calculated value shows that
there is an error percentage of 9.77%. Since there are actually more forces acting on
a car during uphill condition; hence the current calculated is slightly lesser than
measured current value. The necessity to involve acceleration force in the calculation
shall be considered to improve the accuracy.
Efficiency loss shall be considered because the gear system will never be
100% efficient. A small efficiency loss can cause another variation factor in the real-
car calculation and implementation.
When it comes to real world implementation, a lab test is needed to obtain the
angle-current profile. A particular electric vehicle should have its own relationship

33
between slope angle and current needed during uphill condition due to different
parameters. Average data by repeating the tests shall be obtained to compensate for
the efficiency loss that is unpredictable in the calculation method.

CHAPTER 4
4 MOTOR SPEED MONITORING
4.1 Introduction
Typical motor speed control or monitoring systems need sensors to provide
feedback information of the motor. Some common used sensors are listed below:
i) Shunt resistors
ii) Current-sensing transformer
iii) Hall effect current sensors
iv) Hall effect tachometer
Other than these feedback systems, the back electromotive force (EMF)
control method can be used to eliminate the requirement for relatively expensive
sensors, such as Hall Effect devices. Back-EMF control method has its advantage
over other motor speed monitoring method due to the sensorless configurations. This
control method obtains the speed and position of the motor directly from the voltage
at the motor windings.
This method can be used in brushless DC motors to provide monitoring of the
motor speed. The back EMF is created when the motor‟s armature turns, which
creates an electrical kickback or EMF that can be sensed as a voltage through a
resistor.

The amplitude of the EMF signal increases with the speed of the armature
rotation. Amplitude of back-EMF voltage is directly proportional to the motor speed.
A drawback of this method is that the amplitude of the signal is very small at low
shaft RPMs.
4.2 Research Methodology
The back-EMF motor speed monitoring system needs a DC motor and a core
microcontroller to read the feedback voltage from the motor terminal as well as
doing analogue-to-digital conversion.
4.2.1 Microcontroller with multiple I/O options
Choosing the correct microcontroller is an important step because features available
in the particular microcontroller will decide amount of tasks that can be done. After
comparing various types of microcontroller, PIC24 with a Dual Inline Package (DIP)
design has been chosen. PIC24 is preferred than those 8-bits microcontroller (MCU);
it is a 16-bits MCU featuring a set of 16 working registers.
Figure 4.1: PIC24FJ64GA002

As shown in Figure 4.1, PIC24FJ64GA002 has been selected for the motor
speed monitoring purpose.
Some important features of the selected microcontroller are shown below:
i) 8MHz Internal Oscillator
ii) Operating Voltage range from 2.0V to 3.6V
iii) Low Operating Current at 650µA
iv) 64Kbytes Program Memory
v) 10-bits Analog-to-Digital Converter (ADC); up to 13 channel
vi) 16 Remappable Pins
vii) Support Universal Asynchronous Receiver/Transmitter (UART)
The 10-bits ADC feature of the PIC24 makes it possible to take the back-
EMF voltage generated by motor terminals of DC motor as input voltage for
conversion process. The drawback of this PIC24 is that it can only accept an input
voltage for not greater than 3.6V for an analogue pin; while the maximum back-EMF
generated during the maximum motor speed is higher than 9V.
To overcome this, a simple voltage divider circuit has been constructed to
scale down the voltage (3.3V). Small value resistors are used in the voltage divider
circuit because the PIC24 cannot detect the input voltage if the input current is too
low. 27Ω resistors are used to ensure the current flow through is kept above 100mA.
Figure 4.2: Schematic between microcontroller and DC motor

In order to program the PIC24, a PICkit2 was built to provide Universal
Serial Bus (USB) connection to a computer.
Figure 4.3: Self-built PICKit2 programmer
The compiler used to program the PIC24 using self-built programmer is the
MPLAB Integrated Development Environment (IDE) by Microchip. Easy-to-learn
interface is provided with powerful debugging tools and simulators. The MPLAB
IDE supports programming with C languange and it can be used to program various
types of microcontroller.
Figure 4.4: MPLAB IDE user interface

Once programming code has been done debugging under MPLAB IDE, the
exported hex code can be programmed into the target board (PIC24) using PICkit2
v2.61 as shown in Figure 4.5.
Figure 4.5: PICkit2 v2.61 programmer interface
4.2.2 ADC Conversion and LCD display
Programming stage:
i) Set one pin as analogue input pin (RB0) to read back-EMF voltage
ii) Set one pin as input pin (RB1) to be connected with a switch
iii) Set 6 pins for output pins (RA0-RA5) to be connected with a LCD display
iv) Initialize ADC conversion
v) Initialize LCD
vi) Read from ADC conversion and send string to LCD
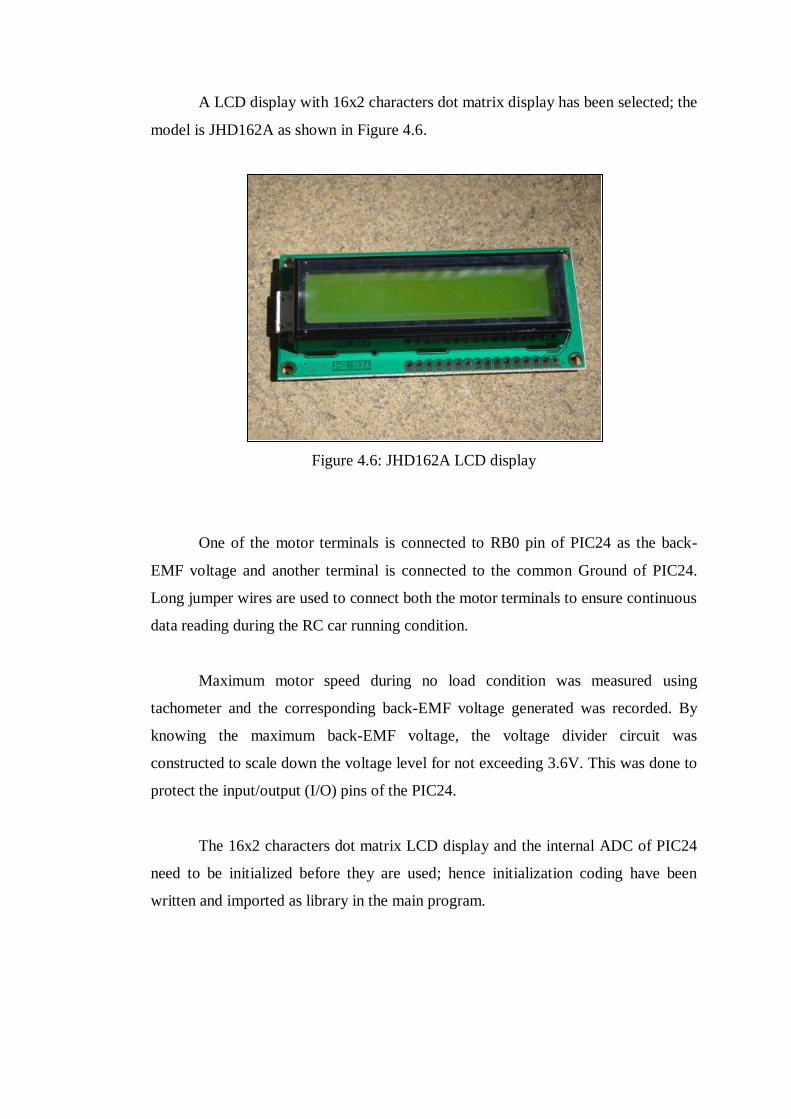
A LCD display with 16x2 characters dot matrix display has been selected; the
model is JHD162A as shown in Figure 4.6.
Figure 4.6: JHD162A LCD display
One of the motor terminals is connected to RB0 pin of PIC24 as the back-
EMF voltage and another terminal is connected to the common Ground of PIC24.
Long jumper wires are used to connect both the motor terminals to ensure continuous
data reading during the RC car running condition.
Maximum motor speed during no load condition was measured using
tachometer and the corresponding back-EMF voltage generated was recorded. By
knowing the maximum back-EMF voltage, the voltage divider circuit was
constructed to scale down the voltage level for not exceeding 3.6V. This was done to
protect the input/output (I/O) pins of the PIC24.
The 16x2 characters dot matrix LCD display and the internal ADC of PIC24
need to be initialized before they are used; hence initialization coding have been
written and imported as library in the main program.

4.3 Results and Discussion
Figure 4.7: LCD display showing updated back-EMF voltage reading and calculated
rounds-per-minute (RPM)
After the ADC conversion interrupt occurs, the PIC24 will calculate the
corresponding Rounds-Per-Minute (RPM) with ratio to the back-EMF voltage level.
The conversion was done according to the 10-bits internal ADC of PIC24,
with accuracy up to 0.1% and resolution of 3.2mV. Due to 16 buffer calculations are
selected instead of 1 buffer, the average value converted is more accurate.
4.3.1 Problems encountered
The problem encountered in this method was the voltage drop after the back EMF
voltage being feed to the PIC24 as input voltage. For instance, a reading of 2.8V
back-EMF voltage will be detected as 2.0V after it is connected to the input pin of
PIC24.

The reason was found and it was due to the impedance mismatch. To
compensate for this error, several readings were taken and the average value was
found to be 0.82V voltage drop.
An extra step of calculation was added in the main program to compensate
for this loss of voltage level. Due to this voltage drop, the PIC24 cannot detect the
RPM precisely at low motor speed due to the small back-EMF voltage generated by
the motor terminals.
4.4 Suggestions for Improvements
This method can give feedback of motor speed monitoring without sensor
configurations; yet it is not 100% accurate due to the voltage generated is not stable
under low speed condition.
The impedance mismatch case in the methodology also shows that the use of
voltage divider configuration circuit is not suitable. Voltage regulator circuit shall be
built with desired regulator IC. The selected regulator IC can be chosen with desired
electrical characteristics.
Also, the RPM calculated in this method can only give the motor shaft‟s
speed. In order to have the speedometer feature, sensors are still needed to show the
vehicle speed in unit of km/hour. For instance, sensors shall be installed at vehicle
wheels to measure time between each wheel revolution. Accurate wheel radius shall
be known to give precise calculations of vehicle speed.
Lastly, a 32-bits microcontroller can be chosen in order to have a faster
response time. More features and output pins can be manipulated for necessary
options and operations.

CHAPTER 5
5 DATA LOGGING AND GRAPHICAL USER INTERFACE
5.1 Introduction
Typical EV intelligent control systems have data logging features to save data to the
on-board computers. These saved data can be manipulated by technician or engineers
during servicing process; some advanced systems could even access to the database
by the control centrals.
Graphical user interface (GUI) to assist EV driver access to the embedded
system shall be kept clear and user friendly. Features like temperature monitoring,
motor speed monitoring, GPS navigation system and BMS are necessary in an EV
intelligent control system. Some extra features like phone calling, e-book reader and
infotainment can be added to the secondary screen. These features are going to be
implemented in this project; done separately by different members of this project.
5.2 Research Methodology
The data logging features are done using two ways; one is using Electrically Erasable
Programmable Read-Only Memory (EEPROM) and another is done using computer
solid state hard disk storage. The GUI is designed using Adobe Flash CS3.

43
5.2.1 Data Logging
EEPROM storage
The first option was to store date read from sensors to EEPROM through I2C 2-wire
protocol. An EEPROM with model NM24C04 is connected to the PIC24. The
EEPROM uses two I/O pins of PIC24; hence it can store 4K bits with minimized pin
counts. It is used to serve as backup memory storage if the serial connection to the
computer fails.
Computer solid state hard disk storage
In order to save feedback data from sensors installed on electric vehicles, data must
be passed to computer through the microcontroller. Serial connections are needed
between the computer serial ports and the microcontroller. An Intel Desktop Board
D510MO has been used as the on-board computer; two serial ports are available for
serial communications.
5.2.2 Recommended Standard 232 (RS-232)
RS-232 is a standard developed by Electronic Industry Association (EIA) and it is
one of the most widely used communication interfaces. RS-232 is used to connect a
Data Terminal Equipment (DTE) to a Data Circuit Terminating Equipment (DCE).
RS-232 refers to serial communication; hence bits are transmitted serially.
Communication between two devices connected using RS-232 is full duplex; which
means that the data transfer can take place in both direction. In this project, data are
transferred from the microcontroller to the computer.

44
In order to transmit data through RS-232 from a microcontroller, an extra
circuit is needed. The particular circuit is known as MAX232 serial level converter.
MAX232 is an integrated circuit used to convert signals from RS-232 serial port.
Figure 5.1: MAX232 schematic diagram
Figure 5.2: MAX232 circuit with RS-232 cable

45
By having this serial level converter circuit, data processed by internal ADC
of PIC24 can be transmitted serially to the computer. Data received through the
computer serial ports can be accessed through some terminal program such as
HyperTerminal, SerialTerm and PuTTY.
Figure 5.3: Motor speed monitoring through HyperTerminal
Figure 5.4: Motor speed monitoring through SerialTerm

46
Figure 5.5: Motor speed monitoring through PuTTY
Data received through serial ports can be stored in text file format and it can
be saved to specific folders according to the user setting. The text file is set to be
saved in a format such that there is no space between incoming data. This text file
can be manipulated later as input for graph plotting or input for Flash design.
5.2.3 LoadVars Method in Adobe Flash
GUI design was done using Adobe Flash CS3. The output file format is a Shock
Wave Flash (SWF) file. A SWF file is a window for capturing and displaying
information. Adobe Flash does not have communication ports; hence it cannot
communicate with serial ports directly.
Using ActionScript functions and methods, information can be sent and
received from text files and XML files. In addition, server-side scripts can request
specific information from a database and relay it to a SWF file. Server-side scripts
can be written in different languages: some of the most common are CFML, Perl,
ASP (Microsoft Active Server Pages), and PHP.

47
By storing information in a database and retrieving it, dynamic and
personalized content for the SWF file can be created. For example, motor speed
monitoring can be done by continuously reading data from the text file
“motorspeed.txt”. The text file should be stored in the same directory as the SWF file;
hence the setting in the RS-232 terminal program should be configured to match this
requirement.
LoadVars method is used to access data from a text file; the source code is
written as below:
var myTextLoader:URLLoader = new URLLoader();
myTextLoader.addEventListener(Event.COMPLETE, onLoaded);
function onLoaded(e:Event):void
var speed:Array = e.target.data.split("&");
if (speed[i]==undefined)
var display_message:URLLoader = new URLLoader();
display_message.addEventListener(Event.COMPLETE, onLoaded);
function onLoaded(e:Event):void
var error:Array = e.target.data.split("&");
textbox.text= error[0];
;
display_message.load(new URLRequest("error.txt"));
gotoAndPlay (1,"Scene 1");//end if
else
textbox.text= speed[i];
;
myTextLoader.load(new URLRequest("database.txt"));

48
The working principle of this method:
i) Create a textbox
ii) Assign a destination text file to read data
iii) Split data read using special character
iv) Display value as arrays
v) Continuously looping from frame to frame
The SWF file is designed in such a way that whenever a button is pressed to
monitor the motor speed, a looping back from scene to scene is prompted. This is
done to ensure that the action script is being executed continuously so that it will
continuously read from the particular text file to get the updated data. Action script
3.0 was used in the Flash design.
Figure 5.6: Initial design of speed monitoring SWF file
Figure 5.7: Error message during serial-communication failure
49
5.2.4 Graphical User Interface Design
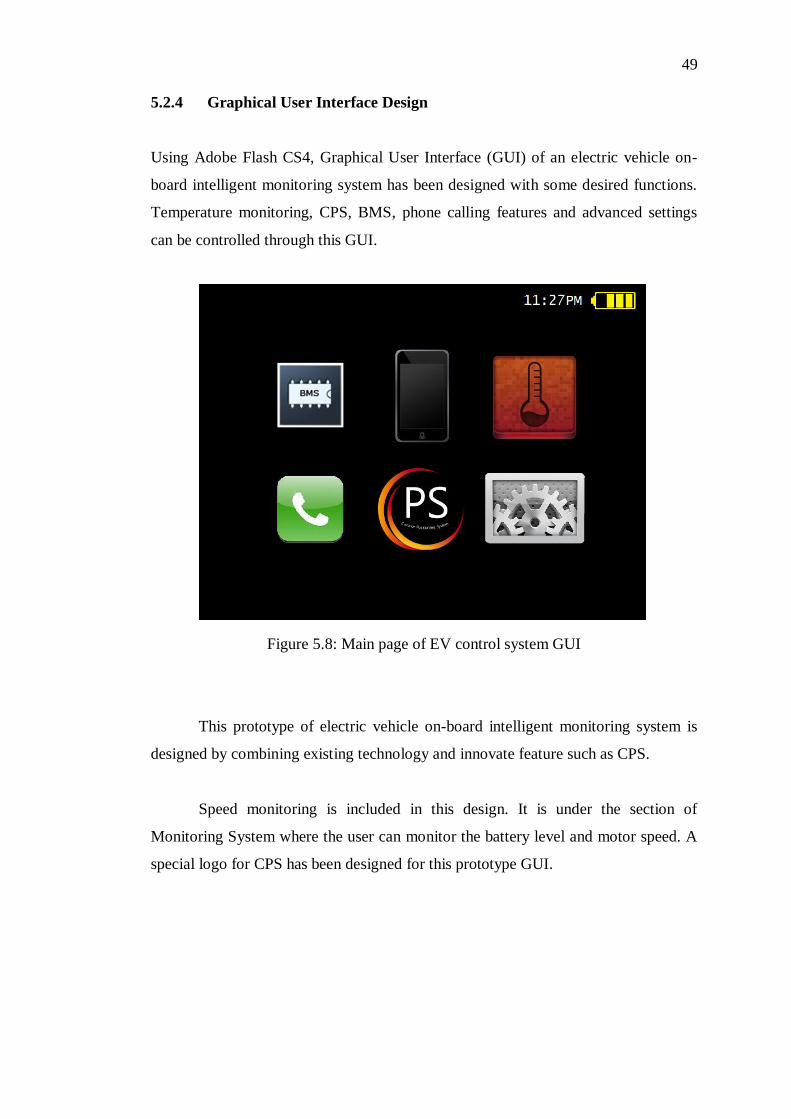
Using Adobe Flash CS4, Graphical User Interface (GUI) of an electric vehicle on-
board intelligent monitoring system has been designed with some desired functions.
Temperature monitoring, CPS, BMS, phone calling features and advanced settings
can be controlled through this GUI.
Figure 5.8: Main page of EV control system GUI
This prototype of electric vehicle on-board intelligent monitoring system is
designed by combining existing technology and innovate feature such as CPS.
Speed monitoring is included in this design. It is under the section of
Monitoring System where the user can monitor the battery level and motor speed. A
special logo for CPS has been designed for this prototype GUI.
50
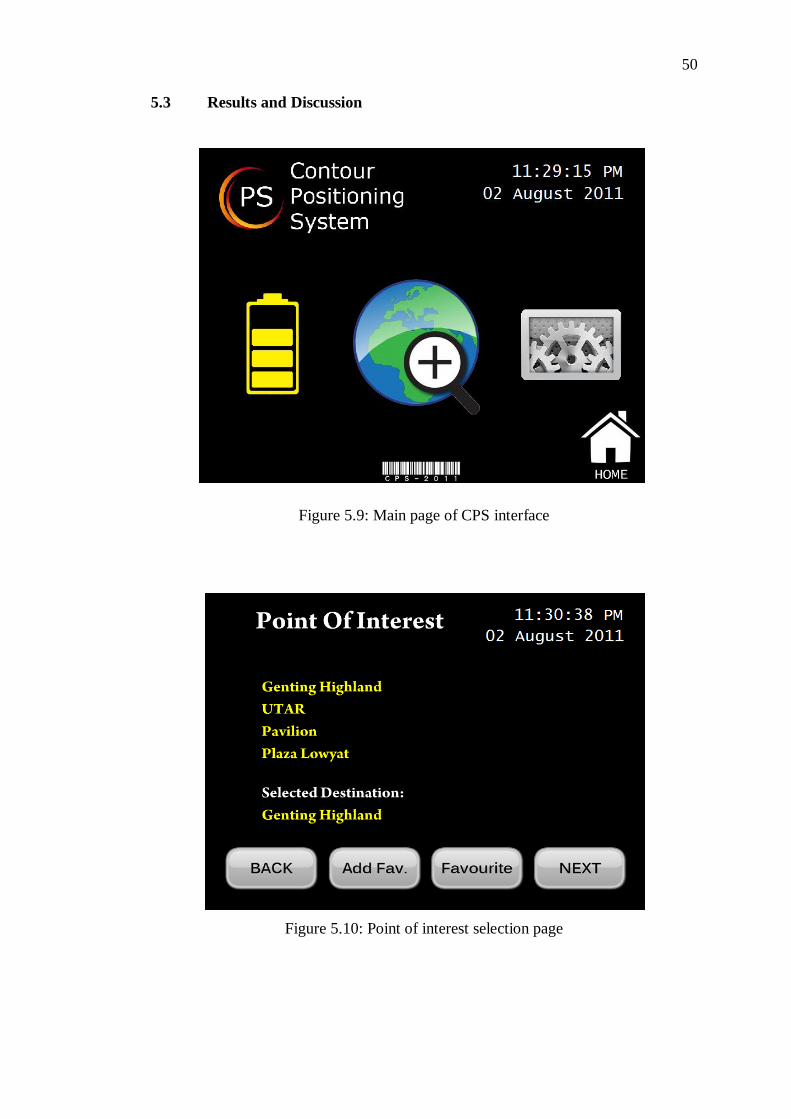
5.3 Results and Discussion
Figure 5.9: Main page of CPS interface
Figure 5.10: Point of interest selection page

51
Figure 5.11: Calculation results displaying page
Figure 5.12: Battery status checking page

52
Figure 5.13: Navigation page with CPS results updated
Figure 5.14: Motor monitoring page

53
As shown in Figure 5.9 to Figure 5.13, the main GUI page with be directed to
the CPS page where the user can choose to view current battery status or to choose a
point of interest. Once a location is selected, the user will see the calculated
remaining battery status under CPS method which considered about the contour
condition along the route line selected.
CPS calculation has been used in this GUI design to show how it can be
implemented on an EV or even a conventional gasoline-powered car.
As shown in Figure 5.14, the monitoring system page has been done with
both battery monitoring and motor speed monitoring. The input to the motor speed
monitoring is obtained from a specified text file saved using terminal program
(SerialTerm or PuTTY).
5.4 Suggestions for Improvements
Smart phone revolution has brought significant impact to global users. Smart phones
with surprising features are equipped with powerful mobile operating system. Two of
the famous mobile operating systems are known as iOS and Android.
Smart phone features could be embedded onto the on-board computers in EV,
such as the phone calling feature and infotainment feature. For instance, an Android
smart phone can be connected to computer using VNC remote control software.

54
Figure 5.15: Phone calling and media playing feature on computer

55
CHAPTER 6
6 COMPETITIONS AND ACHIEVEMENTS
6.1 1MALAYSIA Solar Competition
Figure 6.1: 1Malaysia Solar Competition (Solar Car) certificate

56
6.2 JamesDyson Award
Figure 6.2: JamesDyson Award project listing
2nd
August: Project submission
6th September: Qualified as Malaysia top ten National Finalists
Current stage: Pending international top 20 teams selection

57
6.3 Manuscript Submission
Manuscript entitled “Contour Positioning System - New Idea to Enhance Electric
Vehicle Battery Capacity Estimation” submission:
i. IEEE (submission accepted)
ii. Elsevier Editorial System (submission accepted)
6.4 MSC Malaysia APICTA Awards 2011
Submission of „Development of Electric Vehicle Intelligent Control System (EVICS)
prototype‟ for the Best of Research & Development category under MSC Malaysia
APICTA Awards 2011 shortlisted to final stage presentation.
Current stage: Pending winner announcement

58
CHAPTER 7
7 CONCLUSION AND RECOMMENDATIONS
7.1 Conclusion
In this project, several modules are added as extra features to an EV control system.
The CPS introduced can be a new revolution in the range and battery estimation
technology; contour conditions should be considered in order to estimate available
battery capacity accurately. A series of CPS calculation is proven to match measured
values from inclined plane experiment; some improvements could be made to make
the system more reliable.
Motor speed monitoring was done using back-EMF control method; hence it
does not use sensors. Using PIC24 as core microcontroller, ADC conversion was
done and the RPM calculated from back-EMF could be shown on a LCD display.
Using RS-232 serial communication, the motor speed could be monitored through
GUI designed using Adoble Flash. Real time monitoring can be achieved by using
LoadVars method in Adobe Flash so that the SWF file can continuously read data
from a text file.
7.2 Recommendation
Real time kernel and real time operating system shall be created in order to have real
time response within microcontroller and computer serial ports. For an EV, data

59
communication for displaying at the on-board display screen shall be kept as real
time as possible. The importance of real time condition will only be realized during
crucial condition; hence it should be implemented for the EV drivers‟ safety purpose.
RS-232 communication protocol could be replaced by Universal Serial Bus
(USB) standard in order to have higher speed transmission. USB connection is also
easier to be carried out by end users.

60
REFERENCES
R. Bajaj, S. L. Ranaweera and D. P. Agrawal, “GPS: Location-Tracking
Technology”, IEEE Computer, Vol.35, No.4, 2002, pp. 92–94
James Larminie, John Lowry. Electric vehicle technology explained. West Sussex:
John Wiley and Sons Ltd, 2003, pp. 1-277.
André Lewis, Michael Purvis, Jeffrey Sambells, Cameron Turner. Beginning Google
maps applications with Rails and Ajax: from novice to professional. New York:
Springer-Verlag, 2007, pp. 276-269.
Chris Veness. “Calculate distance, bearing and more between Latitude/Longitude
points.” Internet: http://www.movable-type.co.uk/scripts/latlong.html, Jan. 2010
[May 29, 2011].
Mircea Popa, Veronica Argesanu, Anca Sorana Popa. “Car finding with a pedestrian
navigation system”, Human System Interactions (HSI) 2010 3rd Conference, pp.
406-411.
James Watkins. (2008). An introduction to biomechanics of sport and exercise. [On-
line]. Available:
http://books.google.com/books?id=bwcFXCjqEA8C&printsec=frontcover#v=onepag
e&q&f=false [Jul. 13, 2011].
Thomas Bräunl. (2008, August). Embedded Robotics: Mobile Robot Design and
Application with Embedded System. (3rd
edition). [On-line]. Available:
http://books.google.com/books?id=1_rMmj9OxYC&printsec=frontcover#v=onepage
&q&f=false [Jun. 30, 2011].

61
Wayne Rademacher. “Brushless Motors.” Internet:
http://www.tcrconline.com/documents/Brushless/Brushless%20Motors.pdf, Jan.
2008 [Jun. 25, 2011].

62
APPENDICES
APPENDIX A: Graphs
Figure 7.1: Current versus Angle graph plotting

63
APPENDIX B: Computer Programme Listing
//Main Program coding
#include <P24FJ64GA002.H>
#include <stdio.h>
#include <string.h>
#include "LCD.c"
#include "adc.c"
#include "function.h"
#include "UART_KC.c"
_CONFIG1(JTAGEN_OFF & BKBUG_OFF & FWDTEN_OFF)
_CONFIG2(FCKSM_CSDCMD & OSCIOFNC_ON & POSCMOD_NONE &
FNOSC_FRC)
void main(void)
char speed[7];
char volt[3];
char counter[20];
float value,value1,temperature;
int loop;
int ct=0;
lcd_init();
initU1();
64
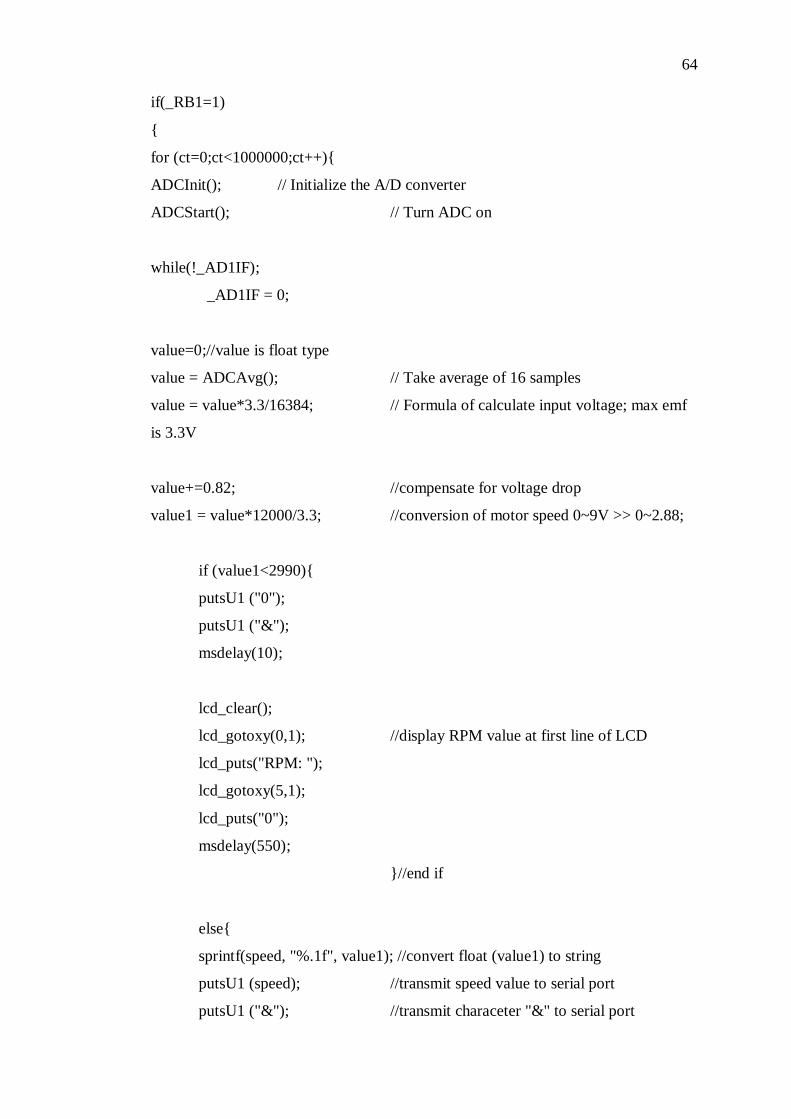
if(_RB1=1)
for (ct=0;ct<1000000;ct++)
ADCInit(); // Initialize the A/D converter
ADCStart(); // Turn ADC on
while(!_AD1IF);
_AD1IF = 0;
value=0;//value is float type
value = ADCAvg(); // Take average of 16 samples
value = value*3.3/16384; // Formula of calculate input voltage; max emf
is 3.3V
value+=0.82; //compensate for voltage drop
value1 = value*12000/3.3; //conversion of motor speed 0~9V >> 0~2.88;
if (value1<2990)
putsU1 ("0");
putsU1 ("&");
msdelay(10);
lcd_clear();
lcd_gotoxy(0,1); //display RPM value at first line of LCD
lcd_puts("RPM: ");
lcd_gotoxy(5,1);
lcd_puts("0");
msdelay(550);
//end if
else
sprintf(speed, "%.1f", value1); //convert float (value1) to string
putsU1 (speed); //transmit speed value to serial port
putsU1 ("&"); //transmit characeter "&" to serial port

65
msdelay(10);
lcd_clear();
lcd_gotoxy(0,1); //display RPM value at first line of LCD
lcd_puts("RPM: ");
lcd_gotoxy(5,1);
lcd_puts(speed);
msdelay(550);
//end else
//end for loop
//end if loop
else
lcd_clear();
//end main loop
//UART library for serial communications
#include <p24fj64ga002.h>
/**************************************************
*********Initialization for UART settings**********
**************************************************/
//call the function initU1() to set up UART port for data transmission to PC
//Using MAX232 connect T1IN to RP6 and R1OUT to RP5
void initU1(void)

66
RPINR18bits.U1RXR=5; //set pin14 as U1RX
RPOR3=0x0003; //set pin15 as U1TX
U1BRG=25; // baud rate=9600 for 8MHz FRC
U1MODE=0x8000; //enable UART
U1STA=0x0400; //enable transmission
IFS0bits.U1TXIF=0; //ensure TX1 interrupt flag is 0
/**************************************************
*******Transmission of data in string************
**************************************************/
int putsU1 (char *s)
while (*s)
delay();
transmitU1(*s++);
/**************************************************
*****Tansmission of data from U1TX(integer)********
**************************************************/
int transmitU1(int c)
U1TXREG=c; //move the integer to TX1 register
IFS0bits.U1TXIF=0; //ensure TX1 interrupt flag is 0
while (!IFS0bits.U1TXIF);
return c;

67
/**************************************************
*******************Timing delay********************
**************************************************/
//provide delay for the clock to stable after power up
//provide delay for the transmission to complete
void delay()
unsigned char i,j;
for(i=0;i<255;i++)
for(j=0;j<100;j++);
/**************************************************
******Function provide newline for UART************
**************************************************/
void newline()
delay();
transmitU1(10); //go to new line and return
delay();
transmitU1(13);
/**************************************************
**************Data receive to U1RX****************
**************************************************/
char getU1()
while(!U1STAbits.URXDA);
delay();
return U1RXREG;

68
//LCD initialization code
#include <P24FJ64GA002.H>
#include "lcd.h"
/**************************************************/
/* msdelay(x) */
/* Delay for x milliseconds. */
/* Note delay is only approximate . */
/* Max value for x is 65536 i.e. 65.536 seconds */
/**************************************************/
void msdelay(unsigned int x)
unsigned int delval;
while(x--)
delval =794; //msdelay(1)= delay of 1.000250mSecs
while(delval--)
;
/**************************************************/
/* lcd_init() */
/* Initialise the LCD */
/**************************************************/
void lcd_init()
/* 0x28 - 4 bit mode
0x06 -
0x0c -
*/
static BYTE lcd_init_data[] = 0x28,0x06,0x0c ;

69
BYTE i;
AD1PCFG |= 0xffff;//0x003C;
TRISB &= 0x10F0;//0xFFC0;
TRISA &= 0x0000;
E = 0;
RS = 0;
msdelay(20);
/* Ensure LCD is in known state */
for( i = 0; i < 3; i++)
lcd_write_nibble(0x03);
msdelay(5);
/*Set LCD to 4-bit mode */
lcd_write_nibble(2);
msdelay(1);
/* Configure LCD */
for( i = 0; i < 3; i++)
lcd_write_byte(lcd_init_data[i]);
lcd_clear();
/**************************************************/
/* lcd_clear() */
/* Clear LCD to all spaces */
/**************************************************/
void lcd_clear()
lcd_write_control_byte(CLEAR_LCD);

70
msdelay(5);
/**************************************************/
/* lcd_gotoxy(x,y) */
/* Position cursor at column x, line y. */
/* For a 2 line 16 character display */
/* x = 0 to 15, y = 0 or 1 */
/**************************************************/
void lcd_gotoxy(BYTE x, BYTE y)
BYTE pos = 0x80;
if ( (x < 16) && (y < 2) )
if (y > 0)
pos += 0x40; // position for second line
pos += x; // add offset
lcd_write_control_byte(pos);
/**************************************************/
/* lcd_putchar(x) */
/* display character x on LCD at cursor location. */
/**************************************************/
void lcd_putchar(char x)
lcd_write_data_byte(x);

71
/**************************************************/
/* lcd_puts(s) */
/* Display string s on LCD at cursor location. */
/**************************************************/
void lcd_puts(const char *s)
while(*s)
lcd_write_data_byte(*s++);
/*================================================*/
/* END OF PUBLIC FUNCTIONS */
/*================================================*/
/************************************************
The following functions should not need
to be called by a user program
*************************************************/
static void lcd_write_nibble(BYTE x)
LATA = ((LATA & 0xFFF0) | x);
E = 1;
E = 1;
E = 0;
static void lcd_write_byte(BYTE x)
BYTE temp;
temp = (x >> 4) & 0x0f;
lcd_write_nibble(temp);
temp = x & 0x0f;
lcd_write_nibble(temp);

72
msdelay(1);
void lcd_write_control_byte(BYTE x)
RS = 0;
lcd_write_byte(x);
void lcd_write_data_byte(BYTE x)
RS = 1;
lcd_write_byte(x);
//ADC initialization code
ADCInit()
AD1CON1 = 0x00E4;
AD1CON2 = 0x003C;
AD1CON3 = 0x0D09;
AD1CHS=0x0102;
AD1PCFG=0xFFFB;
AD1CSSL=0x0000;
ADCStart()
_ADON = 1; // Turn on the A/D converter

73
ADCAvg()
unsigned long int temp;
temp = ADC1BUF0 + ADC1BUF1 + ADC1BUF2 + ADC1BUF3 +
ADC1BUF4 + ADC1BUF5 + ADC1BUF6 + ADC1BUF7 +
ADC1BUF8 + ADC1BUF9 + ADC1BUFA + ADC1BUFB +
ADC1BUFC + ADC1BUFD + ADC1BUFE + ADC1BUFF;
return (temp);