Embed Size (px)
Citation preview

June 2008Arne Olav Fredheim, EPTLars Henrik Gjertsen, StatoilHydro
Master of Science in Engineering and ICTSubmission date:Supervisor:Co-supervisor:
Norwegian University of Science and TechnologyDepartment of Energy and Process Engineering
Development of Processes for NaturalGas DryingFurther exploring the TEG Injection Concept
Audun Bråthen

Problem DescriptionBakgrunn:Naturgass som produseres og transporteres fra norske felt for salg i Europa eller USA inneholderen del komponenter som må fjernes fra gassen. I tillegg til CO2 og H2S så må gassen tørkes for åunngå utfelling av vann som igjen kan danne hydrater i prosess- og transportsystem. Hvor myegassen må tørkes avhenger av bruksområde og hvilke prosesser som er involvert. Det finnes fleretilgjengelige teknologier for tørking av gass som benyttes i dag. På anlegg der gassen sendesvidere til sluttbruker via et rørsystem benyttes ofte absorpsjonsbasert tørkeprosess med glykolsom kjemikalie. På anlegg der gassen skal prosesseres videre via nedkjøling benyttes ofteadsorpsjonsbasert tørkeprosess med molekular sieve. Både absorpsjon- ogadsorpsjonsprosesser er energikrevende og plasskrevende, og det arbeides kontinuerlig med åfinne frem til mer kompakte prosessløsninger. Alternative prosesser kan for eksempel innbefattebruk av membraner eller kompakte absorpsjonskontaktorer.
Mål:Evaluere eksisterende og nye prosessløsninger for tørking av naturgass med hovedmål om å finnenye konsepter som krever mindre plass (vekt/volum) og mindre energiforbruk.
Oppgaven bearbeides ut fra følgende punkter:
1.Videreutvikling av prosesskonsept (fra prosjektoppgave) for tørking av naturgass med fokus påreduksjon i vekt og volum av anlegget i forhold til konvensjonelle TEG (tri-etylen glykol) anlegg.Anlegget skal kunne tørke gassen både til rørtransportkvalitet og kaldprosesskvalitet
2.Etablering av simuleringsmodell for det nye konseptet i Hysys sammen med CPA (Cubic PlussAssosiation) tilstandslikning for beregning av glykol-vann-hydrokarbon likevekt. Både tørkedel ogregenereringsdel modelleres.
3.Gjennomføre simuleringer av konseptet samt design av hovedkomponenter med bruk av TEG ianlegget for å kunne sammenligne med eksisterende glykol (TEG) tørkeanlegg.
4.Sammenligning av simulerte prosessparametere ved bruk av forskjellige typer kjemikalier itørkeanlegget som for eksempel glykoler (eksempelvis MEG (mono etylen glykol), DEG (de etylenglykol), TEG ) og aminer (eksemplevis MDEA).
Assignment given: 16. January 2008Supervisor: Arne Olav Fredheim, EPT

i
Preface This paper is the result of my master thesis conducted as part of my Master in Science and
Technology in Engineering & ICT with specialisation in the field of Industrial Processing at the
Norwegian University of Science and Technology (NTNU). The work was done from January to June
2008, counting 30 study points, equivalent to 100% of my work load for this period.
The supervisors for this project have been Professor II Arne Olav Fredheim from NTNU and Lars
Henrik Gjertsen from StatoilHydro.
______________________________________ Audun Bråthen
Trondheim, 6.6.2008
Acknowledgements
First I would like to thank my primary supervisor for this project, Professor II Arne Olav Fredheim, for
aiding me in the work with this project and for introducing me to many of the competent people
working for StatoilHydro. Also thanks to Lars Henrik Gjersten for introducing me to the work
StatoilHydro has done on compact dehydration.
Thanks to Kjersti Omdahl Christensen from StatoilHydro and Bernt Kalgraff from ProPure for giving
me an introduction to the ProPure compact mixer technology.
Thanks to Even Solbraa and Svein Puntervold from StatoilHydro for helping out with using the CPA
EoS with HYSYS. Also thanks to the IVCSEP research group at the Technical University of Denmark
(DTU) for letting me use the CPA EoS for my simulations.
Thanks to Lars Erik Øi from Telemark University College (HiT) for helping me model the TEG
regeneration process in HYSYS.
Also thanks to my roommates, friends and family for all the support during the work with this
project, and for engaging me in leisure activities from time to time, making me regain my energy and
motivation.

ii

iii
Abstrakt Denne avhandlingen tar for seg videreutvikling av TEG injeksjonskonseptet presentert i Bråthen
(2007). En introduksjon til separatorteknologi, konvensjonell glykol regenereringsprosess og
kompaktmiksing blir først presentert, ettersom dette er viktige elementer i den alternative
tørkeprosessen. Fordeler, ulemper og operasjonelle problemer påpekes, før problemene med TEG
injeksjonskonseptet beskrives. Bruk av varm strippegass for regenerering av glykol foreslås som en
mulig forbedring, men det viser seg at dette fører til store tap av glykol, stort behov for strippegass
samt oksidasjon av glykol, noe som bidrar til at dette ikke inkluderes. De eneste forbedringene som
inkluderes er bruk av inline-teknologi for de første ekstraksjonstrinnene, samt bruk av
kompaktmiksere for miksing av TEG og naturgass. En simuleringsmodell for prosessen utarbeides i
HYSYS, sammen med bruk av CPA-tilstandsligning og operasjonsdata fra Snøhvit LNG anlegget. Både
tørkedelen og regenereringsdelen modelleres. Fra simuleringene finnes det at TEG injeksjon krever
omtrent 50% større sirkulert mengde TEG for å oppnå samme vanninnhold i den tørka gassen som
vanlig absorber tørking. Vekt og volum for absorpsjonsdelen for TEG injeksjon er derimot mye
mindre når det sammenlignes med størrelser fra Kristinfeltet i Nordsjøen, hvilket til dels
kompenserer for den økte mengden sirkulert TEG. Bruk av MEG og DEG istedenfor TEG i
injeksjonskonseptet blir også simulert, men det konkluderes med at TEG er den beste absorbenten
på bakgrunn av lavere energiforbruk for regenereringsdelen, mindre tap, samt bedre effektivitet
med små til moderate mengder strippegass. På bakgrunn av meget store tap av absorbent
konkluderes det også med at MEG er totalt uegnet for tørking.

iv

v
Abstract This paper treats further development of the TEG injection process described in Bråthen (2007). An
introduction to separation technology, conventional glycol regeneration and compact mixing is
presented, as these are important parts of the alternative dehydration concept. Advantages,
disadvantages and operational problems are pointed out, before the problems with the TEG
injection process is described. Using hot stripping gas for regeneration of the TEG is one of the
suggested improvements, but large glycol losses, large flow rates of stripping gas and oxidizing of
glycol are found to be the consequences, thus making the alternative unfeasible. The only
improvements used, are to use inline separators for the first separation stages and compact mixers
for mixing of TEG and natural gas. A simulation model is developed using the simulation software
HYSYS with the CPA EoS as fluid package. Both the absorption and the regeneration part of the
process are modeled, using operational data from the Snøhvit LNG facility is used as reference. From
simulations it is found that TEG injection requires about 50% more circulated TEG than conventional
absorber dehydration to obtain the same water content in the dehydrated gas. The weight and
volume of the absorption part of the process is however found to be considerably smaller than the
operational process at the Kristin field in the Norwegian North Sea, thus partly compensating for the
increased TEG circulation rate. Use of MEG and DEG instead of TEG for the injection concept is also
simulated, but it is concluded that TEG is the best suited because of lower regeneration energy,
lower absorbent loss and best dehydration performance for low to intermediate flow rates of
stripping gas. MEG is found to be unsuited for dehydration because of very large losses of absorbent.

vi

vii
List of contents Preface ..................................................................................................................................................... i
Acknowledgements .................................................................................................................................. i
Abstrakt .................................................................................................................................................. iii
Abstract ................................................................................................................................................... v
List of figures .......................................................................................................................................... xi
List of formulas ..................................................................................................................................... xii
List of tables .......................................................................................................................................... xii
Abbreviations ....................................................................................................................................... xiii
Nomenclature ...................................................................................................................................... xiv
Introduction ............................................................................................................................................ 1
Chapter 1: Separators ............................................................................................................................. 3
1.1 Function ........................................................................................................................................ 3
1.1.1 Inlet diverter .......................................................................................................................... 4
1.1.2 Liquid collection section ........................................................................................................ 4
1.1.3 Gravity settling section .......................................................................................................... 5
1.1.4 Mist extractor section ............................................................................................................ 5
1.2 Configurations ............................................................................................................................... 5
1.2.1 Horizontal separator .............................................................................................................. 6
1.2.2 Vertical separators ................................................................................................................. 7
1.2.3 Centrifugal separators ........................................................................................................... 8
1.3 Three-phase separators ................................................................................................................ 9
1.4 Operation problems ...................................................................................................................... 9
1.4.1 Sand deposition ................................................................................................................... 10
1.4.2 Plugging of mist extractor .................................................................................................... 10
1.4.3 Foaming ................................................................................................................................ 11
1.4.4 Carry-over of liquid through the gas outlet ......................................................................... 11
1.4.5 Carry-under of gas through the liquid outlet ....................................................................... 11
1.5 New technology – inline separation ........................................................................................... 11
1.5.1 The CDS-Gasunie cyclone ..................................................................................................... 12
1.5.2 The Twister BV supersonic separator .................................................................................. 14
Chapter 2: Glycol regeneration system ................................................................................................ 15
2.1 The different units` operation .................................................................................................... 16
2.1.1 Filters .................................................................................................................................... 16

viii
2.1.2 Overhead condenser ............................................................................................................ 16
2.1.3 Flash tank ............................................................................................................................. 16
2.1.4 Glycol/glycol heat exchanger ............................................................................................... 17
2.1.5 Regeneration still ................................................................................................................. 17
2.1.6 Glycol pump ......................................................................................................................... 20
2.2 Operational problems ................................................................................................................. 20
2.2.1 Corrosion .............................................................................................................................. 20
2.2.2 Contamination of the glycol ................................................................................................. 21
2.2.3 Emission of hazardous compounds ..................................................................................... 21
2.2.4 Glycol loss............................................................................................................................. 22
2.3 Enhanced glycol regeneration .................................................................................................... 22
2.3.1 The Drizo process ................................................................................................................. 22
2.3.2 The Coldfinger process ......................................................................................................... 23
2.3.3 Vacuum distillation .............................................................................................................. 23
2.3.4 Stripping gas ......................................................................................................................... 24
Chapter 3: Compact mixing unit ........................................................................................................... 25
3.1 The ProPure compact mixer........................................................................................................ 25
Chapter 4: Further developing the alternative natural gas drying concept ......................................... 29
4.1 The concept ................................................................................................................................. 29
4.2 Potential improvements ............................................................................................................. 30
4.3 Alternative concepts ................................................................................................................... 31
4.3.1 Alternative 1: Injecting hot stripping gas into the rich glycol stream .................................. 31
4.3.2 Alternative 2: Using staged injection of hot stripping gas ................................................... 32
4.3.3 Alternative 3: Using an absorber for regeneration .............................................................. 33
4.3.4 Alternative 4: Using piping as a heat exchanger for the glycol regeneration unit .............. 34
4.4 Discussion .................................................................................................................................... 34
Chapter 5: Developing the simulation model ....................................................................................... 37
5.1 The TEG injection process ........................................................................................................... 37
5.2 Regular absorber process ........................................................................................................... 38
5.3 The regeneration process ........................................................................................................... 39
5.4 Using different chemicals for dehydration ................................................................................. 40
Chapter 6: Simulation results ................................................................................................................ 43
6.1 Comparing the TEG injection process to absorber dehydration ................................................ 43
6.1.1 Dehydration performance ................................................................................................... 43

ix
6.1.2 Energy consumption ............................................................................................................ 45
6.1.3 HC emission .......................................................................................................................... 47
Summarized ...................................................................................................................................... 48
6.2 Using different absorbents for the TEG injection process .......................................................... 48
6.2.1 Dehydration performance ................................................................................................... 48
6.2.2 Energy consumption ............................................................................................................ 50
6.2.3 Loss of absorbent ................................................................................................................. 51
6.2.4 HC emissions from the regeneration column ...................................................................... 53
Summarized ...................................................................................................................................... 54
6.3 Discussion .................................................................................................................................... 55
Chapter 7: Designing a TEG injection system ....................................................................................... 57
7.1 Dehydrating for pipeline specifications ...................................................................................... 57
7.2 The TEG injection process ........................................................................................................... 58
7.2.1 The regeneration process .................................................................................................... 58
7.2.2 The absorption process ........................................................................................................ 61
7.2 Data from existing TEG dehydration process.............................................................................. 63
7.3 Comparing TEG injection and absorber dehydration ................................................................. 64
Overview ............................................................................................................................................... 67
Conclusion ............................................................................................................................................. 69
References ............................................................................................................................................ 71
Appendices ............................................................................................................................................ 75
Appendix A: Separator design ........................................................................................................... 75
Appendix B: Derivation of functions for sizing separators ............................................................... 83
Appendix C: Design of a glycol regeneration unit ............................................................................. 87
Appendix D: Derivation of equations for designing a TEG injection process ................................... 91
Appendix E: Process Flow Diagram for Drizo and Coldfinger processes ........................................... 93
Appendix F: The Cubic-Plus-Association (CPA) Equation of State (EoS) ........................................... 95
Appendix G: Introduction to Aspen HYSYS 2006 .............................................................................. 97
Appendix H: PFD for TEG injection dehydration concept ................................................................. 99
Appendix I: Reference gas composition .......................................................................................... 101
Appendix J: Calculations for chapter 7 ............................................................................................ 103

x

xi
List of figures Figure 1.1: The different sections of a separator……………………………………………………………………….. p.3 Figure 1.2: Different types of inlet diverters………………………………………………………………………………. p.4 Figure 1.3: A typical wire-mesh mist extractor…………………………………………………………………………… p.5 Figure 1.4: Schematics of a typical horizontal separator……………………………………………………………. p.6 Figure 1.5: The different sections of a separator……………………………………………………………………….. p. 7 Figure 1.6: Centrifugal separator……………………………………………………………………………………………….. p.8 Figure 1.7: Horizontal three phase separator…………………………………………………………………………….. p.9 Figure 1.8: Horizontal separator with installed sand jets…………………………………………………………… p.10 Figure 1.9: Schematics for the Degasser Inline separator………………………………………………………….. p.12 Figure 1.10: Schematics for the Deliquidiser inline separator……………………………………………………. p.13 Figure 1.11: Schematics for the Twister BV Supersonic Separator…………………………………………….. p.14 Figure 2.1: Typical glycol regeneration system………………………………………………………………………….. p.15 Figure 2.2: Gas flow through the different types of trays………………………………………………………….. p.17 Figure 2.3: Examples of random packing…………………………………………………………………………………… p.18 Figure 2.4: Examples of structured packing……………………………………………………………………………….. p.18 Figure 2.5: A kettle type reboiler employed in a regeneration still……………………………………………. p.19 Figure 2.6: Schematics of a glycol driven pump…………………………………………………………………………. p.20 Figure 2.7: Example of the result of severe corrosion on a pipe inlet………………………………………… p.20 Figure 2.8: Glycol with and without filtering………………………………………………………………………………. p.21 Figure 3.1: Schematics for the ProPure compact mixer……………………………………………………………… p.25 Figure 3.2: Drop shattering as We>Wecrit…………………………………………………………………………………… p.26 Figure 3.3: Assembled ProPure compact mixer………………………………………………………………………….. p.26 Figure 4.1: The TEG injection dehydration concept……………………………………………………………………. p.29 Figure 4.2: Alternative regeneration process using hot stripping gas…………………………………………. p.31 Figure 4.3: Alternative regeneration process using staged injection of hot stripping gas…………… p.32 Figure 4.4: Alternative regeneration process using an absorber for regeneration……………………... p.33 Figure 4.5: Using piping as heat exchanger………………………………………………………………………………… p.34 Figure 6.1: Water content of dehydrated gas (TEG injection)…………………………………………………….. p.43 Figure 6.2: Water content of dehydrated gas (Absorber) ………………………………………………………….. p.43 Figure 6.3: Water content of dehydrated gas w/stripping gas (TEG injection) …………………………… p.44 Figure 6.4: Water content of dehydrated gas w/stripping gas (Absorber) …………………………………. p.44 Figure 6.5: Heat requirement for reboiler………………………………………………………………………………….. p.45 Figure 6.6: Heat requirement for reboiler when introducing stripping gas………………………………… p.46 Figure 6.7: HC emissions from regeneration column…………………………………………………………………..p.47 Figure 6.8: Water content in the dehydrated gas for the different absorbents………………………….. p.49 Figure 6.9: Water content for the different glycols when using stripping gas…………………………….. p.50 Figure 6.10: Heat required for the reboiler for the different glycols…………………………………………… p.51 Figure 6.11: Total loss of absorbent for the dehydration process………………………………………………. p.52 Figure 6.12: Total loss of absorbent when using stripping gas……………………………………………………. p.53 Figure 6.13: HC emissions from the regeneration column for the different glycols……………………. p.54 Figure A.1: The different sizes for a horizontal separator…………………………………………………………… p.76 Figure A.2: Forces acting upon a falling droplet in a vertical separator………………………………………. p.78 Figure E.1: PFD for glycol dehydration process with Drizo regeneration unit…………………………….. p.93 Figure E.2: PFD for glycol dehydration process with Coldfinger regeneration unit…………………….. p.93 Figure H.1: PFD for the TEG injection concept w/regeneration system………………………………………. p.99 Figure H.2: PFD for conventional absorber dehydration w/regeneration process………………………. p.100

xii
List of formulas Formula 3.1: Weber number…………………………………………………………………………………………………..... p.26 Formula 3.2: Reynolds number………………………………………………………………………………………………….. p.26 Formula A.1: Falling velocity…………………………....…………………………....…………………………................. p.75 Formula A.2: Falling velocity alternative formulation…………………………....………………………….......... p.76 Formula A.3: Gas capacity constraint horizontal separator…………………………....…………………………. p.76 Formula A.4: Liquid capacity constraint horizontal separator…………………………....……………………… p.77 Formula A.5: Slenderness ratio…………………………....…………………………....…………………………............. p.77 Formula A.6: Total length horizontal separator…………………………....…………………………....…………….. p.77 Formula A.7: Gas capacity constraint vertical separator…………………………....…………………………..... p.78 Formula A.8: Liquid capacity constraint vertical separator…………………………....………………………….. p.78 Formula A.9: Total length vertical separator…………………………....…………………………....…………………. p.78 Formula A.10: Falling velocity liquid/liquid…………………………....…………………………....…………………… p.79 Formula A.11: Liquid capacity horizontal 3-phase separator…………………………....………………………. p.79 Formula A.12: Maximum height of liquid layer horizontal 3-phase separator…………………………... p.79 Formula A.13: Settling constraint vertical 3-phase separator…………………………....……………………… p.80 Formula A.14: Liquid capacity constraint vertical 3-phase separator…………………………....…………… p.80 Formula A.15: Minimum wall thickness…………………………....…………………………....………………………… p.80 Formula A.16: Minimum wall thickness for ellipsoidal head…………………………....………………………… p.81 Formula C.1: Outlet temperature from overhead condenser………………....………………………....……… p.87 Formula C.2: Required area for heat transfer………………....………………………....………………………....…. p.87 Formula C.3: Outlet temperature glycol/glycol HX………………....………………………....………………………p.88 Formula C.4: Required area for heat transfer for glycol/glycol HX………………....……………………….... p.88 Formula C.5: Actual number of trays………………....………………………....………………………....……………… p.89 Formula C.6: Required heat for reboiler………………....………………………....………………………....…………. p.90 Formula F.1: CPA EoS………………....………………………....………………………....………………………....…………. p.95 Formula F.2: Fraction of sites that do not form bonds with other sites………………....………………….. p.95 Formula F.3: Radial distribution function………………....………………………....………………………....……….. p.95 Formula F.4: Energy parameter for CPA………………....………………………....………………………....…………. p.95 Formula F.5: Geometric mean rule………………....………………………....………………………....………………… p.96 Formula F.6: Regular mean………………....………………………....………………………....………………………....… p.96 Formula F.7: Elliot combining rule………………....………………………....………………………....………………….. p.96 Formula F.8: Elliot combining rule………………....………………………....………………………....………………….. p.96
List of tables Table 1.1: Performance data for the CDS-Gasunie Degasser………………………………………………………. p.12 Table 1.2: Performance data for the CDS-Gasunie Deliquidiser………………………….……………………… p.13 Table 6.1: Comparing TEG injection to absorber dehydration……………………………………………………. p.48 Table 6.2: Comparison of operation data for different absorbents……………………………………………. p.54 Table 7.1: Operating conditions for the TEG injection process………………………….……………………….. p.58 Table 7.2: Weight, volume and footprint for the regeneration process……………………………………… p.60 Table 7.3: Estimated data for the TEG injection process………………………….………………………….…….. p.62 Table 7.4: Operational data for the TEG dehydration process at the Kristin platform………………… p.63 Table 7.5: Comparing TEG injection and conventional absorber dehydration……………………………. p.64 Table I.1: Reference gas composition………………………….………………………….…………………………………. p.101

xiii
Abbreviations ASME - American Society of Mechanical Engineers BTEX - Collective term for benzene, toluene, ethyl benzene and xylene isomers CFD - Computational Fluid Dynamics CHIGP - Chemicals in Gas Processing, research project at DTU CPA - Cubic Plus Association Equation of State DEG - Di Ethylene Glycol DTU - Technical University of Denmark ECR - Elliot Combining Rules EoS - Equation of State gal - Gallon gpm - Gallons per minute HC - Hydrocarbon HETP - Height Equivalent to Theoretical Plate HX - Heat exchanger LMTD - Logarithmic Mean Temperature Difference [K] LNG - Liquefied Natural Gas MAWP - Maximum Allowable Working Pressure MEG - Mono Ethylene Glycol micron - Micrometer (μm) [10-6m] MMscf - Million standard cubic feet MMscfd - Million standard cubic feet daily MMscm - Million standard cubic meter PFD - Process Flow Diagram ppm - Parts per million psig - Pound per square inch gauge SAFT - Statistical Association Fluid Theory scf - Standard cubic feet SG - Specific gravity SRK - Soave-Redlich-Kwong Equation of State TEG - Tri Ethylene Glycol TTG - Tetra Ethylene Glycol VOC - Volatile organic compound wt% - Percent by weight

xiv
Nomenclature AG - Area available for gas [m2] AHT - Heat transfer area [m2] AL - Area available for liquid [m2] b - Component constant for CPA [m3/kmole] cgl - Heat capacity of the glycol solution [J/kg*K] cP,G - Heat capacity of gas at constant pressure [J/kg*K] CD - Newtonian friction factor [-] dfil - Characteristic filament dimension [-]
dm - Diameter of small droplet [m] Di - Inner diameter [m] g - Acceleration of gravity, approximately 9.81 [m/s2] g( ρ ) - Radial distribution function for CPA
hfg - Heat of vaporization [J/kg] hL - Height of liquid volume [m] kij - Interaction parameter for CPA K1 - Semi-empirical constant for Sounders-Brown equation [m/s] L - Total length [m] Leff - Effective length usable for separation [m] mgl - Mass flow glycol [kg/s] mreflux - Mass flow reflux [kg/s] M - Mass [kg] NA - Number of actual trays NTH - Number of theoretical trays P - Pressure [Pa] q - Heat flow [J/s] (=[W]) QG - Volume flow gas [m3/s] QL - Volume flow liquid [m3/s]
R - Universal gas constant [kJ/kmole*K]
tG - Retention time gas [s] tL - Retention time liquid [s] tW - Wall thickness [m] Tcrit - Critical temperature [K] Tgl - Temperature of the glycol solution [K] TSAT - Saturation temperature [K] U - Overall heat transfer coefficient [W/m2*K] UG - Velocity gas [m/s] UL - Velocity liquid [m/s] Urel - Relative velocity between gas and liquid [m/s] Ut - Falling velocity of droplet relative to gas [m/s] Ut,L - Falling velocity of droplet relative to liquid [m/s] v - Molar volume [m3/kmole]
VL - Volume available for liquid [m3] We - Weber number [-] Wecrit - Critical Weber number [-] wt% - Percent by weight xi - Molar fraction of substance I [-] XAi - Fraction of sites belonging to molecule i that do not bond with other sites

xv
α(T) - Energy parameter for CPA [Pa*m6/kmole2] βAiBj - Association volume for CPA [-] ΔAiBj - Association strength for CPA [m3/kmole] εAiBj - Association energy for CPA [kJ/kmole] ηj - Joint efficiency [-] ηt - Tray efficiency [-] μ - Dynamic viscosity [cP – centi Poiseuille] ρ - Molar density [kmole/m3]
ρG - Density gas [kg/m3] ρL - Density liquid [kg/m3] ρmix - Density of mixture [kg/m3] ρW - Density of water [kg/m3], approximately 1000 kg/m3
σsurf - Surface tension [N/m2] σmax - Maximum allowable stress [N/m2]

xvi

1
Introduction Water is an impurity found in all natural gas reservoirs to various extents all across the world (Guo &
Ghalambor (2005) [1]). However, as long as the water is in vapor phase it presents no danger, but as
soon as liquid water is formed several problems arise. High pressure hydrocarbons together with
liquid water are able to form an ice like structure called hydrates at ambient temperatures, which
can plug the entire pipe or channels in process equipment if allowed to develop. Sour gases, another
common impurity of natural gas, mixed with liquid water are corrosive, and of course if the
temperature gets low enough, regular ice can form (Kohl & Nielsen (1997) [1]). The solution is to
reduce the water concentration enough, so that the water present is in vapor form for all conditions
encountered throughout the process. For hydrate inhibition use of chemicals is also possible, as is
most often employed for pipeline transport from the wellhead to the platform or land based
processing facility.
The most commonly used processes for dehydration is absorption into a liquid or adsorption into a
solid, but cooling and compression of the gas can also be used (Kohl & Nielsen (1997) [1]).
Absorption is used for dehydration when the requirement for water content is moderate, typically
for dehydration before sending the gas through long distance pipelines. Adsorption can produce
extreme dryness in the gas, and is used before low temperature processes (e.g. liquefaction or heavy
hydrocarbon extraction). This paper will focus on absorption.
Today most absorption processes uses glycol, more specifically tri ethylene glycol (TEG), in an
absorption column where lean TEG (lean in water) is introduced from the top while wet gas flows in
through the bottom (Arnold & Stewart (1999) [1]). As the TEG flows down the column over trays or
packing, water is absorbed from the rising gas, letting dehydrated gas flow from the top of the
column, while rich TEG (rich in water) exits from the bottom. The rich TEG is regenerated by
reducing the pressure and increasing the temperature, before it is re-injected into the absorption
column again. This equipment is very large and heavy, two major cons on offshore platforms.
Throughout my project thesis (Bråthen (2007)) I explored different ways of improving upon the
conventional absorption process. The result was the proposition for an alternative dehydration
concept; injecting TEG directly into the gas stream and utilizing the piping as a contactor. Three
stages of injection and extraction was found to be the most promising concept, and simulations
were conducted to compare the concept to regular absorption dehydration. It was found that the
flow rate of TEG had to be considerably larger for the TEG injection concept to produce the same
dryness as the absorber process, thus reducing the potential of the alternative concept (Bråthen
(2007)).
This paper will try to further develop the TEG injection concept by introducing inline separators,
compact mixer units, and improving upon the regeneration process as well, to potentially make the
concept more competitive when compared to conventional dehydration.
First a literature review of separators and the glycol regeneration process is presented, to better be
able to suggest improvements and to discuss the suggested improvements. Then the compact
mixing unit from ProPure is presented, before further development of the TEG injection process is
discussed. Chapter 5 describes the making of the HYSYS simulation model, and lists all the

2
assumptions and decisions made. Simulations comparing the alternative concept to conventional
dehydration, as well as simulations using different absorption mediums for TEG injection are
presented in chapter 6. Thereafter, based on data from the simulation model, the different
components of the TEG injection process are designed using the design models from appendix A and
C, and the results compared to conventional absorber dehydration. Finally an overview of the paper
is given before a conclusion for the TEG injection process is reached.

3
Chapter 1: Separators Separators play a very important part in most processing facilities found today, and is also a
fundamental part of the proposed alternative natural gas dehydration concept. Their use is to
extract the liquid glycol and water mixture from the gas for the various stages, so the liquid can be
recycled to the preceding stage or sent to regeneration (depending on which stage), and the
dehydrated gas passed to the next stage or further processing. The type of separator used depends
on the tolerances for liquid carry-over, pressure drop and available space, among other factors.
Separators with very high gas to liquid ratio are often referred to as gas scrubbers or simply
scrubbers. They are often used upstream of equipment unable to handle liquids, e.g. compressors
and contactor towers, or downstream of equipment involving liquids or where liquid might form,
e.g. sour gas treating, glycol dehydration units or coolers. As the glycol concentration when injected
in the natural gas stream is very small, the separators used in the concept can therefore be referred
to as scrubbers.
This chapter gives an introduction to the function of separators and also operation problems
experienced during operation. First the function of the separator is explained, discussing the
different types of separators and the most common internal equipment. Secondly typical problems
experienced with operating separators are described, followed by possible solutions. A short
discussion of three-phase separators then follows, describing the differences compared to two-
phase separators. Finally an introduction to inline separation is presented. Design procedures for the
described separator types can be found in appendix A.
1.1 Function
Generally two types of separators are most commonly used; vertical and horizontal with cylindrical
shell (Arnold & Stewart (2008) [1]). Other separator designs include spherical-, centrifugal-, venturi-,
filter- and double-barrel horizontal separators. Vertical, horizontal and centrifugal separators will be
discussed here, while those interested in other types are referred to Arnold & Stewart (2008) [1].
Regardless of design, each two-phase separator contains four major sections (except centrifugal
separators); inlet diverter, liquid collection, gravity settling and mist extractor. See figure 1.1 for an
illustration showing the different sections for a vertical separator.
Figure 1.1: The different sections of a separator (adapted from Arnold & Stewart (1998):p.104)

4
1.1.1 Inlet diverter
The inlet diverter is the first section encountered by the process stream, located just inside the inlet
of the separator. Its purpose is to absorb the momentum from the stream by altering the direction
of flow, and at the same time working as the first stage of separation. There are many types of inlet
diverters, but they can be classified in three main groups; baffle plates, centrifugal diverters and
elbows illustrated in figure 1.2 (Arnold & Stewart (2008) [1]).
Baffle plates comes in many shapes and forms, including cones, spherical disks, angle irons and flat
plates, about anything able to cause a sudden change in the direction of the flow. The heavier
droplets entrained in the gas are not able to adjust for this sudden change in flow direction, and will
therefore collide with the inlet diverter, coalesced and fall into the bottom of the separator.
Centrifugal inlet diverters utilize centrifugal forces, created either by a tangential inlet or a cyclonic
chimney. Droplets are then forced to the walls by the centrifugal forces, where they coalesced and
flow to the bottom of the separator. Centrifugal inlet diverters are the most common in natural gas
processing (Guo & Ghalambor (2005) [2]), but baffles are also used. This choice depends on the
amount of liquid in the gas, the gas velocity, if slug flow is possible and the regularity of the stream.
Centrifugal inlet diverters are very dependent on the flow rate of the gas, as they will not work
properly for low flow rates.
Elbows consist merely of a bent pipe section serving the same purpose as a baffle plate.
Figure 1.2: Different types of inlet diverters (adapted from Arnold & Stewart (1998):p.109,110)
1.1.2 Liquid collection section
The liquid collection section of the separator, located in the bottom of the vessel, is where the liquid
is processed. The liquid has to stay in this section for a given time (retention time) to let the gas
bubbles entrained in the liquid escape to the gravity settling section. Retention time is a function of
total liquid capacity, feed flow rate, required degree of separation, and the difference in density
between the liquid and the gas (Arnold & Stewart (2008) [1]). When designing a separator, the
retention time dictates the required size of the liquid collection section. If there is a problem with
slug flow, the liquid collection section also acts as a surge volume and has to be sized accordingly.
Depending on the operating conditions for the separator, additional equipment may also be
necessary in the liquid collection section. For horizontal separators waves can form on the liquid
surface because of intermittent slugs, irregular liquid flow or external movement (e.g. on floating
structures), and wave breakers must be installed. A wave breaker consists merely of perforated
baffles or plates placed perpendicular to the flow. It is very important to prevent waves from
forming, as waves can prevent weirs, liquid level controllers and level safety switches from operating
properly (Arnold & Stewart (2008) [1]).

5
Irregular liquid flow can also result in low liquid levels in the liquid collection section, potentially
creating a vortex near the liquid outlet which can suck gas into the liquid outlet line. This can be
prevented by installing a vortex breaker, e.g. a cylinder with radially directed flat plates.
1.1.3 Gravity settling section
In the gravity settling section the gas is allowed a greater cross section area, thus reducing the
velocity of the gas, thereby also reducing the turbulence. As a result of this, the drag force from the
gas on the liquid droplets will decrease (See e.g. White (2003):p.478), and droplets will fall to the
liquid surface by the force of gravity. Parallel plates can also be installed to further decrease the
turbulence (Asheim & Herfjord (1984)), and also mitigate foaming if that is a problem.
The size of the gravity settling section is dependent on how small droplets that needs to be
separated out. A common design criterion for a separator is to remove all liquid droplets greater
that 100 – 140 microns, while for a scrubber removal of droplets greater than 500 microns might be
sufficient (Arnold & Stewart (2008) [1]). The background for this criterion is to remove enough of the
liquid so that the mist extractor will not become flooded, and thereby function properly.
1.1.4 Mist extractor section
The mist extractor section is the final separation stage in a separator, and is designed to coalesce the
smallest droplets so that they can be extracted from the gas stream. Intricate flow patterns force the
droplets onto the solid surfaces, as the droplets are not able to adjust to the constant changes in
direction. There are different types of mist extractors including wire-mesh, corrugated plates and
hooked vanes, but the wire-mesh outnumbers all of the others (Arnold & Stewart (2008) [1]). The
wire-mesh units are knitted from very thin metal wires (0.1 – 0.28 mm), and features a very large
surface area for a given volume (See figure 1.3).
Figure 1.3: A typical wire-mesh mist extractor (adapted from Arnold & Stewart (1998):p.113)
Effectiveness of the wire-mesh unit is strongly dependent on the gas velocity being close to the
design velocity. Too high velocity causes the knocked out liquids to be re-entrained, while too low
velocity causes the gas to just drift through the wire-mesh without knocking out any liquids (Arnold
& Stewart (2008) [1]).
1.2 Configurations
As mentioned earlier, separators appear in a lot of different configurations. The following
paragraphs will give a short introduction to horizontal, vertical and centrifugal separators.

6
1.2.1 Horizontal separator
Horizontal separators are usually the first choice because of their low cost, due to their smaller size
for a given gas and liquid flow rate (Guo & Ghalambor (2005) [2]). The feed enters from the left side
(See figure. 1.4) and encounters the inlet diverter, forcing the biggest drops out of the gas stream.
The feed stream continues horizontally through the gravity settling section with droplets
continuously falling toward the liquid/vapor interface. Horizontal separators are usually half filled
with liquid, thereby providing the largest possible liquid/vapor interface (Arnold & Stewart (2008)
[1]).
As horizontal separators are mounted horizontally, there is always a force acting towards the liquid
interface regardless of the gas velocity. There is however still a possibility for liquid carry-over, if the
liquid droplet has not reached the liquid surface before the gas outlet (Asheim & Herfjord (1984)).
For a proper designed horizontal separator, this requirement is generally met with gas velocities
greater than the terminal velocity (See formula A.1 in appendix A) (Asheim & Herfjord (1984)).
Figure 1.4: Schematics of a typical horizontal separator (adapted from Arnold & Stewart (1998):p.103)
After the gravity settling section the gas enters the mist extractor, where the final separation takes
place. The mist extractor is normally mounted horizontally with the gas flowing vertical upwards.
This is due to problems with flooding when mounted vertically (Arnold & Stewart (2008) [1]).
Horizontal separators are commonly used in streams with high gas to liquid ratios, foaming well
streams or liquid-liquid separation (Guo & Ghalambor (2005) [2]). The large liquid/gas interface
enhances both gravity separation and helps gas bubbles escape from the liquid, but at the same time
makes the separator vulnerable to liquid slugs and liquid surges. The separator also takes up a larger
footprint than a vertical separator, and solids can deposit on the bottom of the vessel (GPSA (2004)
[1]). A horizontal separator with an attached second barrel for liquid is known as a double barrel
horizontal separator.
Advantages:
- Cheaper to build for a given flow rate compared to other configurations
- Very large liquid/vapor interface
- Can generally handle larger gas velocities than vertical separators
- Better at handling foaming

7
Disadvantages:
- Large footprint
- Limited surge capacity
- Possible problem with solid deposition
1.2.2 Vertical separators
Vertical separators occupy considerable less floor space than horizontal separators, thereby gaining
an advantage for offshore processing facilities where space is limited. As there is a large vertical
distance between the feed stream inlet and the gas outlet, chances for liquid to be re-entrained and
carried out of the gas inlet is also much smaller. This also makes the vertical separator less
vulnerable to liquid slugs (Guo & Ghalambor (2005) [2]).
The feed stream enters from the left side as for the horizontal separator (See figure 1.5), and hits the
inlet diverter. Large droplets are flung into the liquid collection section by the abrupt change in
direction, while the gas and the smaller droplets flow onward to the gravity settling section. As the
force of gravity and drag acts in opposite directions of each other, the velocity has to be limited to
reduce the drag force, allowing droplets to fall to the liquid collection section. The drag force
exerted by the gas on the liquid droplets is proportional to the square of the gas velocity (See e.g.
White (2003):p.478). Gas velocity is proportional to the vessel diameter for a given volume stream.
Thus, for the force of gravity to be greater than the drag force, the diameter has to be larger than a
given minimum diameter (See appendix A).
Figure 1.5: The different sections of a separator (adapted from Arnold & Stewart (1998):p.104)
From the gravity settling section the gas flows upwards to the mist extractor for the final separation
stage. This section is identical to the horizontal separator, with the gas flowing upwards. The gas
then leaves the separator through the top.
Vertical separators are commonly used where the gas to liquid ratio is low to intermediate, or if
there is a problem with impurities or solids in the stream. They are also used where the gas to liquid
ratio is very high (e.g. gas scrubbers) (Arnold & Stewart (2008) [1]). As they take up less floor space
than horizontal separators, they are also frequently employed in facilities with limited space. They
are however more costly to produce than horizontal separators (Guo & Ghalambor (2005) [2]).
Advantages:
- Small footprint

8
- Good at handling solids
- Large surge capacity
Disadvantages:
- Expensive
- Terminal velocity for the liquid droplets dictates a minimum diameter
- Small liquid/vapor interface
1.2.3 Centrifugal separators
Instead of using gravity to separate vapor and liquid,
the centrifugal separator utilizes the large centrifugal
forces created by rotating a stream at high velocities
for separation. This force ranges from 5 to 2500 times
the force of gravity, depending on the flow rate of the
stream and the diameter of the pipe (Arnold & Stewart
(2008) [1]). It is fundamentally different from horizontal
and vertical separators, and does not contain the same
sections as previously described.
The inlet stream enters through a tilted tangential inlet
(See figure 1.6) causing the gas to spiral down towards
the liquid outlet. To stratify the inlet stream and
enhance separation, the inlet pipe is inclined at an
optimum angle determined by CFD analysis (Arnold &
Stewart (2008) [1]). As the gas reaches the bottom, most of the droplets have been flung onto the
walls by the centrifugal forces, and the liquid free gas can leave upwards through the centre. The
liquid drains down from the walls and leaves through the liquid outlet located at the bottom.
Centrifugal separators are not capable of removing liquid down to the same concentrations as
conventional horizontal or vertical separators, and are therefore best suited for bulk separation
(Arnold & Stewart (2008) [1]). The high velocity swirl also makes them vulnerable to erosion from
solid particles on the pipe walls. Today centrifugal separators are frequently employed downstream
of glycol absorption columns for glycol recovery (Arnold & Stewart (2008) [1]), or where space is
limited, e.g. offshore platforms.
There are also several special types of centrifugal separators available on the market today, e.g. the
Twister supersonic separator (Twister BV (undated)), and the CDS-Gasunie Cyclone (CDS Separation
Technology (undated)). See chapter 1.5 for an introduction.
Advantages:
- Small and compact design
- No moving parts
- Little maintenance
- Low cost compared to conventional technology
Figure 1.6: Centrifugal separator (adapted from
Arnold & Stewart (2008):p.159)

9
Disadvantages:
- Sensitive to flow rate; Too low flow rate results in a low centrifugal force hampering
separation
- Requires a greater pressure drop
- Each unit must be tailor made for each project
1.3 Three-phase separators
A three-phase separator works in the same
way as a two-phase separator, except that
in addition to separating the liquid from
the gas, the separator must also divide the
liquid into separate phases. This requires
longer retention times for the liquid and
also additional equipment in the liquid
collection section. Both vertical and
horizontal configurations can be used,
subject to the same considerations as for
two-phase separation.
To separate the two liquids, the use of weirs is often employed (See figure 1.7) (Arnold & Stewart
(2008) [3]). Because of different densities of the two liquids, the lightest liquid will after a certain
time float on top of the heavier liquid. By designing a weir to have a height greater than the
thickness of the heaviest liquid layer, the only liquid allowed to overflow the weir is the lightest. The
use of weir requires however a very strict control of the liquid levels, as too low or too high liquid
levels can result in re-mixing of the liquids through the outlets.
In addition to weirs, coalescing plates can also be installed in the liquid collection section to aid
liquid separation. The coalescing plates will increase the droplets entrained in both the liquids,
enhancing gravity separation and thereby reducing the required retention time, again reducing the
required size of the separator (assuming that size is constrained by liquid flow rate) (Arnold &
Stewart (2008) [3]). The liquid retention times for three phase separators are generally longer than
for two phase separators and retention times as long as 30 to 45 minutes is normal.
1.4 Operation problems
Several problems can arise when operating a separator, most subject to the fluid composition and
the separation technique used. Sand and other solids carried with the feed stream can deposit on
the vessel bottom, paraffin or other plugging elements may plug the mist extractor, liquid HC may
cause foaming, liquid can be carried-over through the gas outlet, or gas can be carried-under
through the liquid outlet. Now each of the problems will be addressed more thoroughly, and
possible solutions/prevention techniques presented.
Figure 1.7: Horizontal three phase separator (adapted from
Arnold & Stewart (1998):p.137)

10
1.4.1 Sand deposition
Sand or other solid particles can be carried from the natural gas reservoir, through pipelines and into
the inlet separator of the first processing facility (e.g. an offshore platform). If the separator is not
properly designed, the solids could plug separator internals or accumulate at the bottom of the
separator, thereby decreasing the volume available for the liquid. For vertical separators a cone can
readily be placed at the bottom of the separator for sand collection, and the sand can then be
removed periodically through an access hole, or continuously through a separate outlet (Arnold &
Stewart (2008) [1]). Alternately it can also be transported with the liquid to be handled by
downstream equipment. Using a cone is however only done in cases where major problems with
sand are anticipated. For minor sand problems, the separator can be periodically cleaned internally
with steam or water, washing the sand out with it.
Avoiding sand problems in horizontal separators are harder, as the sand easily deposits along the full
length of the separator, and not only around one outlet. One possible solution is to install sand jets
and drains at regular intervals (normally less than 1.5 m (Arnold & Stewart (2008) [1])) to flush out
the deposited solids (see figure 1.8). Liquid (normally produced water) is then sprayed through the
sand jets onto the deposited solids, so the solids break up and drains with the liquid out of the
vessel.
Figure 1.8: Horizontal separator with installed sand jets (adapted from Arnold & Stewart (2008):p.175)
Sand deposition is normally not an issue for centrifugal separators, as the velocity throughout the
entire vessel is very high, preventing the sand from settling out. The fast rotating sand particles may
however lead to excessive erosion of the vessel walls, requiring units where sand/solids may be
present to be manufactured from special materials.
1.4.2 Plugging of mist extractor
Paraffin or other plugging elements can accumulate in tight passages through the separator, and
severely hamper separation efficiency. A wire-mesh mist extractor exposed to paraffin over time can
for example plug and be rendered useless, resulting in liquid carry-over. Coalescing plates in the
gravity settling section can also be plugged, leading to less cross section area available to the gas
stream, leading to higher gas velocities and poor separation (Arnold & Stewart (2008) [1]). To
counter this problem, alternative mist eliminators should be employed, and the vessel equipped
with manways or handholes to allow steam, solvent or other types of cleaning of the separator
internals.

11
1.4.3 Foaming
Foaming is a dispersion of gas in a liquid created by agitation (Toshiba (undated)). In most cases, the
foam will rapidly break up as the bubbles expand and the surface tension increases, causing the
bubbles to rupture. If this is completed before the outlet of the unit, the foaming may present no
problem to the unit`s operation (Arnold & Stewart (2008) [1]). However, some components tend to
stabilize the foam, increasing the lifespan of the bubbles and ultimately leading to bubbles being
carried over from the separator. For glycol systems, corrosion inhibitors, solids, salt water, thermal
decomposition products and degradation products from oxidized glycol have been found to stabilize
foam (Toshiba (undated), Kohl & Nielsen (1997) [1]). Typical foaming problems reported include
large liquid carry-over, off-spec product, and severely decreased unit efficiency caused by reduced
throughput (Toshiba (undated)).
The priority when experiencing foaming problems should be to locate the source of the foam
stabilizing components and prevent them from entering the unit. For immediate foam prevention
however, anti-foam chemicals can be introduced in the process stream. The use of anti-foam
chemicals requires very careful mixing, as excessive dosage of anti-foaming chemicals actually can
increase the foaming (Arnold & Stewart (2008) [1]). Coalescing devices (e.g. parallel plates) can also
be used to break up the foam.
1.4.4 Carry-over of liquid through the gas outlet
Regardless of how finely tuned a specific separator design is, there will always be traces of liquid left
in the gas (The Two-Phase Flow Committee at NTH Lecture Series No.9 (1984)). The designers goal
for a separator is however to minimize this amount, as liquid might damage downstream equipment,
represent economical losses, or result in off-spec product. Even though a separator is properly
designed, carry-over might still occur. Faulty liquid level control resulting in high liquid levels,
damage to vessel internals, foaming, plugged liquid outlets or excessive flow rate might all result in
liquid carry-over (Arnold & Stewart (2008) [1]).
Carry-over is best prevented by using a properly designed mist extractor, paired with a liquid high
level safety sensor that shuts of inlet flow if the liquid level reaches too high (Arnold & Stewart
(2008) [1]).
1.4.5 Carry-under of gas through the liquid outlet
Low liquid levels, vortexing and liquid level control failure, are reason that can lead to gas escaping
through the liquid outlet. This can result in extensive damage to downstream equipment, e.g.
cavitation on pump blades or vessel rupture because of over-pressure. Carry-under can be
prevented by using vortex breakers and a liquid low level safety sensor that shuts of liquid outflow if
the liquid level becomes too low (Arnold & Stewart (2008) [1]).
1.5 New technology – inline separation
As space on offshore production facilities is very limited and with subsea processing becoming more
and more popular, the need for compact and durable process equipment is growing fast. Inline
separators is one example of such equipment, replacing big separator tanks with units able to be
installed directly in the pipeline (hence the name inline). Inline equipment is also very attractive for

12
de-bottlenecking existing units. This chapter will give a short introduction to the CDS inline
separator, as well as the Twister supersonic separator.
1.5.1 The CDS-Gasunie cyclone
The CDS-Gasunie cyclone is an inline separator utilizing centrifugal forces to separate liquid and
vapor developed by CDS and StatoilHydro. The cyclone is based on theory developed for centrifugal
separators, and can be regarded as a mono-cyclone (spirals in only one direction, contrary to up and
down in regular centrifugal separators). It comes in two versions; the Degasser for removal of vapor
from a continuous liquid stream, and the Deliquidiser for removal of liquid from a continuous gas
stream (Schook & Håland (undated)).
The Degasser
The process stream enters from the left (See figure 1.9) and is passed through a mixing element to
prevent a stratified (layered) stream from entering the vessel, as stratified flow will reduce the
separation efficiency considerably. A stationary swirling element brings the stream into rotation and
because of the difference in density, the liquid is forced to the walls while the gas stays in the center.
The gas leaves the vessel through an annular section in the cyclone inner region, and is extracted to
the vertical scrubber section on top of the Degasser. In the scrubber section the small amount of
liquid entrained in the gas is separated from the gas and re-injected into the liquid stream. Finally
the processed liquid is routed through a de-swirling element to recover pressure and reduce the
pressure drop over the unit (Schook & Håland (undated)).
Figure 1.9: Schematics for the Degasser Inline separator (adapted from Schook & Håland (undated):p.4)
Table 1.1: Performance data for the CDS-Gasunie Degasser (adapted from Schook & Håland (undated):p.4)
Maximum diameter (Di) Unlimited
Length 8 - 10 * Di
Height 4 - 6 * Di
Liquid load Unlimited
Gas load < 55% volume fraction
Pressure drop 0.5 - 2.5 bar
Separation efficiency 90 - 99% gas from liquid
Liquid turndown 50 %
Gas turndown 55 - 0 %

13
All Degasser units are tailor-made for each process, able to optimize for pressure drop, separation
efficiency, turndown or a combination of these parameters (Schook & Håland (undated)).
The Deliquidiser
As for the Degasser, the process stream enters from the left (See figure 1.10) and is mixed through a
mixing element to prevent stratified flow. A stationary swirl element brings the fluid into rotation,
forcing the liquid to form a film on the pipe walls. The gas is removed through a pipe inserted into
the center of the unit, as the liquid enters the space between the original pipe wall and the gas pipe
and is collected in a vertical boot section. Some gas will inevitably follow the liquid, and is removed
from the liquid in the boot and re-injected into the gas stream. A de-swirling element is located close
to the exit of the unit to recover pressure and reduce the pressure drop over the unit (Schook &
Håland (undated)).
Figure 1.10: Schematics for the Deliquidiser inline separator (adapted from Schook & Håland (undated):p.5)
Table 1.2: Performance data for the CDS-Gasunie Deliquidiser (adapted from Schook & Håland (undated):p.5)
Maximum diameter (Di) Unlimited
Length 6 - 8 * Di
Height 4 - 6 * Di
Gas load Unlimited
Liquid load < 10% volume fraction
Pressure drop 0.4 - 0.7 bar
Separation efficiency 90 - 99% liquid from gas
Gas turndown 50 %
All Deliquidiser units are also tailor-made for each process, able to optimize for pressure drop,
separation efficiency, turndown or a combination of these parameters (Schook & Håland (undated)).
Schook & Håland (undated) presents several examples of Degassers and Deliquidisers in operation at
various locations in the world today. On the Norwegian continental shelf it is used at the Sleipner-T,
Statfjord-B and Veslefrikk fields with great success. However most applications are for de-
bottlenecking of existing systems, and no process described employs the Degasser or Deliquidiser as
the only unit for separation (Schook & Håland (undated)).

14
1.5.2 The Twister BV supersonic separator
The Twister BV supersonic separator also employs centrifugal forces to separate gas and liquid, but
in addition to rotate the stream, the stream is accelerated to supersonic velocities through a Laval
nozzle. Even though the Twister is named “separator”, the main use is however conditioning the gas
to meet pipeline specifications.
The feed gas enters from the left (See figure 1.11) and is set into rotation by stationary guide vanes
located in the vortex generation section. Passing the stream through a Laval nozzle with a
sufficiently high volume stream makes the flow supersonic, greatly intensifying the swirl and
lowering the temperature. The swirl flings the liquid droplets onto the vessel walls, and the liquid
and some slip gas is extracted through a cyclone separator section. The slip gas is recovered in a
hydrate separator, and the liquid sent to treatment (Twister BV (undated)).
Figure 1.11: Schematics for the Twister BV Supersonic Separator (adapted from Twister BV (undated))
Performance data for the Twister BV is not available, but the unit must be tailor made for all
projects. The two main disadvantages of the Twister, is the required pressure loss of 15 – 30%, and
the fact that a Laval nozzle is a fixed flow rate device, allowing for very little turndown (Twister BV
(undated)). Advantages include no moving parts, compact and lightweight and no need for chemicals
when processing for pipeline specifications (Note: Not able to produce pipeline specifications for all
locations, e.g. the North Sea).

Chapter 2: Glycol regeneration systemEven though the TEG injection concept
rich glycol still has to be regenerated using the conventional
give an introduction to this process, discussing the process and typical operational problem
the process is presented and the different unit`s operation described. Operational problems are then
discussed, shortly describing the problem and giving possible solution
for enhanced glycol regeneration are presente
The process
The rich glycol (rich in water) exits the absorber in the top left corner (referring to figure
heated through the overhead condenser for the regeneration still, and enters the flash tank. The
flash tank operates at a lower pressure than the absorber, and some HC and water are therefore
flashed off. From the flash tank, the glycol passes through two filt
in the glycol (called sock filter) and one to remove liquid HC (charcoal filter often employed). It is
heated through the glycol/glycol heat exchanger, and finally entered into the regeneration still.
In the regenerati
vaporizing the water together with some glycol. Through the
containing glycol and water is gradually cooled, causing glycol to condense and f
while essentially water vapor leaves from the to
overhead condenser, providing reflux for the column. From the bottom of the
lean glycol overflows by gravity to the
exchanger and pressurized by the glycol pum
gas before it is re
(2005), Guo & Ghalambor (2005) [1]
Chapter 2: Glycol regeneration systemEven though the TEG injection concept
rich glycol still has to be regenerated using the conventional
give an introduction to this process, discussing the process and typical operational problem
the process is presented and the different unit`s operation described. Operational problems are then
discussed, shortly describing the problem and giving possible solution
for enhanced glycol regeneration are presente
Figure 2.1
The process
The rich glycol (rich in water) exits the absorber in the top left corner (referring to figure
ed through the overhead condenser for the regeneration still, and enters the flash tank. The
flash tank operates at a lower pressure than the absorber, and some HC and water are therefore
flashed off. From the flash tank, the glycol passes through two filt
in the glycol (called sock filter) and one to remove liquid HC (charcoal filter often employed). It is
heated through the glycol/glycol heat exchanger, and finally entered into the regeneration still.
In the regeneration still heat is added through a reboiler (normally by burning natural gas),
vaporizing the water together with some glycol. Through the
containing glycol and water is gradually cooled, causing glycol to condense and f
while essentially water vapor leaves from the to
overhead condenser, providing reflux for the column. From the bottom of the
lean glycol overflows by gravity to the
exchanger and pressurized by the glycol pum
gas before it is re-entered into the
Guo & Ghalambor (2005) [1]
Chapter 2: Glycol regeneration systemEven though the TEG injection concept
rich glycol still has to be regenerated using the conventional
give an introduction to this process, discussing the process and typical operational problem
the process is presented and the different unit`s operation described. Operational problems are then
discussed, shortly describing the problem and giving possible solution
for enhanced glycol regeneration are presente
2.1: Typical glycol regeneration system (adapted from Apex Process Group
The rich glycol (rich in water) exits the absorber in the top left corner (referring to figure
ed through the overhead condenser for the regeneration still, and enters the flash tank. The
flash tank operates at a lower pressure than the absorber, and some HC and water are therefore
flashed off. From the flash tank, the glycol passes through two filt
in the glycol (called sock filter) and one to remove liquid HC (charcoal filter often employed). It is
heated through the glycol/glycol heat exchanger, and finally entered into the regeneration still.
on still heat is added through a reboiler (normally by burning natural gas),
vaporizing the water together with some glycol. Through the
containing glycol and water is gradually cooled, causing glycol to condense and f
while essentially water vapor leaves from the to
overhead condenser, providing reflux for the column. From the bottom of the
lean glycol overflows by gravity to the
exchanger and pressurized by the glycol pum
entered into the
Guo & Ghalambor (2005) [1]
Chapter 2: Glycol regeneration systemEven though the TEG injection concept uses a different method for dehydrating the natural gas, the
rich glycol still has to be regenerated using the conventional
give an introduction to this process, discussing the process and typical operational problem
the process is presented and the different unit`s operation described. Operational problems are then
discussed, shortly describing the problem and giving possible solution
for enhanced glycol regeneration are presente
: Typical glycol regeneration system (adapted from Apex Process Group
The rich glycol (rich in water) exits the absorber in the top left corner (referring to figure
ed through the overhead condenser for the regeneration still, and enters the flash tank. The
flash tank operates at a lower pressure than the absorber, and some HC and water are therefore
flashed off. From the flash tank, the glycol passes through two filt
in the glycol (called sock filter) and one to remove liquid HC (charcoal filter often employed). It is
heated through the glycol/glycol heat exchanger, and finally entered into the regeneration still.
on still heat is added through a reboiler (normally by burning natural gas),
vaporizing the water together with some glycol. Through the
containing glycol and water is gradually cooled, causing glycol to condense and f
while essentially water vapor leaves from the to
overhead condenser, providing reflux for the column. From the bottom of the
lean glycol overflows by gravity to the surge tank, before it is cooled in the
exchanger and pressurized by the glycol pum
entered into the absorber
Guo & Ghalambor (2005) [1]).
15
Chapter 2: Glycol regeneration system
uses a different method for dehydrating the natural gas, the
rich glycol still has to be regenerated using the conventional
give an introduction to this process, discussing the process and typical operational problem
the process is presented and the different unit`s operation described. Operational problems are then
discussed, shortly describing the problem and giving possible solution
for enhanced glycol regeneration are presented. Design models are described in appendix
: Typical glycol regeneration system (adapted from Apex Process Group
The rich glycol (rich in water) exits the absorber in the top left corner (referring to figure
ed through the overhead condenser for the regeneration still, and enters the flash tank. The
flash tank operates at a lower pressure than the absorber, and some HC and water are therefore
flashed off. From the flash tank, the glycol passes through two filt
in the glycol (called sock filter) and one to remove liquid HC (charcoal filter often employed). It is
heated through the glycol/glycol heat exchanger, and finally entered into the regeneration still.
on still heat is added through a reboiler (normally by burning natural gas),
vaporizing the water together with some glycol. Through the
containing glycol and water is gradually cooled, causing glycol to condense and f
while essentially water vapor leaves from the top. At the top of the
overhead condenser, providing reflux for the column. From the bottom of the
surge tank, before it is cooled in the
exchanger and pressurized by the glycol pump. Finally the lean glycol is cooled by the dehydrated
(not shown in the figure) (Carroll
uses a different method for dehydrating the natural gas, the
rich glycol still has to be regenerated using the conventional regeneration
give an introduction to this process, discussing the process and typical operational problem
the process is presented and the different unit`s operation described. Operational problems are then
discussed, shortly describing the problem and giving possible solution
d. Design models are described in appendix
: Typical glycol regeneration system (adapted from Apex Process Group
The rich glycol (rich in water) exits the absorber in the top left corner (referring to figure
ed through the overhead condenser for the regeneration still, and enters the flash tank. The
flash tank operates at a lower pressure than the absorber, and some HC and water are therefore
flashed off. From the flash tank, the glycol passes through two filters, one to remove solids entrained
in the glycol (called sock filter) and one to remove liquid HC (charcoal filter often employed). It is
heated through the glycol/glycol heat exchanger, and finally entered into the regeneration still.
on still heat is added through a reboiler (normally by burning natural gas),
vaporizing the water together with some glycol. Through the regeneration
containing glycol and water is gradually cooled, causing glycol to condense and f
At the top of the regeneration
overhead condenser, providing reflux for the column. From the bottom of the
surge tank, before it is cooled in the
Finally the lean glycol is cooled by the dehydrated
(not shown in the figure) (Carroll
uses a different method for dehydrating the natural gas, the
regeneration proces
give an introduction to this process, discussing the process and typical operational problem
the process is presented and the different unit`s operation described. Operational problems are then
discussed, shortly describing the problem and giving possible solutions. Finally different processes
d. Design models are described in appendix
: Typical glycol regeneration system (adapted from Apex Process Group
The rich glycol (rich in water) exits the absorber in the top left corner (referring to figure
ed through the overhead condenser for the regeneration still, and enters the flash tank. The
flash tank operates at a lower pressure than the absorber, and some HC and water are therefore
ers, one to remove solids entrained
in the glycol (called sock filter) and one to remove liquid HC (charcoal filter often employed). It is
heated through the glycol/glycol heat exchanger, and finally entered into the regeneration still.
on still heat is added through a reboiler (normally by burning natural gas),
regeneration column, hot rising vapor
containing glycol and water is gradually cooled, causing glycol to condense and fall to the bottom,
regeneration
overhead condenser, providing reflux for the column. From the bottom of the regeneration
surge tank, before it is cooled in the glycol
Finally the lean glycol is cooled by the dehydrated
(not shown in the figure) (Carroll (2003
uses a different method for dehydrating the natural gas, the
process. This chapter will
give an introduction to this process, discussing the process and typical operational problems.
the process is presented and the different unit`s operation described. Operational problems are then
Finally different processes
d. Design models are described in appendix C.
: Typical glycol regeneration system (adapted from Apex Process Group (2007))
The rich glycol (rich in water) exits the absorber in the top left corner (referring to figure 2.1), is
ed through the overhead condenser for the regeneration still, and enters the flash tank. The
flash tank operates at a lower pressure than the absorber, and some HC and water are therefore
ers, one to remove solids entrained
in the glycol (called sock filter) and one to remove liquid HC (charcoal filter often employed). It is
heated through the glycol/glycol heat exchanger, and finally entered into the regeneration still.
on still heat is added through a reboiler (normally by burning natural gas),
column, hot rising vapor
containing glycol and water is gradually cooled, causing glycol to condense and fall to the bottom,
regeneration column there is an
regeneration column
glycol/ glycol heat
Finally the lean glycol is cooled by the dehydrated
2003), Lyons & Pl
uses a different method for dehydrating the natural gas, the
This chapter will
s. First
the process is presented and the different unit`s operation described. Operational problems are then
Finally different processes
.
), is
ed through the overhead condenser for the regeneration still, and enters the flash tank. The
flash tank operates at a lower pressure than the absorber, and some HC and water are therefore
ers, one to remove solids entrained
in the glycol (called sock filter) and one to remove liquid HC (charcoal filter often employed). It is
heated through the glycol/glycol heat exchanger, and finally entered into the regeneration still.
column, hot rising vapor
all to the bottom,
column there is an
column
/ glycol heat
Finally the lean glycol is cooled by the dehydrated
Lyons & Plisga

16
2.1 The different units` operation
A typical glycol regeneration system (as shown in figure 2.1) consists of a flash tank for recovering
HC trapped in the glycol, several filters for removing impurities, a regeneration column with a
reboiler, a heat exchangers for cooling the lean glycol and heating the rich glycol, and a pump for
pressurizing the lean glycol before it is sent back to the absorber again (Guo & Ghalambor (2005)
[1]). In addition processes for enhanced glycol regeneration (i.e. higher purity in the lean glycol) e.g.
introducing stripping gas in the stripping column or using the Coldfinger or the Drizo-processes can
be employed requiring additional equipment (See chapter 2.3).
2.1.1 Filters
Even though an inlet separator is used to remove solids and other contaminants before the feed gas
enters the absorber, solids will accumulate in the glycol if not removed. A sock filter is therefore
employed shortly after the rich glycol leaves the absorber, removing any contaminants. Lyons &
Plisga (2005) and Guo & Ghalambor (2005) [1] both claim that the filter should be located before the
flash tank filtrating high pressure glycol, while Kidnay & Parrish (2006), Arnold & Stewart (1999) [1]
and Carroll (2003) argue it should be placed after the flash tank filtrating low pressure glycol (See
point 1 figure 2.1), thus indicating that both placements are used. Filtrating high pressure glycol
enhances filtration efficiency and prevent solids from possibly plugging the overhead condenser, but
requires pipe joints also in front of the flash tank. Placing the filter after the flash tank enables the
sock filter and the charcoal filter to be placed directly after each other, limiting pipe joints, but can
result in possible problems with solid deposition in the flash tank.
In addition to a sock filter, a charcoal filter is used to remove small amounts of hydrocarbons that
are not flashed off in the flash tank. To serve any purpose, this filter must be placed after the flash
tank, filtrating the low pressure glycol. For large glycol regeneration systems, it is common to filtrate
only a portion of the glycol through the charcoal filter to extend the operation time of the filter, and
to prevent shutdown when replacing the filter (Arnold & Stewart (1999) [1]).
2.1.2 Overhead condenser
To reduce the viscosity and enhance separation, the rich glycol should be heated before it is sent to
the flash tank (Point 2 figure 2.1). This is often done by routing a portion (depending on the size of
the regeneration unit) through the overhead condenser for the regeneration column. The overhead
condenser can be either integrated in the column itself consisting of coils at the top of the column,
or be a separate heat exchanger located beside the column (Kohl & Nielsen (1997) [1]). To reduce
the thickness of the tubes in the overhead condenser, the pressure is usually lowered either through
a nozzle or using a pressure driven pump prior to the rich glycol entering the overhead condenser
(Guo & Ghalambor (2005) [1]).
2.1.3 Flash tank
Since the glycol is in intimate contact with the natural gas, some natural gas will become absorbed in
the glycol together with the water. The amount of HC absorbed depends on absorber conditions
(temperature and pressure), gas composition and contacting time between the glycol and the
natural gas, and the type of glycol (Kohl & Nielsen (1997) [1]). High operating pressure and heavy
hydrocarbons, especially aromatics, present in the natural gas results in larger quantities of natural
gas absorbed by the glycol. Kohl & Nielsen (1997) [1] suggests using 1 scf/gal at 1000 psig and 100oF
(0.0075 Sm3/l at 70 bar and 38oC) to estimate the solubility of natural gas in TEG. Hydrocarbons are

17
not allowed to enter the regeneration still as it may result in foaming, thereby reducing the
efficiency of the stripping still (Guo & Ghalambor (2005) [1]).
If there are liquid hydrocarbons present in the rich TEG the flash tank should be a three-phase
separator, otherwise a two-phase separator is used (as shown in figure 2.1. point 3). For a three-
phase separator a retention time of 10 to 45 minutes is required, while 3 to 10 minutes is sufficient
for a two-phase separator (Kohl & Nielsen (1997) [1]). Typical operating pressure for the flash tank is
3 to 7 bar (Carroll (2003), Arnold & Stewart (1999) [1]), depending on composition and temperature
of the rich glycol. If the pressure is lowered too much glycol may vaporize, resulting in loss of
expensive glycol.
2.1.4 Glycol/glycol heat exchanger
To recover some of the heat from the lean glycol exiting the stripping still, it is passed through a
glycol/glycol heat exchanger (Point 4 figure 2.1), transferring heat from the lean to the rich glycol.
This heat exchanger can be either a simple coil located in the surge drum for the lean glycol (Guo &
Ghalambor (2005) [1]), or a dedicated shell and tube or plate/fin heat exchanger located just before
the rich glycol inlet to the regeneration still (Kidney & Parrish (2006), Arnold & Stewart (1999) [1]).
2.1.5 Regeneration still
The regeneration still consists of a reboiler, a regeneration column, an overhead condenser and a
surge tank. The reboiler heats the rich glycol, vaporizing absorbed water together with some glycol.
Operation temperature of the reboiler is governed by the glycol used, e.g. for TEG and DEG the
maximum recommended temperature is 204oC and 170oC at sea level pressure, respectively (Kidney
& Parrish (2006)). Heat for the reboiler is commonly supplied by burning a portion of the processed
gas, flash gas from the flash tank, or fuel gas available from other processes, directly in tubes inside
the reboiler (Kohl & Nielsen (1997) [1]). Steam, waste heat and hot oil systems can also be used if
available. Regardless of heat source, it is very important to keep the maximum temperature below
the decomposition temperature of the glycol, or else large glycol losses due to thermal
decomposition may occur.
The regeneration column is a regular distillation column with trays or packing (Figure 2.1. point 5).
Hot rising vapor from the reboiler (Point 6 figure 2.1) rises through the column and contacts the
falling cold rich glycol, vaporizing the water in the rich glycol and condensing the glycol in the rising
vapor. At the top of the column, the vapor consists of nearly only water, and is passed through the
reflux condenser and exits the column trough the top (Carroll (2003)).
The mass transfer zone of the regeneration column can use trays
or packing. Trays come in many different forms, the simplest
being sieve trays which are just holes punched through a plate. A
major disadvantage for sieve trays is that for gas flow rates below
70% of design, glycol will start to flow through the sieve holes
onto the stage below (called “weeping”), which greatly reduces
the efficiency of the tray (Kolmetz & Zygula (2000)). Slightly more
efficient and complex are the valve trays, which employ valves
over the holes, improving the turn down (the minimum required
gas flow relative to design) to 60%. The most efficient, and also
Figure 2.2: Gas flow through the
different types of trays (adapted from
GPSA (2004):p.19-9)

18
most expensive trays, are the bubble cap trays. These are designed to prevent weeping and have
unlimited turn down (Arnold & Stewart (1999) [2]). Trays are preferred for large installations; clean,
noncorrosive, nonfoaming liquids; and low to medium liquid flow applications (Kohl & Nielsen (1997)
[2]) Figure 2.2 shows an illustration of the different types of trays.
Packing is divided into two types; structured- and random
packing. Random packing was the first packing developed,
just filling a portion of the column with small packing
elements in a random order. Structured packing was
originally designed for troublesome separation and smaller
columns, but is available also for larger units today (Kohl &
Nielsen (1997) [2]). Packing is normally used for small
installations, corrosive service, foaming liquids, high liquid to
gas ratio or applications requiring low pressure drop (e.g.
vacuum operation) (Kohl & Nielsen (1997) [2]). Figure 2.3
and 2.4 shows different types of packing elements.
For relative small plants, the regeneration column
is packed with ceramic saddles or stainless steel
Pall rings with diameters from 1 to 1.5 inch (2.5 – 4
cm) and frequently mounted directly on top of the
reboiler (Kohl & Nielsen (1997) [1]). Packing
heights range from 4 ft (1.2 m) for small plants, up
to 15 ft (4.6 m) for larger units. Columns with
larger diameter than 24 inches (60 cm) commonly
use bubble cap trays instead of packing, and are
connected to the reboiler by piping (Kohl &
Nielsen (1997) [1]).
Several reboiler designs are possible to use with a regeneration still, but the most commonly
employed is the kettle type reboiler (GPSA (2004) [2]). As seen from figure 2.5, the kettle reboiler
(sometimes also referred to as “flooded bundle reboiler”), has a design very similar to a horizontal
separator. Natural gas is used as fuel for a burner, and the exhaust gas passed through a pipe bundle
emerged in the liquid phase of the reboiler. Water and some glycol are vaporized at the tube
surface, rise to the liquid surface, and flow out of the reboiler and into the regeneration column.
Using a weir on the left side, the lean glycol is able to overflow into the surge tank, while the rich
glycol is kept in the reboiler and heated. The advantages of employing a kettle type reboiler include
easy liquid level control, and that the reboiler itself represents one theoretical equilibrium tray (Kohl
& Nielsen (1997) [1]). Other types of reboilers include forced circulation, once through natural
circulation, and vertical- and horizontal thermosyphon. See GPSA (2004) [2] for an introduction.
Figure 2.4: Examples of structured packing (adapted from
GPSA (2004):p.19-17)
Figure 2.3: Examples of random packing
(adapted from GPSA (2004):p.19-16)

19
Figure 2.5: A kettle type reboiler employed in a regeneration still (adapted from GPSA (2004):p.19-24)
Because of the large difference in boiling points for glycol (e.g. 285oC for TEG) and water (100oC), the
separation of water from the glycol requires very few theoretical equilibrium stages, usually
between two and three, where the reboiler is the first (Kohl & Nielsen (1997) [1], Arnold & Stewart
(1999) [1]). Depending on the tray efficiency used and the requirement for glycol losses, this results
in 10 to 20 actual trays (Kohl & Nielsen (1997) [1]). The reason for using so many trays, is to reduce
the loss of glycol through the exiting water vapor to almost zero. The pressure is kept as low as
possible, but still at slight overpressure to prevent air leakage into the system.
Using the maximum recommended regeneration temperature for TEG, distillation at sea level results
in a maximum theoretical purity for the lean TEG of 98.5 wt% (Kidnay & Parrish (2006)). In practice,
purities as high as 99.1 wt% have however been obtained, because of stripping effect from dissolved
HC or operation above sea level (Kohl & Nielsen (1997) [1]). If higher purity is required, processes for
enhanced glycol regeneration must be employed (See chapter 2.3).
As mentioned in chapter 2.1.2, the overhead condenser can be either integrated in the regeneration
column or be a standalone unit located directly downstream of the column. Several systems are
available, one of which being the earlier described cooling coil. The simplest solution available, is
however to install an uninsulated or finned section at the top of the column, condensing a portion of
the vapor and thereby providing reflux. The drawback for this solution is that it is very difficult to
control the rate of reflux under adverse weather conditions, and it is therefore only used for small
units (Kohl & Nielsen (1997) [1]). Introducing pure water as reflux directly into the top of the
distillation column can also be employed, but this requires accurate flow control and pure water to
prevent introducing salts and other contaminants into the column. Typical reflux ratios for a
regeneration column are 25 to 50% of the rising water vapor at the top of the column (Arnold &
Stewart (1999) [1]).
The surge tank is usually located below the reboiler (Point 7 figure 2.1), and stores the lean glycol
before it is sent back to the absorber. As mentioned in chapter 2.1.4, the surge tank can also act as
the glycol/glycol heat exchanger, transferring heat from the hot lean glycol in the tank to the cold
rich glycol flowing through pipes. The surge tank must be large enough to allow for thermal
expansion of the lean TEG, in addition to hold sufficient capacity to allow for reasonable time
between additions of glycol (Arnold & Stewart (1999) [1]).

20
2.1.6 Glycol pump
In some glycol regeneration units, a glycol powered pump is
employed (See figure 2.6). The high pressure of the rich glycol is
used to pressurize the low pressure lean glycol, conserving the
pressure energy in the rich glycol which otherwise would have
been lost through a nozzle. This solution is however seldom used
in larger units or units at remote locations (e.g. offshore), because
of the added complexity over a regular pump, reducing the
reliability. The alternative is using a regular electric powered pump
(Point 8 figure 2.1).
2.2 Operational problems
Operating a glycol regeneration unit incur several possible operational problems. The problems
described for separators in chapter 1.4 are also applicable for the glycol regeneration process, as the
flash tank and the stripping column are both special types of separators. These problems will not be
repeated here. In addition problems with corrosion, contamination of the glycol, emission of
hazardous compounds and loss of glycol have been reported (Kohl & Nielsen (1997) [1]).
2.2.1 Corrosion
As the glycol is essentially non-corrosive, corrosion caused by the glycol solution is believed to be the
result of other components present formed by oxidation or thermal decomposition of the glycol, or
by components entering the system from the gas stream (Kohl & Nielsen (1997) [1]). Other factors
influencing the extent of the corrosion are the temperature of the glycol and fluid velocity. Corrosion
is illustrated in figure 2.7.
Thermal decomposition of the glycol is the result of local
temperatures exceeding the thermal decomposition
temperature of the glycol. This can happen if the surface of
the fire tubes in the reboiler becomes unevenly coated with
depositions, resulting in locally low thermal resistances,
creating local hotspots. This can be prevented by regular
cleaning of the fire tubes` outer surfaces.
Oxidation of the glycol requires that oxygen is present. In
some cases the feed gas to be dehydrated contains oxygen,
and oxygen can then enter the regeneration system with the
rich glycol. The most common source of oxygen is however
leakage through the surge tank (Kohl & Nielsen (1997) [1]). Lyons (1957) as cited by Kohl & Nielsen
(1997) [1] found that oxidation of DEG resulted in the formation of an organic peroxide as an
intermediate product, and formic acid and formaldehyde in considerable quantities. The oxidation
rate was found to increase with increased temperature and partial pressure of oxygen, and
accelerated by the presence of acid. To prevent oxygen from entering the regeneration system, a gas
blanket is often applied in the surge tank (Kohl & Nielsen (1997) [1]).
Figure 2.7: Example of the result of
severe corrosion on a pipe inlet (adapted
from TTI Environmental (undated))
Figure 2.6: Schematics of a glycol
driven pump (adapted from Arnold
& Stewart (1999):p.221)

21
A third possible source for corrosion is by components entering the system with the rich glycol. CO2
and H2S are known to be highly corrosive in combination with free water, and are also soluble in
glycol. Dehydration of feed gases with high concentrations of sour gases may therefore require sour
gas removal prior to dehydration.
To prevent corrosion in the regeneration system several measures have been mentioned already,
but in addition corrosion-resistant alloys can be used for manufacture, corrosion inhibitors added to
the glycol and the process designed with minimized temperatures and velocities (Kohl & Nielsen
(1997) [1]).
2.2.2 Contamination of the glycol
Contamination of the glycol (See figure 2.8) is a very common
problem in operation of glycol regeneration units, and can
have many different sources. Corrosion products, together
with solid particles brought in by the rich glycol, can lead to
fouling of heat exchanger surfaces by deposition and
ultimately plugging of heat exchanger pipes. Solids entering
the stripping column can plug weep holes in the distillation
trays, and also accelerate corrosion (and possibly also erosion)
(Kohl & Nielsen (1997) [1]). Glycols also absorb salts at low
temperatures, which again are desorbed at high
temperatures, leading to extensive salt depositions in heat
exchangers and on reboiler fire tubes if not handled.
As earlier mentioned, sock filters should be employed in the rich glycol line to remove solids (See
chapter 2.1.1). Removal of solids larger than 5 microns is regarded as sufficient (Kohl & Nielsen
(1997) [1]). If salt is a major problem, a vacuum distillation or ion exchange can be employed to
directly remove the salt. For most systems however, it is sufficient to remove deposited salt during
scheduled shutdowns (Kohl & Nielsen (1997) [1]).
Absorbed HC are partly flashed off in the flash tank, but some of the heavy HC will remain in the
glycol. HC can, as previously noted, lead to foaming in the regeneration still, as well as increased
emissions of HC. To prevent heavy HC from accumulating in the system, a portion of the rich glycol is
therefore routed through a charcoal filter prior to entering the regeneration still.
2.2.3 Emission of hazardous compounds
Even thought the rich glycol is both flashed and filtrated, some HC will inevitably enter the
regeneration still with the glycol. Especially aromatics such as benzene, toluene, ethyl benzene and
xylene isomers (BTEX) are absorbed well in glycol, and a significant fraction is carried through the
flash tank and into the regeneration still (Kohl & Nielsen (1997) [1]). The amount of BTEX absorbed
increases with increasing glycol circulation rate, increasing operating pressure and temperature of
the absorber, and increasing concentration in the feed gas (Nassar, Bullin & Lyddon (2000)). If not
handled, the BTEX will vaporize in the regeneration still and leave through the top of the column
with the water vapor. As BTEX is considered hazardous for the environment, rules and regulations
restrict yearly emissions, for the USA maximum 25 tons/year altogether and maximum 10 tons/year
of any single compound (Nassar, Bullin & Lyddon (2000)).
Figure 2.8: The resulting glycol condition
if filtering is not employed can be seen to
the left, versus the clean to the right
(adapted from Hydrotechnik UK (2008))

22
Measures for handling BTEX include minimizing the glycol circulation rate, maximizing the amount
flashed off in the flash tank, using a glycol with low solubility for aromatics (e.g. DEG/MEG instead of
TEG), or processing the overhead vapor from the regeneration still (Kohl & Nielsen (1997) [1]).
Processing involves either incineration of the gas (e.g. as fuel gas for the reboiler) or partial
condensation with HC recovery. The Drizo process (See chapter 2.3.1) utilizes the condensed liquid
HC from the overhead vapor, superheats it, and re-introduces it into the regeneration column as
stripping gas.
In addition to BTEX other emissions also occur, including volatile organic components (VOCs), glycol,
and breakdown products from the glycol. Depending on the amount, these may also need to be
handled, either by distillation or by incineration (Kohl & Nielsen (1997) [1]).
2.2.4 Glycol loss
Sources for glycol loss include glycol carry-over from the absorber, vaporization of glycol in the
reboiler, vaporization into the dehydrated gas, and mechanical loss from the system (e.g. leakage
through seals, pumps, spillage etc.) (Kohl & Nielsen (1997) [1]). The greatest contribution to glycol
loss is however entrainment and resulting carry-over from the absorber (Kidnay & Parrish (2006),
Kohl & Nielsen (1997) [1]), and the most effort is therefore made to design the best possible mist
extractor for each unit. Typical acceptable glycol losses are in the range from 0.5 – 1.0 lb/MMscf (8 –
16 kg/MMscm), but for some systems even larger losses can be acceptable (e.g. dehydration of sour
gases) (Kohl & Nielsen (1997) [1], Kidnay & Parrish (2006)).
2.3 Enhanced glycol regeneration
As mentioned earlier, additional processing is required to regenerate the glycol to purities higher
than approximately 98.5 wt%. Several processes are available today, each employing different
strategies to enhance glycol regeneration by reducing the effective partial pressure of water in the
vapor space (GPSA (2004) [3]). This chapter will give a short introduction to the Drizo, the Coldfinger,
vacuum distillation and the stripping gas processes.
2.3.1 The Drizo process
The Drizo process (See appendix E for PFD) utilizes superheated HCs as stripping gas in a column
placed after the regeneration still to lower the water vapor pressure. After the stripping column the
stripping gas is cooled, and the HCs are separated from the water and off gas in a three-phase
separator. The gas is vented to the atmosphere and the water discarded, while the HCs are
recovered and recycled to be used for stripping gas again. As the glycol absorbs some HCs in the
absorption column, the Drizo process can even produce liquid HC products, enhancing the overall
process efficiency (Kohl & Nielsen (1997) [1]).
Using the Drizo process for glycol regeneration has been shown to result in glycol purities higher
than 99.99 wt% (GPSA (2004) [3]), which allows for dew point depressions as high as 100oC
(Prosernat (undated)). To obtain even higher glycol purities, the superheated HC stripping gas can be
dehydrated using a solid desiccant in an adsorption bed before it is injected into the stripping
column. This has proven to produce glycol purities as high as 99.999 wt%, allowing dew point
depressions of up to 120oC (GPSA (2004) [3]). An added advantage of the Drizo process is that the
emission of BTEX to the atmosphere is almost eliminated.

23
The drawbacks for the Drizo process, is that it requires additional equipment both for the stripping
column and the regeneration of the liquid HC, and heat is required to vaporize and superheat the
HCs used for stripping.
According to the manufacturer (Prosernat (undated)), the Drizo process has been successfully
installed in more than 60 glycol regeneration units worldwide. As there are over 20 000 installed TEG
dehydration units in USA alone (Kidnay & Parrish (2006)), this is surprisingly few, indicating that the
process is not as advantageous as the manufacturer boasts.
2.3.2 The Coldfinger process
Instead of using gas to reduce the vapor pressure of water, the Coldfinger process (See appendix E
for PFD) condenses and extracts water from the vapor phase using a cold tube bundle (“Coldfinger”).
The lean glycol is routed from the regeneration still to a separate vessel which contains the
Coldfinger process. The vessel is half filled with lean glycol, while the other half is occupied by vapor
consisting of water and glycol. A cold bundle is inserted in the vapor space, condensing water from
the vapor, which again is extracted from the vessel by the use of troughs. As all systems naturally
seek equilibrium conditions, water will evaporate from the liquid glycol to restore equilibrium in the
vapor phase, thereby concentrating the glycol. The glycol exiting the vessel therefore has a higher
purity of glycol than the glycol entering, reaching as high as 99.9 wt% (Comart undated). In the most
common applications, rich glycol from the absorber column is used as coolant for the Coldfinger
bundle (GPSA (2004) [3]).
As for the Drizo process, the Coldfinger process requires extra equipment added to the regeneration
process. In addition to the Coldfinger vessel itself, equipment for processing the extracted water is
also needed.
The manufacturer (Comart (undated)) claims that 61 000 MMscfd is processed using the Coldfinger
process for enhanced glycol regeneration. One of the largest gas processing facilities in Norway,
Ormen Lange, exports alone approximately 2 500 MMscfd (StatoilHydro undated), indicating that
use of the Coldfinger process also is limited.
2.3.3 Vacuum distillation
Partial pressure is the product of the total pressure and the molar fraction of the matter present in
the vapor phase (Moran & Shapiro (1998):p.538). The two previously described processes reduce the
partial pressure by reducing the molar fraction, while vacuum distillation, as the name implies,
reduces the total pressure. Operating at vacuum conditions usually utilize the same equipment as
for atmospheric operation, but with the added need to totally condense the overhead vapor as well
as provide a vacuum pump for the non-condensable gases (Kohl & Nielsen (1997) [1]).
As the ambient pressure is greater than the process pressure, air will leak into the process if cracks
or fractures develop. This would lead to drastic reductions in the process performance, resulting in
poor glycol regeneration, and subsequently insufficient dehydration of the natural gas. Exposing the
hot glycol solution to oxygen also leads to oxidation of glycol, resulting in large glycol losses.
To reduce the probability of air leaks into the process and limit the amount of vacuum vapor to be
handled, the BS&B Engineering Company has developed a process where the first stage in the
regeneration process is identical to the original process, operating at near atmospheric pressure.

24
After the regeneration column the lean glycol is flashed into a vacuum column, resulting in glycol
purities reaching 99.9 wt% (Kohl & Nielsen (1997) [1]).
2.3.4 Stripping gas
Stripping gas is the simplest and most employed process for enhanced glycol regeneration used in
the natural gas industry today (Kohl & Nielsen (1997) [1]). A non-condensable gas at regeneration
conditions is introduced into the regeneration column, lowering the molar fraction of water in the
vapor phase, and thereby also lowering the partial pressure of water. Often a small portion of the
wet gas is used, because at regeneration temperature it will still be able to absorb large amounts of
water (Arnold & Stewart (1999) [1]). The amount of natural gas needed to heat the glycol solution to
increase the lean glycol concentration is in most cases lower than if using stripping gas directly.
Stripping gas is therefore mainly used to increase the purity above approx 98.5 wt% (Arnold &
Stewart (1999) [1]).
Injecting the stripping gas directly into the reboiler has proven to obtain glycol purities between 99.1
and 99.6 wt% at the maximum regeneration temperature and near ambient pressure (Kohl &
Nielsen (1997) [1]). To better utilize the stripping gas, a dedicated stripping column can be installed
after the regeneration column, counter-currently contacting the stripping gas and lean glycol.
Depending on the number of trays in the stripping column and the flow rate of stripping gas, this can
produce purities reaching 99.99 wt% (Kohl & Nielsen (1997) [1]).
The greatest advantage when using stripping gas is that it does require very little additional
equipment (especially if the stripping gas is injected into the reboiler). This makes stripping gas a
very widespread method for extending the operating capacity of existing units (Arnold & Stewart
(1999) [1]).

25
Chapter 3: Compact mixing unit A fundamental part of the alternative dehydration concept, is the injection and mixing of TEG with
the feed gas. To minimize the circulation of TEG and enhance the overall unit efficiency, it is very
important that the mixer creates an as near equilibrium mix as possible, at the same time conserving
most of the pressure. There are several commercial mixing concepts available, but this chapter will
concentrate on the mixing unit from ProPure, as it is one of the newest and most promising compact
mixing units for use in the natural gas industry available today.
3.1 The ProPure compact mixer
Figure 3.1: Schematics for the ProPure compact mixer (adapted from Nilsen et al. (2006):p.4)
The ProPure compact mixer is an inline unit utilizing turbulence to mix a liquid with a gas. The gas
enters from the left (See figure 3.1), and the pipe cross section area is reduced to increase the
velocity of the gas. The liquid to be mixed with the gas enters through an annulus, and is evenly
distributed around the perimeter. Before the smallest cross section of the pipe (point 3) the liquid is
exposed to the gas, causing the gas to drag the liquid with it and form a liquid film on the pipe walls
(point 11). At the smallest cross section area (point 6), the diameter is suddenly increased, creating a
sharp edge. This causes the liquid to leave the pipe walls and form drops in the gas. The large
turbulence created by the sudden cross section expansion and the high velocity aids in breaking up
the drops to small droplets, resulting in very effective contact between the liquid and the gas (Nilsen
et al. (2006)). To reduce the permanent pressure drop over the unit, the gas is then expanded
through a diffuser to the original pipe diameter.
The physics utilized in the mixing unit is surface forces, shear forces and drag forces. The liquid to be
mixed with the gas is pumped through a small channel ending in an annulus, and is pushed into the
gas stream. As the liquid is pushed into the stream adhered to the wall, the surface force between
the liquid and the wall will keep the liquid adhered to the wall, but the shear forces transferred from
the fast moving gas will pull the liquid forward, creating a moving film. When the liquid film reaches
the sharp edge, the surface forces are reduced enough for the gas to launch the liquid into the gas
stream creating liquid filaments. Once in the gas stream the filaments are exposed to drag forces
from the faster moving gas, shattering them into smaller droplets. This process is governed by the
Weber number (We) defined from formula 3.1 (Nilsen et al. (2006):p.13):

26
2
G rel fil
surf
U dWe
ρ
σ
⋅ ⋅≡
(Formula 3.1: Weber number)
Where ρG is the gas density, Urel the relative velocity between the gas and the liquid, dfil the
characteristic filament dimension and σsurf the liquid-gas surface tension.
Figure 3.2: Drop shattering as We>Wecrit (adapted from ProPure (undated):p.2)
When the Weber number reaches a critical value, Wecrit, the surface tension is no longer strong
enough to hold the filament together, causing it to shatter into smaller droplets (See figure 3.2).
From wind tunnel experiments it has been found that Wecrit has a value between 8 and 10 (Nilsen et
al. (2006)). After the filaments have shattered, further mixing is provided by turbulence, governed by
the Reynolds number (Nilsen et al. (2006):p.13).
Re mix mix i
mix
U Dρµ⋅ ⋅
≡ (Formula 3.2: Reynolds number)
It can be seen from formula 3.1 that the greater the difference in velocity between the gas and the
liquid (Urel), the better the mixing, as smaller droplets (smaller values for dfil) will shatter because of
reaching Wecrit. High gas velocities will also push the filaments forward, inertia at the same time
causing the filaments to spread out perpendicular to the direction of flow, increasing the dfil and
thereby also We (Illustrated in figure 3.2). As velocity is inversely proportional to the square of the
pipe diameter, Re (and consequently also the turbulence) will increase when narrowing the cross
section area. Accelerating the gas to greater velocities by narrowing the available cross section area
will however increase the permanent pressure drop across the unit.
The design of the mixing unit is very strongly
dependent on the operating conditions and the
fluids involved, and must be reworked for each
new project. Several parameters are adjustable
including the smallest cross section, the rate of
narrowing, the angle of the sharp edge, and the
rate of expansion (Nilsen et al. (2006)).
Depending on the design criteria, the unit can
thereby be optimized for best possible mixing,
lowest possible pressure drop, or most compact
design, among others. The unit is installed into Figure 3.3: Assembled ProPure compact mixer (adapted
from ProPure (undated):p.1)
27
the same type of pipe used at the operating location, this to ensure compatibility and easily fulfill
pressure/temperature requirements (See figure 3.3). Placement and inclination of the unit is
arbitrary, but preferentially it is mounted horizontally with 15 to 20 pipe diameters of straight pipe
downstream to provide further mixing (Nilsen et al. (2006)).
Although the ProPure compact mixer can be designed to mix any fluid with gas, it is presently
marketed for injection of H2S scavenging chemicals in natural gas. Internationally this concept has
been applied to more than 30 applications with up to 30% reduction in scavenger consumption
compared to conventional systems (ProPure (2005)).
Advantages using the ProPure compact mixer include (ProPure (2005)):
- Large turndown ratio for both gas and liquid.
- Better mixing performance than conventional mixers.
- Robust towards plugging.
- Great mixing performance also for high viscosity liquids.
- Compact.
Disadvantages using the ProPure compact mixer include:
- Permanent pressure drop (approx 0.3 bar (Kalgraff (2008))).

28

29
Chapter 4: Further developing the alternative natural gas drying
concept As earlier mentioned, my semester project work during fall 2007 resulted in a proposition for an
alternative concept for dehydrating natural gas. This chapter will give a short introduction to this
work and try to further develop the concept, countering some of the major disadvantages when
compared to conventional dehydration technology. Alternatives for improvements will be
presented, before the different alternatives are discussed and one is eventually chosen for
simulation.
4.1 The concept
The proposed dehydration unit consists of multiple stages of injection and extraction of TEG directly
into/from the feed gas (See figure 4.1). Following inlet separation, a compact mixer unit injects lean
TEG into the feed stream, and the piping is utilized as a contactor. After sufficient contacting time,
the rich TEG is separated from the gas stream by using a scrubber, while the dry gas leaves for
further processing.
Figure 4.1: The TEG injection dehydration concept
As opposed to counter-current contacting in a conventional absorber column where equilibrium
with the lean TEG is obtained, co-current contacting in the gas piping can ultimately only result in
the gas obtaining equilibrium with the rich TEG (Kohl & Nielsen (1997) [1]). More than one
injection/extraction stage is therefore needed to restrict the TEG flow rate. From simulations it was
found that going from one to three stages, the TEG flow rate could be reduced by almost 85% for
normal operating conditions (Bråthen (2007)). The leanest TEG is injected in front of the last
extraction stage, and the liquid extracted in the last extraction stage injected before the preceding
stage and so forth (See figure 4.1). Adding a fourth injection/extraction stage would further reduce
the TEG flow rate, but at the expense of adding more weight and volume to the unit. As the

30
reduction was much smaller than going from two to three stages, it was concluded that three stages
was the most promising concept.
While the TEG flow rate was found to decrease substantially going from one to three separation
stages, the required flow rate required to obtain a given dryness was still roughly four times that of a
conventional absorber column (Bråthen (2007)). When comparing weight and volume, the
advantages when comparing the absorption units was therefore massively outweighed by the
disadvantages when comparing the regeneration units, making TEG injection uncompetitive
compared to conventional dehydration. It must however be noted that the absorption column used
in the comparison in my project thesis consisted of 10 theoretical trays, while it is common to use 6
to 12 actual trays (Arnold & Stewart (1999) [1]). 6 to 12 actual trays results in 2 to 8 theoretical trays,
depending on the tray efficiency (See chapter 2.1.5). The results for the contactor tower is therefore
better than what is found for a typical absorption column in operation, making the comparisons to
the TEG injection concept better than they actually are.
Another possible problem with the concept, is the intimate contact between TEG and liquid HC.
Heavy hydrocarbons are absorbed by the TEG, and can cause both foaming in the regeneration unit
and lead to excessive emission of hazardous components with the water vapor exiting the stripping
column. This problem is however also applicable to many conventional absorption units, but still
needs to be handled (See chapter 2.2.3).
4.2 Potential improvements
As mentioned above, the TEG circulation rate is the main disadvantage for the TEG injection
concept, and focus should therefore be to reduce this even further. One possible solution is to use
more injection/extraction stages utilizing inline separators and other compact equipment, but this
will at the same time increase both the complexity of the process and also the weight and volume.
The separators could be placed on top of each other, minimizing the required footprint, but their
weight and volume would still be the same. More stages also require more utility equipment like
pumps, gauges, piping etc.
Another possible solution is to use an alternative process for the regeneration of the rich TEG as
well. Conventional regeneration technology (See chapter 2) relies on heating the entire glycol/water
solution to boil the absorbed water from the glycol. This means that there is a near linear
dependence between the flow rate of rich glycol and the energy needed for regeneration (See
formula C.6 in appendix C) (The dependence is not directly proportional to the glycol circulation rate,
as vaporizing the water requires heat as well). By using alternative processes where energy
consumption instead is dependent on the amount of water absorbed, huge energy savings could be
achieved.
Intimate contact between HC and TEG is difficult to avoid, as this is a fundamental part of the
concept. Using an alternative process for regeneration could however diminish the problem, as
foaming in the regeneration column is then mitigated. Anti-foaming chemicals can also be applied,
but then at increased operating costs. Other glycols like MEG and DEG with lower solubility for HC
can also be used, but then at the expense of increased circulation rate.

31
Using amines instead of glycols for simultaneous sweetening and dehydration is also possible, and
this would improve at least the weight and volume comparisons for the concept. However, to be
able to dehydrate the gas, the amine concentration has to be above 95%, requiring very high
reboiler temperatures at which severe corrosion will occur (Kohl & Nielsen (1997) [3]). To overcome
the corrosion, corrosion-resistant materials must be used, greatly increasing the production costs.
Mixtures of glycol and amines have also been tested, but rejected among other factors because of
large vaporization losses of amine (Kohl & Nielsen (1997) [3]).
4.3 Alternative concepts
Because most of the improvements pointed out above involve the regeneration process for the
glycol, most of the attention in this chapter is devoted to suggesting improvements/alternative
processes for the regeneration process.
4.3.1 Alternative 1: Injecting hot stripping gas into the rich glycol stream
Idea: Instead of heating the entire rich glycol solution to boil out the water, hot stripping gas is
injected to absorb the water from the glycol.
Figure 4.2: Alternative regeneration process using hot stripping gas
Hot stripping gas is provided by burning a portion of the dehydrated gas together with flash gas
absorbed by the glycol. Combustion air is supplied from the surroundings, together with recycled
stripping gas, and combusted in a gas burner. The stripping gas is then injected into the glycol
stream, and separated out again using a separator. To reduce glycol loss, multiple stages are
required, but to minimize weight and volume of the unit, two stages is proposed. The off gas from
the separators must also be treated to recover some of the entrained glycol, as well as separating
the BTEX from the water.
Advantages:
- Energy consumption is much lower than for a conventional regeneration process, as the
stripping effect is more important than the heating effect

32
- Compact; can use separators/scrubbers instead of a distillation column
- Shorter retention time for the glycol in the regeneration process
- Very good heat transmission, since the hot and the cold fluid is mixed
- Less thermal strain on the glycol solution, as lower temperature is sufficient for regeneration
Disadvantages:
- Large glycol entrainment needs to be handled
- Contamination of the glycol; more filtering is needed
- Compressor is needed for pressurizing combustion air; reduces reliability because of
introducing additional rotating equipment
- Larger glycol loss than the conventional regeneration process
- Possible degradation of the glycol caused by presence of oxygen
4.3.2 Alternative 2: Using staged injection of hot stripping gas
Idea: Injecting the leanest and hottest stripping gas in front of the last injection stage, recycle the off
gas from the last separator and inject it in the preceding stage.
Figure 4.3: Alternative regeneration process using staged injection of hot stripping gas
The hot stripping gas is obtained using the same method as for alternative 1, but instead of dividing
the stream into multiple injection stages, all of the stripping gas is injected before the last stage.
From the last separator, the off gas is then routed to the preceding stage where it is reused as
stripping gas. To avoid condensation of the stripping gas and eliminate the need for recompression,
the last stage must operate at a higher pressure than the preceding stage. The liquid entering the
last stage must therefore be pressurized using a pump. The off gas from the first stage needs to be
processed to recover some of the entrained glycol, as well as separating the volatile HCs from the
water.
Advantages:
- Energy consumption is much lower than for a conventional regeneration unit

33
- Compact; can use separators/scrubbers instead of a distillation column
- Shorter retention time for the glycol in the regeneration system
- Less thermal strain on the glycol
- Very good heat transmission, since the hot and the cold fluid is mixed
- Better fit to equilibrium than alternative 1
Disadvantages:
- Requires pressurizing of the glycol between injection/extraction stages
- Glycol entrainment must be handled
- More filtering is needed because of contamination of the glycol
- Compressor is needed for combustion air
- Possible degradation of the glycol caused by presence of oxygen
- Larger glycol loss than conventional regeneration process
4.3.3 Alternative 3: Using an absorber for regeneration
Idea: Using stripping gas to regenerate the rich glycol in an absorber.
Figure 4.4: Alternative regeneration process using an absorber for regeneration
The rich glycol enters from the top of the column flowing downwards, and lean stripping gas enters
from the bottom flowing upwards. As the gas flows up the column it will absorb water from the
glycol, and exit from the top saturated with water (ideally). Lean glycol exits from the bottom.
Possible stripping gases are atmospheric air, nitrogen or hot combustion gases.
Advantages:
- Less energy consumption than conventional regeneration
- Can re-use known technology
- Less thermal stress on the glycol solution
- Low gas flow rate results in a very compact design of the absorber
- Lower glycol loss than previously described alternatives
Disadvantages:
- Possible problem with oxidation of the glycol if using atmospheric air as stripping gas

34
- Requires equipment for regenerating stripping gas if other than atmospheric air is used
- Expensive
4.3.4 Alternative 4: Using piping as a heat exchanger for the glycol regeneration unit
Idea: Installing a pipe inside another bigger pipe, and exchanging heat from the hot internal lean
glycol to the outer rich cold glycol.
Figure 4.5: Using piping as heat exchanger
A pipe is installed in the center of another pipe and support stands welded between the pipe walls at
suitable intervals. The lean hot glycol is passed through the inner pipe, while the rich cold glycol is
passed through the outer pipe. As the pressure in the inner and outer pipes is almost the same, the
pipe walls can be very thin, enhancing heat transfer and reducing costs.
Advantages:
- Saves weight as the inner pipe walls can be thinner
- Saves floor space as no dedicated heat exchanger is needed
- Easy to manufacture
Disadvantages:
- Increased pressure drop in the fluid flowing in the outer pipe
- May provide insufficient heat transfer, e.g. very long piping is needed
- Difficult to locate leaks in the inner pipe
4.4 Discussion
The concepts involving injection of hot stripping gas for regeneration (Alternative 1 and 2) may
initially sound promising, but after some afterthought and calculations they are discarded. One
problem discovered by doing coarse simulations, is that very large quantities of stripping gas is
needed to regenerate the glycol to even moderate concentrations. E.g. for regeneration of 65
kgmole/h rich TEG to 98 wt% stripping gas flow rates as high as 6500 m3/h @ 200oC was found to be
needed. This implies that large diameter pipes must be used, in addition to very large TEG losses
caused by entrainment in the spent stripping gas. The idea was also that the hot stripping gas should
be provided by burning a portion of the dehydrated natural gas, and then mixing the exhaust gases
with pressurized atmospheric air to obtain the desired temperature. This would however introduce

35
oxygen into the regeneration system, resulting in oxidation of the glycol, adding further to the glycol
losses. Oxidation of glycol would also not be modeled by HYSYS, since it only uses equilibrium
calculations for the different units and does not include chemical reactions.
Another drawback with the hot stripping gas concepts is that the equipment for cooling the lean
glycol is not incorporated. This does not only result in poor energy efficiency for the unit, but also
requires a separate cooling circuit utilizing sea water or air. An alternative is of course to use a heat
regenerator as for conventional glycol regeneration, and use stripping gas only for the last heating
stage. This would however result in a more complex process than the conventional concept,
requiring more equipment and having much larger glycol losses.
The only advantages of using the hot stripping gas concept is very good heat transfer, as the hot and
cold fluids are intimately mixed, and that the bulk temperature of the glycol can be lower during
regeneration . These advantages are however massively outweighed by the larger glycol losses,
faster glycol degradation and huge flow rates of stripping gas.
Using a contactor for regenerating glycol (Alternative 3) is better than staged injection, but still has
the problem of obtaining the hot stripping gas. As mentioned above, the mixing of air with the
exhaust from burning natural gas introduces oxygen into the system, potentially leading to large
glycol loses caused by glycol oxidation. Other stripping gases could have been used, but the stripping
gas itself then also needs to be regenerated. This would introduce another regeneration process,
both worsening the thermodynamic efficiency of the overall process and requiring additional
equipment and energy. If exhaust gas from e.g. a gas turbine was available at the processing
location, this could still not be used for stripping gas as most gas turbines operate under lean
conditions. That is, there is excess of oxygen compared to the amount of fuel, and consequently
there will still be free oxygen present in the exhaust gas. Air is also used for temperature control and
to prevent hot spots (Turns (2000)).
Alternative 4 (using piping as heat exchanger) could probably be incorporated in the concept with
some success, but its use is still limited. Placing a pipe in the center of another pipe implies that the
outer pipe must have a diameter 40% greater than that of the inner pipe to provide the same area
for flow. In addition, the flow rate of the rich glycol is greater than the flow rate of the lean glycol (as
the water has not been extracted yet), thus requiring an even greater diameter of the pipe. As the
perimeter increases as Pi times the diameter difference, the weight saved by using a thin wall for the
inner pipe may easily be compensated by the need for a greater diameter of the outer pipe. In
addition the pressure in the regeneration process is commonly near atmospheric, further reducing
the potential weight savings. Also, to completely replace the heat exchangers a very long pipe is
needed, probably requiring more volume and weight than the heat exchangers. A better solution for
exchanging heat between the rich and the lean glycol would be to place the pipes beside each other
and wrap them in insulation (in addition to using a heat exchanger).
The conclusion of this discussion is therefore that the conventional way of regenerating glycol is
difficult to improve upon when considering weight-, volume- and energy requirements. Some minor
improvements, like using the piping for heat exchange might be possible to incorporate, but the
advantages are too small to make any real difference. None of the proposed alternative concepts for
regeneration will therefore be simulated, as they are not considered worth pursuing.

36
Focus for the rest of this project will therefore be to improve upon the simulation model from my
semester project (Bråthen (2007)) by incorporating pressure losses for the different units, carry-over
for the different separators and modeling of a conventional glycol regeneration process, as well as
utilizing the CPA equation of state (See appendix F) instead of the default glycol fluid package.

37
Chapter 5: Developing the simulation model This chapter will describe the modeling of the alternative dehydration concept in the engineering
simulation software HYSYS (See appendix G for an introduction), stating the different assumptions
made and highlighting the chosen options for the different units. A model for conventional glycol
dehydration is also developed. The process flow diagrams (PFDs) are presented in appendix H.
The input data used for the simulations are from the Snøhvit LNG processing facility and are
presented in appendix I. As earlier mentioned, a relatively new equation of state (EoS) developed by
the Technical University of Denmark (DTU), CPA, is used as fluid package (See appendix F for a
description).
General assumptions
• The entire process is assumed to be adiabatic.
Absorption: The flow rate of gas is much greater than the flow rate of TEG, and the gas
temperature will therefore govern the process temperature. As the retention time for the gas in
the process is very short, the surrounding temperature will have to differ greatly from the gas
temperature to influence the process temperature. This assumption is however not so good for
the recycling streams of wet TEG, as they are much more vulnerable to the surrounding
temperature because of lower flow rates and smaller diameter pipes (e.g. greater perimeter
compared to cross section area).
Regeneration: The temperature difference between the glycol in the regeneration system and
the surroundings can often be quite large, indicating that heat transfer will occur. This will result
in increased heat load for the reboiler, and ultimately increased fuel gas consumption. As the
heat capacity of the glycol is large and the retention time in the piping is small, this contribution
is however small, and is assumed to be neglectable.
Pumps: A pump is a very non-adiabatic unit, but since the flow rate through the pumps are
limited the required energy is small, and the difference from adiabatic operation is therefore
neglected.
• Pressure drop through piping is neglected.
As the piping used for the processes is very limited, the pressure drop across the different units
will constitute most of the pressure drop.
5.1 The TEG injection process
As described in chapter 4.1, the absorption process consists of three stages of injection and
extraction of TEG from the natural gas. The mixing unit from ProPure is described in chapter 3, and is
used for the mixing of TEG and natural gas. For the two first extraction steps, the Deliquidiser from
CDS described in chapter 1.6.1 is used, while for the last extraction step a conventional scrubber
(described in chapter 1.2) is used to reduce the liquid carry-over from the system. See appendix H.1
for PFD.
The ProPure compact mixer
The compact mixer is modeled using a mixing unit in HYSYS. This unit assumes perfect mixing of the
different streams, which is impossible to achieve in practice. So even though the compact mixer
from ProPure has shown to be more efficient than other mixing units available, this still will

38
introduce an error in the simulation model. To model the pressure drop of 0.3 bar across the mixer,
a valve is placed after the mixing unit.
The Deliquidiser
The Deliquidiser is modeled using the two phase separator unit in HYSYS using the default options.
Separation efficiency is given to be 90-99% in table 1.2, meaning that wet TEG will be carried-over to
the following stage. This will marginally reduce the purity of the TEG injected in that stage, but since
the amount is very small it will barely affect the results. I have tried to model this using the carry-
over calculation option available in HYSYS, but it seems to be something wrong with this function, or
that my version of HYSYS does not support it. No matter what I choose and type in, I just get the
message “carry-over calculations failed”. Carry-over is therefore not calculated, introducing a minor
error to the simulated results.
The pressure loss (assumed to be 0.6 bar, referring to table 1.2) is modeled using the same valve as
for the mixing unit, placed in front of the separator. This is based on the assumption that most of the
pressure is lost during the acceleration of the stream through the swirling element, in front of the
actual separation section.
Two Deliquidiser units are used in the absorption process, making up the two first extraction stages.
The liquid from the second Deliquidiser is routed through a pump and injected through the ProPure
compact mixer in front of the first Deliquidiser, while the liquid from the first Deliquidiser is sent to
the regeneration unit.
Glycol pumps
As some pressure is lost through the mixing and separation units, the glycol needs to be pressurized
before it is injected in the preceding stage. This is achieved using regular pumps, one for each of the
recycling streams. The pump unit in HYSYS is used to model each pump, and the default values are
used for all the available options. Pump efficiency is set to 100%, but this will not affect the
simulation results noticeably as the pressure difference across the pump is very small (less than 1
bar) and the flow rate limited.
Gas scrubber
For the last extraction stage a conventional gas scrubber is used instead of a Deliquidiser unit to
reduce the liquid carry-over. The scrubber is modeled using the two-phase separator unit in HYSYS,
using all the default options. To account for the pressure drop, a valve is placed in front of the
scrubber, representing the pressure drop for both the mixing unit and the scrubber. As the scrubber
unit has very few internals, the only pressure drop is through the inlet- and exit facilities, assumed to
be 0.1 bar.
5.2 Regular absorber process
To be able to compare the simulated results for the TEG injection process with conventional glycol
dehydration, an absorption column process is also modeled. The process consists of an inlet
separator and an absorption column, but the inlet separator is omitted since the stream used for
simulation consists of 100% vapor initially. See appendix H.2 for PFD.

39
Absorption column
For the absorption column, the absorber unit in HYSYS is utilized. 10 actual trays are used for the
column, resulting in 4 theoretical trays using a tray efficiency of 40% (See appendix C.4). The
pressure drop across the column is estimated to be 0.2 bar (Coker (2007)). The rest of the options
are left with their default values.
5.3 The regeneration process
The regeneration process is modeled after the standard glycol regeneration process presented in
chapter 2. See appendix H for PFD.
Pressure relief valve
To reduce the required thickness of pipe- and vessel walls, the pressure is lowered as soon as the
rich glycol enters the system. This is accomplished using the nozzle unit in HYSYS and setting the
outlet pressure from the nozzle to 2 bar. Gauge pressure is used because of the pressure drop
through the piping and heat exchangers placed before the regeneration unit, and to avoid venting to
much glycol in the HC flash tank.
Filters
Filters are most important for removing impurities and liquid HC so it doesn’t accumulate in the
circulated TEG over time. When doing equilibrium simulations in HYSYS the filters are therefore not
employed.
HC flash tank
To regain some of the HC absorbed by the glycol and prevent foaming in the regeneration still, the
rich glycol is passed through a flash tank after the pressure relief valve. As there is only one liquid
phase in the rich glycol, the two phase separator unit in HYSYS is used for modeling. All the default
options are used, with the pressure drop set to 0.1 bar. In chapter 2.1.3 the HC flash tank pressure is
recommended to be between 3 and 7 bar, but since the TEG injection concept involves more
intimate contact with the natural gas, more HC is probably absorbed by the TEG. To prevent too
much HC from entering the regeneration still, the pressure is therefore lowered to 2 bar.
Overhead condenser
The overhead condenser is a heat exchanger where the cold rich glycol is used to provide reflux for
the regeneration still. The heater unit in HYSYS is used to model the rich glycol side of the overhead
condenser, while the cooling side is integrated in the distillation column unit. For the heater a
pressure drop of 0.2 bar (typical pressure drop for heat exchangers recommended by Coker (2007))
is specified, while the pressure drop for the condensing side is neglected. Using a recycle element,
the energy stream from the condenser is routed to the heater unit to compute the correct rich glycol
outlet temperature.
Glycol/glycol heat regenerator
One heater and one cooler unit in HYSYS are used for modeling the glycol/glycol heat exchanger. The
pressure drop is specified to be 0.05 and 0.2 bar for the lean and rich side, respectively (Different
pressure drops since a shell-and-tube is commonly used; a smaller pressure drop for the shell side
and a larger pressure drop for the tube side). The outlet temperature for the lean TEG is set to 90oC

40
and the energy stream from the lean cooler unit is recycled using a recycle element to the rich
heater unit. This forces HYSYS to iterate over the outlet temperature of the rich glycol, as it is
dependent on the circulation rate of glycol.
Regeneration still
For modeling the glycol regeneration still, a distillation column unit in HYSYS is used. Four theoretical
trays are specified for the column (that is, four theoretical trays including the reboiler and the
condenser), with the feed entering on tray 2. Specifications for the column are chosen as
recommended by Øi & Bråthen (2000), with the reboiler temperature specified as 204oC and the
reflux ratio as 50% for TEG. The rest of the options are used with their default values. The total
pressure drop is estimated to 5 kPa including the pressure drop across the reflux condenser (Coker
(2007)).
Stripping gas
To be able to simulate dehydration using higher glycol purities, stripping gas is also added to the
regeneration column. The stripping gas is taken from the inlet to the dehydration process using a
splitting unit. The gas is then expanded to the same pressure as the rich glycol entering the stripping
column using a valve unit (110 kPa).
Makeup TEG
As some TEG is lost throughout the process, new TEG needs to be added for the system to converge.
This is accomplished by inserting a mixing element before the glycol pump, merging a “Makeup
TEG”-stream and the regenerated TEG stream. The flow rate of lean TEG is one of the given
parameters for the system, and the “Makeup TEG”-stream is therefore adjusted by HYSYS to obtain
this. The composition of the makeup TEG stream is specified to equal the composition of the lean
TEG from the regeneration still to avoid influencing the TEG leanness.
Glycol pump
A regular pump unit is used for modeling the glycol pump, using all the default values and setting the
efficiency to 100%.
Gas/glycol heat exchanger
As the glycol is injected into the gas stream, the temperature of the lean glycol will very quickly drop
to the gas temperature. The gas/glycol heat exchanger is therefore omitted for the TEG injection
concept. For conventional absorber dehydration a cooler unit is used, with the outlet temperature of
the lean glycol set to 30oC. The pressure drop is specified to 0.2 bar.
5.4 Using different chemicals for dehydration
To decide if TEG is the best suited chemical to use for the compact dehydration process, other
chemicals will be simulated as well. This is done by just altering the composition of the lean
absorbent stream and adjusting the regeneration temperature for the new compound.
Because of problems with my HYSYS license, I was not able to simulate when using amines for
dehydration, so the only alternative components simulated are MEG, DEG and tetra ethylene glycol
(TTG). The dehydration performance of TTG was however so poor that the results are omitted.

41
Also, to be able to make comparisons when using different types of chemicals, the flow rate of
absorbent is given in kg/hr instead of kgmole/hr. Preferably the flow rate should have been given in
liter/hr or m3/hr, but this is not supported by HYSYS.

42

43
Chapter 6: Simulation results This chapter presents the results obtained when simulating using the simulation models described in
chapter 5 together with input data from the Snøhvit LNG processing plant (See appendix I). First the
simulation results for the TEG injection concept is presented and compared to the simulation results
for conventional absorber dehydration. Several simulation cases are used, each shortly described
before the results are presented. Secondly the injection concept is simulated using different types of
absorbent (MEG and DEG), and different parameters of interest compared to TEG. Finally a
discussion comparing the TEG injection concept to absorber dehydration, as well as comparing usage
of different types of absorbent is given.
Because of problems with the CPA EoS increasing the time required for simulation greatly, the
number of data points had to be decreased. This results in that some of the graphs are a bit rough,
but the results are still considered reliable.
6.1 Comparing the TEG injection process to absorber dehydration
The three stage TEG injection concept and conventional absorber dehydration are simulated, and
the different parameters for the process compared. The absorbent flow rate for these paragraphs is
given in kgmole/hr, and one must consider that the molar weight of TEG is approximately 150
kg/kgmole (Kohl & Nielsen (1997) [1]) when evaluating the results.
6.1.1 Dehydration performance
This simulation case is designed to compare the dehydration performance of the three stage TEG
injection concept with conventional absorber dehydration. The reboiler pressure has been kept
constant at 110 kPa, and the flow rate of lean TEG and the regeneration temperature have been
varied. The results are presented below.
Water content (no stripping gas)
Figure 6.1: Water content of dehydrated gas (TEG injection) Figure 6.2: Water content of dehydrated gas (Absorber)

44
The first thing that can be seen from figures 6.1 and 6.2 is that the regeneration temperature has
only a small impact on the water concentration of the dehydrated gas. Lowering the temperature
from 204oC to 200oC, increases the water content by 4 ppm for TEG flow rates greater than
approximately 50 kgmole/hr. For lower flow rates the impact is even smaller, from 2 – 3 ppm. The
same increase in water content is found when further lowering the regeneration temperature to
196oC.
Secondly, using an absorber for dehydration is seen to accomplish lower water concentrations in the
dehydrated gas using lower flow rates of TEG than the TEG injection concept. E.g. for a regeneration
temperature of 204oC and a required water content in the dehydrated gas of 55 ppm, TEG injection
requires approximately 60 kgmole/hr, while the absorber requires only 40 kgmole/hr. Alternatively
the regeneration process used for the absorber can operate at 196oC and still obtain the same
dryness as the TEG injection process regenerated at 204oC using the same TEG flow rate.
The equilibrium water concentration is also affected by the regeneration temperature, and the
difference is approximately 4 ppm for each temperature step for the absorber. For the TEG injection
process, the difference is 3 and 5 ppm going from 204oC to 200oC and 200oC to 196oC, respectively.
Water content (with stripping gas)
This simulation case is also designed to compare the dehydration performance of the TEG injection
concept with conventional absorber dehydration, but now with stripping gas added to the
regenerator (i.e. the purity of the lean TEG is higher). The reboiler pressure and temperature has
been kept constant for this simulation, while the flow rate of stripping gas and flow rate of TEG is
varied. Reboiler pressure has been set to 110 kPa and regeneration temperature to 204oC. Water
saturated natural gas at 64 bar is used as stripping gas, taken from the process stream at the inlet to
the dehydration unit. The results are presented below.
While it was required to study the figures when regenerating without stripping gas to observe which
was the best dehydration process, it becomes much clearer when using stripping gas (See figures 6.3
and 6.4). E.g. using 50 kgmole TEG/hr and 20 kgmole stripping gas/hr for regeneration results in
water content of the dehydrated gas of 27 and 38 ppm for the absorber and TEG injection concept,
respectively. To be able to obtain the same dryness, the TEG injection concept requires either an
Figure 6.3: Water content of dehydrated gas (TEG injection) Figure 6.4: Water content of dehydrated gas (Absorber)

45
increased TEG flow rate of approximately 20 kgmole/hr or increased stripping gas flow of 40
kgmole/hr (combinations of increasing TEG flow and stripping gas flow is also possible).
It can also be observed from figures 6.3 and 6.4 that the equilibrium concentration for the
dehydrated natural gas is very different for the absorber and the injection concept. For a TEG flow
rate of 60 kgmole/hr the equilibrium concentration of water is twice as high for the TEG injection
process, as for the conventional absorber process.
6.1.2 Energy consumption This simulation case is designed to determine the connection between flow rate of TEG,
regeneration temperature and required heat for the reboiler. Heat is normally supplied by burning a
portion of the gas, and is therefore also an important economic parameter. The regeneration
pressure is kept constant at 110 kPa for this simulation, and the regeneration temperature and flow
rate of lean TEG is varied. As the same regeneration process is employed for both absorption
processes, only the data from the absorber process is shown. The results for the injection process is
going to be slightly different, as the process is able to remove less water, and consequently decrease
the load on the regeneration process. However, the differences are so small that it is not considered
prominent enough to show in a separate graph.
Heat required for reboiler (no stripping gas)
Figure 6.5: Heat requirement for reboiler at different regeneration temperatures and TEG flow rates
As can be seen from figure 6.5, the regeneration temperature has very little impact on the required
heat for the reboiler. This is because of the good heat recuperation of the process, exchanging heat

46
between the rich and the lean glycol. So if the glycol is heated another 4oC in the reboiler, this
results in the lean glycol being 4oC warmer, and consequently the rich glycol being heated another
4oC in the glycol/glycol heat regenerator. The small difference is caused by additional vaporization in
the reboiler when increasing the temperature.
The required heat is also seen to be almost linear dependent on the flow rate of lean TEG. The small
deviation from linearity when increasing the flow rate is because the TEG absorbs more water which
again must be vaporized in the regeneration column.
Heat required for reboiler (with stripping gas)
This simulation case is designed to investigate how the addition of stripping gas to the regeneration
column influences the heat required for the reboiler. The regeneration temperature is kept constant
at 204oC and the regeneration pressure at 110 kPa, while the flow rate of lean TEG and stripping gas
is varied. Stripping gas is supplied by extracting a portion of the wet natural gas.
Figure 6.6: Heat requirement for reboiler when introducing stripping gas
From figure 6.6 it can be seen that the addition of stripping gas affects the heat consumption of the
reboiler quite a bit. This is both because the stripping gas itself must be heated, but also because
more water is absorbed by the glycol and needs to be vaporized. For a TEG flow rate of 40
kgmole/hr, an addition of 30 kgmole/hr of stripping gas increases the heat requirement by almost
10%. The added heat is however observed to be independent of the TEG flow rate, and only a
function of the stripping gas flow rate (as all the lines have similar shape).

47
The gradient for the required heat is observed to decline as the flow rate of stripping gas increases.
This is probably because the stripping gas is able to absorb more water from the rich glycol as it
enters the reboiler, so that the amount of water that must be vaporized is reduced. The heat
required is still rising though, indicating that the amount of heat needed for heating the stripping gas
is greater than the heat saved by reduced vaporization.
6.1.3 HC emission
As earlier mentioned, the off gasses from the regeneration column can contain large quantities of HC
which are hazardous for the environment. This simulation case is therefore designed to obtain the
connection between TEG flow rate and emissions of HC through the overhead vapor from the
regeneration column. The regeneration temperature is kept constant at 204oC, the pressure
constant at 110 kPa and no stripping gas is added, while the TEG flow rate is varied. The results for
both the TEG injection concept and conventional absorber dehydration are presented in figure 6.7
below.
Figure 6.7: HC emissions from regeneration column
From figure 6.7 it is seen that for a given flow rate of TEG, there is very little difference in the
amount of HC vented from the regeneration column for the two different dehydration processes.
The TEG injection vents slightly more HC to the surroundings, which is expected because of the more
intimate contact with the natural gas.
The shapes of the curves are also similar, starting off exponential, but approaches linearity for flow
rates greater than approximately 90 kgmole/hr. The reason for this behavior is that when increasing
the flow rate of TEG, the water concentration in the wet gas entering the second and third

48
injection/extraction stage decreases, thereby making the glycol able to absorb more HC in these
stages. However as the water content decreases and approaches equilibrium, no more water can be
absorbed, and the increased amount of HC absorbed becomes linearly dependent of the increase in
TEG flow rate.
To be able to estimate the HC emissions for the different processes in relation to water content in
the dehydrated gas (which is the parameter of primary interest for the dehydration process), one
must however see figure 6.7 in relation to figures 6.1 and 6.2. If the required dryness of the
dehydrated natural gas is for example 60 ppm, the required circulated amount of lean TEG is 50 and
35 kgmole/hr for the TEG injection concept and absorber, respectively (provided no stripping gas is
used). Looking at figure 6.7 this implies that the TEG injection concept vents about twice the amount
of HC compared to absorber dehydration when obtaining a water concentration in the dehydrated
gas of 60 ppm.
Summarized
Table 6.1 presents a comparison of the TEG injection process to regular absorber dehydration. A
water specification of 50 ppm in the dehydrated gas is chosen, and the rest of the parameters
obtained from the simulation results. No stripping gas is used for this comparison.
Table 6.1: Comparing TEG injection to absorber dehydration
Water content Flow rate lean TEG Energy required HC emissions
TEG injection 50 ppm 12750 kg/hr 2.83 MJ/hr 144.4 kg/hr
Absorber 50 ppm 7875 kg/hr 2.16 MJ/hr 62.9 kg/hr
Difference -- 4875 kg/hr (+60%) 0.67 MJ/hr (+31%) 81.5 kg/hr (+130%)
6.2 Using different absorbents for the TEG injection process
To be able to choose the best suited absorbent for the injection dehydration concept, this paragraph
presents the simulation results using different types of absorbent for the injection concept. As
earlier mentioned there was a problem with the amine fluid package in HYSYS, so the only
compounds simulated are MEG and DEG. To be able to compare the parameters for the different
absorbents, the flow rate of absorbent is given as kg/hr in the following paragraphs.
6.2.1 Dehydration performance
This simulation case is designed to compare the dehydration performance when using different
types of absorbent for the TEG injection concept. The absorbents used are MEG and DEG.
Regeneration temperature is kept constant at the maximum recommended regeneration
temperature for the given absorbent at sea level (165oC for MEG , 170oC for DEG and 204oC for TEG
(Arnold & Stewart (1999) [1], Kohl & Nielsen (1997) [1])), regeneration pressure kept constant at 110
kPa, while the flow rate of absorbent is varied.

49
Water content (no stripping gas)
Figure 6.8: Water content in the dehydrated gas for the different absorbents
From figure 6.8 it can be seen that the dehydration performance of the different absorbents vary
greatly. Using MEG requires large flow rates of absorbent just to obtain moderate water
concentrations in the gas, and the lowest concentration possible is as high as about 80 ppm. DEG
actually outperforms TEG with respect to dryness for flow rates lower than approximately 5500
kg/hr, but for higher flow rates TEG is better. It is also noted that DEG and MEG reaches equilibrium
conditions with the dehydrated gas already at about 6000 kg/hr, while TEG has yet to reach
equilibrium at 10 000 kg/hr.
The explanation for the poor dehydration performance of MEG and DEG when compared to TEG is
possibly insufficient leanness of the lean glycol. Using the simulation model it is found that using the
maximum recommended regeneration temperature yields 96.40 wt% 96.57 wt% and 99.18 wt%
purity for MEG, DEG and TEG respectively for a regeneration pressure of 110 kPa.
Water content (stripping gas)
The same as the above case, but stripping gas is now used to increase the purity of the lean
absorbent. Wet natural gas from the inlet of the dehydration process is used as stripping gas, and
the flow rate is varied. The flow rate of lean absorbent is kept constant at 6000 kg/hr.

50
Figure 6.9: Water content for the different glycols when using stripping gas
As expected, the dehydration performance is greatly enhanced by introducing stripping gas in the
regeneration column. Especially MEG benefits greatly from enhanced regeneration, and
outperforms both DEG and TEG for stripping gas flow rates larger than approximately 10 kgmole/hr.
TEG has the best dehydration performance at stripping gas flow rates less than 10 kgmole/hr, but for
flow rates larger than 20 kgmole/hr it is outperformed by both MEG and DEG.
Quite surprisingly, MEG has by far the best dehydration performance after introducing stripping gas,
and water content as low as 10 ppm is achievable with about 65 kgmole/hr of stripping gas. DEG
follows close behind capable of obtaining 15 ppm using 100 kgmole/hr of stripping gas, while TEG is
only capable of obtaining 35 ppm. As the purity of the lean TEG without stripping gas already is more
than 99 wt%, the reason for the insufficient dehydration performance for TEG is the TEG flow rate.
6.2.2 Energy consumption
This simulation case is designed to compare the heat required for the reboiler when regenerating
the different absorbents. No stripping gas is used for this simulation, the regeneration temperature
is kept constant at the maximum recommended temperature for each compound, and the
regeneration pressure constant at 110 kPa. The flow rate of lean absorbent is varied.

51
Figure 6.10: Heat required for the reboiler for the different glycols
From figure 6.10 it is observed that MEG is the absorbent which requires the most heat for
regeneration, which is quite surprising as it is regenerated at the lowest regeneration temperature
of the different compounds. From Kohl & Nielsen (1997) [1] it is however observed that MEG has
both the highest specific heat and heat of vaporization, explaining the required added heat. It is also
observed that the required heat for regenerating DEG and TEG is almost linear, while MEG increases
more than linearly for low flow rates of absorbent. This is probably because the concentration of
water in the rich MEG is very large for low flow rates (vaporizing the water requires more heat than
increasing the temperature of the glycol). For DEG and TEG these low flow rates are not simulated,
but the relation probably also applies to them.
TEG requires the least amount of heat for regeneration, and by closer inspection of figure 6.10, the
difference is found to be quite big. E.g. regenerating 6000 kg/hr of MEG requires the same amount
of heat as regenerating approximately 8200 kg/hr of TEG. Corresponding, regenerating 6000 kg/hr of
DEG requires the same amount of heat as regenerating 7000 kg/hr of TEG.
6.2.3 Loss of absorbent
This simulation case is designed to investigate how the flow rate of absorbent affects the total loss
of absorbent for the dehydration and regeneration process. The regeneration temperature is kept
constant at the maximum recommended regeneration temperature and the pressure constant at
110 kPa, while the absorbent flow rate is varied.

52
Total loss of absorbent (no stripping gas)
Figure 6.11: Total loss of absorbent for the dehydration process
As can be seen from figure 6.11, the absorbent loss for MEG by far exceeds the losses of DEG and
TEG. Already for flow rates as low as 1000 kg/hr the loss is 10 kg/hr, or 1% of the circulated amount.
By inspecting the simulation model, it is found that almost 80% of the loss is from vaporization into
the processed natural gas. This loss is difficult to reduce, and the only measure is to cool the natural
gas to reduce the vapor pressure of the MEG.
The loss when using DEG for dehydration is, although it is much lower than for MEG, observed to be
greater than twice the loss as for using TEG. The loss of TEG varies from approximately 0.7 kg/hr to 1
kg/hr depending on the flow rate.
Total loss of absorbent (stripping gas)
This is the same simulation case as above, with the exception of the absorption flow rate being
constant and the flow rate of stripping gas varied. The flow rate of lean absorbent is kept constant at
6000 kg/hr.

53
Figure 6.12: Total loss of absorbent when using stripping gas
The results from the previous simulation case are further supported by figure 6.12, worsening the
comparison for MEG. For stripping gas flow rates lower than approximately 8 kgmole/hr, the loss
does not increase when adding stripping gas, but it is still formidable 14 kg/hr. When the stripping
gas flow rate is increased beyond 30 kgmole/hr, the loss starts to increase almost exponentially and
totals almost 35 kg/hr when using 45 kgmole/hr of stripping gas. From inspection of the simulation
model, it is found that the loss with the dehydrated natural gas has not increased, and that the
increased loss is from the regeneration column and the flash tank. The loss from the flash tank could
be somewhat reduced by increasing the operation pressure, but then at the expense of more
dissolved HC in the glycol.
Because of the huge loss of MEG, the increase in the losses of DEG and TEG is a bit harder to read
from the figure. A closer inspection however reveals that the losses increase to approximately 3
kg/hr and 1.5 kg/hr for DEG and TEG respectively for a stripping gas flow rate of 45 kgmole/hr.
6.2.4 HC emissions from the regeneration column
This simulation case is designed to investigate how much HC the different absorbents release in the
regeneration column. The regeneration temperature is kept constant at the maximum
recommended regeneration temperature for each compound and the pressure constant at 110 kPa.
The flow rate of lean absorbent is varied, and no stripping gas is used for this simulation.

54
Figure 6.13: HC emissions from the regeneration column for the different glycols
As expected, TEG absorbs a lot more HC than DEG and MEG as can be seen from figure 6.13. For flow
rates lower than approximately 3000 kg/hr the difference is not so big, while it increases for larger
flow rates. DEG absorbs slightly less HC than MEG for flow rates lower than 3000 kg/hr, but for
greater flow rates the situation is reversed.
It can also be observed that the amount of HC vented increases more than linearly for all types of
glycol simulated. This is because of the same reason as described in chapter 6.1.3, that the water
concentration for the last two stages is lowered when increasing the glycol flow rate, making the
glycol able to absorb more HC in these stages. Ultimately a linear relation will be reached, as the
water content in the natural gas can not be lowered further by increasing the absorbent flow rate.
Summarized
Table 6.2 presents comparisons data when using MEG, DEG and TEG as absorbent for the injection
process.
Table 6.2: Comparison of operation data for different absorbents
Lean glycol Stripping gas Water content Energy HC emission Absorbent loss
MEG 6000 kg/hr 15 kgmole/hr 40 ppm 2.30 MJ/hr 8.0 kg/hr 14.61 kg/hr
DEG 7520 kg/hr 24 kgmole/hr 40 ppm 2.42 MJ/hr 17.5 kg/hr 2.11 kg/hr
TEG 7500 kg/hr 18 kgmole/hr 40 ppm 2.23 MJ/hr 57.3 kg/hr 0.68 kg/hr

55
6.3 Discussion
The findings from my semester project (Bråthen (2007)) concerning the dehydration performance of
the TEG injection concept when compared to conventional absorber dehydration is further
supported from the simulation results presented in chapter 6.1.1. The differences are however
smaller, caused by using a more realistic number of theoretical trays for the absorber. Also, if the
requirements for water concentration are less stringent, TEG injection becomes more competitive
and is almost as good as absorber dehydration.
Introducing stripping gas increases the difference in dehydration performance between TEG
injection and absorber dehydration, and the effect of an extra theoretical tray becomes prominent.
TEG injection is however still able to accomplish water concentrations down to 15 ppm in the
dehydrated gas, using 70 kgmole/hr of TEG and 100 kgmole/hr of stripping gas. This is sufficiently
low for many low temperature processes, but probably not economically competitive with using an
absorber.
As expected, the heat consumption of the reboiler is found to be linearly dependent on the flow rate
of TEG and not much affected by the regeneration temperature. Adding stripping gas increases the
heat requirement, but the gradient declines as more stripping gas is added and the need for
vaporization of water is reduced. However, when calculating the heat requirement for each process
related to dryness in the dehydrated gas, the TEG injection concept requires more heat than
absorber dehydration, as the TEG flow rate is larger for injection dehydration.
Venting of HC from the regeneration column is a problem both when using an absorber and TEG
injection for dehydration. Compared to the emission regulations for USA presented in chapter 2, the
flow rate of TEG must be below approximately 10 kgmole/hr to be able to operate the column
without processing the vapor. Looking at figure 6.1 and 6.2 this would result in a water
concentration of about 130 and 110 ppm in the dehydrated gas for TEG injection and absorber
respectively, way above the concentration required for pipeline transport. A vapor handling system
is therefore necessary for both dehydration processes to be able to follow the emission regulations.
When simulating using different types of absorbent for the injection concept, DEG is the glycol
capable of producing the lowest water concentration for flow rates between 2000 and 5000 kg/hr
when no stripping gas is used for regeneration. This is quite surprising, since the lean concentration
of the DEG is only about 96.6 wt%. The obtained dryness is however only approximately 70 ppm,
which in most cases is too high for even pipeline transport specifications. TEG has the worst
dehydration performance for flow rates below 4000 kg/hr, but is the best for flow rates greater than
5500 kg/hr. This is expected, as it has the highest lean purity and therefore will have the lowest
equilibrium concentration when the flow rate is increased towards infinity. The dehydration
performance of MEG is mediocre for flow rates lower than 4000 kg/hr, and becomes the worst for
higher flow rates.
Adding stripping gas to the glycol regeneration column completely changes the dehydration
performance characteristics for the different glycols, now making MEG the superior glycol for flow
rates higher than 10 kgmole/hr of stripping gas. MEG is even able to obtain water concentrations in
the natural gas reaching as low as 10 ppm, which is quite impressive. DEG also performs quite well,
and obtains lower water concentrations than TEG for stripping gas flow rates larger than

56
approximately 15 kgmole/hr. Using large quantities of stripping gas it is even able to obtain
concentrations below 20 ppm. TEG has the best dehydration performance for stripping gas flow
rates lower than 10 kgmole/hr, but is the worst glycol for flow rates larger than approximately 15
kgmole/hr. However, adding 100 kgmole/hr of stripping gas does not improve the dehydration
performance much over adding 30 kgmole/hr, indicating that the flow rate of TEG is the limiting
factor for the dryness.
The energy consumption for regenerating the different glycols varies quite much for a given flow
rate, with TEG being the glycol requiring the least amount. When considering energy consumption,
the important parameter is however the amount of energy required to obtain a given dryness in the
processed gas, and not the energy consumption for a given flow rate of absorbent. Therefore, figure
6.10 must be viewed together with figure 6.8 and 6.9. Ideally I should have given a 3D-figure where
the axis represented glycol flow, stripping gas flow and heat requirement, so it would have been
easier to find the most energy efficient glycol and the ideal operating conditions. Unfortunately
because of the previously described problems with the CPA EoS, this has not been possible.
The graphs for loss of absorbent clearly illustrate why MEG is not used for dehydration, even though
it has proven to have the best dehydration performance of the glycols simulated. Even without
stripping gas, the loss of MEG starts off at a whooping 10 kg/hr for a flow rate of 1000 kg/hr. This is
about 5 and 10 times the loss for DEG and TEG respectively, and much too high to make MEG an
alternative for use in the TEG injection concept. Also as previously noted, most of the loss is with the
dehydrated gas, making it almost impossible to recover. When introducing stripping gas, the results
become even grimmer, and for stripping gas flow rates larger than 30 kgmole/hr the loss of MEG
increases almost exponentially.
Although overshadowed by the huge loss of MEG, the losses of DEG and TEG also increases when
introducing stripping gas. The increase is however only linear, resulting in a loss of about 3 and 1.5
kg/hr of DEG and TEG respectively for a stripping gas flow rate of 45 kgmole/hr. This is well within
the acceptable limits presented in chapter 2. One must however keep in mind that carry-over is
neglected in these simulations, so the real loss for an injection process is going to be higher.
Again, it is of no surprise that TEG absorbs much more HC than MEG and DEG. For all TEG flow rates
larger than approximately 2000 kg/hr, the vapor must be processed to meet American emission
regulations, as previously noted. DEG absorbs less HC than TEG, but already at a flow rate of 3000
kg/hr the HC emission exceeds the American emission limit, and the vapor must be processed. The
vented amount of HC when using MEG has a much gentler slope than TEG and DEG, but also
breaches the emission limit already at 3500 kg/hr. The amount of HC vented is therefore not so
much of a comparison criterion (at least not for this case, using the reference composition and flow
given) when deciding which is the best glycol for the injection dehydration concept. Of course the
load on the vapor handling system would be slightly different for the different glycols, but the added
flow of HC is very small compared to the total flow of vapor (consisting merely of water).

57
Chapter 7: Designing a TEG injection system This chapter uses the simulation model from chapter 5 to obtain operating data for the TEG injection
process for a chosen reference case. First the regular requirements for pipeline dehydration are
presented, before the reference case is chosen. Using the operating data, the sizing procedures for
separators and the different parts of the regeneration process (presented in appendix A and C) is
used to design a complete TEG injection system. Operating data from an operational TEG absorber
process from the Kristin field in the Norwegian North Sea is then presented, before finally a
comparison between the simulated TEG injection system and the operational conventional absorber
is made. All calculations are shown in appendix J.
7.1 Dehydrating for pipeline specifications
In short, the dehydration requirement for pipeline transport demands that under no circumstances,
is water allowed to condense from the gas forming liquid water (Arnold & Stewart (1999) [1]). As
condensation depends on pressure and temperature, the ambient temperature will influence the
maximum allowable water content in the gas, thus the pipeline requirements differs for different
parts of the world. The water content requirement is commonly substituted by a dew point
temperature at a given pressure, representing the temperature at which water from the gas will
start to condense at that pressure. In warmer climates where the sea water temperature is high, a
water dew point requirement of 10 – 15oC may be sufficient, while for the northern gas fields dew
points as low as -20oC can be found (-18oC @ 70 bar is common for the North Sea (Fredheim
(undated))).
In this design the water dew point requirement for the Norwegian North Sea of -18oC @ 70 bar will
be used. To determine the water dew point of the dehydrated gas, a cooler and a three phase
separator is placed after the last TEG injection/extraction stage in the simulation model presented in
chapter 5. The dehydrated gas is then cooled until a separate water phase is formed in the three
phase separator, and this temperature is used as the water dew point temperature. For -18oC and 70
bar the corresponding water concentration is found to be 29 ppm for the reference gas.
As seen from the simulation results presented in chapter 6, several combinations of TEG and
stripping gas flow rates can be used to obtain a given dryness in the dehydrated gas. The main goal
for further development of the TEG injection concept is to reduce the weight and volume of the unit,
and this is therefore emphasized when determining the operation conditions. From the discussion in
chapter 4 and also from my semester project (Bråthen (2007)), it was found that the regeneration
unit, and more specifically the regeneration column, contributed most to the overall weight and
volume of the process. The size of the column is dependent on the amount of vapor present, and the
amount of stripping gas should therefore be limited. By using the simulation model, the following
operating conditions are found to be suitable:

58
Table 7.1: Operating conditions for the TEG injection process
Overhead condenser Flash tank Reboiler
Tgl,i 27.4 oC QG 82.67 m3/hr QL 9,77 m3/hr
Tgl,o 77.6 oC QL 9.31 m3/hr
mgl 9681 kg/hr ρG 2.07 kg/m3
ρL 1021 kg/m3
Glycol/glycol HX Regeneration column 3rd Extraction stage
Tgl,r,i 77.6 oC QG,tot 1616 m3/hr QG 12420 m3/hr
Tgl,r,o 169.2 oC QL 9.54 m3/hr QL 9.171 m3/hr
Tgl,l,i 204.0 oC Qstrip 553 m3/hr ρG 54.79 kg/m3
Tgl,l,o 90.0 oC ρG 0.804 kg/m3 ρL 1026 kg/m3
mgl,l 8999 kg/hr ρL 977.5 kg/m3
Nth 4
7.2 The TEG injection process
7.2.1 The regeneration process
Overhead condenser
To be able to estimate the size of the overhead condenser, the type of heat exchanger and the
overall heat transfer coefficient, U, must be decided. Integrating the heat exchanger in the
regeneration column is chosen to save floor space, and U is assumed to be 568 W/m2K as suggested
by Arnold & Stewart (1999) [1]. The procedure described in appendix C.1 is then used to find a value
for AHT:
AHT = 8 m2
Assuming the heat exchanger consists of merely pipes placed inside the regeneration column, for 10
pipes with a diameter of 10 cm the resulting length would be 2.5 m for each pipe. Using steel pipes 3
mm thick (the pressure is assumed to be lowered before the overhead condenser, so there is almost
no pressure difference), the total weight will be about 190 kg using an average steel density of 7850
kg/m3 as recommended by Elert (2004).
Because of the high heat transfer coefficient when using a condensing medium, the required heat
transfer area is observed to be quite small.
Flash tank
The flash tank is sized using the procedure described in appendix C.2. To minimize the required
space, a vertical configuration is chosen and K1 is assumed to be 0.05 m/s. As there is only one liquid
phase, a liquid retention time of 4 minutes and a liquid height of 1.3 m are chosen. This produces the
following results:
Ut = 1.11 m/s, Di = 0.78 m and L = 3.08 m

59
The resulting slenderness ratio is then calculated to 3.95, which is slightly below the maximum
recommended for vertical separators, thus the calculated diameter is close to the smallest possible.
To estimate the total weight of the vessel, the wall thickness and material are needed. Using the
procedure given in appendix A.6, assuming the material is carbon steel with a maximum stress
tolerance of 126.0 MPa (Arnold & Stewart (2008):p.321) and a maximum allowable working pressure
(MAWP) for the unit of 230 kPa, I find:
tW = 6.4 mm and the resulting total weight, Mtot = 432 kg without glycol.
The reason for the rather thick wall when compared to the low pressure is to ensure rigidity of the
vessel (Coker (2007)).
Glycol/glycol heat exchanger
The glycol/glycol heat exchanger is assumed to be a regular shell and tube heat exchanger with
baffles and fins to provide the best possible heat transfer with the smallest heat exchanger possible.
From Branan (2002):p.34 it is found that 230 W/m2K is a suitable overall heat transfer coefficient.
Assuming the heat exchanger is made from steel, the main dimensions are found to be:
AHT = 125.6 m2, L = 4 m, Do = 1.13 m, tW = 8.1 mm, Npipes = 100, Dpipes = 0.05 m, tw,pipes = 3 mm
and Mtot = 4178 kg
Regeneration column
As the TEG absorbs much more HC than other types of glycol (see chapter 6), structured packing is
used for the regeneration column in case of foaming. HETP is assumed to be 1.2 m, in the lower end
of the recommended interval from appendix C.4. Using K1 = 0.1 m/s from appendix C.4 this gives:
Ut = 3.49 m/s, Di = 0.40 m and Ltot = 6.3 m
Using the same procedure as for separators, the thickness of the column wall is calculated and the
total weight estimated:
tw = 6.42 mm and Mtot = 708 kg (including the overhead condenser)
Reboiler
The size of the reboiler is calculated using the same procedure as for a horizontal two-phase
separator. Assuming the liquid retention time is 5 min, the following is computed:
L = 3.73 m, tW = 6.4 mm and Di = 0.745 m
The weight is then calculated to 488 kg and the total volume to 1.68 m3.
Using the amount of rich glycol to be heated, the required heat is found:
Qreq = 1512 kW
For the same operating conditions the simulation model calculates the heat consumption to be only
698 kW, so the formula clearly overestimates the required heat. However, the simulation model
does not incorporate heat loss to the surroundings, making the real heat requirement higher than
the one simulated.

60
Glycol pump
The pressure difference across the glycol pump is almost 64 bar, but the flow rate is only 8.71 m3/hr.
Thus the weight of the pump is estimated to be 200 kg and the footprint 0.5 m2.
Glycol storage tank
As some glycol is lost throughout the process, a storage tank for makeup glycol is required. The TEG
loss at the operating conditions is found to be 0.76 kg/hr, thus approximately 550 kg TEG in the tank
would be sufficient for one month’s operation without refill. This requires a tank with a volume of
0.565 m3. Choosing a vertical circular storage tank with L=1.5 m and Di = 0.48 m provides this
volume, at the same time reducing the required footprint while maintaining stability. As the storage
tank operates at near ambient pressure, the minimum required wall thickness to ensure rigidity is
stated to be tw = 6.4 mm for the chosen diameter (Coker (2007)). This gives a total weight for the
storage tank of 134 kg without glycol.
Summarized
The results for the regeneration process are presented in table 7.2:
Table 7.2: Weight, volume and footprint for the regeneration process
Regeneration process
Weight [kg] Volume [m3] Footprint [m
2] Glycol volume [m
3]
Flash tank 432,00 1,52 0,49 0,63
Glycol/glycol HX 4 178,00 4,13 4,52 3,60
Regeneration column 708,00 0,84 0,13 0,00
Reboiler 488,00 1,68 2,78 0,81
Glycol pump 200,00 0,25 0,50 0,00
Glycol storage tank 134,00 0,29 0,73 0,28
Total glycol volume 5 469,00 0,00 0,00 5,32
Total 11 609,00 8,71 9,15
As can be seen from table 7.2, most of the equipment for the regeneration process is small and
lightweight, and actually half the weight is from the glycol contained in the system. This is because of
the near ambient pressure, resulting in very thin walls for the different units and the piping. The
small size of the regeneration column is quite surprising, but from appendix J.1 it is seen that the low
vapor density is the reason for the high terminal velocity, and the resulting small diameter.
Compared to operating data presented by Kohl & Nielsen (1997):p.989 it seems to be a bit too small,
but this is probably because zero TEG carry-over is the goal for most operational units, thus the
dimensions are increased. This is also applicable for the flash tank.
The glycol/glycol heat exchanger is observed to be the biggest part of the regeneration process,
constituting almost 50% of the volume and footprint, and about 35% of the weight. This is because
of the very large flow rate of glycol through the unit (as both the rich and the lean glycol must pass
through this heat exchanger), and the large amount of heat that is transferred.

61
7.2.2 The absorption process
Pipeline dimensions
To be able to calculate the natural gas pipeline diameter, the gas velocity is assumed to be 20 m/s.
Using the definition of volume flow, the diameter is then found to be 0.46 m. As the pressure inside
the pipe is much higher than the ambient pressure, it is assumed that higher grade steel is used for
manufacture. Using low-alloy steel with a stress allowance of 172.4 MPa (Arnold & Stewart
(2008):p.321), the resulting wall thickness is calculated to be 11.9 mm.
Deliquidiser
Assuming the Deliquidiser is produced using the same diameter as the pipe, it is found using table
1.2:
L = 2.76 m and h = 1.84 m
The height calculated is however the height of the liquid collection section, and not the height of the
entire unit (which equals the pipe diameter). The total volume of the liquid collection section is
found to be 0.46 m3 by assuming a liquid retention time of 3 minutes.
Using the data calculated for the pipe, the weight is calculated to 382 kg for the pipe segment
required for the unit. Assuming the internals weigh 50 kg and the liquid collection section 100 kg,
the total weight for one Deliquidiser unit is 532 kg.
ProPure compact mixer
The ProPure compact mixer is produced using the same diameter pipe as used for the pipeline, as
mentioned in chapter 3. Assuming the unit needs to be 5 diameters long to provide sufficient mixing,
the weight is found to be 318 kg for the pipe segment. The internal equipment is estimated to weigh
50 kg, making the total weight of the unit 368 kg.
Scrubber
For the last extraction stage a conventional scrubber is employed to reduce the TEG loss for the
process. Using a vertical configuration to save space and assuming K1 = 0.15 m/s and tL = 15 min, the
following results are obtained:
Ut = 0.63 m/s, hL = 0.42 m, Di = 2.64 m and L = 4.06 m
The reason for the small Ut and the corresponding large Di is the high density of the gas, as well as
the large gas volume flow. Calculating the slenderness ratio reveals that it is slightly below the
minimum required value, but increasing the slenderness ratio further means that the liquid
retention time (tL) must be even greater, increasing the amount of TEG stored in the scrubber.
As the pressure within the scrubber and the diameter is quite large, it is assumed that better quality
steel is used for the wall to reduce the required thickness. Using a low-alloy steel with a stress
allowance of 172.4 MPa (Arnold & Stewart (2008):p.321) the wall thickness is calculated to 50 mm,
while the head thickness is 49 mm. The resulting total weight for the unit is found to be 18 096 kg
without TEG.

62
Piping
Piping is also required between the different units in the absorption process. After the mixing unit it
is recommended to have 15 – 20 diameters of straight pipe to enhance the mixing performance.
Assuming 17 diameters is sufficient this constitutes 23.46 m of piping for the three mixing units. Gas
piping between the other units is also needed, estimated to total 5 m. The combined weight of all
the gas piping using a steel density of 7850 kg/hr is then calculated to 3941 kg.
The liquid flow rate is slightly different for the two recycling streams for TEG, but when estimating
the piping, the flow rate is assumed to be the same for both (i.e. the same diameter pipes are used).
Assuming the liquid velocity is 5 m/s the diameter and wall thickness is calculated to be:
Di = 0.026 m and tW = 0.7 mm
Adding a safety margin to the wall thickness, tW = 3 mm is assumed to be sufficient. Estimating the
total length of the pipes to 20 m (a little longer than 2/3 of the total straight pipe length calculated
above), the weight is found to be 43 kg.
Pumps
Pumps are needed for pressurizing the recycled glycol in the TEG injection process. However, as the
pressure drop is very small (only 90 kPa), the pumps are quite small. Their combined weight is
estimated to 50 kg.
Summarized
The results for the TEG injection process is presented in table 7.3.
Table 7.3: Estimated data for the TEG injection process
TEG injection process Weight [kg] Volume [m
3] Footprint [m
2] Glycol volume [m
3]
Deliquidisers 1 064,00 1,01 2,67 0,92
Compact mixers 1 104,00 1,27 3,51 0,00
Scrubber 18 096,00 23,94 5,90 2,30
Gas piping 3 941,00 5,23 13,77 0,00
Recycle piping 43,00 0,02 0,64 0,01
Recycle pumps 50,00 0,003 0,09 0,00
Total glycol volume 3 324,55 0,00 0,00 3,23
Total 27 622,55 31,47 26,58
For the TEG injection process the last stage scrubber is the by far biggest and heaviest part of the
system. It contributes to about 65 % of the weight and 76 % of the volume of the entire unit,
indicating that the process would have been much more compact if an inline separator was used for
the last extraction stage as well. Of course this would increase the TEG carry-over from the system,
probably to a level which would have been unacceptable.
From table 7.3 it can also be observed that the compact mixers are one of the smallest and most
lightweight parts of the system. This is somewhat misleading, as most of the gas piping for the

63
system also is considered as a part of the mixing unit. The straight pipe is, as mentioned in chapter 3,
used to enhance the mixing performance of the unit, thus it is not required. Removing or reducing
the length of the pipe can however lead to incomplete mixing of TEG and natural gas, resulting in
insufficient dryness in the dehydrated gas.
7.2 Data from existing TEG dehydration process
To get a better idea of how the TEG injection process performs, the process is compared to a
conventional process in operation today. It has been quite difficult to get operational data for a
facility, but finally some data from the Kristin field in the Norwegian North Sea was obtained from
Bjotveit & Lærum (2005):p.21. The data is quite coarse, and several important facts are missing, but
at least some comparisons can be made.
Table 7.4: Operational data for the TEG dehydration process at the Kristin platform (Bjotveit & Lærum (2005):p.21)
Mass flow [kg/hr] Size Pressure [bar]
Absorber 699 300 D = 3.2 m, L = 10.5 m 84,5
Regeneration 14 000 BxLxH = 5.5mx12mx14.075m unknown
The flow rate of gas is slightly higher than for the reference gas (681 800 kg/hr for reference gas),
but the difference is so small (2.5 %) that it is considered to have little impact on the sizing. For the
reference gas the pressure is slightly below 65 bar, while the gas for the Kristin field is almost 85 bar.
This will greatly affect the required thickness of the wall for the absorber, and thereby also the
weight of the unit. Higher pressure also means that the density of the gas processed at the Kristin
platform is greater than the reference gas, indicating that the volume flow is similar to or possibly
lower than for the reference gas.
The dew point or water concentration for the dehydrated gas is not mentioned, but since the gas is
to be transported by the Åsgard Transport pipeline, the dew point must be the same as for the
Åsgard platform, which is -18oC at 70 bar (Fredheim (2008)).
Unfortunately the data for the regeneration process is very superficial, but the flow rate is given to
be even higher than for the TEG injection system. This indicates that a lower regeneration
temperature, a higher regeneration pressure or less stripping gas is used. It is also possible that the
simulated TEG amount is underestimated since HYSYS uses equilibrium calculations. The total
pressure is higher for the Kristin gas and the initial water concentration is therefore lower than for
the reference gas (assuming the gas is saturated), thus also pointing in the direction of
underestimation from the simulation model.
Since the intermediate temperatures and flow rates for the regeneration process is unavailable, it is
not possible to use the same procedures as for the TEG injection concept to estimate the sizes of the
different units. Instead the total volume of the regeneration unit is used for comparison.
Absorber
Using the same procedure as for the TEG injection concept, the required wall thickness of the
absorber is calculated. The steel used is assumed to be low-alloy steel with a stress allowance of

64
172.4 MPa (Arnold & Stewart (2008):p.321) and density of 7850 kg/m3 (Elert (2004)). The absorber
uses structured packing for the mass transfer zone, and assuming 4 theoretical trays and HETP of 1.2
m, the weight of the packing is estimated to 7720 kg (200 kg/m3).
tW = 83.2 mm, Vtot = 93.5 m3 and Mtot = 90 080 kg
The large height of the absorber indicates that the inlet separator is integrated into the column, thus
the weight and volume is already calculated.
7.3 Comparing TEG injection and absorber dehydration
Gathering the estimated values for the TEG injection process and the conventional absorption
process gives the following table:
Table 7.5: Comparing TEG injection and conventional absorber dehydration
Conventional absorber process TEG injection
Weight Volume Footprint Weight Volume Footprint
Absorption 90 080 kg 94 m3 8,9 m2 Absorption 27 623 kg 31 m3 27 m2
Regeneration 929 m3 66 m2 Regeneration 11 609 kg 8,7 m3 9,2 m2
Total 90 080 kg 1 023 m3 74,9 m2 Total 39 232 kg 39,7 m3 36,2 m2
Starting with the absorption part of the process, it is observed from table 7.5 that the TEG injection
concept is much better for both weight and volume of the process. The absorption part of the
conventional absorber process is more than twice as heavy as the entire TEG injection system,
weighing more than 90 tons. However the process pressure is 20 bar higher for the Kristin process
than for the simulated case, thus affecting the required wall thicknesses and thereby also the
weight.
The volume for the absorption part of the absorber process is almost three times as big as for the
TEG injection process, totaling 94 m3. Volume is however not a very good comparison criterion, as it
is important where the volume is located. For the absorber process very little floor space is required
for the volume (i.e. the footprint is small), while for the TEG injection process most of the volume is
in contact with the floor. This results in the footprint for the TEG injection process being three times
as big as for the absorber process, even though the volume for the absorber process is three times
that of the injection process. Most of the footprint for the TEG injection process (about 50%) is
required for the piping between the injection/extraction stages. These pipes can potentially be
placed on top of each other, thus reducing the footprint to some extent. Also, the total volume of
the absorption part of the absorber process is only made up from the absorber column, while the
volume for the TEG injection process is distributed over multiple units. Thus it is possible to utilize
smaller unoccupied volumes for the TEG injection process, whereas the absorber process requires a
large unoccupied volume.
As previously noted the regeneration processes are difficult to compare, as very little data is given
for the Kristin process. The size of the regeneration process is given on the form width times length
times height, indicating that the entire process is mounted in one module. The height is given to be

65
over 14 meters, but this is probably just for the regeneration column, and not for the entire module.
Comparing the footprint for the two processes, it is found that the footprint of the regeneration unit
for the absorber process is about 8 times as large as for the TEG injection process. This is because all
utility equipment like ladders, pumps, instrumentation and gangways etc are included, while this is
neglected for the simulated case. Looking at the flow rate of TEG into the regeneration unit, the flow
rate for the absorber process is almost 50% greater than for the TEG injection system, thus implying
that the regeneration unit also has to be larger. How much larger is however difficult to say from the
obtained operational data.
When comparing the TEG injection process to the operational absorber unit from the Kristin
platform, one must however keep in mind that all the values for the TEG injection process are
estimated and simulated. Many important factor when designing a real unit is neglected, e.g.
maintenance equipment, instruments, safety equipment and so forth. The operating conditions may
also change over the lifetime of a facility, which must then be incorporated into the design.

66

67
Overview Based on the literature for separators and the regeneration process for glycol presented in chapter 1
and 2 and an analysis of potential improvements in chapter 4.1, the rest of chapter 4 was used for
suggesting and discussing improvements to the TEG injection process. Most of the improvements
concerned the regeneration process, using hot stripping gas to extract water from the rich glycol
instead of the method of vaporization as is used today. Unfortunately none of the suggested
improvements were incorporated into the process, as a couple of major disadvantages were
discovered. Firstly the required amount of stripping gas required to regenerate the glycol was much
larger than what was first estimated, and secondly the loss of glycol was much too high to be
acceptable. Thirdly the stripping gas was to be obtained by burning a portion of the natural gas and
mixing the exhaust gases with atmospheric air. This would have introduced oxygen into the system,
further increasing the glycol losses. Substituting the regular separators used for the two first
extraction stages of the TEG injection process with Deliquidiser units from CDS and using the
ProPure compact mixer for TEG injection was therefore the only improvements incorporated.
From simulations using the simulation model from chapter 5, the findings from my semester project
(Bråthen (2007)) was again confirmed in chapter 6.1; the TEG injection concept requires more
circulated TEG than absorber dehydration to obtain a given dryness. Of course this does not come as
a very big surprise, as the absorber has more theoretical trays than the TEG injection process, but
the difference was bigger than expected. E.g. to obtain 55 ppm water in the dehydrated gas using
the maximum recommended regeneration temperature for TEG, the TEG injection process requires
50% more circulated TEG than the absorber process. Adding stripping gas to the regeneration
column further worsens the comparison, and also increases the difference in equilibrium dryness for
the two processes; the absorber is able to reach water contents as low as 5 ppm, while the TEG
injection process strives to obtain 15 ppm. Comparing the HC emissions through the over head vapor
from the regeneration column surprisingly revealed that there is very little difference between TEG
injection and absorber dehydration.
Using MEG and DEG as absorbents for the TEG injection concept also revealed some interesting
result. When regenerating the absorbents using the maximum recommended temperature, DEG was
actually the best absorbents for flow rates lower than 5000 kg/hr, while TEG was the best for higher
flow rates. Adding stripping gas however completely changed the situation, with MEG being the by
far best absorbent for stripping gas flow rates higher than 10 kgmole/hr. DEG has the second best
dehydration performance, while TEG is only able to obtain the highest water concentration. For TEG
the flow rate of absorbent seems to be the limiting factor, as there is almost no difference in
obtained water concentration when adding 30 kgmole/hr or 100 kgmole/hr of stripping gas. The
reason why MEG is not used for dehydration is however clearly revealed when investigating the loss
of absorbent. Even when using no stripping gas, the loss of MEG is 10 kg/hr for circulation rates as
low as 1000 kg/hr. For comparison, the loss of DEG and TEG are 1.3 kg/hr and 0.6 kg/hr, respectively.
Adding stripping gas further increases the loss, and for MEG the loss increases almost exponentially
for stripping gas flow rates higher than 30 kgmole/hr.
Comparing the estimated design for the TEG injection concept to the operational TEG absorber
process from the Kristin platform showed that the TEG injection concept was considerably smaller
and more lightweight. The footprint is however larger, mainly because of the gas piping required
between the injection stages and the conventional scrubber used for the last stage. Much weight

68
and volume could therefore be saved by using an inline separator for the final separation stage as
well. As noted in chapter 7, it is however difficult to interpret much from these comparisons, as none
of the reasons for the design of the operational process is known. The unit could be sized for future
increase in the gas load, e.g. if new gas fields were expected to be found in the region, new wells
connected to the platform and so forth. Also, the flow rate of TEG is almost 50% higher for the
operational absorber compared to TEG injection when handling about the same amount of gas,
while the simulated results show that the absorber requires considerably less absorbent than TEG
injection. This points in the direction of underestimation of absorbent circulation rate by the
simulation model, or that underlying reasons requires the absorber on the Kristin platform to have
this high circulation rate.

69
Conclusion Based on the presented discussions the following conclusions are reached:
1) As long as the absorbent is regenerated using the conventional regeneration process, the
TEG injection concept is not competitive with regular absorber dehydration.
2) When comparing weight and volume for the absorption part of the process, the TEG
injection concept is much better than conventional absorber dehydration.
3) TEG injection is able to fulfill both pipeline- and cold process water content specifications.
4) Using injection of hot stripping gas for glycol regeneration is unsuited, as the amount of
stripping gas required is too large, the glycol losses to high, and the stripping gas cannot be
supplied by mixing hot exhaust gasses with atmospheric air because of oxidizing of glycol.
5) TEG is considered a better absorbent for the injection concept over DEG as TEG requires less
energy for regeneration, has lower loss of absorbent, and has the best dehydration
performance for low to moderate flow rates of stripping gas (See table 6.2).
6) MEG is unsuited for dehydration at ambient temperatures because of the large glycol loss
with the dehydrated gas.

70

71
References Apex Process Group (2007): Glycol Dehydration, http://www.apexprocess.com.au/Technologies/GasProcessing/GlycolDehydration/tabid/84/Default.aspx, last visited 6.3.2008. Arnold, Ken & Stewart, Maurice (1998): Surface Production Operations Volume 1: Design of Oil
Handling Systems and Facilities – 2nd
Edition, Houston, Texas: Gulf Publishing Company, ISBN 0-88415-821-7. Arnold, Ken & Stewart, Maurice (1999): Surface Production Operations Volume 2: Design of Gas-
Handling Systems and Facilities – 2nd
Edition, Houston, Texas: Gulf Publishing Company, ISBN 0-88415-822-5. 1: p. 195 - 221 2: p. 141 - 149 Arnold, Ken & Stewart, Maurice (2008): Surface Production Operations Volume 1: Design of Oil
Handling Systems and Facilities - 3rd
Edition, Amsterdam: Elsevier, ISBN 978-0-7506-7853-7. 1: p. 150 - 235 2: p. 316 - 346 3: p. 244 – 308 Asheim, Harald & Herfjord, Hans (1984): Separator Design, Simple Theory, Difficult Theory and Some
Reality, Trondheim: The Two-Phase Flow Committee at NTH. AspenTech (undated)
1. Aspen HYSYS, http://www.aspentech.com/products/aspen-hysys.cfm, last visited 2.6.2008.
2. Company Overview, http://www.aspentech.com/corporate/index.cfm, last visited 2.6.2008.
Austrheim, Trond (2006): Experimental Characterization of High-Pressure Natural Gas Scrubbers, Bergen: Dissertation for the degree philosophiae doctor (PhD). Bjotveit, Arve & Lærum, Jorunn Lovise (2005): Gassbehandlingssystemet på Kristin, Haugesund: Høgskolen Stord/Haugesund. Branan, Carl (2002), editor: Rules of Thumb for Chemical Engineers – 3
rd Edition: A Manual of Quick,
Accurate Solutions to Everyday Process Engineering Problems, USA: Elsevier Science, ISBN 0-7506-7567-5. Bråthen, Audun (2007): Development of Processes for Natural Gas Drying, Trondheim: Semester project conducted at Department of Energy and Process Engineering, NTNU. Carroll, John J. (2003): Natural Gas Hydrates: A Guide for Engineers, USA: Elsevier Science, ISBN 0-7506-7569-1, p.143 - 164. CDS Separation Technology (undated): CDS-Gasunie Cyclone, http://www.fmctechnologies.com/CDSSeparationTechnologies.aspx, last visited 13.2.2008. Coker, A. Kayode (2007): Ludwig`s Applied Process Design for Chemical and Petrochemical Plants –
Volume 1, 4th
Edition, Oxford: Elsevier Science, ISBN 978-0-7506-7766-0, p. xviii – xxvi.
72
Comart (undated): Coldfinger® Technology, http://www.comart.biz/main/index.php?id_pag=24, last visited 4.4.2008. CSG Inc. (2008): Specific Gravity and Viscosity of Liquids, http://www.csgnetwork.com/sgvisc.html, last visited 7.3.2008. DTU (2008): Development of the CPA EOS, http://www.ivc-ses.kt.dtu.dk/Research/Major%20Projects/Development%20of%20the%20CPA%20EOS.aspx, last visited 23.4.2008. Elert, Glenn (2004): Density of Steel, http://hypertextbook.com/facts/2004/KarenSutherland.shtml, last visited 19.5.2008. Fredheim, Arne Olav (2008): Personal e-mail. Fredheim, Arne (undated): Gas Processing Part 1: Off-shore gas conditioning for rich gas transport, Part of the syllabus for TEP4185: Industrial Process, NTNU. Gardener, G.C. (1984): Talk on Natural Separation and Separation by Impaction, Trondheim: The Two-Phase Flow Committee at NTH. Gas Processors Suppliers Association (GPSA) (2004): Engineering Data Handbook, Oklahoma: GPSA. 1: Section 7 2: Section 19 3: Section 20 Guo, Boyun & Ghalambor, Ali (2005): Natural Gas Engineering Handbook, Houston, Texas: Gulf Publishing Company, ISBN 0-9765113-3-9.
1: p. 123 – 151 2: p. 93 - 120
Hydrotechnik UK (2008): Customized Water Glycol Cleanup Rigs, http://www.hydrotechnikstore.com/Filter-Cool%20Water%20Glycol.htm, last visited 7.3.2008. Incropera, Frank P. & DeWitt, David P. (2002): Fundamentals of Heat and Mass Transfer – 5
th edition,
New York: John Wiley & Sons Inc., ISBN 0-471-38650-2, p. 641 – 680. Jones, Davis S.J. & Pujadò, Oeter R. (2006), editors: Handbook of Petroleum Processing, Dordrecht: Springer, ISBN 1-4020-2819-9, p.877 - 942. Kalgraff, Bernt (2008): Personal e-mail. Kidnay, Arthur J. & Parrish, William R. (2006): Fundamentals of Natural Gas Processing, Boca Raton, Florida: CRC Press, ISBN 0-8493-3406-3, p. 133 - 163. Kohl, Arthur & Nielsen, Richard (1997): Gas Purification – 5
th Edition,
Houston, Texas: Gulf Publishing Company, ISBN 0-88415-220-0. 1: p. 953 - 989 2: p. 6 – 35 3. p. 40 - 60

73
Kolmetz, Karl & Zygula, Timothy M. (2000): Resolving Process Distillation Equipment Problems, Presentation at the 5th Annual Regional Olefins Conference October 31st – November 3rd 2000, Johor Bahru, Malaysia. Kontogeorgis, Georgios M., Voutsas, Epaminondas C., Yakoumis, Iakovos V. & Tassios, Dimitrios P. (1996): An Equation of State for Associating Fluids, Ind. Eng. Chem. Res. Vol. 35 No. 11 p.4310-4318. Kontogeorgis, Georgios M., Folas, Georgios K., Muro-Suñé, Núria, von Solms, Nicolas, Michelsen, Michael L. & Stenby, Erling H. (2007): Modeling of Associating Mixtures for Applications in the Oil &
Gas and the Chemical Industries, Fluid Phase Equilibria 261 2007 p. 205 – 211. Lyons, William C. & Plisga, Gary J. (2005), editors: Standard Handbook of Petroleum & Natural Gas
Engineering – Second Edition, Oxford, UK: Elsevier, ISBN 0-7506-7785-6, section 6: p.274 - 295. Moran, Michael J. & Shapiro, Howard N. (1998): Fundamentals of Engineering Thermodynamics – 3
rd
Edition, West Sussex, England: John Wiley & Sons Ltd, ISBN 0-471-97960-0. Moss, Dennis R. (2004): Pressure Vessel Design Manual – 3
rd Edition,
Oxford, UK: Elsevier, ISBN 0-7506-7740-6, p. 15 - 30. Nassar, Vivian L., Bullin, Jerry A. & Lyddon, Lili G. (2000): Solubility of Hydrocarbons in Physical
Solvents, Bryan, Texas: Bryan Research & Engineering Inc. Technical Papers, http://www.bre.com/portals/0/technicalarticles/Solubility%20of%20Hydrocarbons%20in%20Physical%20Solvents.pdf, last visited 2.3.2008. Nilsen, Finn Patrick, Linga, Harald, Fantoft, Rune, Nilsen, Inge Sverre Lund & Eide, Geir Inge (2006): Method for Mixing Fluids, United States Patent Office, patent no. 7128276 B2. ProPure (2005): ProPure - H2S Scavenging Technology, http://www.propure.com/Downloads/H2s_brchure_Justert.pdf, last visited 10.4.2008. ProPure (undated): ProPure Mixing Technology, ProPure presentation obtained from Bernt Kalgraff ([email protected]) 3.4.2008. Prosernat (undated): Drizo®, http://www.prosernat.com/en/processes/gas-dehydration/Drizo/, last visited 4.4.2008. Schook, Rob & Håland, Trygve (undated): Cost-Effective De-Bottlenecking of Separation Facilities by
use of Inline Technology, http://www.fmctechnologies.com/upload/de-bottlenecking.pdf, last visited 7.4.2008. Soave, Giorgio (1971): Equilibrium Constants from a Modified Redlich-Kwong Equation of State, Chemical Engineering Science Vol. 27 No. 6 1972 p.1197-1203. StatoilHydro (undated): Ormen Lange, http://www.statoilhydro.com/en/OurOperations/ExplorationProd/partneroperatedfields/OrmenLange/Pages/default.aspx, last visited 4.4.2008. The Two-Phase Flow Committee at NTH Lecture Series No.9 (1984): Plenty Metrol Separator Design, Trondheim: Tapir trykk.

74
Toshiba (undated): Foam Control in Amine and Dehydration Units during Gas Sweetening, www.unikor.net/m_data/upfiles/td_1122610083.ppt, last visited 28.4.2008. TTI Environmental (undated): Corrosion Examples, http://www.ttienv.com/corrosion_examples.htm, last visited 6.3.2008. Turns, Stephen R. (2000): An Introduction to Combustion: Concepts and Applications, Singapore: McGraw-Hill, ISBN: 0-07-235044-X, p.365-366. Twister BV (undated), http://www.twisterbv.com/, last visited 13.2.2008. Voutsas, Epaminondas, Perakis, Christophoros, Pappa, Georgia & Tassios, Dimitrios (2007): An
Evaluation of the Performance of the Cubic-Plus-Association Equation of State in Mixtures of Non-
polar, Polar and Associating Compounds: Towards a Single Model for Non-polymeric Systems, Fluid Phase Equilibria 261, 2007 p.343-350. Wertheim, M. S. (1986): Fluids with Highly Directional Attractive Forces.III. Multiple Attraction Sites, Journal of Statistical Physics Vol. 42 No. 3/4 1986 p.459-476. White, Frank M. (2003): Fluid Mechanics - 5
th Edition,
New York: McGraw-Hill, ISBN 0-07-119911-X. World Oil Magazine (2003): Successful revamp of turbo-expander NGL recovery process, World Oil Magazine Vol.224 No.4 April 2003, http://www.compositecatalog.com/magazine/MAGAZINE_DETAIL.asp?ART_ID=1993&MONTH_YEAR=Apr-2003, last visited 2.6.2008. Øi, Lars Erik (2003): Estimation of Tray Efficiency in Dehydration Absorbers, Chemical Engineering and Processing Vol. 42 No. 11 2003 p.867 – 878. Øi, Lars Erik & Bråthen, Terje (2000): Calculation of TEG Dehydration Unit in HYSYS, Hyprotech 2000: Amsterdam, November 6-10th 2000.

75
Appendices
Appendix A: Separator design
Important factors influencing separator design includes (Arnold & Stewart (2008) [1], Guo &
Ghalambor (2005) [2]):
• Minimum, average and peak flow rates for both gas and liquid
• Operating and design pressures and temperatures
• Composition and physical properties of the fluids
• Designed degree of separation
• If slugs can develop in the feed stream
• Presence of impurities
• Foaming
• Corrosion from the gas or liquids
• Available space at operation location
• Weight limitations at operation location
After establishing the above factors, a preliminary design can be made based on engineering models,
standards and most of all; engineering experience. This appendix will give a short introduction to a
set of models enabling preliminary designs for horizontal and vertical separators. Centrifugal
separators are not covered, as they require very detailed design including CFD-analysis.
A.1 Falling velocity
The first decision when designing a separator, is choosing either a horizontal or a vertical
configuration (or other special configuration, e.g. centrifugal). As earlier mentioned a horizontal
configuration is generally cheaper, and it is therefore commonly regarded as the design basis for
most projects. Conditions may however dictate the use of vertical separators instead, e.g. space
limitations, problems with solid deposition or slug flow.
Regardless of orientation of the separator, the falling velocity of the smallest droplets separated in
the gravity settling section must be determined. The falling velocity (also referred to as terminal
velocity) (Ut) will dictate the required minimum diameter for the separator, and can be determined
from the semi-empirical formula A.1, known as the Sounders-Brown equation (Asheim & Herfjord
(1984):p.5).
1
2
1L G
t
G
U Kρ ρ
ρ −
= ⋅
(Formula A.1: Falling velocity)
Where K1 is a semi-empirical constant based on the smallest droplet separated out (in addition to
field experience) (normally in the range 0.035 – 0.051 m/s (Asheim & Herfjord (1984))), ρG is the gas
density and ρL is the liquid density [kg/m3]. Branan (2002):p.132 gives a chart for estimating K1 based
on the liquid to gas ratio.
The formula is developed by manipulating the equation for the different forces acting on a falling
drop (drag and gravity), and by assuming that the drag force follows Stokes law. Stokes law assumes
laminar flow, which is rarely the situation for the flow around a droplet in an oil/gas separator. This

76
implies that the drag in reality is larger than estimated by Stokes law, making formula A.1
overestimate the falling velocity of the droplet (depending on the chosen value for K1). Alternatively
formula A.2 (Arnold & Stewart (2008):p.199, modified) can be used instead, incorporating the drag
coefficient (CD), the acceleration of gravity (g) and the diameter of the smallest droplet to be
separated (dm [m]). For a complete derivation of formula A.2, see Arnold & Stewart (2008) [1].
11
224
3
m L Gt
D G
d gU
C
ρ ρρ
⋅ −= ⋅ ⋅ ⋅
(Formula A.2: Falling velocity)
A.2 Horizontal separators
Both horizontal and vertical separators must be sized for liquid- and gas capacity. Liquid capacity
means that gas bubbles caught in the liquid must have sufficient time to escape to the vapor phase
before the liquid leaves the vessel, while gas capacity means that liquid droplets must have sufficient
time to fall to the liquid phase before the gas leaves the vessel. For gas capacity the falling velocity is
important, dictating the inner diameter (Di) and effective length (Leff) of the vessel. Effective length is
the length of the separator vessel available for separation, i.e. the entire length of the vessel except
the inlet and exit sections (See figure A.1). By setting the retention time for the gas equal to the time
it takes for a drop to fall from the top of the vessel to the liquid interface (the longest distance
possible) and assuming that the vessel is half full of liquid, formula A.3 can be derived (See appendix
B):
4 Geff i
t
QL D
Uπ⋅ = ⋅ (Formula A.3: Gas capacity constraint)
Figure A.1: The different sizes for a horizontal separator (adapted from Arnold & Stewart (2008):p.211)
Where QG is the gas volume flow rate under operating conditions [m3/s] and Ut the falling velocity
from formula A.1 or formula A.2. When determining the falling velocity for a horizontal separator, a
K1 value of 0.13 – 0.17 is recommended (depending on the length) (GPSA (2004) [1]). Note that the
K1 value is much higher than recommended in appendix A.1. This is from the previously described
reason that there always will be a force acting towards the liquid interface for horizontal separators,
regardless of the gas velocity. The falling velocity calculated using the above recommended K1 value
is therefore used to calculate the maximum velocity before carry-over can be anticipated.

77
By choosing a retention time for the liquid (tL) (based on engineering experience), a known fluid flow
rate (QL) and still assuming that the vessel is half full of liquid, formula A.4 can be derived (See
appendix B):
2 8eff i L LL D Q t
π⋅ = ⋅ ⋅ (Formula A.4: Liquid capacity constraint)
As can be seen from formula A.3 and formula A.4, several combinations of Leff and Di will fulfill the
requirements for gas- and liquid capacity. There is however a general design rule, that the ratio of
Leff to Di (“slenderness ratio”) should be between 2.5 and 5 for horizontal separators (GPSA (2004)
[1]). The smaller the diameter, the lower the cost and the weight of the vessel (Arnold & Stewart
(2008) [1]), so it is beneficial to use the biggest slenderness ratio possible. Greater slenderness ratio
than 4 are used at the risk of re-entraining liquid in the gas, and should therefore be thoroughly
checked.
[ ] 2.5,5.0eff
i
LSlenderness ratio
D≡ ∈ (Formula A.5: Slenderness ratio)
After determining suitable values for Leff and Di based on formula A.3, A.4 and A.5, the total length of
the vessel can be determined from the formula A.6 (Arnold & Stewart (2008):p.212):
, if design is governed by gas capacity
4, if design is governed by liquid capacity
3
eff i
eff
L D
LL
+
= ⋅
(Formula A.6: Total length)
The majority of the two-phase separators operated in the oil and gas industry is operated
approximately half filled with liquid (Arnold & Stewart (2008) [1]). Sizing a separator other than half
full requires a more complex expression for the gas capacity, in addition to more empirical
constants. This is therefore omitted in this report, and those interested are referred to e.g. Arnold &
Stewart (2008) [1].
Branan (2002):p.132 presents an alternative method for sizing horizontal separators by multiplying
K1 for formula A.1 with a factor of 1.25, and then use the same procedure as for vertical separators
as presented below. This however, may lead to unnecessary large diameters, and consequently
higher costs. For a preliminary design it may although still be good enough.
Guo & Ghalambor (2005):p.101 also employs formula A.1 for determining the falling velocity, but
gives a table for K1 based on the configuration of the separator. Based on calculated liquid settling
volume and the falling velocity, suitable combinations for total length and inner diameter are given
in a set of tables for both vertical and horizontal separators. The maximum available diameter in the
table is however only 60 inches (1.5 m), which limits the use to systems with moderate to low gas
flow.

78
A.3 Vertical separators
For vertical separators, the gas flows in the opposite direction of the force of gravity, thereby
limiting the gas velocity as previously stated. The maximum allowable gas velocity is therefore equal
to the falling velocity of the smallest droplets to be separated out in the gravity settling section
derived previously from formula A.1 or A.2. Assuming that the design velocity equals the falling
velocity and using the given gas flow rate, formula A.7 can be obtained (See appendix B):
1
24 Gi
t
QD
Uπ
= ⋅
(Formula A.7: Gas capacity constraint)
By selecting a settling time for the liquid (tL) (based on engineering knowledge) and a known liquid
flow rate (QL), the following formula can be derived (See appendix B):
2 4L i L Lh D Q t
π⋅ = ⋅ ⋅ (Formula A.8: Liquid capacity constraint)
Where hL is the height of the liquid volume [m].
As for horizontal separators, there are combinations of parameters
fulfilling formula A.7 and A.8, but the restriction on the slenderness
ratio applies to vertical separators as well. Slenderness ratio is
normally no greater than 4 to keep the liquid height to a reasonable
level, and ratios between 3 and 4 are normal (Arnold & Stewart
(2008) [1]).
After determining the inner diameter and the liquid height, the total
height of the vessel can be determined from formula A.9 (Arnold &
Stewart (2008):p.224, modified):
2, 0.2
1, 0.2
L L
L i L
h hL
h D h
+ ≤=
+ + ≥ (Formula A.9: Total length)
A.4 Special considerations for designing scrubbers
As earlier mentioned, scrubbers are separators designed to remove only small quantities of liquid,
where the gas to liquid ratio is very high. Because of space limitations vertical configurations are
most commonly employed, but horizontal designs can also be used. As the liquid quantities are
small, the bulk separation in the gravity settling section becomes less important, and the scrubber
can be designed with a higher internal gas velocity than a separator. Austrheim (2006):p.30 presents
a discussion for choosing appropriate values for K1 in the Sounders-Brown equation (formula A.1) for
scrubbers, arguing that K1 should be between 0.1 and 0.3 m/s depending of the scrubber internals.
For demisting internals (e.g. mist extractors) values below 0.15 m/s is recommended, while
additional equipment e.g. cyclones or vane packs downstream of the demisting section could
increase the K1 value towards 0.3 m/s. It should also be noted that pressure and feed stream
composition affects the maximum allowable K1.
Figure A.2: Forces acting
upon a falling droplet in a
vertical separator (adapted
from Arnold & Stewart
(1998):p.127)

79
A.5 Three phase separators
Design of a three-phase separator is slightly different than a two-phase separator. The equations for
gas/liquid separation are the same (formula A.3 and A.7), but the separation of liquids require
additional calculations. It can be shown that the flow around a settling drop of liquid in another
liquid is laminar (Arnold & Stewart (2008) [3]), and thus Stokes` law govern the drag forces. The
falling velocity of a liquid drop (L1) in another liquid (L2) can then be calculated from (Arnold &
Stewart (2008):p.262):
5 2
1 2, 1/2
2/1
5.56 10,m L L
t L
L W W
SG dU SG
ρ ρµ ρ ρ
⋅ ⋅∆ ⋅= ∆ = −
(Formula A.10: Falling velocity liquid/liquid)
Where ΔSG is the difference in specific gravity for the two liquids, dm the diameter of the droplet [m]
and μL1/2 the dynamic viscosity of the continuous liquid (cP). Liquid L1 is assumed to be the heaviest
liquid.
It is difficult to predict the droplet size to be separated out without conducting small scale
experiments for the same separator design. This is however expensive and not always possible, so
Arnold & Stewart (2008) [3] recommends using dm = 500 micron for oil/water separation and dm =
200 micron for glycol/HC separation in absence of experimental data.
A.5.1 Horizontal three-phase separators
The design criteria for liquid capacity can be expressed for a horizontal three-phase separator,
assuming 50% filled with liquid, as (See appendix B for derivation):
( )2
1 1 2 2
8eff i L L L LL D Q t Q t
π⋅ = ⋅ ⋅ + ⋅ (Formula A.11: Liquid capacity, horizontal 3-phase)
In addition the height of the different liquid layers must be established, to ensure sufficient time for
entrained liquids to settle out. The height can be calculated from formula A.12 (See appendix B for
derivation).
1/2,max , 2/1 1/2L t L Lh U t= ⋅ (Formula A.12: Maximum height of liquid layer)
Where hL,max is the maximum height of each liquid layer [m] for the entrained droplets to be
separated, that is, the heavy liquid droplets must have time to sink to the liquid/liquid interface, and
the light liquid droplets must have time to rise, before the liquid leaves the vessel.
Total length and slenderness ratio are calculated as for two-phase horizontal separators, see
appendix A.2, but slenderness ratios as high as 5.0 are common (Arnold & Stewart (2008) [3]).
For designing three-phase separators other than half full of liquid, see Arnold & Stewart (2008) [3].
A.5.2 Vertical three-phase separators
The settling constraint for a three-phase separator is based on the requirement that the heavy liquid
must have sufficient time to fall to the liquid/liquid interface, and the light liquid must have
sufficient time to rise (Formula A.13, see appendix B for derivation).
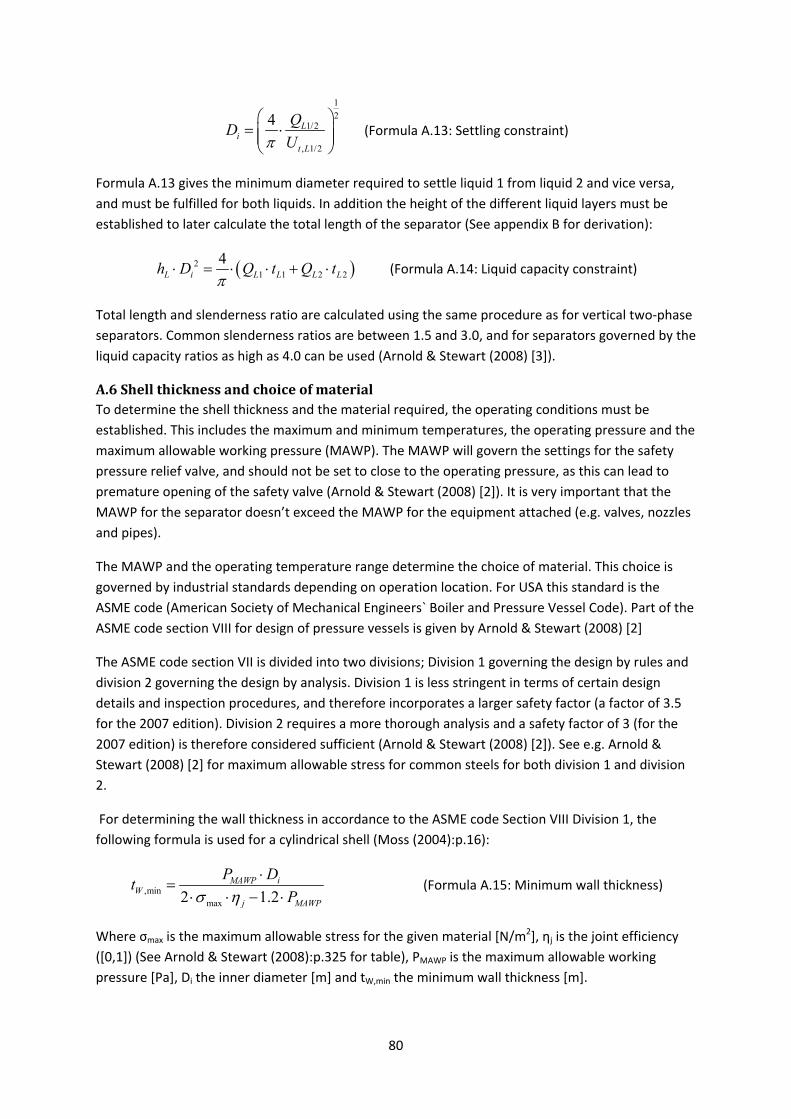
80
1
21/2
, 1/2
4 Li
t L
QD
Uπ
= ⋅
(Formula A.13: Settling constraint)
Formula A.13 gives the minimum diameter required to settle liquid 1 from liquid 2 and vice versa,
and must be fulfilled for both liquids. In addition the height of the different liquid layers must be
established to later calculate the total length of the separator (See appendix B for derivation):
( )2
1 1 2 2
4L i L L L Lh D Q t Q t
π⋅ = ⋅ ⋅ + ⋅ (Formula A.14: Liquid capacity constraint)
Total length and slenderness ratio are calculated using the same procedure as for vertical two-phase
separators. Common slenderness ratios are between 1.5 and 3.0, and for separators governed by the
liquid capacity ratios as high as 4.0 can be used (Arnold & Stewart (2008) [3]).
A.6 Shell thickness and choice of material
To determine the shell thickness and the material required, the operating conditions must be
established. This includes the maximum and minimum temperatures, the operating pressure and the
maximum allowable working pressure (MAWP). The MAWP will govern the settings for the safety
pressure relief valve, and should not be set to close to the operating pressure, as this can lead to
premature opening of the safety valve (Arnold & Stewart (2008) [2]). It is very important that the
MAWP for the separator doesn’t exceed the MAWP for the equipment attached (e.g. valves, nozzles
and pipes).
The MAWP and the operating temperature range determine the choice of material. This choice is
governed by industrial standards depending on operation location. For USA this standard is the
ASME code (American Society of Mechanical Engineers` Boiler and Pressure Vessel Code). Part of the
ASME code section VIII for design of pressure vessels is given by Arnold & Stewart (2008) [2]
The ASME code section VII is divided into two divisions; Division 1 governing the design by rules and
division 2 governing the design by analysis. Division 1 is less stringent in terms of certain design
details and inspection procedures, and therefore incorporates a larger safety factor (a factor of 3.5
for the 2007 edition). Division 2 requires a more thorough analysis and a safety factor of 3 (for the
2007 edition) is therefore considered sufficient (Arnold & Stewart (2008) [2]). See e.g. Arnold &
Stewart (2008) [2] for maximum allowable stress for common steels for both division 1 and division
2.
For determining the wall thickness in accordance to the ASME code Section VIII Division 1, the
following formula is used for a cylindrical shell (Moss (2004):p.16):
,min
max2 1.2
MAWP iW
j MAWP
P Dt
Pσ η⋅
=⋅ ⋅ − ⋅
(Formula A.15: Minimum wall thickness)
Where σmax is the maximum allowable stress for the given material [N/m2], ηj is the joint efficiency
([0,1]) (See Arnold & Stewart (2008):p.325 for table), PMAWP is the maximum allowable working
pressure [Pa], Di the inner diameter [m] and tW,min the minimum wall thickness [m].

81
In addition the thickness of the heads (top and bottom) of the vessel must be calculated. Ellipsoidal
heads are the most common (Arnold & Stewart (2008):p.320) and their thickness is calculated from:
,min
max2 0.2
MAWP iW
j MAWP
P Dt
Pσ η⋅
=⋅ ⋅ − ⋅
(Formula A.16: Minimum wall thickness for ellipsoidal head)
These equations are valid for cylindrical vessels for tW,min < 0.25Di and PMAWP < 0.385 * σmax *ηj (Moss
(2004)).
To account for possible corrosion, a safety margin of 0.125 inches (3.2 mm) for non-corrosive service
and 0.250 inches (6.4 mm) for corrosive service is added to the wall thickness resulting from formula
A.15 and A.16 (Arnold & Stewart (2008) [2]). Also, to ensure rigidity of the vessel, a minimum wall
thickness of 6.4 mm for vessels with diameter up to 1.07 m, 8.1 mm for diameters up to 1.52 m and
9.7 mm for greater diameters is recommended (Coker (2007)).

82

83
Appendix B: Derivation of functions for sizing separators
The falling velocity (Ut and Ut,L) used in some of the formulas, can be obtained from one of the below
formulas (Asheim & Herfjord (1984):p.5, Arnold & Stewart (2008):p.196,262):
[ ]1
2
1 1, 0.035,0.051L Gt
G
U K Kρ ρ
ρ −
= ⋅ ∈
11
224
3
m L Gt
D G
d gU
C
ρ ρρ
⋅ −= ⋅ ⋅ ⋅
5 2
1 2, 1/2
2/1
5.56 10,m L L
t L
L W W
SG dU SG
ρ ρµ ρ ρ
⋅ ⋅∆ ⋅= ∆ = −
Formula A.3: Gas capacity constraint for horizontal two-phase separators:
Developing an expression for the effective length (Leff) and inner diameter (Di), by setting the
retention time for the gas equal to the time it takes for a drop to fall from the top of the separator to
the liquid interface.
Assumptions:
- Vessel is half full of liquid
- Known QG and Ut
Gas retention time: eff
G
G
Lt
U= Falling time: 2
i
f
t
D
tU
= Area available for gas: 21
2 4G iA D
π= ⋅ ⋅
Gas velocity: 2
8
G GG
Gi
Q QU
AD
π= =
⋅
24
2 8 2
eff i effi i GG f eff i
G t G t t
L D LD D Qt t L D
U U Q U U
π
π
⋅ ⋅= ⇒ = ⇒ = ⇒ ⋅ = ⋅
⋅ ⋅ ⋅
Formula A.4: Liquid capacity constraint for horizontal two-phase separators:
Choosing a liquid retention time and using the expression for retention time to develop an
expression for the liquid capacity of a horizontal separator.
Assumptions:
- Vessel is half full of liquid
- Known QL and tL
Liquid retention time: LL
L
Vt
Q= Volume available for liquid: 21
2 4L i effV D L
π= ⋅ ⋅ ⋅
2
2 8
8
i effLL eff i L L
L L
D LVt L D Q t
Q Q
π
π
⋅ ⋅= = ⇒ ⋅ = ⋅ ⋅
⋅

84
Formula A.7: Gas capacity constraint for vertical two-phase separators:
Setting the gas velocity equal to the falling velocity of the smallest droplet to be separated in the
gravity settling section, and derive a function for the minimum required diameter of a vertical
separator.
Assumptions:
- UG = Ut
- Known QG and Ut
Gas velocity: GG
G
QU
A= Area available for gas: 2
4G iA D
π= ⋅
1
2
2
4 4G G GG t t i
G i t
Q Q QU U U D
A D Uπ π
= ⇒ = = ⋅ ⇒ = ⋅
Formula A.8: Liquid capacity constraint for vertical two-phase separators:
Choosing a liquid retention time and deriving an expression for the liquid height (hL) and inner
diameter (Di) by using the expression for retention time.
Assumptions:
- Known QL and tL
Liquid retention time: LL
L
Vt
Q= Volume available for liquid: 2
4L i LV D h
π= ⋅ ⋅
22 4
4
i LLL L i L L
L L
D hVt h D Q t
Q Q
ππ
⋅ ⋅= = ⇒ ⋅ = ⋅ ⋅
⋅
Formula A.11: Liquid capacity constraint for horizontal three-phase separator
Assumptions:
- Known QL1/2 and tL1/2
- Vessel 50% full of liquid
Settling time: 1/21/2
1/2
LL
L
Vt
Q= Volume available for each liquid: 2 1/2
1/2
1
2 4
LL eff i
L
AV L D
A
π= ⋅ ⋅ ⋅ ⋅
Total liquid area: 1 2L L LA A A= +
2 21 2
1 21 2
1 1 2 2
8 8,
L Leff i eff i
L L L LL L
L L L L
A AL D L D
V A V At t
Q Q Q Q
π π⋅ ⋅ ⋅ ⋅ ⋅ ⋅
= = = =
Adding the two above equations gives:

85
( )2 21 21 1 2 2 1 1 2 2
8
8
L LL L L L eff i eff i L L L L
L
A At Q t Q L D L D t Q t Q
A
ππ
+⋅ + ⋅ = ⋅ ⋅ ⋅ ⇒ ⋅ = ⋅ ⋅ + ⋅
Formula A.12: Maximum height of liquid level in horizontal three-phase separator
Assumptions:
- Known Ut,L1/2 and tL1/2
Retention time: 1,max 2,max
1 2
, 2 , 1
, L L
L L
t L t L
h ht t
U U= =
Rearranging: 1,max , 2 1 2,max , 1 2, L t L L L t L Lh U t h U t= ⋅ = ⋅
Formula A.13: Settling constraint for vertical three-phase separator
Assumptions:
- Known QL1/2 and Ut,L1/2
- UL1=Ut,L1 and UL2=Ut,L2
Liquid velocity: 1/21/2
LL
L
QU
A= Cross section area: 2
4L iA D
π= ⋅
1
21/2 1/2 1/2
1/2 , 1/2 , 1/22 , 1/2
4
4
L L LL t L t L i
L t Li
Q Q QU U U D
A UD
π π
= ⇒ = = ⇒ = ⋅
⋅
Formula A.14: Liquid capacity constraint for vertical three-phase separator
Assumptions:
- Known QL1/2 and tL1/2
Volume of each liquid layer: 2 2
1 1 2 2, 4 4
L L i L L iV h D V h Dπ π
= ⋅ ⋅ = ⋅ ⋅
Retention time for each liquid: 1 21 2 1 1 1 2 2 2
1 2
, , L LL L L L L L L L
L L
V Vt t V Q t V Q t
Q Q= = ⇒ = ⋅ = ⋅
2 2
1 1 2 2 1 1 1 2 2 2, , 4 4
L L L L L L L i L L L iV V V V Q t h D Q t h Dπ π
= = ⇒ ⋅ = ⋅ ⋅ ⋅ = ⋅ ⋅
( ) ( )2 2
1 2 1 1 2 2 1 2 1 1 2 2
4
4L L L L L L L i L L L i L L L LV V V Q t Q t D h h h D Q t Q t
ππ
= + ⇒ ⋅ + ⋅ = ⋅ ⋅ + ⇒ ⋅ = ⋅ ⋅ + ⋅

86

87
Appendix C: Design of a glycol regeneration unit
As for separator design, a lot of factors influence the design of the glycol regeneration system. In
addition to the factors mentioned in appendix A, other important factors are:
• Choice of glycol
• Flow rate of glycol
• Required purity of lean glycol
• Ambient temperature and pressure
C.1 Overhead condenser
The size of the overhead condenser is dependent on the amount of reflux required for the
regeneration still, the flow rate of glycol, and the chosen design.
First of all, the outlet temperature of the rich glycol must be calculated (See appendix D for
derivation):
( ), , , ,
reflux
gl o gl i p G G SAT fg G
gl gl
mT T c T T h
m c = + ⋅ ⋅ − + ⋅
(Formula C.1)
Where Tgl,o is the rich glycol outlet temperature [K], Tgl,I the rich glycol inlet temperature [K], mreflux
the mass flow of reflux [kg/s], mgl the mass flow of rich glycol [kg/s], cgl the heat capacity of the rich
glycol [J/kg*K], cp,G the heat capacity for the gas in the regeneration column at constant pressure
[J/kg*K], TG the temperature of the gas in near the overhead condenser [K], TSAT the saturation
temperature for the gas at pressure near the overhead condenser [K], and hfg,G the heat of
vaporization/condensation for the gas in the regeneration column near the overhead condenser
[J/kg]. Arnold & Stewart (1999) [1] recommends designing for glycol outlet temperatures in the
range 353 – 368 K (80 – 95oC). Typical values for required reflux is between 25 and 50% of the water
evaporated from the glycol (Kohl & Nielsen (1997) [1], Arnold & Stewart (1999) [1])
After determining the rich glycol outlet temperature, the total heat transfer surface required (AHT)
can be estimated from formula C.2 (see appendix D for derivation):
( )( )
, ,
, ,
1
2
gl gl gl o gl i
HT
SAT gl o gl i
m c T TA
U T T T
⋅ ⋅ −=
⋅ − ⋅ −
(Formula C.2: Required area for heat transfer)
Where U is the overall heat transfer coefficient for the overhead condenser [W/m2*K].
The overall heat transfer coefficient (U) is dependent on both the fluids involved, the geometry of
the heat exchanger, the thickness of the walls, the flow regime in the channels/tubes and a lot of
other factors. For initial design it can however be estimated from tables, e.g. Branan (2002):p.34.
Arnold & Stewart (1999) [1] suggests using U = 568 W/m2K, but this seems conservative compared to
Branan (2002):p.34.

88
Using the calculated heat transfer area (AHT) and choosing the design of the heat exchanger (e.g.
plate/fin, shell and tube etc.), the overall size of the heat exchanger can be estimated. For a more
thorough design procedure and an introduction to heat exchangers, Incropera & DeWitt (2002) is
recommended.
Note: Sizing a heat exchanger is an iterative process, as several of the factors can be varied. For
example a portion of the glycol stream can be routed past the heat exchanger, resulting in higher
outlet temperature of the glycol and a smaller heat transfer area. At the same time, the pressure of
the regeneration still can be changed, altering the saturation temperature and the heat capacity of
the gas, giving yet another result.
C.2 Flash tank
The flash tank is sized using the same procedures as described for separators in appendix A.
Depending on if there are liquid HC present or not, a three- or two-phase separator design is
employed respectively.
C.3 Glycol/glycol heat exchanger
The glycol/glycol heat exchanger must be calculated a little different than the overhead condenser,
as there is no condensation, just two liquids exchanging heat. Assuming the outlet temperature of
the rich glycol is the unknown, formula C.3 can be derived (see appendix D):
( ), ,
, , , , , , , ,
, ,
gl l gl l
gl r o gl r i gl l i gl l o
gl r gl r
m cT T T T
m c
⋅= + ⋅ −
⋅ (Formula C.3: Outlet temperature glycol/glycol HX)
Assuming countercurrent flow, the total required heat transfer area can then be calculated from
(Incropera & DeWitt (2002):p.650):
( ) ( ) ( ), , , , , , , , , , , , , ,
, , , ,
, , , ,
,
ln
gl l gl l gl l i gl l o gl l o gl r i gl l i gl r o
HT
gl l o gl r i
gl l i gl r o
m c T T T T T TA LMTD
U LMTD T T
T T
⋅ ⋅ − − − −= =
⋅ − −
(Formula C.4)
As mentioned earlier for the overhead condenser, the calculated required surface area for heat
transfer together with the chosen design enables the total size of the heat exchanger to be
estimated. This design is also considered an iterative process, as the mass flow of glycol (both rich
and lean), inlet temperatures and outlet temperature for the lean glycol can be varied. Arnold &
Stewart (1999) [1] recommends outlet temperature of the rich glycol to be in the range 408 – 423 K
(135 – 150oC). In addition it is important that the outlet temperature of the lean glycol is not too
high, as this can damage the glycol pump.
C.4 Stripping column
The first decision to be made in designing a stripping column, is whether to use trays or packing for
the mass transfer zone. Trays are typically used for large units handling clean and trouble free fluids
(i.e. noncorrosive, nonfoaming etc.), while packing is used for smaller units handling troublesome
fluids (See chapter 2.1 and 2.2 for a more thorough discussion). Packing is also preferred for
operating locations with limited space (e.g. offshore platforms) or moving operation (e.g. floating
operation facilities).

89
Determining the column diameter can be done by several means, one of which is to use the same
procedure as for separator sizing presented in appendix A. For trayed columns with 24 inch tray
spacing (0.61 m), Guo & Ghalambor (2005) [2] recommends using K1= 0.05 m/s, while Kohl & Nielsen
(1997) [2] gives different values for K1 based on the liquid to gas ratio and tray spacing. After
determining the falling velocity (Ut) from formula A.1 or A.2, the required diameter can be calculated
from formula A.7. When calculating the required diameter, it is important to use the largest gas flow
for the column, usually found at the bottom near the reboiler (Kohl & Nielsen (1997) [1]). If stripping
gas is used in the stripping column, this must also be taken into account when calculating the
required gas capacity.
For packed columns, the Sounders-Brown correlation from appendix A can also be used, but now
using K1= 0.1 m/s (Kohl & Nielsen (1997) [1], GPSA (2004) [2]). Alternatively a more detailed
procedure is described by Jones & Pujado (1997), calculating the diameter using the flooding criteria
for the tower.
In determining the height of the column, the number of actual trays or feet of packing is required.
Actual trays are calculated using the number of theoretical trays (equilibrium is obtained at every
theoretical tray) and dividing by the tray efficiency (See formula C.5). Tray efficiency can be
estimated using graphical techniques or empirical correlations, see Kohl & Nielsen (1997) [2] or Øi
(2003) for an introduction. For conservative design, the efficiency can be estimated as 25% (Arnold &
Stewart (1999) [1]). Height required between the trays vary with the tower diameter and flow
conditions, and general design guidelines are given by Kohl & Nielsen (1997) [2].Lyons & Plisga
(2005) recommends using tray spacing of 55 – 60 cm regardless of column diameter and types of
trays.
THA
t
NN
η= (Formula C.5: Actual number of trays)
The number of theoretical trays can be found through analysis of the components of the rich glycol,
in addition to operating conditions, usually resulting in 2 – 3 theoretical trays for a stripping column
for glycol (Kohl & Nielsen (1997) [1], Arnold & Stewart (1999) [1]). As previously noted many glycol
regeneration columns are however designed with an excess of trays to minimize the glycol loss
through the overhead vapor (Kohl & Nielsen (1997) [1]).
Feet of packing is found using the HETP (“Height equivalent to theoretical plate”) and multiplying by
the number of theoretical trays. HETP is difficult to predict accurately, and empirical formulas and
engineering experience is often applied (Kohl & Nielsen (1997) [2]). Values between 3.7 and 5.0 ft
(1.13 – 1.53 m) are common, but values as high as 8 ft (2.44 m) is also experienced (Kohl & Nielsen
(1997) [1], Arnold & Stewart (1999) [1]). Branan (2002):p.87 presents a table for HETP for different
types of commercial packing elements.
In addition to allow space for packing or trays, inlet- and exit facilities must also be incorporated.
This depends strongly on tower design; if overhead condenser and reboiler are integrated in the
column, etc.

90
C.5 Reboiler
The most common correlation for estimating required reboiler heating duty, is the one proposed by
Sivalls (1976) (Cited by Kohl & Nielsen (1997):p.985), see formula C.6 (converted to metric units).
557.43req glq Q= ⋅ (Formula C.6: Required heat for reboiler)
Where qreq is in kilowatts [kW] and Qgl in [l/s].
GPSA (2004) [2] claims that a factor of 418.07 in formula C.6 already overestimates the required
heat duty. This is however very dependent on the operating conditions, e.g. water content of rich
glycol, rate of reflux, heat loss from the regeneration column etc.
For sizing a kettle type reboiler the same procedure as for sizing two phase horizontal separators
presented in appendix A.2 can be used by assuming a liquid retention time.

91
Appendix D: Derivation of equations for designing a TEG injection process
Formula C.1: Outlet temperature of rich glycol from overhead condenser
Assumptions:
- Known fluid properties
- Known mass flow
- Known vapor temperature near the overhead condenser in the regeneration still
( ) ( )( ) ( )( )
, , , ,
, , , ,
, ,
, ,
, reflux reflux p G G SAT fg G oc gl gl gl o gl i
reflux oc reflux p G G SAT fg G gl gl gl o gl i
reflux p G G SAT fg G
gl o gl i
gl gl
q m c T T h q m c T T
q q m c T T h m c T T
m c T T hT T
m c
= ⋅ ⋅ − + = ⋅ ⋅ −
= ⇒ ⋅ ⋅ − + = ⋅ ⋅ −
⋅ ⋅ − + ⇒ = +⋅
Formula C.2: Required heat transfer area for overhead condenser
Assumptions:
- Known fluid properties, U
- Known temperatures
( ) ( )
( ) ( )( )
( )
, ,
, ,
, ,
, ,
, ,
, , , =2
1
2
gl o gl i
oc HT G gl oc gl gl gl o gl i gl G SAT
oc oc HT G gl gl gl gl o gl i
gl gl gl o gl i
HT
SAT gl o gl i
T Tq U A T T q m c T T T T T
q q U A T T m c T T
m c T TA
U T T T
+= ⋅ ⋅ − = ⋅ ⋅ − =
= ⇒ ⋅ ⋅ − = ⋅ ⋅ −
⋅ ⋅ −⇒ =
⋅ − ⋅ −
Formula C.3: Outlet temperature of rich glycol from glycol/glycol heat exchanger
Assumptions:
( ) ( )( ) ( )
( )
, , , , , , , , , , , , , ,
, , , , , , , , , , , , , ,
, ,
, , , , , , , ,
, ,
, gl r gl r gl r gl o r gl i r gl l gl l gl l gl o l gl i l
gl r gl l gl r gl r gl o r gl i r gl l gl l gl o l gl i l
gl l gl l
gl r o gl r i gl l i gl l o
gl r gl r
q m c T T q m c T T
q q m c T T m c T T
m cT T T T
m c
= ⋅ ⋅ − = ⋅ ⋅ −
= ⇒ ⋅ ⋅ − = ⋅ ⋅ −
⋅⇒ = + ⋅ −
⋅

92

93
Appendix E: Process Flow Diagram for Drizo and Coldfinger processes
Figure E.1: PFD for glycol dehydration process with Drizo regeneration unit (adapted from World Oil Magazine (2003))
Figure E.1 shows the layout of the glycol dehydration process with a Drizo process added to the
regeneration unit. The blue equipment is the basis equipment for a typical glycol dehydration
process, while the red equipment is extra equipment needed for the Drizo process.
Figure E.2: PFD for glycol dehydration process with Coldfinger regeneration unit (adapted from Comart (undated))
Figure E.2 shows the layout of the glycol dehydration process with a Coldfinger process added to the
regeneration unit. The Coldfinger unit is surrounded by a square; the red flow being heat transferred
from the vessel to keep the Coldfinger cold, the blue stream being water and the green stream being
glycol.

94

95
Appendix F: The Cubic-Plus-Association (CPA) Equation of State (EoS)
When simulating a process using simulation software like HYSYS, an equation for the different
physical properties (enthalpy, density, entropy etc) is needed to predict the behavior of the
components involved. Components interact differently depending on what mixture they are a part
of, and the choice of equation is therefore subject to the chosen components. Mixtures of glycol,
water and HC are especially hard to model, as both glycol and water are associating components.
This appendix will give a short introduction to the CPA EoS, which is able to handle the glycol, water
and HC mixture, and is used in this project.
F.1 The equations
The EoS describes the relation between pressure, volume and temperature for a given substance in
either vapor or liquid phase, the simplest EoS being the ideal gas law (See e.g. Moran & Shapiro
(1998):p.93). The CPA EoS is an extended ideal gas law, which incorporates three component
constants and also accounts for associating components (See formula F.1 (Kontogeorgis et al.
(2007):p.2)).
( ) 1 ln ( )1 (1 )
( ) 2 i
i
i A
i A
R T T R T gP x X
v b v v b v
α ρρ
ρ ⋅ ⋅ ∂
= − − ⋅ ⋅ + ⋅ ⋅ ⋅ − − ⋅ + ∂ ∑ ∑ (Formula F.1)
Where P is the total pressure [Pa], R is the universal gas constant [kJ/kmole*K], v the molar
volume [m3/kmole], b a component constant [m3/kmole], α(T) the energy parameter (See formula
F.4), ρ the molar density [kmole/m3], g( ρ ) the radial distribution function (See formula F.3), xi the
mole fraction of component i and XAi the fraction of sites belonging to molecule i that do not form
bonds with other sites (See formula F.2). The last term in the equation is the association term, and
will equal zero for all non-associating compounds (as the fraction of sites not bonded will equal 1.0).
The EoS is then reduced to the well known Soave-Redlich-Kwong (SRK) EoS (Kontogeorgis et al.
(2007)).
XAi is found from formula F.2 (Kontogeorgis et al. (2007):p.2):
1
1 , ( ) exp 12
i j
i j i j i j i j
j
A B i j
A j B A B A B A B
j B
b bX x X g
R T
ερ ρ β
− +
= + ⋅ ⋅ ⋅∆ ∆ = ⋅ − ⋅ ⋅ ⋅ ∑ ∑
Where ΔAiBj is known as the association strength, εAiBj as the association energy and βAiBj as the
association volume.
The radial distribution function is defined from formula F.3 (Kontogeorgis et al. (2007):p.2):
1 1( ) ,
1 1.9 4g bρ η ρ
η≡ = ⋅ ⋅
− ⋅ (Formula F.3)
Finally the energy parameter α(T) is given from formula F.4 (Kontogeorgis et al. (2007):p.2):
( )2
0( ) 1 1 , r r
crit
TT a c T T
Tα = ⋅ + ⋅ − =
(Formula F.4)

96
Where a0 and c are constants subject to the components involved, Tr the reduced temperature and
Tcrit the critical temperature.
In addition to the equation itself it is therefore necessary to know five parameters for each
component involved (a0, b, c, βAiBj and εAiBj) to be able to solve the equation. These are obtained by
fitting vapor pressure and liquid density data to experimental data. For non-associating compounds
only the first three parameters are required, which can be obtained via critical properties and
acentric factors (Kontogeorgis et al. (2007)).
F.2 Mixing rules
When simulating mixtures, mixing rules must be applied to obtain global values for the model
constants. Several mixing rules have been developed, and which one to use is subject to the
components involved. Different mixing rules are also employed for the different model constants.
For the energy parameter the geometric mean rule is applied (Kontogeorgis et al. (2008):p.2):
(1 )mix i j i j ij
i j
a x x a a k= ⋅ ⋅ ⋅ ⋅ −∑∑
(Formula F.5)
Where kij is an interaction parameter [0,1].
For the b parameter regular mean is used (Formula F.6 (Kontogeorgis et al. (2008):p.2):
mix i i
i
b x b=∑ (Formula F.6)
If two associating components are involved (as is the case with water/glycol mixtures), mixing rules
for the association energy and association volume is also needed. Again several are available, but the
ones used for simulation in this project are the Elliot Combining Rule (ECR) rules (Kontogeorgis et al.
(2008):p.3):
2
i i j j
i j
A B A B
A B
ε εε
+= (Formula F.7)
i j i i j j
i j
A B A B A B
ij
b b
bβ β β
⋅= ⋅ ⋅
(Formula F.8)
F.3 Experience
The CPA EoS is a relatively new EoS first proposed by Kontogeorgis et al. (1996) from the National
Technical University of Athens, Greece in 1996. It combines the physical term from the widely used
SRK (Soave-Redlich-Kwong) EoS (See e.g. Soave (1971)) with the association term from the SAFT
(Statistical Association Fluid Theory) EoS (See e.g. Wertheim (1986)). For non-associating
components CPA reduces to SRK as previously noted, having the advantage that constants
developed for the SRK EoS can be used in CPA for non-associating components. CPA has been
extensively tested during the last ten years, and proven to be a very good EoS for modeling almost
any component mixture (Voutsas et al. (2007)).
Further development of the CPA EoS is conducted by the research project CHIGP (Chemicals in Gas
Processing) lead by Georgios Kontogeorgis at the Technical University of Denmark (DTU (2008)).

97
Appendix G: Introduction to Aspen HYSYS 2006
Aspen HYSYS is a simulation software package provided by the American AspenTech company. The
company was founded in 1981 to commercialize technology developed as part of the Advanced
System for Process Engineering (ASPEN) project at the Massachusetts Institute of Technology (MIT).
Aspen HYSYS has been on the market for more than 20 years, and is one of the leading process
modeling tools available today (AspenTech undated [2]).
The program presents a steady state solution for a given process, and can handle both static and
dynamic input data. The equation solver runs continuously (as long as it is not stopped by the user),
and new output values for changes in input values will therefore appear immediately. As the
solution algorithm is designed to calculate both ways, output values can also be given to calculate
input values. (AspenTech undated [1])
The process is modeled in a process flow diagram (PFD), using common process components like
compressors, separators, heat exchangers, pumps, mixers and valves. Different options are available
for each component, including heat and pressure loss, efficiency and working temperature and
pressure, and are defined by the user. Detailed options are also available, for example design and
layout, reactions within units and carry-over-calculations. The components are connected through
material streams, modeling the transportation of mass from one unit to the next. If two process
units are going to be very far apart in the physical process, a pipe module can be inserted to also
model the pressure loss. If the unit delivers or requires energy, a corresponding energy stream is
applied to transfer the energy.
Thermodynamics and fluid properties are contained in “fluid packages”. It is very important to
choose a suitable fluid package for the process modeled, as some packages are very accurate for HC
calculations, while others are very accurate for processes involving water. Special packages, e.g.
Amine package are also available through third-part vendors. (AspenTech undated [1])
When starting to model a project, all the components (the substances) in the process must be
defined, resulting in a component list. A suitable fluid package then has to be selected based on the
component list, before the user is allowed to enter the simulation environment, where an empty
PFD will appear. Different process components can now be selected from the object palette and
added to the PFD, where the user gives the required input values (varies for the different
components). Material streams can then be defined, and for each input stream (or output stream)
two independent variables must be given (e.g. pressure and temperature), in addition to the stream
composition and flow rate. When the required input (or output) data is given, the solver will
automatically start, calculating the rest of the material streams, unit outputs and other unknowns.
The results can be view by adding tables to the PFD, or by simply double-clicking the relevant stream
or unit.

98

99
Appendix H: PFD for TEG injection dehydration concept
H.1 The TEG injection process
Figure H.1: PFD for the TEG injection concept w/regeneration system

100
H.2 Conventional absorber dehydration
Figure H.2: PFD for conventional absorber dehydration w/regeneration process

101
Appendix I: Reference gas composition
The reference gas composition used for the simulation is given in the following table:
Table I.1: Reference gas composition
Component mol % Temperature 26,6 oC
Nitrogen 2,6661 Pressure 64,88 bar
CO2 0,005 Enthalpy -13274,95 kW
H2O 0,07 Phase Vapor Liquid
Methane 86,2807 Fraction 1,0 0,0
Ethane 6,5256 Volume flow 11829,0 m3/h
Propane 2,6825 Molecular Weight 18,88 kg/kgmole
i-Butane 0,4147 Density 57,61 kg/m3
n-Butane 0,8182 Viscosity 0,013 mPa*s
i-Pentane 0,1812 Specific Heat 2,65 kJ/(kg*K)
n-Pentane 0,1701
Hexanes 0,1003
Heptanes 0,0449
Octanes 0,0137
Nonanes 0,0031
Benzene 0,0151
Toluene 0,0058
Xylenes 0,0015
C10 0,001
C11 0,0002
C12 0,0001
The reference gas composition is from the Snøhvit processing plant after the sour gas removal unit.

102

103
Appendix J: Calculations for chapter 7
All the formulas used in this appendix are found in appendix A and C.
J.1 Regeneration process
Overhead condenser
Using formula C.2:
( )
( )
o o
2
o o o
2
9681 2.161 77.6 27.4
81
3600 570 89.3 77.6 27.42
HT
kg kJC C
hr kgKA m
Ws C C C
m K
⋅ ⋅ −= =
⋅ ⋅ − ⋅ −
Flash tank
Calculating the falling velocity from formula A.1:
1
2
3 3
3
1021 2.07
0.05 1.11
2.07t
kg kg
m mm mUkgs s
m
− = ⋅ =
Calculating the minimum required inner diameter from the gas capacity constraint for a vertical
separator (formula A.7):
13 2
82.674
0.16
1.11 3600i
m
hrD mm
ss
π
= ⋅ = ⋅
(Gas capacity)
Calculating the minimum required inner diameter from the liquid capacity constraint (formula A.8):
13 24
9.31 4min
0.781.3 60
i
m
hrD mm s
π
⋅ ⋅ = =
⋅
(Liquid capacity)
The minimum required diameter is the biggest of the calculated diameters, thus Di = 0.78m. The total
length of the separator can then be calculated from formula A.9:
1.3 0.78 1 3.08L m m m m= + + =
The slenderness ratio is then calculated from formula A.5 to see if the design is suitable:
3.08 3.95
0.78Slenderness ratio = = -> Within the recommended values

104
To determine the shell thickness, the maximum allowable stress for the material must be
determined. Using the table from Arnold & Stewart (2008):p.321, and assuming the carbon steel is
of the cheapest quality (as the pressure difference is very small), σmax is found to be 126.0 MPa. The
joint efficiency is assumed to be 1. Using formula A.15:
,min
128 0.780.0004
2 1.26 5 1 1.2 128W
kPa mt m
E kPa kPa
⋅= =
⋅ ⋅ − ⋅
Adding a safety margin of 3.2 mm, the resulting wall thickness is 3.24 mm. However to ensure
rigidity of the vessel, a minimum wall thickness of 6.4 mm for diameters below 1.07 m is
recommended by Coker (2007).
Using formula A.16, the corresponding required thickness for the heads (assumed ellipsoidal) is
found:
,min
128 0.780.0004
2 1.26 5 1 0.2 128W
kPa mt m
E kPa kPa
⋅= =
⋅ ⋅ − ⋅
Adding the safety margin, the thickness for the heads is calculated to 3.24mm, the same as for the
wall. However to ensure rigidity, a wall thickness of 6.4 mm is used for the heads as well.
Using ρsteel = 7850 kg/m3 (Elert (2004)) the total weight of the flash tank is calculated to 432 kg
(empty).
Glycol/glycol heat exchanger
First the LMTD needs to be calculated:
( ) ( )o o o o
o
o o
o o
90.0 C 77.6 C 204.0 C 169.2 C21.71 C
90.0 C 77.6 Cln
204.0 C 169.2 C
LMTD− − −
= = − −
Inserting the calculated LMTD into formula C.4 together with the other given properties gives:
( )o o
2
o
2
8999 2.20 204.0 C 90.0 C
125.6
3600 230 21.71 CHT
kg kJ
hr kgKA m
Ws
m K
⋅ ⋅ −= =
⋅ ⋅
Using 100 pipes with a 5 cm diameter and tw = 3 mm doing two passes for the tube side and
assuming the same area is required for shell side flow the volume and weight are calculated as
follows:
1
22 2 2 4
2 100 5.6 0.5 2 1.0 1.134
totpipes tot pipes hx
AA cm m A A m D m
ππ⋅ = ⋅ ⋅ ⋅ = ⇒ = ⋅ = ⇒ = =

105
The required length of the pipes is then determined:
2125.64
0.05 100 2pipes
mL m
mπ= =
⋅ ⋅ ⋅
Thus, the heat exchanger itself must be 4 m long. Determining the minimum required wall thickness
(formula A.15):
,min
10 1.130.000057
2 1.26 5 1 1.2 10W
kPa mt m
E kPa kPa
⋅= =
⋅ ⋅ − ⋅
Adding a corrosion safety margin the thickness is still below the minimum required for rigidity, and
tw = 8.1 mm is therefore chosen (Coker (2007)).
The total weight of the heat exchanger included the piping is then found to be 4178 kg.
Regeneration column
Calculating the falling velocity from formula A.1:
1
2
3 3
3
977.5 0.804
0.1 3.49
0.804t
kg kg
m mm mUkgs s
m
− = ⋅ =
Calculating the minimum required diameter from the gas capacity (formula A.7):
13 2
16164
0.40
3.49 3600i
m
hrD mm
ss
π
= ⋅ = ⋅
Using HETP = 1.2 m, the total height is calculated (1.5 m is added for inlet- and exit facilities, as well
as overhead condenser):
tot4 1.2 4.8 , h 4.8 1.5 6.3packingh m m m m= ⋅ = = + =
Assuming the same type of steel is used as for the flash tank, the required shell thickness is
calculated from formula A.15:
,min
10 0.400.00002
2 1.26 5 1 1.2 10W
kPa mt m
E kPa kPa
⋅= =
⋅ ⋅ − ⋅
Because of the near ambient pressure, the required wall thickness is very small, but by adding a
corrosion safety margin, the resulting thickness is 6.42 mm (6.4 mm is added, since corrosion can
occur).

106
This gives the total weight and volume of the shell to be 0.82 m3 and 418 kg respectively. The
packing also contributes to the total weight, estimated to 100 kg, thus the total weight for the
column is 708 kg (including the overhead condenser).
Reboiler
Calculating the size using the same procedure as for a two-phase horizontal separator (formula A.4):
3
2 38 19.773 5min 2.07
60i
mL D m
hr sπ⋅ = ⋅ ⋅ ⋅ =
Assuming a slenderness ratio of 5 (maximum recommended), L and Di is found:
L = 3.73 m and Di = 0.75 m
Shell thickness from formula A.15:
,min
10 0.750.000038
2 1.26 5 1 1.2 10W
kPa mt m
E kPa kPa
⋅= =
⋅ ⋅ − ⋅
Using the minimum wall thickness to ensure rigidity recommended by Coker (2007), tw = 6.4 mm.
The required heat for the reboiler is calculated from formula C.5:
1557.43 9770 1512
3600req
kJ l hrq kW
l hr s= ⋅ ⋅ =
J.2 TEG injection process
Calculating the pipe diameter from the definition of volume flow assuming the velocity is 20 m/s:
13 2
4 11940
0.46
20 3600i
m
hrD mm
ss
π
⋅
= = ⋅ ⋅
Calculating the wall thickness for the pipe from formula A.15:
,min
6387 0.460.0087
2 1.724 5 1 1.2 6387W
kPa mt m
E kPa kPa
⋅= =
⋅ ⋅ − ⋅
Adding the safety margin, the resulting pipe wall thickness is 11.9 mm.
Deliquidiser
Calculating the length and height using the values given in table 1.2:
6 0.46 2.76 , 4 0.46 1.84L m m h m= ⋅ = = ⋅ =
Scrubber
Calculating the falling velocity from formula A.1:

107
1
2
3 3
3
1026 54.79
0.15 0.63
54.79t
kg kg
m mm mUkgs s
m
− = ⋅ =
Calculating the minimum required diameter from the gas capacity constraint (formula A.7):
13 2
124204
2.64
0.63 3600i
m
hrD mm
ss
π
= ⋅ = ⋅
Calculating the required liquid height assuming the retention time for the liquid is 3 minutes
(formula A.8):
3
2 2
9.171 15min4
0.422.64 60
L
m
hrh mm sπ
⋅= ⋅ =
⋅
The length of the entire vessel is then calculated using formula A.9:
0.42 2.64 1 4.06L m m m m= + + =
Checking the slenderness ratio (formula A.5):
4.06 1.54
2.64Slenderness ratio = =
The resulting minimum wall thickness is calculated from formula A.15:
,min
6387 2.640.050
2 1.724 5 1 1.2 6387W
kPa mt m
E kPa kPa
⋅= =
⋅ ⋅ − ⋅
Calculating the thickness for the heads (assumed ellipsoidal) from formula A.16:
,min
6387 2.640.049
2 1.724 5 1 0.2 6387W
kPa mt m
E kPa kPa
⋅= =
⋅ ⋅ − ⋅
Piping
Calculating the TEG recycle pipe diameter from the definition of volume flow:
13 2
4 9.218
0.026
5 3600i
m
hrD mm
ss
π
⋅
= = ⋅ ⋅
Calculating the wall thickness for the TEG recycle streams piping using formula A.15:

108
,min
6387 0.0260.0007
2 1.26 5 1 1.2 6387W
kPa mt m
E kPa kPa
⋅= =
⋅ ⋅ − ⋅
Adding the safety margin, tW = 3 mm is assumed to be sufficient.
J.3 Comparing with existing TEG dehydration process
Calculating the wall thickness using formula A.15:
,min
8350 3.20.080
2 1.724 5 1 1.2 8350W
kPa mt m
E kPa kPa
⋅= =
⋅ ⋅ − ⋅
Adding a corrosion allowance of 3.2 mm, the resulting thickness is 83.2 mm.