Embed Size (px)
Citation preview

Brigham Young University Brigham Young University
BYU ScholarsArchive BYU ScholarsArchive
Theses and Dissertations
2004-11-24
Development of Pole Impact Testing at Multiple Vehicle Side Development of Pole Impact Testing at Multiple Vehicle Side
Locations As Applied To The Ford Taurus Structural Platform Locations As Applied To The Ford Taurus Structural Platform
Mark Halford Warner Brigham Young University - Provo
Follow this and additional works at: https://scholarsarchive.byu.edu/etd
Part of the Mechanical Engineering Commons
BYU ScholarsArchive Citation BYU ScholarsArchive Citation Warner, Mark Halford, "Development of Pole Impact Testing at Multiple Vehicle Side Locations As Applied To The Ford Taurus Structural Platform" (2004). Theses and Dissertations. 226. https://scholarsarchive.byu.edu/etd/226
This Thesis is brought to you for free and open access by BYU ScholarsArchive. It has been accepted for inclusion in Theses and Dissertations by an authorized administrator of BYU ScholarsArchive. For more information, please contact [email protected], [email protected].

DEVELOPMENT OF POLE IMPACT TESTING AT MULTIPLE
VEHICLE SIDE LOCATIONS AS APPLIED TO THE
FORD TAURUS STRUCTURAL PLATFORM
By
Mark H. Warner
A thesis submitted to the faculty of
Brigham Young University
in partial fulfillment of the requirements for the degree of
Master of Science
Department of Mechanical Engineering
Brigham Young University
December 2004

Copyright © 2004 Mark H. Warner
All Rights Reserved

BRIGHAM YOUNG UNIVERSITY
GRADUATE COMMITTEE APPROVAL
of a thesis submitted by
Mark H. Warner
This thesis has been read by each member of the following graduate committee, and by majority vote, has been found to be satisfactory.
__________________ __________________________________________ Date Carl D. Sorensen, Chair __________________ __________________________________________ Date Spencer P. Magleby __________________ __________________________________________ Date Robert H. Todd

BRIGHAM YOUNG UNIVERSITY
As chair of the candidates graduate committee, I have read the thesis of Mark H. Warner in it’s final form, and have found that (1) its format, citations, and bibliographical style are consistent and acceptable and fulfill university and department style requirements; (2) its illustrative materials including figures, tables, and charts are in place; and (3) the final manuscript is satisfactory to the graduate committee and is ready for submission to the university library. __________________ __________________________________________ Date Carl D. Sorensen, Chair Accepted for the Department ____________________________________ Matthew R. Jones, Graduate Coordinator Accepted for the College ____________________________________ Douglas M. Chabries, Dean Ira A. Fulton College of Engineering and Technology

ABSTRACT
DEVELOPMENT OF POLE IMPACT TESTING AT MULTIPLE
VEHICLE SIDE LOCATIONS AS APPLIED TO THE
FORD TAURUS STRUCTURAL PLATFORM
By Mark H. Warner
Department of Mechanical Engineering
Master of Science
A test method was developed whereby repeated pole impacts could be
performed at multiple locations per test vehicle, allowing a comparison of energy
and crush relationships. Testing was performed on vehicles moving laterally into
a 12.75 inch diameter rigid pole barrier. Crush energy absorption characteristics
at the different locations were analyzed, and the results compared to test data from
broad moving barrier crashes and available crash tests with similar pole impacts.
The research documents the crush stiffness characteristics for narrow impacts at
various points on the side of the Taurus vehicle platform. Factors encountered
during the research include the importance of rotational energy accounting and

uncertainties related to crush energy related to induced deformation. The findings
show that the front axle and A-pillar regions are much stiffer than the CG and B-
pillar areas to narrow rigid pole impact. The central CG region produced stiffness
relations that correspond well with published broad-impact data when the
effective crush width was assumed to be roughly three times the pole diameter.
Results of this research sustain the theory that stiffness properties vary
significantly along the side of a vehicle. Though not practical as a tool in every
circumstance, the multiple impact location technique should be considered when
side impact crush energy absorption characteristics are key to the outcome of an
accident reconstruction.

ACKNOWLEDGMENTS
Sincere thanks to the many professors here at Brigham Young University
who have helped me for the past several years. Special thanks to those who
believed in me, even when I didn’t believe in myself, and gently compelled me to
change. Words cannot express my gratitude to the Lord for the opportunities I
have had. It was by His will and hand that I was accepted to the University, and I
have been blessed here.
I am most grateful for the support of my family. For the support of my children,
who have struggled with their homework beside me, as I was struggling with
mine. For my fabulous, invincible, dedicated sweetheart Serena. Her infinite
capacity for cleaning, cooking, baking, laundry, tutoring, lawn mowing,
gardening, weeding, piano, parent-teachering, carpooling, and the thousands of
seemingly small things that make our house a wonderful home. For her nurturing
spirit and motherly love. Her examples of determination, service, and love stand
above all others. As I watch her, I know I can never give up.
This work is dedicated to my father, Dr. Charles Y. Warner. His relentless
patience in helping me all of these years has been the foundation for my growth.

As I have climbed my Mount Everest, he has always been above me with a hand
or rope.

ix
TABLE OF CONTENTS
1.0 INTRODUCTION 1
2.0 BACKGROUND 5
2.1 Side Impact in Crash Safety 5
2.2 Federal Safety Standards Relating to Side Impact 5
2.3 Energy in Reconstruction of Side Crashes 9
2.4 The Velocity-Time Diagram 14
2.5 Restitution 15
2.6 Rotation 16
2.7 Crush Energy as a Reconstruction Tool 21
2.8 Review of Related Literature 21
3.0 TEST METHOD DEVELOPMENT 25
3.1 The Rigid Barrier / Crash Test Facility 25
3.2 Tow System 26
3.3 Speed Measurement 28
3.4 Photography / Videography 28

x
3.5 Side Impact Technique Development 29
3.6 Test Vehicles 31
4.0 RESULTS 35
4.1 Test Locations and Velocities 35
4.2 Restitution Documentation 35
4.3 Rotation Effects 37
4.4 Crush Measurement 40
4.5 Crush Energy Calculation 42
4.6 Crush Energy as a Function of Width 46
4.7 Bowing and Effective Width 48
5.0 DISCUSSION 49
5.1 Barrier Width 49
5.2 Barrier Width as a function of Pole Width 50
5.3 Yaw Energy 55
5.4 Energy Comparisons Based upon Impact Location 57
6.0 CONCLUSIONS 59
6.1 Multiple Impact Location Test Technique 59
6.2 Variations in Stiffness Between Impact Locations 59
6.3 Importance ofYaw Energy in Calculating Crush Energy 60

xi
6.4 Transition Zones 60
6.5 Pole Impact Data Compared to NHTSA 214 Test Data 61
6.6 Applications 61
7.0 RECOMMENDATIONS FOR FUTURE RESEARCH 63
8.0 REFERENCE MATERIALS 65
9.0 APPENDICES 73

xii
LIST OF FIGURES
2.1 Euro NCAAP Side Impact Test Procedure 6 2.2 Euro Side Impact Test Configuration 7 2.3 V-T Diagram for Central Impact 15 2.4 R distance from Pole Center of Rotation to CG 18 2.5 V-T Diagram for Non-Central Impact 20 3.1 Photographs of Test Facility 25 3.2 Pole Test Fixture 26 3.3 Impact Configuration and Location 27 3.4 Photographs of Friction Shoes 29 3.5 Photographs of Digital Surveying Technique 32 3.6 Photographs of Accelerometers and Rotation Rate Sensor 34 4.1 Vehicle Motion Analysis / Test B5 38 4.2 Integrated Yaw Rate / Test B5 39 4.4.1 Composite Crush Map of Vehicle B 41 4.4.2 Composite Crush Map of Vehicle C 42 4.5 Energy / Crush Distance Correlations 45 4.6 CG Test and Neptune Data 47 5.1 CG: Varying Pole Widths Compared to Neptune Data 50

xiii
5.2 Front Axle: Varying Pole Widths / Neptune Data 52 5.3 A Pillar: Varying Pole Widths / Neptune Data 53 5.4 B Pillar: Varying Pole Widths / Neptune Data 54 6.1 Comparison of Crush Energy / Linear Crush Distance 56

xiv
LIST OF TABLES
3.1 Test Vehicle Weight Measurements 33 4.1 Impact Speed and Linear Crush 35 4.2 Crush Energy Calculation Matrix 44 5.1 Pole Width Correlations 51 5.2 Highlighted Crush Energy Calculations 55

xv
LIST OF APPENDICES
A. FMVSS 214 “Dynamic” Side Impact Protection 74
B. European Side Impact Test 78
C. Excerpts from Neptune Engineering, Inc. Website 80
D. Neptune Crash Data for 1999 Taurus Side 87
E. Yaw Moment of Inertia for 1999 Taurus 88
F. Charles Y. Warner Brief Regarding Energy Models 89
G. Selected Test Vehicle Photographs 97
H. NHTSA Bowing Protocol 103

xvi
NOMENCLATURE / DEFINITION OF TERMS
m: vehicle mass, lbm
w: vehicle weight, lbf
v0: the velocity of the test vehicle immediately prior to impact
vr: CG rebound velocity
Ω: (Omega) rotational velocity in degrees or radians
I : rotational moment of inertial
C: Crush (inches or feet)
R: distance (feet) from vehicle CG to center of rotation about pole
d: Impactor width
ε : Restitution at the vehicle CG
CE: Crush Energy (per impact)
CETOT: Total Crush Energy
EBS: Equivalent Barrier Speed
FAVE: Average Force
FTOT: Total Force

1
1.0 INTRODUCTION
Each year, over 6 million automobile accidents occur in the United States.
Roughly 37,000 of these accidents result in fatalities, and over 10% of the fatal
accidents and about one-fourth of the occupant fatalities involve vehicles struck in
the side [FARS data]. Though not as common as frontal collisions, side impacts
often impart more severe forces and accelerations to occupants because protection
space is limited. Such impacts can result in more severe injuries, as the protection
provided by vehicle side structures cannot manage forces as readily as the large
“crumple zones” employed by vehicles in frontal impacts.
Accident reconstruction encompasses a wide variety of engineering techniques.
For decades, engineers and inspectors estimated the severity and pre-collision
parameters of accidents based upon such factors as skid mark length, tire to
roadway friction coefficients, and the principles of skidding energy and
momentum conservation. These techniques are still a valuable and important part
of accident reconstruction, but sometimes skid marks have faded , or the vehicles
have traveled across surfaces where no skid marks can be recorded and measured
(i.e. wet or snow covered roads or high traffic areas). As new vehicles
incorporate advanced braking systems with anti-skid controls, these situations

2
require the use of additional tools. Reconstruction methods rely upon structural
crush energy estimates to determine vehicle kinematics prior to accident impacts.
Several methods have been developed and tested which allow the engineer to
relate post-collision crush geometry to crush energy. Some of these models
simply relate the maximum depth of crush to a kind of “rule of thumb” as a
calculated or predicted pre-impact speed for the vehicle. Other models take a
more technical empirical approach; assigning varying “plastic spring” force
constants or “crush energy coefficients” to the surfaces of the vehicle as functions
of crush depth and width. Virtually all models refer to vehicle crash testing,
either as a basis for development or for verification purposes.
Numerous computer programs have been developed to aid the engineer in
accurately estimating the pre-collision speeds and attitudes of vehicles. This work
is supplemented using a program called PC Crash, a robust and widely accepted
tool for automobile accident reconstruction [PC Crash].
This work is not in itself an attempt to design or recommend better protection
systems for occupants. It is intended as a step toward better understanding of side
impact forces, and how they are transformed into crush energy by body structures
in various locations along the side of the vehicle. It is hoped that this work will
provide valuable reference material to researchers in reconstruction of accidents.

3
A method for impacting a test vehicle at multiple locations along the side has
been developed. Comparing calculated crush energy from test data at multiple
impact locations provides the researcher with a better understanding of the
variation in stiffness along the vehicle side. Though not practical as a tool in
every circumstance, this technique should be considered when side impact crush
energy absorption characteristics are key to the outcome of an accident
reconstruction.
Repeated crash testing was performed on 1999 model Ford Taurus sedans. The
techniques employed, data gathered, and test results are included in the body of
this writing, in addition to conclusions and recommendations for future work.
Common accident reconstruction methods include the measurement and
comparison of post-accident crush patterns to those of a controlled crash test.
This work helps to quantify and compare the stiffness of vehicle side structures at
various locations on the Ford Taurus platform. The basis for comparison between
tests is the calculated crush energy absorbed by the vehicle structures.

4

5
2.0 BACKGROUND
2.1 Side Impact in Crash Safety
The side impact accident places the driver and/or occupants of a vehicle at
higher risk than other types of accidents, given an equal level of crush energy
absorbed. The doors of a typical sedan are always constructed to be less than one
foot thick, and size, strength, and weight considerations dictate limits to door
strength as applied to intrusion resistance. Passengers are often seated low
enough that adverse vehicle frontal structures align with the abdomen, pelvis, and
thoracic zones of occupants. Structural architecture limits the compatibility and
effectiveness of side structures and restraint systems, as do mass, stiffness, and
geometric differences between vehicles of various types.
2.2 Federal Safety Standards Relating to Side Impact
Federal Motor Vehicle Safety Standard 214 (FMVSS 214) prescribes a
side impact performance level required of all automobiles certified in the United
States [FMVSS 214]. It involves impacts into stationary production vehicles by a
crabbed (angled) deformable moving barrier weighing about 3000 lbs. The

6
barrier is angled at 27 degrees and pulled along an approach track so as to strike
the front door area at about 33 mph. A deformable barrier face over 5 feet wide
first contacts the front door and its pillars simultaneously, hence the “crabbed,
deformable, moving” barrier, CDMB (See Figure 2.1, below).
Figure 2.1 NHTSA 214 Side Impact Test Procedure
Canadian test requirements are similar to those of the U.S. [Canada]. The
European Economic Union also uses a moving deformable barrier or pole barrier,
but addresses the stationary vehicle at a right angle (90 or 270 degrees) [Euro].

7
Figure 2.2 Euro NCAP Side Impact Test Procedure
Australian and Japanese requirements are similar. These test protocols
emphasize the measurements recorded on inertial and deflection instruments in a
seated side impact dummy. Appendices A and B provide more details relating to
FMVSS 214 and the Euro side impact tests. EuroNCAP (European New Car
Assessment Program) are conducted at higher speeds with similar respective
physical setups. NCAP energy levels are about 40 percent higher than the
respective compliance tests. All of these tests are designed primarily to validate
the vehicle’s dummy protection capabilities. They are not intended to be used for
energy based reconstruction analysis.

8
These standards are attempts to represent “typical” side impact crashes, but by
using a complex crash test orientation and design, the results are not optimal for
crash reconstruction applications. Crabbed Deformable Moving Barrier faces are
more than five feet wide. As a result, localized impacts are not well represented
with respect to structural characteristics. Barrier face structural deformation and
yield force characteristics are not always well documented. The impacts are not
central, so rotations of both barrier and subject vehicle are involved in absorption
of initial kinetic energies. Induced crush effects are not well understood.
In recent years, the popularity of higher, heavier, stiffer vehicles like pickups and
SUVs has changed the typical structural relationships between striking and struck
vehicles [Bradsher, 2002]. This change has been recognized in some crash
testing, but applications to reconstruction remain complex [IIHS, 2000; IIHS,
2003].
Data from many crash tests are published in the open literature. Many of these
have been collated by Neptune Engineering, Inc. and other similar agencies to
assist reconstructionists in characterizing vehicle structures [Neptune, 2003].
These characterizations and models must be studied carefully to make useful
application in the general reconstruction case. Very few reliable data for direct
application to narrow fixed object impact are available. Most side crush energy
research has not given full account of rotation effects in non-central side impacts

9
[Neptune, 1994; Asay, 2002]. The great majority of side impact crash test data
are derived in non-central crashes. Even in those cases where vehicle sides have
struck poles, the center of impact is usually targeted on the occupant head region
rather than the vehicle CG, as injury criteria are of primary concern.
2.3 Energy in Reconstruction of Side Crashes
The theory of side impact reconstruction is that an energy estimate might
be achieved by measurement of the vehicle deformation to serve as a means of
checking or determining impact speed. Thus, the sum of damage energy to both
impact partners can be checked against the energy loss predicted from dynamic
momentum analysis. The physics and mathematics governing generalized two-
vehicle collisions has been adequately treated in the literature [Marquardt; Emori;
PC CRASH]. Hand calculation methods can arrive at a reasonable estimate, but
the arithmetic is extensive and laborious. Computer programs are available and
are in widespread use to help with the calculations. The SMAC program and its
derivatives integrates the equations of motion without reference to energy, but it
requires an estimate of vehicle stiffnesses for its force balance operations
[SMAC]. It is helpful to check SMAC results with independent calculations of
energy. The CRASH program and its relatives employ an instantaneous impact
model, but employ assumptions based on energy to achieve speed estimates
[CRASH]. The PCCRASH program simply evaluates speed estimates supplied

10
by the user, then provides instantaneous momentum accounting and run-out
predictions, leaving the user to compare the dissipated energy to his own
calculations of crush energy [PCCRASH]. Each program has its advantages,
depending upon user objectives.
The kinetic energy involved during a single vehicle collision with a rigid, massive
structure (utility pole, tree, bridge abutments etc.) can be expressed by
2i2
12i2
1 vgwmvKE == (2.1)
Where m = mass and w = weight of the moving vehicle, g = acceleration due to
gravity, and vi = the velocity of the vehicle immediately prior to impact. The
instant before impact, the vehicle can be idealized to possess energy only in this
translational kinetic form. During impact, it also obeys rules of impulse and
momentum, but these are not usually important tools in impacts against a massive
or “fixed” barrier. Some of the energy the vehicle possessed prior to impact is
dissipated by deforming structures, while some energy is retained in the form of
post impact velocity (restitution) and/or rotation. Energy must be accounted for,
as outlined in the mechanical energy equation:
CEKEKEKE yawfi ++= , (2.2)

11
where
CE = Crush energy
KEi = Initial translational energy = 2
i21
i mvKE = (2.3)
KEf = final translational energy = 2
f21
f mvKE = (2.4)
KEyaw = final yaw energy = 2
f21
f IKE Ω= (2.5)
When structures are deformed, they exhibit plastic and elastic behavior. The
response of vehicle structures in a collision can be modeled many different ways.
A traditional accounting method employs the concept of restitution to identify the
restorative elastic properties of crush, by definition of rebound velocity as a
fraction of approach velocity. This is discussed further below.
The structural deformation behavior of a deforming vehicle side structure has
been defined in several ways, usually as some function of the crush stroke. The
simplest model represents the deforming force as constant over the crush from an
individual impact, Ci. It is one way of grasping the average force exhibited in an
impact, and is represented by
=iF Constant.
The subscript “i” is used here because in the application below, repeated impacts
will be addressed at the same impact point, and an average constant force

12
calculated based on total energy and crush from repeated applications of this
simple representation, where crush energy is given by the product
iii CFCE ×= (2.6)
iTOT CECE ∑=i
(2.7)
The simple model used here represents force as a linear function of crush, as
F = kx.
Thus CE = 2
ckc
21Fdx =∫ (2.8)
These relations apply to unit widths normal to the deformation on an idealized
force transmission member. The linear model corresponds to the simple harmonic
oscillator model. That model is applied in the SMAC program, by addressing the
stiffness per unit width as kv = k/w, and F/w = [kv/w]x, where w is the small or
unit width of application [SMAC]. This model, using kv, has become one of the
standardized methods of correlating crush energy data. It is reported in the
published data for many crash tests (See Appendix D).
The linear model was extended in the CRASH program to include a two-
parameter representation of force and energy density as a point-slope form,
wherein force per unit width takes the form
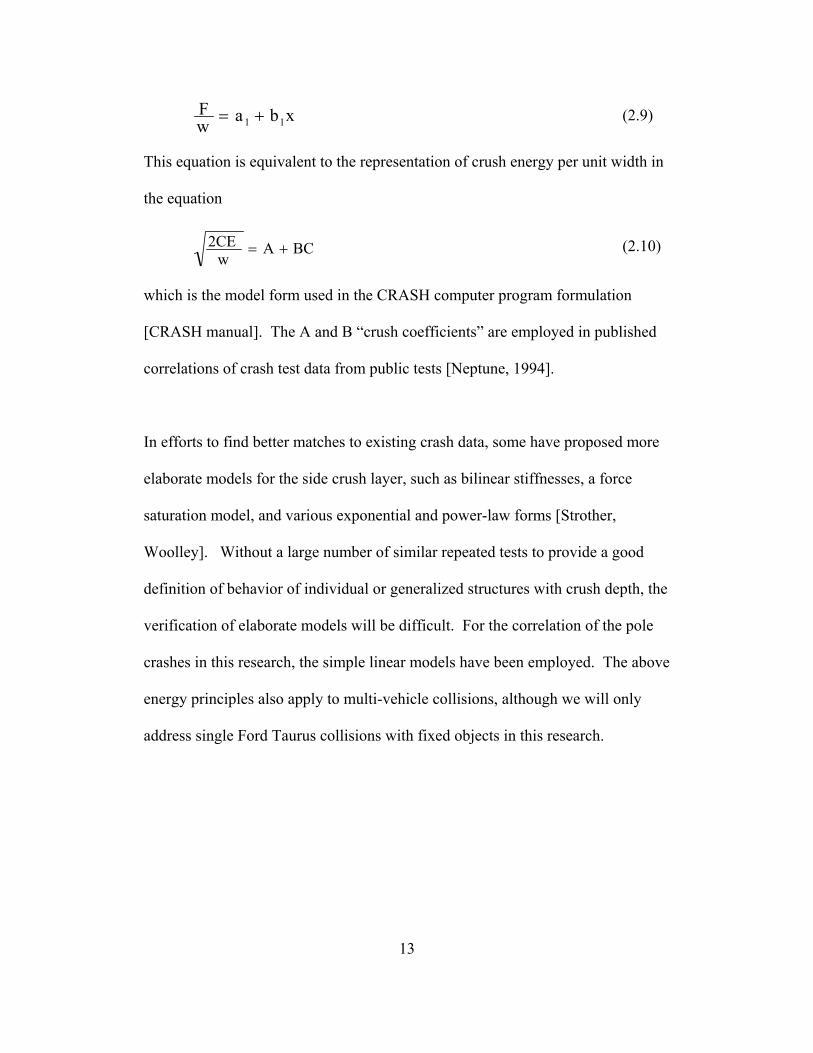
13
xbawF
11 += (2.9)
This equation is equivalent to the representation of crush energy per unit width in
the equation
BCAw
2CE += (2.10)
which is the model form used in the CRASH computer program formulation
[CRASH manual]. The A and B “crush coefficients” are employed in published
correlations of crash test data from public tests [Neptune, 1994].
In efforts to find better matches to existing crash data, some have proposed more
elaborate models for the side crush layer, such as bilinear stiffnesses, a force
saturation model, and various exponential and power-law forms [Strother,
Woolley]. Without a large number of similar repeated tests to provide a good
definition of behavior of individual or generalized structures with crush depth, the
verification of elaborate models will be difficult. For the correlation of the pole
crashes in this research, the simple linear models have been employed. The above
energy principles also apply to multi-vehicle collisions, although we will only
address single Ford Taurus collisions with fixed objects in this research.

14
2.4 The Velocity-Time Diagram
The dynamics of impact are illustrated well on velocity-time coordinates.
We define time zero as the moment of impact. In the case of a single vehicle pole
impact, the moment initial contact is made between the moving vehicle and the
stationary pole. Prior to impact, we consider the velocity of the vehicle (v0) to be
constant. Beginning at t=0, the vehicle experiences a change in velocity (∆V).
The following diagram helps to illustrate a generic form of Velocity / Time (V/T)
diagram that is useful in explaining a typical vehicle collision response. Its initial
form is similar to the cosine curve which results from the integration of one
quarter-wave (having duration of 0.085 seconds) of a simple harmonic oscillator
which obeys the function in equation 2.11 as follows:
02
2
=+⎟⎟⎠
⎞⎜⎜⎝
⎛kx
dtxdm (2.11)

15
Velocity / Time Diagram
-5
0
5
10
15
20
25
-0.05 0 0.05 0.1 0.15 0.2
Time (s)
Vel
ocity
(mph
)
Figure 2.3 V-T Diagram for Central Impact
2.5 Restitution
The generic V/T curve of Figure 2.3 is representative of a central impact,
where velocity passes zero at full crush, changing direction (velocity becomes
negative) and vehicle structures restore part of their deformation. The area under
the curve between 0 and 0.085 seconds represents distance absorbed as plastic
deformation. The area below the horizontal axis between 0. 085 and 0.15 seconds
represents energy restored from elastic deformation, and is subtracted from the
total residual kinetic energy in calculation of CETOTAL. Restitution is defined as

16
the ratio of rebound velocity (Vr), divided by initial, or impact velocity (Vi) as
follows:
0rv
vε ≡ (2.12)
Technically, restitution is only defined for central impacts like billiard ball
contacts or ball-into-flat wall contacts, although the concept has been extended by
some researchers [Brach; Warner, 1998]. The application of restitution to non-
central collisions with complex structures like automobile bodies is not well
understood. While it is clear that such bodies restore elastic energy after plastic
collision, the application of the classical definition to largely offset collisions
becomes very complex when rotational effects are involved. Fortunately,
restitution in automobile crashes is usually quite small, typically less than 25%.
Further, it enters the energy balance as the square, so its effect on energy would
usually be less than 10% and is often ignored in reconstruction calculations. It is
included in this discussion to help separate the various energy effects.
2.6 Rotation
When a vehicle moves laterally into a fixed object, off-central forces will
induce a yaw rate during the impact phase. Induced yaw rate (ω) will continue to

17
increase as the vehicle structures are crushed to their maximum level. The
resulting yaw energy must be subtracted from the total crush energy in calculating
the energy absorbed by the deformed part of the vehicle. Impact-induced vehicle
rotation may be divided into two phases:
Phase 1- Yaw of the vehicle mass around the impact point, (in this case, a
pole) during contact, which increases in response to the impact moment.
Phase 2- Rotation of the vehicle immediately following separation from the
pole, which decreases in response to tire forces interacting with the roadway
surface. Impact induced yaw rate usually reaches a maximum value at the end of
the impact phase, unless other rotational impulses are applied.
When calculating the planar Yaw Moment of Inertia for any finite object,
including a rotating vehicle, two components of inertia are needed [Verat, 1999].
20 mkI = (2.13)
]R[kgw)Rm(kI 2222
p +=+= (2.14)
In the equation, m = vehicle mass, w = vehicle weight, h = radius of gyration, and
R = distance from the planar point of impact to the vehicle CG, where I0 = The
Yaw Moment of Inertia of a free rotating vehicle about its CG, and IP = the

18
moment of inertia of a vehicle rotating around a point of impact a distance R from
the CG.
Figure 2.4 R distance from Pole Center of Rotation to CG

19
In the specific case considered here, the rotation at separation is assumed to be
around the CG, since pole contact is lost at the instant restoration of impacted
structures is complete.
Estimated values for Yaw Moment of Inertia for many vehicles are published in
reference tables [NHTSA]. For this research the values of Yaw Moment of
Inertia I0 for the test vehicle were obtained from measured values given for a
similar vehicle reported by a NHTSA contractor and adjusted using the empirical
formula [Appendix E].
The yaw energy is calculated using the established moment of inertia (I0) about
the vehicle CG. The planar CG was located using individual tire weight
measurements from the undamaged vehicle. Any shifts in CG position and I0 due
to impact phase deformation were ignored. When the impact is longitudinally
aligned with the vehicle CG, R is simply the Y distance from the CG to the side of
the vehicle. However, yaw velocities are very small, and rotational energies are
generally negligible in central impacts.
Finally, the total rotational energy is subtracted from the net translational kinetic
energy to obtain the energy absorbed in vehicle deformation, rearranging equation
2.2:

20
rotfi KE)KE-(KE CE −= (2.15)
Figure 2.3 above represents the motion of the CG of a vehicle in central pole
impact. One may schematically represent the CG motion for non-central pole
impact in similar form, but the resulting motion will not be asymptotic to zero, but
to the continuing speed of the CG, with rotational effects considered. It will of
course be complicated in general by tire force effects, but these may be ignored
during the brief time of the impact, giving a motion of the form shown in figure
2.5.
Velocity / Time DiagramCentral vs Non-Central Impact
-5
0
5
10
15
20
25
-0.05 0 0.05 0.1 0.15 0.2
Time (s)
Vel
ocity
(mph
)
CENTRAL
NON-CENTRAL
Figure 2.5 V-T Diagram For Non-Central Impact

21
2.7 Crush Energy as a Reconstruction Tool
Calculation of crush energy based on vehicle deformation is a technique
which has been developed and improved within the last 30 years. While sincere
efforts have been made to develop methods for comparing standardized crash test
results (including crush) to accident field data, the widely varying crush patterns
exhibited, even between accidents of similar nature, highlight the difficulty in
comparing test data to accident data. An accident is, by definition, an unusual
event, and no two accidents are the same. Reconstruction attempts comparing
“apples to oranges” have been made too often, as the researcher must often make
gross generalizations in calculation of energy based on available data. More
information is included in a brief, unpublished dialog by Dr. Charles Warner. It
explains the development of various methods and tools related to crush energy
(Appendix F).
2.8 Review of Related Literature
The use of crush energy in reconstruction originated with the pioneering
work of Marquardt, Emori and Campbell and its application in the CRASH
program and the crash files required to support it collated by the NHTSA
[Marquardt, 1966; Emori, 1968; Campbell, 1974; McHenry, 1976]. In Europe, a
similar approach called the EES (Energy Equivalent Speed) method was adopted

22
[Zeidler, 1985]. The CRASH – III Manual provides rudimentary data related to
structural behavior in the form of two-parameter “A and B coefficients” for a
linear slope-intercept model relating the [2CE/w]½ and crush depth for the front,
side, and rear of four vehicle classes. These early data were founded in
interpretations of only about a dozen laboratory crashes [McHenry, 1976]. The
dependent variable [2CE/w] ½, while readily usable in calculations, lacks
somewhat in its physical interpretability. Its relationship to the model for linear
structural stiffness is discussed by Strother, et.al. [Strother, 1986; Prasad, 1990-1].
A new technique for better definition of crush models involving repeated crashes
of the same vehicle was published by Warner, et.al. and applied extensively
thereafter to frontal crashes by Prasad [Warner, 1986; Prasad, 1990-2]. Smith
et.al. adapted frontal impact crush parameters to frontal pole crashes [Smith,
1987].
Side impact crash energy coefficients were not broadly published until FMVSS
214 dynamic testing began and injury reduction concepts were actively pursued
[Warner, 1990]. Although side impact crash tests are now being conducted on
four continents, emphasis is on occupant loadings, the crashes are almost never
central, and the detailed measurements needed to separate rotation and restitution
effects are seldom measured [NHTSA 214, NCAP, EuroNCAP]. As side impact
crash test results were developed in compliance testing, they were included in
published calculations of side crush coefficients, but without detailed accounting

23
for localized effects [Neptune, 1994; Neptune, 1998]. Applications of side impact
data in broad and narrow impacts were reviewed extensively by Strother, Varat,
and others. More elaborate energy models were proposed. [Strother, 1998;
Neptune, 1999; Varat, 1999; Woolley, 2000; Woolley 2001; Asay, 2002].
Published testing of pole impacts into the side structures of vehicles has not been
documented to the extent needed to properly distinguish restitution and rotation
effects [FOIL, Escort, Asay].

24

25
3.0 TEST METHOD DEVELOPMENT
This section outlines the equipment, methods, and parameters utilized in
this research. Testing was performed at facilities owned and operated by Delta V
Technology, Inc. in Orem, Utah.
3.1 The Rigid Barrier / Crash Test Facility
A track-based guidance / acceleration system was employed, and vehicles
were accelerated into a vertical, rigid 12 ¾ inch diameter pole barrier supported
by a large concrete foundation.
Figure 3.1 Photographs of Test Facility

26
Lateral positioning of the pole barrier is facilitated by large attachment bolts. It
was necessary to move and re-attach the pole for each impact location, as the
guidance /acceleration track must guide the vehicle such that the CG remains
aligned with the track..
Figure 3.2 Pole Test Fixture
3.2 Tow System
A track-based tow system was used to accelerate and guide the vehicle for
each test. The vehicle was attached to the tow cable by means of a tow chain or
“tow yoke” connected to front and rear vehicle suspension members. The tow
yoke was modified to ensure separation of the tow yoke upon release prior to

27
impact. The tow yoke was connected at the “tow shoe” by means of a release pin
which was driven out through the tow yoke ends just prior to impact with the
pole. This mechanism worked without failure, and allowed the vehicle to slide
into the pole and deform at the pole without tow yoke interaction.
Figure 3.3 Impact Configuration and Location

28
A “fifth wheel” was attached to the test vehicle, and used to measure vehicle
velocity during approach. The fifth wheel transmitted real time velocity to the test
controller through a radio telemetry system, as displayed on a plotter in the
operator’s booth.
3.3 Speed Measurement
Laser speed traps were used to record approach speed of the vehicle just
prior to impact. Test vehicles were set near the pole in the intended impact
configuration, and the speed trap fixture was positioned such that the traps were
triggered within one foot of impact. The lasers were calibrated for each impact
direction using a digital micrometer, and resulting speeds were compared to
speeds calculated from high speed videotape analysis.
3.4 Photography / Videography
Test vehicles were photographed in impact configuration prior to each
location series and following each impact at rest position. Overhead and
horizontal video cameras were used to record vehicle motion prior to impact and
during the impact phase. Mini DV cameras were used to document general
motion from the side, and high speed video cameras were mounted overhead.
Painted grid marks were applied at one foot intervals on the ground surrounding

29
the pole, and an overhead measuring bar was installed with marks at 3 inch
intervals. A matching series of 3 inch marks was applied directly beneath the
vehicle and adjacent to the pole. Two high speed video cameras were mounted
directly above the impact point on a stationary camera boom; one NAC model
HSV 400 video camera recording 200 frames per second, and one JVC 9800
video camera recording 240 frames per second. The recorded images were
instrumental in calculating restitution and aided in verification of post impact yaw
rate.
3.5 Side Impact Technique Development
The most obvious difficulty when moving a vehicle laterally into a pole is
the challenge of overcoming the lateral resisting force of the tires.
Figure 3.4 Photographs of Friction Shoes

30
Some test facilities use large quantities of liquid soap spread over the track
surface to reduce friction. This technique is cost-prohibitive, messy,
environmentally unfavorable, and it attracts dirt. Experience with attached
wheels, carts, and other devices led to experimentation with new methods. This
work was accomplished by using plastic “friction shoes” attached to the tires of
the test vehicle. The shoes are made of UHMW-PE (Ultra High Molecular
Weight Polyethylene…similar in performance to Teflon®) which allows the
vehicle to slide sideways with a relatively low drag coefficient.
This technique has several advantages:
• No significant mass is added to the test vehicle (using a dolly or attaching
wheels are some alternatives).
• The structure of the test vehicle is not altered.
• Attaching the friction pads is much less expensive and time-consuming
than attaching a tow dolly.
The development of this technique involved several iterations or “shakedown
tests” on vehicles other than the Ford Taurus test vehicles. Attaching rectangular
UHMW-PE strips to vehicle tires proved to be a challenge. Subsequent
experiments involved screwed-on rectangular UHMW-PE strips. Tires were
filled with polyurethane foam (used for forklift tires), and self tapping screws
were driven through the PE strips and into to tires directly. This technique

31
worked well for attaching the strips, but added too much mass to the vehicle
(added 70 lb per tire) and was cost prohibitive due to the expense of the tire foam.
The most effective means for attaching the friction shoes was to cut the material
into a crossing-rectangle shape, then use a torch to form the shoe around the tire.
A system of chains was assembled for each tire, then the tire was deflated, the
chains were attached and the tire was re-inflated with the shoe in place.
Although reduced significantly from the level experienced without friction shoes,
the increased pull force (compared to that of a rolling vehicle) caused increased
tow cord stretch, and led to more difficult speed control than was anticipated.
This made the use of repeated impacts more important, as comparable single data
points based on speed or predicted energy were difficult to match.
3.6 Test Vehicles
The test vehicles were model year 1999 Ford Taurus sedans. The vehicles
had been used previous to this research for unrelated low speed frontal crash
testing, and had sustained minor front end damage. Residual damage profiles
showing the vehicles as received and after testing are shown in figures 4.4.1 and
4.4.2. This previous damage was taken into account in calculation of potential
bowing effects, but bowing was not found to be significant in relation to the
localized pole impacts performed.

32
3.6.1 Pre-Test and Post-Test Geometric Documentation
Each of the three test vehicles was cleaned and marked with a series of
points to be used for three dimensional digitization, and the points were numbered
sequentially. Prior to testing the vehicles were surveyed using a “Vulcan”
surveying device, and the data was stored.
Figure 3.5 Photographs of Digital Surveying Technique
Following each impact, the same points were surveyed again and the data was
overlaid and aligned using the AutoCAD® drawing program. Photographs were
taken of each vehicle prior to initial testing and following each subsequent
impact.

33
3.6.2 Vehicle Weight Measurement
The test vehicles were weighed using an electronic scale system. Table
3.1 below lists vehicle weights at wheels, and shows calculated totals and
percentages by location. Total vehicle weights (lbf) are used for energy
calculations.
Table 3.1 Test Vehicle Weight Measurements
3.6.3 Electronic Instrumentation
The test vehicles were fitted with mounts for electronic accelerometers
and yaw rate sensors at the CG. Where off central impacts were performed, the
vehicles were fitted with mounts for an additional accelerometer opposite the
VEHICLE A
VEHICLE B
VEHICLE C
TOTALS TOTALS TOTALS
% % %
LF 0.663217 RF LF 0.675547 RF LF 0.65782 RF
1052 2115 1063 1058 2130 1072 1029 2082 1053
0.505174 3189 0.494826 0.502696 3153 0.497304 0.500158 3165 0.499842
LR 0.336783 RR LR 0.324453 RR LR 0.34218 RR
559 1074 515 527 1023 496 554 1083 529

34
point of impact on the vehicle. Accelerometer mounts were fabricated from 3/16”
steel angle and plate, and welded to structural locations. The front axle test
accelerometer mount was welded to the opposite side strut tower. A-pillar and B-
pillar tests were welded to opposite side A and B-Pillar structures, respectively.
Figure 3.6 Photographs of Accelerometers and Yaw Rate Sensor

35
4.0 RESULTS
4.1 Test Locations and Velocities
Plans to impact the test vehicles at multiple locations were developed well
before the first impact occurred. It was important to be able to impact both sides
of each test vehicle without disrupting integrity and making the vehicles
unsuitable for further testing. Test speeds were chosen, with multiple impacts at
each location.
Table 4.1 Impact Speed and Linear Crush
Location A
PILLAR B
PILLAR LF WHEEL CG Test B1 B2 B3 B4 B5 B6 B7 C1 C2 C3 C4 C5
IMPACT V (mph) 5.2 13.3 9.5 4.7 9.6 11.8 17.5 11.8 16.5 7.9 14.5 13
CRUSH (in) 1.25 6 7.125 1 6.25 12 22 3.75 7 4.5 11 13.75
4.2 Restitution Documentation
Rebound velocity (vr) at the vehicle CG was determined through analysis
of high speed videotape by plotting the position of the CG over 100 millisecond

36
(ms) increments in time. The center of the lens of the high speed video camera
was positioned directly above the vehicle CG. With post-impact rotation a factor
in most tests, the CG did not always rebound in the direction opposite to
incoming velocity (V0), as usually anticipated in the definition of central impacts.
In lower speed impacts, rebound distance was often small. The restitution was
inferred from vehicle CG position compared over equivalent time as follows:
0
r
0
rxx
vvε ≈≡ (4.1)
Where ε (epsilon) = coefficient of restitution
vr = the rebound velocity of the vehicle CG
v0 = the velocity at impact
x0 = the displacement of the vehicle CG between -100 ms and impact
xr = the displacement of the vehicle CG between 100 ms and 200 ms (post
impact)
This technique was found to be superior to measuring equivalent distance over
change in time, due to the small displacement of the CG post impact, and the
difficulty in resolving small amounts of change over minimum time steps of 5ms
(video camera recording 200 frames / sec). Checks for parallax error showed
negligible error for all subjects except those very near the edges of the camera

37
view. The distance between the pole and deepest crush was also measured
following each impact. This is termed the “run-out distance” and is used to
estimate exit velocity by the skid mark method in comparing calculated restitution
to measured restitution.
4.3 Rotation Effects
Yaw rate sensors attached at the CG of the test vehicle were used to record
the yaw rate (Ω ) during the impact phase. Integrated yaw rate plots were
compared graphically to hand plots of videotape images spaced at 100
millisecond intervals, and were found to compare reasonably for all tests (See
Figures 4.1 and 4.2).

38
Figure 4.1 Vehicle Motion Analysis / Test B5

39
Figure 4.2 Integrated Yaw Rate / Test B5
The Y (lateral) acceleration trace was also integrated and plotted, providing a
curve indicating the point in time when the vehicle CG velocity changed direction
(see green lines on Figure 4.3 below). Analysis of the graphs at this point during
the impact typically showed a peak yaw velocity between 100 and 200
milliseconds after first contact.
25
20
15
10
5
0
-5
Inte
grat
ed Y
aw R
ate
(deg
)
1.00.80.60.40.20.0-0.2Time (sec)

40
Figure 4.3 Integrated Acceleration overlaid with Yaw Rate / Test B5
4.4 Crush Measurement
Measurements of deepest crush were taken by tape measure following
each impact, and added to the post test data sheets (an example test data sheet is
found in appendix G). This measurement was used for preliminary energy
calculations. Final crush measurements were taken from plan view CAD
drawings produced using the survey data, and added to the calculation
spreadsheet.
14
12
10
8
6
4
2
0
Inte
grat
ed A
ccel
erat
ion
(mph
)
1.00.80.60.40.20.0-0.2Time (sec)
60
40
20
0
Yaw
Rate (deg/sec)
SAE CFC 60
CG SENSOR
SATELLITE SENSOR
Yaw Rate

41
Figures 4.4.1 and 4.4.2 show composite damage plots showing the crush at
both locations impacted on vehicles B and C.
Figure 4.4.1 Composite Crush Map of Vehicle B

42
Figure 4.4.2 Composite Crush Map of Vehicle C
4.5 Crush Energy Calculation
4.5.1 Planar Vehicle Yaw Rate
As mentioned above, yaw rates were obtained by analyzing yaw rate
sensor data as overlaid with integrated acceleration traces. These yaw rates were
used in crush energy calculations as follows:

43
=Ω Yaw rate (omega) in degrees/sec, converted to radians/sec for energy
calculation
=0I Yaw moment of inertia for rotation about CG
=pI Yaw moment of inertia at the pole (center of vehicle rotation for impulse)
20yaw ΩI
21kE = (4.2)
4.5.2 Calculation of Total Crush Energy
Crush energy was calculated as the total kinetic energy (KEi) of the
vehicle prior to impact, minus the sum of the post-impact kinetic energy (KEf)
and post impact rotational energy (KErot), as shown in equation 4.3.
(4.3)
Survey data recorded following each test were imported into the AutoCAD®
drawing program, and linework was developed allowing comparison of the post
test vehicle outline to the undamaged vehicle outline. Dimensions were
transferred to an Excel® spreadsheet where calculations were performed.
( )2f
2r
20 2
1 - vgw
21 -v
gw
21 CE Ω⎟⎟
⎠
⎞⎜⎜⎝
⎛⎟⎟⎠
⎞⎜⎜⎝
⎛= I

44
Table 4.2 Crush Energy Calculation Matrix
Repeat Test Vo ∆KE Vr Ω KEYaw Ci Cf CETOT
V
Impact Linear V
rebound Yaw
Velocity Yaw
Energy Crush Impact
Crush Total Cumulative
mph ft-lbf mph rad/s ft-lbf inches inches ft-lbf A PILLAR 1 5.2 2757.7 1.0 0.3 116.9 3.0 3.0 2640.7 A PILLAR 2 13.3 18040.3 2.5 1.4 2231.8 4.0 7.0 18449.3 A PILLAR 3 9.5 8631.3 2.9 1.1 1811.4 0.4 7.3 25269.2
B PILLAR 1 4.7 2191.2 1.2 0.3 88.2 1.5 1.5 2103.0 B PILLAR 2 9.6 9091.9 2.5 0.9 809.9 5.5 7.0 10384.9 B PILLAR 3 11.8 13406.4 3.5 1.0 1034.2 7.6 14.5 22757.2 B PILLAR 4 17.5 31466.5 3.0 2.3 5817.0 10.6 25.1 48406.6
FRONT AXLE
1 11.8 14309.3 2.1 1.7 3251.9 4.7 4.7 11057.3 FRONT AXLE
2 16.5 27640.0 3.5 2.4 6373.8 2.5 7.2 32323.6
CG 1 7.9 6214.2 2.0 0.3 130.1 5.4 5.4 6084.1 CG 2 14.5 20934.6 3.6 0.8 718.3 9.2 14.6 26300.3 CG 3 13.0 16999.7 3.0 0.4 150.3 4.5 19.1 43149.7
Calculated values of crush energy were plotted against crush depth (energy vs.
crush). These calculated values form a good basis for comparison. It is worth
repeating that these data are corrected for rotation, and that the total crush energy
absorbed in vehicle structures can be a fairly small percentage of the total kinetic
energy of the vehicle prior to impact. For example, crush energy calculated for
the second impact at the front axle location is 32324 ft-lbf. The energy attributed
to post impact rotation was 6374 ft-lbf (Table 4.2).

45
ENERGY vs CRUSH
0
5000
10000
15000
20000
25000
30000
35000
40000
45000
50000
0 5 10 15 20 25 30
CRUSH (in)
CRUS
H E
NERG
Y (f
tlb)
FRONTAXLE
A PILLAR
B PILLARCG
Figure 4.5 Energy / Crush Distance Correlations
It should be obvious that models which fail to account for rotational energy
should not be relied upon for non-central impacts. In Figure 4, The slope of the
line connecting data points for each test is seen to increase as total energy and
crush depth increase. This is reasonable, as we expect structures to increase in

46
stiffness with increasing deformation up to a point where the structure becomes
completely crippled. In cases of very high crush, a force saturation may occur, as
reported for some vehicles by Strother, et.al. [Strother, 1998]. Such saturation
behavior was not manifest in the crush levels recorded in the present research.
Deeper levels of crush involve more vehicle structures, and the ability of
structures to collapse prior to crippling or rupture becomes more limited with
depth. Only two or three data points are available for stiffness characterizations at
each location. Budget and time limited the number of crash tests which were
devoted to this study.
4.6 Crush Energy as a Function of Width
The use of the SMAC model to calculate an effective “k” or spring
stiffness has become a common industry tool for comparing crush energy from
accident field data to crash test data. A frequently used source for this data is
Neptune Engineering [Appendix D], where thousands of crash test data from
various entities are compiled and sold through an on-line ordering system
[Appendix C]. As shown, available side crash data for the similar body type Ford
Taurus was purchased from Neptune Engineering for comparison with our test
results. The vertical axis in the plots is [2CE/w] ½. In the case of the Neptune
data, the impactor width is the measured barrier face width of a little more than 5
feet. This does not account for the width of the induced damage pattern, just the
crush depth as compared to the width of the impactor.

47
For comparison purposes, a plot of the resulting crash test data overlaid
with the Neptune data is shown below. The Neptune data is centered at the point
(12.5, 100), and is shown in black. These data are taken from 5 side impact tests
with similar test conditions, producing points in the graph that are overlaid at this
point. The green data series mark the points from pole tests at the CG performed
in this study. A trendline was added using a linear regression fit of the data, and
forced through the x,y intercept at zero. The slope of the lines represents the
value of kv, or the equivalent spring constant, relating to the given data group.
CG√(2CE/w) / CRUSH
y = 15x
y = 8x0
50
100
150
200
250
300
350
400
0 10 20 30 40
CRUSH (in)
√(2C
E/w
) w = 1 pole diameter
Neptune Data
`
Figure 4.6 CG Test And Neptune Data

48
4.7 Bowing and Effective Width
In cases of deep deformation and/or high energy side impacts, the vehicle
longitudinal centerline begins to exhibit bowing. Test and accident vehicles
exhibiting high levels of bowing often have ruptured door latch mechanisms and
other component failures associated with the structural integrity of the vehicle.
NHTSA field reconstruction standards mandate an adjustment of energy
calculations by using a “bowing constant” when the undeformed side of the
vehicle is bowed more than 4 inches. Minor bowing was present in all tests
except those performed at the left front axle spin axis, but none exceeded 4
inches. Please refer to Appendix H for the NHTSA protocol for measuring side-
impacted vehicle crush.

49
5.0 DISCUSSION
5.1 Barrier Width
Figure 5.1 (below) helps to illustrate the variation in energy absorption
characteristics a given vehicle will exhibit, based on the width of the impactor.
This comparison may lead us back to a discussion comparing apples to oranges,
but since no other basis for comparison is available, we will stay with impactor
width. An argument could be made that the width of the pole applied to the side
of a vehicle bears little relationship to the width of a NHTSA 214 barrier face.
This research supports such an argument, but for the lack of other proven data to
compare against, we will use the Neptune data, as gleaned from NHTSA 214
tests. In plotting of [2CE/w]½ for the CG test data, the width of the pole (12.75
inches diameter) is compared to the width of the NHTSA 214 test barrier face (66
inches).

50
5.2 Barrier Width as a function of Pole Width
For impacts at the CG, the exact number of pole widths needed to overlay
the Neptune data is 3.55, or 45.3 inches. This does not correlate to the Neptune
data based on barrier width, and it should not be expected to correlate.
CG√(2CE/w) / CRUSH
Varying "w"
0
50
100
150
200
250
300
350
400
0 10 20 30 40
CRUSH (in)
√(2C
E/w
) w = 1 pole diameter
w = 4 pole diameters
w = 3 pole diameters
w = 2 pole diameters
Figure 5.1 CG: Varying Pole Widths Compared to Neptune Data

51
The Neptune data is based upon test data from NHTSA 214 tests, where barrier
width is 66 inches, the barrier face is deformable, and test conditions are
significantly different from those employed here. Graphs showing varying pole
widths help to demonstrate these differences. Plotting test data from the other 3
locations (Front axle, B-pillar, A-pillar), gives some insight into the energy
absorbed at these locations. At the B-pillar location, the data fits best at 2.65
times pole width, 33.8 inches wide, and the others as shown in the following
table:
Table 5.1 Pole Width Correlations
LOCATION FRONT AXLE A PILLAR CG B PILLAR
MULTIPLES OF POLE WIDTH 16.5 12 3.55 2.65
INCHES 210.4 153 45.3 33.8
In addition to the difficulty comparing widths in the [2CE/w]½ equation, we must
deal with the fact that yaw energy is not fully accounted for in the NHTSA 214
test data. Plots of Front axle, A-pillar and B-pillar comparisons are shown below.

52
FRONT AXLE√(2CE/w) / CRUSH
Varying "w"
0
50
100
150
200
250
300
350
400
0 5 10 15 20 25 30 35 40
CRUSH (in)
√(2C
E/w
)
w = 1 pole diameter
w = 16.5 pole diameters
Neptune Data
Figure 5.2 Front Axle: Varying Pole Widths / Neptune Data

53
A PILLAR√(2CE/w) / CRUSH
Varying "w"
0
50
100
150
200
250
300
350
400
0 10 20 30 40
CRUSH (in)
√(2C
E/w
)
w = 1 pole diameter
w = 12 pole diameters
Neptune Data
Figure 5.3 A Pillar: Varying Pole Widths / Neptune Data

54
B PILLAR√(2CE/w) / CRUSH
Varying "w"
0
50
100
150
200
250
300
350
400
0 10 20 30 40
CRUSH (in)
√(2C
E/w
)
w = 1 pole diameter
w = 2.65 pole diameters
Neptune Data
Figure 5.4 B Pillar: Varying Pole Widths / Neptune Data
Variation in structural stiffness between multiple locations along a vehicle side
can be characterized through analysis of crash test data at the different locations.
This research allows conclusions to be drawn and predictions to be made for the
Ford Taurus vehicle platform based upon the comparison of similar test or
accident conditions to this testing. Generalizations relating narrow object test or
accident conditions in locations other than at or close to the locations tested here,

55
in angled tests, or with barrier types or widths of different types should not be
made. Test data exist wherein results are calculated inclusive of rotational
energy, in addition to data where these calculations are not included. The
researcher should use care in use of crash test data and results, including those
presented here.
5.3 Yaw Energy
Calculation of yaw energy, and accounting for such energy must be
performed for impacts where post impact yaw is present. In a case where the
center of an impulse is offset more that a few inches from the vehicle CG, this
energy can be a large percentage of the total energy. For example, in the tests at
the vehicle CG, the total yaw energy is 998 ft-lbf, less than 3% of the total crush
energy, whereas the yaw energy at the front axle is 9625, nearly 30% of the total
crush energy (Table 5.2).
Table 5.2 Highlighted Crush Energy Calculations
Repeat Test Vo ∆KE Vr Ω KEYaw Ci Cf CETOT
V
Impact Linear V
rebound Yaw
Velocity Yaw
Energy Crush Impact
Crush Total Cumulative
mph ft-lbf mph rad/s ft-lbf inches inches ft-lbf FRONT AXLE
1 11.8 14309.3 2.1 1.7 3251.9 4.7 4.7 11057.3 FRONT AXLE
2 16.5 27640.0 3.5 2.4 6373.8 2.5 7.2 32323.6
CG 1 7.9 6214.2 2.0 0.3 130.1 5.4 5.4 6084.1 CG 2 14.5 20934.6 3.6 0.8 718.3 9.2 14.6 26300.3 CG 3 13.0 16999.7 3.0 0.4 150.3 4.5 19.1 43149.7

56
Figure 5.5 Comparison of Crush Energy / Linear Crush Distance
ENERGY vs CRUSH
0
5000
10000
15000
20000
25000
30000
35000
40000
45000
50000
0 5 10 15 20 25 30
CRUSH (in)
CR
USH
EN
ERG
Y (f
tlb)
FRONTAXLE
A PILLAR
B PILLARCG

57
5.4 Energy Comparisons Based upon Impact Location
One of the goals of this work was to ascertain how well impacts between
the stiffest and softest locations on a vehicle exhibit behavior consistent with
averaging the distance between points of equal force on the energy/displacement
curve. For example, using a crush energy basis of 20,000 ft-lbf, we can compare
crash deformation and stiffness between the A-Pillar and B-Pillar locations noting
the intersection of each curve, and checking the deformation in inches. The
results of this example give a deformation comparison of 7.2 at the A-Pillar vs.
13.5 inches at the B-Pillar. The challenge comes when one tries to interpolate
between points. If we attempt to use the CG data as a mid point between the A
and B Pillars, we find it crosses the 20,000 ft-lbf line at 12 inches. This method
does not allow for reliable linear interpolation prediction of structural behavior
between points, but a physical understanding of the structures involved at the
various impact locations can lead to rational justification of these results.
When applying these data to another vehicle with side impact deformation, the
researcher must apply good judgment in comparing stiff locations to soft
locations. The behavior of the crush data at the CG location during this test series
was particularly difficult to predict. The term “Transition Zone” may be used to
describe a location that is between a hard and soft spot. Repeated impacts at the
CG of the Ford Taurus test vehicles presented a behavior that was unanticipated.

58
The crush pattern had a tendency to drift toward the softer area of the vehicle side
structure, yielding in a pattern that forced the vehicle to move longitudinally to
some degree during the impact phase. It is likely that a given vehicle will exhibit
this behavior in several locations. More research is needed to compare behavior
of these transition zones, and to compare repeated impacts to higher speed single
impact tests. It is anticipated that this diagonal drifting will be evident in both
repeated and single impacts, but that the drifting will be more difficult to account
for using an energy basis in repeated testing.

59
6.0 CONCLUSIONS
6.1 Multiple Impact Location Test Technique
A method for impacting a test vehicle at multiple locations along the side
has been developed. Comparing calculated crush energy from test data at
multiple impact locations provides the researcher with a better understanding of
the variation in stiffness along the vehicle side. Though not practical as a tool in
every circumstance, this technique should be considered when side impact crush
energy absorption characteristics are key to the outcome of an accident
reconstruction.
6.2 Variations in Stiffness Between Impact Locations
The results of this study allow a generalization relating energy absorption
properties at different locations along the vehicle side. These tests show that front
axle and A pillar locations are much stiffer than CG and B pillar locations in
response to rigid, narrow pole impacts, and that equivalent energy is absorbed
over roughly half the crush distance as compared to CG and B pillar locations.

60
Conversely, the front axle and A pillar locations absorb about twice the energy for
a given linear crush distance.
6.3 Importance of Yaw Energy in Calculating Crush Energy
Calculation of yaw energy, and accounting for such energy must be
performed for impacts where post impact yaw is present. In a case where the
center of an impulse is offset more that a few inches from the vehicle CG, yaw
energy can be a large percentage of the total energy.
6.4 Transition Zones
In areas between stiff and soft spots on the vehicle side, interaction of the
rigid pole barrier created a source of longitudinal deflection as it interacted with
vehicle structures. This behavior was noticed at the CG of the Ford Taurus test
vehicle, and was accentuated in repeated impact tests. The resultant forces
experienced by the vehicle during impact were not purely lateral as would be
modeled in many accident simulation programs.

61
6.5 Pole Impact Data Compared to NHTSA 214 Test Data
Comparison of these test data to NHTSA 214 test data show significant
differences in vehicle side structure response. This is to be expected, as NHTSA
214 test data are taken from application of a wide deformable barrier face and
crabbed moving barrier. The researcher should use discretion when comparing
narrow object impacts to NHTSA 214 test data.
6.6 Applications
In cases where a pole or tree impact has occurred and residual crush has
displaced structures laterally into the side of a vehicle, these data can be
referenced and used as an aid to accident reconstruction. Only vehicle structures
similar to the late model Ford Taurus should be compared.
Modern automobiles are constructed is such a way as to maximize convenience
and usefulness to the consumer, while providing needed performance and safety.
The results of this study may be misinterpreted by some to conclude that vehicles
of the type tested here are “too soft” in the areas surrounding the passenger
compartment. Stiffness and energy absorption properties relating to occupant
motion and protection are complex issues not discussed here.

62

63
7.0 RECOMMENDATIONS FOR FUTURE RESEARCH
An important goal of any research should be the advancement of state-of-
the-art techniques for analysis or method. This work has presented many
problems and solutions in terms of crash test technique and methodology, and
some of the solutions have come as a result of post test analysis.
Recommendations for future work of this type are as follows:
1. Pole contact area as applied to the vehicle body surface should be
measured following each impact. Some correlation between the pole
surface area, or simply the circumferential contact distance, with the crush
and stiffness calculations may be discovered.
2. The characterization of “transition zones” along the vehicle side should be
explored. Experience here shows that repeated impact techniques in
transition zones will be less dependable for calculation of crush energy in
these locations.

64
3. Comparable peer vehicles should be tested using similar test conditions
and impact parameters, allowing more general comparisons of this test
data to other vehicle makes and models.
4. Verification tests are needed to confirm the accuracy of the repeated
impact technique on vehicle side structures. Multiple impact tests need to
be compared to single impact tests of equal energy.

65
REFERENCE MATERIALS
[Asay 2002] Asay, Alan F., Dagmar Buzeman-Jewkes, and Ronald L. Woolley, “Narrow Object Impact Analysis & Comparison with Flat Barrier Impacts”, Paper # 2002-01-0552, Society of Automotive Engineers, Warrendale, Pennsylvania, 2002.
[Baumann 1990] Baumann, K.H., L. Groesch, H. Holtze, and W. Schwede, “Frontal Offset Crash Testing for Approx. 15 Yrs: Results, Experiences & Consequences”, Paper # 900413, Society of Automotive Engineers, Warrendale, Pennsylvania, 1990.
[Brach 1987] Brach, Raymond M., “Energy Loss in Vehicle Collisions”, Paper # 871993, Society of Automotive Engineers, Warrendale, Pennsylvania, 1987.
[Bradsher 2002] Bradsher, Keith, High and Mighty, New York: PublicAffairs, 2002.
[Brown 1998] Brown, Christopher M., “1994 Ford Explorer XLT Broadside Collision with a Narrow Fixed Object: Foil Test No. 98S005”, Publication No. FHWA-RD-98-150, USDOT, Federal Highway Administration, McLean, Virginia, Oct. 1998.
[Buzeman-Jewkes 1999]
Buzeman-Jewkes, Dagmar G., Per Lövsund, and David C. Viano, “Use of Repeated Crash Tests to Determine Local Long & Shear Stiffness of the Veh Front with Crush”, Paper # 1999-01-0637, Society of Automotive Engineers, Warrendale, Pennsylvania, 1999.
[Campbell 1974] Campbell, Kenneth L., “Energy Basis for Collision Severity”, Paper # 740565, Society of Automotive Engineers, Warrendale, Pennsylvania, 1974.
[Canada] Canada, “Test Method 214 – Side Door Strength”, Ottawa, Ontario, November 14, 1996.
[Chen 2004] Chen, H. Fred, C. Brian Tanner, Nicholas J. Durisek, and Dennis A. Guenther, “ Pole Impact Speeds Derived from Bilinear Estimations of Maximum Crush for Body-On-Frame Constructed Vehicles”, Paper # 2004-01-1615, Society of Automotive Engineers, Warrendale, Pennsylvania, 2004.
[De Coo 1998] De Coo, P.J., A.K. Roberts, A. Seeck, and D. Cesari, “Test Methods for Evaluating and Comparing the Performance of Side Impact Barrier Faces”, 16th ESV Conference, Abstract Paper # 98-S8-O-02, Windsor, Canada, June 1998.

66
[Digges 1999] Digges, K., A. Eigen, and J. Harrison, “Application of Load Cell Barrier Data to Assess Vehicle Crash Performance and Compatibility”, Paper # 1999-01-0720, Society of Automotive Engineers, Warrendale, Pennsylvania, 1999.
[Durisek 2004] Durisek, Nicholas J., C. Brian Tanner, H. Fred Chen, and Dennis A. Guenther,
“Vehicle Characterization Through Pole Impact Testing, Part I: Vehicle Response in Terms of Acceleration Pulses”, Paper # 2004-01-1210, Society of Automotive Engineers, Warrendale, Pennsylvania, 2004.
[Emori 1968] Emori, Richard I., “Analytical Approach to Automobile Collisions”, Paper # 680016, Society of Automotive Engineers, Warrendale, Pennsylvania, 1968.
[Emori] Emori, Richard I., “Mechanics of Automobile Collisions”, Conf.
[EuroNCAP 2003] “Pole Side Impact Testing Protocol”, European New Car Assessment Programme,
Version 4, Jan. 2003.
[Fleck 1996] Fleck, John, NHTSA Crash Test V2483, Report No. 214D-MGA-97-04 New Car Assessment Program Side Impact Testing Passenger Cars, 1977 Ford Taurus 4-door Sedan, MGA Proving Ground, Burlington, Wisconsin, Dec. 11, 1996.
[FMVSS 214] US Dept of Transportation Laboratory Test Procedure for FMVSS 214, August 2, 1999.
[Fonda 1990] Fonda, Albert G., “Crush Energy Formulations and Single-Event Reconstruction”,
Paper # 900099, Society of Automotive Engineers, Warrendale, Pennsylvania, 1990.
[Gadberry 1998] Gadberry, Chad, NHTSA Crash Test V2975, Report No. 214-MGA-99-02 Safety Compliance Testing for FMVSS No. 214 “Side Impact Protection”, 1999 Ford Taurus 4-door, MGA Proving Ground, Burlington, Wisconsin, Dec. 21, 1998.
[Gorski 1991] Gorski, Zygmunt, “Practical Problems Related to Side Impact Field Data Accuracy & Its Importance to Side Impact Protection Assessments”, Paper # 910317, Society of Automotive Engineers, Warrendale, Pennsylvania, 1991.
[Grimes 1997] Grimes, Wesley D., Ronald Heusser, John Hunter, and James A. Neptune, “Developing a Crush Profile Estimate by Balancing Impact Forces”, Paper # 970942, Society of Automotive Engineers, Warrendale, Pennsylvania, 1997 .
[IIHS 2001] “Head Protection in Side Impacts”, Status Report, Insurance Institute for Highway Safety, Jan. 6, 2001
[IIHS 2002] “Side Impact Crash Test Protocol (Version I)”, Insurance Institute for Highway Safety, Dec. 2002.
[IIHS 2003] “Side Impact Crash Test Protocol (Version II)”, Insurance Institute for Highway Safety, Oct. 2003.

67
[IIHS 2004] “Side Impact Crash Test Results: Camry and Accord with Side Airbags Rated Good, Malibu Acceptable; 10 Other Mid-sized Cars Rated Poor in Tests Simulating Crash With SUV”, Insurance Institute for Highway Safety, April 18, 2004.
[Jones 1978] Jones, Ian S., and A. Stephen Baum, “An Analysis of the Urban Utility Pole Accident Problem”, American Association of Automotive Medicine, San Francisco, California, 1978.
[Kamal 1970] Kamal, M.M., “Analysis and Simulation of Vehicle to Barrier Impact”, Paper # 700414 Society of Automotive Engineers, Warrendale, Pennsylvania, 1970.
[Kent 1998] Kent, Richard W. and Charles E. Strother, “Wooden Pole Fracture Energy in Vehicle Impacts”, Paper # 980214, Society of Automotive Engineers, Warrendale, Pennsylvania, Warrendale, Pennsylvania, 1998.
[Kerkhoff 1993] Kerkhoff, John F., Stein E. Husher, Michael S. Varat, Alison M. Busenga, and Kevin Hamilton, “An Investigation into Vehicle Frontal Impact Stiffness, BEV and Repeated Testing for Reconstruction”, Paper # 930899, Society of Automotive Engineers, Warrendale, Pennsylvania, 1993.
[Kosloske 2000a] Kosloske, Dave and David Winkelbauer, NHTSA Crash Test V3445, ES-2 Full Scale Vehicle Tests, Report No. 2, Testing for EU 96/27/EC European Side Impact, 1996 Ford Taurus 4-door, MGA Proving Ground, Burlington, Wisconsin, Aug. 15, 2000.
[Kosloske 2000b] Kosloske, Dave and David Winkelbauer, NHTSA Crash Test V3522, ES-2 Full Scale Vehicle Tests, Report No. 4, FMVSS No. 214 “Side Impact Protection”, 1996 Ford Taurus 4-door, MGA Proving Ground, Burlington, Wisconsin, Nov. 8, 2000.
[Kosloske 2000c] Kosloske, Dave and David Winkelbauer, NHTSA Crash Test V3482, ES-2 Full Scale Vehicle Tests, Report No. 3, FMVSS No. 214 “Side Impact Protection”, 1996 Ford Taurus 4-door, MGA Proving Ground, Burlington, Wisconsin, Aug. 20, 2000.
[Lim 1972] Lim, G.G., “Crash Data Analysis”, Paper # 720496, Society of Automotive Engineers, Warrendale, Pennsylvania, 1972.
[Long 1999] Long, Timothy J., “A Validation Study for the Force Balance Method in Determination of Stiffness Coefficients”, Paper # 1999-01-0079, Society of Automotive Engineers, Warrendale, Pennsylvania, 1999.
[Mak 1981] Mak, King K., John J. Labra, and J. Thomas Noga, “A Procedure for The Reconstruction of Pole Accidents”, American Association of Automotive Medicine, San Francisco, California, 1981.
[Mak 1981] Mak, King K., and Robert L. Mason, “Selected Characteristics of Pole Impacts”, American Association of Automotive Medicine, San Francisco, California, 1981.
[Marquard 1966] Marquard, E., “Progress in the Calculations of Vehicle Collisions”, Automobiltechnische Zeitschrift, Jahrq. 68, Heft 3, 1966, pp. 74-80.

68
[McHenry 1975] McHenry, R.R., “The CRASH Program – A Simplified Collision Reconstruction Program”, Paper prepared for the Motor Vehicle Collision Investigation Symposium, Calspan Corporation, Buffalo, New York, October 1975.
[Monson 1999] Monson, Kenneth, “Determination of Mechanisms of Motor Vehicle Structural Restitution from Crash Test Data”, Paper # 1999-01-0097, Society of Automotive Engineers, Warrendale, Pennsylvania, 1999.
[Morgan 1987] Morgan, James R. and Don L. Ivey, “Analysis of Utility Pole Impacts”, Paper # 870607, Society of Automotive Engineers, Warrendale, Pennsylvania, 1987.
[Neptune 1992] Neptune, James A., George Y. Blair, and James E. Flynn, “A Method for Quantifying Vehicle Crush Stiffness Coefficients”, Paper # 920607, Society of Automotive Engineers, Warrendale, Pennsylvania, 1992.
[Neptune 1994] Neptune, James A. and James E. Flynn, “A Method for Determining Accident Specific Crush Stiffness Coefficients”, Paper # 940913, Society of Automotive Engineers, Warrendale, Pennsylvania, 1994.
[Neptune 1998] Neptune, James A. and James E. Flynn, “A Method for Determining Crush Stiffness Coefficients from Offset Frontal and Side Crash Tests”, Paper # 980024, Society of Automotive Engineers, Warrendale, Pennsylvania, 1998.
[Neptune 1999] Neptune, James A., “A Comparison of Crush Stiffness Characteristics from Partial-Overlap and Full-Overlap Frontal Crash Tests”, Paper # 1999-01-0105, Society of Automotive Engineers, Warrendale, Pennsylvania, 1999.
[Nystrom 1991] Nystrom, Gustav A., Garrison Kost, and Stephen M. Werner, “Stiffness Parameters for Vehicle Collision Analysis”, Paper # 910119, Society of Automotive Engineers, Warrendale, Pennsylvania, 1991.
[Nystrom 1992] Nystrom, Gustav A. and Garrison Kost, “Application of the NHTSA Crash Database to Pole Impact Predictions”, Paper # 920605, Society of Automotive Engineers, Warrendale, Pennsylvania, 1992.
[PC Crash] PC Crash User manual, Version 6.2
[Prasad 1981] Prasad, Priyaranjan, “Static-to-Dynamic Amplification Factors for use in Lumped-Mass Vehicle Crash Models”, Paper # 810475, Society of Automotive Engineers, Warrendale, Pennsylvania, 1981.
[Prasad 1990] Prasad, Aloke Kumar, “CRASH3 Damage Algorithm Reformulation for Front and Rear Collisions”, Paper # 900098, Society of Automotive Engineers, Warrendale, Pennsylvania, 1990.
[Prasad 1990] Prasad, Aloke K., “Energy Dissipated in Vehicle Crush – A Study Using the Repeated Test Technique”, Paper # 900412, Society of Automotive Engineers, Warrendale, Pennsylvania, 1990.
[Prasad 1991] Prasad, Aloke K., “Energy Absorbed by Vehicle Structures in Side-Impacts”, Paper # 910599, Society of Automotive Engineers, Warrendale, Pennsylvania, 1991.
69
[Robinson 2000] Robinson, Edward L., “Derivation of Closing Speed as a Function of Dissipated Energy”, Paper # 2000-01-1318, Society of Automotive Engineers, Warrendale, Pennsylvania, 2000.
[Samaha 1998] Samaha, Randa R., Louis N. Molino, and Matthew R. Maltese, “Comparative Performance Testing of Passenger Cars Relative to FMVSS 214 and the EU 96/EC/27 Side Impact Regulations: Phase I”, 16th ESV Conference, Abstract Paper #98-S8-O-08, Windsor, Canada, June 1998.
[Schreier 1987] Schreier, Hans-Herbert and Wilton D. Nelson, “Applicability of the EES-Accident Reconstruction Method with MacCAR”, Paper # 870047, Society of Automotive Engineers, Warrendale, Pennsylvania, 1987.
[Seyer 1998] Seyer, K., M. Terrell, Brian Fildes, D. Dyte, and K. Digges, “Development and Benefits of a Harmonised Dynamic Side Impact Standard”, 16th ESV Conference, Abstract Paper # 98-S8-O-04, Windsor, Canada, June 1998.
[SMAC] SMAC User manual, 1994
[Smith 1987] Smith, Gregory C., Michael B. James, Thomas R. Perl, and Donald E. Struble, “Frontal Crush Energy & Impulse Analysis of Narrow Object Impacts”, Paper # 87-WA/SAF-5, The American Society of Mechanical Engineers, New York, New York, 1987.
[Stolinski 1998] Stolinski, Richard, Raphael Grzebieta, and Brian Fildes, “Vehicle Far-Side Impact Crashes”, 16th ESV Conference, Abstract Paper # 98-S8-W-23, Windsor, Canada, June 1998.
[Strother 1986] Strother, Charles E., Ronald L. Woolley, Michael B. James, and Charles Y. Warner, “Crush Energy in Accident Reconstruction”, Paper # 860371, Society of Automotive Engineers, Warrendale, Pennsylvania, 1986.
[Strother 1998] Strother, Charles E., Richard W. Kent , and Charles Y. Warner, “Estimating Vehicle Deformation Energy for Vehicles Struck in the Side”, Paper # 980215, Society of Automotive Engineers, Warrendale, Pennsylvania, 1998.
[Strother 1990] Strother, Charles E., Charles Y. Warner, Ronald L. Woolley, and Michael B. James, “The Assessment of the Societal Benefit of Side Impact Protection”, Paper # 900379, Society of Automotive Engineers, Warrendale, Pennsylvania, 1990.
[Tumbas 1988] Tumbas, Nicholas S. and Russell A. Smith, “Measuring Protocol for Quantifying Vehicle Damage from an Energy Basis Point of View”, Paper # 880072, Society of Automotive Engineers, Warrendale, Pennsylvania, 1988.
[Ueno 1998] Ueno, Masanori, Takeshi Harigae, Haruo Ohmae, Takahiko Uchimura, and Eiji Fujiwara, “Development of Moving Deformable Barrier in Japan – Part 2”, 16th ESV Conference, Abstract Paper # 98-S8-W-25, Windsor, Canada, June 1998.
[Varat 1994] Varat, Michael S., Stein E. Husher, and John F. Kerkhoff, “An Analysis of Trends of Vehicle Frontal Impact Stiffness”, Paper # 940914, Society of Automotive Engineers, Warrendale, Pennsylvania, 1994.

70
[Varat 1999] Varat, Michael S. and Stein E. Husher, “Vehicle Crash Severity Assessment in Lateral Pole Impacts”, Paper # 1999-01-0100, Society of Automotive Engineers, Warrendale, Pennsylvania, 1999
[Warner 1978] Warner, Charles Y. and Thomas R. Perl, “The Accuracy and Usefulness of SMAC”, Paper # 780902, Society of Automotive Engineers, 22nd STAPP Car Crash Conference, Ann Arbor, Michigan, 24-26 October 1978.
[Warner 1986] Warner, Charles Y., “A Repeated-Crash Test Technique for Assessment of Structural Impact Behavior”, Paper # 860208, Society of Automotive Engineers, Warrendale, Pennsylvania, 1986.
[Warner 1989] Warner, Charles Y., Charles E. Strother, Michael B. James, Donald E. Struble, and Timothy P. Egbert, “Crash Protection in Near-Side Impact – Advantages of a Supplemental Inflatable Restraint”, Paper # 890602, Society of Automotive Engineers, Warrendale, Pennsylvania, 1989.
[Warner 1990] Warner, Charles Y., Charles E. Strother, Michael B. James, “A Perspective on Side Impact Occupant Crash Protection”, Paper # 900373, Society of Automotive Engineers, Warrendale, Pennsylvania, 1990.
[Warner 1990] Warner, Charles Y., Charles E. Strother, and Ronald L. Woolley, “Application of Kinematic Concepts to Side Impact Injury Analysis”, Paper # 900375, Society of Automotive Engineers, Warrendale, Pennsylvania, 1990.
[Welsh 1999] Welsh, Kevin, “Crush Energy and Structural Characterization”, Paper # 1999-01-0099, Society of Automotive Engineers, Warrendale, Pennsylvania, 1999.
[Winkelbauer 1995]
Winkelbauer, David, NHTSA Crash Test V2340, Report No. 214-MGA-96-003 Safety Compliance Testing for FMVSS 214 “Side Impact Protection – Passenger Cars”, 1996 Ford Taurus GL 4-door, MGA Proving Ground, Burlington, Wisconsin, Nov. 14, 1995.
[Wood 1992] Wood, Dennis, “Collision Speed Estimation Using a Single Normalised Crush Depth-Impact Speed Characteristic”, Paper # 920604, Society of Automotive Engineers, Warrendale, Pennsylvania, 1992.
[Wood 1993] Wood, Denis P., Mark Doody, and Stephen Mooney, “Application of a Generalised Frontal Crush Model of the Car Population to Pole and Narrow Object Impacts”, Paper # 930894, Society of Automotive Engineers, Warrendale, Pennsylvania, 1993.
[Wood 1997] Wood, Denis P. and Stephen Mooney, Modelling of Car Dynamic Frontal Crush”, Paper # 970943, Society of Automotive Engineers, Warrendale,Pennsylvania, 1997.
[Wood 1998] Wood, Denis P., “Comparison of Modelled and Actual Car Dynamic Frontal Crush”, Paper # 980027, Society of Automotive Engineers, Warrendale, Pennsylvania, 1998.

71
[Woolley 1991] Woolley, Ronald, Charles E. Strother, and Michael B. James, “Rear Stiffness Coefficients Derived from Barrier Test Data”, Paper # 910120, Society of Automotive Engineers, Warrendale, Pennsylvania, 1991.
[Woolley 2000] Woolley, Ronald L., Alan F. Asay, and Dagmar Buzeman-Jewkes, “Crash Testing with a Massive Moving Barrier as an Accident Reconstruction Tool”, Paper # 2000-01-0604, Society of Automotive Engineers, Warrendale, Pennsylvania, 2000.
[Woolley 2001] Woolley, Ronald L., “Non-Linear Damage Analysis in Accident Reconstruction”, Paper # 2001-01-0504, Society of Automotive Engineers, Warrendale, Pennsylvania, 2001.
[Zeidler 1985] Zeidler, F., H.H. Schreier, and R. Stadelmann, “Accident Research and Accident Reconstruction by the EES-Accident Reconstruction Method”, Paper # 850256, Society of Automotive Engineers, Warrendale, Pennsylvania, 1985.

72

73
APPENDIX
I. FMVSS 214 “Dynamic” Side Impact Protection 74
J. European Side Impact Test 78
K. Excerpts from Neptune Engineering, Inc. Website 80
L. Neptune Crash Data for 1999 Taurus Side 87
M. Yaw Moment of Inertia for 1999 Taurus 88
N. Charles Y. Warner Brief Regarding Energy Models 89
O. Selected Test Vehicle Photographs 97
P. NHTSA Bowing Protocol 103

74

75

76

77

78

79

80

81

82

83

84

85

86
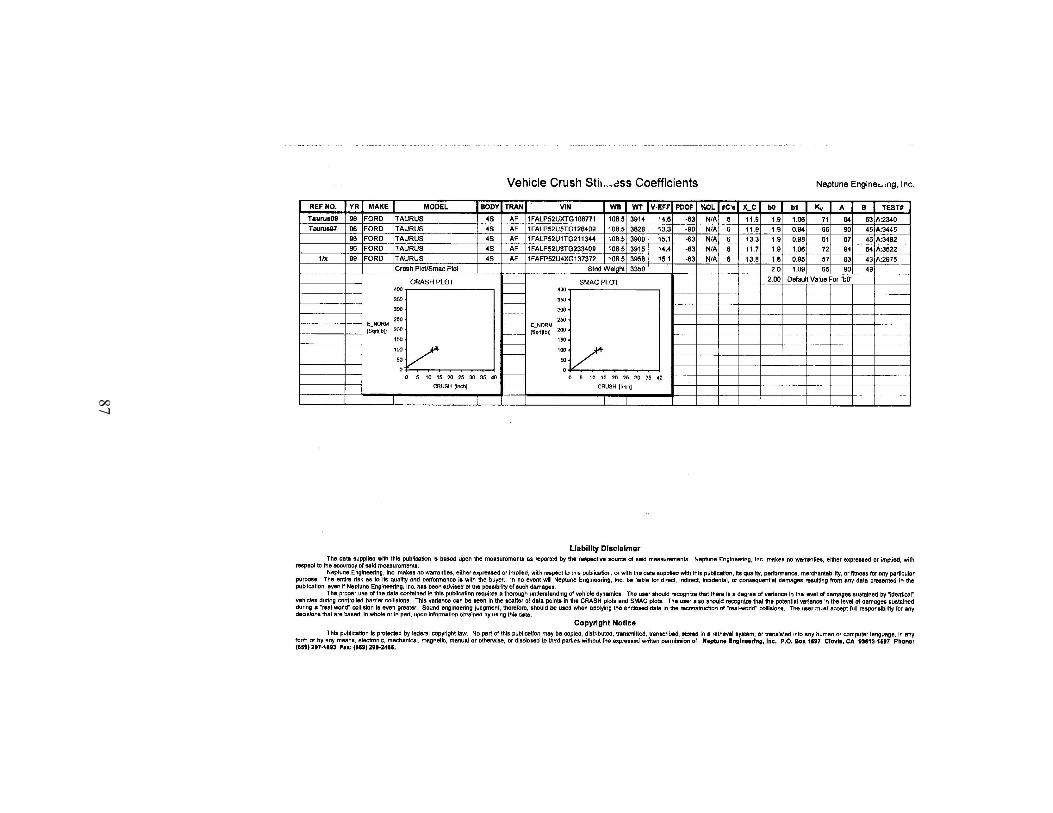
87

88

89
Notes Regarding Energy Models
A Dialog by Dr. Charles Y. Warner, Senior Engineer / Collision Safety
Engineering
The widespread use of crush energy as a tool for accident reconstruction
depends upon structural performance data from appropriate surrogate structures.
This has been attempted in various ways since the method first gained prominence
following the accumulation of a small number of crashes which served as a basis
for the CRASH II computer program, fostered by the NHTSA about 1974 as a
basis for “automated” reconstruction for field accident data teams. The CRASH
(Calspan Reconstruction of Accident Speeds on the Highway) program was based
on a user-interactive approach in an era where punched card data input was just
giving way to desktop computers. This approach allowed the NHTSA’s relatively
non-technical field investigators to answer standardized questions and arrive at an
answer for traveling speed and velocity change. It gave the NHTSA a way to
accumulate data on crash severity in a standardized and repeatable way, and
served as the reconstruction basis for the National Crash Severity Study (NCSS)
and National Accident Sampling System (NASS). Although the program was
never intended for precision work, CRASH II’s energy methods were quickly

90
adopted by the reconstruction community because the computer program allowed
a kind of “cookbook” approach.
Since the inception of the FMVSS crash testing program, thousands of
FMVSS compliance and NCAP crash tests have been performed and reported by
government, research and manufacturer agencies, patterned to prove or disprove
performance of occupant protection strategies related to legal requirements. This
has led to the development of a kind of “cottage industry” wherein government
test results have been catalogued and massaged in the form of energy coefficients
first utilized for the CRASH II computer program and its predecessor, the
Simulation Model for Automotive Collisions (SMAC) program. The continuing
enlargement of this crash data base has proven to be both a blessing and a curse to
the crash reconstruction community. It is an obvious blessing because it has
provided access to real structural and restraint system performance data and
thereby helped to enlighten the community regarding vehicle and occupant
motion and injury causation. Its negative effects are related to the false sense of
security which comes from repetition of many very similar tests around a single
test condition and generalization of that condition to other untested situations.
FMVSS, NCAP and EuroNCAP requirements have specific test conditions that
are seldom seen that specifically in real accidents. Vehicles have thus been
characterized on the basis of these many repetitions of the same test condition, but
much of the structural detail for more limited force application and for different

91
impacts speeds is masked in these generalizations. This was obviously true of the
first single-parameter modeling of the entire vehicle circumference by the same
single-parameter crush stiffness (kv) in the SMAC program. This first
approximation was designed around a linear spring-mass model in an attempt to
provide a time-based solution of the crash phase. The stiffness kv was intended to
indicate the linear force-deflection constant which would result from compression
of a unit width of a vehicle having homogeneous crush character similar to a foam
block, so it had the dimensions of a classical stiffness, i.e. lb/ft, written per unit
crush width. Hence, kv had the units of (lb/ft)/ft; resembling a pressure. Aside
from applications to cases where significant shear angles, corners, and multiple
impacts were applied on various sides of the same vehicle, the approximations
remained physically intelligible. (An early through review of the literature of the
SMAC program and some of its applications was given by Warner and Perl,
1978.)
The introduction of the CRASH filled some of the technical blanks left in
the SMAC formulation, but created others in its turn. Much of our current
reconstruction work still carries the physical paradigms introduced by SMAC and
CRASH, but many of their oversimplifications remain to bedevil the practitioners
and confuse the physical interpretation of their structural models and results.
CRASH retained the unit-height representation of vehicle structures introduced in
SMAC. In this regard, neither program offers complete reconstruction of the

92
general under-over-ride accident scenario. CRASH, moving toward the purpose
of improving the modeling ability of the crushing structures, introduced a two-
parameter (A + Bx) slope-intercept characterization of the crush layer formerly
represented in SMAC by the single stiffness parameter kv. Hence the CRASH
model allows a representation of the displacing structures in slope-intercept form.
The reconstruction tables and charts produced from crash tests typically report
both characterizations, i.e. the kv for the SMAC model and the A and B for the
CRASH model. Thus, the reconstruction community has available tables of kv,
A, and B coefficients for the fronts, rears, and sides of various makes and models
of automobiles, mostly structured from crash tests related to FMVSS
requirements. These are seldom adequate to justify the sophistication of even a
two-parameter model, since the severity range and crush data are clustered around
a single test condition. In practice, many attempt to salvage the appearance of
accuracy by assuming a no-damage impact level (the energy level at which
permanent plastic deformation remains), but this is seldom based on real crash
data for the vehicle represented.
It is fortunate that many of the inaccuracies in the tabulated data are
masked by the squared function that generally governs the calculation of crush
energy and crash intensity, so that many of the inaccuracies are of little
consequence in serious crashes. Since the majority of reconstruction applications
are directed to injury-producing crashes involving significant delta-V, the nuances

93
of lower-severity crush behavior may not be important. Hence the emphasis on
more elaborate crush models may be somewhat wasted, except for modeling of
crashes where limited crush is involved.
One method which has been used successfully to address structural crush
behavior involves repeated testing of the same structures [Warner; Prasad]. While
this approach cannot offer much insight into replication of occupant motion, it has
been shown to give reasonable approximations of crush energy responses and has
been used in many applications.
Data limitations arising from the limited test scope are often ignored in the
application of these tabulated coefficients. For instance, it is often assumed that
the “pressure” exerted upon a crushing structure is uniform across the width of
application. Of course, the width of application is fixed in FMVSS testing, but
real crashes have varying widths. That assumption is implied in all of the
tabulated coefficients, but it is obviously unjustified in localized crashes like pole
impacts and in situations where stiff structures “telescope” past each other. It is
often necessary to conduct specific testing to evaluate structural conditions
encountered in practice.
Definition of crush width and of impact location become very significant
in side impact [Strother, et.al. 1998]. The tabulated crash data available to the
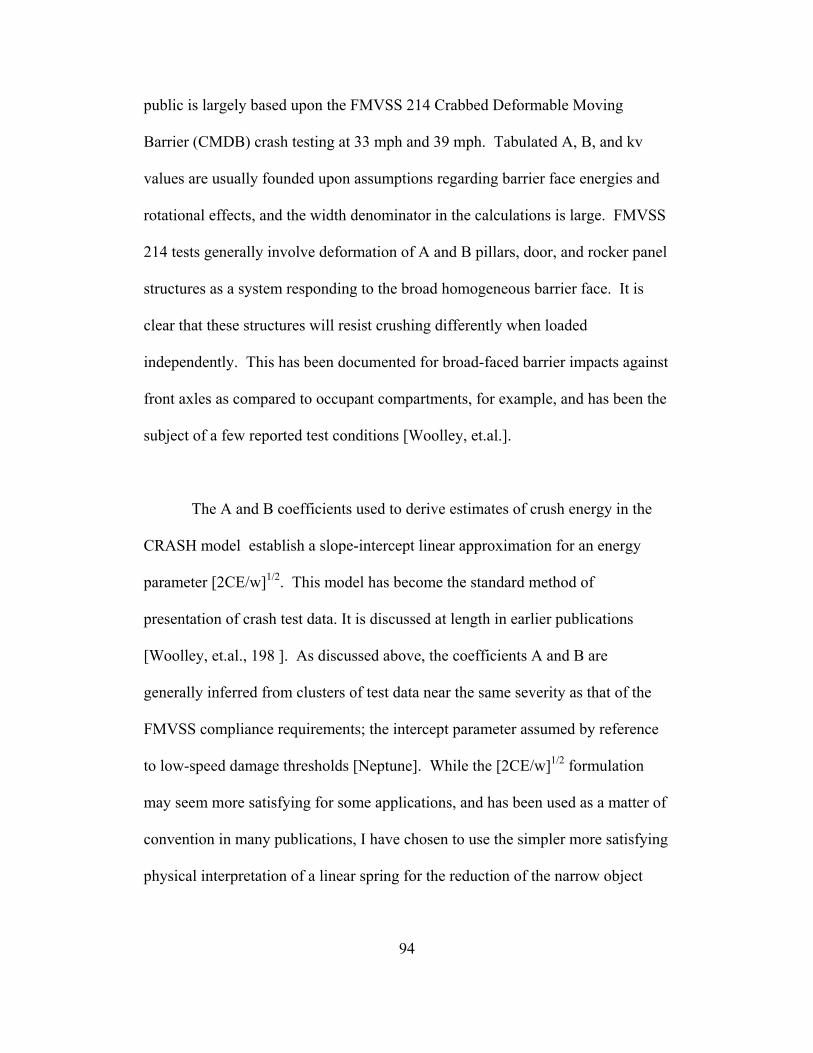
94
public is largely based upon the FMVSS 214 Crabbed Deformable Moving
Barrier (CMDB) crash testing at 33 mph and 39 mph. Tabulated A, B, and kv
values are usually founded upon assumptions regarding barrier face energies and
rotational effects, and the width denominator in the calculations is large. FMVSS
214 tests generally involve deformation of A and B pillars, door, and rocker panel
structures as a system responding to the broad homogeneous barrier face. It is
clear that these structures will resist crushing differently when loaded
independently. This has been documented for broad-faced barrier impacts against
front axles as compared to occupant compartments, for example, and has been the
subject of a few reported test conditions [Woolley, et.al.].
The A and B coefficients used to derive estimates of crush energy in the
CRASH model establish a slope-intercept linear approximation for an energy
parameter [2CE/w]1/2. This model has become the standard method of
presentation of crash test data. It is discussed at length in earlier publications
[Woolley, et.al., 198 ]. As discussed above, the coefficients A and B are
generally inferred from clusters of test data near the same severity as that of the
FMVSS compliance requirements; the intercept parameter assumed by reference
to low-speed damage thresholds [Neptune]. While the [2CE/w]1/2 formulation
may seem more satisfying for some applications, and has been used as a matter of
convention in many publications, I have chosen to use the simpler more satisfying
physical interpretation of a linear spring for the reduction of the narrow object

95
impact data in my research. I believe that this will simplify the process of sorting
out the rotation, restitution, and crash width issues with which I am faced in this
analysis. The result should allow the reader to more easily interpret the
observations. This is consistent with the presentation and analysis of Varat, et.al.
[Varat, 1999]. Application of more elaborate force-deflection models for these
localized structures will be left for further future work.
The repeat-crash method for these narrow pole impacts calls into question
the proper width to be employed in the pressure model. It is customary to employ
the volume of direct and induced crush in application of test data, as usually
represented by the respective planar areas and the assumed unit height of the
vehicles. The most appropriate volume has not yet been proven for narrow pole
impacts. It was assumed for the purposes of this study that the induced crush may
be neglected. This is consistent with the standard practice relative to the broad
impacts reported from CDMB tests reported in the literature [Neptune, 2003].
In general, repeated crashes in the same structure will produce an array of
points in which [2CE/w]1/2 may be defined by linear functions of crush, C.. The
slope of the curve passing through the origin and the regression of these data
points will be termed k, and is comparable to the overall kv coefficients reported
for side impacts in the literature. The literature itself does not present much data
for narrow, non-central side impacts. Crush characterizations are mostly related

96
to the CDMB setup of the FMVSS 214 compliance tests. Indeed, the
documentation of post-impact rotation effects is very limited. Such tests as are
reported and acknowledge the importance of rotation supply poor documentation
of its effects.
Varat and Husher reported crush energy prediction errors as high as 357 %
based on interpretations of flat barrier data for a Ford Escort, having included an
accounting for the rotational effects [Varat, 1999]. Asay, Jewkes, and Woolley
report two repeated 90-degree side pole impacts into a 1988 Ford Taurus with
significant rotational moment, but do not make clear how they may have
accounted for the average crush bowing effects, or rotational energy [Asay, 2002].

97

98

99

100

101

102

103

104