Embed Size (px)
Citation preview

13th World Conference on Earthquake Engineering Vancouver, B.C., Canada
August 1-6, 2004 Paper No. 2256
DEVELOPMENT OF PARTICIPATORY SEISMIC RISK ASSESSMENT PROCEDURE THAT REFLECTS COMMUNITY NEEDS: A CASE
REPORT FROM MARIKINA CITY, METRO MANILA, PHILIPPINES
Kouichi HASEGAWA1, Haruo HAYASHI2, Kenneth Topping2, Norio MAKI1, Shigeo TATSUKI3, Michiko BANBA1, Kei HORIE1, Satoshi TANAKA2, Keiko TAMURA2 and Manabu WATANABE2
SUMMARY This paper discusses the importance and effectiveness of an participatory seismic risk assessment method applied as a part of the Earthquake Disaster Reduction Planning process in Marikina City, Philippines. Marikina City is at potential risk of a 7.0 magnitude near-field earthquake disaster because the West Valley Fault system cuts across the west end of the city. As the basis for this study we used hazard maps created by PHIVOLCS which offered PGA distributions with grid cells. The GESI method, which was developed by GeoHazards International and expanded by UNCRD, was selected for this study because this method can be applied to a damage state estimation for individual structure. In this method, we needed the building structure type and the quality of the building in order to determine its vulnerability. We conducted the field survey to acquire this information for the important structures that Marikina City administrators expressed a desire to protect in case of an earthquake in the first workshop. The results of the risk assessment for those structures were presented to the Marikina City stakeholders at the second workshop. Through two workshops stakeholders could proceed into initial discussions for disaster reduction goal and objectives to achieve sustainable economic development. In final section number of casualties in Marikina was estimated according to GESI method. Residential buildings were classified into two types in order to do better estimation. Land use data in Marikina city and land cover analysis of a satellite image were referred to confirm distribution and density of buildings in the northwest of the city where GIS building data was lacking.
INTRODUCTION The seismic damage risk assessment method presented in the May 2003 workshop for the Marikina City Earthquake Disaster Reduction Plan was conducted. The assessment used the GESI method prepared by the United Nations Centre of Region Development (UNCRD) in collaboration with GeoHazards International (GHI) [1]. The Earthquake Disaster Reduction Plan is part of the joint research program, Development of Earthquake and Tsunami Disaster Mitigation Technologies, and their Integration for the Asia-Pacific Region (EqTAP). The risk assessment findings were presented to the Marikina City stakeholders at the Risk Assessment and Goal Setting Workshop in May 2003. A set of questions asked by stakeholders at the May meeting, together with answers to groups of questions were provided separately at the Planning Workshop on July 29, 2003.

Marikina City is a bedroom community, located northeast of Manila in the Philippines. The city area is about 23 square kilometers, with a population of about 370,000. About 45 percent of the city is residential and about 13 percent is industrial; the remainder of the city is made up of public structures, commercial properties, open space, and streets. The Marikina River flows through the western part of the city, to the west of the river lies the West Valley Fault. The following report provides a detailed explanation of technical methods to conduct a seismic damage risk assessment, in cooperation with Marikina City stakeholders during two workshops in 2003.
WORKSHOPS FOR SEISMIC DAMAGE RISK ASSESSMENT In this project on EqTAP, two workshops were planned to understand seismic damage risk in Marikina: a Problem Identification Workshop in January 2003 and a Risk Assessment and Goal Setting Workshop in May 2003. The relationship between these two workshops and the risk assessment are reviewed in the following sections. Problem Identification Workshop This workshop was conducted on January 29, 2003. In the morning session, photographs of damaged structures caused by earthquakes were introduced to city staff members who had never experienced major earthquakes. A seismic hazard map for the West Valley Fault (magnitude 7.0) and a building damage estimation map were introduced. Two kinds of damage maps were presented as examples that all buildings have the same vulnerability. One map shows higher vulnerability buildings and the other shows lower ones. The maps helped participants to understand the importance of earthquake-resistant buildings. In the afternoon session, participants were divided into three groups and discussed what should be protected from an earthquake. Each group consisted of about 10 persons, and each group filled in key words that demonstrate what they wanted to protect against an earthquake. The cards were then grouped by classification, and presented. The location of the structure to be protected was plotted on a high-resolution satellite map to help confirm the location of each important structure. In the results of the discussion, structures are classified into five categories. The number of how many groups the item is repeated in three groups shows the importance of the item; therefore, larger number means the higher priority for protection. We selected the higher priority structures in five categories for seismic risk assessment as follows. 1) Residential Housing 2) Public Service City Hall, Hospitals, Fire Stations, Police Stations 3) School & Public Spaces Elementary Schools 4) Infrastructure Bridges 5) Commercial & Industrial Markets In category two, the “Public Safety Center” is also selected because it has the role of fire station and police station. Barangay Halls have some local staff that play a similar role as the police; thus, we selected them. In category three, we selected elementary schools because they are located in every district. In category four, although bridges and electricity have the equal priority, we selected bridges since they are necessary to transport food or life saving devices from neighboring cities. In category five, although market and industry has the equal priority, we selected market for the reason that they deal with food that is essential for life. Risk Assessment and Goal Setting Workshop In the morning session, we reported the results of the field survey and risk assessment of the structures selected in the previous workshop. Many questions were asked and requests were made after presenting the risk assessment. The following list shows a summary of the questions: 1) Earthquake, ground shaking, ground condition 7 items

2) Building vulnerability, risk assessment 7 items 3) Request for more risk assessment 3 items 4) What should we do? 11 items 5) What building is the best resistant to earthquake? 8 items 6) Damage mitigation measures, safe place 5 items Categories one to three are mainly with risk assessment and the total question number is 17. On the other hand, categories four to six represent what to do to mitigate future risks. The total question number is 24. It was found that participants have strong interests in measures to mitigate risks.
SEISMIC HAZARD & GIS LAYERS Damage risk assessments were preformed for the structures selected as a result of the Problem Identification Workshop. In this risk assessment, the damage state of each structure, not damage rate of structures, was assessed. The procedure is described below. Seismic Hazard Information Seismic hazard information with horizontal peak ground acceleration was shown on a map. The data was calculated and offered by Bartolome et al. [2], the Philippine Institute of Volcanology & Seismology (PHIVOLCS). The data consists of longitude, latitude, and PGA value. The GIS-based 200-meter grid polygon layer was created by interpolating the data set. This seismic ground motion data was calculated by the magnitude of a 7.0 earthquake due to the West Valley Fault. Figure 1 shows the hazard maps. The map C (PGA) is acquired by multiplying the map B (Bedrock Acceleration) by the map A (Amplification Factor).
(A) Bedrock Acceleration (B) Soil Amplification (C) Peak Ground Acceleration
Figure 1. Hazard Maps (Data is offered by PHIVOLCS) GIS Data The National Mapping and Resource Information Authority (NAMRIA) created vector topographical map layers by looking at aero-photo images. In these layers, a building shape polygon layer is included. Four zones of map data cover Marikina city. But one of them, northwest part of Marikina was under editing. No attribute is attached, such as building story, structure, or households. The building shape polygons were used to calculate 200-meter grid based building damage risks. Other GIS data such as road, barangay, river, and fault line were prepared as vector layers. IKONOS satellite image was also prepared for the purpose of background image.
Unit: cm/s2
600 - 620590 - 600580 - 590560 - 580550 - 560540 - 550520 - 540
Amplification Factor
1 .15 - 1.41 .04 - 1.150.98 - 1.040.91 - 0.980.82 - 0.910.67 - 0.820.59 - 0.67
Unit: cm/s2
710 - 860620 - 710580 - 620550 - 580510 - 550430 - 510320 - 430

Vulnerability Assessment of Buildings In order to evaluate damage to each structure, a damage factor must be adopted. A vulnerability curve method is preferred to fit the buildings in the Philippines. However, fragility curves are typically based on building damage statistics, which are not found in the Philippines. The U.S. seismic damage factor index for many structures was developed based on expert opinions in reference to ATC-13 [3]. In Japan, there is a study evaluating damage factor based on the description in a seismic intensity manual published by the Tokyo Metropolitan Disaster Prevention Council (Okada and Kagami [4]). As they are based on the case of developed countries, it is doubtful that the damage factor index shown fit the Philippine’s structures. The method of the Global Earthquake Safety Initiative (GESI) [1] Project has been put into practice in many developing countries for the purpose of total city risk assessment against an earthquake. The GESI Project was arranged by UNCRD. In this project the GHI method for risk assessment for a total city was introduced. The method has been applied to 21 cities all over the world. Almost all of the 21 cities are located in developing countries. The vulnerability curves and rating scheme in this method are unique yet simple enough for it to be applicable to the countries where earthquake damage rarely occurs and few risk assessments were taken. As the vulnerability curves evaluate average damage state, it is applicable to the damage state of each structure. Figure 2 shows the graph of GESI vulnerability curves. In the graph, the y axis shows the damage state, while the x axis shows PGA (unit g). The curve type is from A to I, which is determined by the structure type and rating value showing seismic performance. The damage state from 1 to 4 is explained in Table 1. Table 2 shows a chart to decide the type of vulnerability curve. Each row represents a building structure type, and each column a rating value. The rating scheme was evaluated based on the GESI manual. The rating scheme consists of three categories: a) Quality of design b) Quality of construction c) Quality of materials Quality of design and of construction is evaluated on a scale from 0 to 3, and quality of materials on a scale of 0 or 1. A smaller value shows higher performance during an earthquake in every category. The total value is calculated as rating value for the building. Though it is necessary to show some standard to translate this quality evaluation into a value, there is not much description in the manual: a) Quality of design 0: Engineered with seismic design 1: Engineered without seismic design, or non-engineered using seismic resistant rules of thumb (e.g. lintel band for masonry) 2: Non-engineered, no seismic resistant elements, good proportions (short, wide, symmetric) 3: Non-engineered, no seismic resistant elements, poor proportions (tall, narrow, or non-symmetric) b) Quality of construction 0: Excellent quality, effective supervision of seismic elements of construction 1: Good quality, some supervision of seismic elements of construction 2: Moderate quality, no supervision of seismic elements of construction but skilled workers 3: Poor quality, no supervision and unskilled workers c) Quality of materials 0: Good quality materials 1: Poor quality materials, or poor maintenance of building
VULNERABILITY ASSESSMENT

We treated the rating value as a relative evaluation score. Specific content of relative evaluation will be explained next chapter. How to Assess the Vulnerability Field surveys to gather information for rating the seismic resistance performance of each structure selected in section 2 were conducted after January Workshop. The surveyed structure and its number are shown in the following list: 1) City hall 1 2) Hospital 5 3) Police, Fire station 4 4) Barangay hall 14 5) Elementary school 22 6) Market 8 7) Bridge 5 Survey of the structures consisted of the following items. a) Taking pictures of both the outside and inside of the structures b) Sketching a plan of the buildings c) Taking pictures of characteristic parts of the buildings d) Interviewing about the construction age Using these surveys, the structure and seismic performance of the structures were evaluated. Structure was determined by taking pictures of the outside and inside of the structure. Quality of design and building height were also evaluated by taking pictures of the inside and outside. A one or two-story building is standard, and the higher the building, the higher the added value. The plan shape was evaluated based on a sketch plan of the building. A plan that appears too wide, narrow, or asymmetrical in shape equals added value. The quality of construction was evaluated by taking pictures of characteristic parts of the building. For example, buildings with narrow columns, long span of beams, large openings in wall or “piloti” on the ground floor, or narrow or non-braced beams were considered added value. The quality of materials was estimated using interviews about the construction of the structure. Buildings whose materials look older with cracks in the concrete or rust on its steel parts should be regarded as added value.
0
0.1
0.2
0.3
0.4
0.5
0.6
0.7
0.8
0.9
1
0 0.2 0.4 0.6 0.8 1 1.2 1.4
PGA
Dam
age
Stat
e
A
C
B
DEFGHI
4
3
2
1
Figure 2. Vulnerability Curves in the GESI Method
D am age S tate D excription
4 C om plete CollapseB uilding is entirely destroyed, w ith significant portions of
the building collapsed.
3 Partial C ollapse
B uilding is entirely structurally com prom ised and on the
verge of collapse or sm all portions of the building have
collapsed.
2 ExtensiveExtensive structural and non-structural dam age.
Localized life-threatening situations are com m on.
1 N one, S light or M oderateR anging from no dam age to non-structural dam age and
m inor structural dam age.
TABLE 1. DESCRIPTION OF DAMAGE STATE IN THE GESI METHOD

Building T ypes 0 1 2 3 4 5 6 7
Wood A A B B C C C D
Steel A B C C D D E F
R/C B C D E E F G H
R/C, steel with masonryinfill walls C D D E E F G H
Reinforced masonr y C D D E E F F F
Unreinforced masonry E E F F G G G H
Adobe N/A N/A G H H H H I
Stone rubble N/A N/A G H H H H I
Lightweight shack N/A N/A N/A H H H H I
DAMAGE RISK ASSESSMENT Result of Assessment for Important Structures Based on the vulnerability curves and hazard PGA value obtained, the risk of damage to each structure was calculated. Figure 3 shows the distribution map of the damage risk assessment result to important structures. Typical photographs and the assessment results to important structures are shown in Appendix. Some important characteristics of the structures and procedure of risk assessment are described as follows. a) City Hall: The City Hall building consists of good qualities such as a low rise, good proportion, and good materials. This building seems to be a standard for rating the quality of the other structures. Unfortunately many glass partitions are located inside the building, which may injure people near the partition during a major earthquake. The structure type is an RC frame with a masonry infill. The total rating value is 0, as a result of the quality of design at 0, the quality of construction at 0, and the quality of material at 0. Using the Table 2 matrix, the vulnerability curve is decided as Type C. From the location of City Hall and the hazard map, we had an estimated ground motion of 0.7g in PGA. In the end, the damage state was evaluated as “Extensive” on the vulnerability curve. b) Hospital: The hospital is the next most important structure to City Hall. Five hospitals were surveyed. The structure type of all the buildings is an RC frame with a masonry infill. The buildings designated Nos. 01 and 02 are over four stories high and some weak structures are also shown such as a parking space on the first floor in No.02. The total rating value was 2. The other buildings were rated as 0 or 1. In the end, all damage states were labeled “Extensive.” c) Public Safety Center & Fire Station: Two public safety centers and two fire stations were surveyed. The building designated as No. 3 in Appendix is made of wood and the office is jointed to a carport roof which is supported by narrow wooden columns. The material looked old and weak. The total rating value was 5. Braces should be added to the columns. The building designated as No. 2 is made of steel with a large carport space. Some braced beams support the columns and the material appeared to be good. The total rating value was 2. The remaining structures were evaluated as 1. In the end, all damage states were “Extensive.” d) Barangay Hall: All Barangay Halls were surveyed. We found that half of them were two-story and the others were one-story buildings. The structure type is almost an RC frame with a masonry infill. In some buildings, a portion of the second floor is made of wood. The two-story buildings are well constructed but some of the second floor load looks heavy. On the other hand, the one-story buildings look old but the light roof would seemingly release the building from severe damage. The average rating value was 1. The damage state was “Partial Collapse” or “Extensive.” e) Elementary School: All Elementary Schools were surveyed. There are two types of buildings, a new type and old type. The structure of both is an RC frame with a masonry infill. The new-type buildings are two or three-story, whereas the old ones are one or two-story. The construction of the new-type buildings appears to be the same quality as the City Hall building; therefore its average rating value is 0. The old-type buildings use old materials and the construction quality looks relatively poor, making the average rating value 2. All the damage states of the new-type buildings were “Extensive,” however the old ones as
TABLE 2. MATRIX FOR VULNERABILITY CURVE DECISION IN THE GESI METHOD

“Partial Collapse” or “Extensive.” As almost all schools have both types of buildings, Figure 3 shows the damage risk map of old type. f) Market: Eight markets were selected at the Problem Identification Workshop. All eight were surveyed. We found a variety of structure types such as steel, RC frame with masonry infill, wood, and un-reinforced masonry (URM). The structures designated as Nos. 3, 4, and 8 are made of steel. No. 4 is a good structure with many braces between the columns and beams; therefore, the rating value is 1. No. 3 and 8 were evaluated as 3, due to small braces. Their damage risks were “Extensive.” The structures designated as Nos. 2, 3, and 7 are RC frames with a masonry infill. No. 3 is good quality and the rating value is 1. Nos. 2 and 7 look old and have “piloti” on the first floor, which could collapse during major shaking; therefore the rating value is 4. The damage state of No. 7 is “Partial Collapse.” The structure designated as No. 6 is made of wood with braced beams, but the material is old and the construction quality does not look good; therefore, the rating value is 4. Structure No. 5 is poorly constructed in our survey. The standard structure type looked like URM with a poor quality of design, construction, and material; thus, the rating value was 7 and the damage state was “Complete collapse.” g) Bridges: As GESI does not support bridge, five bridges were applied by the ATC-13 [3] standard U.S. method. Bridges are separated by scale and spans, and the damage factor is evaluated. The Damage risk was evaluated as “Moderate” or “Light.”
Figure 3. Damage Assessment Map to Important Structures
Damaged Buildings Estimation in Grid Map In order to understand the difference between the risk of poor quality buildings and standard quality buildings, let us assume the two types of building are at the same site. The poor quality building is more vulnerable to quakes than the standard quality one. If the poor quality building was reinforced and improved, the building’s damage risk would be reduced and lives and reconstruction cost would be saved. Figure 4 (a) depicts a case study to show the damage risk of all buildings in 200-meter grid cells, which are supposed to have the same vulnerability of type D in the GESI method. Type D curve means an example of standard quality. Conversely, Figure 4 (b) shows the example of a damage risk of all buildings with vulnerability of type F curve which is an example of poor quality. Total number of complete collapsed building with poor quality is over 11000, whereas that with standard quality is only less than 500. Comparing (a) with (b) it is obvious that the revision of building quality is effective in reducing the total damage to the structure.
The amount of damaged buildings is calculated by setting the deviation at above and below the average damage state curve shown in Figure 2. According to the GESI manual and through interviews with GHI and UNCRD, we calculated damaged building number to each grid cell using the standard deviation 10.
(A) The Case of Poor Quality (B) The Case of Standard Quality Figure 4. Building Damage Assessment Grid Map (Complete Collapse)
COMPARISON BETWEEN JAPANESE VULNERABILITY CURVES AND GESI ONES
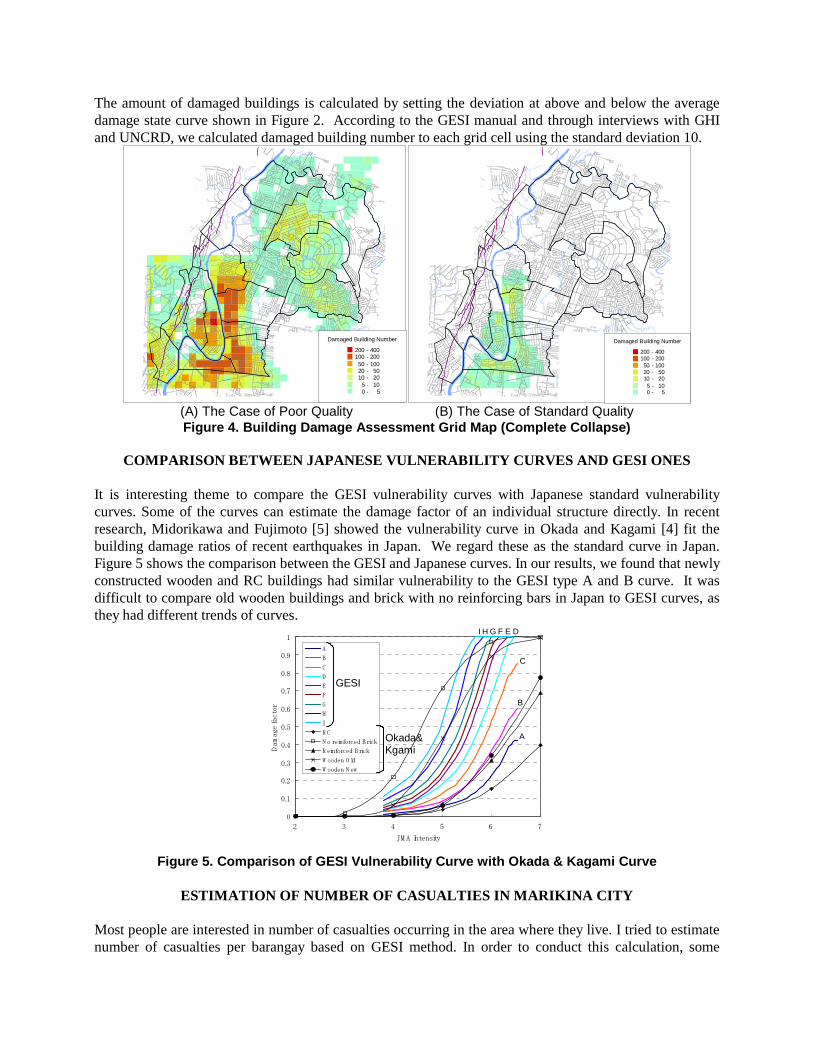
It is interesting theme to compare the GESI vulnerability curves with Japanese standard vulnerability curves. Some of the curves can estimate the damage factor of an individual structure directly. In recent research, Midorikawa and Fujimoto [5] showed the vulnerability curve in Okada and Kagami [4] fit the building damage ratios of recent earthquakes in Japan. We regard these as the standard curve in Japan. Figure 5 shows the comparison between the GESI and Japanese curves. In our results, we found that newly constructed wooden and RC buildings had similar vulnerability to the GESI type A and B curve. It was difficult to compare old wooden buildings and brick with no reinforcing bars in Japan to GESI curves, as they had different trends of curves.
0
0.1
0.2
0.3
0.4
0.5
0.6
0.7
0.8
0.9
1
2 3 4 5 6 7
JM A Intensity
Damage factor
A
B
C
D
E
F
G
H
I
R C
N o reinforced Brick
R einforced Brick
W ooden O ld
W ooden N ew
A
B
C
I H G F E D
Figure 5. Comparison of GESI Vulnerability Curve with Okada & Kagami Curve
ESTIMATION OF NUMBER OF CASUALTIES IN MARIKINA CITY
Most people are interested in number of casualties occurring in the area where they live. I tried to estimate number of casualties per barangay based on GESI method. In order to conduct this calculation, some
Damaged Building Number
200 - 400100 - 20050 - 10020 - 5010 - 20
5 - 100 - 5
Damaged Building Number
200 - 400100 - 20050 - 10020 - 5010 - 20
5 - 100 - 5
GESI
Okada&Kgami

assumptions were decided with building type. In GESI method number of casualties for each damage state is calculated by the following equation.
ΣLi = ΣDri * ΣLri * P (1) Here i: damage state; extensive, partial collapse and complete collapse, Li: number of casualties for each damage state, Dri: damage state ratio for each damage state, Lri: lethality rate for each damage state, P: total population per barangay Number of casualties calculated for each damage state is totaled into one. In this study buildings in Marikina were classified into two groups, standard quality building and relatively poor quality one. How to classify the buildings and calculate number of casualties is described in the following sub sections. Classification of Building Type based on Building Area Characteristics of Buildings in Major Residential Land Uses According to JICA report [6] with earthquake impact reduction study for Metropolitan Manila, 97 percent of all buildings in Marikina city are used for residence. In order to estimate number of casualties better, it is necessary to classify vulnerability of residential buildings. 2 classifications were prepared such as “standard housing in the city” and “relatively poor quality building than standard one”. Overlaying land use layer and building shape layer, it was found that there exist different type buildings with different density in different land use. There were 4 types of residential classifications in the “existing land use” GIS data offered by Marikina city, such as (a) residential, (b) used zone, (c) socialize housing and (d) area for priority development. It was confirmed that in the zone (a) and (b) most buildings were standard housings whereas zone (c) and (d) contained mainly small buildings with relatively poor quality. So I call (a) and (b) zone as “standard residential zone” and (c) and (d) zone as “high density residential zone”. Figure 6 shows histograms of building area in each residential zone. Building area was computed based on building polygon layer. Median of each histogram was as follows, 104 m2 (standard residential zone), 46 m2 (high density residential zone). There was a difference between two types of residential zones in median and trend of histogram of building area. And it was inferred that vulnerability of each building type might show near trend in the histograms of building area. In other words, building area could be a good index to classify quality of building in Marikina. In this study, building area “50m2” was assumed as one threshold to classify building type. This threshold was used only in the high density residential zone. All buildings in standard residential zone was assumed to have the same quality to seismic hazard. Two types of buildings were defined as follows. Type I (standard quality housing); buildings except for type II Type II (relatively poor quality housing); buildings whose building area is under 50 m2 locating in the high density residential zone

0
200
400
600
800
1000
1200
1400
1600
1800
2000
5 15 25 35 45 55 65 75 85 95 105
115
125
135
145
155
165
175
185
195
205
215
225
235
245
255
265
275
285
295
305
315
325
335
345
355
365
375
385
395
405
415
425
435
445
455
465
475
485
495
500-
Building Area (m2)
Num
ber
of B
uild
ings
Standard Housing Zone
High Density Housing Zone
Figure 6. Histograms of Building Area in Two Types of Residential Zones
Average Density of Buildings in Major Residential Land Use According to overlay analysis of building shape layer and land use layer, building density in residential zones were calculated. Standard residential zone contained 19.3 buildings per hectare and high density residential zone contained 64.2 buildings per hectare as total average. The ratio of building type II in high density residential zone was 55% as total average. These values were used to estimate number of buildings in the area where building shape polygons were lacking. Number of Buildings Estimation in the Zones Where Building Shape Polygons are Lacking Building shape polygon layer didn’t cover whole Marikina city area because the topographic map data was under editing in northwest of Marikina. Moreover there exists some polygon lacking zones in several part of the city, where buildings distribute with too high density to clarify each building shape. In such zones buildings are expressed in one large polygon. One solution to make up these lacking of building data is to apply average building density based on land use or land cover distribution. Building number in high density residential zones in the northwest of Marikina shown as red polygons was estimated by two ways. One is the way using average building density in major residential land use and the other one is based on the estimated land cover grid data [7]. Grid based land cover analysis and building density In northwest of Marikina, Hayashi et al. [7] applied cluster analysis to 50 meter-square grid data set based on histograms with 4-band color information of 1-meter resolution satellite image, IKONOS. It is possible to quote the result of this analysis in order to confirm the distribution of buildings and their density. Figure 7 shows the grid layer which is a data set for cluster analysis. Red polygons in this figure shows high density residential zones which were digitized by hand on the IKONOS. The grid layer contains 32 classes of digital number totaled from each pixel in the IKONOS. After the analysis 11 categories were classified as major land covers. Legend name was interpreted by comparing the category-grid map, a result of cluster analysis and the IKONOS. Figure 8 shows the category-grid map. Most grids in red polygons correspond to residential classifications. The building density numbers shown at the legend in Figure 8 were measured by building shape polygons within each grid cell. According to this result, building density for high density residential is about 40 to 70 per hectare, whereas that of standard residential is about 17 to 22 per hectare. These densities correspond to the average densities measured by major two residential land uses which are described in the preceding section. This fact shows the validity to classify buildings by land use map.
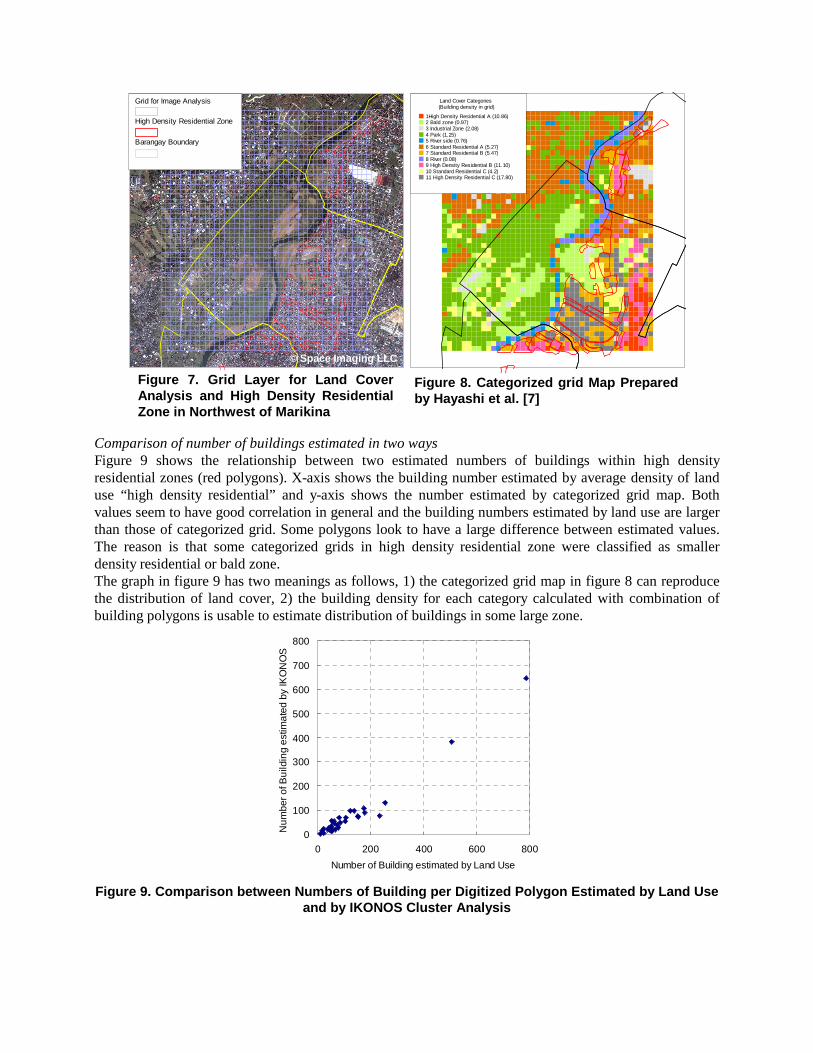
Comparison of number of buildings estimated in two ways Figure 9 shows the relationship between two estimated numbers of buildings within high density residential zones (red polygons). X-axis shows the building number estimated by average density of land use “high density residential” and y-axis shows the number estimated by categorized grid map. Both values seem to have good correlation in general and the building numbers estimated by land use are larger than those of categorized grid. Some polygons look to have a large difference between estimated values. The reason is that some categorized grids in high density residential zone were classified as smaller density residential or bald zone. The graph in figure 9 has two meanings as follows, 1) the categorized grid map in figure 8 can reproduce the distribution of land cover, 2) the building density for each category calculated with combination of building polygons is usable to estimate distribution of buildings in some large zone.
0
100
200
300
400
500
600
700
800
0 200 400 600 800
Number of Building estimated by Land Use
Num
ber o
f Bui
ldin
g es
timat
ed b
y IK
ON
OS
Figure 9. Comparison between Numbers of Building per Digitized Polygon Estimated by Land Use
and by IKONOS Cluster Analysis
© Space Imaging LLC
Figure 7. Grid Layer for Land Cover Analysis and High Density Residential Zone in Northwest of Marikina
Figure 8. Categorized grid Map Prepared by Hayashi et al. [7]
Barangay Boundary
High Density Residential Zone
Grid for Image Analysis Land Cover Categories(Building density in grid)
1High Density Residential A (10.86)2 Bald zone (0.97)3 Industrial Zone (2.08)4 Park (1.25)5 River side (0.76)6 Standard Residential A (5.27)7 Standard Residential B (5.47)8 River (0.08)9 High Density Residential B (11.10)10 Standard Residential C (4.2)11 High Density Residential C (17.80)

Vulnerability Curve and Lethality Rate in GESI Decision of Vulnerability curve type for major residential buildings GESI vulnerability curve have to be selected to two types of residential buildings in Marikina. TABLE 3 shows the list of vulnerability curve type to important structures based on field survey in the city. Referring this result vulnerability of residential building type I and II was evaluated as follows.
Type I is evaluated as type “D” as it seems to be similar to barangay hall. Type II is evaluated as “F” as it seems to have middle grade vulnerability between worst grade in public
market and barangay hall. The parameter Dri in the equation (1) is decided by considering the PGA value from hazard grid map and vulnerability curves shown in figure 2. Circle graph at Figure 10 shows the damage state ratio per barangay, which was total of grid based number of damaged buildings. The size of circle graph shows total number of damaged buildings.
TABLE 3. VULNERABILITY CURVE TYPE FOR SURVEYED IMPORTANT STRUCTURES VulnerabilityCurve Type
HospitalPublicSafety
BarangayHall
ElementarySchool
PublicMarket
City Hall
AB 1
C 3 2 22* 3 1
D 6 2 14* 22*
E 2
FGH 1
I* Average of all surveyed buildings
Lethality Rates Lethality rates in GESI method which is the parameter Lri in the equation (1) are decided according to major building type in Marikina. Since most buildings in the city were made of brick or concrete, building type I was evaluated to “Light and ductile buildings” and type II was evaluated to “Heavy and non-ductile buildings” as building type for lethality rate. According to GESI manual, lethality rate Lri to each damage state was defined as follows; light and ductile buildings: 0.05% in Extensive, 0.5% in Partial Collapse and 5% in Complete Collapse, heavy and non-ductile buildings: 0.2% in Extensive, 2% in Partial Collapse and 20% in Complete Collapse. Estimation of Number of casualties Building number in each grid cell for each building type was counted all over the city using building polygon layer. According to the report [6] and web site of Marikina city (http://www.marikina.gov.ph/), population per housing building was calculated at 8.2 persons as total average in the city. Number of people in each barangay for each building type, parameter P in the equation (1), was calculated using this average population per housing building and number of buildings in each barangay totaled by grid based number for each building type. In the zones where building polygons were lacking, average density 64 (buildings per hectare) in the area of high density residential was applied to estimate building number. Number of buildings in type II was estimated according to building number and its ratio 55% based on the histogram at figure 6. Applying the all values to parameters in the equation (1), number of casualties to each building type was totaled into one value as number of casualties per barangay. Figure 10 shows number of casualties and

damaged building ratio per barangay. Number of casualties in the whole city was computed at about 1900 people.
Figure 10. Damaged Buildings Ratio and Number of casualties by Barangay
CONCLUSION
A two-phase approach to risk assessment was taken to encourage Marikina stakeholder involvement. During phase 1, in the January Workshop, Marikina City stakeholders reviewed the results of grid-based seismic hazard analysis showing the impact of an earthquake on standard buildings in Marikina City. The assets city stakeholders had a special interest in protecting from a 7.0 magnitude earthquake were identified. During phase 2, in the May Workshop, a vulnerability assessment of the structures identified as important were presented using the vulnerability curves of the GESI method and showing various damage states of individual structures. Stakeholders asked many questions about the structure’s risk assessment and earthquake threat, and proceeded into initial discussions regarding setting up an earthquake disaster reduction goal and related objectives. Comparison of the GESI method’s fragility curves with those used in the Japanese method was carried out. It was discovered that Japanese new wooden buildings or RC buildings have similar vulnerability trend to GESI type A or B curves. It was found that the GESI method has an advantage that it is applicable to analyzing individual structures, and a disadvantage that the method does not include lifeline infrastructures. Number of casualties in Marikina city was estimated based on GESI methodology. In the process, number of damaged buildings was estimated by classifying buildings into two types, standard residential and high density residential. Total number of casualties in the city was estimated at about 1900 people.

REFERENCES 1. GeoHazards International and UNCRD Disaster Management Planning Hyogo Office, Global
Earthquake Safety (GESI) Initiative Pilot Project. Final Report, 2001. 2. Bartolome C. Bautista, Ma. Leonila P. Bautista, Raymundo S. Punongbayan, Ishmael C. Narag and
Winchelle Ian G. Sevilla, “A Deterministic Ground Motion Hazard Assessment of Metro Manila, Philippines.” EDM Technical Report. Third Multi-lateral Workshop on Development of Earthquake and Tsunami Disaster Mitigation Technologies and their Integration for the Asia-Pacific region, 2001, No.11, pp. 323-342.
3. Applied Technology Council. ATC-13: Earthquake Damage Evaluation Data for California. ATC, 1985.
4. Okada Shigeyuki and Kagami Hiroshi. “Inventory Vulnerability Functions for Earthquake Damage Evaluation in Terms of Intensity Scale of the Japan Meteorological Agency.” Journal of the Seismological Society of Japan. 1991, Vol. 44, No. 2, pp. 93-108.
5. Midorikawa Saburoh and Fujimoto Kazuo. “Relationship between the JMA Instrumental Seismic Intensity and Damage Ratios of Wooden Houses Based on Damage Survey Data of Local Government.” Journal of the JAEE. 2002, Vol. 2, No. 2, pp. 15-22.
6. JICA, MMDA and PHIVOLCS. Earthquake Impact Reduction Study for Metropolitan Manila, Republic of the Philippines. Interim Report, 2003, Chapter 6.
7. Haruo HAYASHI, Manabu WATANABE, Masasuke TAKASHIMA and Kouich HASEGAWA. “DEVELOPMENT OF PROCEDURE TO CREATE BUILDING INVENTORY FOR SEISMIC RISK ASSESSMENT IN DEVELOPING COUNTRIES USING IKONOS SATELLITE IMAGE.” Proceedings of the 13th WCEE, Vancouver, Canada, 2004, Paper No. 1071.
ACKNOWLEDGEMENTS This project is the part of the Development of Earthquake and Tsunami Disaster Mitigation Technologies and Their Integration For the Asia-Pacific Region (EqTAP), Special Coordination Funds for Promoting Science and Technology sponsored by the Government of Japan. The authors deeply appreciate efforts made by Marikina City staff that supported us to carry out field survey to structures and to offer GIS data.

APPENDIX: SURVEYED IMPORTANT STRUCTURES This page shows most of important structures we surveyed except bridges. Photograph and attribute of structure and its location such as structure type, rating value, vulnerability curve type, PGA value and damage state. Barangay halls and elementary schools were evaluated using average structure attribute. Number of each structure corresponds to Figure 3.