Embed Size (px)
Citation preview

DEVELOPMENT OF A NOVEL EXTRACTION
TECHNIQUE BASED ON COMBINATION OF
MOLECULAR IMPRINTED POLYMERS AND LIQUID
MEMBRANE FOR BIOMEDICAL AND
ENVIRONMENTAL APPLICATIONS
By
Ntakadzeni Olga Nemulenzi (0618728T)
A research report submitted to the Faculty of Science, University of the Witwatersrand, Johannesburg, in partial fulfilment of the requirements for the
degree of Master of Science
Supervisor: Dr Luke Chimuka (WITS, School of Chemistry) Co-supervisor: Prof Ewa Cukrowska (WITS, School of Chemistry)
WITS University, Johannesburg, 2007

DECLARATION
I declare that this research report is my own, unaided work. It is being submitted for the
Degree of Master of Science in the University of the Witwatersrand, Johannesburg. It has
not been submitted before for any degree or examination in any other University.
------------------------------------------------------ (Signature of Candidate)
----------------------------------Day of------------------------------2007
i

ABSTRACT
In this study a novel technique for extraction of biological and environmental samples
was investigated. The developed technique is based on the combination of liquid
membrane and molecular imprinted polymers technologies referred to as liquid
membrane-molecular imprinting polymers extraction technique. As a model compound,
17β-estradiol was chosen, a hormone known to produce adverse effect in wild life and
humans. A precipitation and bulk polymerization methods which produces easily, cleanly
and in good yield polymers was used for the synthesis of the molecularly imprinted
polymers. The model compound was extracted from aqueous sample through the
hydrophobic porous membrane which was impregnated with toluene which also formed
part of the acceptor solution. In the acceptor phase, the compound was re-extracted onto
MIP beads which were also part of the organic phase. The selectivity of the new
technique was demonstrated by extracting river water, waste water and fruit sample. In
all different samples extracted clean chromatograms were obtained. The new technique
therefore combines extraction and clean-up in one step. The enrichment factors were low
and around one but can still be improved.
ii

With ever lasting loving memories of my mother
Makwarela Shonisani Nemulenzi (1935-1990)
“Always in our thoughts”
iii
ACKNOWLEDGEMENTS
First, I would like to show my gratitude to Dr Luke Chimuka for his supervision and
support that he gave me as from the University of Venda and here at the University of the
Witwatersrand and made it possible for me to reach this far and that without him none of
this could have happened. My special thanks also go to Prof Ewa Cukrowska for her
significance academic and financial support that she gave me through my studies and
other supports like giving me the other opportunities to use all resources from her
laboratories and the computers which I used to do literature reviews through internet
connection etc.
Thanks to my fellow students Beata Beresca and Erasmus Chauke, I also really
appreciate environmental analytical chemistry group at the school of chemistry: Dr H.
Tutu, Dr H. Nsengemana, Dr L. Ochieng, J.G Lusilao, N.F Kana, E. Bakatula, B. Mhaka,
P.P. Mbhele, Z. Manjanja, M. Nqcola, S. Pole, D. Roberts, and C. Booiysen for making
the atmosphere more interesting and workable. My special appreciation also goes to
NRF-SIDA for funding the project.
I would also like to dedicate this work to my son Zwavhudi, my daughter Rolivhuwa,
my husband Eric and the rest of my family members for being patient and taking care of
my children while I was furthering my studies. I love you all.
iv

TABLE OF CONTENTS
CONTENTS PAGE
Declaration…………………………………………………………………………..i
Abstract…………………………………………………………………………….. ii
Acknowledgement………………………………………………………………….iv
Table of content……………………………………………………………………. v
List of Figures………………………………………………………………………x
List of Tables……………………………………………………………………….xi
List f Abbreviation………………………………………………………………….xii
CHAPTER 1: INTRODUCTION…………………………………………………..1
1.1. Molecular Imprinting Technology……………………………………………..1
1.2 Different polymerization methods……………………………………………...2
1.3 Application of molecular imprinting polymers……………………………….... 2
1.4 Principle of molecular imprinting technology…………………………………. 3
1.5 Fate of 17-β estradiol in the environment……………………………………… 4
1.6 Liquid membrane extraction as a sample preparation tool……………………. 5
1.8 Research objectives…………………………………………………………….. 6
1.8.1 General objectives……………………………………………………. 6
1.8.2 Specific objectives…………………………………………………….6
1.9 Statement of the research………………………………………………………. 7
1.10 Research assumption…………………………………………………..7
1.11 Hypothesis of the research……………………………………………. 7
v

1.12 Justification of the research…………………………………………....7
CHAPTER 2: LITERATURE REVIEW....................................................................9
2.1 Sample preparation techniques.............................................................................9
2.1.1 Introduction……………………………………………………………….......9
2.1.2 Different sample preparation method..............................................................11.
2.1.2.1 Liquid-Liquid extraction technique (LLE).........................................11
2.1.2.2 Solid Phase Micro-extraction (SPME)...............................................12
2.1.2.3 Solid Phase Extraction………………………………………….......16
2.1.2.4 Molecularly Imprinting Polymers.....................................................21
2.1.2.4.1 Emulsion polymerization...................................................23
2.1.2.4.2 Dispersion polymerization.................................................24
2.1.2.4.3 Suspension polymerization................................................24
2.1.2.5 Application of Molecularly Imprinting Polymers in solid phase
Extraction..............................................................................27
2.2 Membrane extractions…………………………………………………………..28
2.2.1 Introduction…………………………………………………………………..28
2.2.1.1 Dialysis……………………………………………………………..30
2.2.1.2 Polymeric membrane extraction (PME)............................................31
2.2.1.3 Membrane extraction with sorbent interface (MESI)........................31
2.3 Liquid membranes...............................................................................................32
2.3.1 Supported Liquid Membrane (SLM)................................................................32
2.3.1.1 Microporous membrane liquid-liquid extraction (MMLLE)……….35
2.4 Determination techniques.....................................................................................37
vi
2.4.1 Liquid chromatography...........................................................................37
2.4.1.1 Ultra violet detector .................................................................39
2.4.1.3 High Performance Liquid Chromatography coupled with a Mass
Spectrometry detector via an ElectroSpray Interface................40
2.4.2 Gas chromatography…………………………………………………...41
2.4.2.1 Gas chromatography-mass spectrometry.................................42
2.4.2.2 The flame ionisation detector...................................................43
2.4.2.3 Electron capture detector……………………………………..44
CHAPTER 3: EXPERIMENTAL................................................................................45
3.1 Chemicals...............................................................................................................45
3.2 Equipments............................................................................................................45
3.2.1 HPLC and Centrifuge..............................................................................45
3.2.2 Oil bath, ultrasonicator and electron microscope...................................46
3.2.3 Membranes and membrane unit.............................................................46
3.3 Preparations of stock solutions.............................................................................46
3.4 Preparation of mobile phase..................................................................................47
3.5 Preparing 0.2M phosphate buffer .........................................................................47
3.6 Preparation of MIP................................................................................................47
3.6.1 Preparation of MIP by precipitation method......................................................48
3.6.2 Preparation of MIP by bulk polymers................................................................49
3.7 The binding constant of the MIP prepared by bulk method..................................50
4.0 Extraction-procedures with LM-MIP technique ...................................................50
4.1 Optimization of LM-MIP technique.......................................................................51
vii
Varying the amounts of MIP.......................................................................................51
Influence of sonication on E2 rebinding.....................................................................52
Varying the extraction time.........................................................................................52
Testing of impurities ..................................................................................................52
Quality assurance........................................................................................................53
4.2 Demonstration of LM-MIP selectivity in various samples..................................53
4.2.1 River water, urine and fruit samples.....................................................53
CHAPTER 4: RESULTS AND DISCUSSION…………………………………….55
4.1 Synthesis of MIPs………………………………………………………………55
4.1.2 Bulk polymerisation…………………………………………………..57
4.1.3 Binding studies………………………………………………………..59
4.1.4 Checking for impurities in the prepared MIPs.....................................60
4.1.6 Quality assurance……………………………………………………..61
4.1.6.1 Reproducibility……………………………………………..61
4.1.6.2 Calibration curve…………………………………………....62
4.2 Optimisation experiment………………………………………………………..63
4.2.1 Variation of the amounts of MIPs……………………………………63
4.2.2 Influence of sonication on binding…………………………………...64
4.2.3 Varying extraction time………………………………………………65
4.3 Demonstration of selectivity…………………………………………………...66
4.3.1 Deionised water……………………………………………………....66
4.3.2 River water…………………………………………………………. .67
4.3.3 Urine…………………………………………………………………68
viii

4.3.4 Fruit sample………………………………………………………….69
4.4 Comparison of LLE and LM-MIP extraction technique for the extraction of apple
Sample………………………………………………………………………….71
4.5 Preconcentration factors.....................................................................................72
ix

LIST OF FIGURES
FIGURE DESCRIPTION PAGE
Figure 1 The principles of MIP technology…………………….....................3
Figure 2 Configurations of solid phase microe-xtraction................................14
Figure 3 The setup involved in the preparation of MIPs…………….............23
Figure 4 The different types of SLM modules................................................33
Figure 6 The schematic representation setup of MMLLE..............................36
Figure7 High-performance liquid chromatography.......................................39
Figure 8 A schematic diagram of gas chromatograph....................................42
Figure 9 Flame Ionisation Detector................................................................44
Figure 10 The set up for the preparation of MIPs............................................47
Figure 11 Set-up of LM and MIP extraction technique...................................50
Figure 12 Represents the morphology of the MIPs prepared using bulk method
and precipitation method.................................................................58
Figure 13 Represents the binding constant of bulk MIPs, results are binding studies
of three replicate for MIP and NIP..................................................59
Figure 14 Chromatogram obtained after third MIP wash with 5 mL of 10 %
deionised water in methanol ...........................................................60
Figure 15 Typical calibration curve obtained from the HPLC system.............63
Figure 16 Plot of extraction time vs obtained peak areas with different amounts
of MIP..............................................................................................64
x

Figure 17 Comparison of rebinding of E2 under static versus sonication conditions.
A; 30 minutes and B; 60 minutes binding times...................................65
Figure 18 Plot of E2 peak areas at different times in LM-MIP extraction
Technique..............................................................................................66
Figure 19 Chromatograms obtained from direct injection of deionised water
spiked with 7 mg of E2 (A) and after LM-MIP extraction (B)...........67
Figure 20 Comparison of the selectivity of LM-MIPs technique in river water...68
Figure 21 Comparison of selectivity after extraction urine spiked with 7 mg/L E2
with and without MIP beads incorporated in the organic acceptor .....69
Figure 2 Comparison of selectivity in the apple sample without MIP (a), with
MIP (b).................................................................................................71
Figure 23 Analysis of apple sample using LLE and Analysis of apple using
LM-MIP extraction technique..............................................................72
xi

LIST OF TABLES
TABLE DESCRIPTION PAGE
Table 1 Representing the classification of membrane techniques.....................29
Table 2 Ingredients values used for precipitation polymerisation preparation..49 Table 3 The percent yields of the MIP synthesis……………………………...51
Table 4 Repeated 10 times injections of 1ppm standard solution of E2 in the
chromatographic system........................................................................62
Table 5 Summary of the enrichment factors in various samples………………73
Table 6 Values of Plot of extraction time vs obtained peak areas with
different amounts of MIP.......................................................................87
Table 7 Values for varying extraction time........................................................88
Table 8 The mean values of varying extraction time………………………….89
Table 9 Values of Static versus sonication in 30 minutes................................89
Table 10 Values of Static versus sonication in 60 minutes.................................89
xii

xiii
LIST OF ABBREVIATIONS
LM Liquid membrane MIP Molecular Imprinted Polymers DH2O Deionised water LC-MS Liquid chromatography-mass spectrometry HPLC High performance liquid chromatography GC-MS Gas chromatography-mass spectrometry TMS Trimethylsilyl PFD Pentafluorobenzyl NCI Negative ion chemical ionization E2 17β-estradiol
CHAPTER 1: INTRODUCTION
1.1. Molecular Imprinting Technology
The technique of molecular imprinting, introduced in 1972 by Wulff and Sarha, and
expanded by the work of the group of Mosbach in 1980s, has shown to be capable of
producing materials with “antibody-like” materials in selectivity (Xu et al, 2004).
Molecular imprinting is a way of producing materials which possess high selectivity and
affinity for the target molecule. Molecular interaction or bonds involved in producing the
imprint may be relatively weak hydrogen bonds, ionic attractions, or hydrophobic
interactions; or they may involve relatively strong, cleavable bonds such as esters of
carboxylic or boronic acids, or ketals or amines. Molecularly imprinted polymers with
non-covalent interaction have increasingly been developed as mimic of natural molecular
receptors. Basically, molecular imprinted polymers (MIPs) are extensively cross-linked
polymers containing specific recognition sites with a predetermined selectivity for
compound of interest (Ye and Mosbach, 2001).
The outstanding advantages of MIPs include their physical robustness, high strength,
resistance to elevated temperature and pressures, and inert to acids, bases, metal ions and
organic solvents as well as the low cost and ease for preparation (Ramström, 1996). To
prepare MIPs, the following important ingredients are required: template, cross- linker
monomer, the initiator and choice of the solvent (Ramström, 1996).
1

1.2 Different polymerization methods
Different uses and potential application of the MIPs demand different properties from the
polymers. In response to this demand, different methods to produce imprinted polymers
have been developed. So, far MIPs have been prepared by bulk, suspension, two-step
swelling, precipitation and emulsion core-shell polymerization. Each of these procedures
involves the control of different parameters during the synthesis and produces polymers
with different properties. Other methods also employed are film synthesis, aerosol
polymerization, and polymerization on silica particles (Pérez-Moral and Mayes, 2003).
1.3 Application of molecular imprinting polymers
Molecular imprinted polymers has been used before in chromatographic separation, in
biomimetic sensors, in solid phase extraction for sample enrichment/clean-up, in
screening of combinatorial chemical libraries, for in situ product removal during
biotransformation process, and down stream product purification. They are furthermore
of great potential for drug determination when using; for instance ligand competitive
assay (Ye et al, 1998). In fact molecular imprinting polymers can be used to extract trace
organics such as drugs, metabolites, endogenous compounds, food additive, pesticides,
and other analytes of environmental concern (Ye et al, 1998). The major limitation of
MIP sorbents is the loss of selectivity when aqueous sample is directly percolated. This is
due to water molecules competing for hydrogen bonding onto MIP sorbents with target
compounds and that makes MIP to work best in organic solvents.
2

1.4 Principle of molecular imprinting technology
Non-covalent approach
Covalent approach
Non-covalent approach
Covalent approach
Figure 1. Showing the principles of MIP technology.
Figure 1 show that molecular imprinting polymers can be obtained with covalent or non-
covalent approach. Template, functional monomer and the cross linker are mixed forming
self-assembly. Polymerization is formed with the cross linker around a template, forming
a three dimensional structure. Removal of the template by solvent extraction or chemical
cleavage results into binding sites specific to the original template (Ye and Mosbach
2001). In covalent approach, polymerisation produces chemical cleavage with templates
which is later re-extracted.
3
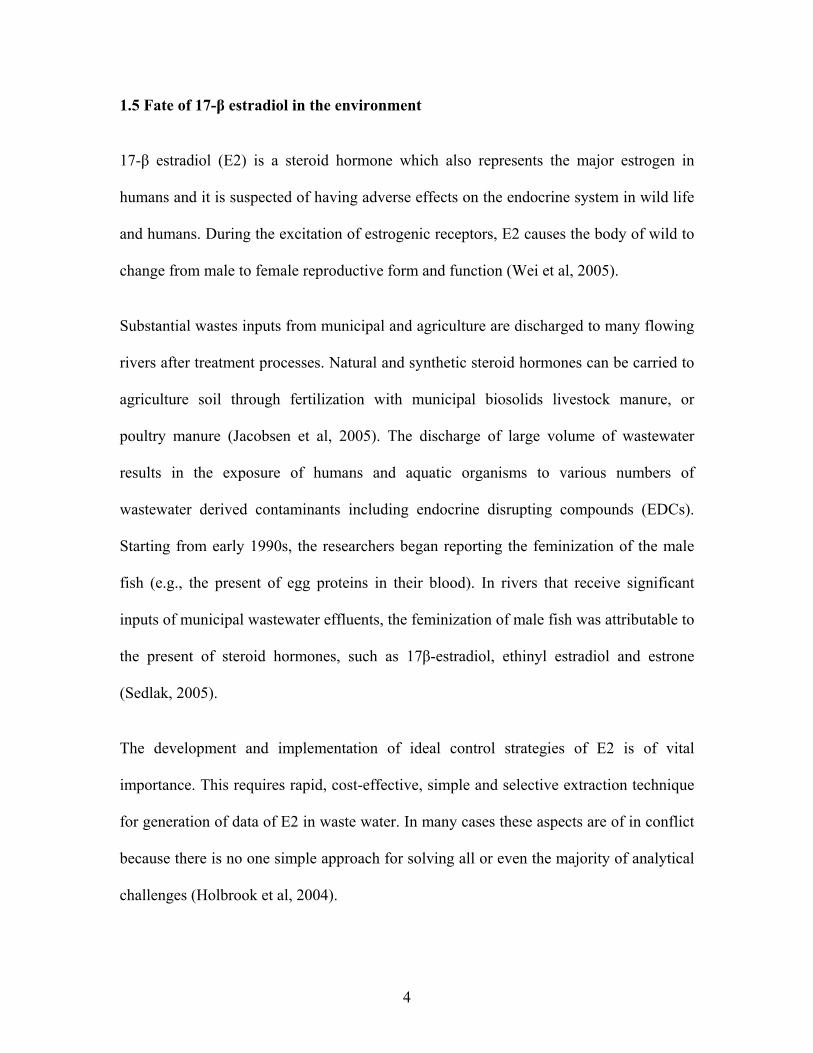
1.5 Fate of 17-β estradiol in the environment
17-β estradiol (E2) is a steroid hormone which also represents the major estrogen in
humans and it is suspected of having adverse effects on the endocrine system in wild life
and humans. During the excitation of estrogenic receptors, E2 causes the body of wild to
change from male to female reproductive form and function (Wei et al, 2005).
Substantial wastes inputs from municipal and agriculture are discharged to many flowing
rivers after treatment processes. Natural and synthetic steroid hormones can be carried to
agriculture soil through fertilization with municipal biosolids livestock manure, or
poultry manure (Jacobsen et al, 2005). The discharge of large volume of wastewater
results in the exposure of humans and aquatic organisms to various numbers of
wastewater derived contaminants including endocrine disrupting compounds (EDCs).
Starting from early 1990s, the researchers began reporting the feminization of the male
fish (e.g., the present of egg proteins in their blood). In rivers that receive significant
inputs of municipal wastewater effluents, the feminization of male fish was attributable to
the present of steroid hormones, such as 17β-estradiol, ethinyl estradiol and estrone
(Sedlak, 2005).
The development and implementation of ideal control strategies of E2 is of vital
importance. This requires rapid, cost-effective, simple and selective extraction technique
for generation of data of E2 in waste water. In many cases these aspects are of in conflict
because there is no one simple approach for solving all or even the majority of analytical
challenges (Holbrook et al, 2004).
4

1.6 Liquid membrane extraction as a sample preparation tool
Application of membrane technology in analytical science is currently identified as a very
powerful approach because it offers various versions of simple, miniaturized and novel
extraction configuration and techniques (Jonsson and Mathiasson, 1999). Liquid
membrane was introduced as an alternative separation technique to liquid-liquid
extraction technique (Audunsson, 1986).
Liquid membrane composes of two immiscible phases separated by the membrane. One
phase is called the donor phase as it contain aqueous solution with the compound of
interest which is extracted from it to the acceptor phase. The acceptor phase can be
organic or aqueous solution. The compound of interest can be transported across the
liquid as a consequence of an existing concentration gradient between the two phases
(Ata and Colak, 2005). Membrane selectivity can be fine-tuned by proper choice of the
conditions in the different phases (Chimuka et al, 2004). However, in complex samples
such as wastewater, sediments, plant extract, the selectivity is insufficient.
1.7 Research objectives
1.7.1 General objectives
• To develop novel miniaturized extraction technique for biomedical and
environmental applications in the analytical sciences.
5
1.7.2 Specific objectives
• To combine the technologies of molecularly imprinted polymers (MIPs) and
liquid membrane (LMs).
• To develop a new extraction technique based on the combined LM-MIP
technologies, offering unsurpassed selectivity in environmental and biomedical
applications.
• To further develop the extraction technique into a miniaturized format, still
retaining its simplicity.
• To demonstrate the potential of the new technique using E2 as a model
compound.
1.8 Statement of the research
The proposed project carries both academic and industrial significance as it addresses
central challenges in present MIP- and LM-technologies. The combination of the two
techniques into a working unit has the potential to create synergy effect that may meet
these challenges both in terms of aqueous phase performance and analytes selectivity.
The LM-MIP techniques is also highly adaptable to versatile and miniaturized production
formats, and has the potential to be commercialized.
1.9 Research assumption
This research assumes that the combination of the LM with MIP technology has the
potential to produce synergic effect in selectivity and performance.
6

1.10 Hypothesis of the research
The combination of MIPs and LM will resolve some of the problem faced by these
individual techniques in the extraction of environmental and biomedical samples.
Extraction will be performed by the miniaturised extraction system that will exhibit high
selectivity.
1.20 Justification of the research
Emphasis on the novel extraction techniques for biomedical and environmental
applications in the analytical sciences has continued to attract great interest in the
scientific community. At first it was directed at developing techniques that are capable of
extracting as many compounds as possible with minimal organic solvents for multi-
residue analysis. Later, the focus shifted more to techniques that are capable of fast
response times and high sample throughput such as immunoassays. Recently, much
attention has been concentrated on simple and miniaturized techniques.
Extraction techniques that have been accepted by the scientific community in analytical
sciences include solid-phase micro-extraction (SPME) (Beltrans et al, 2000) and stir-bar
sorptive extraction (SBSE) techniques (David and Sandra, 2007). However, these novel
techniques mainly use extraction sorbents that interact with the analytes through
hydrophobic interactions, and this makes them unsuitable for applications that involve
complex matrices samples such as wastewater, plant extracts and biological fluids.
In this project, a novel, simple and selective extraction technique that will address the
above short comings is presented for the first time. The technique based on the
7

combination of molecular imprinted polymers (MIPs) and liquid membranes (LMs),
taking advantage of both technologies for resulting into selective extraction.
8

CHAPTER 2: LITERATURE REVIEW
2.1 Sample preparation techniques
2.1.1 Introduction
Major requirements of good sample preparation techniques
Despite the advances in separation and quantitation techniques, typical methods for
sample preparation of different environmental samples involve liquid/liquid or
liquid/solid extraction with an organic solvent, often followed by clean-up and
preconcentration steps. These methods are time-consuming, labor intensive, and costly,
depending on the amount of solvent required. A greater concern over the usually toxic
solvents discarded and their impact on the environment has led to the development of
cleaner extraction methods.
The well known principles of “green chemistry” may be utilized to formulate its main
features. The following features are considered to have top priorities:
• Elimination (or, at least, significant reduction of consumption) of reagents,
particularly organic solvents, from analytical procedures;
• Reduction of vapor emission and gases, as well as liquid and solid waste
generated in analytical laboratories;
• Elimination of reagents displaying high toxicity and/or eco-toxicity from
analytical procedures (e.g., substituting benzene with other solvents);
9

• Reduction of labor and energy consumption in analytical procedures; per single
analyte or per whole analytical cycle (Wardencki et al, 2006).
The irony is that analytical methods used to assess the state of environmental pollution
which may may also contribute significantly to pollution significant pollution. Sampling,
and especially sample preparation, frequently involves generation of large amounts of
pollutants. This is why sample preparation techniques that use a small amount of organic
solvent, or none at all, have been developed. Usually they are classified according to the
extraction phase used; gas, membrane, and sorbent extraction. One important factor that
can be considered when choosing for sample preparations methods is to preconcentration
the analytes in the sample so as to increase their level/concentration so as to enhance
detection. Other important factors are as follows:
• To isolate the analytes from the rest of the sample matrix/components as it is
important because sample components can interfere with the analysis.
• To develop a method that is simple and easy to perform
• To be able to extracts as many analytes as possible. This is important because
often there is more than one pollutant in the sample. These should be extracted by
the same sample preparation method otherwise it can be time consuming.
• To be easy to automate; extract sample unattended. This will allow the person to
do other things and precision will also increase.
10
2.1.2 Different sample preparation technique
2.1.2.1 Liquid-Liquid extraction (LLE) technique
One of the most versatile techniques for the extraction and enrichment of analytes from
liquid samples is liquid–liquid extraction (LLE). Compared to the more recent and
popular technique of solid-phase extraction (SPE), LLE offers a higher potential for
chemically tuning the separation by incorporating different specific reagents, a higher
capacity for interfering compounds, and physical separation of the extracted analyte from
the extracted sample. However, LLE also has some well-known drawbacks, such as high
consumption of solvents, difficulties of automation and on-line connection to analytical
instruments, and an often tiresome formation of emulsions (Jönsson and Mathiasson,
1999).
Liquid-liquid extraction, also known as solvent extraction separates compounds on bases
of their distribution partition between the solvent systems. It is an extraction of a
substance from one liquid phase into another liquid phase. Liquid-liquid extraction is a
basic technique in chemical laboratories, where it is done in separating funnels, as well as
a common process in chemical industry and ore processing. Liquid extraction is a
valuable process in chemical engineering where the separation of one or more of the
components from a liquid mixture is required. A flow-based extraction method that
operates at a micro-scale to allow continuous liquid/liquid extraction based on the
exploitation of surface tension differences between two fluids has also been reported as
well as liquid-liquid extraction, the method can additionally be used to separate gas from
liquids (Lusiano et al, 2006).
11

Normally, extracts from samples, whether of biological or environmental origin, contain
many diverse compounds included with the possible analytes of interest. To exclude
these interfering molecules, a variety of sample clean-up techniques are usually
employed. Liquid-liquid extraction is a well-established technique for working up and
purifying solutions of fluids and it is also known to be easy to perform. To ensure that the
analytes is almost extracted, the same sample can be extracted several times with
different portions of organic phase. The continuous-flow operation enables the system to
be used for a wide range of scales simply dependent upon how long the system is left
running. Typically it takes only tens of seconds from entering the system to have a
worked-up fluid stream exiting the system and any settling time that would be required in
batch is reduced to a few seconds. Typically between 30 and 60% more effective than the
traditional batch process (http://www.answers.com/topic/liquid-liquid-extraction).
2.1.2.2 Solid Phase Micro-extraction (SPME) technique
Solid-phase microextraction (SPME), developed by Pawliszyn and co-worker in 1989, is
solvent-free analytical technology, which has the advantage of simplicity, low detection
limits and reproducibility (Dong et al, 2006). SPME has gained wide acceptance for the
analysis of environmental samples and more recently it has been shown to be useful for
many drug analysis applications, coupled to analysis by standard chromatography
instruments, (GC, GC–MS, LC, LC–MS, CE) (Namera et al 1996). Sensitivity and
precision are generally good or better than standard methods, the methods themselves are
simpler, and solvent use is eliminated (Arthur and Pawliszyn, 1990).
12

In SPME, analytes move from a flowing liquid sample phase to an immobilized or
supported liquid or solid-phase, and includes several embodiments. They include mainly
open bed extraction concepts such as coated fibres, vessels, agitation mechanism disks,
but in-tube approaches are also considered. Some better address issues associated with
agitation and others ease of implementing sample introduction to the analytical
instrument. It should be noted that solid-phase micro extraction was originally named
after the first experiment using an SPME device which involved extraction on solid
fused-silica fibres, and later, as a reference to the appearance of the extracting phase,
relative to a liquid or gaseous donor phase, even though it is recognized that the
extraction phase is not always technically a solid (Arthur and Pawliszyn, 1990).
In the case of fibre solid-phase micro extraction (SPME), analytes from a sample are
extracted by a polymer film coated on a fine 1-cm long fused-silica rod (Figure 2). The
rod with the polymer film and extracted analytes is then transferred to a hot injector port
of a GC or GC–MS, where extracted analytes are thermally desorbed and transported in
the carrier gas for standard separation and analysis. For LC applications, analytes are
desorbed from the fibre into mobile phase or another desorption solvent, in a small
volume desorption interface (Helrich, 1990).
In the technique of in-tube SPME, analytes are desorbed from a polymeric coating inside
a capillary, also into mobile phase or a separate desorption phase. In the desorption
process, the fibre and/or polymeric extraction phase are cleaned, and rendered ready for
another extraction. Methods are typically developed so that extraction and analysis times
are similar. In this way and with the use of an SPME autosampler, analysis is continuous,
13

with the analysis occurring concurrently with the subsequent extraction (Lord and
Pawliszyn, 2000).
Figure 2. Configurations of solid phase micro-extraction (Lord and Pawliszyn, 2000).
The fiber is mounted in a syringe-like holder called a SPME fiber assembly which
protects the fiber during storage and penetration of septa in the sample vial and in the GC
injector. This device is operated like an ordinary GC syringe for sampling and injection.
The extraction principle can be described as an equilibrium process in which the analyte
partitions between the fiber and the aqueous phase (Yang and Xie, 2006).
However, special equipment is usually needed in the SPME procedures and they could be
expensive. Moreover, SPME is mostly applied for volatile compounds in liquid matrices.
14
GC or GC–MS is usually used to determine the targeted compounds. In addition, a fibre
blank must be run before every extraction to verify that it is free of contaminants. In fact,
SPME has been proven to be an important sample preparation technique applied to
forensic specimens and because of the the advantage of being simple, rapid, sensitive and
(eliminating) the (disadvantages) of plunging and the use of solvents. The operation is
simple, the system can be reused and only small amount of solvent is required. Solid
phase micro-extraction (SPME) technique has been well studied and has been applied to
some drugs of abuse (Fucci et al, 2003).
Recently, many applications of SPME have been investigated for analysis of semi-
volatile and volatile compounds in air, aqueous matrices and in the headspace above dirty
aqueous samples, slurries and soils (Psillakis et al, 2000). The technique has been applied
for fruit aromas as an alternative sample preparation strategy, to overcome the problems
associated with conventional sampling methodologies, such as high costs, time-
consumption, and the use of large volumes of organic solvents. In addition, the SPME
procedure will more closely reflect the true flavor profile of the fruit pulp than those that
might be generated by distillation and solvent extraction processes (Carasek and
Pawliszyn, 2006).
2.1.2.3 Solid Phase Extraction extraction
The term "solid-phase" or "sorbent extraction", frequently abbreviated to "SPE", simply
implies a physical extraction process involving a liquid and a solid phase. Solid phase
extraction also consists of two immiscible phases. However, the extracted phase in this
case is a solid material or organic liquid immobilised on the solid support.
15
This is the most widely used sample preparation method/technique. It has also been the
most researched sample preparation technique in the last 10 years. Much research
focused on finding different extracting material for example those that can extract very
polar compounds/pollutants, materials that can extract on target pollutants (tailor made
materials) etc (Poole and Wilson, 2000).
In principle solid phase extraction can be considered as simple liquid chromatography.
The sorbent is the stationary phase and mobile phase is the aqueous phase during the
extraction step and organic solvent during the elution step. During the extraction step,
aqueous sample is passed through the sorbent material. Target analytes are trapped on the
sorbent in typical extractions; 50-200 ml of water sample is extracted. The trapped
analytes are then eluted by passing a small volume of organic solvent say 3 ml of
methanol or acetonitrile. The elution solvent used should be able to remove the analytes
(high performance) with low volume (3-5 ml), should be non toxic and should be
compatible with instrument to be used for analysis (Poole and Wilson, 2000).
Typical Solid phase extraction sequence consists of four steps:
• Conditioning the sorbent; the surface area of the sorbent is increased say opening
up hydrophobic chains in a C18 sorbent with methanol.
• Percolating the sample/extraction of the target analytes from the sample by
passing in water sample.
• Rinsing and when possible cleaning to remove interfering compounds. Here a
small amount of organic solvent is passed but this should not desorb the analytes.
16

• Desorption and recovery of the analytes from the sorbent using an organic solvent
e.g. acetonitrile or methanol.
Various materials of solid phase extraction are available in catridges, column and discs
configuration. Catridges have an advantage in that one can have many of them, so that
many samples can be extracted at the same time. However, they do not permit online
extraction for analysis (Sabik et al, 2000). Disks allow extracting the sample at very high
flow rate e.g. 15 ml/min-1. This means short extraction time is taken even for large
volume samples giving low determination limits. Discs cannot permit on-line extraction.
Solid phase in practice has also come to mean the use of commercial pre-packed columns
containing stationary phases related to those used widely in high-performance liquid
chromatography (HPLC), that may be adsorbents such as silica gel or FlorisilTM,
reversed-phase materials (e.g. with chemically-bonded octadecylsilyl ("ODS" or "C18"
groups) or ion-exchange media (e.g. with bonded aminopropyl or phenylsulfonic acid
moieties). The packing material is held in a place within a polyemer (usually
polypropylene of a serological grade) column by porous frits, also constructed of a
polymer material, and the column ends in a Luer tip to facilitate connection to a vacuum
manifold, to a needle or to a collection vessel.
Most of the manufacturers will supply copious literature on their products describing the
principles of the technique and innumerable applications. One particularly good example
of a general handbook is available from Analytichem International (Christie, 1992).
17

Figure 3. Shows the type of solid-phase extraction column (Christie, 1992).
Break through volume in SPE
Break through volume is the maximum volume of the sample that must be passed through
sorbents in SPE. Beyond that volume, the analytes just pass through unretained. Break
through volume differs from compounds to compounds and depends mostly on the
polarity of compounds and that of the stationary phases. Major causes of the break
through volume include: insufficient retention of analytes on the sorbent especially for
polar pollutants/compounds and when the capacity of the sorbent is exceeded, that is too
large volume has been extracted or sample contain too high concentrations.
18

The main types of materials used in SPE can be divided into two groups; non selective
sorbents/materials and selective sorbents: Non selective sorbents can be used to extract as
many pollutants as possible from water but they also extract other unwanted components
from the samples. Examples of non selective sorbents are silica materials bonded with
C18 ad C8 alkyl chain, graphitized carbon black (charcoal) and polymeric sorbents.
Selective sorbents are tailor made to trap only the target pollutants in the sample.
Examples of selective sorbents: Immunosorbents (IS): consists of antibodies covalently
bonded onto an appropriate material/sorbents and molecularly imprinted polymers which
are synthesized materials with antibodies mimics.
The more the compounds are extracted, the wide is the range of their physico-chemical
properties, e.g. polar compounds are generally lost during extraction because of low
affinity for sorbents. This emphasizes in the careful selection of the sorbent materials due
to differences in polarity. Non-polar compounds are efficiently trapped on common C18
sorbents but their desorption may be difficulty due to their high retention on the sorbent.
Non-polar compounds also adsorb in the tubing and vessel walls because of their high
desorption. Very non- polar solvent is therefore used and volume could be more resulting
in dilution. Methanol plus methylene chloride combination is often used as elution
solvent (Simpson and Dekker, 2000).
To eliminate adsorption phenomena, a low percentage of organic solvent or low amounts
of surfactants can be added directly to the sample. Some compounds may exist as ionic
forms under normal sample environmental conditions and this may require sample pH
adjustments.
19

One of the advantages of SPE over LLE is that it does not require the use and subsequent
disposal of large volumes of organic solvents. Solid phase extraction has a considerable
simplicity, reproducibility, reliability and automation capabilities this has made sample
preparation using SPE sample preparation to be popular and permanent features of many
laboratories (Simpson and Dekker, 2000).
SPE is an extremely efficient method for isolating and concentrating solutes from
relatively large volumes of liquid. This technique can be very effective, even when the
solutes are present at extremely dilute concentrations (e.g. ppb). Materials extracted in
this way can be used for subsequent chromatographic separation, spectroscopic
examination, or biological assessment. The apparatus consists of a simple tube, which
may be 2-4 mm I.D. and 2-4 cm long and is usually, but not necessarily, made from
stainless steel or a suitably inert polymer. The extraction tube is usually packed with an
appropriate bonded phase.
SPE is routinely used in many different areas of analytical chemistry. Some of the main
fields are environmental and pharmaceutical analysis where cleaning and concentration
of the sample are important steps in the analytical protocol. The growth of SPE has
largely been at the expense of liquid–liquid extraction (LLE) where the perceived
advantages of SPE over LLE are that it consumes less organic solvents and that a wider
range of extraction mechanisms can be utilised. Conventionally, solid phase materials
have included reversed phase sorbents, such as C18, C8, normal phases such as silica gel
and diol and ion exchange sorbents. For a sorbent to be useful, it must enable selective
extractions to be achieved (Olsen et al, 1998).
20

2.1.2.4 Molecularly Imprinting Polymers
Over the past two decades, enormous activity has taken place in the field of sensor
technology. Biosensors, in particular, have attracted considerable attention because of
their extraordinary sensitivities and specificities. However, such devices often lack
storage and operational stability because they are based on a fragile biological
recognition element: an enzyme or antibody. For this reason, biosensors have not become
quite the commercial success expected in the early euphoric development phase. An
emerging technology called molecular imprinting polymer, however, could provide an
alternative. This technique leads to highly stable synthetic polymers that possess selective
molecular recognition properties because of recognition sites within the polymer matrix
that are complementary to the analyte in the shape and positioning of functional groups
(Kriz et al, 1997).
The outstanding advantages of MIPs include their physical robustness, high strength,
resistance to elevated temperature and pressures, and inert to acids, bases metal ions an
organic solvents as well as the low cost and ease for preparation (Xu et al, 2004). MIPs
have high selectivity and affinity constants, comparable with naturally occurring
recognition systems such as monoclonal antibodies or receptors, which make them
especially suitable as constituents in chemical (biomimetic) sensors for analytical
chemistry or even as selective sorbents (Kriz et al, 1997). MIPs have enormous potential
applications because of their unparalleled characteristics and have previously been used
as chiral separation materials, recognition components in chemical sensors, specific
21

adsorbents in competitive drug assays, mimics of catalytic antibodies, and solid phase
extraction adsorbents for sample preparation (Ye et al, 2000).
The first known examples of molecularly imprinting polymer appear to have been
independent of each other, and motivated by two distinctly different goals. The soviet
chemist Polyakov was one of many scientists who were involved in investigations of
silica for use in chromatography. Polyakov prepared his silica by the acidifications of
sodium silicate solution which, after drying of gelatinous silica polymer, afforded a rigid
matrix. With the goal of increasing the binding capacity of the silica, the effect on pore
structure by the presence of either benzene, toluene or xylene during drying was
investigated (Anderson, et al, 1999)
Basically, molecular imprinted polymers are extensively cross-linked polymers
containing specific recognition sites with a predetermined selectivity for compound of
interests. Molecular imprinted polymers have been used for chromatographic separation,
in biomimetic sensors, in solid phase extraction for sample enrichment and clean-up (Ye
et al, 1998). Conventionally, MIPs are synthesized by bulk polymerization method in a
porogenic solvent creating a block co-polymer. To prepare MIPs, the imprint molecule is
dissolved in the acetonitrile porogen or other organic solvent together with functional
monomers. The functional monomers will form solution interaction, prearrangement
complexes, with the imprint molecule. In that case the bonds may be relatively weak
hydrogen bond, potential ionic bond which may be formed between the functional
monomers and the imprint molecule. This is followed by addition of crosslinking
monomers together with the initiator (Ramström, 1996).
22

Since free-radical polymerization is inhibited by the present of oxygen, the solution is
purged with nitrogen followed by induction of polymerization in the selected condition
(Ramström, 1996). After the removal of the print molecule, the polymer will reveal
retaining specific binding sites that can selectively rebind the original print molecule (Ye
and Mosbach, 2001).
Selection Self assembly Polymerisation ExtractionSelection Self assembly Polymerisation Extraction
Figure 4. Shows the steps involved in the preparation of MIPs (He et al, 2006).
Methods of MIP preparations
2.1.2.4.1 Emulsion polymerization
This method normally leads to uniform latex particles with diameters smaller than 1 μm.
Until now there have been only limited examples of MIP nanobeads that were
successfully prepared by simple emulsion polymerisation because the MIP beads
generated have narrow size distribution and from which each particle is surrounded by
the surfactant ('soap'), the charge on the surfactant repels other particles electrostatically
and surfactants and other polymerization adjuvants remains in the polymer and are
difficult to remove (Yan and Ramström, 2005). Emulsion polymerization is used to
manufacture several commercially important polymers. Many of these polymers are used
as solid materials (http://en.wikipedia.org/wiki/Emulsion_polymerization).
23

2.1.2.4.2 Dispersion polymerisation
This method starts from a homogenous solution containing monomer, initiator and, also
often an appropriate stabilizer. The added stabilizer, often a polymer modifier, provides
an effective steric barrier to prevent aggregation of the polymer granules. This method is
the common one for preparing commodity polymer beads (Yan and Ramström, 2005).
The common approach to prepare composite polymer particles is also through multi-step
This method has been investigated to the great extent for making molecular imprinting
polymer beads, using both aqueous and non-aqueous continuous phases. This method
gives larger beads and a broader distribution in particle size, although the latter can be
controlled to certain extent by optimizing the reaction conditions (Yan and Ramström,
2005). This technique has been developed for improving binding performance of MIPs
and new physical formats of MIPs. This is a simple method to prepare molecularly
imprinted polymer beads (Ye et al, 1999). The method turned out to be generally
applicable to a broad range of template structures, and purification of the imprinted
Traditionally, MIPs were synthesized as porous monolith, which after grinding and
sieving, gave irregular particles with different sizes in the range of 5–100 μm. Although
this method allows easy preparation of small amount of MIPs, it is time-consuming and
yields only moderate amount of useful MIPs (yield typically less than 50%).
dispersion polymerisation.
2.1.2.4.3 Suspension polymerization
polymer beads can be easily achieved.
24

The irregularity of size and shape of such MIP particles also made sample handling
difficult, and chromatography efficiency reduced. For new analytical applications, the
irregular particles are inferior to well defined polymer beads, especially in developing
MIP-based assays, sensor arrays and separation modules. In addition to improving
binding performance of MIPs, new physical formats of MIPs and more efficient synthetic
methodologies were important research topics in the past years (Yoshimatsu et al, 2006).
1 Types of interactions in molecular imprinting
MIPs can be divided into two main categories based on the types of interactions between
the template molecule and the functional groups, namely non covalent and covalent
interactions (Yan and Ramström, 2005).
Covalent was pioneered by Wulff and coworkers (Yan and Ho Row, 2006). This
technique involves the formation of covalent bond between the template and the
functional monomer in the synthesis of the polymer. During the rebinding, the ligand
interacts with the polymer via reversible, labile covalent bonds. Whitcombe and co-
workers introduces semi-covalent imprinting which can be looked upon as hybrid
approach relying on covalent bonds to first form the template-monomer complex with
subsequence rebinding to the polymer occuring via no-covalent interactions (Kirsch and
Whitcombe, 2005). Generally, the covalent and the semi-covalent approaches can be
successfull in creating well-defined recognition site, but both these techniques suffer
from the use of metal-coordination interaction, and therefore these approaches have
enjoyed their principal success in rather specific system (Yan and Ramström, 2005).
25

The introduction of MIP based non-covalent interactions has led to rapid growth in the
imprinting field (Vlatakis et al, 1993). Non-covalent interactions are the basis of
reversible binding and recognition event in biochemical systems that rely on non-
covalent interactions such as salt bridges, hydrogen bonds, and hydrophobic interactions.
This technique is generally regarded as being of more versatile in nature, as much as it
can be applied to almost any type of template. The inherent weakness of the interactions
makes this approach more difficult to control, often associated with a higher degree of
heterogeneity in the binding sites formed (Yan and Ramström, 2005).
The outstanding advantages of MIPs include their physical robustness, storage life, good
selectivity, high strength, resistance to elevated temperature, and pressures, and inert to
acids, bases metal ions, organic solvents as well as the low cost and ease for preparation
(Xu et al, 2004). Disadvantages include, column bleeding, heterogeneous sites and non-
polar solvent which is only preferred.
2.1.2.5 Application of Molecularly Imprinting Polymers in solid phase extraction
The potential for MIPs as SPE sorbents was first reported by Sellergren in 1994 a MIP
with recognition sites for the drug pentamidin (an antiprotozoal drug) was synthesised
and evaluated for on-line SPE. The MIP was prepared using methacrylic acid as
monomer and ethylene glycol dimethacrylate as cross-linker. This combination of
monomer and crosslinker has subsequently been used for the synthesis of most
applications of MIPs for SPE reported to date.
26
Sellergren achieved selective extractions and concentration of samples when the
technique was applied to the analysis of biological fluids (Sellergren, 1998).
A urine sample was spiked with pentamidin and the MIP based extraction resulted in a
clean extract and enrichment of the sample to a level where direct detection could be
achieved. After demonstration of MIP technology in SPE, it was several more years
before the next applications of MIPs in SPE appeared. Probably the most interesting
finding in the study was the importance of selecting the correct ionic modifier for the
elution step as this greatly affected the selectivity of the extraction.
The use of MIPs for SPE is at an early stage and several successful approaches in
bioanalysis and environmental analysis have been reported indicating the potential of the
concept. However, a number of problems, particularly with regard to template leaching
needed to be solved before the full utilization of MIPs can be realised in the sample
preparation arena (Olsen et al, 1998).
2.2 Membrane extractions
2.2.1 Introduction
Liquid membranes consist of a liquid that separates two solutions: the donor and acceptor
phases. They can be divided into three groups; i.e. bulk liquid membrane (BLM),
emulsion liquid membrane (ELM), and supported liquid membrane (SLM)
(Kocherginsky et al, 2006). BLMs consist of two aqueous phases separated by two semi-
permeable membranes from a stirrer organic phase. They have the slowest mass transfer
rate and have been used mainly in transport mechanism studies. EMLs are formed by
27
emulsion of three immiscible phases stabilized by surfactants. They have high diffusion
rate because of short diffusion path and high membrane-solution contact area
(Audunsson, 1986). The problem with EMLs is the formation of stable emulsions and the
additional steps needed to recover the analytes (Kralj and Brecevic, 1998). EMLs have
been used mainly for industrials applications like the recovery of metal ions from
industrial processes. The summary of other liquid membranes is given in Table1.
28
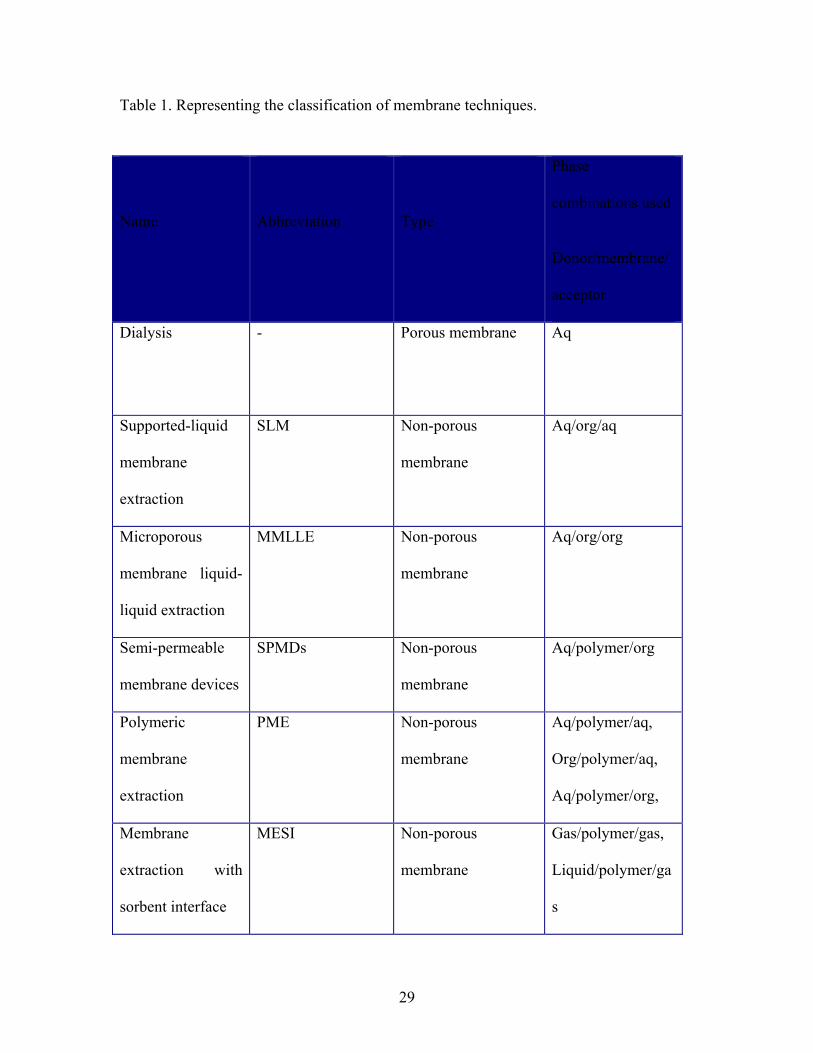
Table 1. Representing the classification of membrane techniques.
Name
Abbreviation
Type
Phase
combinations used
Donor/membrane/
acceptor
Dialysis
- Porous membrane Aq
Supported-liquid
membrane
extraction
SLM Non-porous
membrane
Aq/org/aq
Microporous
membrane liquid-
liquid extraction
MMLLE Non-porous
membrane
Aq/org/org
Semi-permeable
membrane devices
SPMDs Non-porous
membrane
Aq/polymer/org
Polymeric
membrane
extraction
PME Non-porous
membrane
Aq/polymer/aq,
Org/polymer/aq,
Aq/polymer/org,
Membrane
extraction with
sorbent interface
MESI Non-porous
membrane
Gas/polymer/gas,
Liquid/polymer/ga
s
29

Other membrane based extraction techniques
2.2.1.1 Dialysis
In dialysis, solutes diffuse from the aqueous donor side of a porous membrane to the
aqueous receiving side as a result of a concentration gradient. Separation between the
solutes is obtained as a result of differences in diffusion rates arising from differences in
molecular sizes. Dialysis is therefore most effective in removing large molecules like
protein from small ones (Van der Merbel and Brinkman, 1993). This technique has few
applications for environmental analysis except in biological samples since in the former,
both the analytes and the sample matrix compounds are small molecules.
In electrodialysis the electrical potential applied across the separation membrane make
sure that properly charged analytes in the feed solution are drawn through the membrane
to the receiving side (Jönsson et al, 2003). The advantages found from was that extraction
process using electrodialysis can be increased by an external electric field and the
techniques were suggested to recover organic acids from their dilute solutions. The
distribution coefficient of organic acids was also found to be successfully increased
(Pinacci and Radaelli, 2002).
The disadvantage is that sometimes this technique can produce very low electric
conductivity of the organic phase and the direct contact of the two phases and the energy
consumption can also become high and unstable (Yi et al, 2005).
30
2.2.1.2 Polymeric membrane extraction (PME)
In this case, instead of a porous membrane, an entirely solid membrane is used to
separate the donor and the acceptor solutions. The difference in the solubility and
diffusion of various analyte into the polymer is the basis of selectivity. The major
advantage is that the solid nature of silicon rubber means that the phase breakthrough is
minimized. The major disadvantage is that it does not allow for any room to incorporate
other functional group (carrier) that can enhance both the mass transfer and the selectivity
of the compounds of interest (Jönsson et al, 2003). Diffusion in solid are also slower
compared to liquids so the mass transfer in PME is less compared to liquid membranes.
2.2.1.3 Membrane extraction with sorbent interface (MESI)
The technique is based on membrane extraction into a gas followed by trapping of the
analytes on a solid sorbents (cryofocusing) and subsequent thermal desorption into a gas
chromatographic system (Pratt and Pawliszyn, 1992). The technique is therefore suitable
for volatile organic compounds either in air or aqueous samples. The main draw back of
the technique is that it has a narrow application window for environmental analysis; only
volatile organic compounds can be extracted (Jönsson et al, 2003).
31

2.3 Liquid membranes
2.3.1 Supported Liquid Membrane (SLM)
SLM consists of a three phase system which is the aqueous donor phase and aqueous
acceptor phase separated by the liquid membrane. In this technique, the sample comes in
contact with the organic liquid solvent, immobilised in a membrane (commonly a porous
teflon membrane) where the analytes of interest are selectively extracted. On the opposite
side of the membrane, a stagnant aqueous acceptor solution traps the inactive
(charged/ionized) sample analytes at their optimum pH values. Trapping analytes with
stagnant acceptor solutions, results in increased total concentration of the analytes and
this leads to efficient enrichment (Audunsson, 1986).
The extraction efficiency of SLM is a function of a number of thermodynamic and kinetic
parameters which affect the detection limits, accuracy and precision of quantification of
the analytes if not optimized. Therefore, optimization is an important step for an efficient
clean-up and pre-concentration of the analyte to be extracted or enriched (Msagati et al,
2005). The composition and nature of the liquid membrane is of critical importance to
consider since it can influence the rate of mass transfer, stability and selectivity. The
nature and physicochemical properties of the analytes to be enriched, the solubility in
water of the membrane solvent, together with the environment in which they are found,
provides crucial criteria for the choice of the membrane solvent (Msagati et al, 2005).
32

Three different physical realisation of SLM modules have generally been reported i.e the
flat, spiral and tubular modules (Figure 5). Common configurations of SLM are flat sheet
supported liquid membrane (FSSLM) and hollow fiber supported liquid membrane
(HFSLM). Small experimental laboratory setup usually consists of a two-compartment
cell, separated by a flat membrane. If the SLM is not stable and organic liquid does not
stay in the pores, it is possible to use cells with three compartments where two porous
supports of same (Wodzki and Sionkowski, 1995) or different (Kislik and Eyal, 1996)
nature are used to separate the organic and aqueous phases. The organic solution with the
carrier can be stirred or circulated in the middle compartment to decrease mass transfer
resistance. PTFE is the one commonly used membrane. There has been many studies
conducted using this technique over a wide range of samples (Lee et al, 2007). Also
SLM can be modified into a probe that can be used for trace analysis (Cukrowska et al,
2004).
(i)
(ii)
Acceptor channel Membrane
(iii)
Figure 5. Shows the different types of SLM modules (i) Flat, (ii) spiral and (iii) tubular
(Jönsson et al., 2003).
33
Although SLMs have been widely studied for the separation and concentration of a
variety of compounds and present many potential advantages over other separation
methods, there have been very few large scale applications of SLM due to insufficient
membrane stability. This problem can be due to the loss of the carrier and/or solvent from
the membrane, which has an influence on both flux and selectivity. Time after which
instability phenomena are observed varies from less than 1 h (Takeuchi et al, 1987) to
several months (Danesi, 1984; 1987). The major degradation mechanisms are:
• Progressive wetting of the pores in the membrane support by the aqueous phase
• Pressure difference over the membrane
• Mutual solubility of species from the aqueous phase and liquid membrane phase
• Emulsion formation in the liquid membrane phase
• Blockage of membrane pores by precipitation of a carrier complex at the surface
SLM stability can be affected by the type of polymeric support and its pore radius
organic solvent used in the liquid membrane, interfacial tension between the aqueous and
membrane phase, flow velocity of the aqueous phases, and method of preparation
(Chiarizia, 1991; Yang and Fane, 1997).
The technique has been used as a sample preparation alternative to many others in the
extraction of different compounds in avariety of matrices (Jönsson and Mathiasson,
1999a, b). Audunson (1986, 1988) first reported the use of SLM in the determination of
amines and after that the technique has been used in many other applications such as
enrichment of metals in natural waters (Djane etal, 1997; Ndung’u et al, 1998, 1999).
34

The technique has also been used in monitoring of a variety of classes of veterinary drugs
in biological matrices (Msagati and Nindi, 2001, 2004) and in the enrichment of
herbicides in natural water samples (Chimuka et al, 1997).
2.3.1.1 Microporous membrane liquid-liquid extraction (MMLLE)
Another variation of SLM is termed microporous membrane liquid–liquid extraction
(MMLLE), a two-phase extraction, where an aqueous phase and an organic phase are
separated by a hydrophobic membrane in a flow system similar to that used for SLM. By
means of this technique, classical LLE methods can be set up in an alternative manner
from conventional extraction-funnel operation or to segmented-flow systems. This
approach has demonstrated possibilities for automation, reduced solvent consumption, no
emulsion formation, as well as a greatly reduced need for manual labor (Shen et al,
1998).
Figure 6. Shows schematic representation setup of MMLLE. P, pump;V1, V2, valves;;
SY, glass syringe; V, vial; S, sample; A, accepter (hexane); W, waste; AB, aluminum
backer; PB, PTFE block; PM, PTFE membrane; SC, spiral channel (Liu et al, 2003).
35

The MMLLE technique can be operated either with a stagnant and a flowing acceptor
(Sandahl et al, 2000). MMLLE is conceptually similar to continuous dialysis, are also
valid for that technique under the assumption of equilibrium between the phases. By
using an acceptor flow in the opposite direction to the donor flow, the concentration
gradient between the two phases will be larger and the mass transfer will be somewhat
more efficient (Bernhardsson et al, 1985). This situation is mathematically far more
complex than the parallel-flow assumption, as it is not possible to assume equilibrium
anywhere in the cell. For the corresponding problem in dialysis, numerical solutions to
the appropriate partial differential equation system have been derived (Bernhardsson et
al, 1985).
Compared with SLM, MMLLE has the following characteristics:
• It is applicable to hydrophobic, preferably uncharged compounds, i.e., those that
can not be extracted with SLM.
• The maximum concentration enrichment possible is limited by the partition
coefficient whereas in SLM it is dependent on the degree of trapping.
• The extract ends up in the organic solvent, not in water. Thus MMLLE is more
easily interfaced to gas chromatography and normal-phase HPLC than is SLM,
which is most compatible with reversed-phase HPLC.
The hardware is identical or similar, so the possibilities for automation should be similar,
considering the point above (Jönsson and Mathiasson, 1999).
36

2.4 Determination techniques
2.4.1 Liquid chromatography
Liquid chromatography (LC) is an analytical chromatographic technique that is useful for
separating ions or molecules that are dissolved in a solvent. If the sample solution is in
contact with a second solid or liquid phase, the different solutes will interact with the
other phase to differing degrees due to differences in adsorption, ion-exchange,
partitioning, or size. These differences allow the mixture components to be separated
from each other by using these differences to determine the transit time of the solutes
through a column (Schoeff and Williams, 1993). This technique is widely used for
preparative chemistry and biochemistry, in which milligrams to grams of material are
isolated (Harris et al, 1997). Liquid chromatography uses liquids as a mobile phase, the
stationary phase used are almost exclusively of the octadecylsilyl (“ODS”) type, with an
octyl phase being recommended occasionally as an alternative. The mobile phase is either
acetonitrile (mainly) or methanol containing some water (Faust, 1992).
High-performance liquid chromatography (HPLC) is a form of liquid chromatography to
separate compounds that are dissolved in solution. HPLC instruments consist of a
reservoir of mobile phase, a pump, an injector, a separation column, and a detector.
Compounds are separated by injecting a plug of the sample mixture onto the column. A
schematic diagram of a typical HPLC is shown in figure 7. The different components in
the mixture pass through the column at different rates due to differences in their
partitioning behavior between the mobile liquid phase and the stationary phase. HPLC
37

has many applications including separation, identification, purification, and
quantification of various compounds (Knox et al, 1989).
Separation in HPLC is based upon the relative abilities of the stationary phase to trap
analytes and allow them to elute over time. As molecules of the sample components enter
the column, it can be either be adsorbed on the stationary phase or remain in the mobile
phase. A strongly adsorbed sample component spends a greater proportion of its time
within the column on the stationary phase than does a weakly adsorbed component.
Consequently, the retention time or volume increases as the amount of adsorption on the
stationary phase increases (Braun, 1987).
Figure7. High-performance liquid chromatography (Pieper and Rutledge, 1989).
38

2.4.1.1 Ultra violet detector
The most common detector for HPLC is the UV-Visible spectroscopic detector, which is
both sensitive and linear (Smith et al, 2005). UV absorption detectors respond to those
substances that absorb light in the range 180 to 350 nm. Many (but not all) substances
absorb light in this wavelength range, including those substances having one or more
double bonds (p electrons) and substances having unshared (unbonded) electrons, e.g. all
olefins, all aromatics and compounds, for example, containing > C = O , > C = S , –
N = N – groups. The sensor of a UV detector consists of a short cylindrical cell having a
capacity between 1 µl and 10 µl through which passes the column eluent. UV light is
arranged to pass through the cell and fall on a photo–electric cell (or array). The output
from the photocell passes to a modifying amplifier and then to a recorder or data
acquisition system. The relationship between the intensity of UV light transmitted
through a cell (IT) and the concentration of solute contained by it (c) is given by Beer's
Law which is represented as follows:
A=ebc
Where A is absorbance (no units, since A = log10 P0 / P), e is the molar absorbtivity with
units of L/mol cm-1 , b is the path length of the sample - that is, the path length of the
cuvette in which the sample is contained and c is the concentration of the compound in
solution, expressed in mol/L (http://www.chromatography-online.org/HPLC-
Detectors/UV/rs37.html).
39
High-performance liquid chromatography (HPLC) with ultraviolet (UV) detection has
been also used to determine relatively high concentration ( μg/L) organic compounds;
e.g. PCBs and estradiols (E2) from water supplies (Matsumoto et al, 2002).
2.4.1.3 High Performance Liquid Chromatography coupled with a Mass Spectrometry
detector via an ElectroSpray Interface
The MS continuously monitors the HPLC solvent flow. When a compound of interest
(analyte) elutes from the separations module, the MS first vaporizes the HPLC solvent to
remove it, and then it ionizes the compound. The MS then electronically propels the ion
through an extraction cone, then into a molecular-mass sorter and finally, into a particle
counter. A computer monitors the particle count for a range of masses and ion charges.
The values generated provide a mass spectrum that shows information about an analyte's
identity as well as its concentration in the sample.
High Performance Liquid Chromatography coupled with a Mass Spectrometry detector
via an ElectroSpray Interface (HPLC–ESI-MS) was also found to be useful for the
analysis of EDCs e.g. E2 from marine sediments and biota samples sewage effluents and
surface waters (Pojana, 2007).
2.4.2 Gas chromatography
In gas chromatography, gaseous analytes is transported through the column by a gaseous
mobile phase, called carrier gas. The stationary phase in this type of chromatography is
usually a non-volatile liquid, but sometimes it can be a solid analytes either gas or
40
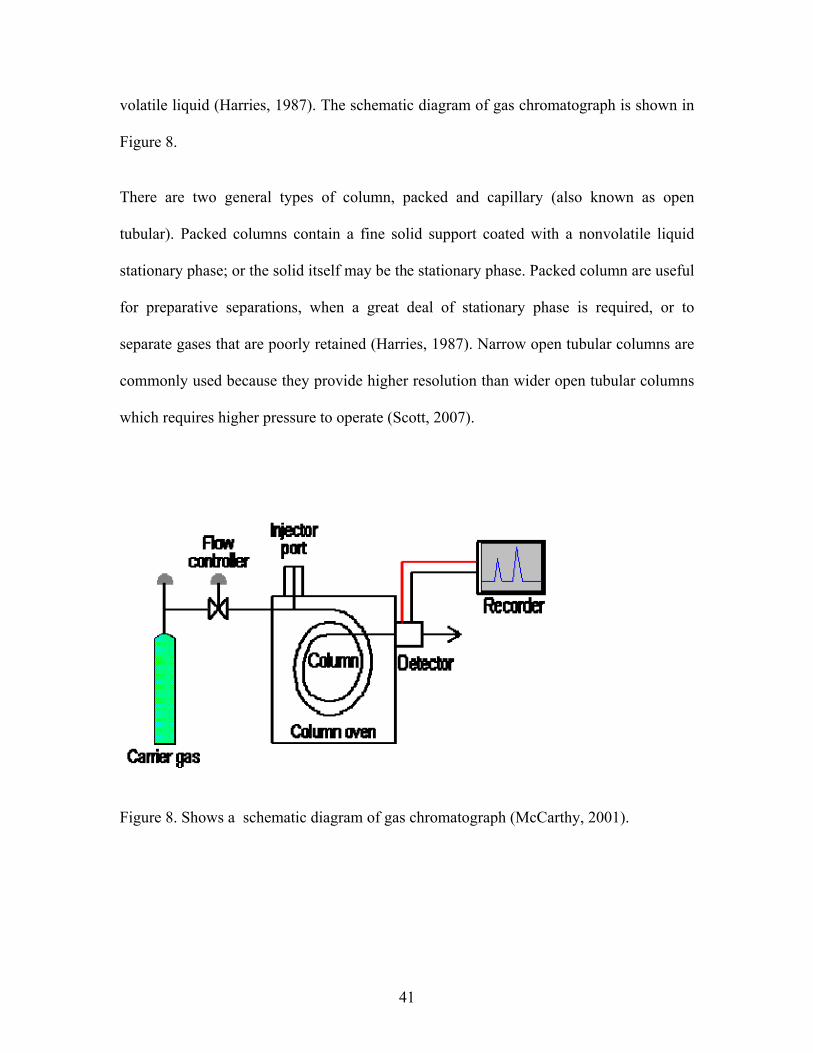
volatile liquid (Harries, 1987). The schematic diagram of gas chromatograph is shown in
Figure 8.
There are two general types of column, packed and capillary (also known as open
tubular). Packed columns contain a fine solid support coated with a nonvolatile liquid
stationary phase; or the solid itself may be the stationary phase. Packed column are useful
for preparative separations, when a great deal of stationary phase is required, or to
separate gases that are poorly retained (Harries, 1987). Narrow open tubular columns are
commonly used because they provide higher resolution than wider open tubular columns
which requires higher pressure to operate (Scott, 2007).
Figure 8. Shows a schematic diagram of gas chromatograph (McCarthy, 2001).
41
2.4.2.1 Gas chromatography-mass spectrometry
The GC-MS is composed of two major building blocks: gas chromatograph and the mass
spectrometer. The gas chromatograph utilizes a capillary column and depending on the
column’s dimensions (length, diameter, film thickness). The differences in the chemical
properties between different molecules in a mixture will separate the molecule as the
sample travels the length of the column. The molecule will be eluted with different
retention time from the gas chromatogram and then that allows the mass spectrometer
down to capture, ionise, and detect the molecule separately. The mass spectrometer does
this by breaking each molecule into fragments and detecting these fragments using their
mass to charge ration.
The analytical determination of E2 from surface and wastewater commonly can be
performed using gas chromatography-mass spectrometry (GC-MS or MS-MS) (Yoon et
al, 2003). GC-MS can be used to extract E2 from a surface water sample, it analysis by
using N-methyl-N-(tert.-butyldimethyltrifluoro-acetamide (MTBSTFA) as the
derivatization reagent, and the recoveries can be quantitative if the extract volume is 100–
200 μl, irrespective of the amount of reagent added (Yoon et al, 2003).
Estrone (E1), 17β-estradiol (E2), ethynylestradiol (EE2) and estriol (E3) can be measured
with the detection limits of 0.65, 0.65, 0.65 and 0.60 ng/ml, respectively when using GC
coupled with MS. The recovery for river water samples can be in the range of 86.0–
105.1% with the RSD of 1.9–5.8%. The method was applied to the analysis of a river
water sample and estrone (E1) was determined to be 2.1 ng/l (Matsumoto, 2002).
42

2.4.2.2 The flame ionisation detector
The flame ionisation detector is used to measure concentrations of hydrocarbons within a
sampled gas. The presence of hydrocarbons is detectable by burning the sampled gas in
an air-hydrogen flame. Burning just pure hydrogen with air produces only trace amounts
of ionisation. The presence of hydrocarbons in the sampled gas, when burnt with an air-
hydrogen mix causes high levels of ionisation. The ionisation occurs as a result of the
carbon atoms present in the sampled gas. The level of ionisation is proportional to the
number of carbon atoms within the sample (Fackrell, 1980).
Figure 9. Schematic representation of flame Ionisation Detector (Smith et al, 2005).
43

2.4.2.3 Electron capture detector
The electron capture detector (ECD) is a highly sensitive detector capable of detecting
picogram amounts of specific types of compounds. The high selectivity of this detector
can be a great advantage in certain applications. Compared with the FID, it has much
more limited linear response range, generally less than 2 orders of magnitude. The
response can also vary significantly with temperature, pressure and flow rate (Robards et
al, 1994). The electron captor detector is particularly sensitive to halogen-containing
molecules, conjugated carbonyls, nitriles, nitro compounds, and organometallic
compounds, but relatively insensitive to hydrogen and alcohol. ECD detectors measure
the pulse rate needed to maintain the standing current (Lehrle, 1999).
44

CHAPTER 3: EXPERIMENTAL
3.1 Chemicals
97% 17β-estradiol (E2), 2,2′-Azobis(2-isobutyronitrile) (AIBN), 99% methacrylic acid
(MAA), trimethylolpropane trimethacrylate (TRIM) and 98% 1,1 Azobis(cyclohexane-
carbonitrile) (ACCN) were purchased from Sigma Aldrich (Darmstadt, German).
Analytical grade (99.9 %) acetonitrile was from BDH, (London, England). Other solvents
used were also of analytical grade.
3.2 Equipments
3.2.1 HPLC and Centrifuge
HPLC used in this project was from SRI (model 210D, LA, California, USA). This
instrument composed of variable UV detector from which 220 nm was selected for
analysis. A C18 column (25 cm x 4 mm, 5 µm) was from Supelco. The instrument was
used for the determination of all the analysis. A computer equipped with a Peak Simple
version 3.29 chromatographic software was used to process chromatograms.
An MSE, Mistral 1000 bench top centrifuge (Hettich, Germany) was used to sediment the
MIPs during washing after synthesis.
45

3.2.2 Oil bath, ultrasonicator and electron microscope
A silicone heat transfer fluid was bought from Kynethan Business Management (KBM)
(Johannesburg, South Africa). The fluid was added as a bath to heat the reaction mixture
in the synthesis of molecular imprinting polymer for 17β estradiol.
For shaking or dissolving sample solution during experimentation, a 460 Ultrasonic
Elma (Braun, Germany) was used. The physical appearance of MIPs was viewed using
scanning electron microscopes JSM-840 (JEOL, JMS-840, Tokyo, Japan).
3.2.3 Membranes and membrane unit
Porous PTFE membrane with polyethylene backing (pore size 0.2 µm, porosity 0.70 µm,
total thickness 175 µm of which 115 µm is polyethylene backing, Type FG) was from
Millipore (Bedford, MA, USA). The stainless steel extraction unit was constructed by CE
engineering cc (Johannesburg, South Africa).
3.3 Preparations of stock solutions
50 mg of 17β-estadiol was dissolved in 50 ml volumetric flask of acetonitrile to make a
stock solution of 1000 mg/L. All the standards with the concentration of 0.5, 1, 3, 5 and 7
mg/L were prepared from that stock solution.
46
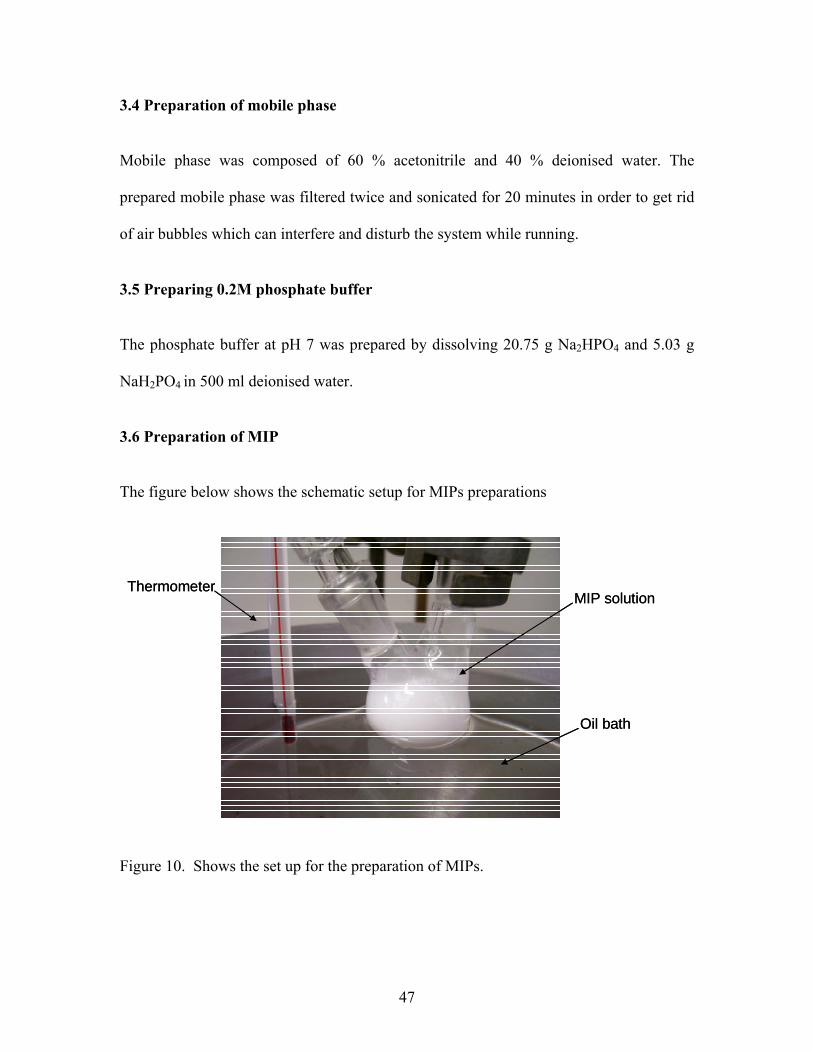
3.4 Preparation of mobile phase
Mobile phase was composed of 60 % acetonitrile and 40 % deionised water. The
prepared mobile phase was filtered twice and sonicated for 20 minutes in order to get rid
of air bubbles which can interfere and disturb the system while running.
3.5 Preparing 0.2M phosphate buffer
The phosphate buffer at pH 7 was prepared by dissolving 20.75 g Na2HPO4 and 5.03 g
NaH2PO4 in 500 ml deionised water.
3.6 Preparation of MIP
The figure below shows the schematic setup for MIPs preparations
MIP solution
Oil bath
ThermometerMIP solution
Oil bath
Thermometer
Figure 10. Shows the set up for the preparation of MIPs.
47
3.6.1 Preparation of MIP by precipitation method
The molecular imprinted microspheres were prepared using precipitation polymerization.
The imprint molecule 17β-estadiol, functional monomer MAA, cross linker TRIM and
the initiator AIBN were dissolved in acetonitrile followed by sonication for 5 minutes in
round bottom flasks. Table 1 summarizes the amounts used in preparation of MIP. The
solutions were then purged with nitrogen for 5 minutes and the flasks were sealed under
nitrogen. Polymerization was induced by placing the flasks in an oil bath at 60 ◦C.
The polymerization continued overnight. The microspheres obtained were collected by
centrifugation using the centrifuging machine. Imprint molecule was extracted by
washing three times with 10 mL methanol containing 10% acetic acid, followed by final
wash in the same volume of acetone. The repeated centrifugation and decanting steps
subsequently removed the print molecule from the polymer. The imprinted polymers
were finally dried by leaving the MIPs beads at room temperature. Blank imprinted
polymers were prepared and treated in exactly the same way, except the print molecule
was excluded during polymerization.
48

Table 1. Ingredients values used for polymerization preparation.
Ingredients Molecular
weight
(g/mol)
Measurments
(mg)
Concentration
(mmol)
Equivalents
E2 275.39 40 0.145 1
MAA 86.09 60 0.696 5
TRIM 338.40 100 0.296 2
POROGEN 41 8 ml ___ ___
3.6.2 Preparation of MIP by bulk polymers
1 mmol of 17 β-estradiol, 8 mmol of monomer (MAA), 25 mmol of cross-linking agent
ethylene gylcol dimethacrylate (EDMA) and 50 mg of initiator 2,2-azobis(2,4-
dimethylvaleronitrile) (ABDV) were dissolved in 7.5 mL of acetonitrile in an air-tight
glass vial. The mixture was then purged with nitrogen for 5 min. The polymerisation was
done overnight at 40 °C in a water-bath. The bulk polymers were successively ground in
a mortar and crushed with ceramic beads in presence of methanol and washed with 5
rounds of acetonitrile/ acetic acid mixture (4/1) followed by 1 round of acetonitrile and 2
rounds of methanol at 60°C with shaking. The polymers were then dried overnight with a
vacuum pump.
49

3.7 The binding constant of the MIP prepared by bulk method
100 µL of radioactive E2 (0.32 pmol, 30 nCi) in presence of different polymer
concentrations ranging from 5 to 40 mg/mL was allowed to equilibrate overnight. The
polymer particles were removed from the samples by centrifugation at 13000 rpm for 15
min; 500 µL of the supernatant was added to 4 mL of scintillation cocktail in 20 mL
scintillation vials and the radioactivity was measured with a β-radiation counter.
Experiments were performed in triplicates.
4.0 Extraction-procedures with LM-MIP technique
Acceptor phase
Porous membrane
Magnetic stirrer
Acceptor phase (toluene, MIP beads)
Porous membrane
Magnetic stirrer
Donor aqueous phase
Acceptor phase
Porous membrane
Magnetic stirrer
Acceptor phase (toluene, MIP beads)
Porous membrane
Magnetic stirrer
Donor aqueous phase
Figure 11. Set-up of LM and MIP extraction technique.
Figure 11 shows the components of the LM-MIP extraction technique. It is composed of
two immiscible phases which is the aqueous phase (37 mL) and the organic phase (2.5
mL) separated by porous hydrophobic membrane. The porous membrane was
impregnated with the organic acceptor phase, in this case toluene.
50

7 mg of MIPs beads were incorporated in the acceptor phase. E2 was extracted from
aqueous into organic acceptor phase due to its solubility, partition. In the acceptor phase
it was re-extracted onto MIP beads. After extraction MIP beads was separated from the
organic phase by reducing the volume of the toluene on the membrane and then the
membrane with MIP beads was left dry. When toluene evaporated, the beads were then
transferred to the vial and 2.5 mL of 10% water in methanol was added for beads to
release the bound E2 which was then analysed on HPLC.
Preparation of the extraction unit involved first filling 37 mL of the sample in the lower
compartment. The membrane previously soaked for 5 minutes in toluene was placed on
top. The upper compartment was then screwed. 2.5 mL of the organic solution followed
by 7 mg of MIP beads were then added. The top hole was then closed and the unit was
ready for extraction.
4.1 Optimization of LM-MIP technique
Varying the amounts of MIP
This was done by spiking 7 mg/L of E2 in 5 mL of toluene in three test tubes. Then 0.5
mL, 1.5 mL and 7 mg of MIP beads were added respectively. After shaking and leaving
the test tubes standing for 30, 60 and 288 minutes, the amount of E2 not bound was
determined.
51

Influence of sonication on E2 rebinding
7 mg of E2 spiked in deionised water was extracted as described in the procedure. After
60 minutes extraction time, the organic solvent and MIP beads were taken and ultra
sonicated for 30 minutes before separating the MIP. The experiment was repeated with
60 minutes sonication.
Varying the extraction time
Deionised water was spiked with 7 mg/L of E2 in a 50 mL volumetric flask. The
concentration of E2 was determined before and after extraction. Extraction was done for
15 minutes, 30 minutes and 60 minutes. 37 mL of each spiked water was extracted as
aqueous donor phase and 2.5 mL of toluene was used as acceptor organic phase with 7
mg of MIP beads. The experiment was repeated twice.
Testing of impurities
To check for any impurities in the prepared MIPs, 5 mL of methanol containing 10 %
deionised solution was injected on HPLC and about 7 mg of MIPs in methanol containing
10 % deionised was sonicated and filtered. After filtering the filtrate was injected into the
HPLC and both chromatograms were compared for any unwanted peaks. The
chromatogram for direct injection of 10% water in methanol served as the control.
52
Quality assurance
The reproducibility of the HPLC system was determined by injecting 1 mg/L standard
solution 10 times. In some cases extractions were done in triplicates to test for the
reproducibility of the LM-MIP extraction techniques. The calibration curve was used for
evaluation of the unknown sample. Linearity of the calibration curve was evaluated by
looking at the correction coefficient. E2 from the samples was identified by comparing its
retention time to that of the standard solutions.
4.2 Demonstration of LM-MIP selectivity in various samples
4.2.1 River water, urine and fruit samples
Water sample was collected from the river near Supersport Park Pretoria, Centurion
(Gauteng province). It was then spiked with 7 mg/L by taking 350 μl from the 1000 mg/L
stock solution into the 50 ml volumetric flask, and the flask was filled up to the mark. 37
mL of this water was then extracted by LM-MIP extraction technique to demonstrate its
selectivity against matrices found in river water. Urine sample was donated by one of the
postgraduate student. The sample was then spiked the same way as for river water. The
LM-MIP extraction technique was applied to urine to check its extraction efficiency and
its selectivity to E2 from the rest of the impurities. Each experiment was repeated twice
and the conditions of the acceptor phase were as reported earlier. After each extraction,
the amount of MIP in the bulk acceptor solution was quantified by letting the solvent
evaporate and then exchanged for 2.5 mL of 10% deionised in water. The amount of E2
trapped by MIP beads was desorbed and analysed as before.
53

60 g of each fruits was crushed in the mortar for homogenization. The homogenate was
mixed with 160 ml of methanol in a flask and left overnight. The contents were
transferred into a 400 ml beaker and allowed the methanol to evaporate (about 2 days) at
room temperature. The sample was filtered after 200 ml of 0.2 M phosphate buffer at pH
7 was added. The fruits in the phosphate buffer were then extracted by the LM-MIP
extraction unit.
54

CHAPTER 4: RESULTS AND DISCUSSION
4.1 Synthesis of MIPs
As described in the experimental, the preparation of MIPs requires the template,
functional monomer, cross linker, the initiator and suitable solvent. According to other
authors, a typical imprinting system consists of a print molecule, at least one type of
functional monomer and crosslinker, and a porogenic solvent (Ye and Mosbach, 2001).
From the experimental chapter (Table 2) it can be seen that the concentration of
functional monomer is more compared to that of the cross linker so that MIPs obtained
become very specific to the original print compound than if concentration of the cross
linker is more than that of the functional monomer.
During preparation, the shape of the template is the one which will guide the binding of
the functional monomer and the binding of the cross-linker will form the double helix
structure of the polymer. The initiator will be the one which will initiate the
polymerisation by forming the radicals during reaction. According to the ingredients use,
it can be seen that about 160 mg of MIPs should be obtained after polymerisation
reaction is completed, assuming a 100 % yield.
55

Table 3. The percent yields of the MIP synthesis.
Mass (mg) Yield (%)
128.6 80 %
135.8 85 %
87.7 59 %
100.9 63 %
20.2 13 %
Mean Average value: 60 %
(% RSD =47 %)
The percent yield of the MIPs which is shown in Table 3 was prepared using
precipitation polymerisation method. The average percentage yield of the synthesised
MIPs was found to be 60 %. This gives about 96 mg of MIPs. The morphology is shown
in Figure 12B. According to Ye and Mosbach (2001), they found that the ideal way for
preparing MIP microspheres is that the reaction conditions are compatible with most
imprinting systems and in the presence of excess solvent (typically ≥ 95 % by volume,
depending on solubility parameter of the polymer and the solvent). This gives uniform
microspheres bearing imprinted binding sites with excellent yields (Greater than of 85
%). To synthesize uniform MIP microspheres, choice of the reaction solvent is critical. In
the non-covalent approach, the solvent should be non-interfering to the driving force of
forming the print molecule-functional monomer complex. In addition, the solvent should
56
be miscible with monomers and initiator, but be a non-swelling solvent for the polymer
formed.
With acetonitrile as a solvent, uniform MIP microspheres are readily obtained when
appropriate amount of print molecule and crosslinker are utilized. The obtained yield was
found to be low especially when compared with the 100 % yields of the MIPs which were
prepared using the convectional bulk method. In producing conventional imprinted
polymer beads, large amount of cross-linking monomer is used with a total monomer
concentration of around 20–50 % (v/v) with respect to solvent, which gives higher yields
(Ye et al, 2001). The reason for getting low MIPs yieldswith this could be due to manual
errors when measuring the amounts of the template and the cross-linker because the
acetonitrile (porogen) which produces good polymers was used for polymer preparation.
This is supported by relative high standards deviations. The temperature fluctuation from
60◦c of the oil bath could also have contributed in getting low amounts of MIPs because
the reaction was performed in the hood with the oil bath not covered or insulated.
4.1.2 Bulk polymerisation
About 98 % yield was obtained from MIPs prepared using bulk polymerisation which is
higher than what is obtained from precipitation polymerisation. The physical appearance
of these polymers is shown in Figure 12A. The morphologies and porosities of the
resulting imprinted materials were characterized by scanning electron microscopy
analysis, respectively using JSP at 2000x magnification. The figure shows that from bulk
polymerisation, bigger particles were prepared. In precipitation polymerisation, smaller
particles were formed and that formed clusters or aggregates.
57

Figure 12 (a) represents the morphology of the MIPs prepared using bulk method and (b)
represent the morphology of the MIPs prepared by precipitation method.
Depending on the polymerisation method used, MIPs (Figure 12A), can have various
physical configurations. It has been found that the conventional molecularly imprinted
polymers or MIPs are irregular in shapes which are combination of macroporous and
microporous polymer beads. Bigger MIP particle generally results into slow diffusion of
analytes in and out due to large pores compared to imprinted microspheres (Ye et al,
2001). This may be due to the small size of the discrete microspheres and the better
accessibility to their specific binding sites.
58

4.1.3 Binding studies
Figure 13. Represents the binding constant of bulk MIPs, results are binding studies of
three replicate for MIP and NIP.
The competitive binding analysis was performed to verify the presence of specific
binding sites on the molecular imprinted polymer (MIP) and non-imprinted microspheres
(NIP). Figure 13 shows that for the MIPs, the binding efficiency increases with the
increase in the concentration of MIPs until the binding becomes independent of MIPs
concentration.
Moreover, it is hypothesized by Wei and Mizaikoff (2007) that the specific interactions
between template and monomers are related to the porosity of the molecular imprinted
59

polymers. This implies that the amount of binding sites and the pore sized distribution of
the molecular imprinted polymer materials are a critical factor in achieving the desired
MIP performance in various analytical applications.
4.1.4 Checking for impurities in the prepared MIPs
Figure 14. Chromatogram obtained after third MIP wash with 5 mL of 10 % deionised
water in methanol.
Template extraction from the prepared MIP is a crucial step as this leaves selective
cavities ready for analyte recognition. Methods that have been used by other authors to
purify MIPs beads is Soxhlet extraction followed by supercritical carbon dioxide
extraction (SFE) with CO2 at mild conditions (150 bar, 50 °C). At least a removal of
>99.7 % of the template was achieved (Bunte et al, 2007). In another study (Bravo et al,
2005), the effectiveness of the extraction was evaluated by using fluorimetric analysis of
the washing solutions containing the extracted template (collected after the successive
60

microwave-assisted extractions). It was also found that successive extractions are
therefore unnecessary when compared to the most common extraction methods
(incubation and soxhlet). Microwave-assisted extraction reduced extraction time by
several hours and in addition, less solvent was used (Bravo et al, 2005). In our studies no
impurities were found that could have interfered with analysis of other samples see
(Figure13). This procedure which was used for washing MIPs removed most of the
unwanted peaks especially around the retention time of 17β-estradiol (8 minutes). This
suggests that most of the template extraction was removed.
61

4.1.5 Quality assurance
Reproducibility
Table 4. Repeated 10 times injections of 1ppm standard solution of E2 in the
chromatographic system.
Standard solution injection Peak area
1 18.03
2 16.84
3 14.76
4 18.17
5 18.66
6 18.11
7 14.44
8 18.19
9 18.39
10 12.17
Mean 16.78 (%RSD=13.2)
The HPLC was tested for reproducibility by injecting 1 ppm of a standard solution 10
times. The standard deviation of 2.22 and RSD of 13.2 % were obtained. It can be said
that the analysis was not very reproducible since it was above 5 % RSD. This could be
attributed to 17β-estradiol behavior in water standard solution where it is not very soluble
62

Calibration curve
y = 24.432xR2 = 0.9955
020406080
100120140160180
0 2 4 6 8
Concentration (mg/mL)
Peak
are
a
Figure 15. Typical calibration curve obtained from the HPLC system.
A calibration curve was used as a method for determining of the unknown concentration
in the extracts. The plot was linear with R2 values of 0.9955 (Figure 15). This also means
that although the HPLC instrument was not very reproducible, it could be used for
quantification of concentration of the samples.
63

4.2 Optimisation experiment of the LM-MIP technique
4.2.1 Variation of the amounts of MIPs
0
20
40
60
80
100
30 60 288
Time (minutes)
Peak
are
a
0.5 mg1.5 mg7 mg
Figure 16. Plot of extraction time vs obtained peak areas with different amounts of MIP.
Figure 16 reveal that binding increases with the increase on the amounts of MIPs and
when it is given a longer extraction time. From figure 16 it is clear that much more
binding occurred when more amounts of MIP were added and this was more pronounced
at lower binding time. The effect of binding/extraction time was more pronounced at 60
minutes. Thereafter the curves tend to move towards reaching a plateau. For the
application of the LM-MIP extraction technique, an extraction time of 60 minutes was
taken as the optimum. Too long time results into low sample throughput.
From other studies, it has largely been demonstrated that MIPs offer the highest
selectivity when samples are dissolved in the solvent used for the MIPs preparation
(Pichon, 2007). In our study, toluene was used as a solvent instead of acetonitrile that was
64
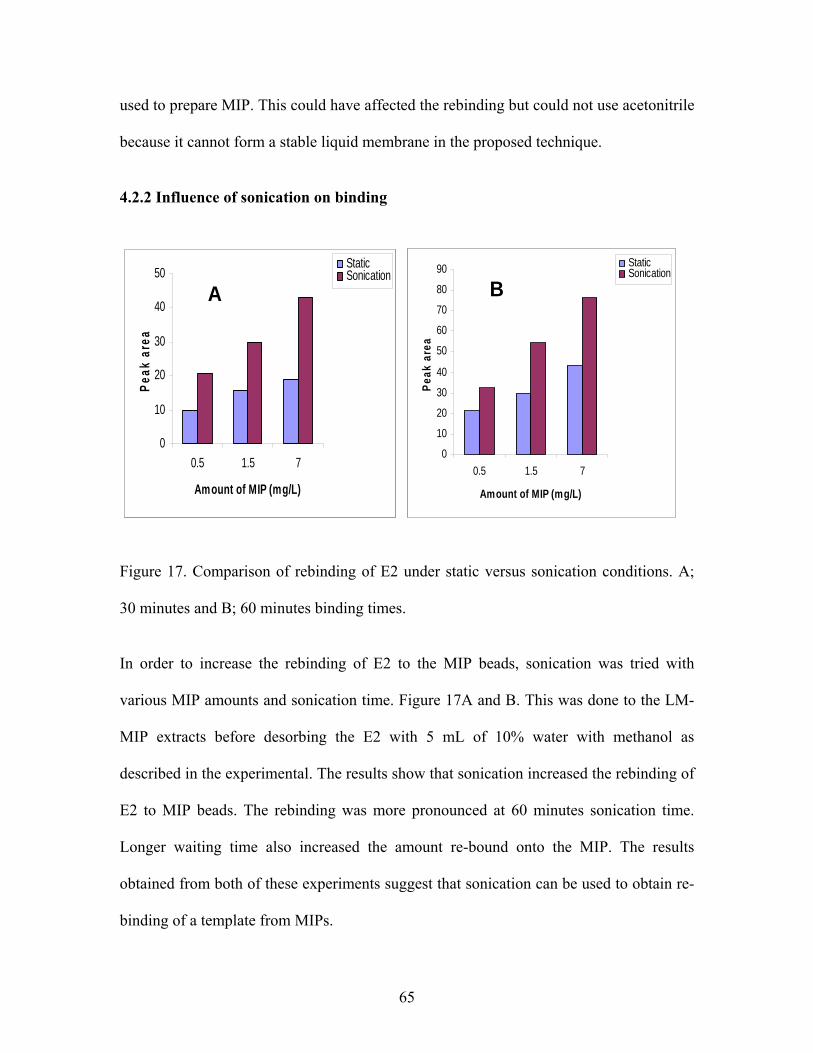
used to prepare MIP. This could have affected the rebinding but could not use acetonitrile
because it cannot form a stable liquid membrane in the proposed technique.
4.2.2 Influence of sonication on binding
0
10
20
30
40
50
0.5 1.5 7
Amount of MIP (mg/L)
Peak
are
a
Static Sonication
A
0
10
20
30
40
50
60
70
80
90
0.5 1.5 7
Amount of MIP (mg/L)
Peak
are
a
StaticSonication
B
0
10
20
30
40
50
0.5 1.5 7
Amount of MIP (mg/L)
Peak
are
a
Static Sonication
A
0
10
20
30
40
50
60
70
80
90
0.5 1.5 7
Amount of MIP (mg/L)
Peak
are
a
StaticSonication
B
Figure 17. Comparison of rebinding of E2 under static versus sonication conditions. A;
30 minutes and B; 60 minutes binding times.
In order to increase the rebinding of E2 to the MIP beads, sonication was tried with
various MIP amounts and sonication time. Figure 17A and B. This was done to the LM-
MIP extracts before desorbing the E2 with 5 mL of 10% water with methanol as
described in the experimental. The results show that sonication increased the rebinding of
E2 to MIP beads. The rebinding was more pronounced at 60 minutes sonication time.
Longer waiting time also increased the amount re-bound onto the MIP. The results
obtained from both of these experiments suggest that sonication can be used to obtain re-
binding of a template from MIPs.
65

4.2.3 Varying extraction time
0
20
40
60
80
100
120
140
160
180
15 30 60
Time (minutes)
Peak
are
a
BeforeAfterMIP w ash
Figure 18. Plot of E2 peak areas at different times in LM-MIP extraction technique.
Figure 18 shows the results of varying the extraction time in LM-MIP extraction unit.
The concentration of aqueous solution was analysed before and after extraction to
determine the amounts extracted and that remained in the sample. The re-extracted E2
which was retained by MIPs was released by adding 5 mL of 10% water in methanol
which was later sonicated for five minutes, filtered and then analysed on HPLC. From
the results obtained it was found that about 16 % of E2 was extracted to the organic phase
in 15 minutes and 12 % was re-extracted by MIPs. In 30 minutes it was found that MIPs
in the acceptor phase retained 27 % of E2 from 31 % that was extracted in the acceptor
phase. After 60 minutes about 53 % of E2 was extracted in the acceptor phase and 43 %
was MIP bound. When comparing these experiments, it was found that with 15 minutes
66

extraction time not much of E2 was extracted. More E2 was extracted with a time of 60
minutes. In this case the extraction increased about three times and MIPs. These results
agree well with those obtained in figure 18 that E2 rebinding increases with time.
4.3 Demonstration of selectivity
4.3.1 Deionised water
Time (minutes) Time (minutes)
E2
E2
Pea
k ar
ea
Peak
are
a
-270 mV
1200 mV 1200 mV
-270 mV
Time (minutes) Time (minutes)
E2
E2
Pea
k ar
ea
Peak
are
a
-270 mV
1200 mV 1200 mV
-270 mV
Figure 19. Chromatograms obtained from direct injection of deionised water spiked with
7 mg of E2 (A) and after LM-MIP extraction (B).
It can be seen from figure 19 that the two chromatograms are clean as expected since
deionised water has no matrix components. Figure 19B shows low amounts of E2
detected after extraction with LM-MIP extraction technique. This could be due to the
rebinding of E2 from the bulk acceptor solution onto the MIP beads.
67

4.3.2 River water extraction
Time (minutes)
Pea
k ar
ea
Unknown
E2Spiked
Unspiked
-270 mV
1200 mV
Time (minutes)
Pea
k ar
ea
Unknown
E2Spiked
Unspiked
-270 mV
1200 mV
Figure 20. Comparison of the selectivity of LM-MIPs technique in river water
Chromatograms were obtain from direct injection of unspiked and after LM-MIP
extraction of new water spiked with7 mg of E2.
Figure 20 demonstrates the selectivity of the LM-MIP technique. When river water was
injected directly, unknown compound was detected, but after the extraction with the
technique it was eliminated. This high lights the novelty of adding MIP beads in the
organic acceptor solution. The results are however not surprising since MIPs are known
to be specific for the template molecule.
68

4.3.3 Urine extraction
1200 mV
-270 mV
Time (minutes)
E2
Unknown Without MIP
With MIP
Pea
k ar
ea
1200 mV
-270 mV
Time (minutes)
E2
Unknown Without MIP
With MIP
Pea
k ar
ea
Figure 21. Comparison of selectivity after extraction urine spiked with 7 mg/L E2 with
and without MIP beads incorporated in the organic acceptor.
Biologically estrogens are present in biological tissues and fluids mainly as water-soluble
conjugates with high polarity, i.e., estrogen sulfates and glucuronides, instead of the free
compounds. The three major occurring estrogens in woman are estrone, estriol and
estradiol. It was thus important to test the selectivity of the LM-MIP by extracting spiked
urine samples. Further prospective epidemiological studies have suggested that additional
estrogen, whether from endogenous or exogenous sources, may be associated with the
development of breast cancer promotion and tumor growth (Zhang and Henion, 1996).
69

Figure 20 demonstrates the selectivity obtained. With the organic solvent (toluene) as the
extracting acceptor phase, only other unwanted peak is observed in the chromatograms.
After the addition of MIP beads, the peak disappears emphasizing the selectivity of the
proposed techniques. The presence of the other peak shows that membrane extraction is
not very selective. In this case most of other compounds from the sample were extracted
too. It should be noted that the liquid membrane with organic acceptor is not very
selective since selectivity is based on differences in partition coefficient of the sample
components into the organic liquid (Yang et al, 2002). The E2 peak after LM-MIP
extraction is smaller due to slow re-binding of E2 onto MIP beads in the organic acceptor
solution.
4.3.4 Fruit sample
Different types of fruits sample and other samples were also analysed in order to study
the selectivity of LM-MIP extraction technique. Apple, water melon and tea (eleven
o’clock, rooibois) were chosen because they represent a wider variety of matrices. E2 is
not found in fruits sample but these samples were used to just test the selectivity of the
LM-MIP combination.
70
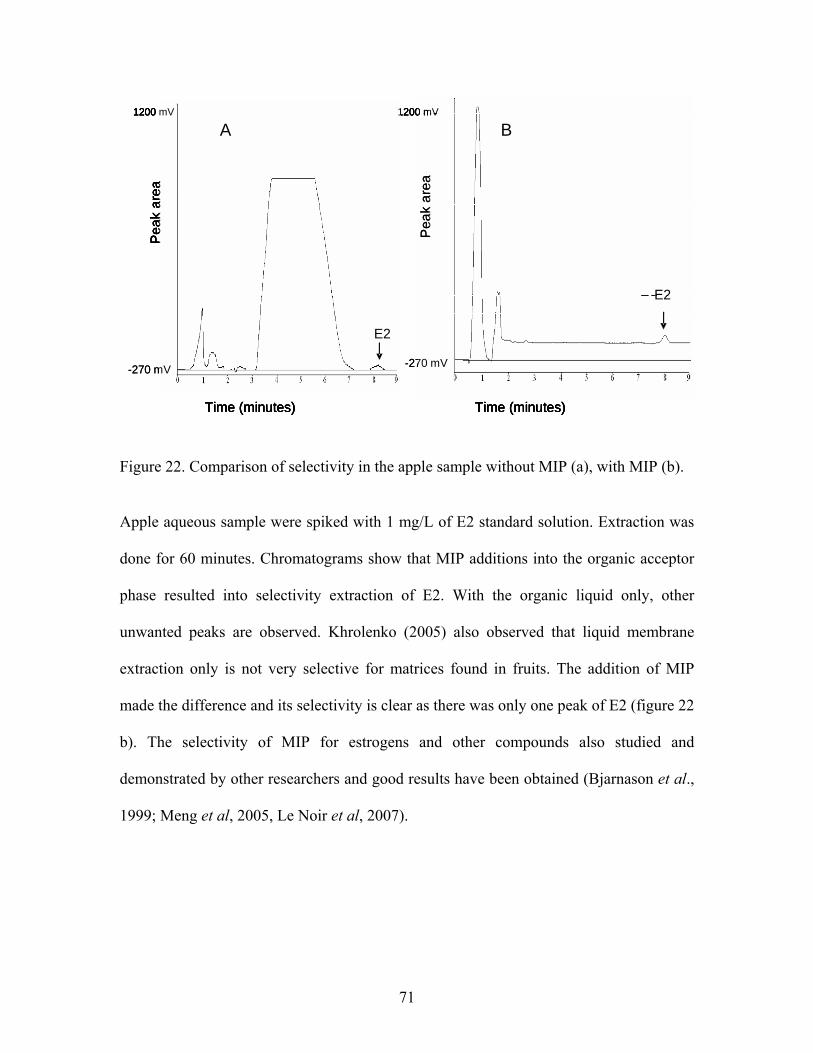
Time (minutes)
Peak
are
a
1200 mV 1200 mV
A B
E2
E2
Pea
k ar
eaTime (minutes)Time (minutes)
Peak
are
a
1200 mV 1200 mV
A B
E2
E2
Pea
k ar
eaTime (minutes)
-270 mV -270 mV
Time (minutes)
Peak
are
a
1200 mV 1200 mV
A B
E2
E2
Pea
k ar
eaTime (minutes)Time (minutes)
Peak
are
a
1200 mV 1200 mV
A B
E2
E2
Pea
k ar
eaTime (minutes)
-270 mV -270 mV
Figure 22. Comparison of selectivity in the apple sample without MIP (a), with MIP (b).
Apple aqueous sample were spiked with 1 mg/L of E2 standard solution. Extraction was
done for 60 minutes. Chromatograms show that MIP additions into the organic acceptor
phase resulted into selectivity extraction of E2. With the organic liquid only, other
unwanted peaks are observed. Khrolenko (2005) also observed that liquid membrane
extraction only is not very selective for matrices found in fruits. The addition of MIP
made the difference and its selectivity is clear as there was only one peak of E2 (figure 22
b). The selectivity of MIP for estrogens and other compounds also studied and
demonstrated by other researchers and good results have been obtained (Bjarnason et al.,
1999; Meng et al, 2005, Le Noir et al, 2007).
71

4.4 Comparison of LLE and LM-MIP extraction technique for the extraction of
apple sample
Time (minutes) Time (minutes)
E2
Pea
k ar
ea
Pea
k ar
eaE2
A B
-270 mV
1200 mV
-270 mV
1200 mV
Time (minutes) Time (minutes)
E2
Pea
k ar
ea
Pea
k ar
eaE2
A B
-270 mV
1200 mV
-270 mV
1200 mV
Figure 23. (a) Analysis of apple sample using LLE and Figure (b) Analysis of apple using
LM-MIP extraction technique.
From the results showed in the figure 23, it can be seen that with LLE not much of E2
recovered and other compounds were extracted along. In this case liquid-liquid extraction
was only performed once not with repeated extraction of the same sample three times
which is the standard procedures. It was also stated that When LM-MIPs technique used
for extraction of the same sample, more E2 was extracted with very good selectivity.
72

4.5 Preconcentration factors
Table 5. Summary of the enrichment factors in various samples.
Spiked
(mg/L)
Determined
concentration
Enrichment
factor
Bound onto
MIP beads
(acceptor)
Tea 1.0 0.915 0.9
Apple 1.0 0.969 0.9
River 7.0 2.9 0.4
Urine 7.0 3.2 0.4
In hexane
(acceptor)
Tea 1.0 1.590 1.6
Apple 1.0 1.707 1.7
River water 7.0 5.3 0.7
Urine 7.0 5.1 0.7
Table 3 gives a summary of enrichment factors obtained in various samples from that
found in the organic acceptor phase and from that bound onto MIP beads in the acceptor
organic phases. First, results shows that the enrichment factors from the MIP are low in
all the samples. This is due to poor re-binding of E2 onto MIP beads. The organic phase
contained more E2 than that bound onto MIP. The effects to increase the rebinding with
sonication did significantly improve the results neither the addition of more MIP beads.
Other method such as ultrasound assisted rebinding will have to be tried in future.
73

CHAPTER 5: CONCLUSION AND RECOMMENDATION
5.1 Conclusions
A new novel extraction technique for environmental and biological samples was
developed. The technique is based on the combination of liquid membrane (LM) and
molecular imprinted polymer (MIP) technologies. The developed technique was tested by
applying it to river water, urine and apple sample. It was found to be selective to E2 from
other compounds in these samples
MIPs for E2 were successfully prepared using precipitation polymerization which
produces spherical microspheres and the convectional bulk polymerization which
produces block monolith. In evaluation of these polymerization methods it was found that
a high yield of spherical microspheres were produced compared to the block monolith. In
addition precipitation polymerisation method is simple and it takes less time compared to
convectional bulk method as it does not require crushing and sieving of the polymers.
5.2 Recommendations
• The developed LM-MIPs extraction technique though showed high selectivity, the
enrichment factors were low. The technique therefore need further optimization to
increase the enrichment factors such as trying different organic liquids as acceptor
phase and using ultra sound to assist the rebinding of E2.
• Testing the new technique to other organic pollutants such as triazine and
polyaromatic hydrocarbons in various complex samples.
74

REFERENCES
Allender, C. J. (2005). Theme Editor, Molecularly imprinted polymers: technology and
applications. Advanced Drug Delivery Reviews. 57, 1731-1732.
Anderson, H.S., Karlsson, J.G., Piletsky, S.A., Koch-Schmidt, A.C., Mosbach, K.,
Nichol!s, I.A. (1999) Study of the Natute of Recognition in Moleculatly Imprinted
Polymers. II. [1] Influence of Monomer- Template Ratio and Sample Load on Retention
and Selectivity. Journal of Chromatography. 848, 39-49.
Archardy, R.; Mosbach, K. (1981). Synthesis of substrate selective polymers by host-
guest polymerisation. Journal of molecular catalysis. 182, 687-692.
Arthur, C.L., Pawliszyn. J.B. (1990). Solid-phase microextraction (SPME), based on
extraction by a coated. Journal of analytical chemistry. 62, 2145-2161.
Ata, O. Nand Çolak, S. (2005). Modelling of zinc transport through a supported liquid
membrane. Hydrometallurgy. 80, 155-162
Audunsson, G. (1986). Aqueous/aqueous extraction by means of a liquid membrane for
sample cleanup and preconcentration of amines in a flow system. Journal of analytical
chemistry. 58, 2714 –2723.
Audunsson, G. (1986). Aqueous/aqueous extraction by means of a liquid membrane for
sample cleanup and preconcentration of amines in a flow system. Journal of analytical
Chemistry. 58, 2714–2723.
75

Audunsson, G. (1988). Determination of low parts per billion levels of amines in urine
by liquid membrane cleanup directly coupled to a gas-liquid chromatograph. Journal of
analytical chemistry. 60, 1340 –1347.
Beltran, J.; López, F.J; Hernández, F. (2000). Solid-phase microextraction in pesticide
residue analysis. Journal of Chromatography. 885, 389-404.
Bernhardsson, B., Martin, E and Johansson, G. (1985). Solute transfer in on-line
analytical flow-through dialyzers. Anal Chim Acta. 167, 111-122.
Bjarnason, B., Chimuka, L and Ramstrom, O. (1999). On-line solid phase extraction
of triazine herbicides using a molecularly imprinted polymer for selective sample
enrichment, Jopurnal of analytical chemistry. 71, 2152-2156.
Bone, S.R.M., Sharp, J.R and Barry L. (2005). Applications of a novel flame ionisation
detector for liquid chromatography. Scientific limited. 86, 2134-2346.
Braun, R.D. (1987). Introduction to instrumental analysis: Chemistry series. McGraw-
Hill international, New York, U.S.A.
Bravo, J.C., Ferna´ndez, P and Duranda, J.S. (2005). Flow injection fluorimetric
determination of b-estradiol using a molecularly imprinted polymer. Analyst. 30, 1404-
1409.
Bunte, G., Hürttlen, J., Pontius, H., Hartlieb, K and Krause, H. (2007). Gas phase
detection of explosives such as 2,4,6-trinitrotoluene by molecularly imprinted polymers.
Analitical. Chimica. Acta. 591, 49-56.
76

Carasek, E and Pawliszyn, J. (2006). Screening of Tropical Fruit Volatile Compounds
Using Solid-Phase Microextraction (SPME) Fibers and Internally Cooled SPME Fiber.
Journal. Agric. Food Chem. 54, 8688 -8696.
Chiarizia, R. (1991). Stability of supported liquid membranes containing long-chain
aliphatic-amines as carriers. Journal of membrane science. 55, 65–77.
Chimuka, L., Cukrowska, E and Jönsson J.A. (2004). Why liquid membrane
extraction is an attractive alternative in sample preparation. Pure Applied. Chemistry.76,
707–722.
Chimuka, L., Nindi, M.M, and Jöhsson, J.Å. (1997). Supported liquid membrane
enrichment studies of natural water samples applied to liquid chromatographic
determination of triazine herbicides. Int. Journal. Environmental. Analytical chemistry.
68, 429 –445.
Christie, W. W. (1992). Solid-phase extraction columns in the analysis of lipids.
Advances in Lipid Methodology. 1, 1-17.
Cukrowska, E., Chimuka, L., Nsengimana, H Kwaramba, V. (2004). Application of
supported liquid membrane probe for extraction and preconcentration of organotin
compounds from environmental water samples, Analitical Chimica Acta. 523, 141-147.
Danesi, P.R. (1984). Separation of metal species by supported liquid membranes.
Seperation. Science. Technoogyl. 19, 857–894.
77

Danesi, P.R. (1987). Lifetime of supported liquid membranes: the influence of interfacial
properties, chemical composition and water transport on the long-term stability of the
membranes. Journal of Membrane Science. 31, 117–145.
David, F and Sandra P. (2007). Stir bar sorptive extraction for trace analysis. Journal
of Chromatography A. 1152, 54-69.
Djane, N.K., Bergdahl, I..A., Ndung’u, K., Schütz, A., Johansson, G and
Mathiasson, L. (1997). Supported liquid membrane enrichment combined with atomic
absorption spectrometry for the determination of lead in urine. Analysts. 122, 1073-
1077.
Dong, C., Mei, Y and Chen, L. ( 2006). Simultaneous determination of sorbic and
benzoic acids in food dressing by headspace solid-phase microextraction and gas
chromatography. Journal of Chromatography A. 1117, 109-114
Fackrell, J.E.. (1980). A flame ionization detector for measuring fluctuating
concentration. Journal of Physics E - Scientific Instrument. 13, 887-894
Faust, C.B. (1992). Modern chemical techniques. The royal society of chemistry.
London, U.K.
Fucci , N., De Giovanni, N and Chiarotti, M. (2003). Simultaneous detection of some
drugs of abuse in saliva samples by SPME technique. Forensic Science International. 24,
40-45.
78

Gasser, M.S., and Daoud, J.A. (2007). Extraction of Co(II) from aqueous solution using
N.E. El-Hefny. Clinical Oncology. 36, 1783-1793.
Harries, J.E., Sheahan, D.A., Jobling, S., Matthiessen, P., Neall, P., Sumpter, J.P.,
Tylor, T. and Zaman, N. (1997). Estrogenic activity in five United Kingdom rivers
detected by measurement of vitellogenesis in caged male trout. Environmental
Toxicology & Chemistry. 16, 534-542.
He, C., Liu, F, Li, K and Liu, H. (2006). Molecularly Imprinted Polymer Film Grafted
from Porous Silica for Selective Recognition of Testosterone. Analytical Letters. 39, 275–
286.
Helrich, K. (1990). Official Methods of Analysis of the Association of Official Analytical
Chemists. 15th ed. Association of Official Analytical Chemist: Virginia.
Holbrook, D., Love, N.G and Novak, J.T. (2004). Sorption of 17β-Estradiol and 17 -
Ethinylestradiol by Colloidal Organic Carbon Derived from Biological Wastewater
Treatment Systems. Environ. Sci. Technol. 38, 3322 -3329.
http://www.boomer.org/c/p3/c03/c0305.html, HPLC instrument, assessed Jan, 2003.
http://www.cambustion.com/instruments/hfr500/fidprinciple.html Fast FID principles,
(1987) assessed in 2007.
http://www.chemistry.adelaide.edu.au/external/soc-rel/content/spe.htm,solidphase
extraction, University of adelaide; Australia.
79

http://www.chromatography-online.org/GC/GC-Columns/rs19.html Gas
chromatography, 2007, assessed in 2000.
Jacobsen, A.M., Lorenzen, A., Chapman, R and Topp E.. (2005). Persistence of
Testosterone and 17β-Estradiol in Soils Receiving Swine Manure or Municipal Biosolids.
Journal of environmental quality, 34, 861-871.
Jönsson, J.Å and Mathiasson, L. (1996). Liquid membrane extraction in analytical
sample preparation. Journal of Chromatography A. 18, 318-325.
Jönsson, J.A and Mathiasson, L. (1999). Liquid membrane extraction in analytical
sample preparation. TrAC Trends in Analytical Chemistry. 18, 5318-325.
Jönsson, J.A., Mathiasson, L., Chimuka, L. and Cukrowska, E. (2003). Membrane
techniques for analysis, sampling and speciation in environmental measurement.
Analitical Chemistry. 84-109.
Jönsson, J.Å. and Mathiasson, L. (2000). Membrane extraction techniques in
bioanalysis. Analytica Chimica Acta. 52, 1612-112.
Nabieyan, B., Kargari, A and Kaghazchi, T. (2007). Bench-scale pertraction of iodine
using a bulk liquid membrane system. Desalination. 214, 167-176.
Khrolenko, M.V and Wieczorek, P.P. (2005). Determination of glyphosate and its
metabolite aminomethylphosphonic acid in fruit juices using supported-liquid membrane
preconcentration method with high-performance liquid chromatography and UV
80
detection after derivatization with p-toluenesulphonyl chloride. Journal of
chromatography. 1093, 111-117.
Kislik, V.S. Eyal, and A.M. (1996). Hybrid liquid membrane (HLM) and supported
liquid membrane (SLM) based transport of titanium (IV). Journal of membrane science.
111, 273–281.
Knox, J.H. and Kauer, B. (1989). High Performance Liquid Chromatography.
Analitical Chemistry. 98, 189-198.
Kocherginsky, N. M., Yang, Q and Seelam, L. (2006). Recent advances in supported
liquid membrane technology. Separation and Purification Technology. 53, 171-177.
Kralj, D and Brecevic, L.. (1998). Precipitation of some slightly soluble salts using
emulsion liquid membranes. Laboratory for precipitation process. 71, 1049-1060.
Kriz, D., Ramström, O and Mosbach, K. (1997). Molecular imprinting new possibility
for sensor technology. Analitical Communications. 69, 345-349.
Le Noir, M., Lepeuple, A., Guieysse, B and Mattasson, B. (2007). Selective removal
of 17β-estradiol at trace concentration using a moleculary imprinted polymer, water
research. Journal of chromatography B. 41, 2825-2831.
Lee, J.Y., Lim, D.P and Lim, D.S. (2007). Tribological behavior of PTFE
nanocomposite films reinforced with carbon nanoparticles. 38, 810-816.
81
Lehrle, R.S., Rollinson M., Dadvand N., Parsons I.W. (1999). Mass spectrometry
detection versus flame ionisation detection in pyrolysis-gas chromatography: spurious
pyrolysis peaks and possible errors in estimating relative product yields. Polymer
Degradation and Stability. 66, 221-231.
Li, N.N. (1968). Liquid surfactant membranes. Chemistry. Society. 36, 610-794
Liu, J. F., Liang, X, Jiang, G. B., Cai, Y.Q., Zhou, Q. S and Liu, G. G. (2003). High
performance liquid chromatography for the determination of 4-nonylphenol, 4-tert-
octylphenol,and their short ethoxyl chain polyethoxylates inwater samples using a
microporous membrane liquid-liquid extraction sample pretreatment technique. Journal
of Separation Science. 76, 344-353.
Lord, H. and Pawliszyn, J. (2000). Micro extraction of drugs. Journal of
Chromatography B. 902, 17–63.
Luciano, A.T., Jarbas, R.R., José, R.S. (2006). Determination of pentavalent antimony
in antileishmaniotic drugs using an automated system for liquid-liquid extraction with
on-line detection. Talanta. 68, 1536-1543.
Matsumoto, K., Tsukahara, Y., Uemura, T., Tsunoda, K., Kume, H., Kawasaki,
Tadano, S.J and Matsuya, T. ( 2002). Highly sensitive time-resolved fluorometric
determination of estrogens by high-performance liquid chromatography using a β-
diketonate europium chelate. Journal of Chromatography B: Analytical Technologies in
the Biomedical and Life Sciences. 773, 135-142.
82

Matsumuro, M., Sankai, T., Cho, F., Yoshikawa, V and Yoshida, T. (1999). A two-
step extraction method to measure fecal steroid hormones in female cynomolgus
monkeys. Journal of primatology. 48, 291-298.
Mayes, A.G and Whitcombe M.J. (2005). Synthetic strategies for the generation of
molecularly imprinted organic polymers. Food research. 57, 1742-1778.
McCarthy, A. (2001). Methods for analysis and detection. Cambridge university press,
United Kingdom.
Meng, Z., Chenand, W., and Mulchandani, A. (2005). Removal of estrogenic
pollutants from contaminate water using molecularly imprinted polymers.
Environmental. Science. Technology. 39, 8958-8962.
Mishra, V and Joy, K.P. (2005). HPLC-electrochemical detection of ovarian estradiol-
17β and catecholestrogens in the catfish (Heteropneustes fossilis): Seasonal and
periovulatory changes. General and Comparative Endocrinology. 145, 84-91.
Msagati, T.A.M and Nindi M.M. (2004). The use of supported liquid membranes in the
extraction of macrolides in biomatrices. Microchimica. Acta. 148, 199 –214.
Msagati, T.A.M and Nindi, M.M. (2001). Determination of benzimidazole anthelmintic
compounds by supported liquid membrane extraction and liquid chromatography.
Journal. Separation. Science. 24, 606 –614.
83

Msagati, T.A.M. and Nindi, M.M. (2005). Determination of b-lactam residues in
foodstuffs of animal origin using supported liquid membrane extraction and liquid
chromatography–mass spectrometry. Food chemistry. 100, 836-844.
Namera, A., Yashiki, M., Nagasawa, N., Iwasaki, Y and Kojima, T. (1996). Rapid
analysis of malathion in blood using head space-solid phase microextraction and
selected ion monitoring. Forensic science. 88, 125-131.
Ndung’u K, Djane NK, Malcus F, Mathiasson L. (1999). Ultrasonic extraction of
hexavalent chromium in solid samples followed by automated analysis using a
combination of supported liquid membrane extraction and UV detection in a flow system.
Analyst. 124, 1367-1372.
Ndung’u, K., Djane, N.K, Mathiasson, L. (1998). Determination of trace metal ions in
river water by ion-pair chromatography after using supported liquid membrane. Journal.
Chromatophy A. 826, 103-108.
Nigel, J.K., Simpson, L., and Dekker, M. (2000). New York, Solid phase extraction.
18, 528-536.
Olsen, J., Martin, P. and Wilson, I.D. (1998). Molecular imprints as sorbents for solid
phase extraction : potential and applications. Analitical communications. 35, 13–14.
Perez-Moral, N and mayes A.G. (2003). Comparative study of imprinted polymer
particles prepared by different polymerization methods. Analytica chimica acta. 504, 15-
21.
84

Pichon, V. ( 2007). Selective sample treatment using molecularly imprinted polymers.
Journal of chromatography A. 1152, 41-53.
Pieper and Rutledge. (1989). Laboratory Techniques for Pharmacists. Health science.
27.
Pinacci, P and Radaelli, M. (2002). Recovery of citric acid from fermentation broths by
electrodialysis with bipolar membranes. Desalination. 148, 177-179.
Pojana, G., Bonfà, A., Busetti, F., Collarin, A and Marcomini, A. (2004).
Determination of natural and synthetic estrogenic compounds in coastal lagoon waters
by HPLC-electrospray-mass spectrometry. International Journal of Environmental
Analytical Chemistry. 84, 729-738.
Pojana, G., Gomiero, A., Jonkers, N and Marcomini, A. ( 2007). Natural and
synthetic endocrine disrupting compounds (EDCs) in water, sediment and biota of a
coastal lagoon. Environmental Toxicology and Chemistry. 23, 929-936.
Poole, C.F and Wilson I.D. (2000). Special issue on solid-phase extraction. J.
Chromatogr. 885, 801-809.
Pratt, K.F and. Pawliszyn, J. (1992). Gas Extraction Dynamics of Volatile Organic
Species from Water with a Hollow Fibre Membrane. Anal. Chem. 64, 2101 2106.
Psillakis, E., Naxakis, G and Kalogerakis, N. (2000). Detection of tnt-contamination in
spiked-soil sample using SPME and GC/MS. Int. J. 2, 227-235.
85

Raloff, J. (2003). Nonstick surfaces can turn toxic at high heat - Sticky Situation -
polymer-fume fever caused by teflon and other non-stick cooking surfaces. Science
Service. 72, 443-450.
Ramström, O and Ansell, R.J. (1998). Molecular imprinting technology: challenges and
prospects for the future. Chirality. 10, 295-209.
Ramström, O. (1996). Molecular imprinting technology. Bio/Technology. 1-17.
Ramström, O., Yan M. (2003). Editors, Molecularly Imprinted Materials: Science and
Technology, Marcel Dekker, New York. 181.
Robards, K., Haddad, P.R., and P.E. Jackson. (1994) Principles and Practice of
Modern Chromatographic Methods. Academic Press. 35, 1135.
Sandahl, M., Úlfsson, E and Mathiasson, L. (2000). Automated determination of
Vinclozolin at the ppb level in aqueous samples by a combination of microporous
membrane liquid–liquid extraction and adsorption chromatography. Analytica Chimica
Acta. 424, 1-5.
Schoeff, M.S. and Williams, R.H. (1993). Principles of Laboratory Instruments.
Acadermis press. 33, 163-169.
Sedlak, D. (2005). The Fate of Hormones in the Aquatic Environment. Environmental
Toxicology and Chemistry. 77, 24-31.
86

Sellergren, B. (1998). Noncovalent molecular imprinting: antibody-like molecular
recognition in polymeric network materials. TrAC Trends in Analytical Chemistry.
16, 310-320.
Simpson, N.J.K and Dekker, M. (2000). Solid-phase Extraction: Principles,
Techniques, and Applications. New York, 349-360.
Smith, R.M. (2005). Before the injection-modern methods of sample preparation for
separation technique. Journal of Chromatography.A. 1000, 3-27.
Takeuchi, H., Takahashi, K and Wataru, G. (1987). Some observations on the stability
of supported liquid membranes. Journal of membrane science. 34 , 19-31.
Valcárcel, M. and Luque de Castro, M.D. (1991). Non-Chromatographic Continuous
Separation Techniques. The Royal Society of Chemistry. 509, 47-56.
Van de Merbel, N.C. and Brinkman, U.A. (1993). On-line dialysis as a sample-
preparation technique for column liquid chromatography. TrAC Trends in Analytical
Chemistry. 12, 249-256.
Vlatakis, G., Anderson, L.I., Müller, R and Mosbach, K. (1993). Drug assay using
antibody mimics made by molecular imprinting. Nature. 361, 645-647.
Wang, L., Cai, Y.O., He, B., Yuan, C.G., Shen, D.Z., Shao, J and Jiang, G.B. (2006).
Determination of estrogens in water by HPLC–UV using cloud point extraction. Talanta,
70, 47-51.
87
Wang, W., Howdle, S.M and Yan, D. (2005). One-step seed dispersion polymerisation
in supercritical carbon dioxide. Chemistry.Communications. 31, 3939-3941.
Wardencki, W, Curyło, J and Namieśnik, J. (2006). Trends in solventless sample
preparation techniques for environmental analysis. Journal of Biochemical and
Biophysical Methods. 70, 275-288.
Watabe, Y.M., Kubo, T., Nishikawa, T., Fujita, T., Kaya, K and Hosoya, K. (2006).
Fully automated liquid chromatography–mass spectrometry determination of 17β-
estradiol in river water. Journal of Chromatography A. 1159, 252-259.
Wei, S and Mizaikoff, B. (2007). Binding site characteristics of 17β-estradiol imprinted
polymers. Biosensors and Bioelectronics. 21, 1-9.
Wei, S., Molinelli, A and Mizaikoff, B. (2005). Molecularly imprinted micro and
nanospheres for the selective recognition of 17β-estradiol. Biosensors and
Bioelectronics. 21, 1943-1951.
Wodzki, R. and Sionkowski, G. (1995). Recovery and concentration of metal-ions. 2.
Multimembrane hybrid system. Seperation. Science. Technology. 30, 2763–2778.
www.jenck.com/aplicaciones_gcms.htm, Analysis of Water sample using GC/MS -
Acrylamide-. 47. LA146-E020.
Xu, X., Zhu, L., and Chen, L. (2004). Separation and screening of compounds of
biological origin using molecularly imprinted polymers. Journal of chromatography B.
801, 61-69.
88

Yan, H and Ho Row, K. (2006). Characteristic and synthetic approach of Molecular
imprinted. International. Journal. Molecular. Science. Korea. 7, 155-178.
Yan, M and Ramström, O. Molecularly Imprinted Materials: Science and Technology
Marcel Dekker; New York, 2005.
Yang, R. and Xie, W. (2006). Determination of cannabinoids in biological samples
using a new solid phase micro-extraction membrane and liquid chromatography–mass
spectrometry. Forensic science. 162, 135-139.
Yang, X.J. and Fane, T. (1997). Effect of membrane preparation on the lifetime of
supported liquid membrane. Journal. Membrane. Sci. 133, 269–273.
Yang, X.J., Fane, A.G and Soldenhoff, K. (2002). Comparison of Liquid Membrane
Processes for Metal Separations: Permeability, Stability, and Selectivity. Ind. Eng.
Chem. Res. 42, 392 -403.
Ye, L and Mosbach, K. (2001). Molecularly imprinted microspheres as antibody
binding mimics. Reactive and functional polymers. 48, 149-159.
Ye, L., Cormack, P.A.G and Mosbach, K. (2001). Molecular imprinting on microgel
spheres. Analytica Chimica Acta, 435, 187-196.
Ye, L., Cormack, P.A.G. and Mosbach, K. (1999). Molecularly imprinted
monodisperse microspheres for competitive radioassay. Analitical.Communication. 36,
35 – 38.
89

Ye, L., Ramström, O., Ansell, R J., Månsson, M.O and Mosbach, K. (1998), Use of
Molecularly Imprinted Polymers in a Biotransformation Process. Biotechnology and
Bioengineering. 64, 650-655.
Ye, L., Weiss R. and Mosbach, K. (2001). Macromolecules. Analytical.chem. 33, 8239.
http://www.answers.com/topic/liquid-liquid-extraction Liquid-liquid extraction, assessed
in 2007.
Ye, L., Weiss, R and Mosbach, K. (2000). Synthesis and Characterization of
Molecularly Imprinted Microspheres. Macromolecules. 33, 8239-8245.
Yi, S.S., Lu, Y.C and Luo, G.S. (2004). An in situ coupling separation process of
electro-electrodialysis with back extraction. Journal of Membrane Science. 284, 134-137.
Yoon, Y., and Westerhoff, P., Snyder, S. A and Esparza, M. (2003). HPLC-
fluorescence detection and adsorption of bisphenol A, 17β-estradiol, and 17α-ethynyl
estradiol on powdered activated carbon. Journal of material science technology. 37,
3530-3537.
Yoshimatsu, K., Reimhult, K., Krozer, A., Mosbach, K., Sode, K and Ye, L. (2006)
Uniform molecularly imprinted microspheres and nanoparticles prepared by
precipitation polymerization: The control of particle size suitable for different analytical
applications. Analytica Chimica Acta. 584, 112-121.
Zhang, H and Henion, J. (1999). Quantitative and Qualitative Determination of
Estrogen Sulfates in Human Urine by Liquid Chromatography/Tandem Mass
90

Spectrometry Using 96-Well Technology. Bioanalysis and Biotransformation Research
71, 3955 -3964.
91

APPENDIX
Appendix 1. Figures of chromatograms for standards solution and those which were
determined during extraction experiments.
Time (minutes)
Pea
k ar
ea
Pea
k ar
ea
Time (minutes)
E2
E2A B
-270 mV
1200 mV
-270 mV
1200 mV
Time (minutes)
Pea
k ar
ea
Pea
k ar
ea
Time (minutes)
E2
E2A B
-270 mV
1200 mV
-270 mV
1200 mV
Figure 24. Chromatograms of 0.5 mg/L (A) and 7 mg/L (B) E2 standards solution
while using the C8 column
92
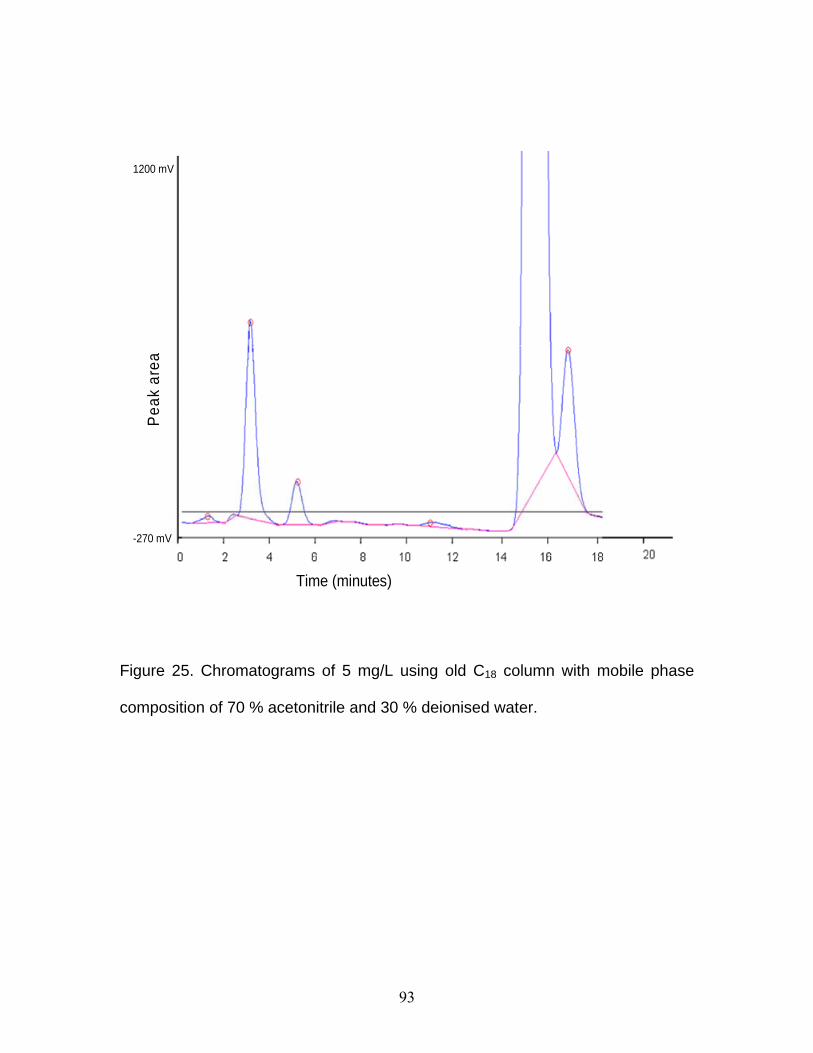
Peak
are
a
-270 mV
1200 mV
Time (minutes)
Peak
are
a
-270 mV
1200 mV
Time (minutes)
Figure 25. Chromatograms of 5 mg/L using old C18 column with mobile phase
composition of 70 % acetonitrile and 30 % deionised water.
93

Appendix 2. Viewing of the polymer using optical microscope
Figure 26. MIPs at 100x
Figure 27. NIP at 100x
94

Appendix 2. Tables of values determined during extraction of river water
and urine samples
Table 6. Values of Plot of extraction time vs obtained peak areas with
different amounts of MIP
0.5 mg 1.5 mg 7 mg
30 minutes 25.4542 49.9512 69.5522
60 minutes 39.0058 57.7252 77.9706
288 minutes 45.1856 59.8624 85.1856
95

Table 7. Values for varying extraction time
60 minutes 30 minutes 15 minutes
Before 166.3832 166.3832 166.3832
166.3832 166.3832 166.3832
166.3832 166.3832 166.3832
Mean 166.3832 166.3832 166.3832
After 76.7456 64.4608 40.9968
97.9548 78.0056 45.7528
79.0080 72.3915 58.7166
Mean 84. 5695 71.6193 48.4887
MIP wash 76.1412 51.7510 36.4780
100.3008 92.8026 34.0080
81.5920 61.6486 43.4652
Mean 86.0113 68.7341 37.9737
96

Table 8. The mean values of varying extraction time
15 minutes 30 minutes 60 minutes
Before 166.383 166.383 166.383
After 141.155 115.953 77.9028
MIP wash 21.3171 43.4007 80.0113
Table 9. Static versus sonication values in 30 minutes
0.5 mg 1.5 mg 7 mg
Static 9.9942 15.5232 18.9856
Sonication 20.9706 29.9512 43.1856
Table 10. Static versus sonication values in 60 minutes
0.5 mg 1.5 mg 7 mg
Static 21.6542 29.8624 43.231
Sonication 32.4556 54.2113 76.6343
97

Appendix 2. Summary of parameters for LM-MIP technique
UV detection wave length 220 nm
Mobile phase 60 % deionised water and 40 %
Acetonitrile
Running time 8 minutes
Retention time of E2 6 minutes
Mass of MIP 7 mg
Aqueous phase (Sample) 37 mL
Organic phase (Toluene) 2.5 mL
MIP wash Wash solution 10 % deionised water in methanol
Extraction time 15, 30, 60 minutes
98
99
Trouble shooting with HPLC
How to start the instrument
Firstly the mobile phase should be sonicated for at least 40minutes. Switch on the
detector, the HPLC instrument then the computer. Immediately when it starts pumping,
the purge button must be opened in order to remove the bubbles. Wait until there is no
more air bubble. Purging should be done for at least 5-10minutes. If there is an air bubble
inside the instrument it can be noted by the fluctuation/instability in the detector. To
know where the bubble is located in the instrument, first can switch off the pump, if the
numbers in the detector still keep on changing then will know that the bubble is stuck in
the detector but if not then it should be somewhere perhaps in the column.
To get read of that bubble, the column should be disconnected so that the pump could be
increased to high flow rate. But if the bubble still is not coming out then ethanol should
replace the current mobile phase and pumped through the system as the bubble does not
dissolve the bubble therefore ethanol can remove the bubble from the system. However
ethanol should not pumped for a long time but at least 30-40min and that should be done
without column connected. After pumping ethanol to the system, replace the current
mobile phase and pump it for 30-40min to remove ethanol from the system and that
should be done before column connected again. When the column connected after that
period and the detector still unstable, the column can be disconnected from the other end
and pump for some time and again can be connected. Another thing, the bubbles can be
overcame by filtering the mobile phase and then sonicate it. It really reduce the problem
of the bubbles to the system.