Embed Size (px)
Citation preview

Development of High-Speed UltrawidebandGround-Penetrating Radar for Rebar Detection
Xianlei Xu1; Tian Xia2; Anbu Venkatachalam3; and Dryver Huston, M.ASCE4
Abstract: This paper describes the development of new air-coupled ultrawideband ground-penetrating radar (GPR) for highway pavementand bridge deck inspections that can achieve high spatial resolution and high inspection performance while operating on vehicles driving atregular highway speeds. Themajor design features include dual-frequency band operation, 8 gigasamples per second high-speed real-time dataacquisition, high-speed large volume data transmission and storage, and customized signal-processing algorithms for GPR image enhancementand feature extractions. For design validations, steel reinforcing bar detection experiments in various setups are conducted. The measurementresults show good agreement with the subsurface feature configurations. DOI: 10.1061/(ASCE)EM.1943-7889.0000458. © 2013 AmericanSociety of Civil Engineers.
CE Database subject headings: Structure reinforcement; Sampling; Imaging techniques; Radar.
Author keywords: GPR system; Rebar detection; High-speed real-time sampling; Air coupled; Imaging processing.
Introduction
The development of noninvasive techniques to identify and classifysubsurface features has generated interest in a wide variety of ap-plicationfields, such as oil and gas exploration, geology, conduit andpipe localization, and archeology (Pasolli et al. 2009; Chang et al.2009). To this end, the research reported here is in the developmentof ground-penetrating radar (GPR) for identifying the location andcondition of steel reinforcing bars in concrete bridge decks (Roquetaet al. 2012; Dérobert et al. 2008; Shaw et al. 2003; Halabe et al.1995). Such noninvasive techniques provide useful information formaintenance and condition assessment efforts. Of particular interestis using GPR in highway or bridge deck subsurface inspectionswithout disrupting vehicular traffic.
A variety of GPR systems are currently available. Based onantenna installations, GPR can be classified as ground-coupledGPR or air-coupled GPR. The ground-coupled GPR has its an-tennas installed at close proximity to the detection surface, whichresults in high detection sensitivity and small signal loss. However,when installed at this height, antennas are prone to damage if thesurface under detection has a rough profile. Consequently, theground-coupled GPR survey speed is low, and its operation maycause traffic disturbances. In air-coupled GPR, the antennas aretypically installed 200–500 mm or even higher above the surface.Hence, GPR survey speed can be increased without concerns of
damage to the antennas. There are some commercial air-coupledGPRs that can operate at highway speed (e.g., 96.5 km/h). However,the data acquisition units inmost of these systems are designed usingthe low rate equivalent-time sampling method. As a result, the ef-fective road inspection speed is low.Uddin (2006) reported thatmostin commercial highway speeds (i.e., 96.5 km/h posted) air-coupledGPRs transmit and receive 50 pulses per second. When the GPRvehicle drives at 96.5 km/h, a low pulse transmission rate will leadto low spatial resolution in the inspection, which results in the pro-duction of blind spots that miss many subsurface features in thecharacterization.
In the United States, Federal Communications Commission(FCC) regulations severely limit ultrawideband (UWB) radiatedemissions in the frequency band from 0.96 to 3.1 GHz, whichhappens to be favorable in GPR roadway inspections (FCC 2002).This constraint and the aforementioned limiting factors are chal-lenges in GPR designs. This research presents efforts to overcomethese constraints and limitations by developing a new and small air-launchedUWBGPR system that can be installed at the bottom side ofa vehicle. A key feature is the use of a high-speed real-time samplingunit that acquires the full reflected GPR waveforms in a single shot,which bypasses the slower subsampling methods used by mostpresently available impulse radar systems. By configuring the dataacquisition unit in a multithread operating mode, an enormousamount of sampled data can be rapidly collected and stored. Theseimprovements collectively enable this new UWB radar to operate ina vehicle running at normal driving speed.
Another challenge in GPR design is that various forms of in-terference and noise couplings can corrupt GPR data and deterioratesystem performance. In this research, a series of performance-enhancing signal-processing approaches are developed, includingdata preprocessing for systematic noise and interference reduction,target area detection, and linear hyperbola fitting to automate GPRdata characterization and to leverage radar operating efficiency andaccuracy. For design validation, experiments are conducted bymeans of various test setups.
The organization of this paper is as follows. A short descriptionof the GPR system hardware and data acquisition unit designs ispresented. Then, the signal preprocessing algorithms developed to
1Visiting Graduate Student, School of Engineering, Univ. of Vermont,Burlington, VT 05405. E-mail: [email protected]
2Associate Professor, School of Engineering, Univ. of Vermont, Bur-lington, VT 05405. E-mail: [email protected]
3Graduate Student, School of Engineering, Univ. of Vermont, Burling-ton, VT 05405. E-mail: [email protected]
4Professor, School of Engineering, Univ. of Vermont, Burlington, VT05405 (corresponding author). E-mail: [email protected]
Note. Thismanuscriptwas submitted onNovember 1, 2011; approvedon July 9, 2012; published online on July 30, 2012. Discussion periodopen until August 1, 2013; separate discussions must be submitted forindividual papers. This paper is part of the Journal of EngineeringMechanics, Vol. 139, No. 3, March 1, 2013. ©ASCE, ISSN 0733-9399/2013/3-272–285/$25.00.
272 / JOURNAL OF ENGINEERING MECHANICS © ASCE / MARCH 2013
J. Eng. Mech. 2013.139:272-285.
Dow
nloa
ded
from
asc
elib
rary
.org
by
Uni
vers
ity o
f V
erm
ont L
ibra
ries
on
11/2
4/13
. Cop
yrig
ht A
SCE
. For
per
sona
l use
onl
y; a
ll ri
ghts
res
erve
d.

improve rebar detection and signature characterizations are given.Experimental results are presented and, finally, concluding remarksare given.
GPR Hardware Development
System Issues
The UWB GPR is an impulse radar system in which a short elec-tromagnetic (EM) pulse launched from an antenna travels throughair and ground dielectric media to interact with subsurface features.A receiver collects the reflected and scattered impulses for datastorage, analysis, and subsurface feature identification. The radarhardware consists of a radio-frequency (RF) front end and digitalcontrol and data processing back end, including the data acquisitionmodule. The UWB pulse generator is a major front-end componentthat plays a critical role in determining the GPR system bandwidth,the detection range resolution, and the EM wave penetration capa-bility. The data acquisition unit is a crucial back-end component.Its sampling speed directly determines whether the GPR can op-erate at regular highway driving speeds while achieving sufficientspatial resolution. In most GPR systems (Jol 2009; Gan et al. 2011),equivalent-time subsampling provides a practical and low-costmethod of digitizing the high-speed waveforms. Equivalent-timesubsampling is based on the assumption that the object under test isstatic or moves slowly, relative to GPR transceiver. Thus, the re-flection signal within multiple sampling cycles is periodic and hasan invariant waveform. By sampling various portions of the re-flection signal across multiple cycles, the reflection waveform of acomplete cycle can be reconstructed over time. However, for ahighway speed GPR system, the foundation for equivalent-timesampling may lose its validity. When the GPR vehicle travels ata high speed (e.g., 30 m/s), the GPR transceiver can move witha relatively large spatial offset during the waveform reconstructionintervals. Consequently, the reflection signalwill not be periodic andmay become unsuitable for equivalent-time sampling. To reduce thespatial offset during the wave reconstruction, the radar pulse hasto be launched more frequently. However, increasing the pulselaunching frequency will increase the radiated emission power that isconstrained by FCC regulation. The newGPR reported here exploitshigh-speed real-time sampling techniques to realize single-shot datacollection, where the reflection signal in a complete cycle is obtainedin a single trigger event with high fidelity.
Another advantage of applying real-time sampling is that it canhelp improve highway GPR survey resolution. For detecting a bur-ied rebar at normal highway speed, the relative target moving speedand the data acquisition speed are related as
Dt ¼ dRv
¼ 1 cm96:5 km/h
¼ 0:37 ms ð1Þ
where dR 5 targeted image cell resolution of 1 cm; n 5 relativetarget moving speed (which equals the normal highway drivingspeed of ∼96.5 km/h); and Dt 5 allowed data acquisition time forsampling reflection signals within two consecutive cycles. The Dtvalue determines the applicable minimum GPR pulse repetitionfrequency (PRF), which equals 2.7 kHz (51/0.37ms)when theGPRvehicle moves at 96.5 km/h. In fact, for practical GPR operations,the PRF typically needs to be 10 times higher than the minimumPRF, which will enable sampling the same location reflection signalmultiple times to facilitate data averaging for noise alleviation. If theequivalent-time sampling method is adopted, then it would requirean even higher PRF for multicycle waveform sampling and signal
reconstruction. A higher PRF produces more emission pulses withina shorter time interval, which leads to a higher level of time-averagedradiated emission power density. In order for UWB radar to meet theemission power constraints regulated by FCC02-48 (FCC2002), theGPR pulse amplitude has to be reduced as a design trade-off, whichwill degrade radar system performance and its detection efficiency.These factors reinforce the suitability of real-time full-waveformsampling for a highway speed GPR system.
System Configuration
Typically, for radar signals low-frequency EM waves have goodpenetrating capability while high-frequency EMwaves can achievebetter spatial resolution. To accomplish high detection resolutionand good penetration while reducing power radiation in the 0:9323:1 GHz band, a dual-band dual-channel UWB GPR has beendeveloped. Fig. 1 illustrates the system diagram. In the design, theUWB pulse generator receives an oscillating signal from a pro-grammable oscillator whose frequency is tunable from 1 kHzto 10 MHz to control the UWB PRF. The UWB pulse generatorgenerates 600-ps-wide monocycle pulses as the source signal forboth sub-1-GHz base and 324:5-GHz high bands. In the base-bandoperation, the monocycle pulse is directly amplified, emitted, andreceived through UWB antennas, while at the high-frequency bandthe monocycle pulse feeds into a mixer circuit (Hittite HMC128G8)to perform frequency modulation by a 3-GHz local oscillator. Thespectrum of the resulting emitted and received signal spans from 3to about 4.5 GHz. Two remote-controlled single-pole/dual-throwRF switches are used to select the operating band. A field pro-grammable gate array (FPGA) circuit (Xilinx Spartan-3) providesthe high-speed control. To improve radar survey efficiency, the twooperating channels are implemented to realize parallel inspections,with each channel having its own transmission antenna and re-ceiving antenna. To minimize interchannel coupling and inter-ference, a Ping-Pong mode control scheme turns on each channelalternately. At the receiver side, various band signals are processeddifferently. The base-band signal is amplified and filtered beforeanalog-to-digital (ADC) conversion. The high-band signal uses amixer to perform frequency down conversion using the same localoscillator as that in the transmitter. The FPGA coordinates the radaroperating band selection, channel switching, samplingdata collection,and storage.
Pulse Generator
In GPR radar design, it is important to develop a UWB pulse gen-erator that can produce high-quality pulses with large-amplitude,low-level ringing and a wide range of applicable PRFs. This re-search develops a high-quality and low-cost pulse generator circuitusing a step recovery diode (SRD) and short-circuited microstriplines. As shown in Fig. 2(a), the pulse generator consists of thefollowing three functional units: (1) a signal amplitude converter, (2)a Gaussian pulse generator, and (3) a pulse-shaping filter. The signalamplitude converter contains a current feedback operational am-plifier (THS3091), a negative voltage converter (TL 7660), and a 50-V terminal resistor. The main function is to convert a single polaritysquare wave (0 V to Vdd) to a dual-polarity square wave (2Vdd toVdd). The dual polarity signal Vs acts as the stimulus signal for theSRD Gaussian pulse generator unit. Inserting a power attenuatoralleviates the SRD nonlinearity caused by impedancematching. TheSRD sharpens the input square-wave transition edge by connectingto the short-circuited microstrip lines through PIN diodes and direct-current blocking capacitors. Switching a specific microstrip lineturns on a forward-biased PIN diode to connect the edge-sharpened
JOURNAL OF ENGINEERING MECHANICS © ASCE / MARCH 2013 / 273
J. Eng. Mech. 2013.139:272-285.
Dow
nloa
ded
from
asc
elib
rary
.org
by
Uni
vers
ity o
f V
erm
ont L
ibra
ries
on
11/2
4/13
. Cop
yrig
ht A
SCE
. For
per
sona
l use
onl
y; a
ll ri
ghts
res
erve
d.

Fig. 1. Block diagram of the high-speed UWB dual-band GPR system
Fig. 2. (a) UWB monocycle pulse generator circuit; (b) pulse measurement result
274 / JOURNAL OF ENGINEERING MECHANICS © ASCE / MARCH 2013
J. Eng. Mech. 2013.139:272-285.
Dow
nloa
ded
from
asc
elib
rary
.org
by
Uni
vers
ity o
f V
erm
ont L
ibra
ries
on
11/2
4/13
. Cop
yrig
ht A
SCE
. For
per
sona
l use
onl
y; a
ll ri
ghts
res
erve
d.

step signal to the microstrip line. The short-circuit nature of themicrostrip causes the step signal traveling along themicrostrip line tobe fully reflected with an opposite phase. At the SRD output, theincident step signal and the reflection signal add together to producea Gaussian pulse, in which the width is determined by the signalpropagation delay along themicrostrip line and is proportional to themicrostrip line length. Using PIN diodes to select microstrip linesof various lengths enables tuning the Gaussian pulse width. TheGaussian pulse then connects to a Schottky diode, which acts asa half-wave rectifier to pass only the positive pulses while elimi-nating the negative ones. The pulse shaping unit consists of a shuntresistor, an inductor, and a series-connected capacitor. The resistorand inductor have small values to produce a low-impedance pathto shunt the low-frequency ripples to the ground, while the smallcapacitor in the series passes only the high-frequency componentsin the Gaussian pulse. This pulse-shaping circuit plays two roles(Xia et al. 2012). On one hand, it acts as a high-pass filter to eliminate
low-frequency ripples; on the other hand, it acts as a differentiator toproduce a monocycle pulse from the input Gaussian pulse. The dif-ferentiator causes the monocycle pulse amplitude to be pro-portional to the slope of the Gaussian pulse. Because the Gaussianpulse is very narrow (less than 1 ns in this design) and has sharptransition edges, the resulting monocycle pulse amplitude is high.Fig. 2(b) shows the measurement of a Gaussian monocycle pulse,which shows that the pulse width is approximately 600 ps and theamplitude is approximately 1.8 V. When compared with otherdesigns in the literature, this pulse generator achieves lower levelsof ringing and higher pulse amplitudes.
Ultrawideband Antenna
To have the maximum power transmitted onto the object under in-spection, the GPR antennas need to have good impedance matchingto minimize the internal reflections and to smooth out the transitionfrom the circuit impedance, 50 V, to the free space impedance,377 V. In this study, the GPR system is a novel homemade goodimpedance match antenna (GIMA) (Huston et al. 2000). As shownin Fig. 3, this GIMA antenna appears as a waveguide with twometalconductors of varying widths that are separated by an insulator.Fig. 3 illustrates the shape and the critical dimensions of the GIMAantenna.
The design concept of the GIMA is to provide a smooth im-pedance transition from the antenna to the air. This is accomplishedwith a combination of taper andflare at the ends of the antenna horns.The variation in impedance is achieved by smooth variation of thewidth (angle a) of metal plates and the separation gap (b) betweenthe metal plates with rolled edges to minimize edge diffraction, andan impedance-matched integrated-balun feed-point connection.The immediate free space surrounding the antenna conductors arecovered with energy absorbing material to minimize energy dissi-pation and to improve signal directivity. The developed GIMRantenna has steady impedance in the operational band from 500MHzto 6 GHz. Fig. 4(a) plots themeasurement results of Return Loss S11,whereas Fig. 4(b) illustrates the voltage standing-wave ratio (VSWR).
Fig. 3. Drawing of UWB horn antenna, where m5 13�, b5 6�,r5 150�, a5 60 mm, b5 60 mm, and l5 180 mm (reprinted fromJournal of Applied Physics, 43, Huston, D. R., Hu, J. Q., Maser, K,Weedon, W, Adam, C. GIMA Ground Penetrating Radar System ForInfrastructure Health Monitoring, 139–146, Copyright 2000; withpermission from Elsevier)
Fig. 4. (a) Reflection loss of the UWB horn antenna from 30 MHz to 6 GHz; (b) signal wave ratio of the UWB horn antenna from 30 MHzto 6 GHz
JOURNAL OF ENGINEERING MECHANICS © ASCE / MARCH 2013 / 275
J. Eng. Mech. 2013.139:272-285.
Dow
nloa
ded
from
asc
elib
rary
.org
by
Uni
vers
ity o
f V
erm
ont L
ibra
ries
on
11/2
4/13
. Cop
yrig
ht A
SCE
. For
per
sona
l use
onl
y; a
ll ri
ghts
res
erve
d.

It is clearly seen that theGIMA return loss is less than210 dB and theVSWR is less than 1.4 across the frequency band. These results attestto the good impedance-matching performance of this antenna design.
High-Speed Digitizer Configuration
The digitizer used in this system is a real-timeADCconverter (AgilentAcqiris U1065A) of 8-gigasamples per second (GSPS) sampling rateand 10-bit resolution. This high-speed and high-resolution digitizerenables implementing a single-shot full-waveform UWB scanningsystem for highway bridge inspection at normal driving speed. Duringoperation, a large amount of data is collected at the rate of 8GSPS. Therapidly accumulated large volume of data is difficult to manage withordinary read andwrite operations. The design solution is to configurethe digitizer into the multibuffer simultaneous acquisition and readout(SAR) mode. In the SAR mode, the internal memory of the digitizeris divided into three banks, as shown in Fig. 5, to form a circularstructure. Each data bank supports dual-port data access to allowsimultaneous data writing and reading. In other words, the stored datacan be read out from one memory bank while the new incomingacquisition data can be written into another available free bank. Afurther configuration is to operate the data acquisition bank in se-quence acquisition mode, in which the bank is divided into 333segments. Each segment has the capacity to store 320 data samplessequentially.
Upon triggering, the digitizer starts one data acquisition process,named a trigger event. At the end of each trigger event, there is
a short time interval in which the digitizer stops new data acqui-sition. This time interval is the rearm time or dead time, whichaffects the maximum event rate or trigger frequency that thedigitizer can operate without missing recording. One valuablefeature of the sequence acquisition mode is that it reduces therearm time or dead time to less than 350 ns at the 8-GSPS samplingrate.
The digitizer operations take on average approximately 13 ns totransfer each data sample from the internal memory of the digitizerto the back-end computer hard disk. However, acquiring each datasample only takes 125 ps. The apparent data transfer speed is about100 times slower than the sampling data acquisition speed. Sucha large speed discrepancy could cause digitizer operation jam anddata losses. Fortunately, the impulse GPR signal has an extremelylow duty cycle and the significant time interval is only a small portionof thewhole signal period. Fig. 5 shows that for a 30-kHz PRF (33.3-ms period), the effective sampling window is only 40-ns wide andonly 320 sampling data points are collected. To fill up one memorybank, it takes about 1 ms (33. 3 ms/segment3 333 segments51 ms), while the effective sampling time length is only 13.32 ms(40 ns/ segment3 333 segments5 13. 32 ms). This gives nearlya 1-ms time margin for transferring the data collected from thedigitizer to the computer hard disk. In other words, this bufferedpipelining scheme compensates for the speed mismatch by a factorof 76 (51 ms/13.32 ms).
To further alleviate the speed mismatch, as shown in Fig. 6, amultiprocessor configuration was also implemented to realize multi-thread data reading and writing in order to speed up data migrationonto the computer hard disk, where one processor reads data from thedigitizer while three processors move data to the hard disk in parallel.Use of these techniques effectively resolves the speed mismatchbetween GPR signal sampling and data storage.
Rebar Test Development
The GPR is designed for rebar detection and feature characteriza-tion. A focus of this paper is on locating the buried rebar. To illus-trate the design effectiveness, a series of experimental studies wereconducted with three different rebar test configurations: (1) one 20-mm-diameter rebar was positioned in air 450 mm below the an-tennas and 550 mm above the floor, (2) one 15-mm-diameter rebarwas buried 100 mm deep inside a sandbox (the sandbox top surfacewas 250 mm below the antennas), and (3) a concrete slab with two20-mm-thick rebars was embedded at depths of 108 and 98.6 mm,respectively. The distance between the two rebars was 500 mm. Theantennas were 100 mm above the top surface of the slab. Fig. 7illustrates each test diagram, whereas Fig. 8 contains photographs ofall test configurations.
Fig. 5. Digitizer configured in the SAR mode
Fig. 6. Multithreading configuration for data transfer and storage
276 / JOURNAL OF ENGINEERING MECHANICS © ASCE / MARCH 2013
J. Eng. Mech. 2013.139:272-285.
Dow
nloa
ded
from
asc
elib
rary
.org
by
Uni
vers
ity o
f V
erm
ont L
ibra
ries
on
11/2
4/13
. Cop
yrig
ht A
SCE
. For
per
sona
l use
onl
y; a
ll ri
ghts
res
erve
d.
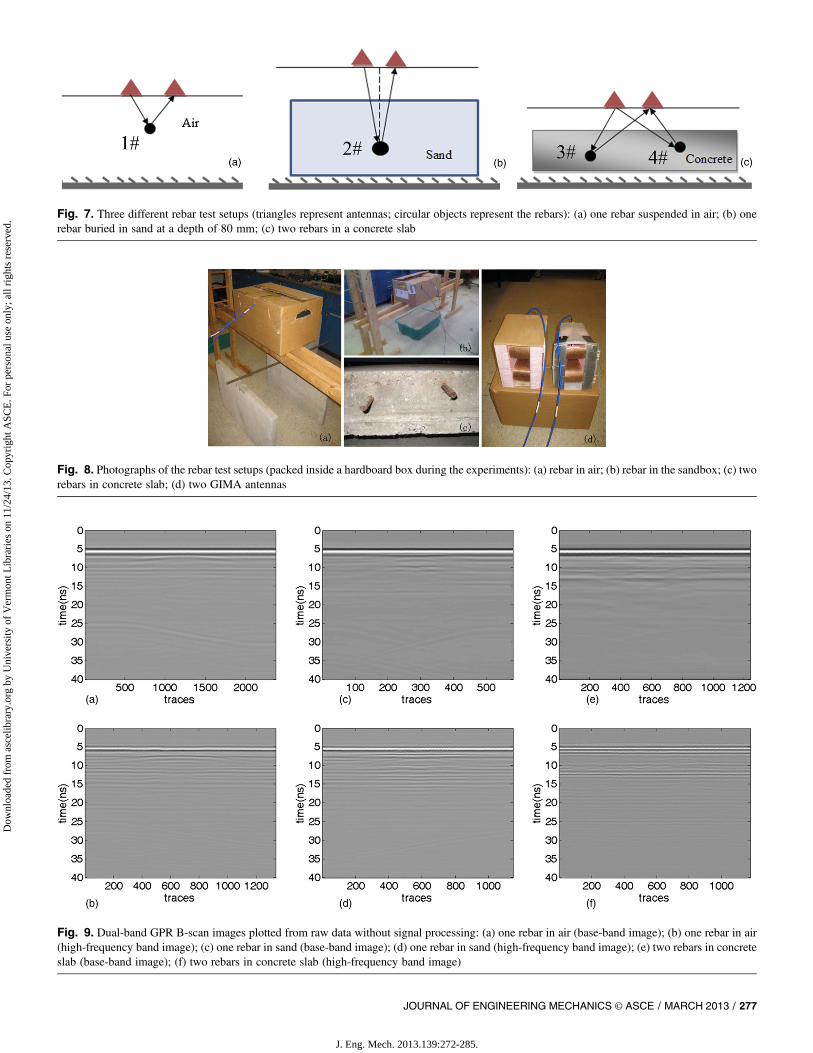
Fig. 7. Three different rebar test setups (triangles represent antennas; circular objects represent the rebars): (a) one rebar suspended in air; (b) onerebar buried in sand at a depth of 80 mm; (c) two rebars in a concrete slab
Fig. 8. Photographs of the rebar test setups (packed inside a hardboard box during the experiments): (a) rebar in air; (b) rebar in the sandbox; (c) tworebars in concrete slab; (d) two GIMA antennas
Fig. 9. Dual-band GPR B-scan images plotted from raw data without signal processing: (a) one rebar in air (base-band image); (b) one rebar in air(high-frequency band image); (c) one rebar in sand (base-band image); (d) one rebar in sand (high-frequency band image); (e) two rebars in concreteslab (base-band image); (f) two rebars in concrete slab (high-frequency band image)
JOURNAL OF ENGINEERING MECHANICS © ASCE / MARCH 2013 / 277
J. Eng. Mech. 2013.139:272-285.
Dow
nloa
ded
from
asc
elib
rary
.org
by
Uni
vers
ity o
f V
erm
ont L
ibra
ries
on
11/2
4/13
. Cop
yrig
ht A
SCE
. For
per
sona
l use
onl
y; a
ll ri
ghts
res
erve
d.

Fig. 10. (a) Waveforms of multiple traces showing level tracking; (b) image after vibration effect correction; (c) highlighted trace waveform showingtime zero point selection
Fig. 11. (a) Image after systematic noise removal; (b) waveform corresponding to the highlighted trace in Fig. 10(a); (c) image of median filteringin RFI reduction; (d) waveform corresponding to the highlighted trace in Fig. 10(c)
278 / JOURNAL OF ENGINEERING MECHANICS © ASCE / MARCH 2013
J. Eng. Mech. 2013.139:272-285.
Dow
nloa
ded
from
asc
elib
rary
.org
by
Uni
vers
ity o
f V
erm
ont L
ibra
ries
on
11/2
4/13
. Cop
yrig
ht A
SCE
. For
per
sona
l use
onl
y; a
ll ri
ghts
res
erve
d.

Test Data Acquisition
In the GPR scanning experiments, the antennas moved in a hori-zontal line above the rebar setup, while a series of reflection signalswere sampled, recorded into computer data files, and stacked intoa B-scan image (Fig. 9). As a result of large noise and interference,the rebar images were fuzzy and the signatures of individual rebarswere difficult to recognize.
Data Processing
GPR image processing has been widely studied in the technicalliterature (Johansson and Mast 1994; Olhoeft 2000; Al-Qadi et al.2004; Kim et al. 2004; Shihab and Al-Nuiamy 2005; Borgioli et al.2008; Wang et al. 2011; Yang 2011). This section presents
the signal-processing algorithms that have been developed toimprove rebar image quality and rebar detection accuracy. Theproposed signal processing consists of three subcomponents,including data preprocessing, target area detection, and linearhyperbola fitting.
Radar Data Preprocessing
Data preprocessing removes undesired systematic noise and in-terference. It involves level tracking, level correction, time zero linesetting, background clutter removal, and low-pass filtering. For thepurpose of illustration, data from the rebar-in-air test configurationare used herein.
Vibration Effect CorrectionIn a scan test, mechanical vibrations in the vehicle suspension andantenna mounts cause relative movements of the antennas to thesurface under inspection and can lead to spurious level misalign-ments amongvarious sampling traces. For instance, in Fig. 10(a), thehighlighted black dots on various traces are misaligned, althoughthey are expected to be on the same horizontal line. Implementinglevel tracking and level correction algorithms can correct thesewaveformmisalignments. For level tracking, a peak level is selectedand identified on all waveform traces, along with their time indexes.Level correction selects the peak point index on the first trace as thereference, and adjusts the time indexes of all other traces by therelative offsets. This aligns the peak points on all traces on the samehorizontal line with the same index value. Upon finishing leveltracking and level correction, the time zero line is identified. In thisproject, the antenna installation plane is selected as the time zeroreference plane. The installation configuration places the transmitand receive antennas in close proximity, which induces a strong EMcoupling between the antennas. Thus, the first peak point on thereceived signal waveform is attributed to the direct coupling and canbe recognized easily. As shown in Fig. 10(c), time zero is selected tobe the midpoint on the transition edge because the transition slopehas the largest value for easy identification.
Fig. 12. GPR image upon morphological filtering
Fig. 13. Comparison of the normalized energy data before and after morphological filtering: (a) horizontal normalized energy map before filtering;(b) horizontal normalized energy upon filtering; (c) vertical normalized energy map before filtering; (d) vertical normalized energy upon filtering
JOURNAL OF ENGINEERING MECHANICS © ASCE / MARCH 2013 / 279
J. Eng. Mech. 2013.139:272-285.
Dow
nloa
ded
from
asc
elib
rary
.org
by
Uni
vers
ity o
f V
erm
ont L
ibra
ries
on
11/2
4/13
. Cop
yrig
ht A
SCE
. For
per
sona
l use
onl
y; a
ll ri
ghts
res
erve
d.

Systematic Noise ReductionReflection data acquired from an air-coupled GPR system are proneto contamination by various systematic noises, such as antenna di-rect coupling. These noise effects are the principal causes of GPRimage background clutter. If their amplitudes are large, they canmask real rebar reflection signals. To remove the systematic noise,the averaging and subtraction approach is adopted. Because most ofthese systematic noises are deterministic and persist from waveformto waveform, time-domain averaging of the waveforms can removethe random and position-varying components to produce an estimateof the deterministic waveform signature. Then, by subtracting theaveraged result from each waveform the deterministic noise can begreatly reduced. Figs. 11(a and b) show the resulting B-scan imageand a trace waveform after systematic noise reduction. ComparingFigs. 10(b and c), it can be seen that the averaging and subtractionremove the background clutter and make the rebar signatures morepronounced.
Radio-Frequency Interference ReductionThe GPR data collection is also subjected to RF interference (RFI) inthe test environment. Because RFI is transient and random, applyingmedian filtering can often alleviate its effects. Median filtering exam-ines a 33 3 window for image data resampling. It first sorts the ninedata samples according to their amplitudes. Then, the medianvalue point is selected to replace the center pixel in the resamplingwindow. Fig. 11(c) shows the resulting image, and Fig. 11(d) is thesignal waveform corresponding to the highlighted trace in Fig. 11(c).
Target Area Detection
After preprocessing, the GPR waveform data are arranged in amatrix X
X ¼
26664
X11,X12, . . . ,X1n
X21,X22, . . . ,X2n
«
Xm1,Xm2, . . . ,Xmn
37775 ð2Þ
where n5 number of traces and m 5 sampling points on the trace.Vector b is the averaging vector
b ¼ ½b1b2⋯bm�T ð3Þ
where
bi ¼ 1n
Pnj¼1
xij, i ¼ 1, 2, . . . ,m
The normalized horizontal variance energy, ei, and the normalizedvertical variance energy, ej, can be calculated, respectively, as
ei ¼ 1n
Pnj¼1
�Xi, j 2 bi
�2, ej ¼ 1
m
Pmi¼1
�Xi, j 2 bi
�2 ð4Þ
Fig. 14. Target area detection results for each test setup: (a) one rebar in air (base-band radar image); (b) one rebar in air (high-frequency band radarimage); (c) one rebar in sand (base-band radar image); (d) one rebar in sand (high-frequency band radar image); (e) two rebars in concrete slab (base-band radar image); (f) two rebars in concrete slab (high-frequency band radar image)
Fig. 15. Edge point detections: (a) four directions for gradient cal-culation; (b) three edge points on the hyperbola curve
280 / JOURNAL OF ENGINEERING MECHANICS © ASCE / MARCH 2013
J. Eng. Mech. 2013.139:272-285.
Dow
nloa
ded
from
asc
elib
rary
.org
by
Uni
vers
ity o
f V
erm
ont L
ibra
ries
on
11/2
4/13
. Cop
yrig
ht A
SCE
. For
per
sona
l use
onl
y; a
ll ri
ghts
res
erve
d.

For the area with the buried rebar, both ei and ej values will expe-rience abrupt changes because of the strong rebar reflection signal;therefore, an examination of the ei and ej patterns identifies thetargeted detection area (Daniels 2004; van Kempen et al. 2000).
Morphological Filtering
After data preprocessing, there may still exist noise that could causefalse target detection. In this step, morphological filtering is appliedto improve the target area detection accuracy. The unique feature ofmorphology filtering is that it utilizes the geometric characteristicsof the target to differentiate the target from the background. Becausethe geometric signature of the rebar is a hyperbola curve in the GPRB-scan image, the following structure element (SE) is thus utilized toperform morphological filtering:
SE ¼24 0 1 0
1 1 0
1 0 1
35 ð5Þ
The resulting data after morphological filtering appear in Fig. 12.Figs. 13(a and c) plot the normalized horizontal and vertical varianceenergy curves before morphological filtering. Figs. 13(b and d)are the normalized horizontal and vertical variance energy curvesafter morphological filtering and low-pass filtering. Fig. 14 is the re-sulting GPR image. It is apparent that morphological filtering sig-nificantly cleans the energy maps and enhances the rebar hyperbolictraits.
Hyperbola Fitting
After identifying the target area, a hyperbola-fitting method extractsthe signature curve for rebar depth calculations. It is important to firstidentify the edge points on the hyperbola curve to conduct curvefitting.
Edge Point DetectionThere are many edge detection methods that have been investigatedfor GPR image processing. The present design adopts the Cannyoperator (Canny 1986). In comparison with other methods, the Cannyoperator has high detection accuracy in spotting continuous edgecurves even when some real edge points may be marked by nearbystrong interfering points. Such a scenario is typical for a highwayGPRsystem that is operating under strong transient noise and interference.The basis of the Canny operator is that the edge under detection liesalong a continuous curve with smooth transition gradients. Thosepoints with abrupt gradient value changes can be discarded as noisypoints. In addition, by following the derived curve direction, faint edgepoints with low gray-scale values can also be traced. Two gradientthreshold values, T1 and T2, were utilized for the Canny operators, inwhich T1 has a high value for filtering out the abrupt gradient chang-ing points and T2 has a low value for picking up faint edge points.
Fig. 16. Image segmentation with selected thresholds: (a) histogram of the image gradients; (b) image segmentation with T1; (c) image segmentationwith both T1 and T2
Table 1. Values of T1 and T2 in Various Images
MediumBand
frequencyStandardgradient SD T1 T2
Air Base 0.565 0.289 0.854 0.565Modulation 0.525 0.300 0.825 0.525
Sand Base 0.425 0.200 0.625 0.425Modulation 0.435 0.145 0.580 0.435
Concrete Base 0.445 0.255 0.700 0.445Modulation 0.455 0.265 0.720 0.455
JOURNAL OF ENGINEERING MECHANICS © ASCE / MARCH 2013 / 281
J. Eng. Mech. 2013.139:272-285.
Dow
nloa
ded
from
asc
elib
rary
.org
by
Uni
vers
ity o
f V
erm
ont L
ibra
ries
on
11/2
4/13
. Cop
yrig
ht A
SCE
. For
per
sona
l use
onl
y; a
ll ri
ghts
res
erve
d.

The implementation details of edge point detection are asfollows:1. In the gradient calculation, the magnitude and direction of the
gradient of the image are calculated through the first-orderpartial derivative. For a hyperbolic curve, the gradient has fourpossible directions in the 33 3 neighborhood, which are shownin Fig.15(a), where the four sectors are numbered from 0 to 3.
2. In candidate edge point searching, a pixel is classified as anedge point if it meets the following conditions:a. The value of this pixel is greater than the values of two
adjacent pixels along the gradient direction, where the twoadjacent points are in the same number sector in Fig. 15(a);
b. In Fig. 15(b), assume Points 1, 2, and 3 have been detectedand are adjacent to each other. Using the x-axis as thereference direction, the direction angle of two pointscan be defined as the angle between the line segmentconnecting the two points and the x-axis. This allows
calculating the direction angle of Points 1 and 2 and Points2 and 3.Because the edge points are the points on a smoothhyperbola curve, the difference between those two direc-tion angles will be small. In the design, the angle differ-ence is set to be less than 30�.
3. In edgedetection and connectionwithCannyoperator, applyingthe Canny method for edge point detection and connection
Fig. 17. Hyperbola fitting results: (a) one rebar in air (base-band radar image); (b) one rebar in air (high-frequency band radar image); (c) one re-bar in sand (base-band radar image); (d) one rebar in sand (high-frequency band radar image); (e) two rebars in concrete slab (base-band radar image);(f) two rebars in concrete slab (high-frequency band radar image)
Fig. 18. Test setup for concrete dielectric constant estimation: (a)concrete under antenna; (b) concrete slab with a metal on the top surface
Fig. 19. Reflection signal waveforms from (a) a metal sheet and (b)a concrete slab
282 / JOURNAL OF ENGINEERING MECHANICS © ASCE / MARCH 2013
J. Eng. Mech. 2013.139:272-285.
Dow
nloa
ded
from
asc
elib
rary
.org
by
Uni
vers
ity o
f V
erm
ont L
ibra
ries
on
11/2
4/13
. Cop
yrig
ht A
SCE
. For
per
sona
l use
onl
y; a
ll ri
ghts
res
erve
d.

requires selecting two threshold values, T1 and T2. Using thepreviously identified edge point candidates produces the gra-dient histogram in Fig. 16(a). Taking the stem value that has thelargest frequencydensity, theT2 value canbedetermined. In thisdesign, it is 0.565. The gradient standard deviation is 0.289. Thelarger threshold T1 value is thus set to 0.854, which equals thesum of T2 and one standard deviation. Fig. 16(b) plots the edgepoints detected by applying threshold T1 only, while Fig. 16(c)plots the image after applying both T1 and T2. Figs. 17(a–f)
show the effective detection of the edge points on the hyperbolacurve. Performing the same processing steps, the T1 and T2values for all radar images are obtained,which are summarizedin Table 1.
Hyperbola Curve FittingHyperbola fitting is applied after detecting edge points. Measuringthe depth of the rebar curve in the test medium requires locating thehyperbolic apex point. This test development employs a linear fittingalgorithm. The standard equation for a hyperbola is�
y2=a2�2
�x2=b2
� ¼ 1 ð6Þ
where a. 0, b. 0, and (x, y)5 hyperbola coordinates; namely, thecoordinates of the edge reflection of the target. Substituting y2 withu and x2 with v in Eq. (6) gives�
u=a2�2
�v=b2
� ¼ 1 ð7Þ
Taking the coordinate values of all edge points detected, and ap-plying linear hyperbola fitting, produces the values of parametersa and b. For the rebar-in-air image, a and b are calculated to be 0.28and 2.79, respectively. Fig. 17 shows the hyperbola fitting results forall six GPR images, with the pixels on the hyperbola curves beinghighlighted to improve visibility.
Rebar Depth Estimation
After locating the rebar hyperbola curve in the GPR image, it ispossible to calculate its depth. This requires determining the EMwave propagation speed in the medium, which makes measuring therelative dielectric constant of the medium a necessity.
Concrete Slab Dielectric Constant Measurement
A simple yet effective GPR testing technique infers the dielectricconstant of bulk materials from surface reflectivity measurements(Huston 2011). The reflection coefficient at the interface of twomedia is R12, which equals the ratio of the electrical fields of the
Fig. 20. Test diagram for estimating the dielectric constant of sand: (a) diagram of the test setup; (b) typical single signal trace; (c) assembled B-scanimage
Fig. 21. Rebar scan data with wave travel time t in a dielectric medium
JOURNAL OF ENGINEERING MECHANICS © ASCE / MARCH 2013 / 283
J. Eng. Mech. 2013.139:272-285.
Dow
nloa
ded
from
asc
elib
rary
.org
by
Uni
vers
ity o
f V
erm
ont L
ibra
ries
on
11/2
4/13
. Cop
yrig
ht A
SCE
. For
per
sona
l use
onl
y; a
ll ri
ghts
res
erve
d.
incident wave and the reflection wave. The R12 value depends on thedielectric constants ɛ1 and ɛ2 of the two media
R12 ¼ffiffiffiffiffiɛ1
p2
ffiffiffiffiffiɛ2
pffiffiffiffiffiɛ1
p þ ffiffiffiffiffiɛ2
p ð8Þ
A test method, illustrated in Fig. 18, was designed to estimate thedielectric constant of the concrete slab with the assistance of a thinmetal sheet. Because the signal amplitude is proportional to theelectric field, by measuring the reflection pulse amplitude, Ac, fromthe concrete surface and the reflection pulse amplitude, Apl, from themetal plate, the reflection ratio can be calculated as R12 5 2Ac=Apl.Thus, the dielectric constant of the concrete slab equals
ɛc ¼"1 þ �
Ac=Apl�
12�Ac=Apl
�#2
ð9Þ
In Fig. 19, the quantized reflection signal amplitudes Ac and Apl
equal 7,831 and 23,091, respectively. Using Eq. (9), the relativedielectric constant ɛc of the concrete is estimated to be 4.1.
Dry Sand Dielectric Constant Measurement
The size of the sandbox was 560 ðwidthÞ3 270 ðlengthÞ3 240 mm(height), which is relatively small for dielectric measurements usingthe aforementioned bulk material surface reflectivity characterizationmethod. To deduce the dielectric constant of the sand, ɛs, it wasdecided to measure the EM wave propagation speed in the sanddirectly. As is well known, for a medium with a dielectric constant ɛ,the speed of waves propagating in this medium and the round-triptraveling time are
V ¼ C=ffiffiffiɛ
p ð10Þ
t ¼ h=ð2 ×VÞ ð11Þ
In the test shown in Fig. 19(a), a rebar was buried inside the sandboxwith a previously known depth (80 mm) in the setup. The dielectricconstant ɛs can thus be obtained as
ɛs ¼�C × t22 t1
2 × h2
�2
ð12Þ
where t1 5 two-way traveling time between the top surface of thesand and the antennas of the EMwave, t2 5 two-way traveling timefrom the rebar in the sand and antennas, and h2 5 rebar depth in thesand (80 mm). From the scan data in Figs. 20(b and c), the t2 and t1offset value is measured as 13 1029 s. Applying Eq. (12), the rel-ative dielectric constant of the sand is calculated to be 3.51.
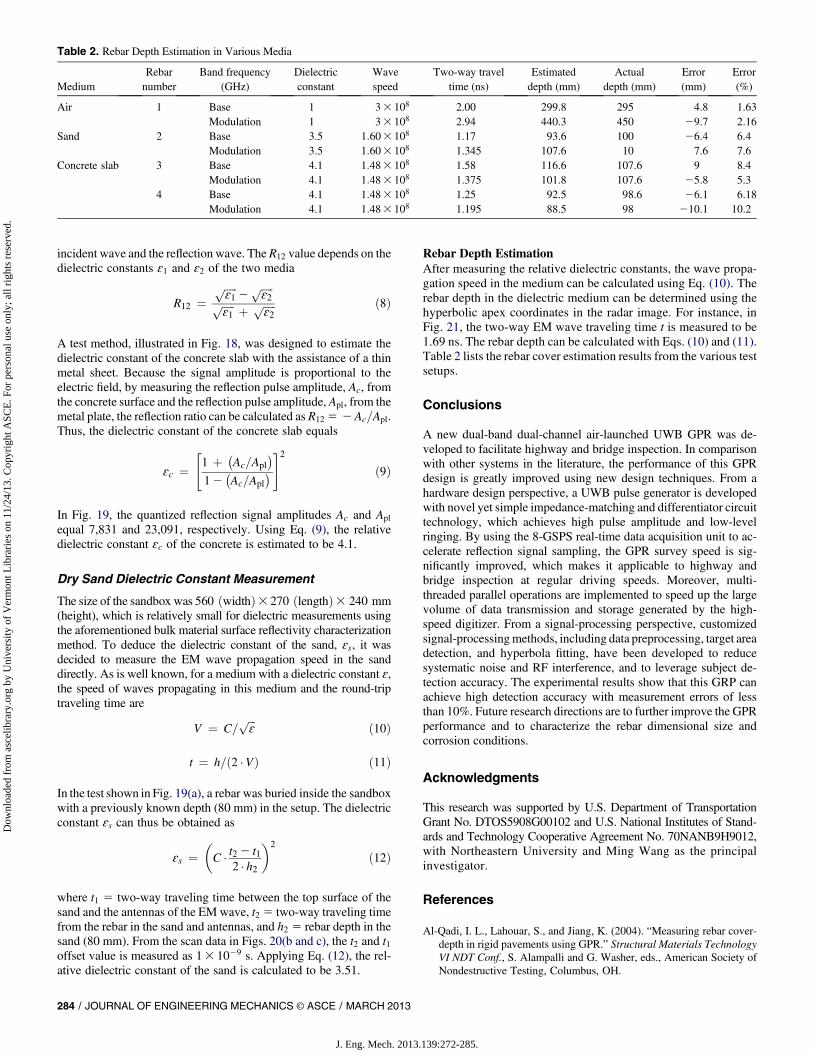
Rebar Depth EstimationAfter measuring the relative dielectric constants, the wave propa-gation speed in the medium can be calculated using Eq. (10). Therebar depth in the dielectric medium can be determined using thehyperbolic apex coordinates in the radar image. For instance, inFig. 21, the two-way EM wave traveling time t is measured to be1.69 ns. The rebar depth can be calculated with Eqs. (10) and (11).Table 2 lists the rebar cover estimation results from the various testsetups.
Conclusions
A new dual-band dual-channel air-launched UWB GPR was de-veloped to facilitate highway and bridge inspection. In comparisonwith other systems in the literature, the performance of this GPRdesign is greatly improved using new design techniques. From ahardware design perspective, a UWB pulse generator is developedwith novel yet simple impedance-matching and differentiator circuittechnology, which achieves high pulse amplitude and low-levelringing. By using the 8-GSPS real-time data acquisition unit to ac-celerate reflection signal sampling, the GPR survey speed is sig-nificantly improved, which makes it applicable to highway andbridge inspection at regular driving speeds. Moreover, multi-threaded parallel operations are implemented to speed up the largevolume of data transmission and storage generated by the high-speed digitizer. From a signal-processing perspective, customizedsignal-processingmethods, including data preprocessing, target areadetection, and hyperbola fitting, have been developed to reducesystematic noise and RF interference, and to leverage subject de-tection accuracy. The experimental results show that this GRP canachieve high detection accuracy with measurement errors of lessthan 10%. Future research directions are to further improve the GPRperformance and to characterize the rebar dimensional size andcorrosion conditions.
Acknowledgments
This research was supported by U.S. Department of TransportationGrant No. DTOS5908G00102 and U.S. National Institutes of Stand-ards and Technology Cooperative Agreement No. 70NANB9H9012,with Northeastern University and Ming Wang as the principalinvestigator.
References
Al-Qadi, I. L., Lahouar, S., and Jiang, K. (2004). “Measuring rebar cover-depth in rigid pavements using GPR.” Structural Materials TechnologyVI NDT Conf., S. Alampalli and G. Washer, eds., American Society ofNondestructive Testing, Columbus, OH.
Table 2. Rebar Depth Estimation in Various Media
MediumRebarnumber
Band frequency(GHz)
Dielectricconstant
Wavespeed
Two-way traveltime (ns)
Estimateddepth (mm)
Actualdepth (mm)
Error(mm)
Error(%)
Air 1 Base 1 33 108 2.00 299.8 295 4.8 1.63Modulation 1 33 108 2.94 440.3 450 29.7 2.16
Sand 2 Base 3.5 1:603 108 1.17 93.6 100 26.4 6.4Modulation 3.5 1:603 108 1.345 107.6 10 7.6 7.6
Concrete slab 3 Base 4.1 1:483 108 1.58 116.6 107.6 9 8.4Modulation 4.1 1:483 108 1.375 101.8 107.6 25.8 5.3
4 Base 4.1 1:483 108 1.25 92.5 98.6 26.1 6.18Modulation 4.1 1:483 108 1.195 88.5 98 210.1 10.2
284 / JOURNAL OF ENGINEERING MECHANICS © ASCE / MARCH 2013
J. Eng. Mech. 2013.139:272-285.
Dow
nloa
ded
from
asc
elib
rary
.org
by
Uni
vers
ity o
f V
erm
ont L
ibra
ries
on
11/2
4/13
. Cop
yrig
ht A
SCE
. For
per
sona
l use
onl
y; a
ll ri
ghts
res
erve
d.

Borgioli, G., Capineri, L., Falorni, P., Mattucci, S., and Windsor, C. G.(2008). “The detection of buried pipes from time-of-flight radar data.”IEEE Trans. Geosci. Remote Sens., 46(8), 2254–2266.
Canny, J. (1986). “A computational approach to edge detection.” IEEETrans. Pattern Anal. Mach. Intell., 8(6), 679–698.
Chang, C. W., Lin, C. H., and Lien, H. S. (2009). “Measurement radius ofreinforcing steel bar in concrete using digital imageGPR.”Constr. Build.Mater., 23(2), 1057–1063.
Daniels, D. J. (2004). Ground penetrating radar, 2nd Ed., Institute ofElectrical Engineers, London.
Dérobert, X., Iaquinta, J., Klysz, G., and Balayssac, J.-P. (2008). “Use ofcapacitive and GPR techniques for the non-destructive evaluation ofcover concrete.” NDT & E Int., 41(1), 44–52.
Federal Communications Commission (FCC). (2002). “Revision of Part 15of the Commision’s rules regarding ultra-wideband transmission sys-tems.” FCC 02-48, Washington, DC.
Gan, L., Zhou, L.,You,X. (2011). “The time-frequency analysis of equivalent-time sampling GPR signal based on HHT.” Int. Conf. on Computationaland Information Sciences (ICCIS), IEEE, Piscataway, NJ, 929–932.
Halabe, U. B., Maser, K. R., and Kausel, E. A. (1995). “Condition as-sessment of reinforced concrete structures using electromagneticwaves.” ACI Mater. J., 92(5), 511–523.
Huston, D. (2011). Structural sensing health monitoring and performanceevaluation, CRC, Boca Raton, FL, 117.
Huston, D. R., Hu, J. Q., Maser, K., Weedon, W., and Adam, C. (2000).“GIMA ground penetrating radar system for infrastructure healthmonitoring.” J. Appl. Geophys., 43(2–4), 139–146.
Johansson, E. M., and Mast, J. E. (1994). “Three-dimensional groundpenetrating radar imaging using synthetic aperture time-domainfocusing.” SPIE Proc., S. Udpa and H. Han, eds., 2275, 205–524.
Jol,H.M. (2009).Groundpenetrating radar theoryandapplications, Elsevier,Amsterdam, Netherlands.
Kim, Y. J., Jofre, L., De Flaviis, F., and Feng, M. Q. (2004). “Microwavesubsurface imaging technology for damage detection.” J. Eng. Mech.,130(7), 858–866.
Olhoeft, G. R. (2000). “Maximizing the information returnfrom ground penetrating radar.” J. Appl. Geophys., 43(2–4), 175–187.
Pasolli, E., Melgani, F., and Donelli, M. (2009). “Automatic analysis ofGPR images: A pattern-recognition approach.” IEEE Trans. Geosci.Remote Sens., 47(7), 2206–2217.
Roqueta, G., Jofre, L., and Feng, M. Q. (2012). “Analysis of the electro-magnetic signature of reinforced concrete structures for nondestructiveevaluation of corrosion damage.” IEEE Trans. Instrum. Meas., 61(4),1090–1098.
Shaw,M. R.,Molyneaux, T. C. K.,Millard, S. G., Taylor, T. J., and Bungey,J. H. (2003). “Assessing bar size of steel reinforcement in concreteusing ground penetrating radar and neural networks.” Insight Non-Destr. Test. Cond. Monit., 45(12), 813–816.
Shihab, S., and Al-Nuaimy, W. (2005). “Radius estimation for cylindricalobjects detected by ground penetrating radar.” Subsurf. Sens. Technol.Applic., 6(2), 151–166.
Uddin, W. (2006). “Ground penetrating radar study—Phase I: Technologyreview and evaluation.” FHWA/MS-DOT-RD-06-182, Federal HighwayAdministration, Washington, DC.
vanKempen, L., Sahli, H., Brooks, J., andCornelis, J. (2000). “New resultson clutter reduction and parameter estimation for landmine detectionusing GPR.” Proc., 8th Int. Conf. on Ground Penetrating Radar,Society of Photo-Optical Instrumentation Engineers, Bellingham, WA,872–879.
Wang, Z. W., Zhou, M., Slabaugh, G. G., Zhai, J., and Fang, T. (2011).“Automatic detection of bridge deck condition from ground pen-etrating radar images.” IEEE Trans. Autom. Sci. Eng., 8(3), 633–640.
Xia, T., Venkatachalam, A. S., and Huston, D. (2012). “A high performancelow ringing ultra-wideband monocycle pulse generator.” IEEE Trans.Instrum. Meas., 61(1), 261–266.
Yang, J. (2011). “The research of detection of the underground pipe’s di-ameter based on GPR.” M.S. thesis, China Univ. of Mining andTechnology, Beijing, 31–33.
JOURNAL OF ENGINEERING MECHANICS © ASCE / MARCH 2013 / 285
J. Eng. Mech. 2013.139:272-285.
Dow
nloa
ded
from
asc
elib
rary
.org
by
Uni
vers
ity o
f V
erm
ont L
ibra
ries
on
11/2
4/13
. Cop
yrig
ht A
SCE
. For
per
sona
l use
onl
y; a
ll ri
ghts
res
erve
d.


