Embed Size (px)
Citation preview

Development of AMV heightassignment directly linked to feature
tracking at JMA
Ryo OYAMA 1, Régis Borde 2, JohannesSchmetz 2 and Toshiyuki KURINO 1
1 Meteorological Satellite Center (MSC) of JapanMeteorological Agency (JMA)
2 EUMETSAT, Am Kavalleriesand 31, D-64295Darmstadt, Germany
9th International Winds Workshop in Annapolis
14-18 April 2008

Contents
Motivation
Introduction of individual-pixel contribution to featuretracking
Methodology
Results of application study
Concluding remarks and future plans

Motivation (1/2)
Height assignment by using coldest pixel radiances (i.e. uppermost clouds) within template image for feature-tracking is themost common.
EUMETSAT
Coldest peak of cloud top height histogram of Cloud Analysis (CLA) product(ASD internal EUMETSAT document).
NOAA/NESDIS
Fixed threshold of 25 % coldest pixels for GOES instruments (Daniels, 2002)
JMAThe most frequent cloud height derived from height-histogram accumulatedin 50-hPa intervals (Oyama and Shimoji, 2008). In many cases, the height ofuppermost cloud is selected because uppermost clouds are selected for thetargets in the target selection.

Motivation (2/2)However…
Buche et al. (2006) considered individual pixel contribution (CCij) to feature-tracking in using cross-correlation matching, and they applied the informationto the height assignment for clear-sky-region WV AMVs.
In this study, the individual pixel contribution to feature-trackingis applied to height assignment for IR AMVs using MTSAT-1Rimages and JMA’s AMV processing system.
Is using a height computed by using an amount of coldest pixelswithin the template image always adequate ???
In fact, AMV producers have to deal with various template imagescontaining clouds with different height and speed.
Some information which can link AMV height to feature-tracking is desired…

Introduction of individual-pixel contribution tofeature-tracking (1/2)
Definition of individual contribution rate to feature-tracking (CCij) under cross-correlation matching:
NM
jiij
M
i
N
j
BB
nm
nmAA
MN ccnmccB
meanij
A
meannjmi
,
,1 1),(
),(1 ,),( (Eq.1)
CC (m,n): cross-correlation at the location best corresponding to the target in the second searchingimageM, N: template image size (=32 at JMA, 24 at EUMETSAT)Aij, Bij: each-pixel (i, j) IR radiance of target image and searched area image on the secondsearching imageAmean, Bmean: averages of A and B, CCij : each pixel (i, j) contribution rate to feature tracking ofeach pixel (i, j)
IR Radiance of second imageIR Radiance of first image CCij

Introduction of individual-pixel contribution tofeature-tracking (2/2)
Some Problems remain in the applicationof CCij to height assignment:
(1) How can we introduce CCij intoheight assignment ?
(2) How many pixels should be used forheight assignment ? 10% , 15%, 20%,25%, 100% coldest pixels ???
Example of cloud clustering for atemplate image (Borde ,2006)
Borde and Oyama (2008) investigatedsome possibility to select availablepixels for AMV height assighment.

S ca t te r P lots o f CC ij a gains t IR ( 10. 8µm ) ra d ia nc e
123456789
-0 . 1 0 0 .1 0.2 0 .3 0 .4 0 .5 0 . 6 0 .7 0 .8 0. 9
C C ij × 100
IRra
dia
nc
e(a
rb.
un
its)
IRra
dia
nce
(arb
.unit
)Line-A
Line-CLine-B
(Eq.2)Radiance for IR AMVheights (L1) :
L1 is finally converted to an IR AMV height via MTSAT-1R’s conversiontable between IR radiance and temperature, and vertical profile data of JMA’sNWP (Global Spectral Model (GSM)) first-guess.
Pixels over grey region or yellow region are not used for computing L1.
Methodology (1/3)
Defined as background pixels
Green Line (Line-B): Average of IR pixel-radiances in template imageBlue line (Line-C): Intersection of Line-A and quadratic curve of pixel distribution
= CC / (template size)2 =<CCij>; template size = 32
Lijcor : IR radiance corrected by H2O-IRW intercept method
ij
Areainpixels
ji
corjiAreainpixels
jiij
CCL
CC
L
1__
,,1__
,
11
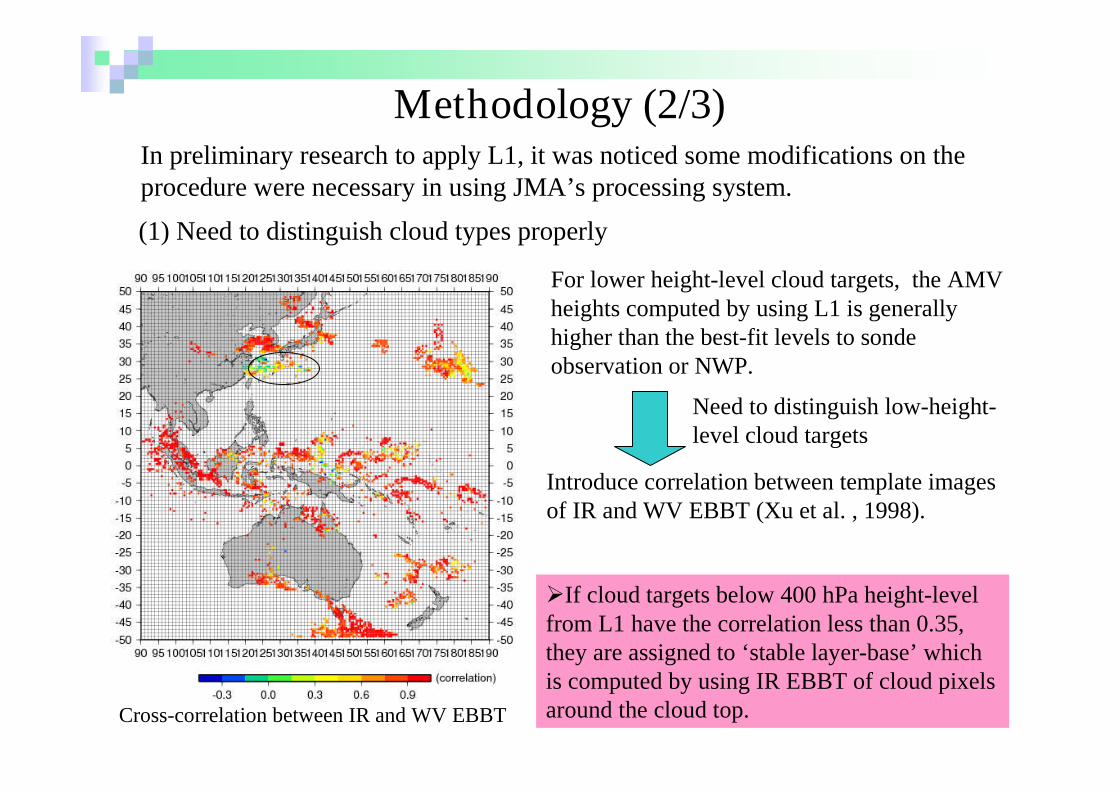
Methodology (2/3)In preliminary research to apply L1, it was noticed some modifications on theprocedure were necessary in using JMA’s processing system.
(1) Need to distinguish cloud types properly
For lower height-level cloud targets, the AMVheights computed by using L1 is generallyhigher than the best-fit levels to sondeobservation or NWP.
Introduce correlation between template imagesof IR and WV EBBT (Xu et al. , 1998).
If cloud targets below 400 hPa height-levelfrom L1 have the correlation less than 0.35,they are assigned to ‘stable layer-base’ whichis computed by using IR EBBT of cloud pixelsaround the cloud top.
Need to distinguish low-height-level cloud targets
Cross-correlation between IR and WV EBBT

Methodology (3/3)
(2) Need to eliminate the influence of convective cloud pixels in cyclone regions
Some convective-cloud pixels with largetime variability and positive CCij arefound in cyclone region.
In this study, the minimal coldest pixelsis not used to compute L1. Thethreshold (1.5 %) is determined not tohave significant influence on AMVheights.
We consider the application of thisprocedure is arbitrary and dependent onIR AMV target selection and heightassignment processes.
Results of application study (1/5)
(d) TEST
-12 -10 -8 -6 -4 -2 0 2 4 6 8 10 12
100-200
200-300
300-400
400-500
500-600
600-700
700-800
800-900
900-1000
(hPa)
(m/s)
Speed Bias(NH)Speed Bias(TR)Speed Bias(SH)
(c) 25 % coldest pixel
-12 -10 -8 -6 -4 -2 0 2 4 6 8 10 12
100-200
200-300
300-400
400-500
500-600
600-700
700-800
800-900
900-1000
(hPa)
(m/s)
Speed Bias(NH)Speed Bias(TR)Speed Bias(SH)
(b) 15 % coldest pixel
-12 -10 -8 -6 -4 -2 0 2 4 6 8 10 12
100-200
200-300
300-400
400-500
500-600
600-700
700-800
800-900
900-1000
(hPa)
(m/s)
Speed Bias(NH)Speed Bias(TR)Speed Bias(SH)
(a) 10 % coldest pixel
-12 -10 -8 -6 -4 -2 0 2 4 6 8 10 12
100-200200-300
300-400400-500500-600600-700700-800
800-900900-1000
(hPa)
(m/s)
Speed Bias(NH)Speed Bias(TR)Speed Bias(SH)
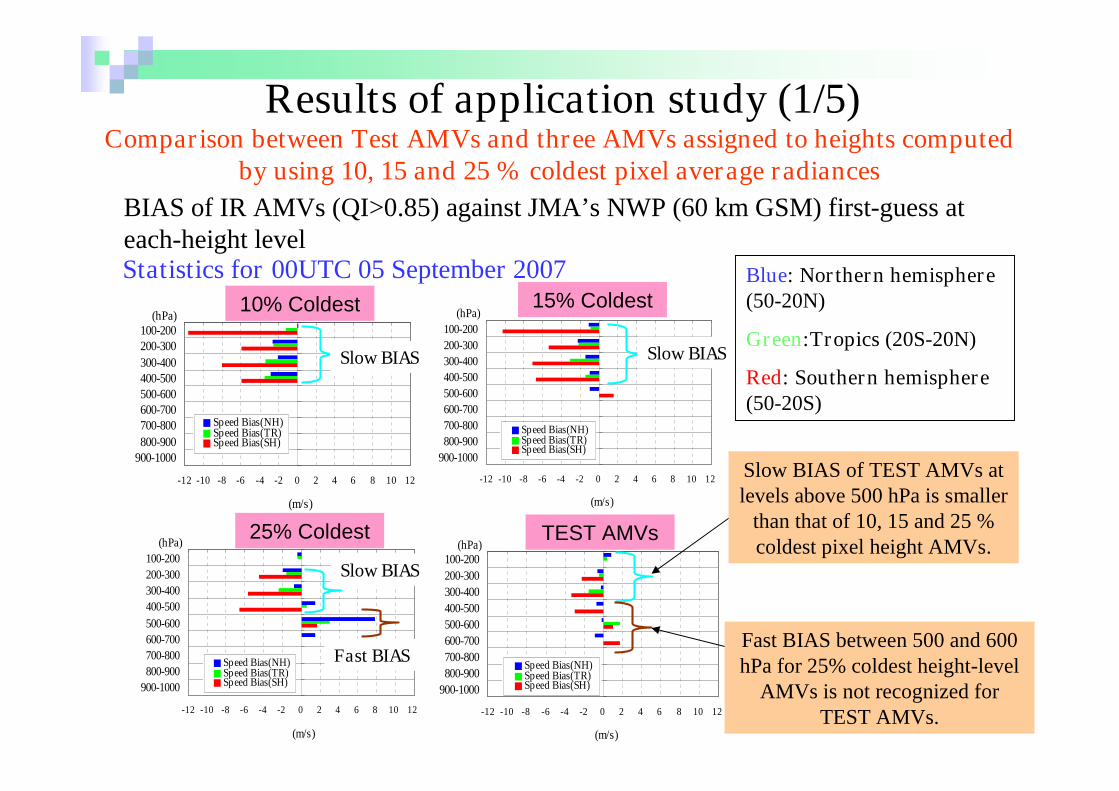
Comparison between Test AMVs and three AMVs assigned to heights computedby using 10, 15 and 25 % coldest pixel average radiances
BIAS of IR AMVs (QI>0.85) against JMA’s NWP (60 km GSM) first-guess ateach-height level
Slow BIAS
Slow BIAS
Slow BIAS
Fast BIAS
Slow BIAS of TEST AMVs atlevels above 500 hPa is smaller
than that of 10, 15 and 25 %coldest pixel height AMVs.
Fast BIAS between 500 and 600hPa for 25% coldest height-level
AMVs is not recognized forTEST AMVs.
Statistics for 00UTC 05 September 2007 Blue: Northern hemisphere(50-20N)
Green:Tropics (20S-20N)
Red: Southern hemisphere(50-20S)
10% Coldest 15% Coldest
25% Coldest TEST AMVs

Results of application study (2/5)
Monthly statistics of IR AMVs (QI>0.85) against JMA’s NWP (60km GSM)first-guess at each height-level
Comparison between current JMA’s AMVs (RTN) and TEST AMVs
BIAS of IRAMV(TEST)
-15 -10 -5 0 5 10
100-200
200-300
300-400
400-500
500-600
600-700
700-800
800-900
900-1000
(hPa)
BIAS (m/s)
Speed Bias(NH)Speed Bias(TR)Speed Bias(SH)
BIAS of IRAMV(RTN)
-15 -10 -5 0 5 10
100-200
200-300
300-400
400-500
500-600
600-700
700-800
800-900
900-1000
(hPa)
BIAS (m/s)
Speed Bias(NH)Speed Bias(TR)Speed Bias(SH)
(a)
Number of IRAMV(TEST)
0 25000 50000 75000 100000 125000
100-200
200-300
300-400
400-500
500-600
600-700
700-800
800-900
900-1000
(hPa)
Number
Number (NH)Number (TR)Number (SH)
Number of IRAMV(RTN)
0 25000 50000 75000 100000 125000
100-200
200-300
300-400
400-500
500-600
600-700
700-800
800-900
900-1000
(hPa)
Number
Number (NH)Number (TR)Number (SH)
(b)
BIAS
Number
RTN (current) TEST
Statistics for March 2007
Fast BIAS of RTNAMVs at levels of 500-700 hPa are resolved in
TEST AMVs.
Number of TESTAMVs is larger thanthat of RTN AMVs,particularly at upper
height-level.
What impacts ?
larger data-coveragethan RTN AMVs !

Results of application study (3/5)
Monthly statistics of IR AMVs (QI>0.85) against JMA’s NWP (60km GSM)first-guess at each height-level
Comparison between current JMA’s AMVs (RTN) and TEST AMVs
Statistics for September 2007
Number of IRAMV(RTN)
0 20000 40000 60000 80000 100000
100-200
200-300
300-400
400-500
500-600
600-700
700-800
800-900
900-1000
(hPa)
Number
Number (NH)Number (TR)Number (SH)
Number of IRAMV(TEST)
0 20000 40000 60000 80000 100000
100-200
200-300
300-400
400-500
500-600600-700
700-800
800-900
900-1000
(hPa)
Number
Number (NH)Number (TR)Number (SH)
(b)
BIAS of IRAMV(RTN)
-10 -8 -6 -4 -2 0 2 4 6 8 10
100-200
200-300
300-400
400-500
500-600
600-700
700-800
800-900
900-1000
(hPa)
BIAS (m/s)
Speed Bias(NH)Speed Bias(TR)Speed Bias(SH)
BIAS of IRAMV(TEST)
-10 -8 -6 -4 -2 0 2 4 6 8 10
100-200
200-300
300-400
400-500
500-600
600-700
700-800
800-900
900-1000
(hPa)
BIAS (m/s)
Speed Bias(NH)Speed Bias(TR)Speed Bias(SH)
(a)
RTN (current) TEST
BIAS
Number
Same positiveimpacts as March2007 are found forSeptember 2007.
What impacts ?

Results of application study (4/5)
How the positive impacts by the use of TEST scheme are obtained ?
In this case, RTN AMV is erroneously assigned to too low height-level (about 600hPa) because CCij is not used for the current JMA’s height assignment.
Wind speeds of AMVs (RTN (Green) and TEST(Pink), and JMA’s NWP wind speed (Blue curve)
Scatter plots of CCij against cloud-top height (Blue),and histogram of cloud-top-height (Pink)
CCij and Histogram against Cloud top height
00UTC 5 September 2007, (45N,160E)0
100
200
300
400
500
600
700
800
900
1000
-0.25 0 0.25 0.5 0.75 1
CCij*100 (blue plots), histogram/100 (pink curve)
Hei
gh
t(h
Pa)
CCij*100
histogram
Wind speed of AMVs (RTN and TEST) and JMA's NWP
0100200300400500600700800900
1000
0 5 10 15 20 25 30 35 40(m/s)
Hei
gh
t(h
Pa)
Speed (GPV)Speed (Test)Speed (Rtn)
A comparison between TEST AMVs and RTN AMVs at a location
The use of CCij can resolve the error of height assignment, particularly, fast BIASat middle-height-level observed in current JMA’s IR AMVs !

Results of application study (5/5)
Statistics for March 2007
Monthly statistics of IR AMVs (QI>0.85) against sonde observation
Statistics for September 2007
Comparison between current JMA’s AMVs (RTN) and TEST AMVs
Slow BIASes of TEST AMVs areslightly larger than those of RTN AMVsat upper and middle height-level.
RMSVDs are nearly same betweenRTN AMVs and TEST AMVs.
What quality-differencesbetween RTN AMVs and
TEST AMVs are found foreach tropospheric layer ?
Probably because CCij of colderpixels are generally larger.
Number of TEST AMVs is generallylarger than that of RTN AMVs.
Upper height level
(Above 400 hPa) RTN TEST RTN TEST RTN TESTMEAN SPEED (m/s) 33.4 33.4 14.5 14.5 23.4 23.1BIAS (m/s) -3.0 -3.1 -0.6 -0.8 -0.3 -0.6
RMSVD (m/s) 9.1 8.9 5.9 5.8 6.7 7.0Number of collocated AMVs 6297 7084 7339 7955 2194 2373
Middle height level
(700 hPa to 400 hPa) RTN TEST RTN TEST RTN TEST
MEAN SPEED (m/s) 25.7 25.2 11.1 11.1 16.1 17.2BIAS (m/s) -2.2 -3.8 -2.1 -1.4 -0.1 0.3
RMSVD (m/s) 9.0 9.3 5.3 4.7 5.4 5.7
Number of collocated AMVs 3365 3388 212 209 242 314
SH (50S-20S)
NH (20N-50N) TR (20S-20N) SH (50S-20S)
NH (20N-50N) TR (20S-20N)
Upper height level
(Above 400 hPa) RTN TEST RTN TEST RTN TEST
MEAN SPEED (m/s) 24.9 24.5 14.9 14.8 28.5 29.0BIAS (m/s) -1.8 -2.1 -0.4 -0.7 -1.8 -2.6
RMSVD (m/s) 7.5 7.6 6.1 6.1 8.8 9.0
Number of collocated AMVs 9621 11883 4078 4896 832 951
Middle height level
(700 hPa to 400 hPa) RTN TEST RTN TEST RTN TESTMEAN SPEED (m/s) 18.2 18.4 10.4 9.9 23.5 22.4
BIAS (m/s) -0.1 0.0 0.2 0.2 -2.4 -2.6
RMSVD (m/s) 5.7 5.9 4.3 4.3 8.0 8.4Number of collocated AMVs 1018 1336 168 219 426 691
SH (50S-20S)
NH (20N-50N) TR (20S-20N) SH (50S-20S)
NH (20N-50N) TR (20S-20N)

Concluding remarks and future plans (1/2)
Concluding remarks
The weighted IR radiance (L1) of pixels within template image,balanced by CCij, is introduced to upper and middle height-levelcloudy targets. It is found that TEST scheme could give well-matched AMVs to JMA’s NWP first-guess field, compared to 10,15 and 25 % coldest pixel height AMVs.
Two noticeable improvements of TEST AMVs against RTN(current) AMVs are recognized, that is, the reduction of fastBIASes below 500 hPa and the increase of high quality (QI>0.85)AMVs particularly at upper troposphere. However, the slowBIASes of TEST AMVs are slightly larger than those of RTNAMVs.

Concluding remarks and future plans (2/2)
Future plans
In the near future, after evaluations of more long-termmonthly statistics of TEST AMVs against sonde observationand JMA’s NWP first-guess, JMA plans to introduce the TESTAMVs in operation.
CCij is useful information to select contributive cloud pixelsto computing AMV heights. The information can be introducedinto height assignment in various ways, using the weighted IRradiance of pixels or in conjunction with other products, forexample, Cloud Analysis product (Borde and Oyama, 2008).

The End
Thank you for your attentions !
Danke schon !
GOSEICHO ARIGATOU-GOZAIMASHITA !

References (1/2)
ASD; ‘MSG Meteorological Products Extraction Facility Algorithm SpecificationDocument’ edited by EUMETSAT. Reference: EUM.MSG.SPE.022.Borde, R. ,2006: AMV height assignment methods with Meteosat-8, Proceedings of8th International Winds Workshop.Borde, R. and R. Oyama, 2008: A direct link between feature tracking and heightassignment of operational AMVs, Proceedings of 9th International Winds Workshop.Büche, G., et al., 2006: Water vapor structure displacements from cloud-freeMETEOSAT scenes and their interpretation for the wind field, J. Appl. Meteor., 45,556-575.Daniels, J., et al., 2002: Status and development of GOES wind products atNOAA/NESDIS, Proceedings of 6th International Winds Workshop, EUMETSAT,71-80.Le Marshall, J., N .Pescod, A. Khaw, and G. Allan 19, 1993: The real-timegeneration and application of cloud-drift winds in the Australian region. Aust.Meteor. Mag., 42, ((3),) 89-103.

References (2/2)
Nieman, N. J., Schmetz and W.P. Menzel, 1993: A comparison of several techniquesto assign heights to cloud tracers, J. Appl. Meteorol., 32, 1559-1568.
Oyama, R. and K. Shimoji, 2008: Status of and future plans for JMA’s Atmosphericmotion vectors, Proceedings of 9th International Winds Workshop.
Schmetz, J., K. Holmlund, J. Hoffman, B. Strauss, B. Mason, V. Gartner, A. Koch,and L. van de Berg, 1993, Operational cloud-motion winds from Meteosatinfrared images. J. Appl. Meteor., 32, 1206–1225.
Xu, J., Q. Zhang, F. Xiang, L. Jian, 1998: Cloud motion winds from FY-2 and GMS-5meteorological satellites, Proceedings of 4th International Winds Workshop, 41-48.