Embed Size (px)
Citation preview

VOL. 11, NO. 15, AUGUST 2016 ISSN 1819-6608
ARPN Journal of Engineering and Applied Sciences ©2006-2016 Asian Research Publishing Network (ARPN). All rights reserved.
www.arpnjournals.com
9400
DEVELOPMENT OF GEO-SPATIAL MAPS FOR MAINTENANCE OF WATER SUPPLY SCHEMES
P. Mariappan1, A. Raja Jeyachandra Bose2, P. Alex Praveen3, S. Sreechanth3 and T. R. Neelakantan4
1TWAD Board, 6A,Balasubramanian Nagar, Rajakkapatty, Dindigul-4, India 2School of Civil Engineering, SASTRA University, Thanjavur, India
3University College, Anna University,Tirunelveli, India 4Centre for Advanced Research in Environment, School of Civil Engineering, SASTRA University, Thanjavur, India
E-Mail: [email protected]
ABSTRACT
Recently, multi-village water supply schemes are erected for quality affected habitations in India. Operation and maintenance of multi-village water supply schemes require a lot of data viz: source, pumping stations, pipe line alignment, sizes of pipes, pressure, elevation, soil type etc. Various drawings and plans are prepared rarely with geo-reference during project planning and design. For Engineers in charge of maintenance, Geo-spatial maps with the above details will help in effective operation and maintenance of water supply schemes like for planning for augmentation, identifying leakages, pollution control etc. An attempt has been made to prepare different utility maps for a multi-village water supply scheme, named Vellur and 24 habitations in Musiri union, Trichy district, India, using GIS tools. Methods adopted to prepare maps and uses of developed maps are presented. Keywords: GIS, geospatial maps, operation, maintenance, multi-village water supply scheme. 1. INTRODUCTION
Regional water supply scheme (RWSS) or multi-village water supply scheme (MVWSS) covers multiple numbers of habitations from a single, perennial source. Area like fluorosis endemic is covered by such MVWSS. Generally, the water supply and sanitation systems consist of data like: source, pipe line, pump sets, sumps, elevated service reservoirs, valves, house service connection, public fountains, dust pin, toilet, sewer lines, manholes, and sewage treatment plant etc. All the details are essentially to be on hand with the Engineers/authorities in-charge of maintenance for the effective operation and maintenance besides planning for improvement and extension. Geographic Information System (GIS) is a spatial information based technology used for easy interpretation of data for creation of visual based information such as maps, etc. GIS is a tool, which helps bringing the utility details/information in the form of geo-referenced maps. Furthermore, the maps generated with GPS also form base maps for the analysis and design in other design software like EPANET, WATER CAD etc. With the facilities available in GIS, an attempt has been made to develop various utility maps, which will help in effective operation and maintenance (preventive as well crisis maintenance) of a Multi-Village Water Supply Scheme (MVWSS) in Trichy district, Tamil Nadu, India. Application of GIS in water utility management has been reported [1-3].
A MVWSS named combined water supply scheme to Vellur and 24 other habitations in Musiri block of Trichy district. It caters to the drinking water demand of the 25 rural villages spread over the Musiri block with the distance of 25 Kilo metres from the head works to the last beneficiary habitation. The scheme accommodates an infiltration well in the Cauvery river bed, four group sumps/intermediate pumping stations, 30 elevated service reservoirs (ESR), conveying pipe line and distribution system from ESRs.
2. METHODOLOGY 2.1 Base maps
Topo sheets, 58_j_5, 58_j_9 & 58_i_12, at the scale of 1:50000 were used as base maps for the entire project of combined water supply scheme to Vellur and 24 other habitations in Musiri union, Trichydistrict,Tamil Nadu. 2.2 GPS (Global Positioning System)
Using GPS device (JUNO JB series), the actual locations of the features such as infiltration wells, group sumps, overhead tanks (OHTs) / elevated service reservoirs (ESRs) were located in person and precise locations were recorded as latitudes and longitudes (X,Y). Interconnection of major pipelines were also located by GPS and taken as a reference. 2.3 Google earth
Google Earth, a well-known software, facilitates to fly anywhere on Earth to view satellite imagery, maps, terrain, 3D buildings, from galaxies in outer space to the canyons of the ocean. Earth is integrated with the results of GIS. 2.4 Utility software
Arc GIS version 10.1 was used to process the data, creation of maps and database creation. Canvas with GIS is an Image processing software used for integration of Topo sheets. Quantum GIS was used for visualizing data as it is an open source GIS software. Google earth was used to View the spatial data in Real-time and finally Picasa was used to geotag the photos.

VOL. 11, NO. 15, AUGUST 2016 ISSN 1819-6608
ARPN Journal of Engineering and Applied Sciences ©2006-2016 Asian Research Publishing Network (ARPN). All rights reserved.
www.arpnjournals.com
9401
2.5 Process Pre-planned flow chart had been made to ensure
that project completed without any mix-up and by the use of ArcGIS software, Geo data base was created and information for each layer was stored into the database. Then, importing the topo sheets into ArcGIS feature extraction were done based on the feature types such as points, lines and polygons. Digitization (Extraction of features) was done using topo sheets as base maps. All the features such as Infiltration wells, group sumps, elevated service reservoir (ESR) and Pipelines were created and information were stored in the geo data base. Then different maps were created with certain criteria as per the needs of the Tamil Nadu Water Supply and Drainage board (TWAD Board) such as digital elevation map (DEM), contour maps for each and every individual area.
Interpolation (Kriging method) is used for creating elevation map. Using elevation map, Slope map (steepest path), water flow map (water flow direction), Contour map (line joining same elevation) and Triangular Irregular Network (TIN) map were generated.
Pressure Contour maps were generated by using interval of 0.5 metre. Contour map and Elevation map for each group sump Coverage Area was also generated.
Google Earth was used to visualize as the maps and contents were converted to support this application for better experience and reference. Photos of the respective Infiltration well, Group sumps, elevated service reservoir (ESR) were also Geo-tagged using Picasa and imported to Google earth. List of various utility geo-referenced maps generated with its content are tabulated (Table-1).
Table-1. List of various utility maps generated.
S. No. Title of the map Content
1 Project Area (Satellite Layer) Satellite Map of project area.
3 Pipe Alignment Map Pipe line alignment, Types of Pipe Lines and infiltration
well.
3 Scour Location Map Rivers and water bodies within the project area.
4 Soil Classification Map Types of Soil in the project area.
5 Elevation Map Elevation.
6 Contour Map Contour Details.
7 Leak & Burst Prone Area Map Area prone for leak and burst.
8 Pollution Prone Stretch Map Areas that are Prone to Pollution.(Drainage’s, sewage’s
crossing)
9 Pressure Points Map Includes Pressure Values of all Point features.
10 Power line alignment Electricity line
3. RESULTS AND DISCUSSIONS
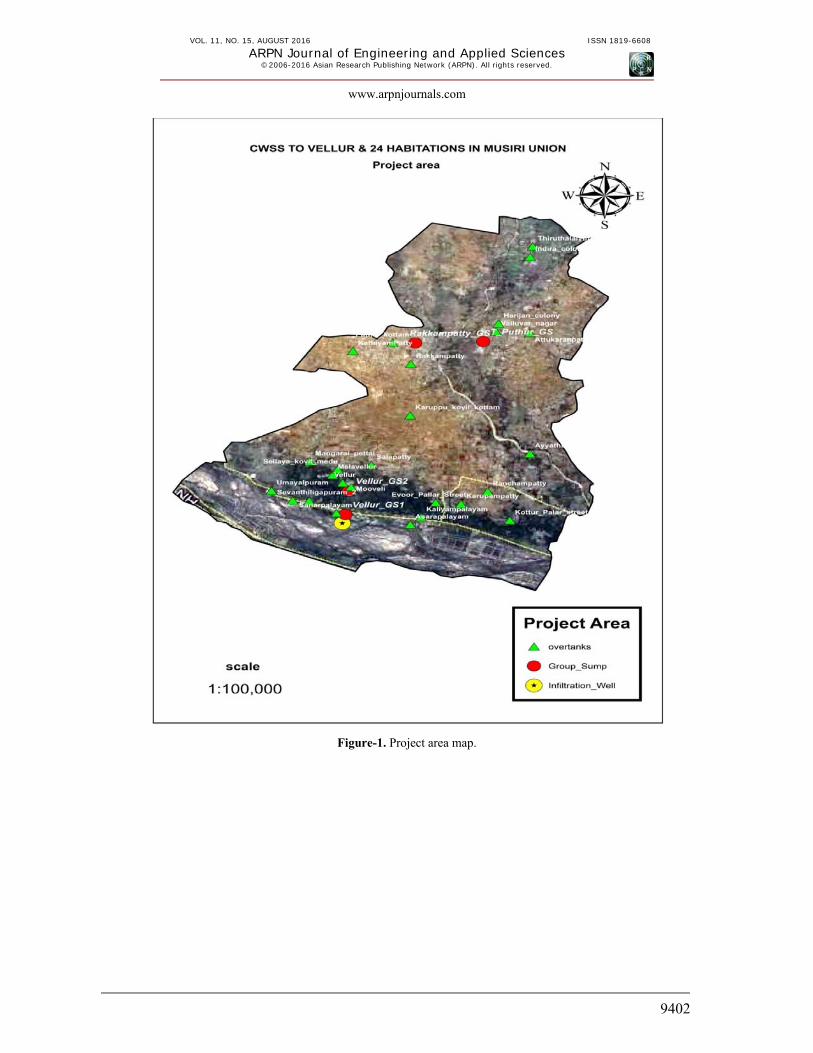
Integration of topo sheet, co-ordinates of features of the CWSS to Vellur and 24 habitations, earth map,etc in GIS platform yielded various utility geo-spatial maps. Content and usefulness of each map are narrated below. 3.1 Project area map
The entire scheme area is marked on the earth map (Figure-1). It depicts the components like elevated service reservoirs (over tanks), source (infiltration well) and group sumps (booster stations) besides the beneficiary habitations. Figure-1 is almost bird’s eye view of the project area showing the drainage pattern etc.
3.2 Pipe line alignment Map showing the pipe line alignment with the
size of pipe and material of pipe is given figure 2.Cast iron pipe has been laid within the river bed and poly-vinyl-chloride (PVC) has been laid in main and branch mains size varying from 50 mm outer diameter (OD) to 140 mm OD. Pipe line alignment map will be helpful to know size and material of pipe available at a particular location which in turn facilitates during attending to any leak or burst. 3.3 River and water body
Figure-3 shows the river and water bodies with pipe line alignment which is very useful to divert the water during emptying of pipe line at the time of repairs.
VOL. 11, NO. 15, AUGUST 2016 ISSN 1819-6608
ARPN Journal of Engineering and Applied Sciences ©2006-2016 Asian Research Publishing Network (ARPN). All rights reserved.
www.arpnjournals.com
9402
Figure-1. Project area map.

VOL. 11, NO. 15, AUGUST 2016 ISSN 1819-6608
ARPN Journal of Engineering and Applied Sciences ©2006-2016 Asian Research Publishing Network (ARPN). All rights reserved.
www.arpnjournals.com
9403
Figure-2. Pipeline alignment with size with source location.

VOL. 11, NO. 15, AUGUST 2016 ISSN 1819-6608
ARPN Journal of Engineering and Applied Sciences ©2006-2016 Asian Research Publishing Network (ARPN). All rights reserved.
www.arpnjournals.com
9404
Figure-3. River and water body for scour location.

VOL. 11, NO. 15, AUGUST 2016 ISSN 1819-6608
ARPN Journal of Engineering and Applied Sciences ©2006-2016 Asian Research Publishing Network (ARPN). All rights reserved.
www.arpnjournals.com
9405
Figure-4. Soil map. 3.4 Soil map
Various types of soils present in the project are depicted in Figure-4. Knowing the soil types will help in mobilizing the machinery and men for the maintenance work.
3.5 Digital elevation map Figure-5 gives the digital elevation map of the
project area. Level variation over the area can be ascertained from the map. 3.6 Contour map
A map showing the contour lines is developed and presented in Figure-6. It provides general information

VOL. 11, NO. 15, AUGUST 2016 ISSN 1819-6608
ARPN Journal of Engineering and Applied Sciences ©2006-2016 Asian Research Publishing Network (ARPN). All rights reserved.
www.arpnjournals.com
9406
about the topography of the area. Knowledge on the topography is essential for the maintenance personnel. It provides the same. 3.7 Burst and leak prone area
Figure-7 shows the burst and leak prone area. Clay soil has the characteristics of shrinkage and expansion depending upon the soil moisture. From area marked as the burst and leak prone, size of pipe and material of the can be known from the Figure-2. It will help in material management, i.e. to have the stock of materials of frequent need.
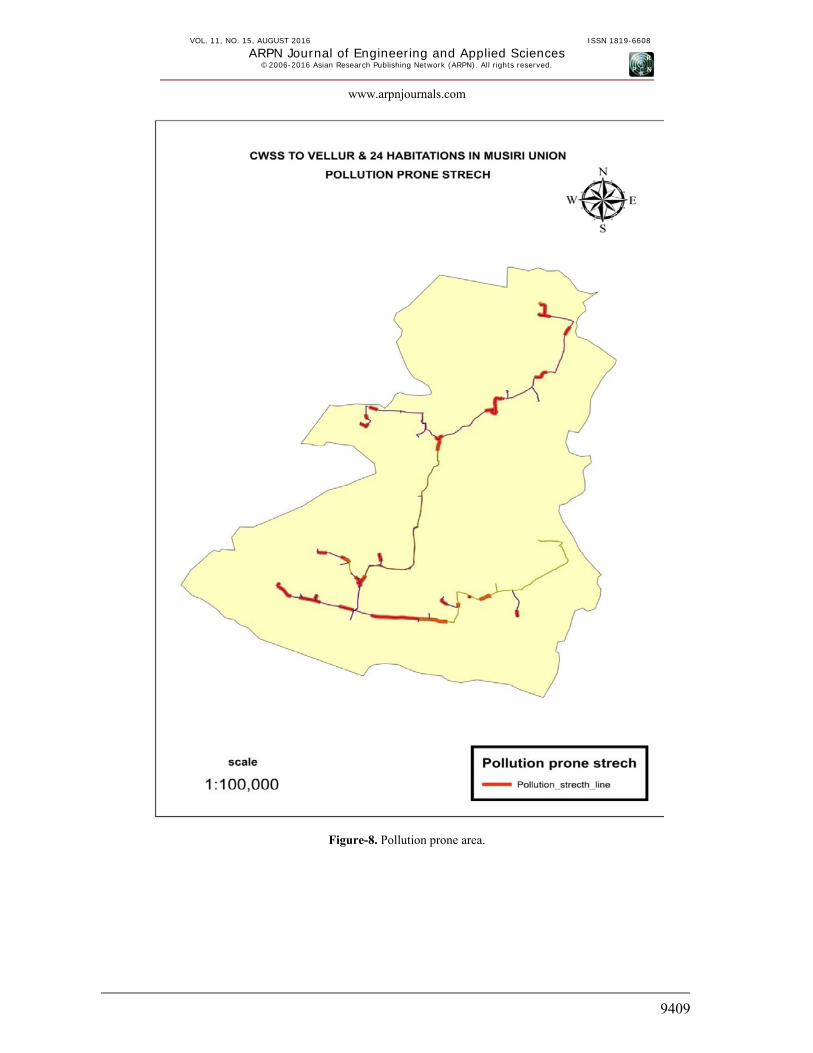
3.8 Pollution prone area It is common that open drain carrying sullage and
the drinking water pipe line go very close to each other within the human settlements. As the chance of entering wastewater, sullage, into the pipe line has been found at many, a map showing the pollution prone stretch of pipe line has been developed integrating the pipe line and the sullage drains. It will be helpful in taking preventive maintenance.
Figure-5. Digital elevation map.

VOL. 11, NO. 15, AUGUST 2016 ISSN 1819-6608
ARPN Journal of Engineering and Applied Sciences ©2006-2016 Asian Research Publishing Network (ARPN). All rights reserved.
www.arpnjournals.com
9407
Figure-6. Contour map of project area.

VOL. 11, NO. 15, AUGUST 2016 ISSN 1819-6608
ARPN Journal of Engineering and Applied Sciences ©2006-2016 Asian Research Publishing Network (ARPN). All rights reserved.
www.arpnjournals.com
9408
Figure-7. Burst and leak prone area.
VOL. 11, NO. 15, AUGUST 2016 ISSN 1819-6608
ARPN Journal of Engineering and Applied Sciences ©2006-2016 Asian Research Publishing Network (ARPN). All rights reserved.
www.arpnjournals.com
9409
Figure-8. Pollution prone area.

VOL. 11, NO. 15, AUGUST 2016 ISSN 1819-6608
ARPN Journal of Engineering and Applied Sciences ©2006-2016 Asian Research Publishing Network (ARPN). All rights reserved.
www.arpnjournals.com
9410
Figure-9. Hydraulic pressure at various locations.

VOL. 11, NO. 15, AUGUST 2016 ISSN 1819-6608
ARPN Journal of Engineering and Applied Sciences ©2006-2016 Asian Research Publishing Network (ARPN). All rights reserved.
www.arpnjournals.com
9411
Figure-10. Electric power line. 3.9 Hydraulic pressure map
Hydraulic pressure at each beneficiary habitation with respect to design is publicized in Figure-9. Pressure in turn indicates the flow rate. It will be help to operate the flow control valves to ensure supply at all the beneficiary habitations.
3.10 Electric power line Electric power line in the scheme area under
study is made known in figure 10. It will enable to measure the distance from the map for power supply connection and shortest point of electric supply may also be identified.

VOL. 11, NO. 15, AUGUST 2016 ISSN 1819-6608
ARPN Journal of Engineering and Applied Sciences ©2006-2016 Asian Research Publishing Network (ARPN). All rights reserved.
www.arpnjournals.com
9412
4. CONCLUSIONS The Engineers in charge of maintenance of water
supply schemes require some data base for planning preventive and crisis maintenance. The developed maps, to
the some extent, shall be useful for the same. The title of the maps with their uses for preventive and crisis maintenance of water supply schemes are tabulated below.
Figure No. Title of the map Uses
1 Project Area Bird eye view of the entire project area to visualize the
project .
2 Pipe Alignment Map Pipe line alignment, Types of Pipe Lines and infiltration
well can be read..
3 Scour Location Map Location of scour can be easily made. Emptying of pipes
during burst and leak may be directed accordingly without flooding the roads and residential areas.
4 Soil Classification Map Soil classification helps to identify the bedding required
and subsoil settling pattern in reltion with pipe line.
5 Elevation Map Topography
6 Contour Map Levels of the project area. Deciding class of pipe and flow
control needed
7 Leak and Burst Prone Area Map Demarcation of area prone for leak and burst for preventive
maintenance.
8 Pollution Prone Stretch Map Identifying the areas that are Prone to
Pollution.(Drainage’s, sewage’s crossing) for preventive maintenance
9 Pressure Points Map Assess the residual pressure at each delivery point and to
control the valves for equal distribution.
10 Power Line Alignment Map Identification of Shortest route for brining electrical line.
The following general observations and
inferences are drawn from the various maps generated using GIS: Project area falls on the northern side of Cauvery
River. Source, infiltration well, has been located on the Cauvery bed. Majority of the beneficiary habitations are situated close to the source. Habitations are relatively close to each other in the initial reaches and scattered in the middle and end. It indicates that more quantity of water is distributed in the initial reaches. Hence, more attention is to be given for water apportion.
Pipe line alignment shows that the pipe size decreases from 140 mm OD PVC to 50 mm OD PVC. It suggests that spare pipe and specials for the maintenance may be kept accordingly so as to minimise the transportation expense.
Cauvery River and ArjunaRiver, a tributary to the former, are the natural drains in the project area. Emptying pipe during mending may be done into the Cauvery River in the initial reaches and into ArjunaRiver in the remaining part of the project.
Sand, sand mixed with clay, clay and hard soil are the soil types present and clay, which behaves differently with moisture condition, solicits much attention.
When clay expands on water absorption exerts pressure on the pipe causing damage. Otherwise, shrinkage on drying is also cause burst and leak. Hence, clay reaches require more concern. Umayalpuram and Kaliyapalayam stretch are prone for frequent burst and leak.
Kathiyampatty habitation is the highest location. Necessary flow control arrangements are to make to make the flow to Kathiyampatty. It is quite nature that the flow direction will be towards lower level.
Conveying mains pass through villages at many places. It is the general practice that the wastewater drains and drinking water pipe lines are accommodated on the side of the roads. So, the places where both fall close to each are vulnerable for pollution.
Pressure head at delivery points vary from 12 metre to 37.99 metre. More flow will take place where the pressure is high. Flow control is essential at such locations.
Electric line alignment rarely follows the pipe line alignment. Shortest point of tapping may be chosen if power supply is to be established in case additional pumping is introduced.

VOL. 11, NO. 15, AUGUST 2016 ISSN 1819-6608
ARPN Journal of Engineering and Applied Sciences ©2006-2016 Asian Research Publishing Network (ARPN). All rights reserved.
www.arpnjournals.com
9413
REFERENCES [1] Prashant P.Bhaveand Kalpana S.Dumbre. 2012. GIS
application for water supply system management. Journal of Indian Water Works Association.pp. 45-51.
[2] AlaeddinneEljamassi and RolaAheadAbeaid. 2013. A GIS based DSS for Management of Water Distribution Networks (Rafah City as case study). Journal of Geographical Information System. 5: 281-291.
[3] TanushreeBhan. 2013. Using GIS for Greater Efficiency in Operation and Better Delivery of Services by Urban Local Body in India, Crier.