Embed Size (px)
Citation preview
Martin O’Malley, Governor Anthony G. Brown, Lt. Governor
John D. Porcari, Secretary Neil J. Pedersen, Administrator
MD-07-SP708B4F
STATE HIGHWAY ADMINISTRATION
RESEARCH REPORT
DEVELOPMENT OF FRICTION IMPROVEMENT POLICIES AND GUIDELINES FOR THE MARYLAND STATE HIGHWAY
ADMINISTRATION
PRINCIPAL INVESTIGATOR: RICHARD SPEIR, P.E
RESEARCH TEAM MEMBERS:
TARA PUZIN ROBERTO BARCENA, P.E PRAVEEN DESARAJU, P.E
APPLIED RESEARCH ASSOCIATES, INC
SP708B4F FINAL REPORT
February 2009

The contents of this report reflect the views of the author who is responsible for the facts and the accuracy of the data presented herein. The contents do not necessarily reflect the official views or policies of the Maryland State Highway Administration. This report does not constitute a standard, specification, or regulation.

Technical Report Documentation Page1. Report No. MD-07-SP708B4F
2. Government Accession No. 3. Recipient's Catalog No.
5. Report Date February 2009
4. Title and Subtitle Development of Friction Improvement Policies and Guidelines for the Maryland State Highway Administration 6. Performing Organization Code
7. Author/s Richard Speir, Tara Puzin, Roberto Barcena, Praveen Desaraju
8. Performing Organization Report No.
10. Work Unit No. (TRAIS)
9. Performing Organization Name and Address Applied Research Associates, Inc. 7184 Troy Hill Drive, Suite N Elkridge, MD 21075
11. Contract or Grant No. SP708B4F
13. Type of Report and Period CoveredFinal Report
12. Sponsoring Organization Name and Address Maryland State Highway Administration Project Planning Division 707 North Calvert Street Baltimore MD 21202
14. Sponsoring Agency Code (7120) STMD - MDOT/SHA
15. Supplementary Notes 16. Abstract This policy and guideline document presents the research performed and the activities that were undertaken to develop guidelines and improvement policies for the implementation of a friction management program at the Maryland State Highway Administration (MDSHA). The document includes a review of the state-of-the-practice based on an extensive literature review. The Pavement Friction Management Framework and an overview of Friction Management have been included, and served as the basis for developing our recommendations for MDSHA’s pavement friction management program. In addition, using our knowledge of MDSHA’s current friction practices and available data, a systematic approach to select friction improvement candidates as well as establishing state-wide friction policies to maximize MDSHA’s available resources has been developed. Also, feedback from various MDSHA Districts and officials about funding and scheduling preferences was obtained through various brainstorming meetings. The report includes various recommendations based on the results of this study, and suggestions for future data collection practices and friction restoration methods have been included. 17. Key Words Pavement Friction, Pavement Texture, Investigatory Level, Intervention Level, Friction Site Categories, Friction Restoration Methods, Friction Number, International Friction Index, Friction Testing.
18. Distribution Statement: No restrictions This document is available from the Research Division upon request.
19. Security Classification (of this report) None
20. Security Classification (of this page) None
21. No. Of Pages 53
22. Price
Form DOT F 1700.7 (8-72) Reproduction of form and completed page is authorized.
TABLE OF CONTENTS INTRODUCTION .............................................................................................................. 3 Background and Objective............................................................................................... 3 Report Organization......................................................................................................... 3 LITERATURE REVIEW ................................................................................................... 5 Pertinent Literature Summary.......................................................................................... 5 PAVEMENT FRICTION MANAGEMENT FRAMEWORK .......................................... 6 Pavement Friction ............................................................................................................ 6 Friction Components........................................................................................................ 6 Factors Influencing Pavement Friction............................................................................ 7 Pavement Surface Texture ............................................................................................... 8 Friction Data Collection................................................................................................... 9 PAVEMENT FRICTION MANAGEMENT OVERVIEW ............................................. 11 Friction Categories and Levels ...................................................................................... 11 Establishing Investigatory and Intervention Friction Levels ......................................... 12 Detailed Site Investigation............................................................................................. 16 Project Selection ............................................................................................................ 17 PFM Program Progress .................................................................................................. 17 CURRENT AND PROPOSED MDSHA FRICTION GUIDELINES AND IMPROVEMENT POLICIES........................................................................................... 18 Current Friction Practices in Maryland.......................................................................... 18 Friction Data Collection and Observation ..................................................................... 19 Candidate Safety Improvement Sections (CSIS)........................................................... 19 Current Friction Guidelines ........................................................................................... 19 Proposed MDSHA Friction Guidelines and Improvement Policies .............................. 21 Friction Program Development Guidelines- General Implementation.......................... 21 Friction Program Development Guidelines- for Immediate Implementation................ 25 Project Level Program Development Guidelines .......................................................... 28 Restoration Methods ...................................................................................................... 29 Additional Network Level Friction Improvement Policies ........................................... 34 Materials and Texture Testing and Selection................................................................. 35 FEEDBACK FROM MDSHA DISTRICTS AND OFFICALS....................................... 38 Timings/Schedule .......................................................................................................... 38 Funding Sources............................................................................................................. 38 RECOMMENDATIONS.................................................................................................. 39
1

LIST OF FIGURES Figure 1: Adhesion and Hysteresis (2) ................................................................................. 7 Figure 2: Type of Surface Friction(2) .................................................................................. 8 Figure 3: Establishing Friction Levels Using Historical Friction Data Only(2) ................ 14 Figure 4: Establishing Friction Levels Using Historical Friction and Crash Data(2) ........ 14 Figure 5: Establishing Friction Levels Using Pavement Friction Distribution and Crash Rate Friction Trend (2) ....................................................................................................... 15 Figure 6: Friction Assessment Process ............................................................................. 22 Figure 7: Friction Assessment Based on MDSHA’s Current Friction Rating System..... 27 Figure 8: Project Level Friction Assessment Process....................................................... 29 Figure 9: Friction Restoration Methods............................................................................ 33 LIST OF TABLES Table 1: Factors Influencing Pavement Surface Friction(2) ................................................ 7 Table 2: Factors Affecting Pavement Surface Texture(2).................................................... 9 Table 3: Factors Affecting Friction Testing(2) .................................................................. 10 Table 4: Friction Categories and Levels for New Zealand(2, 10) ........................................ 12 Table 5: Detailed Site Investigation Questions and Concerns(2,6,11,12) .............................. 17 Table 6: MDSHA’s Friction Practices(2).......................................................................... 18 Table 7: Friction Levels for Future Implementation(11) .................................................... 23 Table 8: Friction Levels Using MDSHA’s Current Friction Ratings ............................... 25 Table 9: Friction Levels Based on Roadway Functional Class ........................................ 34 Table 10: Schedule for the Friction Management Program.............................................. 38
2

DEVELOPMENT OF FRICTION IMPROVEMENT POLICIES AND GUIDELINES FOR MDSHA
INTRODUCTION
Background and Objective The Maryland State Highway Administration (MDSHA) monitors friction properties of pavement surfaces statewide. Additionally, each year the Office of Materials Technology (OMT) and the Office of Traffic and Safety (OOTS) work together to identify pavement locations that have exhibited inadequate friction levels and relatively high numbers of wet surface accidents throughout the state. Although there is a process in place to identify these locations, the process is somewhat informal and inconsistent across the various MDSHA District Offices. As a result of the MDSHA friction measurement and wet accident related activities, District Offices are required to prioritize and take action to address the noted locations. Consequently, the Districts should be given more guidance on how to better identify project candidates, and what actions can be taken to address these locations, including material selection, design life, and alternative temporary low-cost effective solutions until a more permanent fix can be applied. The objective of this study is to develop a systematic approach to select friction improvement candidates as well as establish state-wide friction policies to maximize MDSHA’s available resources.
Report Organization This report has been divided into the following 7 sections:
1. INTRODUCTION 2. LITERATURE REVIEW 3. PAVEMENT FRICTION MANAGEMENT FRAMEWORK 4. PAVEMENT FRICTION MANAGEMENT OVERVIEW 5. CURRENT AND PROPOSED MDSHA FRICTION GUIDELINES AND
IMPROVEMENT POLICIES 6. FEEDBACK FROM MDSHA DISTRICTS AND OFFICIALS 7. RECOMMENDATIONS
INTRODUCTION The Introduction contains important background information, the project objective, and the report organization for this study. LITERATURE REVIEW The Literature Review includes information about the literature search and provides a summary of the documents reviewed that were most pertinent to this study.
3

PAVEMENT FRICTION MANAGEMENT FRAMEWORK This section provides information about the basic concepts of pavement friction and surface texture, which are key concepts to understand pavement friction, and pavement friction management. This section also provides friction data collection information and covers the MDSHA current friction practices, both of which are part of the friction management framework. FRICTION MANAGEMENT OVERVIEW The friction management overview section includes important general information that is necessary for developing a friction management program. Essentially, the information presented in this section can be used by MDSHA to improve upon various friction management entities using MDSHA specific data. Furthermore, this section outlines important information on detailed site investigations, project selection, and friction restoration methods. It also covers the importance of documenting the friction management program’s progress for system feedback. CURRENT AND PROPOSED MDSHA FRICTION GUIDELINES AND IMPROVEMENT POLICIES This section presents the current and proposed friction guidelines and improvement policies developed for MDSHA. This section includes two sets of distinct guidelines for friction management. The first set includes all of the entities of a state-of-the-art friction management program and should be considered as the goal system for future implementation. The second set of guidelines was developed using MDSHA’s current friction ratings and is applicable for a more immediate implementation. This section also includes an additional friction improvement policy that exclusively addresses friction numbers at a network level. Additionally, this section includes information on material testing and selection, important aspects for setting and implementing friction policies, both on a network level and project level. FEEDBACK FROM MDSHA DISTRICTS AND OFFICIALS This section contains information from the brainstorming meetings held with the District Offices and other MDSHA officials. This section also provides a brief summary of the preferred schedule of events and funding sources for friction projects based on the feedback received at the brainstorming meetings. RECOMMENDATIONS Various recommendations to help MDSHA improve their friction practices are presented in this section of the report. Additional Information in the Report The report also contains 2 appendices: Appendix A, which includes a complete literature review and documents the sources utilized during the information gathering process. Appendix B includes an example form that could be used as aid for the detailed site investigation/field survey.
4
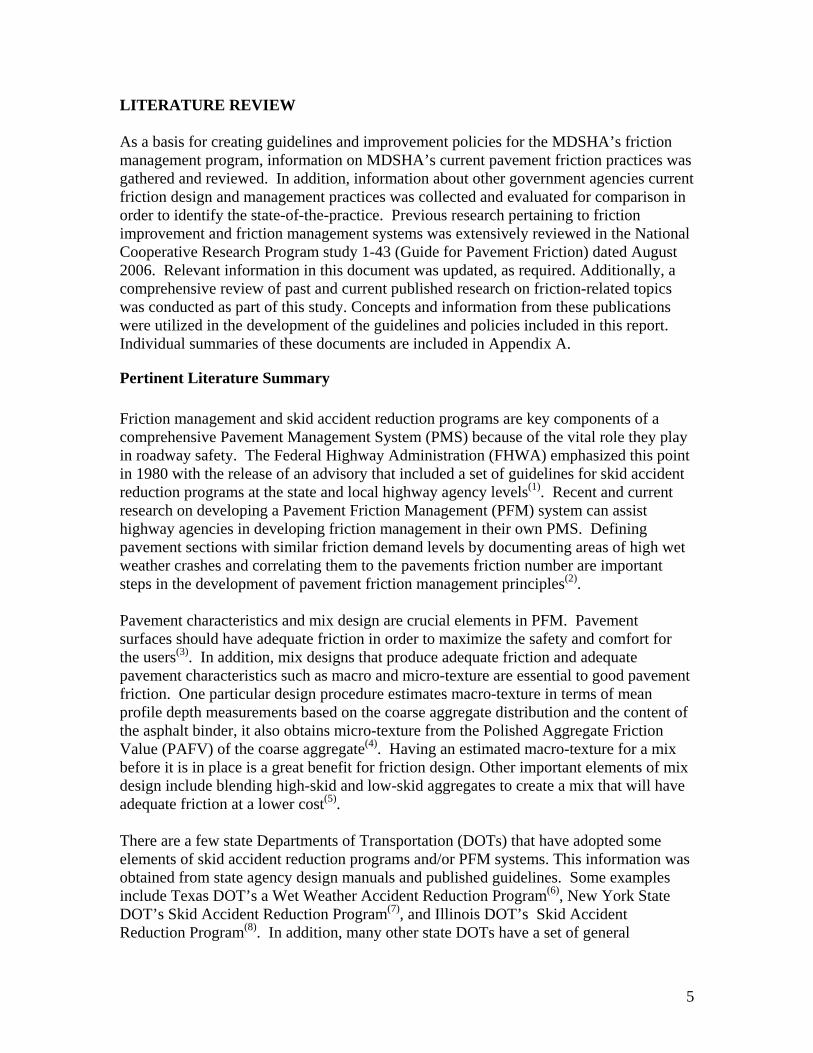
LITERATURE REVIEW As a basis for creating guidelines and improvement policies for the MDSHA’s friction management program, information on MDSHA’s current pavement friction practices was gathered and reviewed. In addition, information about other government agencies current friction design and management practices was collected and evaluated for comparison in order to identify the state-of-the-practice. Previous research pertaining to friction improvement and friction management systems was extensively reviewed in the National Cooperative Research Program study 1-43 (Guide for Pavement Friction) dated August 2006. Relevant information in this document was updated, as required. Additionally, a comprehensive review of past and current published research on friction-related topics was conducted as part of this study. Concepts and information from these publications were utilized in the development of the guidelines and policies included in this report. Individual summaries of these documents are included in Appendix A.
Pertinent Literature Summary Friction management and skid accident reduction programs are key components of a comprehensive Pavement Management System (PMS) because of the vital role they play in roadway safety. The Federal Highway Administration (FHWA) emphasized this point in 1980 with the release of an advisory that included a set of guidelines for skid accident reduction programs at the state and local highway agency levels(1). Recent and current research on developing a Pavement Friction Management (PFM) system can assist highway agencies in developing friction management in their own PMS. Defining pavement sections with similar friction demand levels by documenting areas of high wet weather crashes and correlating them to the pavements friction number are important steps in the development of pavement friction management principles(2). Pavement characteristics and mix design are crucial elements in PFM. Pavement surfaces should have adequate friction in order to maximize the safety and comfort for the users(3). In addition, mix designs that produce adequate friction and adequate pavement characteristics such as macro and micro-texture are essential to good pavement friction. One particular design procedure estimates macro-texture in terms of mean profile depth measurements based on the coarse aggregate distribution and the content of the asphalt binder, it also obtains micro-texture from the Polished Aggregate Friction Value (PAFV) of the coarse aggregate(4). Having an estimated macro-texture for a mix before it is in place is a great benefit for friction design. Other important elements of mix design include blending high-skid and low-skid aggregates to create a mix that will have adequate friction at a lower cost(5). There are a few state Departments of Transportation (DOTs) that have adopted some elements of skid accident reduction programs and/or PFM systems. This information was obtained from state agency design manuals and published guidelines. Some examples include Texas DOT’s a Wet Weather Accident Reduction Program(6), New York State DOT’s Skid Accident Reduction Program(7), and Illinois DOT’s Skid Accident Reduction Program(8). In addition, many other state DOTs have a set of general
5
guidelines that they follow for documenting wet weather accidents, and/or testing and maintaining pavement friction. MDSHA’s current friction practices were gathered from published documentation and through interviews of staff employees. Information on current testing and design procedures pertaining to aggregate selection, binder types, and other various elements of design were obtained from the 2006 MDSHA Pavement Design Guide(9) and included various MDSHA standards and specification manuals, and MDSHA published studies. PAVEMENT FRICTION MANAGEMENT FRAMEWORK
Pavement Friction Pavement friction is the resistive force that occurs between a rolling vehicle tire and the pavement surface. Adequate pavement friction is important because it helps keep vehicles on the roadway and provides drivers with the ability to maneuver their vehicle safely in all directions. Further, pavement friction is one of the key elements of roadway design including, roadway geometrics, horizontal and vertical curves, minimum required stopping distance, and superelevation calculations.
Friction Components Pavement friction is comprised of two separate frictional force components called adhesion and hysteresis. Adhesion is the force that occurs between the tire rubber and pavement surface due to small scale bonding, while hysteresis is the force associated with the energy loss that occurs when the tire deforms due to the shape/texture of the pavement surface. As shown in Figure 1, adhesion depends largely on the micro-level of the pavement, while hysteresis depends mostly on the macro-level of the pavement.
6

Figure 1: Adhesion and Hysteresis (2)
Factors Influencing Pavement Friction As mentioned previously, there are many factors that have an influence on the available pavement friction. All of these factors must be defined in order for the pavement friction to take on a definite value. The factors can be grouped into four categories and are shown below in Table 1. Note that the factors typically considered to be the most critical have been bolded. Table 1: Factors Influencing Pavement Surface Friction(2)
Pavement Surface Characteristics
Vehicle Operating Parameters Tire Properties Environment
• Micro-texture
• Macro-texture
• Mega-texture/unevenness
• Material properties
• Temperature
• Slip speed vehicle speed braking action
• Driving maneuver turning overtaking
• Foot Print
• Tread design & condition • Rubber composition and hardness
• Inflation pressure
• Load
• Temperature
• Climate Wind Temperature Water (rainfall,
condensation) Snow and Ice
• Contaminants Anti-skid material (salt, sand) Dirt, mud, debris
7

Pavement Surface Texture Surface texture has a significant effect on pavement friction. The four main types of surface friction are roughness/unevenness, mega-texture, macro-texture, and micro-texture, which are shown below in Figure 2. Roughness is an overall measure of pavement surface irregularities that have an affect on ride quality. Mega-texture is a measure of the roughness due to a section of pavement between 2 to 20 inches; anything larger than 20 inches would be considered roughness /unevenness. Macro-texture refers to the texture on specific aggregates, while micro texture refers to the degree of roughness revealed by individual particles.
Figure 2: Type of Surface Friction(2) There are many factors that affect pavement surface texture including specific mix properties and texturing techniques that are used after the pavement is in place. These factors are known to affect pavement micro-texture and/or macro-texture. This information is summarized in Table 2 below.
8

Table 2: Factors Affecting Pavement Surface Texture(2) Pavement Surface
Type Factor Micro-Texture Macro-Texture
Maximum aggregate dimensions X Coarse aggregate types X X Fine aggregate types X Mix Gradation X Mix air content X
Asphalt
Mix Binder X Coarse aggregate type X
(for exposed agg. PCC) X
(for exposed agg. PCC) Fine aggregate type X Mix Gradation X X
(for exposed agg PCC) Texture dimensions and spacing X Texture orientation X
Concrete
Texture skew X
Friction Data Collection Ideally, friction information should be collected on a network level annually. To achieve good standardized testing conditions, the following factors must be considered when collecting friction data:
• Season • Test Speed • Test Lane and Line • Ambient Conditions • Contamination
These factors and the reason for consideration are summarized below in Table 3.
9

Table 3: Factors Affecting Friction Testing(2)
Factors Consideration
Season for testing
Because significant variations in measured friction may occur across seasons within a given year, friction testing should be limited to a specific season or time of year when friction is typically lowest. This will help maintain some consistency in year-to-year measurements and reduce variability in measured data. For agencies that cannot perform all testing requirements within a given season, the following can be considered to reduce test variability: • Develop correction factors, as needed, to normalize raw friction test data to a common baseline season. • For a given pavement section, initial and subsequent testing must be done within a specific season (e.g., pavement sections originally tested in fall should subsequently be tested in fall).
Test speed
The standard speed recommended by AASHTO T 242 for pavement friction tests is 40 mi/hr (64 km/hr). However, since most agencies conduct friction tests without traffic control and because posted or operational speeds vary dramatically throughout a network, it is very difficult for the operator to conduct testing at just this speed. For such situations, the operator typically adjusts test speeds to suit traffic conditions and to assure a safe operation. Thus, it is recommended that friction values corresponding to testing done at speeds other than 40 mi/hr (64 km/hr) be adjusted to the baseline 40-mi/hr (64-km/hr) value to make friction measurements comparable and useful. To do this requires the establishment of correlations between friction measurements taken at 40 mi/hr (64 km/hr) and those taken at other speeds (i.e., speed gradient curves). The following equation can be used to adjust friction measurements to FN40:
FN(S) = FNV x e –S-V/Sp where: FN(S) = Adjusted value of friction for a speed S. FNV = Measured friction value at speed V. SP = Speed number. In order to produce accurate estimates of FN(S), SP must be established for a broad range of pavement macro-textures and texture measuring devices.
Test lane and line
Friction measurements must be done in the most heavily trafficked lane, as this lane usually carries the heaviest traffic and is, therefore, expected to show the highest rate of friction loss (worst case scenario). For 2-lane highways with a near 50-50 directional distribution of traffic, testing a single lane will suffice; otherwise, the lane in the direction with heavier traffic should be tested. For multilane highways, the outermost lane in both directions is typically the most heavily trafficked and should be tested. Where the outermost lane is not the most heavily trafficked, a different lane or more than one lane should be tested. Test measurements must be carried out within the wheelpath, as this is the location where friction loss is greatest. Note that it is important to test along the same lane and wheelpath to maintain some consistency between test results and to reduce variability. If it is necessary to deviate from the test lane and wheelpath (e.g., to avoid a physical obstruction or surface contamination), the test data should be marked accordingly.
Ambient conditions
Because ambient conditions can have an effect on pavement friction, it is important to standardize ambient test conditions to the extent possible and document ambient test conditions so the measurements can be corrected as needed. The following should be noted when setting ambient conditions for testing: • Testing in extremely strong side winds must be avoided because these can affect the measurements by creating turbulence under the vehicle that causes the water jet to be diverted from the correct line. • Testing must be avoided in heavy rainfall or where there is standing water on the pavement surface. Excess water on the surface can affect the drag forces at the pavement–tire interface and influence the measurements. • Measurements shall not be undertaken where the air temperature is below 41°F (5°C).
Contamination Contamination of the pavement surface by mud, oil, grit, or other contaminants must be avoided.
10

PAVEMENT FRICTION MANAGEMENT OVERVIEW PFM is an essential component of a good pavement management program. The basic components and initial steps necessary for developing a good friction management program are explained in the following sections of this report.
Friction Categories and Levels Friction levels are typically broken down into two categories: Investigatory Levels and Intervention Levels, which are defined below. The Investigatory Level is the point in a friction deterioration curve where an agency should start monitoring the friction and/or crash levels more carefully at a particular site and begin the process of planning for some sort of restorative action. The Intervention Level is the point in a friction deterioration curve where an agency must either take immediate corrective action, such as applying a restorative treatment, or provide proper cautionary measures, such as posting “Slippery When Wet” signs and/or reduced speed signs. Friction site categories and friction levels are created based on highway features/environment, highway alignment, traffic characteristics, and frictional needs. As a minimum, friction categories should be developed based on highway design speed and traffic information since these factors are directly related to the mico-texture and macro-texture needs of a given roadway. Other factors that are commonly used to develop friction categories and levels include the functional class of the roadway, regional weather patterns (wet/dry), the number of lanes, and the percent trucks on a roadway. As an example, New Zealand implemented a friction management specification in 2002 which included the site categories and friction levels presented in Table 4(10). This example provides the Investigatory Level (IL) and Intervention (in this case called the Threshold Level (TL)) Level used by Transit New Zealand. In New Zealand the Investigatory Level is the level of skid resistance that triggers a site investigation. Furthermore, the Threshold Level in this specific example was set at 0.1 below the Investigatory level and is used and a trigger level for determining priority for treatment. It should also be noted that New Zealand’s skid numbers are presented in decimal form and can be multiplied by 100% to obtain values similar to the ones currently used by MDSHA.
11

Table 4: Friction Categories and Levels for New Zealand (2, 10)
Site Category Site Definition Investigatory
Level (IL) Threshold Level (TL)
1
Approaches to: • Railway level crossings • Traffic lights • Pedestrian crossings • Roundabouts • Stop and Give Way controlled intersections
(where the State Highway traffic is required to stop to give way),
• One Lane Bridges (including bridge deck).
0.55 0.45
2 • Curve < 250m radius • Down gradients > 10% 0.50 0.40
3
• Approaches to road junctions (on the State Highway or side roads).
• Down gradients 5 – 10% • Motorway junction area including On/Off
Ramps
0.45 0.35
4 • Undivided carriageways (event-free)* 0.40 0.30 5 • Divided carriageways (event-free)* 0.35 0.25
*Event-Free = Where no other geometrical constraint, or situations where vehicles may be required to brake suddenly, may influence the skid resistance requirements.
Site categories like the ones shown in Table 4 help prioritize the friction demand (defined in the next section) and friction levels for each pavement section within a given network. The number of site categories should be small (typically no more than 5), but large enough to establish investigatory and intervention/threshold friction levels for the pavement network. Friction site categories, demand categories, and friction levels were developed for MDSHA and are shown in an impending section of this report. It is important to note that all friction categories should be re-assessed periodically to reflect the agency’s current needs.
Establishing Investigatory and Intervention Friction Levels Friction requirements for each section of roadway are unique, and because roadway characteristics are constantly changing there is no definitive value that delineates ‘safe’ and ‘unsafe’ friction values. The level of friction needed to prevent a vehicle from slipping or sliding is defined as the friction demand. In an ideal situation it would be best to have the friction supply exceed that of the friction demand; however, this is not possible in many situations because of ever-changing conditions. Furthermore, the cost of this overly conservative approach would be immense. A more sensible approach is to establish site categories for each section of roadway within the pavement network and maintain an appropriate level of friction based on friction demand. Establishing investigatory and intervention friction levels require detailed investigation of pavement micro-texture and macro-texture. The following three methods, which come from the NCHRP Guide for Pavement Friction, are recommended
12

to establish investigatory and intervention friction levels for MDSHA’s pavement network. All three methods use historical friction information in terms of Friction Number (FN) or International Friction Index (IFI) (F(60), Sp), where ( F(60)) is the friction number and (Sp) is a speed number. Friction data information has been presented in terms of a single FN for many years. This single FN describes the friction between the vehicle tire and the pavement surface. However, the IFI, developed by the World Road Association (PIARC) in the early 1990’s, reports friction in terms of two numbers: a friction number ( F(60)) and a speed number (Sp). The IFI is reported as follows: IFI (F(60, Sp)) The IFI friction number, F(60), is the friction for a slip speed of 37 mph (60 kph), which is very close to the slip speed used for the collection of the FN currently used by MDSHA. The IFI speed number, Sp, defines a relationship between the measured friction and vehicle tire free rotation. Sp is calculated from measured pavement macro-texture in terms of Mean Texture Depth (MTD) or Mean Profile Depth (MPD), obtained using a standardized test method. Method 1: Establishing Friction Levels Using Historical Friction Data Only The first method requires the least amount of data of the three. The FN, IFI, or friction parameter value is plotted against the pavement age in years. As the pavement ages the friction value decreases and at some specific friction values the number drops at a significantly faster rate than initially. This value, where the increase in rate drop occurs, can be set to the investigatory level as shown in Figure 3. An intervention friction level can then be set to a specified amount, such as 5 friction points or 10%, below the investigatory level. The friction value that occurs right as the friction begins to drop rapidly can be found either statistically or graphically. A step-by-step example of the graphical method is provided below and shown in Figure 3.
• Step 1: Plot pavement friction versus age/time for a given friction demand category
• Step 2: Develop a friction loss deterioration curve based on the measured data. • Step 3: Graphically determine the slopes of the three stages of the S-shaped
friction loss versus pavement age/time relationship. • Step 4: Set the investigatory level as the friction value where there is a significant
increase in the pavement friction loss. • Step 5: Set intervention level at a certain value or percentage below the
investigatory level
13

Figure 3: Establishing Friction Levels Using Historical Friction Data Only(2) Method 2: Establishing Friction Levels Using Historical Friction and Crash Data In addition to historical friction data, Method 2 requires corresponding historical crash rate data resulting in a better prediction of the intervention friction level for a specific site category. The procedure for determining the investigatory friction level is the same as presented previously and should be set to the value that occurs as the friction rate begins to drop at a rapid rate. The intervention level is obtained by plotting the crash data and determining when there is a dramatic increase in the number of crashes. The expected result of this effort is provided in Figure 4.
Figure 4: Establishing Friction Levels Using Historical Friction and Crash Data(2)
14

Method 3: Establishing Friction Levels Using Pavement Friction Distribution and Crash Rate- Friction Trend This method requires a histogram of pavement friction data plotted along with crash rate data for the specific friction category which levels are being set. A step-by-step example of this method is provided below and shown in Figure 5.
• Step 1: Plot a histogram of pavement friction for a given friction demand category, based on current history. On the same graph, plot the current wet-to-dry crash ratio for the same sections as the friction frequency distribution.
• Step 2: Determine the mean pavement friction and standard deviation for the pavement friction frequency distribution.
• Step 3: Set the investigatory level as the mean friction value minus “X” standard deviations (say, 1.5 or 2.0) of the distribution of sections and adjust to where wet-to dry crashes begin to increase considerably.
• Step 4: Set intervention level as the mean friction value minus “Y” standard deviations (say, 2.5 or 3.0) of the distribution of sections and adjust the level to a minimum satisfactory wet-to-dry crash rate or by the point where the amount of
money is available to repair that many roadway sections.
Figure 5: Establishing Friction Levels Using Pavement Friction Distribution and Crash Rate Friction Trend (2) Investigatory and intervention friction levels should be reviewed periodically and revised as needed.
15

Detailed Site Investigation It is necessary for pavement sections that are at or below the investigatory or intervention levels to undergo a detailed site investigation. There are two main purposes of the investigation:
1. To identify any factors other than friction that may be contributing to unsafe roadway conditions.
2. To determine the causes of insufficient micro-texture and/or macro-texture The first step can be achieved by conducting a visual or video survey for each inadequate pavement section. Factors that may be contributing to or compounding the friction problem should be identified and documented in terms of available friction and friction demand. Additionally, any other factors that could be contributing to unsafe roadway conditions should be recorded. These factors can include vertical alignment, horizontal alignment, lay out of lanes and intersections, traffic control devices, glare, sight distance, and the amount and severity of existing pavement distresses. A sample field exploration form for the detailed site investigation is provided in Appendix B. The second step of the detailed site investigation is to evaluate the pavement micro-texture and macro-texture, which is achieved through testing. The following tests are example procedures generally recommended to determine micro-texture and macro-texture: Micro-texture tests- • Locked wheel friction tester • British Pendulum Tester (BPT) • Dynamic Friction Tester (DFT)
Macro-texture tests- • High-speed laser • Circular Texture Meter (CTM) • Sand Patch Method (SPM)
The testing should produce a representative sample of the entire pavement area that is being evaluated. Additional information should be collected on roadway characteristics from historical and current records, and field testing. This information should include pavement type, traffic in terms of annual daily traffic (ADT), percentage of trucks, construction materials information, and any other information available that may lead to the identification of the reason for the friction loss. A series of recommended questions that should be answered through the detailed site investigation are provided in Table 5.
16

Table 5: Detailed Site Investigation Questions and Concerns (2,6,11,12) Step Description Recommended Action
1 Site location
1. What is the friction demand for this location? 2. What are the current investigatory and intervention friction levels? 3. Has there been any substantial change in the amount or type of applied
or highway features to warrant a change in friction demand category and associated changes in investigatory and intervention levels? If so, reclassify the friction demand as appropriate.
4. Document recent weather and traffic conditions at the site location. Has there been any unusually bad weather (excessive rainfall, snow blizzards, etc.)? Document unusual weather occurrences and investigate if they can be a possible reason for crash rates.
2 Pavement condition
1. What are the current friction levels? 2. By how much is the current friction level below the investigatory level
and over what length? 3. Is pavement friction uniform over the site or are there significant
variations? If there are significant variations, perform a detailed visual assessment and testing as needed to describe this situation in detail.
4. Is the minimum friction pavement measurement below the intervention level? If so, what percentage of the site is below the intervention level?
3 Crash history
1. What is the location of crashes in relation to the observed variability in measured pavement friction?
2. Are crashes generally located in localized areas with low friction? 3. If not, is there any other pattern apparent in the location or type of
crashes that would warrant more crash investigation? 4. Have there been any significant changes to the site or the traffic in the
analysis period, which could have affected the number of crashes?
4 Visual assessment
1. Is the visual inspection of surface condition consistent with the available survey data?
2. Friction is generally measured in the nearside wheel track in the outside lane. Is the rest of the of the area of the maintained pavement surface visually consistent with the measured path, or ate there ant localized areas of polished surfacing, low texture depth, patching or areas of otherwise likely to give rise to uneven friction (i.e., is it likely that the friction of other lanes could be lower than the lane tested)?
3. If there is a lack of uniformity in friction measurements across the site, is it likely to increase the risk of crashes occurring?
Project Selection The last step in crafting a pavement friction monitoring program is to develop a set of guidelines for project selection. The sites requiring detailed investigation and restoration must first be identified using the friction level and site category information for the pavement network. Each agency should develop these guidelines based on their specific needs and objectives. Proposed guidelines for project selection and friction restoration developed for MDSHA are presented in detail in subsequent sections.
PFM Program Progress As with any system, it is important to measure the progress of an agency’s PFM program and update portions of the program as necessary to increase efficiency and obtain a better
17

end product. After a section is restored, friction information should be collected for the section yearly to ensure that the restoration method chosen was able to provide adequate friction. If a treatment could not provide the expected improvement, the treatment materials and method should be re-evaluated and the friction program should be updated as needed. Furthermore, a process should be adapted to measure the friction program progress on a network level each year. There are a number of ways that progress can be evaluated for a friction program and each agency should develop a process that will enable them to meet their specific goals and objectives. CURRENT AND PROPOSED MDSHA FRICTION GUIDELINES AND IMPROVEMENT POLICIES
Current Friction Practices in Maryland MDSHA currently collects friction information on a network level using a skid trailer and a standardized ribbed tire in accordance to the procedure set forth in ASTM E 274. The Friction Number (FN), also referred to as the Skid Number (SN), is defined in ASTM E 274 as, “the retarding force generated by the interaction between a pavement and a tire under locked, non-rotating wheel condition.” FN values are collected annually in Maryland every one third of a mile for the entire pavement network. The values are collected in the outer most lane for both traffic directions. In addition to collecting FN values on a network level, MDSHA collects friction information on a project level as needed. These special requests are typically originated by the Traffic and/or Maintenance Offices in the Districts. MDSHA’s current friction practices, along with 44 other agencies current practices, were documented from a survey conduced in 2003 as part of the study, “A Guide for Pavement Friction(2).” MDSHA’s Current Friction Practices as recorded in the survey are summarized below in Table 6. Table 6: MDSHA’s Friction Practices (2)
ASTM E247 Pavement Surface Friction Testing Test Methods Preformed to Characterize Pavement-Tire Noise
Smooth Tire Ribbed Tire Pass by Measurements of total Traffic Flow
Pass by Measurements of Individual Vehicles
Vehicle Interior Measurements
No Yes Unknown* Unknown* Unknown* *Office of Environmental design is responsible for noise measurements
Test Methods Preformed to Characterize Pavement-Tire Noise Texture Testing Textures Specified for Noise
in PCC Design
Near Tire Measurements in
Field
Near Tire Measurements in
Lab
NCAT Noise Trailer
Frequency of Pavement Surface Texture Testing Finishing Method
Unknown* Unknown* Unknown* Never None *Office of Environmental design is responsible for noise measurements
18

Table 6 : MDSHA’s Friction Practices (2) (Continued) Surface Material Requirements and Finishing Specifications
Use of Specific
Aggregate Types
Surface Texture
Requirements
Aggregate Size,
Gradation, Shape
Aggregate Polish Value
Mix Type (for AC)
Use of Additives and Rubber
(for AC)
Surface Finishing (for PCC)
No No Yes Yes Yes No Yes Methods for PCC Finishing/Texturing
Tining Grooving Burlap Grinding Astroturf drag Sawcutting Yes Yes Yes No No No
Treatments to Restore Pavement Surface Friction
Grinding Thin Overlays
Micro- surfacing
Shot blasting Grooving Milling Scarifying Chip Seals
Yes Yes Yes No No No No No
Friction Data Collection and Observation Friction Numbers are currently used by the MDSHA’s Office of Materials Technology (OMT) as part of pavement performance evaluation and project level design. MDSHA design divisions and local District Offices sometimes use these numbers to identify zones with friction deficiencies and create projects to address these situations under safety improvement and system preservation funding. Network Friction Numbers are available to users through a web-based software developed in-house by MDSHA (“PMBase”). In addition to viewing friction information for every one third of a mile, the minimum, maximum, and average FN values can be viewed for a defined section of road or for specific routes using PMBase
Candidate Safety Improvement Sections (CSIS) MDSHA’s Wet Accident list, officially referred to as the Candidate Safety Improvement Sections (CSIS) list, contains a list of pavement sections (0.5 to 1 mile in length) where more than 10 wet weather accidents have occurred or where the percentage of wet weather accidents is at least twice the state average. The CSIS list is also available to MDSHA staff and on-site consultant pavement design engineers. This list can be used in conjunction with the network friction information to help engineers identify areas of inadequate friction with high accident rates. Informally, this CSIS list has been the basis for the selection of sections for friction improvement projects.
Current Friction Guidelines Although FN information and typical friction thresholds are available for MDSHA’s designers and consultant pavement engineers, no specific guidelines or methodology for friction evaluation and pavement friction management are currently in place to aide in friction assessment at a network level. However, at a project level, District 3 currently uses a set of friction guidelines developed to address and prioritize pavement sections with inadequate friction. This approach uses the CSIS list and an index value, which
19

takes into account the friction number and the number of wet weather accidents, to prioritize pavement sections needing friction restoration. There are also guidelines to determine the treatment type, either grind and overlay or slurry seal, based on existing pavement distresses. The following is the criteria (presented verbatim) used by District 3 for determining the friction restoration alternative: Criteria for determining Slurry Seal and Grind & Resurfacing Candidates:
1) Check L_Rut % > 0.5” 2) Check R_Rut % > 0.5” 3) If either (1) or (2) is > 0.75%, then Grind & Resurface 4) If both (1) and (2) are <0.75%, then perform Slurry Seal
DO NOT use Slurry Seal treatment if:
• There are medium to high distresses that require substantial patching • There is medium to high rutting
Steps 1 – 4 use MDSHA’s PMBase software. The PMBase software has the capability to report rutting data statistics for the left and right wheel paths based on user specified project limits for the desired year of the survey. Rutting data is collected for 100 samples every 10th of a mile and the data is reported as follows:
• Count of rutting data > 0.5” in depth (for both the left and right wheel paths) • Percentage of rutting data > 0.5” in depth (for both the left and right wheel paths)
If the percentage of rutting > 0.5” for both wheel paths is less than 0.75%, slurry seal is a viable method for friction restoration. If the percentage of rutting > 0.5” for either wheel paths is greater than 0.75%, grinding and resurfacing is the preferred method for friction restoration. Furthermore, based on a project-specific condition survey, if there are medium to high distresses that require substantial patching, or if there is medium to high rutting, a slurry seal should not be used. The current set of guidelines used in District 3 only addresses friction inadequacy for a small portion of the MDSHA’s pavement network. Furthermore, the District 3 guidelines only provide two treatment alternatives for friction restoration and do not take into account other possible factors that may influence the number of wet weather accidents. The friction management system proposed in this document will address network level friction assessment as well as project level assessment, and suggest a number of restoration techniques for flexible, composite, and rigid pavement types. Furthermore, this document will provide insight on materials selection so that friction specifications may be developed by MDSHA.
20

Proposed MDSHA Friction Guidelines and Improvement Policies In an effort to assist engineers at MDSHA, network and project level friction improvement policy guidelines were developed. These guidelines focus on information that is necessary to implement a state-of-the-art PFM program as part of MDSHA’s PMS These guidelines include actions required to assess friction needs of pavement sections at both network and project levels. Additionally, an improvement policy relating exclusively to FN data only was also developed to assist OMT engineers with project selection for friction improvement.
Friction Program Development Guidelines- General Implementation The following friction program development guidelines present a methodology for determining and assessing the priority of the friction improvement needed for MDSHA’s pavement network. The pavement sections are first assessed on a network level, and then prioritized for each of the seven MDSHA Districts. The network level friction measurement and the weather-related listings are used, along with site categories and friction level information to produce a final list of pavement sections by priority. This step-by-step process for assessing and managing friction on a network level and project level is described below and provided in Figure 6 contains only general parameters, such that it can be used with any particular set of categories and friction levels. The following 7-step process includes the steps that are recommended to be taken by the OMT’S Pavement and Geotechnical Division (PAGD). Once the 7-step process is complete, OMT will have a list of friction improvement candidates for each of the seven MDSHA District Offices. There is an additional 5-step process that could be completed by each District Office and their corresponding PAGD team which is presented in the ‘Project Level Program Development Guidelines’ section of this report. The proposed PFM program presented in Figure 6 includes both processes which are separated by green shading.
21

Figure 6: Friction Assessment Process
NO
YES
YES
Not a friction related issue.
Provide information to
the appropriate MDSHA offices
Re-test section for friction
YES
At or above Design Level: Friction is Adequate
Site is categorized as Low Priority
NO
Intervention Level: Friction is poor
Site is categorized as High Priority*
Investigatory Level: Friction is Marginal
Site is categorized as Medium Priority*
Select sites for further review based on priority and budget.
Determine treatment type and cost alternatives
Schedule and complete
restoration activities.
Is FN below the Design Level?
NO
Is FN below the Investigatory Level?
Is re-tested FN below the Design Level?
Define Pavement Network using MDSHA’s Site Categories. Site Categories will define Threshold, Investigation, and Intervention friction
levels. Re-assess friction categories periodically.
Perform Routine Network Level Friction Testing
Couple MDSHA’s Wet Accident List with Network Level Friction Data and perform a site visit for each location to determine if high wet accident rates are due to roadway geometrics or any
other non-friction related issues.
Obtain MDSHA’s Candidate Safety Improvement Sections (CSIS) listings, also referred to as MDSHA’s Wet Accident list
Is there conclusive evidence that friction
is NOT an issue?
YES NO
Compile Network and Project (District) Level Lists. Use Crash Severity index within each friction priority category to
prioritize each site.
See Project Level Flowchart
Test FN on restored section
for feedback
*Perform Detailed Site Investigation Note: Revise Procedure as Necessary
22

7-Step Process to be Conducted by the Office of Materials and Technology Step 1: Define Pavement Network for Friction The first step in creating a PFM program is to delimit a pavement network by defining site categories and establishing friction levels applicable to MDSHA’s pavement network. Table 7 presents the proposed site categories along with the required friction levels to perform network and project level friction analyses. The values were determined using a similar table published by MDSHA in a manuscript titled “Developing a Design Policy to Improve Pavement Surface Characteristics” (11). Additionally, the threshold, investigatory, and intervention friction levels proposed are similar to those used by other agencies. The demand category gives priority (either high or low) to the site categories based on their defined condition. Friction categories and levels should be re-assessed periodically due to the ever-evolving roadway conditions. Table 7: Friction Levels for future implementation (11)
Site Category Site Description Threshold
FN Investigatory
FN Intervention
FN Demand Category
1 Approach rail road crossings, traffic lights, pedestrian crossings, Stop and Give Way controlled intersections (SH only).
55 50 45 High
2 Curves with radius=<250m, downhill gradients > 10% and > 50m long, Freeway/highway on/off ramp.
50 45 40 High
3 Approach to intersections, downhill gradients 5 to 10%. 45 40 35 High
4 Undivided Highways without other geometric constraints which influences frictional demand
40 35 30 Low
5 Divided highways without any other geometrical constraints which influences frictional demand.
35 30 25 Low
Step 2: Perform Network Level Friction Testing FN data should be collected for the entire pavement network annually. As mentioned previously, MDSHA currently collects friction data annually every 1/3 of a mile for the entire pavement network. The data collection is preformed using a skid trailer and a standardized ribbed tire in accordance to the procedure set forth in ASTM E 274. MDHSA’s current data collection practices will produce sufficient friction information for the proposed PFM program; however, the data is limited and can be improved to complement the existing and enhance the PFM program as discussed in the “Recommendations” section of this report.
23

Step 3: Couple friction information with the sections on the CSIS list The most recent friction numbers should be coupled with the sections appearing on the CSIS list annually. The information should be stored in a spreadsheet or database and include the following fields: district, county, section limits, route, functional class, traffic information (AADT, percent trucks, etc.), crash information (total crashes, wet weather crashes, severity, etc.), and friction numbers. Step 4: Visit Sites on CSIS list A brief site investigation should be held for each section on the wet accident list. During this site evaluation the investigator shall record any factors in addition to friction that might be influencing high wet accident rate. The recorded information should include the FN of the section, the minimal friction number needed to be considered adequate, an observation of the traffic patterns at the section (including any queuing of cars or potential for car queuing at the intersections if applicable), any possible issues relating to roadway geometrics, and any potential site distance issues. The investigator should also visually inspect the pavement for friction problems such as bleeding, segregation in the mix, poor macro-texture and/or micro-texture, rutting or any distress that may favor water accumulation. If the investigator can determine that friction is not the reason for the wet weather crashes, the supporting information should be documented and sent to the appropriate Office within MDSHA, so that the issue causing the wet weather crashes can be addressed as quickly as possible. Step 5: Determine Friction Priority Level The friction priority level can be determined using the methodology presented in Figure 6 and the friction levels created in and Table 7. If the friction number is above the threshold level the friction should be re-tested in order to ensure that the originally recorded friction number is correct. The friction priority level will either be high, medium or low. Step 6: Perform a Detailed Site Investigation for all Medium and High Priority Sites A detailed site investigation should be conducted for each medium and high priority site that makes the wet accident list. As mentioned previously, the two main purposes of a detailed site investigation are to (1) identify any factors other than friction that may be contributing to unsafe roadway conditions and to (2) determine the causes of insufficient micro-texture and/or macro-texture. A field survey form is provided for step (1) in Appendix B. Step (2) requires testing of the micro-texture and macro-texture of the pavement section using a combination of the testing equipment discussed earlier in the report.
24
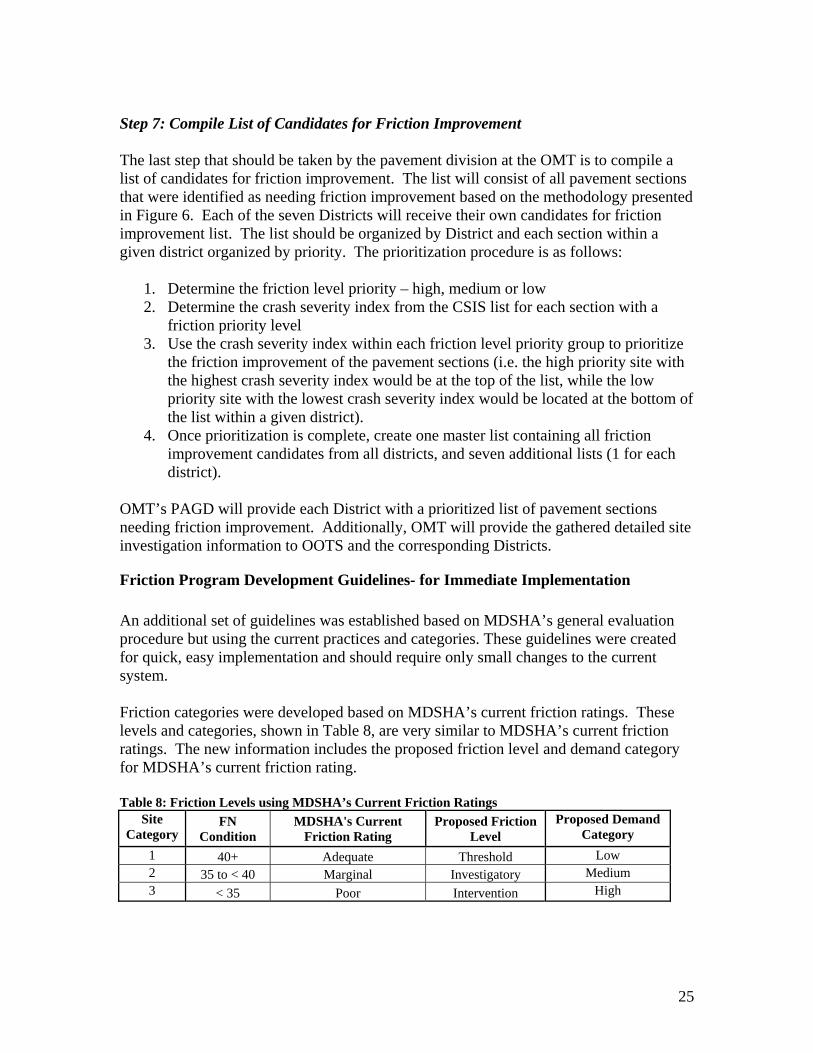
Step 7: Compile List of Candidates for Friction Improvement The last step that should be taken by the pavement division at the OMT is to compile a list of candidates for friction improvement. The list will consist of all pavement sections that were identified as needing friction improvement based on the methodology presented in Figure 6. Each of the seven Districts will receive their own candidates for friction improvement list. The list should be organized by District and each section within a given district organized by priority. The prioritization procedure is as follows:
1. Determine the friction level priority – high, medium or low 2. Determine the crash severity index from the CSIS list for each section with a
friction priority level 3. Use the crash severity index within each friction level priority group to prioritize
the friction improvement of the pavement sections (i.e. the high priority site with the highest crash severity index would be at the top of the list, while the low priority site with the lowest crash severity index would be located at the bottom of the list within a given district).
4. Once prioritization is complete, create one master list containing all friction improvement candidates from all districts, and seven additional lists (1 for each district).
OMT’s PAGD will provide each District with a prioritized list of pavement sections needing friction improvement. Additionally, OMT will provide the gathered detailed site investigation information to OOTS and the corresponding Districts.
Friction Program Development Guidelines- for Immediate Implementation An additional set of guidelines was established based on MDSHA’s general evaluation procedure but using the current practices and categories. These guidelines were created for quick, easy implementation and should require only small changes to the current system. Friction categories were developed based on MDSHA’s current friction ratings. These levels and categories, shown in Table 8, are very similar to MDSHA’s current friction ratings. The new information includes the proposed friction level and demand category for MDSHA’s current friction rating. Table 8: Friction Levels using MDSHA’s Current Friction Ratings
Site Category
FN Condition
MDSHA's Current Friction Rating
Proposed Friction Level
Proposed Demand Category
1 40+ Adequate Threshold Low 2 35 to < 40 Marginal Investigatory Medium 3 < 35 Poor Intervention High
25

The step by step process for MDSHA’s ‘Friction Program Development Guidelines- for immediate implementation’ follows for the same 7-step methodology presented in the “MDSHA Friction Program Development Guidelines- for General Implementation” section, but uses the specific values presented in Table 8 as shown below in Figure 7. Just as stated in the previous section, this 7-step process and should be carried out by OMT and followed by the additional 5 step process presented in the ‘Project Level Program Development Guidelines’ section of this report.
26

NO
YES
YES
Not a friction related issue.
Provide information to the
appropriate MDSHA offices
Re-test section for friction
YES
Friction is Adequate Site is categorized as
Low Priority
NO
Friction is poor Site is categorized as
High Priority*
Friction is Marginal Site is categorized as
Medium Priority*
Select sites for further review based on priority and budget.
Determine treatment type
and cost alternatives
*Perform detailed site investigation Note: Revise Procedure as Necessary
Schedule and complete
restoration activities.
Is FN ≤ 40?
NO
Is FN ≤ 35?
Is re-tested FN ≤ 40?
Define Pavement Network using MDSHA’s Site Categories. Re-assess friction categories periodically.
Perform Routine Network Level Friction Testing
Couple MDSHA’s Wet Accident List with Network Level Friction Data and perform a site visits for each location to determine if high wet accident rates are due to roadway
geometrics or any other non-friction related issues.
Obtain MDSHA’s Candidate Safety Improvement Sections (CSIS) listings, also referred to as MDSHA’s Wet Accident list
Is there conclusive evidence that friction
is NOT an issue?
YES NO
Compile Network and Project (District) Level Lists. Use Crash Severity index within each friction priority category to prioritize each
site.
Test FN on restored section
for feedback
See Project Level
Flowchart
Figure 7: Friction Assessment Based on MDSHA’s Current Friction Rating System
27

Project Level Program Development Guidelines The project level improvement policy and guidelines present a group of actions that should be completed on a project level once the candidates for friction improvement list has been compiled and distributed to the Districts. This process is shown at the project level toward the bottom of Figure 6 and Figure 7, beginning at the green shading. Furthermore, the 5 step process is shown independently in Figure 8. Each of the five steps, to be conducted by the district offices and their supporting PAGD team, is described below. Step 1: Obtain the friction Improvement List by District The first step is to obtain the candidates for friction improvement list from OMT. In addition to the list, information gathered from all field explorations, and any other supporting documents from specific sites should be provided Step 2: Select Sites for Further Review Based on Priority and Budget Each District will have a specified amount of funds available for safety improvement projects. It will be the decision of the District to allocate funding for pavement sections listed on the friction priority list. Step 3: Determine Treatment Types and/or Cost Alternatives Based on the remaining life (time from last rehabilitation) and the condition of the pavement the most cost effective treatment for friction restoration should be determined. There are various methods that can be used to restore pavement friction. These methods are described in great detail in a subsequent section of this report titled, “Restoration Methods”. The Restoration methods section includes a procedure for selecting different friction treatment types based on pavement condition. Also, Figure 9 in the Restoration Methods section shows the most cost-effective methods of restoration and timing of application depending on pavement type, remaining design life, and allocated budget. Step 4: Schedule and Complete Restoration Activities Once a restoration activity is selected, it should be scheduled and completed using the current procedure for projects receiving funding. If for any reason the project is scheduled and not completed, other temporary methods of warning (such as temporary roadway signs) may be utilized until the project can be completed. Step 5: Re-test the Friction on the Restored Pavement Section for System Feedback. Re-testing the pavement section for feedback into the pavement friction management system is recommended for all restored pavement sections. Many studies have concluded that the friction number is considered to reach a near steady state about one year after treatment, including a study conducted by MDSHA(13). Therefore, the re-testing for
28
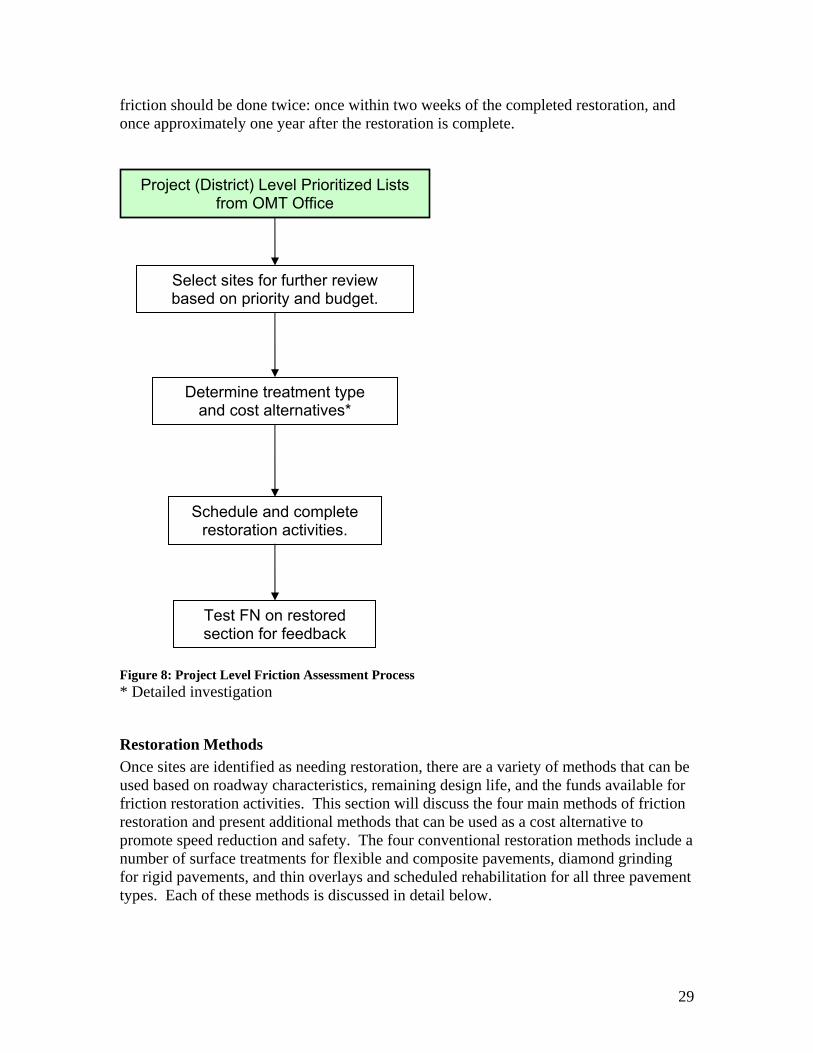
friction should be done twice: once within two weeks of the completed restoration, and once approximately one year after the restoration is complete.
Project (District) Level Prioritized Lists from OMT Office
Select sites for further review based on priority and budget.
Determine treatment type and cost alternatives*
Schedule and complete restoration activities.
Test FN on restored section for feedback
Figure 8: Project Level Friction Assessment Process * Detailed investigation
Restoration Methods Once sites are identified as needing restoration, there are a variety of methods that can be used based on roadway characteristics, remaining design life, and the funds available for friction restoration activities. This section will discuss the four main methods of friction restoration and present additional methods that can be used as a cost alternative to promote speed reduction and safety. The four conventional restoration methods include a number of surface treatments for flexible and composite pavements, diamond grinding for rigid pavements, and thin overlays and scheduled rehabilitation for all three pavement types. Each of these methods is discussed in detail below.
29

Surface Treatments Surface treatments can be used to increase the skid resistance of many pavement surfaces, but surface treatments will not add significant pavement structure . Therefore, surface treatments should be used as a friction restoration activity only when the pavement is structurally sound, and not reaching the end of its design life. The various types of surface treatments that can be used to increase pavement friction are shown below and include information on the improvement they may provide.
• Slurry Seal- A slurry seal is a mixture of crushed aggregate and emulsified asphalt which is applied to the pavement as a corrective measure to seal cracks on the pavement preventing water damage and providing a new wearing surface. In addition, it may improve pavement friction properties. A MDSHA study found that on average slurry seals can increase the friction number by 5 to 8 units when compared to other surface treatments used in Maryland(13). Slurry seals should only be applied to pavements with no to low severity distress that are structurally sound.
• Chip Seal- A chip seal is an application of polymer modified asphalt emulsion
followed by an application of aggregate. Part of the aggregate is left exposed (uncovered by the asphalt emulsion) in order to increase surface friction. A study in Ontario, Canada found that chip seals can provide friction numbers anywhere from 45 to more that 60 depending on the quality of the aggregate used for the treatment (14). In addition to improving friction, chip seals also are used to waterproof the surface and seal cracks. Chip seals are only typically recommended for rural roads that experience low traffic volume.
• Micro -surfacing- Micro-surfacing mix includes polymer modified asphalt
emulsion, well graded aggregate, portland cement concrete, water, and chemicals that help regulate set time. In terms of expected friction improvement, one study in Ontario, Canada involving one roadway found that the friction number range before micro surfacing was between 27 to 30, the friction number directly after micro surfacing was 58 to 63, and the final measured friction number range was 54 to 58 one year after construction (14). Micro surfacing can be typically used on roadways with medium to high traffic. It should not be used however, on roads that have medium to high severity fatigue cracking.
Diamond Grinding Diamond grinding is the preferred method of restoring rigid pavement friction for roadways that are structurally sound and less than 10 years old. Friction is improved by restoring micro-texture of the pavement surface and adding macro-texture to the pavement surface; furthermore, drainage is improved reducing the risk of friction loss leading to hydroplaning(15). In addition to improving friction, diamond grinding is also known to improve pavement smoothness by reducing faulting and reduce noise.
30

Thin Hot Mix Asphalt Overlay Thin overlays improve the functional condition of the pavement by adding skid resistance, and correcting the roadway profile while adding smoothness. There are many mixes that can be used for a thin overlay, and therefore the actual friction improvement depends on the type of mix that is used. Scheduled Rehabilitation The scheduled rehabilitation treatment might be the best option when friction problems become evident near the trigger when a scheduled rehabilitation is required. In other words, the treatment will not only function as a friction restoration treatment, but its purpose would also be tied to the general pavement network condition. The expected friction improvement varies significantly with scheduled rehabilitation and is highly dependent on the type of aggregate used and those aggregate properties. Cost Alternatives for Speed Reduction In the case where funding is not available to restore pavement sections with inadequate friction right away, some remedial methods for speed reduction to mitigate the effects of the areas with poor skid resistance are presented below:
• Rumble Strip • Flashing Warning Signs • Temporary Roadway Signs
Many studies have shown that when rumble strip placed before stops signs at rural intersections, vehicles have a tendency to slow down. Furthermore, flashing warning signs and temporary roadway signs, such as “Slippery When Wet” signs, have been used by many agencies and are an effective way of warning people to reduce their vehicles speed. Suggested Rehabilitation Methods Different friction restoration methods are recommended based on the pavement type, pavement age, and pavement condition. Figure 9 shows the suggested rehabilitation methods and timing for flexible, composite, and rigid pavements based on pavement condition and the time since the last rehabilitation. There are three feasible options for friction restoration on flexible or composite pavement sections, which are surface treatment, thin overlay, and scheduled rehabilitation. The first is generally used when it has been less than 6 years since the last rehabilitation, the pavement has little to no distress, and the pavement section is structurally adequate. The second is typically used when it has been 6 to 12 years since the last rehabilitation and the pavement section is structurally sound. If there is excessive pavement distress in the
31

32
section the distresses should be patched before placing the thin overlay for friction restoration. The third is the scheduled rehabilitation which should be considered for all pavement sections that have been in service for more than 12 years. In addition to addressing friction, this method will address all pavement condition and structural issues. Similarly, there are three viable options for friction restoration on rigid pavement sections, which are diamond grinding, thin overlay, and scheduled rehabilitation. The first is generally used when it has been less than 10 years since the last rehabilitation, the pavement has little to no distress other than minor faulting, and the pavement section is structurally adequate. The second is typically used when it has been 10 to 16 years since the last rehabilitation and the pavement section is structurally sound. If there is excessive pavement distress in the section the distresses should be patched before placing the thin overlay for friction restoration. The third is the scheduled rehabilitation which should be considered for all pavement sections that have been in service for more than 16 years. In addition to addressing friction, this method will address all pavement condition and structural issues. Figure 9 shows these three methods for flexible and composite pavements in the upper left corner and the three methods for rigid pavements in the upper left hand corner. The time since the last rehabilitation reported in Figure 9 includes a 4 year transitional zone between the different treatment types. Recognizing that no two projects are alike, this transitional zone exists to allow flexibility in the restoration choices based on engineering judgment and the available funds.

Figure 9: Friction Restoration Methods
33

Additional Network Level Friction Improvement Policies In addition to the friction categories presented in the program development guidelines, friction categories were also developed in order to improve the current practice and develop more universal polices for friction assessment at MDSHA’s OMT. Currently, friction itself is rarely a main consideration for project selection on a network level at OMT. In addition, friction numbers are typically referred to only after a project has been identified for rehabilitation for reasons other than low friction. In order to improve upon this practice, friction improvement policies for assessment of friction at a network level were developed and are presented below. This assessment is different than the friction management system presented previously because the assessment of potential sections is based solely on a roadway’s friction demand rather than on a variety of factors such as wet weather accidents. This proposed process can be utilized by OMT as soon as annual FN reports become available. Investigatory and intervention friction categories were developed based on roadway functional class to be used for friction assessment as shown below in Table 9. Table 9: Friction Levels Based on Roadway Functional Class
Site Category Site Description Condition
Investigatory FN
Intervention FN
1
OPA, Minor Arterial, Major Collector, Minor Collector, and Collector Routes
Must contain at least one of the following within +/- 500 ft of Project Limits: Approach rail road crossings, traffic lights, pedestrian crossings, Stop and Give Way controlled intersections
50 45
2 On & Off ramps for Interstates, Freeways , and Expressways
None 45 40
3 Interstates, Freeways, and Expressways None 40 35
4
OPA, Minor Arterial, Major Collector, Minor Collector, and Collector Routes
DOES NOT contain at least one of the following within +/- 500 ft of Project Limits: Approach rail road crossings, traffic lights, pedestrian crossings, Stop and Give Way controlled intersections
35 30
5 Local Roads None 30 25 The annual friction number information, along with the information presented in Table 9, can be used to assess future friction improvement projects. A pavement section should be considered for friction restoration if it meets either of the two following criteria:
1. Three consecutive friction tests yield numbers at or below the investigatory FN 2. Five FN tests within 3 miles yield numbers at or below the investigatory FN
34

1. Three consecutive friction tests yield numbers at or below the investigatory FN If three consecutive friction tests produce numbers at or below the investigatory friction number, the pavement section should be considered for friction restoration. The sections falling under this criterion should be divided into two categories. The site should be categorized as ‘Priority 1’ if two or more of the sections are at or below the intervention friction level, otherwise the site will be categorized as a ‘Priority 2’site. 2. Five FN tests within 3 miles yield numbers at or below the investigatory FN If 5 FN tests fall at or below the investigatory level over a length of 3 miles, the section should be considered for friction restoration. The sections falling under this criterion should be separated into two categories. The site should be categorized as ‘Priority 1’ if three or more of the sections are at or below the intervention friction level, otherwise the site will be categorized as a ‘Priority 2’. All sites meeting the criteria for Priority 1 or Priority 2 should undergo a detailed site investigation and the appropriate friction restoration method should be chosen using the same procedure that was previously described for selecting a friction restoration method in the program development guidelines. Priority 1 sites have the greatest need for friction improvement and should undergo site investigation and friction restoration before Priority 2 sites. It should be noted that friction categories need to be re-assessed periodically and the values in Table 9 may change over time as traffic patterns shift. Further, the values presented previously in Table 7 require more detailed information about the roadway than the values presented in Table 9, and if such information is available, Table 7 could be used for the assessment rather than Table 9.
Materials and Texture Testing and Selection Material testing and selection is key in the process of setting and implementing friction policies in both the network and the project levels. Once the friction guidelines are set, the selection of materials take these guidelines and make them tangible. In order to improve the material testing and selection procedures, MDSHA currently has two studies underway that relate materials selection and testing to friction improvement. The results form these two studies will provide MDSHA with the information necessary to improve upon their materials selection process for the proposed PFM program. The first study involves assessing the British Pendulum Tester (BPT), the Dynamic Friction Tester (DFT), and the NCAT Friction Tester for obtaining a measure of pavement macro-texture. The two first testers are being evaluated for use in both the lab and the field. One notable advantage of the DFT is that it can provide the coefficient of friction at multiple slip speeds, which is useful if using the IFI for indexing friction. Traffic control is required for both testers when used in the field, and several measurements are required over a pavement section, making it virtually impossible to assess friction macro-texture on a network level. After a tester is chosen, it is
35
recommended that various standard MDSHA mixes from different aggregate types and sources (i.e. hard aggregate, limestone, etc.) be tested for macro-texture and friction number. From this information expected macro-texture and friction numbers could be obtained for various standard mixes and aggregate source requirements for friction management could be established. High Speed Pavement Surface Texture Testing The electro-optic (laser) method (EOM) for determining pavement surface texture uses non-contact, high speed lasers to measure pavement macro-texture. High-speed laser texture measuring equipment, such as FHWA’s Road Surface Analyzer (ROSANv), can be used to measure pavement surface macro-texture from 0.5mm to 50mm, using intervals of 0.25mm or less. The system calculates the pavement macro-texture in terms of MPD and provides an estimate of the MTD referred to as EMTD. Further, root mean square RMS macro-texture levels can be computed and the power of texture wavelengths can be determined. The laser equipment is mounted to a vehicle and the data is collected at a driving speed up to 70 mph. High speed testing equipment used to measure pavement macro-texture has many advantages over other testing devices. First, the data is collected continuously, at speeds up to 70 mph. Since the data can be collected at highway speeds, collection does not require any traffic control, making data collection safer and more efficient than other methods. Because the data collection doesn’t require any maintenance of traffic (MOT) the data can easily be collected on a network level. The data collected using the EOM correlates well with MTD, which is a commonly used as an indication of the surface texture. Further, EOM can provide a speed constant to go along with the friction data. The EOM method is recommended for collecting macro-texture and it should be in accordance with ASTM E 1845. The second study will attempt to find a relationship between the lab measured FN and the FN measured in the field. Once this relationship is found, different methods could be used to accelerate pavement polishing, loading, etc, and friction could be tested in the laboratory and these values could be used for FN prediction in the field. As mentioned earlier, materials selection is crucial to adequate friction design. In the literature used for this report, many studies have shown that the quality and characteristics of the aggregate used in mix design has a significant effect on the final friction characteristics of the pavement and the rate at which friction changes over time. It is strongly suggested that MDSHA creates a comprehensive testing matrix with friction results of aggregates and mixes used in both regular and friction improvement projects, keeping track of the type of aggregate, gradation, source, mix volumetrics, and their corresponding test results. The testing matrix should also incorporate the different friction restoration techniques mentioned in this report. This exercise may provide the necessary elements to correlate mix and aggregate properties to friction. MDSHA will then be able to write a specification limiting the amount of particular aggregates, recommend
36

gradations, and other mix properties to optimize budget and friction performance in pavement mixes. Acid Insoluble Residue Test In an effort to try to control friction properties from the designing stages, MDSHA should look into using the testing methodologies and procedures included in this report to be able to characterize aggregates and mixes and estimate their friction properties. Carbonate aggregate sources (i.e. limestone, dolomite) have been shown to have an adverse effect on pavement friction numbers. Louisiana’s micro surfacing and chip seal 2002 program determined that half of their projects with friction numbers less than 30 were due to the combination of limestone aggregate and high binder content(17). This study indicates the importance of implementing testing procedures to test the aggregate quality from sources in Maryland. One method commonly used by other agencies to test the hardness of the aggregate from carbonate aggregate sources is the Acid Insoluble Residue (AIR) test ASTM D 3042. This test estimates the percentage by weight of hard, non-carbonate material in the aggregate. Higher AIR values indicate larger percentages of siliceous minerals, which are considered more polish resistant than carbonate materials(18). Many agencies are adopting the AIR test to determine the quality of the aggregate source and limit the amount of material coming from carbonate sources This and other studies have concluded that aggregate source plays a very important role in friction. This general tendency may be substantiated with data suggesting that a majority of friction problems in Maryland seem to be concentrated in one District. Due to geographic conditions and economic reasons, it can be surmised that this District uses the same aggregate sources throughout, which creates a geographically centralized challenge rather than a generalized statewide problem with friction. The friction restoration methods described previously in this report include using the scheduled rehabilitation method (typically pavement overlays) and slurry seals for friction restoration based on the pavement age and condition at the projected restoration timeframe. Both of these methods are currently used within certain districts for friction restoration at MDSHA. High polish value mix (8 PV or higher) is typically used for roadway segments undergoing scheduled rehabilitation where inadequate FN is a main point of concern. Furthermore, slurry seals are typically used to restore friction on younger pavement sections exhibiting minimal distress. The statewide average friction number was 51 for pavements restored with 8PV mixes, and 56 for pavement sections restored with slurry seal as recorded in 2007 for projects completed in 2006. Though this information is limited, it gives some insight about the friction number that could be expected if 8PV mixes or slurry seals are used to restore friction; however, these numbers should not be used for anything more than insight and actual expected values should be established over time based on specific project feedback. Furthermore, MDSHA should work to establish expected friction values for the remaining friction restoration methods recommended in this report as they are recommended, constructed, and tested.
37

FEEDBACK FROM MDSHA DISTRICTS AND OFFICALS Information about funding and scheduling preferences of MDSHA’s District Offices was obtained by ARA during various brainstorming meetings. The schedule for the release for documents pertaining to project level friction improvement, and the funding source availability for friction projects, were the two main concerns for the Districts. Based on the District’s feedback received, the following sections in this report propose timings for the release of the documents for project level friction improvement and discuss some possible allocation of the funding sources for different priority levels of friction projects.
Timings/Schedule The timing for releasing the project level friction information should be formulated in a way that works to restore friction of high priority sites as quickly as possible. It is important to schedule the release of documents in a most efficient manner in order to maximize the time available for the Districts to take action and advertise the project. This timing depends on the release of information from different offices within MDSHA. Based on feedback received form the Districts during the meetings, the following schedule presented in Table 10 is proposed for the release of information pertaining to the proposed Friction Management Program. Table 10: Schedule for the Friction Management Program
Office Action/Document Schedule for Release
OOTS Prepare CSIS listings for MDSHA network. Provide list to OMT Fall (end of Oct)
OMT
Couple with CSIS list and most recent network friction numbers. Prioritize friction improvement sections Provide prioritized list to District’s Traffic Offices
Winter (end of Feb)
Districts Evaluate list and include projects in annual district tour with Chief Engineer.
Spring (April)
OMT
Coordinate with District and conduct detailed site investigation for projects that will be funded. Select appropriate restoration methods. Provide report to District
Spring (April/May)
Districts Prepare bidding documents for selected projects
ASAP for next FY Construction Season
Funding Sources The proposed funding for friction improvement projects may be based on the priority level assigned to the sections during the project level friction assessment. Friction improvement projects may be individually advertised or grouped together under a maintenance advertisement scheme in order to address the friction issues as effectively
38

and efficiently as possible. Initially, it is proposed that “high” and “medium” priority projects receive funding through Fund 76 (Safety and Spot Improvement). The remaining projects that have been characterized as low priority during the project level friction assessment might be addressed through Fund 77 (Resurfacing and Rehabilitation). The ultimate decision will be made by the fund managers and the Districts. RECOMMENDATIONS In general, we recommend implementing the procedures and policies identified in the “Proposed Guidelines” section of this report including the 7 step process for OMT and the 5 step process outlined for the District Offices and the PAGD team. Some specific action also suggested to fully implement this process include the following recommendation. These recommendations should be considered and possibly incorporated to the MDSHA’s procedures, while working towards implementation of the friction improvement policies presented in this report. It is recommended that MDSHA consider adopting the IFI for reporting pavement friction using the procedure presented in ASTM E 1960, “Standard Practice for Calculating the International Friction Index of a Pavement Surface.” The benefits of adopting this procedure include reporting a measure of pavement macro-texture along side the pavement friction number, and having the ability to correct friction values collected at speeds other than 37 mph. An SHA study found that the speed at which friction data is collected has a significant effect on the FN. One of the specific findings in the study concluded that for friction data collected at speeds between 28 mph and 36mph in Charles County, MD, an increase in testing speed of just 5 mph will typically result in a lower friction number by approximately 9 friction units(16). Currently there is no correction factor for data collection speed used at MDSHA. Furthermore, the IFI has become the standard for reporting pavement friction worldwide and many US agencies have adopted the IFI method of indexing friction. As part of the IFI implementation and in order to use the IFI on a network level, a measure of pavement macro-texture is required for the calculation of the speed number (Sp). Currently MDSHA does not collect pavement macro-texture information on a network level. Any standardized test method that provides a calculation or estimate of pavement macro-texture in terms of MPD or MTD will suffice; however, the advantages and disadvantages associated with the different testing methods vary considerably and should be considered by MDSHA. After a tester is chosen, it is recommended that various standard MDSHA mixes from different aggregate types and sources (i.e. hard aggregate, limestone, etc.) be tested for macro-texture and friction number. From this information expected macro-texture and friction numbers could be obtained for various standard mixes and aggregate source requirements for friction management could be established.
39

Documentation of Friction Testing Procedures As mentioned previously, MDSHA uses a skid trailer and a standardized ribbed tire to collect friction data in accordance to the procedure set forth in ASTM E 274. It is recommended that MDSHA formalize these procedures as an internal document taking the form of a training manual that can be easily accessed by the friction testers. Further, it is recommended that the friction testers undergo periodic training covering techniques that should be used for accurate data collection while emphasizing safety as a top priority. Providing a training manual and periodic training for the data collectors will lead to more consistent friction numbers and minimize data variability. Material Selection Criteria It is suggested that MDSHA use the recommendations included in this document to identify materials and mixes that can produce the FN design targets included in Tables 7 and 9 of this document. Subsequently, MDSHA should develop specifications listing the material requirements that will ensure these friction design target properties for better friction performance. Ultimately, MDSHA could develop performance-based friction specifications requesting Contractors meet the recommended design FN values and/or include friction as part of a comprehensive HMA Quality Index (task being pursued by the HMA Pay Factor Team). It is important to expand on the type of friction restoration methods available to MDSHA. By having more alternatives, MDSHA will be able to address friction issues more efficiently under different budget scenarios and constrains. This process may take some time; however, the material testing procedures and results should provide the comfort level that MDSHA needs to implement these restoration methods in the field. At the same time, Contractors will also become more familiar with the techniques and will produce higher quality work.
40

REFERENCES
1. Federal Highway Administration (FHWA). 1980. “Skid Accident Reduction
Program,” Technical Advisory T 5040.17, U.S. Department of Transportation, FHWA, Washington, D.C.
2. Hall, J.W., L. Titus-Glover, J.C. Wambold, T.J.Yager, and Z. ,Rado. 2006.
“Guide for Pavement Friction,” NCHRP Study 1-43, National Cooperative Highway Research Program, Washington, D.C.
3. Flintsch, G.W., I.L.Al-Qadi, R. Davis, and K.K. McGhee. 2002. “Effect on
HMA Properties on Pavement Surface Characteristics,” Proceedings of the Pavement Evaluation 2002 Conference, Roanoke, Virginia.
4. Sullivan, B.W. 2005. “Development of a Fundamental Skid Resistance Asphalt
Mix Design Procedure,” Pavement Management Service, Sydney, Australia.
5. Liang, R.Y. 2003. “Blending Proportions of High Skid and Low Skid Aggregate,” Final Report prepared for Ohio Department of Transportation (ODOT), Columbus, Ohio.
6. Texas Department of Transportation (TXDOT), “Chapter 5- Wet Weather
Accident Reduction Program” Pavement Design Manual, TXDOT, Austin, Texas (2004).
7. New York State DOT’s Skid Accident Reduction Program
8. McNeil, A. F. 1995. “A Summary of the Illinois Skid Accident Reduction
Program 1989 – 1994” Final Report prepared for Illinois Department of Transportation, Springfield, Illinois.
9. Maryland Department of Transportation State Highway Administration
(MDSHA), Pavement Design Guide. Brooklandville, Maryland (2006).
10. Transit New Zealand, “Notes to the specifications for Skid Resistance Investigation and Treatment Selection,” TNZ T10-2002, Transit New Zealand, Christchurch, New Zealand (2002).
11. Chelliah, T., P.Stephanos, T.Smith, B. Kochen. 2002. “Developing a Design
Policy to Improve Pavement Surface Characteristics,” Proceedings of the Pavement Evaluation 2002 Conference, Roanoke, Virginia
12. Viner, H., R.Sinhal, and T. Parry. 2004. “Review of UK Skid Resistance Policy,”
Paper prepared for the 5th International Symposium on Pavement Surface Characteristics--- Roads and Airports, Toronto, Ontario, Canada
41
42
13. Song, W., X. Chen, T. Smith, and A. Hedfi. 2005. “Investigation of Hot Mix
Aspahlt Surfaced Pavements Skid Resistance in Maryland State Highway Network System,” Paper presented at 85th Annual Meeting of the Transportation Research Board, Washington, D.C.
14. Uzarowski, L., M. Maher, G. Farrington, Golder Associates Ltd. 2005. “Thin
Surfacing- Effective Way of Improving Road Safety within Scarce Road Maintenance Budget,” The Transportation Association of Canada, Calgary, Alberta.
15. Hoerner, T.E., K.D. Smith, R.M. Larson, and M.E. Swanlund. 2003. “Current
Practice of PCC Pavement Texturing,” Paper presented at 82nd Annual Meeting of the Transportation Research Board, Washington, D.C.
16. Awoke, G.S and Dr. D. Goulias. 2007. “Review of Maryland’s Pavement
Friction Survey and the Impact of Variable Test Speed on Friction Values.” Paper submitted for presentation at the 2008 TRB Annual Meeting of the Transportation Research Board.
17. Temple, W., S. Shah, H. Paul, and C. Abadie. 2002. “Performance of
Louisiana’s Chip Seal and Microsurfacing Program, 2002.” Transportation Research Record 1795, Transportation Research Board, Washington, D.C.
18. Kandhal, P.1 S., F. Parker Jr., and R.B. Mallick. 1997. Aggregate Tests for Hot
Mix Asphalt: State of the Practice, NCAT Report No. 97-6, National Center for Asphalt Technology (NCAT), Auburn, Alabama.

APPENDIX A: INFORMATION GATHERING Introduction As a basis for creating guidelines and improvement policies for MDSHA’s friction management program, information on MDSHA’s current pavement friction practices was gathered and reviewed. In addition, information about other government agencies current friction design and management practices was collected and evaluated for comparison. Previous research pertaining to friction improvement and friction management systems was extensively reviewed in the National Cooperative Research Program study 1-43 (Guide for Pavement Friction) dated August 2006. This document was reviewed and relevant information was updated as required with additional published works. Literature Search Information on current friction practices for many government agencies, including MDSHA, and information on research pertaining to friction improvement and pavement friction management systems was gathered and is documented below. The information is organized under the following three sections:
• Skid Resistance and Friction Management Research • State of the Practice • MDSHA Friction Practices
Skid Resistance and Friction Management Research
• Guide For Pavement Friction, National Cooperative Highway Research Program (NCHRP) Hall, Smith, and Titus-Glover, 2006.
This study provides a basis for guidelines and recommendations to aid in the development of a friction guide for state or other government agencies. The report illustrates ways to manage friction on existing highway pavements and ways to design highway pavements with adequate highway friction. The report includes but is not limited to a discussion of the importance of micro and macro texture in aggregate selection and as well as aggregate gradation and binder selection that will improve pavement friction. Furthermore, this document provides a summary of historical federal safety provisions related to friction management implementation and of and current friction requirements. The report contains an appendix with a summary of 48 state agency’s current friction practices. • Skid Accident Reduction Program, Federal Highway Administration (FHWA)
1980.
This technical advisory provides a set of guidelines to promote state and local highway agencies to participate in skid accident reduction programs. The advisory contains a theoretical flow chart of an anti skid reduction plan, which includes site prioritization and budget techniques. It encourages the agencies to develop a program that reduces wet weather accidents by identifying areas with high skid potential and
43

promotes the use of anti skid techniques in pavement design, maintenance, and construction. It includes information on friction testing equipment and sets forth step-by step procedures for calibration of friction testing equipment and testing friction on state and local roadways.
• Design Manual for Roads and Bridges, Volume 7, HD 28, “Skid Resistance,”
Department of Transport, London, United Kingdom. The Skid Resistance chapter in the Design Manual for Roads and Bridges describes how appropriate levels of friction or skid resistance should be attained and managed. The document walks through a theoretical procedure of which includes suggestions of how to identify and prioritize highway section with inadequate skid resistance. It also recommends the use of material with specific characteristics during construction to increase the frictional properties of the pavement. • Guidelines for the Management of Road Surface Skid Resistance, Austroads,
2005. The guidelines contain information for transportation agencies to develop and implement network wide skid resistance system. The guide includes “16 key elements” for agencies to consider throughout the development of such a system. The guide also includes general information pertaining to skid resistance including surface friction and surface texture, and discusses how these elements influence the condition of the roadway. • Specifications for Skid Resistance Investigation and Treatment Selection, Transit
New Zealand, 2002.
This document focuses on the process of identifying sites or sections of the road where skid resistance needs to be improved. Investigatory and threshold levels are determined for 5 different categories based on roadway site characteristics. The investigatory and threshold friction values (which are predetermined in the document and can be adjusted as deemed necessary) are compared to the actual friction of sections and theoretically sites with poor friction can be identified, prioritized, and rehabilitated. The document includes some insight on the materials that should be used to improve the friction at sites with low skid resistance • Developing a Design Policy to Improve Pavement Surface Characteristics,
Chelliah, T., P. Stephanos, M.G. Shah, and T. Smith. 2002.
This paper describes the steps that the Maryland State Highway Administration (MDSHA) intends to develop a design policy which will improve pavement friction. The paper attempts to understand the frictional requirements for sections of road with different characteristics (such ad intersections, pedestrian cross walks, etc.) during wet weather conditions. The sections with different characteristics were broken down
44
into 5 different categories with different frictional numbers required for design and different levels of demand. Factors contributing to wet weather skid resistance were documented and described in detail. An example of benefit and cost analysis was provided and shows that there is a benefit associated with friction management. Some conclusions from the study include that sections of road, that are similar in all aspects except for traffic volume can have different skid resistance values over time. Moreover, roads that are similar in all aspects with the exception of the material used can have different skid resistance values. Also, through the data analysis it was discovered that there are a high number of wet weather accidents on roads with low skid resistance. • Utilizing Pavement Evaluation Data in Rehabilitation Design in MDSHA, Smith,
T, P. Stephanos. 2002. MDSHA collects pavement evaluation data including surface friction testing, deflection testing, ride quality testing, ground penetrating radar testing, and pavement surface distress testing. MDSHA utilizes collected pavement evaluation data, along with the procedures set forth in the “AASHTO Guide for Design of Pavement Structures,” for selection of pavement rehabilitation strategies. This paper examines MDSHA’s attempt to use pavement evaluation techniques and data to aide in pavement rehab design. This document explains the collection and use of pavement surface friction data in current pavement design practice. • Thin Surfacing- Effective Way of Improving Road Safety within a Scarce Road
Maintenance Budget, Maher, M. G. Farrington.
This paper explores the effects of different preventative maintenance treatments in Canada. This includes looking at the cost of the treatment and comparing to the benefit for different circumstances. This paper looks at a number of different surface treatments on Canadian roads and gives specific examples of the improvement to the surface friction after treatment.
• Development of a Fundamental Skid Resistance Asphalt Mix Design Procedure,
Sullivan, B.W. 2005. This paper presents a method for estimating the skid resistance of pavement using the International Friction Index (IFI). The mean profile depth, which is measured by the aggregate gradation and binder content, is used to determine the macro texture of the mix. Furthermore, the micro texture is measured using the Polished Aggregate Friction Value (PAFV). The PAFV and the mean profile depth are used in terms of the IFI to determine the required stopping distance. Then, using an iterative procedure the required micro and macro texture required to produce adequate stopping distance under locked wheel braking conditions is calculated. The aggregate type, mix gradation, and binder type which will provide adequate friction are identified and selected. This method has more that one solution and allows the
45

engineer to use a mix with more macro and less micro texture (or vice versa) and end up with the same frictional properties in terms of stopping distance required. • Pavement Surface Macrotexture Measurement and Application, Flintsch, Gerardo
W. León, Edgar de. McGhee, Kevin K. Al-Qadi, Imad L.2003. This paper discusses the different methods used to measure pavement macro-texture and how to apply these measurements in pavement management. The main applications discussed include using macro-texture measurements to detect areas in the constructed hot mix asphalt (HMA) pavement that have low friction, are non-uniform, and/or have experienced segregation. Further applications include using the macro texture measurements for quality assurance and quality control purposes. The paper also looked at the correlation of various macro texture measuring devices on different HMA surfaces. The correlation between the circular track meter and sand patch measurements was found to be excellent and the correlation between the laser profiler and the sand patch measurement was found to be good. The paper also that the skid number gradient with speed is inversely proportional to the macro-texture of the pavement, but the dependence on speed changes depending on what type of tire is used. • Effect of HMA properties on Pavement Surface Characteristics , Flintsch,
Gerardo W. Al-Qadi, Imad L. Davis, Robin, McGhee, Kevin K..2002.
This paper looked at the skid resistance and macro-texture properties for seven different wearing surfaces used at the Virginia Smart Road. The mixes included 5 SuperPave™ mixes, 1 stone mastic asphalt mix (SMA), and one open graded friction course (OGFC). Different testing conditions were used and the results were analyzed. The skid resistance measurements were conducted using a locked wheel trailer with ASTM-specified ribbed and smooth tires, and the majority of macro-texture measurements were taken by a laser profile. The report also gives a general overview of micro and macro-texture and discusses the importance of friction for safety. • Blending Proportions of High Skid and Low Skid Aggregate, Laing, R.Y 2003.
Final Report prepared by the Ohio Department of Transportation. Maintaining friction on the Ohio DOT roadway network is an extremely high priority; however, finding polish resistant and high friction aggregate can be challenging in some parts of the state. This report illustrates that blending high skid and low skid aggregates together creates a mixture that can be more easily obtained and still provide adequate roadway friction. The tests preformed included 4 different blends of aggregate which were 80/20, 70/30, 60/40, and 50/50 by weight percentage blends of high and low skid resistant aggregates. The blends were tested using an accelerated polishing machine according to ASTM D3319-90 and the residual polishing value was determined by the British Pendulum tester. The tests were normalized by recording the results after 8 hours of polishing in order to study the polishing rate for different aggregate blends. The study found that the 50/50 blend
46

produced pavement that usually met Ohio DOT standards but the 60/40 blend produced more acceptable pavement. • Guidance for Implementation of the AASHTO Strategic Highway Safety Plan,
Volume 6: A Guide for Addressing Run-Off-Road Collisions. Neuman, Timothy R., Pfefer, Ronald, Slack, Kevin L., Kennedy-Hardy, Kelly, McGee, Hugh, Prothe, Leanne, Eccles, Kimberley, 2003.
This publication has a section devoted to improving skid resistance on pavements to help reduce run-off-road collisions. The section on skid resistance includes an overview of the problem associated with low friction pavements and wet weather accidents and briefly mentions the funding provided by FHWA, AASHTO, and other pavement associations for research pertaining to improving the design of skid resistance in pavements. This guide focuses on improvements that can be made to sites that have experienced run-off-road collisions and have low skid resistance. The report suggests improving skid resistance by improving mix design, overlaying pavements with low skid resistance, and improving grooving. The report also mentions that areas with rutting, inadequate crown, and shoulder drainage issues should be treated because of the negative effect they have on skid resistance. The report provides a general overview of how to mitigate friction problems once the sites with low friction have been identified and uses NYSDOT’s Skid Accident Reduction Program as an example. • Incorporating Road Safety into Pavement Management: Maximizing Asphalt
Pavement Surface Friction for Road Safety Improvements. Noyce, David A., Bahia, Hussain U., Yambo, Josue M., and Kim, Guisk. Midwest Regional University Transportation Center, Traffic Operations and Safety (TOPS) Laboratory. 2005.
The University of Wisconsin - Madison Department of Civil and Environmental Engineering In Cooperation with The Midwest Regional University Transportation Center
Skid resistance on Department of Transportation roads is an issue that most states are concerned with. Injuries and fatalities occur each year at alarming rates, and as such more states are interested in research pertaining to developing skid reduction programs that can be implemented as part of their pavement management system. This paper discusses skid resistance from many different angles including how to measure skid resistance, the elements effecting skid resistance, and the important role of skid resistance in traffic safety. There is emphasis placed on the importance of micro-texture and macro-texture in friction design and friction variation depending on vehicle speed and weather conditions. The paper includes information from state DOT’s and other international agencies on friction management tools that are currently in use and provides an overview of friction management techniques that could be adopted by DOTs. Furthermore, a survey was conducted on the current
47

state of practice for the use of skid resistance in hot mix asphalt design and the responses were summarized in the report. The survey included the following 10 DOTs: Illinois, Indiana, Michigan, Ohio, Wisconsin, Iowa, Missouri, Nebraska, Pennsylvania, and Washington. The information requested from the DOTs is presented in Appendix A, and the detailed results are shown in Appendix B. The appendices also contain some mix specifications for Iowa, Michigan, and Missouri DOTs.
State of the Practice
• Current Practice of PCC Pavement Texturizing. Hoerner, Todd E., Smith, Kurt D., Larson, Roger M. and Swanlund, Mark E. Applied Pavement Technology, Inc. Submitted for Presentation and Publication at the82nd Annual Meeting of the Transportation Research Board. 2003.
This document summarizes the state of the practice of PCC pavement texturizing techniques. The paper provides information on key issues for both traditional texturizing techniques and more innovative texturizing techniques. Friction, safety, and noise are taken into consideration for each technique. The document provides a summary of the various techniques along with recommendations and conclusions.
• Pavement Design Manual, “Chapter 5- Wet Weather Accident Reduction Program”. Texas Department of Transportation (TXDOT) 2006.
The Texas Department of Transportation (TXDOT) created and implemented a Wet Weather Accident Reduction Program (WWARP) where aggregates are divided into four categories based on different frictional properties. The purpose of this program is to ensure that pavements have adequate skid resistance especially under wet conditions. The program addresses specific aggregate properties and their direct correlation to friction including, aggregate shape, size, and resistance to polish. • A Summary of the Illinois Skid-Accident Reduction Program 1989 to 1984,
Illinois Department of Transportation Bureau of Materials and Scientific Research, McNeil, Amy F. 1995.
This report gives an overview of the Illinois Skid-Accident reduction program from 1989 to 1994. The report touches on the historical development of the program. The field testing procedures used for both flexible and rigid pavements are specified. Different blended surface mixtures and special mixtures were used and evaluated for friction improvement. The properties that yielded the best results were identified.
48

• Guidelines for Maintaining Adequate Pavement Friction in Surface Pavements, Ohio Department of Transportation. 2000
This set of guidelines was developed by the Ohio DOT in order to assist districts in improving skid resistance in areas where known friction problem exist. The guideline helps identify the causes of the friction problems and includes the appropriate responses. In attempt to determine the cause of poor friction and find a viable solution the documents organizes the steps to be taken under the following three categories: (I) Determine the Causes of poor skid resistance, (II) Determine the solutions to skid resistance problems, (III) Determine if local aggregate source is prone to friction problems and needs to be restricted (if it does not this step can be skipped). To determine the problem a number of steps are mentioned including visual inspection, laboratory testing, roadway alignment, type and source of aggregate. Furthermore, some solutions include grind and resurface problem areas, reduce the speed limit on the roadway, and re-align the roadway.
• Pavement Technology Advisory: Testing Pavement Friction, Illinois Department of Transportation, eff. 1996, Rev. 2006.
This advisory provides information on the friction testing procedures that are carried out at IDOT. The document covers the testing equipment used, the primary influences on the friction number (FN), the testing categories, and a brief overview of the procedure to determine if the friction is adequate.
• 2006 Annual Evaluation Report Highway Safety Improvement Program, New York State Department of Transportation. 2006.
This report contains a section on NYSDOT Skid Accident Reduction Program (SKARP). The SKARP helps reduce the number of friction related accidents by identifying areas with a high number of wet accidents and testing those areas for friction problems. When a friction problem is identified the section of the pavement is usually resurfaces with a polish resistant mix. Since the SKARP implementation at NYSDOT the number of sites needing treatment has been on the decline. In 1996 the number of sites requiring treatment for skid resistance issues was 68, but in 2001 the number of sites requiring treatment dropped to 27; furthermore, in 2005 the number of sites dropped to 9.
• Washington State Highway Pavement Trends, Conditions, and Strategic Plan, Washington State Department of Transportation (WSDOT), 1999.
WSDOT measures friction number on their network every 2 years using a locked wheel towed trailer. Before using the trailer water is applied to the pavement surface to create a “wet” environment for determination of the friction number. The data
49

collected from the friction test, along with roadway geometrics and historical accident information are used to reduce and minimize wet weather accidents.
• Survey of State Practices to Control Skid Resistance on Hot Mix Asphalt Concrete
Pavements. Jayawickrama, P.W., Prasanna, R., Senadherra, S.P. 1996.
This paper explores the state of practice to control skid resistance on HMA pavements by investigating the practices of 48 DOTs across the nation. The practices of the various DOTs differed considerably. Based on the survey, 21 of the 48 states did not have design guidelines specifically for skid resistance, or they assumed that proper mix design would ensure skid resistance on their pavements. The survey found that DOTs which consider friction in their design procedures typically do so by controlling the quality of the coarse aggregate in their mix design procedures, but the quality determination differs from state to state. Some DOTs choose their aggregates using classification and aggregate type while others use extensive laboratory testing to determine aggregate properties. Furthermore, Florida, Kentucky, Pennsylvania, and Texas use alternate procedures to choose quality aggregates which rely on field skid resistance.
MDSHA Friction Literature
• MDSHA Standard Specifications for Construction and Materials, Maryland State
Highway Administration, 2001. In the Category 500 Paving section of the MDSHA Standard Specifications for Construction and Materials there are two areas which mention skid resistance. The first is under the application of slurry seals section, where the guide reads the following, “Slurry seal shall be spread to repair slight irregularities and achieve a uniform, skid resistant surface without skips, lumps or tears, as determined by the Engineer.” The second is in the construction section under equipment and reads as follows, “The machine (used for removing asphalt pavement) shall be capable of accurately establishing profile grade control and shall have positive means for controlling slope elevation. The resultant surface shall be true to the established grade and shall be skid resistant.” There are no additional specs provided for skid resistance in this manual.
• Laboratory Method of Predicting Frictional Resistance of Aggregates, Maryland
Department of Transportation State Highway Administration Office of Materials Technology: Maryland Standard Method of Tests. Rev. 2000.
This document provides the laboratory procedure used by MDSHA for determining the degree of polish that can be expected for an aggregate used in surface mixes under traffic conditions. The samples are prepared by binding the aggregate to a hydraulic cement coated plywood board using sand and cement mortar to hold the aggregate in place, and then cured to set. The aggregate samples are then tested using a 6 ft
50

diameter circular test track. After all tests are complete and pertinent data is collected the results are reported in terms of the polish value (PV) to the nearest tenth for each aggregate source that was tested. • Laboratory Method of Predicting Frictional Resistance of a blend of Aggregates,
Maryland Department of Transportation State Highway Administration Office of Materials Technology: Maryland Standard Method of Tests. Rev. 1999.
This document provides the procedure used to determine appropriate proportions of aggregate from two or more different aggregate sources in order to meet the standard specification for polish value (PV) and the British Pendulum Number (BPN). Aggregates are usually blended when a single aggregate source cannot meet the standard specification alone. Other requirements include that percentages of the blended aggregate only apply to the coarse portion which is defined as having a gradation greater or equal to the requirements of M 43 or size 8. Furthermore, there are additional requirements if using recycled asphalt pavement (RAP) in the blend. The methods for testing the blend are the same methods used in the Laboratory Method of Predicting Frictional Resistance of Aggregates, which was documented previously. • Pavement Design Guide, Maryland Department of Transportation State Highway
Administration, Prepared by the Pavement Division, Office of Materials and Technology, 2006.
This book provides guidelines for pavement design and maintenance for MDSHA owned roads. The guide sets forth all design procedures required by the state for pavement design. Specific information in the guide pertaining to skid resistance and the friction on the roadway surface includes information on specifying high polish value mixes. According to the guide at least one of the following must be present to select a high polish value mix: (1) the two-way average daily traffic must be greater than 25,000 in the design year, (2) the skid number values must be less than 40, or (3) more than 25% of the mainline area has polished aggregate as a distress. In addition, one of the steps from the pavement design procedure includes reviewing all available friction information for the existing roadway.
51

APPENDIX B: DETAILED SITE INVESTIGATION FIELD SHEET An example of a field sheet for the detailed site investigation was developed and is provided on the following page.
52
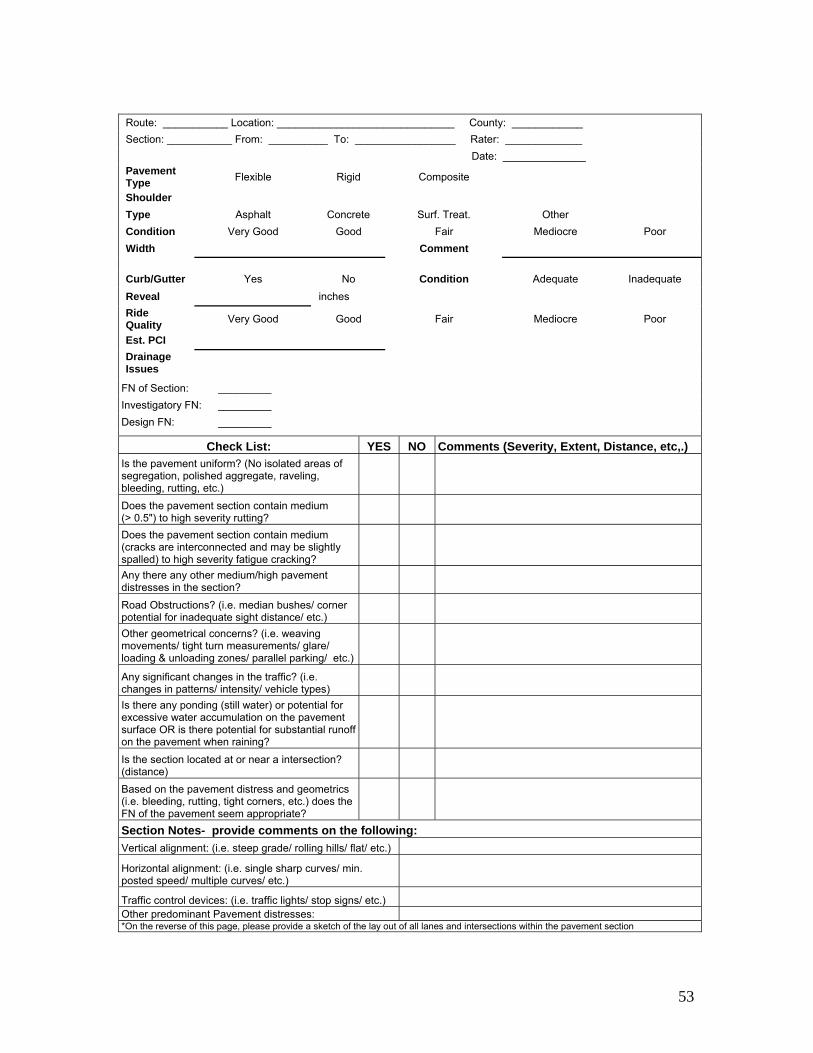
53
Route: ___________ Location: ______________________________ County: ____________ Section: ___________ From: __________ To: _________________ Rater: _____________ Date: ______________ Pavement Type Flexible Rigid Composite
Shoulder Type Asphalt Concrete Surf. Treat. Other Condition Very Good Good Fair Mediocre Poor Width Comment Curb/Gutter Yes No Condition Adequate Inadequate Reveal inches Ride Quality Very Good Good Fair Mediocre Poor
Est. PCI Drainage Issues
FN of Section: _________ Investigatory FN: _________ Design FN: _________
Check List: YES NO Comments (Severity, Extent, Distance, etc,.) Is the pavement uniform? (No isolated areas of segregation, polished aggregate, raveling, bleeding, rutting, etc.) Does the pavement section contain medium (> 0.5") to high severity rutting? Does the pavement section contain medium (cracks are interconnected and may be slightly spalled) to high severity fatigue cracking? Any there any other medium/high pavement distresses in the section? Road Obstructions? (i.e. median bushes/ corner potential for inadequate sight distance/ etc.) Other geometrical concerns? (i.e. weaving movements/ tight turn measurements/ glare/ loading & unloading zones/ parallel parking/ etc.) Any significant changes in the traffic? (i.e. changes in patterns/ intensity/ vehicle types) Is there any ponding (still water) or potential for excessive water accumulation on the pavement surface OR is there potential for substantial runoff on the pavement when raining? Is the section located at or near a intersection? (distance) Based on the pavement distress and geometrics (i.e. bleeding, rutting, tight corners, etc.) does the FN of the pavement seem appropriate? Section Notes- provide comments on the following: Vertical alignment: (i.e. steep grade/ rolling hills/ flat/ etc.)
Horizontal alignment: (i.e. single sharp curves/ min. posted speed/ multiple curves/ etc.)
Traffic control devices: (i.e. traffic lights/ stop signs/ etc.) Other predominant Pavement distresses: *On the reverse of this page, please provide a sketch of the lay out of all lanes and intersections within the pavement section