Embed Size (px)
Citation preview

External Assistance For Health Sector : 1Development of Education of Scheduled Tribes in Orissa: The Role of PESA Act
CMDR Monograph Series No. - 52
Development of Education of ScheduledTribes in Orissa:
The Role of PESA Act
Sailabala DebiMahesh. E
CENTRE FOR MULTI-DISCIPLINARY DEVELOPMENT RESEARCHAlur Venkatrao Circle, DHARWAD-580001, Karnataka, India
Ph : 091-0836-2447639, Fax : 2447627E-mail : [email protected]

2 CMDR Monograph Series No. - 52
Development of Education of Scheduled Tribes inOrissa:
The Role of PESA Act
Sailabala DebiMahesh. E
Professor and Director, CMDR
Research Scholar, CMDR
The present paper aims at examining theeducational status of tribals in a scheduledstate i.e, Orissa and also makes an attemptto study the role of PESA Act in thedevelopment of education of the tribals. Thestudy analyses the results using (i) Sopher’sdisparity Index, (ii) Co-efficient of Equalityand (ii) Gender parity index. The analysis ofthe results mainly concentrates to two groupsof districts i.e (i) Scheduled districts (morethan 50 % tribal population) and (ii) Non-Scheduled districts (Less than 50 % tribalPopulation).
The main findings of the study are: i) Theliteracy rate of male, female and totalpopulation of scheduled tribes in thescheduled districts is lower than the nonscheduled districts with an exception to oneof the scheduled districts (Sundergarh). Thetribal female literacy rate was found to beas low as 7.5 percent in Malkangiri district(scheduled district), which is really a matterof serious concern. ii) About 27 percent ofthe habitations with predominantly scheduled
tribe population did not have a primaryschool within a radius of one kilometer. iii)The gender parity index indicates that it isthe lowest in the Scheduled Districts andhighest in non-scheduled districts. Thesurvival rate (47 percent ) of ST children isfound to be the lowest when they reachclass-V while the same is 65 percent amongothers. iv) The percentage of tribal teachersis only 8.4 percent in the state and only 16percent in tribal dominate areas, which areconsidered to be below the prescribed norm.v) The PESA Act of 1996 after more than adecade does not seem to empower the tribalsto realise their basic rights particularly inrespect of education, health etc.
Hence, it is now high time to make itsimplementation more vigorously andeffectively through institutional means.
1. IntroductionDespite the sincere and concerted efforts bythe government for the overall developmentof the scheduled tribes, they are still far

External Assistance For Health Sector : 3Development of Education of Scheduled Tribes in Orissa: The Role of PESA Act
behind in almost all the standard parametersof development. They are not able toparticipate in the process of development,as they are not aware of most of theprogrmmes and policies made for theirupliftment. This is mainly due to the highincidence of illiteracy and very low level ofeducation among the tribal people. Hence,the educational status of the scheduled tribesand the role of governance in this directionmerit discussion.
The present paper aims at examiningthe educational status of tribals in a scheduledstate (Orissa). Orissa occupies a specialposition in the tribal map of India. It isregarded as the homeland of the tribalshaving a total tribal population of about 81,45,081, which is 22.21 percent of the State’stotal population according to Census 2001.The state has the 3rd highest tribal populationin the entire country, which accounts forroughly 11 percent of the total tribalpopulation of India. The literacy rate amongtribals (39.60 percent) was very lesscompared to the state literacy rate (63.61percent) in 2001 census. It is welldocumented that the educationalbackground of tribals is very discouragingas compared to the rest of the population.Many special programmes and policiesimplemented for scheduled tribes seem tohave not borne the fruits yet. In thisconnection one may raise some questions:
i) What is the educational status oftribals so far vis-à-vis their non tribal
counterparts?
ii) What is the role of governance indevelopment of education of thetribals?
iii) Has the government’s endeavour inrespect of tribal education achievedthe desired result?
iv) Has there been any attempt by thegovernment to empower the tribalcommunity for self governance inrespect of education in their villagesparticularly after the 73rd and 74th
Amendments and the PESA Act?
These are some of the issues thatneed to be examined in the context of Orissawhich is considered as one the scheduledstates of the country, pocketing slightly higherthan 22 percent of the scheduled tribepopulation.
The paper is divided into fivesections. The first section presents theintroduction and the researchable issues inrespect of tribal education. In the secondsection a brief methodology for analysing thedata is presented. The third section hasdiscussed the development of education ofscheduled tribes in Orissa. The PESA Actand its role are presented in brief in the fourthsection. The last section summarises the mainfindings along with some concludingobservations.

4 CMDR Monograph Series No. - 52
2. Methodology
The analysis of the present paper isbased mainly on secondary data collectedfrom Economic Survey of Orissa, StatisticalAbstract, Orissa Development Report(2002), Orissa Human Development Report(2004), Office of the Directorate of PublicInstruction (DPI), Government of Orissa,Census of India, New Delhi etc. In order to
have a better understanding of thedemographic situation of the tribalcommunities, Scheduled Areas1 have beenidentified taking into consideration theconcentration of scheduled tribe populationin different parts of the State. Accordingly,the 30 districts of the state are grouped intotwo broad categories on the basis of STpopulation: (i) Scheduled Districts and (ii)Non-Scheduled Districts.
Scheduled Districts (8 districts):The districts where the proportion ofScheduled tribe population is 50 percent or
See foot note 3
more are defined as a scheduled district(Orissa Development Report, 2002; p441).
Non-Scheduled Districts (22districts) include all the districts other thanthe scheduled districts.
The list of the districts is presentedin Table 1.
The analyses of the study concentrate to theliteracy level and the primary education only.
Tools/Techniques used in the analysis
i. The gender disparity index in literacy
The gender disparity index in literacyis calculated by using Sophers’ DisparityIndex with the help of the following formula:
Disparity Index = Log (X2/X
1) + Log [(Q-
X1)/ (Q-X
2)],
Where, X2 > X
1 and Q = 200
Scheduled
Districts(> 50
percent ST popn)
Gajapathi Angul Dhenkanal KhurdaKoraput Baleswar Ganjam NayagarhKandhamal Baragarh Jajpur NuapadaMalkangiri Bhadrak Jharsuguda SambalpurMayurbhanj Bolangir Jagatsinhpu SonepurNabarangpur Boudh Kalahandi PuriRayagada Cuttack KendraparaSundargarh Deogarh Kendujhar
Non Scheduled Districts
Table 1: Scheduled and Non Scheduled Districts in Orissa

External Assistance For Health Sector : 5Development of Education of Scheduled Tribes in Orissa: The Role of PESA Act
X2 = Male Literacy Rate
X1 = Female Literacy Rate
The higher the value of the index higher isthe extent of gender disparity.
ii. Co-efficient of Equality in Education
The coefficient of equality is estimatedby using the following formula:
Q = (Et / E
o) / (P
t / P
o)
Where Q = Coefficient of equality forScheduled Tribes
Et = Enrolment of Scheduled Tribes in any
particular types of education.
Eo =Enrolment of other communities in the
same type of education
Pt = Population of Scheduled Tribes
Po= Population of other communities.
If the value of co-efficient of equality is 100,it indicates that Scheduled Tribes are at parwith other communities and availing the samefacility of education like others. If it is lessthan 100, it indicates that these communitiesare lagging behind their counterparts. Thiswould provide us the educational status ofScheduled Tribes vis-a-vis Non Scheduled
Tribes.
iii. Gender Parity Index in Enrolment(GPI)GPI = (ENR
G / ENR
B) * 100
Where ENRG = Enrolment of girlsENR
B = Enrolment of Boys
If the value of GPI for example is 86, itimplies that there are 86 girls per 100 boys.
3. Educational Development ofScheduled Tribes in Orissa
It is well documented that there is a positiveimpact of literacy and basic education oneconomic productivity of the recipients ofeducation. Many empirical research on thistopic from a handful of studies found thatthe number of years of schooling (mostlyprimary schooling) is closely related withincome or job productivity. For example inthe agriculture sector, studies have supportedthe notion that an additional year of primaryschooling can directly affect wages and farmoutput. Studies also suggest that an additionalyears of schooling lead to economic returnsthat are greater than the cost of educationitself (Haddad et.al, 1990). In view of thecontribution of education in general andprimary education in particular to the overalldevelopment of the recipients of educationwe have made an attempt to examine theeducational achievement of the scheduledtribe population in the state of Orissa (ascheduled state).According to the provision of the IndianConstitution there are 62 communities listedas STs in Orissa. More than 80 percent ofthem live in designated scheduled areas.There are 13 sections of these tribes in thestate identified as Primitive Tribes, who arevery primitive in nature from the cultural and

6 CMDR Monograph Series No. - 52
technological standpoints. (OrissaDevelopment Report, 2002). Tribalcommunities in Orissa, like their counterpartsin other parts of India, live under asubsistence economy. Agriculture is theirmain occupation and most of the tribes havesubsidiary occupations such as collection ofminor forest produce, forest labour and othernon-agricultural labour, primary governmentwork, apart from the main occupations.There is considerable divergence,differentiations among various tribal groupsin terms of rites, rituals and functions. SinceIndependence, there has been a growingrealisation that development would neverbecome self-sustaining unless it isaccompanied by corresponding changes inthe attitudes, values, knowledge and skillsof the people in general and scheduled tribesin particular. The only way of accomplishingthis change is through education. In thisbackground the analysis of education oftribals in Orissa assumes great significance.
3.1 Literacy rate
Overall literacy rate
Literacy is considered as one of the crucialindictors of education. There is a significantdifference between a literate and an illiterateperson in respect of overall attitude of theconcerned individuals. The overall literacyrate in Orissa has increased by about 15percent, between 1991 and 2001 from49.09 percent to 63.61 percent. Thisincrease is roughly the same as for all-India
and for states with comparable levels ofliteracy in 1991. However, as per the 2001Census, Orissa still ranks 24th among 35states/Union Territories. The state is slightlybelow the national literacy rate(65.38percent) in 2001 census in respect ofoverall literacy rate. The male literacy rate(75.85percent) of India is marginally higherthan that of Orissa (73.34 percent) while thefemale literacy rate of India was 54.16percent and that of Orissa was 50.5 percent.Across districts, as per 2001 census, theoverall literacy rate is the highest in Khurdadistrict at 80.19 percent (Non-ScheduledDistrict) and lowest in Malkangiri District at31.26 percent (Scheduled District). Whilemale literacy rate is the highest (88.96percent) in Jagatsinghpur district (nonscheduled dist) and the lowest (41.21percent) in Malkangiri district (scheduleddist), the female literacy rate is the highest(71.06 percent) in Khurda district (non-scheduled dist) and the lowest (21.02percent) in Nabarangpur district (scheduleddist). Thus, the male, female and overallliteracy rates are the lowest in theScheduled Districts of the state while theyare the highest in the non scheduleddistricts of the state. The details of districtwise literacy rate are presented in Table A-1.
Scheduled tribe literacy rate
As expected, the level of literacy amongscheduled tribes has always been a matterof concern. In the case of Scheduled Tribesin Orissa, it is in fact much lower than for the
External Assistance For Health Sector : 7Development of Education of Scheduled Tribes in Orissa: The Role of PESA Act
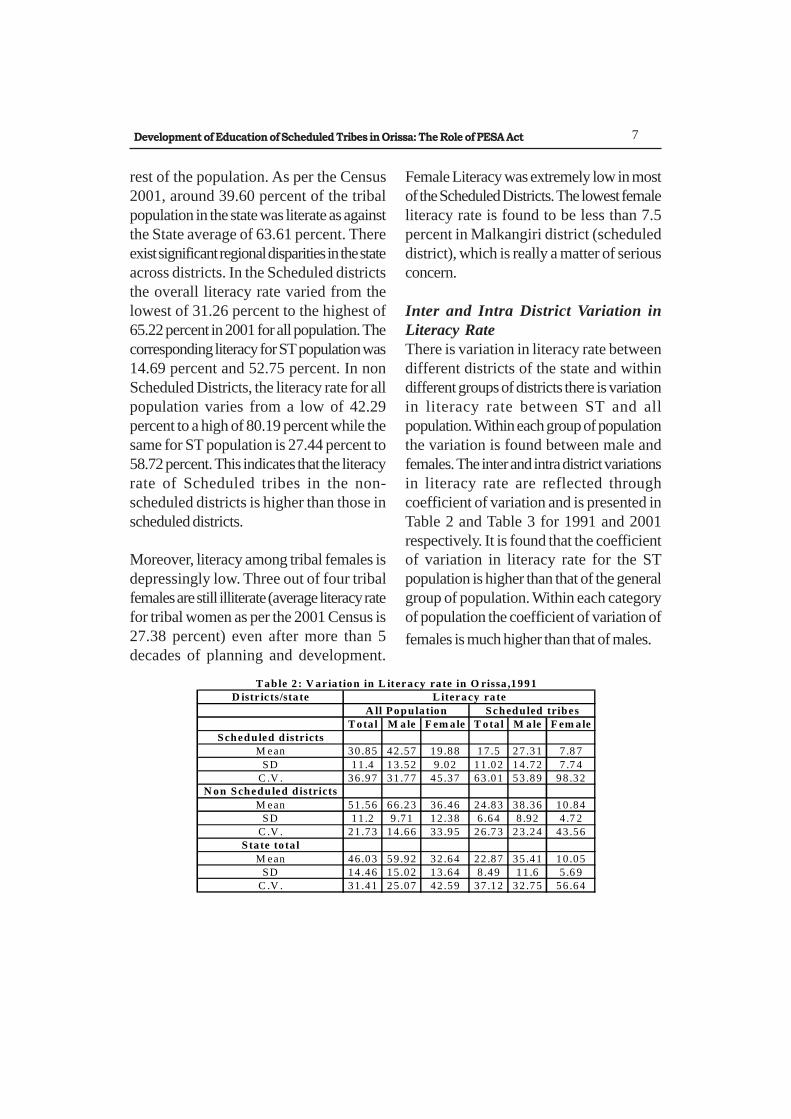
rest of the population. As per the Census2001, around 39.60 percent of the tribalpopulation in the state was literate as againstthe State average of 63.61 percent. Thereexist significant regional disparities in the stateacross districts. In the Scheduled districtsthe overall literacy rate varied from thelowest of 31.26 percent to the highest of65.22 percent in 2001 for all population. Thecorresponding literacy for ST population was14.69 percent and 52.75 percent. In nonScheduled Districts, the literacy rate for allpopulation varies from a low of 42.29percent to a high of 80.19 percent while thesame for ST population is 27.44 percent to58.72 percent. This indicates that the literacyrate of Scheduled tribes in the non-scheduled districts is higher than those inscheduled districts.
Moreover, literacy among tribal females isdepressingly low. Three out of four tribalfemales are still illiterate (average literacy ratefor tribal women as per the 2001 Census is27.38 percent) even after more than 5decades of planning and development.
Female Literacy was extremely low in mostof the Scheduled Districts. The lowest femaleliteracy rate is found to be less than 7.5percent in Malkangiri district (scheduleddistrict), which is really a matter of seriousconcern.
Inter and Intra District Variation inLiteracy RateThere is variation in literacy rate betweendifferent districts of the state and withindifferent groups of districts there is variationin literacy rate between ST and allpopulation. Within each group of populationthe variation is found between male andfemales. The inter and intra district variationsin literacy rate are reflected throughcoefficient of variation and is presented inTable 2 and Table 3 for 1991 and 2001respectively. It is found that the coefficientof variation in literacy rate for the STpopulation is higher than that of the generalgroup of population. Within each categoryof population the coefficient of variation of
females is much higher than that of males.
D istr ic ts/sta te
T ota l M ale F em ale T ota l M ale F em aleScheduled d istricts
M ean 30 .85 42 .57 19 .88 17 .5 27 .31 7 .8 7
SD 11 .4 13 .52 9 .02 11 .02 14 .72 7 .7 4C .V . 36 .97 31 .77 45 .37 63 .01 53 .89 98 .32
N on Scheduled d istricts
M ean 51 .56 66 .23 36 .46 24 .83 38 .36 10 .84SD 11 .2 9 .71 12 .38 6 .64 8 .92 4 .7 2
C .V . 21 .73 14 .66 33 .95 26 .73 23 .24 43 .56State to ta l
M ean 46 .03 59 .92 32 .64 22 .87 35 .41 10 .05SD 14 .46 15 .02 13 .64 8 .49 11 .6 5 .6 9
C .V . 31 .41 25 .07 42 .59 37 .12 32 .75 56 .64
T able 2 : V ar ia tion in L iteracy ra te in O rissa ,1991L iteracy ra te
A ll Popula tion Scheduled tribes

8 CMDR Monograph Series No. - 52
Districts/state
Total Male Female Total Male Female
Scheduled districtsMean 43.71 56.34 31.13 30.17 42.8 17.9
SD 11.92 12.7 11.35 13.64 15.99 11.69
C.V. 27.27 22.55 36.46 45.22 37.35 65.32
Non Scheduled districtsMean 66.91 79.51 53.98 43.03 58.25 27.38
SD 10.22 7.94 12.54 8.76 9.53 8.34
C.V. 15.27 9.98 23.24 20.36 16.35 30.46
State totalMean 60.72 73.33 47.89 39.6 54.13 24.85
SD 14.79 13.9 15.83 11.57 13.25 10.08
C.V. 24.36 18.96 33.06 29.22 24.49 40.45
Table 3: Variation in Literacy rate in Orissa,2001Literacy rate
All Population Scheduled tribes
Chart 1 below shows clearly the coefficients of variation in literacy rate for ST populationvis-à-vis other population, which gives a clear idea about the extent of variation in literacyrates between these two groups of population.
Inter-district Variation in Literacy rate by regions in 2001
0
5
10
15
20
25
30
35
40
45
50
Scheduled dist Non Scheduled dist StateCo-efficient of Variation
All Population ST

External Assistance For Health Sector : 9Development of Education of Scheduled Tribes in Orissa: The Role of PESA Act
The variation in literacy rate is different indifferent groups of districts. Moreinterestingly, the mean literacy rate is thehighest in the non scheduled districts wherethe scheduled tribe population is the lowerwhile the mean literacy rate is the lowest inthe scheduled districts where theconcentration of ST population is very high(more than 50 percent). The coefficient ofvariation in literacy rate is the lowest in non-scheduled districts and the same is thehighest in scheduled districts. The coefficientof variation in literacy rate for females ishigher than that of males but it is the highestin the scheduled districts. It is found to be ashigh as more than 98 percent (in 1991) and65.32 percent (in 2001) for females. Thisgives a clear idea that the scheduled tribesin non-scheduled districts perform betterthan those in the scheduled districts.
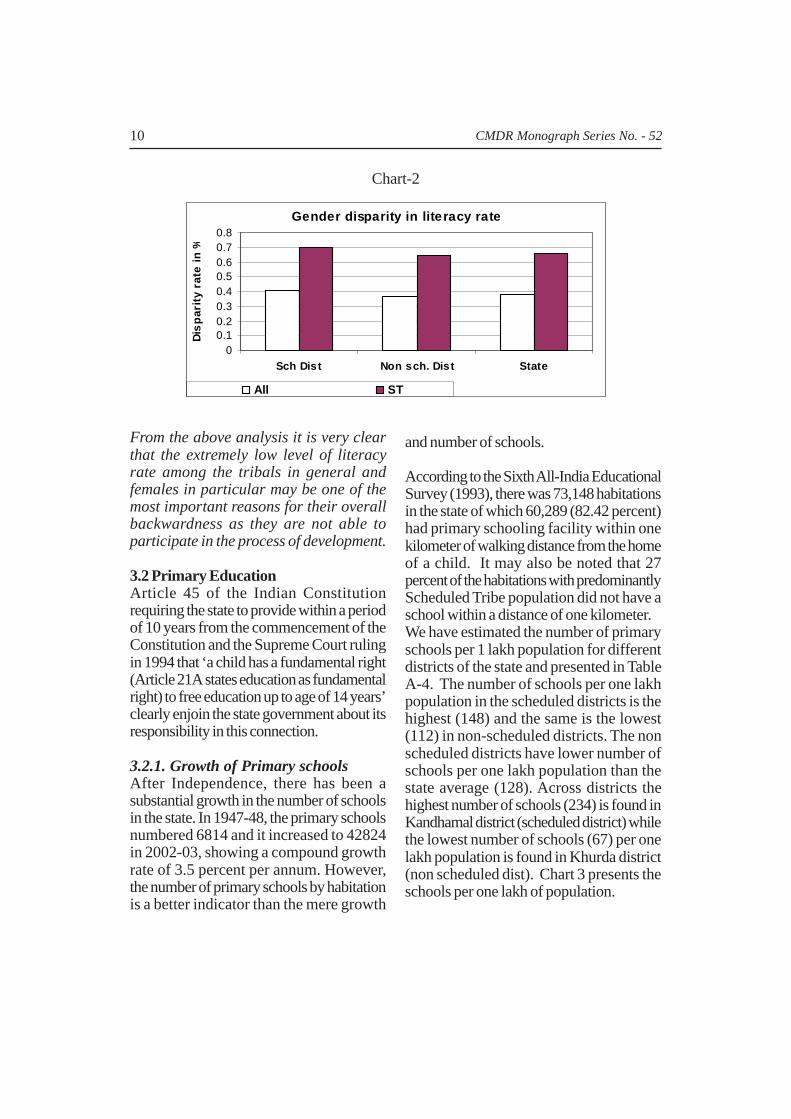
Gender disparity in literacy rate
The literacy rate of females is always foundto be lower than their male counter parts.As stated earlier, the literacy rate of STfemales is extremely low particularly in thescheduled districts of the state, whichultimately leads to a higher gender disparityin literacy rate. We have estimated thegender disparity rate by using Sopher’sDisparity index formula given earlier. The
details of gender disparity index areprovided in Table A-2 for all types ofdistricts. Across districts, as per 2001Census the disparity index is the highest(0.59) in Nuapada district (Non-scheduledDistrict) and the lowest disparity index (0.29)is found in Sundergarh district (ScheduledDistrict). The lowest disparity in Sundergarhmay be largely due to the fast growingurbanization and the industrialization (steelplant in Rourkela). Table 4 presents thesummary of the gender disparity index inliteracy for three groups of districts.
The gender disparity index in literacy of thescheduled districts is found to be higher thanthat of non-scheduled districts and the stateaverage. The gender disparity index for STis found to be higher than all population. Thelower gender disparity index for ST in non-scheduled districts indicates that the literacyrate of ST females in this category of districtsis relatively good. The chart 2 shows the
gender disparity index in literacy rate.
Districts/State
All ST All STScheduled
Dist 0.39 0.7 0.33 0.46Non
scheduled
Dist 0.33 0.62 0.24 0.41
State 0.35 0.61 0.19 0.42
1991 Census 2001 CensusGender Disparity Index in Literacy Rate
Table 4
10 CMDR Monograph Series No. - 52
Gender disparity in literacy rate
0
0.10.2
0.3
0.4
0.5
0.6
0.7
0.8
Sch Dist Non sch. Dist State
Dis
pa
rity
ra
te i
n %
All ST
Chart-2
From the above analysis it is very clearthat the extremely low level of literacyrate among the tribals in general andfemales in particular may be one of themost important reasons for their overallbackwardness as they are not able toparticipate in the process of development.
3.2 Primary EducationArticle 45 of the Indian Constitutionrequiring the state to provide within a periodof 10 years from the commencement of theConstitution and the Supreme Court rulingin 1994 that ‘a child has a fundamental right(Article 21A states education as fundamentalright) to free education up to age of 14 years’clearly enjoin the state government about itsresponsibility in this connection.
3.2.1. Growth of Primary schoolsAfter Independence, there has been asubstantial growth in the number of schoolsin the state. In 1947-48, the primary schoolsnumbered 6814 and it increased to 42824in 2002-03, showing a compound growthrate of 3.5 percent per annum. However,the number of primary schools by habitationis a better indicator than the mere growth
and number of schools.
According to the Sixth All-India EducationalSurvey (1993), there was 73,148 habitationsin the state of which 60,289 (82.42 percent)had primary schooling facility within onekilometer of walking distance from the homeof a child. It may also be noted that 27percent of the habitations with predominantlyScheduled Tribe population did not have aschool within a distance of one kilometer.We have estimated the number of primaryschools per 1 lakh population for differentdistricts of the state and presented in TableA-4. The number of schools per one lakhpopulation in the scheduled districts is thehighest (148) and the same is the lowest(112) in non-scheduled districts. The nonscheduled districts have lower number ofschools per one lakh population than thestate average (128). Across districts thehighest number of schools (234) is found inKandhamal district (scheduled district) whilethe lowest number of schools (67) per onelakh population is found in Khurda district(non scheduled dist). Chart 3 presents theschools per one lakh of population.

External Assistance For Health Sector : 11Development of Education of Scheduled Tribes in Orissa: The Role of PESA Act
Schools per 1 lakh population
148
112
128
0
2040
6080
100
120140
160
Scheduled Dist Non Scheduled dist State
Sch
oo
ls
Chart-3
Here one may raise a question that in spiteof the larger number of schools in thescheduled districts why are these districtsbehind the non scheduled districts in respectof development of education? It is generallybelieved that the supply of schools to thescheduled tribes may enhance their enrolmentand overall quality of education. But contraryto this belief it is found that despite theexistence of very large number of schools inthe scheduled districts they are lagging behindtheir counterparts in respect of education.Mere existence of schools may not enhancethe standard of education unless (i) it isproperly equipped with the teaching andother inputs and (ii) the children should comeand attend the school. It is noticed that inthe remote tribal areas the teacherabsenteeism is a regular phenomena and thisaffects largely the quality of education. Lackof basic infrastructure (roads, electricity andother communications) in the area as well as
in the schools also is responsible for poorattendance in the schools by the teachersand students. Most of these schools havebecome dysfunctional in tribal areas. The roleof governance is also found not to be veryeffective in this case which has beenemphasized in the PESA act. The tribalsmay be empowered to manage their villageschools by making the schools morefunctional.For promoting the education of thebackward population (SC and ST) in thestate the government of Orissa hasestablished special schools for them likeSevashramas, Kanyashramas etc. Asrevealed from Table 5 that there is not muchimprovement in the number of schools inrecent years. The number of schools on theother hand either remains stagnant ordeclined as in case of Sevashramas, forexample there was a decline in theSevashramas from 951 in 1995-96 to 919

12 CMDR Monograph Series No. - 52
in 1998-99 and afterwards it becamestagnant. The Kanyashramas have becomestagnant from 1997-98 onwards.
3.2.2 Growth of EnrolmentIn Orissa, the number of students in primaryeducation increased by 19 times between1947-48 and 2003-04 (HumanDevelopment Report, Orissa 2004).Currently (2003-04), there are 4.9 million
YearSevashrams Ashrams Kanyashrams
1995-96 951 109 341996-97 940 110 351997-98 929 110 37
1998-99 919 112 371999-00 919 112 372002-03 919 112 37
Source: Economic Survey, Government of Orissa.
Table 5Special Schools for ST and SC in Orissa
No. of Schools
children enrolled in primary schools.However, when we compare the decade ofthe 1980s to that of 1990s, there has been avirtual stagnation in the average annual rateof growth of enrollment i.e 2.7 percent andit increased to 2.8 percent during the period1990-91 to 2003-04. The scheduled tribeenrolment is always lower than the enrolmentof other communities and it is morepronounced in the non-scheduled districts.It is found that in the non -scheduled districtsthe enrolment in primary level among the STchildren is 13 percent while in the scheduleddistricts the enrolment of ST is 49.5 percentwhich is quite obvious. The enrolment of STin the state has either remained constant orhas declined over the years, which is a matterof concern. The chart 4 presents the trend
in ST enrolment in primary education.
Enrolment (%) of ST at primary level
22 22 22 2321
25 24
10
15
20
25
30
1996-
97
1997-
98
1998-
99
1999-
00
2000-
01
2001-
2002
2002-
03
% o
f e
nro
lme
nt
Chart-4

External Assistance For Health Sector : 13Development of Education of Scheduled Tribes in Orissa: The Role of PESA Act
Coefficient of Equality in enrolment
between ST and Non – ST
The Coefficient of equality in primary schools
for the scheduled and non scheduled districts
is 85.61 and 115.9 respectively and for the
state it is 107.5. It indicates that Scheduled
Tribes in Non-Scheduled Districts are at par
with other communities as they are availing
the better educational facilities when compare
Dropout Rate in primary education
0.0
10.0
20.0
30.0
40.0
50.0
60.0
70.0
80.0
All Children SC ST
Dro
po
ut
rate
in
%
1995-96 2002-03
to STs of Scheduled Districts. It is interesting
to note that the co-efficient of equality is
more than 100 for 13 districts (out of 22) in
the Non-Scheduled Districts and only 2
districts (out of 8) in case of the Scheduled
Districts. The details of coefficient of
educational equality are presented in Table
A-5. Table 6 presents the summary of the
region wise coefficient equality in enrolment.
Districts/State Total Boys GirlsScheduled dists 85.61 91.46 79.15
Non-scheduled dists 115.9 129.8 100State total 107.5 119.5 93.9
Coefficient of Equality in Enrolment (ST and Non ST) in
Primary education
Table 6
Chart-5

14 CMDR Monograph Series No. - 52
Gender parity Index in EnrolmentThe enrolment of boys is always found tobe higher than that of girls. We haveestimated the gender parity index inenrolment, which shows the ratio of girl’senrolment to boy’s enrolment. The genderparity index of ST children is always lowerthan that of non ST. Across regions, thegender parity index is the lowest in thescheduled districts and highest in nonscheduled districts for both ST and non -ST children. District wise estimates ofgender parity index indicates that the ST girlsare at par with their boys counterparts inthe district of Khurda and in Boudh (nonscheduled district) while they are behind theirboy counterparts in all the scheduled
districts. The lower enrolment of girls thanboys among the scheduled tribes is attributedmainly to (i) extremely low female literacyrate (among tribal females), (ii) lowpercentage of female teachers and (iii) lowpercentage of tribal teachers. Many studieshave documented that the girl’s education issignificantly influenced by mother’seducation. The low female literacy amongthe tribal females may be one of thesignificant factors for low enrolment ofST girls. The details of district wise indexare presented in Table A- 6. The summaryof gender parity is presented in Table 7.Chart 5 clearly depicts the gender parityindex in enrolment of ST and Non ST.
Districts/State All Children Non ST ST
Scheduled dists 0.78 0.81 0.74
Non scheduled dists 0.85 0.86 0.8
State Total 0.83 0.85 0.77
Gender Parity Index in Enrolment by region and by social
groups
Table 7
Gender Parity Index in Enrolment at Primary Level
0.68
0.70
0.72
0.74
0.76
0.78
0.80
0.82
0.84
0.86
0.88
Sche duled dists Non sche dule d dists State Total
Ge
nd
er
Pa
rity
Ind
ex
All Childre n Non ST ST

External Assistance For Health Sector : 15Development of Education of Scheduled Tribes in Orissa: The Role of PESA Act
3.2.3 Dropout Rate of ST and Non-ST
The dropout rate is one of the negativeindicators of educational development. It isfound to be very high among the backwardpopulation. There is substantial improvementin the dropout rate among all the groups ofpopulation over the years. It has declinedfrom 52 percent in 1995-96 to 35 percent
in 2002-03 for all children at the primarylevel. This implies that 65 children in 100children are able to reach the last year ofprimary education. Across Social groups, thedropout rates is the highest among the STchildren i.e. 53.4 percent in 2002-03 whichmeans 53 percent of the children enrolled inclass – I dropout before completing class –V. The details of dropout are given in Table 8.
Year All children SC ST1995-96 51.6 55.8 70.2
1996-97 47.6 55.4 69.9
1997-98 47 54.9 68.7
1998-99 45.6 52.9 65
1999-00 43 52.5 64.7
2000-01 41.8 52.1 63.4
2001-02 41 51 63
2002-03 34.7 37.3 53.4
Dropout rate at Primary level in Orissa
Source: Directorate of Public Instruction office, Orissa
Table 8
Chart. 7 shows the dropout rate in primary education.
Chart-7Dropout rate at Primary level, Orissa
0
10
20
30
40
50
60
70
80
1995-96 1996-97 1997-98 1998-99 1999-00 2000-01 2001-02 2002-03
Dro
po
ut
rate
in
%
All children SC ST

16 CMDR Monograph Series No. - 52
3.2.4. Teachers
Among the various factors thatinfluence the quality of education anddetermine its contribution to nationaldevelopment, the quality and character ofteachers are undoubtedly the most significant(Education Commission 1968). Thus,teachers occupy a vital role in the educationsystem.
Most of the tribal children may beslower learners due to the fact that majorityof the tribal children are the first generationacademic learners and have least scopeof support and help from parents andrelatives who are illiterate. Hence the role ofteachers assumes significance towards thesechildren.
During the period 1947-48 to 2000-01,there has been a significant increase in thenumber of teachers in primary schools. Thenumber teachers in primary schools were114,791 in 2000-01 as against 16,520 in1947-48. (Human Development Report,Orissa 2004). However, the distribution ofnumber of teachers varies considerably fromone Region to other Region. The number ofteachers (33181) in Scheduled districts isless than half of teachers in the Non-scheduled Districts (81610) as per 2000-01.
Pupil-Teacher Ratio
By 2000-01 the overall pupil teacher ratiois 41 in the state of Orissa, indicating thatthe state has not yet fulfilled the national norm
of 35 students per teacher at the primarylevel. Most of the scheduled districts arefound either within the norm or below thenational norm except two districts. It maybe due to the fact that most of the schools inthese districts are having small number ofstudents as compared to other districts undernon scheduled category. But the pupil teacherratio in non scheduled districts is higher thanthe state average and scheduled districts.
Female Teachers
It is well documented by the researchers thatnumber of female teachers in a schoolgenerally enhances the enrolment of girls. Inview of this, a particular norm is fixed whichenvisages that at least 50 percent of the totalteachers should be females. But, the state isfar behind this norm as the percentage offemale teachers to total teachers in primaryschools is only 24 percent in 2000-01 in thestate. The proportion of female teachers isfound to be almost equal in all the regionsand in the state i.e below 25percent (Table 9).
ST teachers
More than female teachers the presence ofST teachers to teach the ST childrenassumes significance in the sense that theteachers from their own community knowthe language and culture of the tribal childrento teach them better than other teachers.Most of the studies found that language isone of the important constraints of tribalchildren at the beginning of their learning. But

External Assistance For Health Sector : 17Development of Education of Scheduled Tribes in Orissa: The Role of PESA Act
the percentage of tribal children in differentregions and in the state shows a verydisheartening picture. The proportion oftribal teachers in the state is less than 9percent and across region it is found that inthe scheduled districts it is the highest and inthe non-scheduled districts it is the lowest.Table 9 summarizes the position relating tofemale teachers and tribal teachers in primaryeducation in Orissa.
4. The PESA1 Act, 1996 and TribalEducation
The governanceMany times the term governance andmanagement in educational institutions is usedinterchangeably which is, however, notcorrect. The role of Governance is toformulate the rules and policies to promotethe quality of educational institutions whilemanagement is responsible for theimplementation and execution of the policies.As such Governance sets the parameters formanagement. Hence good governance forachieving high quality of education is anecessary condition but not a sufficientcondition. The Governance may be national,
Districts/state
% of Female
teachers
% of ST
teachers P/T ratio
Scheduled Dist 24.7 16.5 33
Non Scheduled dist 24.5 5.6 44State 24.0 8.8 41
Table 9
Schools, Teachers and Pupil teacher ratio in Primary Schools in Orissa (2000-01)
state and local to govern the policies ofeducation. The 73rd and 74th Amendmentsof the Constitution have empowered thePanchayats to participate in decision makingat the grass root level in the process ofdevelopment. In recent years the mostsignificant change is the shift in managementfrom government to the local bodies.
Even the experiment in decentralisedgovernance in India, which aims atempowering the people for effectiveparticipation in local governance, has hardlygiven the tribals any power to have controlover the natural resources like land and foreston which the tribals depend for theirlivelihood. Despite the Constitutionalprovision of special powers vested with theGovernors wherein they can exclude any Actof Parliament or of the State Legislature tothe ‘scheduled areas’2 by notification, orextend them with such exceptions andmodifications, which they think necessary forpeace and good Governance, none of thegovernors of states having scheduled areashave applied their discretion in enforcingsuch provisions. On the contrary, all the Acts
18 CMDR Monograph Series No. - 52
and enactments passed by Parliament as wellas State legislatures have been extended tothe scheduled areas without making suitablemodifications to suit to the socio-cultural,political and economic ethos of the tribals.
Self Governance
The analyses on educational developmenthave revealed that the tribals are far behindtheir counterparts in all the indicators ofeducation. The government has madeconcerted efforts to develop the educationalstatus of tribals by increasing the number ofschools, teachers and other inputs. But itseems that the supply of all the educationalinputs is either not sufficient or notappropriate to create the demand foreducation among the tribals. One may raisethe question: Why is the governments’endeavour not very effectives in thisdirection? The role of governance for theeducational development for the STs maybe different than the role of governance inother cases. The self governance rather thanthe state level governance may be more usefulin this case which can be materialsed moreeffectively through the PESA act, 1996.
The Panchayats Extension to ScheduledAreas (PESA) Act, 1996, in fact, has madeit mandatory for the States having scheduledareas to make specific provisions for givingwide-ranging powers to the tribals on thematters relating to decision-making anddevelopment of their community. Technically,when the Act refers to extending the
provisions of Part IX of the Constitution tothe fifth scheduled areas; politically, it givesradical governance powers to the tribalcommunity and recognises traditionalcommunity rights over local naturalresources. It not only accepts the validity of“customary law, social and religiouspractices, and traditional managementpractices of community resources”, but alsodirects the state governments not to makeany law which is inconsistent with these.Accepting a clear-cut role for the community,it gives wide-ranging powers to GramSabha3 .
Grama Sabhas
Grama sabha has been empowered tosafeguard and preserve the traditions andcustoms of the people, their culturalidentities. However, due to the high incidenceof illiteracy and low level of education amongthese people has provided little impetus totheir growth at this level. Thus, educationplays a crucial role in increasing the level ofawareness among the people including thetribals. The right to education for ST hasnot been duly guaranteed so far. They areneeded to be educated through socialmobilisation generated by education. Theliteracy campaigns in tribal areas have provedenormous impact on the other social sectors,most notably women’s empowerment, healthand population stabilization along withenvironmental awareness.
External Assistance For Health Sector : 19Development of Education of Scheduled Tribes in Orissa: The Role of PESA Act
Panchayati Raj Institutions to some extentare providing the opportunity to the peoplefor democratic participation through socialaction. But the effective functions ofPanchayats depend on the type of people,their level of education etc. Wherever theeducational background of the population isbetter the Pachayats are also doing well inempowering the people. One such exampleis provided in Box-1.
Box 1 Education and Empowerment
Kashipur dominated by tribals is located in the eastern state of Orissa and falls under Schedule Five of the Constitution. The literacy rate of a shocking 1 – 2 percent, the tribes of Kashipur have neither the means of protest, or indeed, even the awareness, that they are being deprived of their basic fundamental rights, guaranteed to every citizen of this country, by the highest legal order of the land. Champa Devi , 28 year old, the first women Sarpanch, was unanimously selected for the post in 2001. She was the obvious choice even for men, as she held the most advanced education, having completed class seven at the local government school. Champa Devi’s first project was to organise access to credit in order to stimulate economic development. With the assistance of a local NGO in Kashipur, Champa Devi established a women’s group called the “Ama Sangathan” or Our Organisation. Champa Devi after lot of efforts was able to overcome all the difficulties faced by the tribals for credit from the banks. Now their model is being promoted by women’s organizations around the world!
It is now quite clear that education playspivotal role in empowering people in generaland women in particular. On the whole itseems that PESA Act does not have muchinfluence on education of tribals in terms ofcommunity participation. It may be due tothe reason that it has not yet implemented inthe right perspective.
5. Concluding observations
The main findings of the study are: i) Theliteracy rate of male, female and totalpopulation of scheduled tribes in thescheduled districts are lower than the nonscheduled districts with an exception to thedistrict of Sundergarh. The lowest femaleliteracy rate is found to be less than 8 percentin Malkangiri district (scheduled district),which is really a matter of serious concern.ii) About 27 percent of the habitations withpredominantly scheduled tribe population donot have a primary school within a radius ofone kilometer. iii) The enrolment in primaryschools indicates that girls are generallybehind the boys in all types of regions(scheduled dist and non-scheduled dist). Butthe girls–boys ratio in enrolment is the lowestin the scheduled districts and highest in non-scheduled districts. The dropout rate of STchildren is the highest as only 47 percent ofchildren continue till class-V among ST whilethe same is 65 percent among others. iv)The percentage of female teachers in the stateis much below the required norm. Acrossregion the same pattern is observed as it ismuch below than the state as a whole. v)

20 CMDR Monograph Series No. - 52
The percentage of tribal teachers is only 8.4percent in the state and only 16 percent intribal dominate areas. .vi) The PESA Act of1996 after more than a decade does notseem to empower the tribals to realise theirbasic rights particularly in respect ofeducation and health.
In view of the above findings the followingsuggestions may be considered:
i) Extensive literacy campaign in the tribaldominated districts may be undertakenon a priority basis to literate the tribal ingeneral and the tribal females in particularin order to create awareness about theirrights to education and other fundamentalrights.
ii) The primary schools need to be providedwithin the habitation of the tribals andmore of tribal teachers need to beappointed in these schools located intribal areas.
iii) It is also felt that in the context of a lessdeveloped region (scheduled districts) ina less developed state it is not highereducation but effective literacy and at leastprimary education would prove to bemore effective to make them participatein the process of developmental activities.
iv) Hence, it is now high time to make theimplementation of The PESA Act, 1996more vigorously and effectively throughinstitutional means.

External Assistance For Health Sector : 21Development of Education of Scheduled Tribes in Orissa: The Role of PESA Act
Table A-1
I Scheduled
1991 2001 1991 2001 1991 2001 Total Male Female Total Male Female1 Gajapathi 29.37 41.73 41.76 55.14 17.44 28.91 15.88 25.66 6.75 27.77 41.60 14.832 Koraput 24.64 36.20 33.98 47.58 15.15 24.81 8.34 14.61 2.14 18.68 29.25 8.383 Kandhama 37.23 52.95 54.68 69.98 19.82 36.19 27.49 43.93 11.56 44.47 62.72 26.874 Malkangiri 20.04 31.26 28.24 41.21 18.69 21.28 6.77 11.21 2.32 14.69 22.05 7.505 Mayurbhan 37.88 52.43 51.84 66.38 23.68 38.28 24.10 37.72 10.50 38.80 54.11 23.516 Nabarangp 18.62 34.26 28.10 47.37 9.01 21.02 9.66 17.50 1.80 24.00 36.86 11.127 Rayagada 26.01 35.61 36.53 47.35 15.63 24.31 10.39 17.73 3.40 20.23 31.16 10.078 Sundargarh52.97 65.22 65.41 75.69 39.60 54.25 37.34 50.13 24.52 52.75 64.66 40.90
Mean 30.85 43.71 42.57 56.34 19.88 31.13 17.50 27.31 7.87 30.17 42.80 17.90SD 11.40 11.92 13.52 12.70 9.02 11.35 11.02 14.72 7.74 13.64 15.99 11.69C.V. 36.97 27.27 31.77 22.55 45.37 36.46 63.01 53.89 98.32 45.22 37.35 65.32
II Non Scheduled dists9 Deogarh 44.45 60.78 59.43 73.79 29.26 47.56 27.47 41.25 13.73 45.26 59.41 31.23
10 Jharsuguda52.64 71.47 67.29 83.04 37.11 59.23 34.87 50.95 18.37 57.23 71.86 42.2711 Kendujhar 44.73 59.75 59.04 72.53 30.01 46.71 24.89 38.01 11.74 40.30 54.63 25.9712 Kalahandi 31.08 46.20 46.85 62.88 18.28 29.56 18.54 32.00 5.48 34.17 51.70 17.1513 Nuapada 27.52 42.29 42.31 58.78 12.78 26.01 18.49 32.00 5.18 33.12 50.69 16.1814 Sambalpur 51.56 67.01 65.90 78.87 36.43 54.79 32.06 47.10 16.83 52.67 66.92 38.4015 Angul 51.53 69.40 67.66 82.02 34.32 56.01 25.77 40.01 11.13 45.35 60.25 30.0516 Baleswar 57.64 70.94 71.23 81.75 43.40 59.57 18.91 30.08 7.37 31.88 45.63 17.6917 Baragarh 47.65 64.13 63.78 77.93 31.21 50.03 30.85 47.08 14.61 50.21 65.87 34.4418 Bhadrak 60.54 74.64 74.62 85.44 46.35 63.62 12.87 20.25 4.91 27.44 38.00 16.4319 Bolangir 38.63 54.93 55.64 70.36 21.30 39.27 24.86 41.17 8.65 43.64 61.96 25.5220 Boudh 40.98 58.43 60.61 76.86 21.01 39.78 28.88 48.41 9.30 46.65 68.29 25.1821 Cuttack 65.44 76.13 77.41 85.46 52.44 66.19 21.03 32.83 8.24 35.75 50.49 20.1422 Dhenkanal 54.91 70.11 68.80 81.31 40.33 58.55 22.40 35.01 9.28 39.41 53.69 24.6623 Ganjam 46.72 62.94 63.88 78.39 29.87 47.70 19.98 32.69 7.02 35.54 50.22 20.6524 Jagatsinhp 65.78 79.61 75.27 88.96 53.05 69.94 24.87 35.35 13.33 48.62 59.87 35.9125 Jaipur 58.00 72.19 70.50 82.69 45.29 61.45 16.04 26.05 5.60 31.41 45.48 16.9326 Kendrapara63.61 77.33 76.82 87.62 50.67 67.29 16.86 26.02 6.25 40.07 53.52 25.2127 Kh d 67 72 80 19 78 74 88 38 55 39 71 06 28 11 41 66 13 41 49 91 65 43 33 07
District Wise Literacy Rate in Orissa by Social Groups of PopulationLiteracy rate of ST Literacy rate of ST
1991All Persons Males FemalesLiteracy rate of all population
2001

22 CMDR Monograph Series No. - 52
Table A-2
Gender Disparity Index in Literacy Rate in different Regions of Orissa Sl.No. Districts
2001 1991 1991 2001
I Scheduled Dists1 Gajapathi 0.35 0.44 0.62 0.522 Koraput 0.34 0.40 0.86 0.58
3 Kandhamal 0.39 0.53 0.66 0.474 Malkangiri 0.34 0.20 0.70 0.50
5 Mayurbhanj 0.32 0.42 0.62 0.446 Nabarangpur 0.42 0.54 1.02 0.58
7 Rayagada 0.35 0.42 0.75 0.548 Sundargarh 0.21 0.29 0.38 0.27
All Scheduled Dists 0.34 0.41 0.70 0.44
II Non Scheduled dists9 Deogarh 0.27 0.39 0.55 0.36
10 Jharsuguda 0.23 0.35 0.53 0.32
11 Kendujhar 0.27 0.38 0.58 0.4012 Kalahandi 0.42 0.48 0.83 0.57
13 Nuapada 0.44 0.59 0.86 0.5914 Sambalpur 0.24 0.34 0.53 0.3315 Angul 0.25 0.39 0.63 0.39
16 Baleswar 0.21 0.30 0.67 0.4817 Baragarh 0.28 0.40 0.59 0.37
18 Bhadrak 0.20 0.30 0.65 0.4219 Bolangir 0.35 0.51 0.76 0.49
20 Boudh 0.40 0.57 0.82 0.5621 Cuttack 0.18 0.25 0.66 0.48
22 Dhenkanal 0.22 0.32 0.64 0.4223 Ganjam 0.31 0.43 0.73 0.46
24 Jagatsinhpur 0.17 0.22 0.48 0.2925 Jaipur 0.20 0.27 0.72 0.50
26 Kendrapara 0.19 0.26 0.67 0.4027 Khurda 0.16 0.23 0.56 0.39
28 Nayagarh 0.24 0.35 0.65 0.4529 Puri 0.19 0.28 0.44 0.34
30 Sonepur 0.34 0.53 0.66 0.41
All non Scheduled dists 0.26 0.37 0.65 0.41III State 0.28 0.38 0.66 0.42
ST PopulationAll Population

External Assistance For Health Sector : 23Development of Education of Scheduled Tribes in Orissa: The Role of PESA Act
Table A 3Region Wise Enrolment primary Education by Sex and by Caste groups, 2000-01
Sl.No. DistrictsTotal Boys Girls Total Boys Girls Total Boys Girls
Scheduled Dist1 Gajapathi 78000 42000 36000 39000 20000 19000 39000 22000 170002 Koraput 111000 64000 47000 61000 34000 27000 50000 30000 20000
3 Kandhamal 112000 61000 51000 57000 31000 26000 55000 30000 250004 Malkangiri 77000 45000 32000 37000 21000 16000 40000 24000 16000
5 Mayurbhanj 273000 154000 119000 117000 64000 53000 156000 90000 660006 Nabarangpur 143000 84000 59000 92000 53000 39000 51000 31000 200007 Rayagada 95000 55000 40000 49000 28000 21000 46000 27000 19000
8 Sundargarh 193000 104000 89000 94000 50000 44000 99000 54000 45000Total 1082000 609000 473000 546000 301000 245000 536000 308000 228000
Non-scheduled Dist9 Deogarh 34000 18000 16000 22000 11000 11000 12000 7000 5000
10 Jharsuguda 64000 33000 31000 41000 21000 20000 23000 12000 1100011 Kalahandi 162000 87000 75000 116000 61000 55000 46000 26000 20000
12 Kendujhar 219000 117000 102000 118000 62000 56000 101000 55000 4600013 Nuapada 84000 48000 36000 59000 34000 25000 25000 14000 11000
14 Sambalpur 96000 50000 46000 58000 30000 28000 38000 20000 1800015 Angul 147000 78000 69000 127000 67000 60000 20000 11000 900016 Baleswar 324000 176000 148000 291000 157000 134000 33000 19000 14000
17 Baragarh 182000 95000 87000 148000 77000 71000 34000 18000 1600018 Bhadrak 194000 110000 84000 187000 106000 81000 7000 4000 300019 Bolangir 181000 99000 82000 142000 78000 64000 39000 21000 18000
20 Boudh 50000 27000 23000 44000 24000 20000 6000 3000 300021 Cuttack 295000 158000 137000 285000 152000 133000 10000 6000 400022 Dhenkanal 136000 71000 65000 117000 60000 57000 19000 11000 8000
23 Ganjam 373000 200000 173000 361000 193000 168000 12000 7000 500024 Jagatsinhpu 135000 74000 61000 134000 74000 60000 1000 NA NA25 Jaipur 282000 159000 123000 269000 151000 118000 13000 8000 5000
26 Kendrapara 146000 79000 67000 145000 78000 67000 1000 1000 NA27 Khurda 165000 87000 78000 157000 83000 74000 8000 4000 4000
28 Nayagarh 106000 63000 43000 94000 55000 39000 12000 8000 400029 Puri 178000 93000 85000 177000 92000 85000 1000 1000 NA30 Sonepur 75000 39000 36000 66000 34000 32000 9000 5000 4000
Total 3628000 1961000 1667000 3158000 1700000 1458000 470000 261000 208000
Enrollment of All Communities Enrolment of Non ST children ST Enrollment

24 CMDR Monograph Series No. - 52
Table A-4
District Wise Primary Schools, Teachers and Pupil Teacher Ratio in Orissa, 2000-01
Sl.No. Districts
School per 1
lakh
Population
Pupil-Teacher
ratio
% Of Female
Teachers
% Of ST
Teachers
I Scheduled Districts1 Gajapati 181 41 14.6 25.92 Koraput 157 26 35.4 18.5
3 Kandhamal 234 33 20.6 17.34 Malkangiri 178 32 11.9 9.3
5 Mayurbhanj 132 40 24.6 16.96 Nabarangpur 122 38 22.4 10.9
7 Rayagada 178 23 20.6 12.78 Sundargarh 113 29 31.5 20
All Scheduled di 148 33 24.7 16.5
II Non Scheduled dists9 Deogarh 154 27 24.5 6.9
10 Jharsuguda 120 33 22.2 16.8
11 Kalahandi 128 34 14.7 8.512 Kendujhar 116 48 17.6 13.2
13 Nuapada 138 46 14 1614 Sambalpur 108 27 30.1 8.4
15 Angul 108 43 22 7.216 Balasore 90 69 25.2 3.9
17 Baragarh 106 42 17.8 10.318 Bhadrak 93 62 29.4 1.4
19 Bolangir 145 26 12.6 8.820 Boudh 158 36 16.1 9.8
21 Cuttack 93 54 33.7 122 Dhenkanal 105 46 28.1 2.5
23 Ganjam 93 47 19.2 1.924 Jagatssinghpur 111 49 44.1 0
25 Jaipur 93 70 37.2 1.326 Kendrapara 110 40 25.3 0.1
27 Khurda 67 35 46.4 0.628 Nayagarh 96 55 11.5 2.2
29 Puri 95 49 38.6 0.130 Sonepur 140 29 8.7 2.6
All non schedul 112.14 43.95 24.50 5.61III State total 128.00 40.71 24.04 8.76

External Assistance For Health Sector : 25Development of Education of Scheduled Tribes in Orissa: The Role of PESA Act
S.No. Districts
Total Boys GirlsI Scheduled Districts
1 Gajapathi 96.92 108.35 85.37
2 Koraput 83.22 91.31 73.783 Kandhamal 89.21 91.09 87.33
4 Malkangiri 80.15 86.82 72.345 Mayurbhanj 102.24 109.63 93.89
6 Nabarangpur 45.3 48.18 41.577 Rayagada 74.49 79.27 69.35
8 Sundargarh 104.5 112.23 96.69Total of scheduled dists 85.61 91.46 79.15
II Non Scheduled districts
9 Deogarh 107.79 128 85.8910 Jharsuguda 122.89 128.2 117.51
11 Kalahandi 98.77 108.2 88.8912 Kendujhar 106.74 112.3 100.87
13 Nuapada 79.69 78.59 81.5614 Sambalpur 124.4 129.15 119.57
15 Angul 119.24 126.7 111.416 Baleswar 89.15 95.9 81.5
17 Baragarh 95.67 98.1 93.118 Bhadrak 194.84 194.8 194.4
19 Bolangir 105.69 105.1 106.720 Boudh 95.72 88.5 104.321 Cuttack 94.76 107.4 80.6
22 Dhenkanal 110.69 125.5 95.323 Ganjam 112.23 121.5 101.3
24 Jagatsinhpur 90.61 0 212.625 Jaipur 57.47 62.7 50.7
26 Kendrapara 130.93 232.2 027 Khurda 93.34 89.5 97.5
28 Nayagarh 204.33 237.2 16129 Puri 188.85 351.3 0
30 Sonepur 125.83 136.6 114.6Total of Non-scheduled dists 115.9 129.8 100
III State total 107.5 119.5 93.9
Table A-5Co efficient of Equality in Enrolment
Co efficient of Equality in Enrolment

26 CMDR Monograph Series No. - 52
All Non ST STI Scheduled districts
1 Gajapathi 0.86 0.95 0.77
2 Koraput 0.73 0.79 0.673 Kandhamal 0.84 0.84 0.83
4 Malkangiri 0.71 0.76 0.675 Mayurbhanj 0.77 0.83 0.73
6 Nabarangpur 0.7 0.74 0.657 Rayagada 0.73 0.75 0.7
8 Sundargarh 0.86 0.88 0.83Total of Scheduled dists 0.78 0.81 0.74
II Non Scheduled districts
9 Deogarh 0.89 1 0.7110 Jharsuguda 0.94 0.95 0.92
11 Kalahandi 0.86 0.9 0.7712 Kendujhar 0.87 0.9 0.84
13 Nuapada 0.75 0.74 0.7914 Sambalpur 0.92 0.93 0.9
15 Angul 0.88 0.9 0.8216 Baleswar 0.84 0.85 0.74
17 Baragarh 0.92 0.92 0.8918 Bhadrak 0.76 0.76 0.75
19 Bolangir 0.83 0.82 0.8620 Boudh 0.85 0.83 1
21 Cuttack 0.87 0.88 0.6722 Dhenkanal 0.92 0.95 0.7323 Ganjam 0.87 0.87 0.71
24 Jagatsinhpu 0.82 0.81 NA25 Jaipur 0.77 0.78 0.63
26 Kendrapara 0.85 0.86 NA27 Khurda 0.9 0.89 1
28 Nayagarh 0.68 0.71 0.529 Puri 0.91 0.92 NA
30 Sonepur 0.92 0.94 0.8All non scheduled dists 0.85 0.86 0.8
III State Total 0.83 0.85 0.77
*. Gender Parity Index in enrolment is estimated by taking the ratio of girls to boys enrolment
Table A-6Gender Parity Index* in enrolment in Primary Education
Sl.No. DistrictsGender Parity Index

External Assistance For Health Sector : 27Development of Education of Scheduled Tribes in Orissa: The Role of PESA Act
References
Bernard, Anne K. (2000), “Education for all
and children who are excluded”, Thematic
studies, World Education Forum, Education
for All 2000 Assessment, (UNESCO).
Bhubneshwar Sawaiyan, 2002, “An
Overview of the Fifth Schedule and the
Provisions of the Panchayats (Extension
to the Scheduled Areas) Act, 1996”, pa-
per submitted at Indigenous Rights in
the Commonwealth Project, South and
South East Asia Regional Expert Meeting,
India.
Census of India, Primary Census Ab-
stract, Orissa, 1991, 2001, Office of the
Registrar General, Bhubaneswar.
Dashora Rakesh, Sharma Anushree (2003)
“Role of Tribal Women in Education”,
Yojana Vol. 47, No. 6, pp. 40.
Das, A. 1994, “Women in Development, A
Study in Orissa”, Rupa Publications, New
Delhi.
Davies, Julie-Anne (2001). “Children
painted into grim corner”, 10 May 2001,
(www.theage.com.au).
Debi Sailabala (1990) “Education and
Economic Development of Tribals in an
Urban Setting”,
Journal of Educational Planning
&Administration, Vol. 10, No. 2, pp. 173.
Dutt Sumansh (2001) “The Determinants of
Children’s Educational Attainments: A Socio-
economic Empirical Study on Tribals of
Tripura”, Indian Social Science Review, Vol.
3, No. 2.
Economic Survey (2003-04), Directorate of
Economics and Statistics, Planning and Co-
ordination Department, Government of
Orissa.
Govinda.R (2002), (ed), “India Education
Report: A Profile of Basic Education
(NIEPA), Oxford University Press.
Heredia Rudolf .C (1995) “Tribal Education
for Development: Need for a Liberative
Pedagogy for Social Transformation”,
Economic and Political Weekly, Vol. 30, No.
16, pp. 891.
Haddad, W.D, Carnoy, M, Riniddi, R and
Regel, O(1990) “Education and Development:
Evidence for New Priorities”, World Bank
Discussion, Paper No.95, Washington D.C.,
World Bank.
Iyer, M. S. 2002, “Panchayati Raj – The way
forward”, Economic and Political Weekly,
August 3, 2002.
Madatala Rani (2000) “Tribal Languages
and Tribal Education”, Social Action Vol.
50, No. 4, pp. 414.
Mahi Pal, 2000, ‘Panchayats in fifth
scheduled areas’, Economic and Political

28 CMDR Monograph Series No. - 52
Weekly, Vol 35, No 19, pp. 6–10
Mathew, G. 1999, “Decentralised
Institutions”, Economic and Political
Weekly, February 27- March 5, 1999.
Orissa Human Development Report (2004),
Planning and Co-ordination Department,
Government of Orissa.
Orissa Development Report (2002), Planning
Commission, Government of India, New
Delhi.
Postlethwaite, T.N. 2004, “Monitoring
educational achievement”, Fundamentals of
Educational
Planning-81, International Institute for
Educational Planning/UNESCO, (http://
www.unesco.org /iiep).
Reddy P Sudhakara, Reddy K Raja
(2001) “Tribal Parents Awareness about
Educational Incentives in Andhra
Pradesh”, Journal of Educational
Planning &Administration, Vol. 15, No. 3,
pp. 377
Rovillos, Raymundo (1999). “Indigenous
peoples and education”, Briefing paper no.
3, TebTebba Foundation,
(www.tebtebba.org).
Shah D.C. and Yatindra Singh Sosodia (2004),
(eds.), Tribal Issues in India, Rawat Publi-
cations, Jaipur and New Delhi.
Sinha Durganand, Mishra Ramesh Dhandra
(1997) “Some Personality, Motivational and
Cognitive Characteristics of Tribals and their
Implications for Educational Development of
Children”, Journal of Educational Planning
&Administration, Vol. 11, No. 3, pp. 283.
Singh, Bhupinder and Mahanti, Neeti (1995),
(eds.), Tribal Education in India, Inter India
Publication, New Delhi.
Srivastava K K, Nauriyal D K, Srivastava
T (1996) “Occupational Structure and
Educational Status of Tribals”, Journal of
Educational Planning &Administration,
Vol. 4, No. 4, pp. 65.
Shrivastva Gauri (1997) “Reasons for
Discontinuance of Primary Education among
Tribals of Assam”, Social Change Vol. 27,
No. 1-2, pp. 99.
Sujatha, K 1999, “Education of India,
Scheduled Tribes: A study of community
schools in the district of Vishakhapatnam,
Andhra Pradesh”, Working Document Series,
published by International Institute for
Educational Planning/UNESCO, (http://
www.unesco.org /iiep).
Tilak, J.B.G (2002) Education in Orissa: A
Review of Progress, Problem and
Perspectives for Future on School Education,
Monograph prepared for UNDP, New
Delhi.

External Assistance For Health Sector : 29Development of Education of Scheduled Tribes in Orissa: The Role of PESA Act

30 CMDR Monograph Series No. - 52