Embed Size (px)
Citation preview

Vol. 8(20), pp. 778-790, 25 May, 2013
DOI 10.5897/SRE2013.5403
ISSN 1992-2248 © 2013 Academic Journals
http://www.academicjournals.org/SRE
Scientific Research and Essays
Full Length Research Paper
Development of drought vulnerability maps in the Parambikulam - Aliyar Basin, Tamil Nadu, India
M. Manikandan and D. Tamilmani
Department of Soil and Water Conservation Engineering, Agricultural Engineering College and Research Institute, Tamil
Nadu Agricultural University, Coimbatore – 641 003, Tamil Nadu, India.
Accepted 10 May, 2013
Assessment of occurrence of drought in a basin provides useful information for sustainable water resource planning and management. This study attempts to develop the spatial pattern of drought vulnerability based on frequency and severity of drought events at 3 and 12 month time scales in the Parambikulam-Aliyar river basin. Using the standardized precipitation index (SPI) as a drought assessment and monitoring tool, the occurrence of droughts was examined. The basin was divided into 97 grids of 5 × 5 km, spatial interpolation technique was applied in a geographic information system (GIS) environment with the help of inverse distance weighting approach and gridded rainfall data was generated using the monthly rainfall data for the period of 1972 to 2011 from 28 rain gauge stations. Gridded monthly SPI values were created using gridded rainfall and classified the SPI values based on drought categories and estimated percentage of occurrence (frequency) of drought categories (severity) at 3 and 12 month time scales. Spatial variation of moderate, severe and extreme drought maps are prepared and then integrated separately to prepare the drought vulnerability maps. Drought vulnerability map showed that the high and moderate vulnerability areas are mainly in the northern parts, while the areas with low vulnerability to drought are occurred in the southern parts of the basin. Key words: Drought vulnerability, geographic information system (GIS), rainfall, standardized precipitation index (SPI).
INTRODUCTION Drought is a complex natural phenomenon that affects more people than any other natural hazards causing significant damage both in natural environment and in human lives (Wilhite, 2000). As a normal feature of climate, drought occurs in virtually all climatic zones, such as high as well as low rainfall areas and its occurrence appears inevitable. Mostly droughts are related to the reduction in the amount of rainfall received over an extended period of time, such as a season or a year. Other meteorological characters such as temperatures; high winds; low relative humidity; timing and characteristics of rains, including distribution of rainy
days during crop growing seasons, intensity and duration of rain, and onset and termination, play a significant role in the occurrence of droughts (Mishra and Singh, 2010). The global climate change in recent years is likely to enhance the number of incidences of droughts.
Drought has been classified into meteorological (lack of rainfall), hydrological (drying of surface water storage), agricultural (lack of root zone soil moisture), and socio-economic (lack of water supply for socioeconomic purposes) ones. The first three classes are referred as environmental indicators and the last class is considered as a water resources indicator (Wilhite, 2000). These
*Corresponding author. E-mail: [email protected].
types of drought start to affect the supply and demand of economic products such as water, fish production, hydroelectric power generation, etc. Drought places enormous demand on rural and urban water resources, and immense burden on agricultural and energy production. Therefore, timely determination of the level of drought will assist the decision making process in reducing the impacts of drought.
There are several methods that have been used in the past as the drought assessment tools such as measurement of lack of rainfall, shortage of streamflow, reduced levels of water storage, and drought indices. Of these, drought indices are widely used for drought assessment (Heim Jr, 2002; Keyantash and Dracup, 2002; Smakhtin and Hughes, 2004; Morid et al., 2006). Drought indices are function of a number of hydrometeorological variables (for example, rainfall and streamflow), and expresses with a numeric number which is more functional than raw data during decision making. The most commonly used meteorological drought indices are: 1) Rainfall deciles; 2) the Palmer Drought Severity Index (PDSI); 3) Percent of Normal; 4) Z-index; and 5) the standardized precipitation index (SPI). These rainfall based drought indices are widely used than other drought indices due to their minimum input data requirements, flexibility and simplicity of calculations. In this study, the drought was considered as a meteorological phenomenon characterized by prolonged periods of abnormal rainfall deficit. The SPI was used for the identification and the assessment of drought events. The SPI have been more widely used by decision makers for quantifying most types of drought events. In addition it provides spatial and temporal representations of historical droughts.
Drought is a frequent phenomenon in India and drought areas are mainly confined to the Peninsular and Western parts of the country and there are only few pockets in the central, eastern, northern and southern parts. Out of 329 Million ha of total geographical area in India about 107 Million ha of lands are subjected to different degrees of water stress and drought conditions (Mishra and Desai, 2005). More than 100 districts spread over 13 states of India have been identified as drought prone districts, out of these, about 8 districts occur in the Tamil Nadu (Gupta et al., 2011). The western regions of Tamil Nadu (Coimbatore and Tiruppur districts) have suffered with severe droughts at many times in the past. The demand for water has increased many times due to the growth of population and expansion of agricultural, energy and industrial sectors, and almost every year water scarcity has been occurring. Other factors, such as climate change and contamination of water supplies, have further contributed to the water scarcity. In recent years, droughts have been experienced with higher peaks and severity levels. Assessment of drought vulnerability is of primary importance for water resources planning and management. This requires understanding historical
Manikandan and Tamilmani 779 droughts in the region as well as different concepts of droughts. Shahid and Behrawan (2008) presented a method for spatial assessment of drought hazard in Bangladesh. Bin et al. (2011) developed the drought hazard map to investigate the spatial characteristics of drought hazard in China. The present study was carried out in the Parambikulam-Aliyar basin spread over drought prone districts of Coimbatore and Tiruppur, Tamil Nadu. The objective of this study is to develop drought vulnerability maps in terms of occurrence of drought severity and spatial extents. MATERIALS AND METHODS Study area and data used
Parambikulam-Aliyar-Palar basin (referred as PAP basin) is located in the south western part of the Peninsular India covering areas in Kerala and Tamil Nadu States (Figure 1). Parambikulam Aliyar River basin is the only basin in Tamil Nadu having west flowing rivers. Bharathapuzha River or Ponnani River and Chalakudi River are the two important major rivers originating in Tamil Nadu State at South Western part of Coimbatore district in the Anamalai hill ranges of Western Ghats. Parambikulam – Aliyar basin is drained by west flowing rivers namely: Valayar, Koduvadiaru, Uppar, Aliyar and Palar (tributaries of Bharathapuzha River) and Parambikulam, Solaiyar and Nirar (tributaries of Chalakudi River). They are grouped into 4 sub basins such as Valaiyar sub basin, Aliyar sub basin, Palar sub basin, and Solaiyar sub basin and spread over an area of 2388.72 km
2. One third of the basin area (822.73 km
2) is
covered with hills and dense forest cover. This basin is bounded in north and east by Cauvery basin, south and west by Kerala State. This basin area lies (except the Ayacut area) within the coordinates of North latitude between 10° 10’ 00” to 10°57’20” and East longitudes 76°43’00” to 77° 12’30”. Parambikulam-Aliyar river basin has an undulating topography with maximum contour elevation in the plain is 300 m and the maximum spot height in the plain is 385 m above MSL. Northern parts of the basin include Thondamuthur, Madukkarai, Sultanpet and Kinathukadavu block; Central parts include Pollachi North, Pollachi South, Anamalai and Udumalaipet block; Southern parts include Valparai and some parts of Anamalai block.
The methodology comprised of the generation of gridded rainfall using spatial interpolation technique, development of mean monthly areal rainfall and gridded rainfall at multiple time scale, calculation of SPI values using mean areal and gridded rainfall, classification of SPI values based on drought categories, development of percentage of occurrence of drought categories map and construction of drought vulnerability maps based on percentage of occurrence of droughts. Spatial interpolation of rainfall Spatial interpolation techniques estimate the value of the surface at locations where no observed data exists, based on the known data values (observations). A number of spatial interpolation methods such as inverse distance weighting (IDW), Splines and kriging are available for spatial analysis of any variables and some researchers have used these techniques for drought studies (Kim et al., 2002; Edossa, et al., 2010; Moradi et al., 2011). In this study, IDW approach which gives more accuracy than Thiessen polygon method (Mishra and Desai, 2005) was used for spatial interpolation of rainfall and drought characteristics over the PAP basin.

780 Sci. Res. Essays
Figure 1. Location of raingauges in the PAP basin.

Table 1. Classification of drought categories.
SPI Values Drought category
0 to - 0.99 D1 Mild drought
-1.00 to - 1.49 D2 Moderate drought
-1.50 to - 1.99 D3 Severe drought
≤ 2.00 D4 Extreme drought
Total area of PAP basin was divided into 97 grids with each grid (5 × 5 km) approximately correspondence to 1.03% of total area (2425 km
2) (Figure 1). The monthly rainfall data of 28 rain gauge
stations located in the PAP basin (Figure 1) for 40 years (1972 to 2011) was collected from the office of Groundwater division, Public Works Department, Coimbatore. Monthly rainfall data was interpolated by ArcGIS 9.3 using IDW method and gridded monthly rainfall was created at 3 and 12 month time scales. Mean monthly areal rainfall of PAP basin was estimated by averaging gridded rainfall. The procedure followed for the calculation of gridded SPI values in this study is known as interpolate-calculate, because first rainfall is spatially interpolated then, the SPI time series are calculated (Loukas and Vasiliasdes, 2004).
Use of the standardized precipitation index (SPI) for drought analysis The standardized precipitation index (SPI) as a drought assessment tool was developed at Colorado State University, U.S. to quantify the rainfall deficit, and has been used to monitor drought conditions (McKee et al., 1993). A drought event occurs at the time when the value of SPI is continuously negative and the event ends when the SPI becomes positive. The SPI may be calculated at multiple timescales (1-, 3-, 6-, 9-, 12-, 24-, 48-months). The use of multiple timescales allows the effects of a rainfall deficit on different water resource components (groundwater, reservoir storage, soil moisture, streamflow) to be assessed. Table 1 provides a drought classification based on SPI. Numerous studies have been conducted to analysis the meteorological droughts using SPI (Hughes and Saunders, 2002; Patel et al., 2007; Edossa et al., 2010; Moradi et al., 2011; Pai et al., 2011). Calculation of standardized precipitation index (SPI)
The SPI for any location is calculated, based on the long-term rainfall record for a desired period. This is performed separately for each month and for each grid in space. The long-term record is fitted to a probability distribution, which is then transformed to a normal distribution so that the mean SPI for the location is zero and standard deviation of unity (McKee et al., 1993). Detail of the SPI algorithm can be found in Guttman (1998, 1999), McKee et al. (1993) and Hayes et al. (1999).
The gamma distribution is defined by its probability density function is
���� = ����� ����� /� for x > 0 (1)
Where α>0 is a shape factor, β>0 is a scale factor, and x>0 is the amount of rainfall. Γ(α) is the gamma function which is defined as
��� = � ���������� (2)
Manikandan and Tamilmani 781 Fitting the distribution to the data requires that α and β be estimated. Edwards and McKee (1997) suggested a method for estimating these parameters using the approximation of Thom (1958) for maximum likelihood as follows:
�� = ����1 + �1+ ��
� (3)
!" = ̅� (4)
Where
$ = ln��̅� − ∑ )*� �+,-./ (5)
for n observations.
The resulting parameters are then used to find the cumulative probability of an observed rainfall event for the given month or any other time scale.
0��� = � ������ = �
��1������ ������ /�1��
� (6)
Substituting t for �/!" reduces the above equation to incomplete
gamma function:
0��� = ����� 2�������2
� (7)
Since the gamma function is undefined for x = 0 and a precipitation distribution may contain zeros, the cumulative probability becomes: 3��� = 4 + �1 − 4�0��� (8)
where q is the probability of zero precipitation. If m is the number of zeros in a rainfall time series, q can be estimated by m/n. In this analysis, a small amount of rainfall was substituted for zero rainfall for each grid. This substitution does not affect the distribution of precipitation.
The cumulative probability, H(x), is then transformed to the standard normal random variable Z with a mean of zero and a variance of one, which is the value of SPI (Edwards and McKee, 1997; Hughes and Saunders, 2002).
For 0<H(x)≤0.5
5 = 678 = −92 − :;<:.=<:>=>�<?.=<?>=><?@=@A (9)
Where
2 = �ln B ��C� ��>D (10)
For 0.5<H(x)<1
5 = 678 = +92 − :;<:.=<:>=>�<?.=<?>=><?@=@A (11)
Where
2 = �ln B ����C� ��>D (12)
c0=2.515517, c1=0.802853, c3=0.010328

782 Sci. Res. Essays
Figure 2. The cumulative areal rainfall for selected drought years and periods in the
PAP basin.
d1=1.432788, d2=0.189269, d3=0.001308 Assessment of occurrence of drought Drought prevalence in the PAP basin was investigated based on the occurrence of drought categories for 3 and 12 month time scales. Monthly SPI values derived from gridded rainfall values for each grid were used to classify the occurrence of drought categories for each month of the year based on the classification of SPI values presented in the Table 1. Occurrence of drought categories were obtained by taking the ratio of number of months affected by drought in each time scale to the total length of data and drought category across the basin (Sonmez et al., 2005). Spatial variation of drought severity (Moderate, severe and extreme drought) was developed in terms of gridded values of percentage of occurrence of drought to identify areas frequently hit by droughts. Drought vulnerability map
Drought vulnerability in the PAP basin have been investigated based on percentage of occurrence of drought events for each drought category using the SPI values in a GIS environment at 3 and 12 month time scales. Drought vulnerability was identified with regard to its spatial extends, frequency (drought occurrence) and severity (drought categories that is, moderate to extreme drought). So drought vulnerability maps fully reflect the multiple characteristics of drought. The spatial extents of drought could be easily described by the application of GIS. The severity of drought depends upon the duration, intensity, and spatial extent of a specific drought episode (Sonamez et al., 2005; Wilhite, 2000). Occurrence of drought can be estimated based on number of drought events occurred over the period of analysis.
Moderate, severe and extreme drought maps of 3 and 12 month time scales are prepared, classified into three classes (Low, moderate and high) using natural breaks method and then integrated separately to prepare the drought vulnerability maps at 3 and 12 month time periods. Each drought category was given a particular weight and each class of the category was given a rating to compute drought vulnerability of the integrated layer. The
weights and ratings used for integration are given in Table 3. Drought vulnerability index (DVI) of integrated layer is calculated as:
DVI = (MDr ×MDw ) + (SDr × SDw ) + (EDr ×EDw) (13)
Where, MDr is the ratings assigned to moderate droughts occurrence classes; MDw is the weight given to moderate drought occurrence theme; SDr is the ratings assigned to severe droughts occurrence classes; SDw is the weight given to severe drought occurrence theme; EDr is the ratings assigned to extreme droughts occurrence classes; and EDw is the weight given to extreme drought occurrence theme. This drought vulnerability index (DVI) integrates the character of drought occurrence and drought severity at multiple time scale.
RESULTS AND DISCUSSION
Analysis of gridded rainfall
Gridded rainfall was computed from the rainfall measured at 28 raingauge station located in the PAP basin. Mean areal rainfall was calculated from the spatially averaged gridded rainfall. The average cumulative areal rainfall during the extreme drought periods is compared to normal cumulative areal rainfall in Figure 2. From the figure it is seen that the PAP basin experienced severe, extreme and persistent droughts during the periods of 1970s and 1980s. During these two periods the monthly and annual precipitation was significantly below normal. Especially, the year 1982 and 1976 are the first and second driest years, respectively (Figure 2). Figure 3 shows the spatial variation of annual rainfall in the PAP basin. The PAP basin has a large geographic variation. More rainfall can be observed in the southern parts of the basin (Solaiyar sub basin). When it comes to the middle

Manikandan and Tamilmani 783
Figure 3. Spatial variation of annual average rainfall in the PAP basin.
(Aliyar and Palar sub basin) and northern parts of the basin (Valaiyar sub basin), the rainfall decreases. Mean annual areal rainfall over the whole PAP basin is about 1410 mm and it is distributed unevenly in space and time. The mean annual precipitation varies from about 511 mm at the northern plain areas to more than 4328 mm at the southern mountain areas. More than 70% of the PAP basin except the mountain areas (Solaiyar sub basin) received less than the normal rainfall. Generally, rainfall is rare from January to May (winter and summer season). Rainfall received at the catchment areas of mountainous region of Solaiyar sub basin is being diverted to drought prone areas of Aliyar and Palar sub basin through a chain of reservoirs and contour canals. The prolonged and
significant decrease on monthly and annual rainfall resulted in irrigation cutbacks, over exploitation of groundwater and significant losses of crop yields. Temporal variation of droughts in the PAP basin The monthly SPI values were computed for each month of the year of study period at 3 and 12 month time scales for each grid in the PAP basin. The regional representative of SPI calculated from mean areal rainfall for the PAP basin for the time series of 3- and 12-month SPI (Figure 4a to c) showed that the region experienced frequent moderate, severe and extreme droughts (that is,

784 Sci. Res. Essays
Figure 4. Temporal variation of SPI values for a) 3 month b) 12 month time scale.
SPI<−1) over the period of study. Visual inspection of 3 and 12 month SPI time series indicated that droughts were quite frequent during the 1970s, 1980s and 2000s. Another notable point observed from the figure that as the time scale increases, drought frequency decreases but its duration increases. At shorter time scales (SPI_3), drought becomes more frequent but ends for shorter periods. On longer time scales (SPI_12), drought becomes less frequent but lasts longer. The most intense quantity i.e. minimum negative of SPI values derived from the regional representative of SPI values (worst drought month) was occurred in July 1976 and September 1976 at 3 month SPI (SPI_3=−2.96) and 12 month SPI (SPI_12=−2.40) respectively.
Occurrence of drought categories in the PAP basin for 3 and 12 month time scales is presented in Table 2. The results show that mild droughts occur most frequently
and extreme droughts occur least frequently. Monthly distribution of occurrence of drought categories at 3-month time scale showed that the negative SPI values occur most frequently during September and October followed by February, July and November (Table 2). At 12-month time scales the highest percentage of occurrence of drought was observed in the month of May followed by January, February, March, August and December. Spatial variation of drought categories Spatial variation of drought characteristics derived from gridded SPI series was developed using ArcGIS 9.3 with the help of IDW method. The spatial analysis was performed for evaluating the most affected areas based

Manikandan and Tamilmani 785 Table 2. Monthly distribution of occurrence of drought categories (%).
Category /Month SPI_3 SPI_12
D1 D2 D3 D4 Total D1 D2 D3 D4 Total
January 2.78 0.85 0.43 0.21 4.27 3.42 0.85 0.21 0.21 4.70
February 3.42 0.21 0.64 0.21 4.49 3.42 0.85 0.21 0.21 4.70
March 1.71 1.07 0.64 0.00 3.42 3.63 0.64 0.21 0.21 4.70
April 2.56 0.43 0.43 0.21 3.63 3.42 0.43 0.21 0.21 4.27
May 2.78 1.07 0.00 0.21 4.06 3.63 0.85 0.43 0.00 4.91
June 2.56 0.85 0.43 0.21 4.06 2.99 0.85 0.21 0.21 4.27
July 2.99 1.07 0.21 0.21 4.49 2.78 1.28 0.43 0.00 4.49
August 2.56 0.64 0.43 0.21 3.85 3.63 0.43 0.43 0.21 4.70
September 3.63 0.85 0.21 0.00 4.70 2.99 0.85 0.21 0.21 4.27
October 3.63 0.85 0.21 0.00 4.70 3.42 0.64 0.00 0.43 4.49
November 3.21 0.64 0.64 0.00 4.49 2.78 1.07 0.21 0.21 4.27
December 1.92 1.07 0.00 0.43 3.42 3.42 0.85 0.21 0.21 4.70
Total 33.76 9.62 4.27 1.92 49.57 39.53 9.62 2.99 2.35 54.49
Table 3. Weights and ratings assigned to occurrence of drought categories and classification and area covered of
drought vulnerability index.
Occurrence of drought categories (%) DVI
Area covered
(%) Class Ratings
Moderate drought
Weight = 1
Severe drought
Weight = 2
Extreme drought
Weight = 3
SPI_3
Low 1 6.20 - 8.90 2.35 - 4.15 0.43 - 2.1 6 - 10 28.67
Moderate 2 8.90 - 10.11 4.15 - 4.93 2.10 - 2.61 10 - 12 30.06
High 3 10.11 - 15.81 4.93 - 5.98 2.61 - 4.70 12 - 17 41.27
SPI_12
Low 1 3.21 - 8.90 0.64 - 3.92 0 - 1.55 6 - 10 61.46
Moderate 2 8.90 - 11.54 3.92 - 5.25 1.55 - 3.64 10 - 13 31.17
High 3 11.54 - 20.51 5.25 - 7.69 3.64 - 7.48 13 - 16 7.37
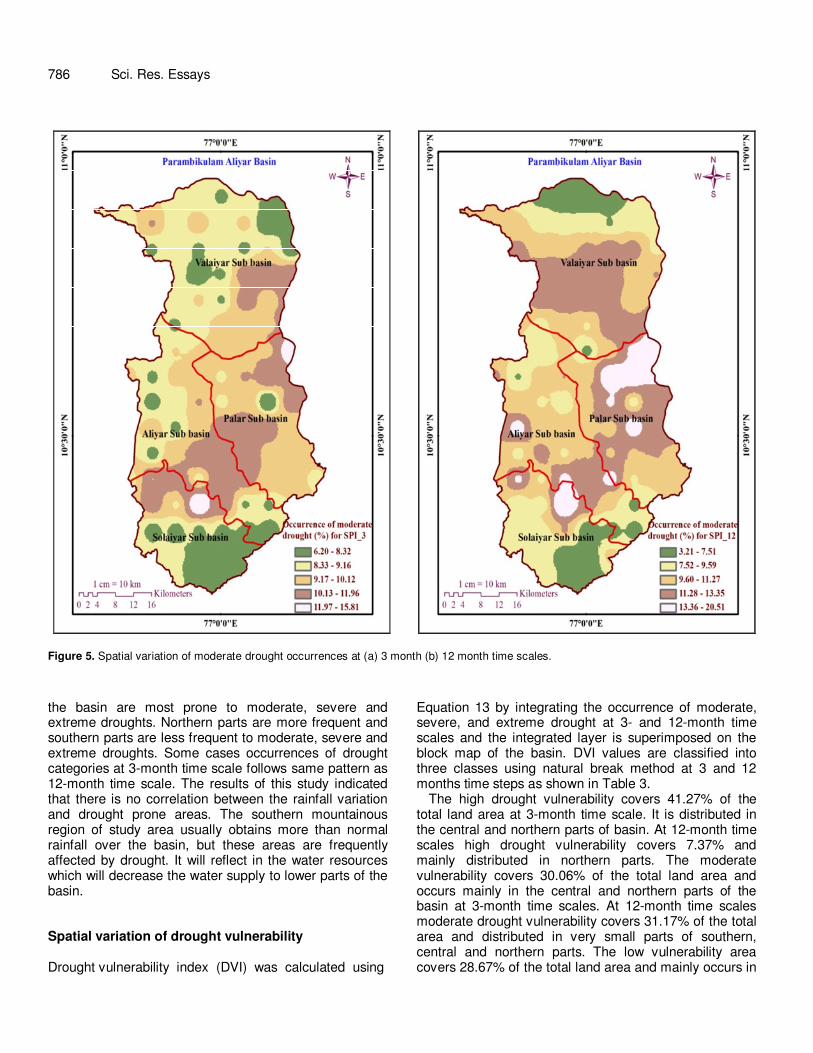
on drought severity and frequency. Spatial variation of percentage of occurrence of drought categories for 3- and 12-month SPI time scales is shown in Figures 5 to 7. From the figure it can be seen that the percentage of occurrence of drought events of a drought severity varies with space and time. The spatial variation of moderate drought occurrences indicates that they tend to occur with highest frequencies in central and north eastern parts at 3-month time scale, while the southern parts are experienced with the lowest frequencies at the same time scale (Figure 5a). The central and eastern parts of the basin are found to be most prone for moderate drought at 12 months time scale (Figure 5b). The northern and southern parts are found less prone for moderate drought. Spatial variation of occurrence of severe drought is presented in Figure 6a and b. At 3-month time scale severe drought occurs more frequently in the central and
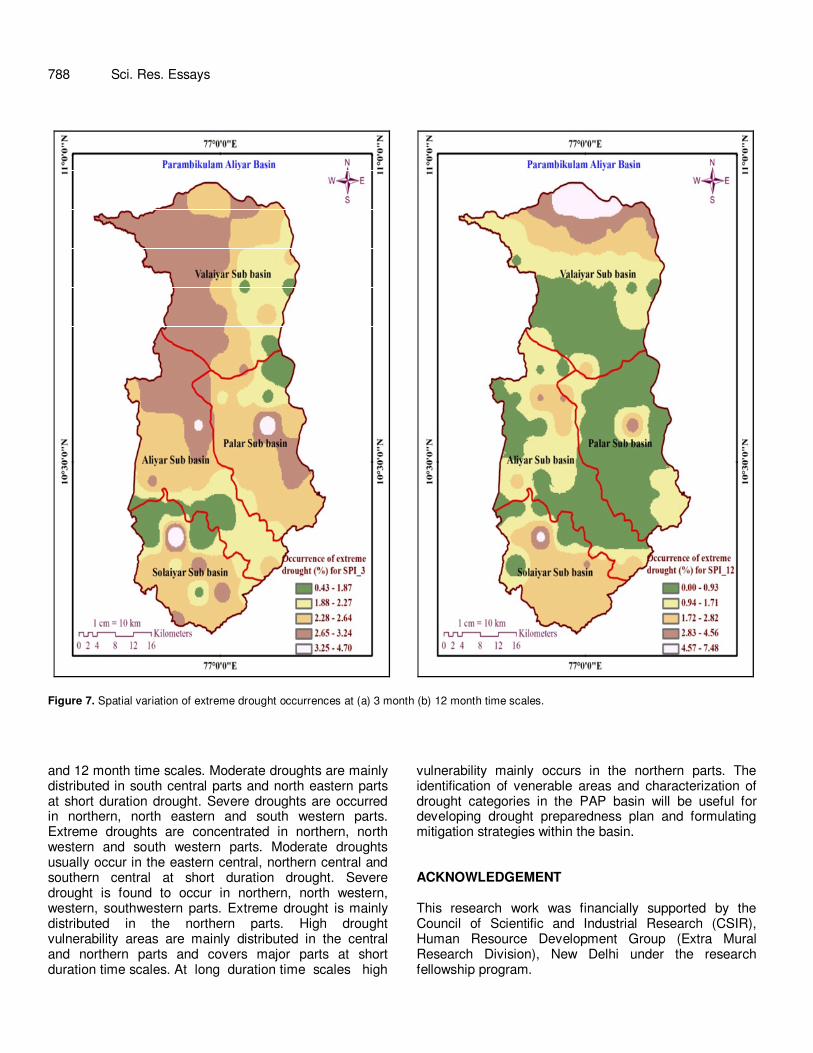
northern parts of the basin. Occurrence of severe drought increases toward northern parts of basin at 12-month time scale. Southern parts of basin are less frequent to severe drought for both time scales. Spatial variation of occurrence of extreme drought is shown in Figure 7a and b. At 3-month time step, extreme droughts occurred more frequently and covered most parts of the basin. Especially northern and north eastern parts experienced extreme drought with maximum frequency. Only very small parts of the basin are less prone to extreme drought. As the time scale increases to 12 months, extreme drought is found to occur more frequent in the northern parts of the basin. Southern parts are less frequent to drought than northern parts. The central part of the area is found less prone for 12 months extreme droughts.
The analysis of drought occurrences at different categories and time-steps indicates that central parts of
786 Sci. Res. Essays
Figure 5. Spatial variation of moderate drought occurrences at (a) 3 month (b) 12 month time scales.
the basin are most prone to moderate, severe and extreme droughts. Northern parts are more frequent and southern parts are less frequent to moderate, severe and extreme droughts. Some cases occurrences of drought categories at 3-month time scale follows same pattern as 12-month time scale. The results of this study indicated that there is no correlation between the rainfall variation and drought prone areas. The southern mountainous region of study area usually obtains more than normal rainfall over the basin, but these areas are frequently affected by drought. It will reflect in the water resources which will decrease the water supply to lower parts of the basin. Spatial variation of drought vulnerability Drought vulnerability index (DVI) was calculated using
Equation 13 by integrating the occurrence of moderate, severe, and extreme drought at 3- and 12-month time scales and the integrated layer is superimposed on the block map of the basin. DVI values are classified into three classes using natural break method at 3 and 12 months time steps as shown in Table 3.
The high drought vulnerability covers 41.27% of the total land area at 3-month time scale. It is distributed in the central and northern parts of basin. At 12-month time scales high drought vulnerability covers 7.37% and mainly distributed in northern parts. The moderate vulnerability covers 30.06% of the total land area and occurs mainly in the central and northern parts of the basin at 3-month time scales. At 12-month time scales moderate drought vulnerability covers 31.17% of the total area and distributed in very small parts of southern, central and northern parts. The low vulnerability area covers 28.67% of the total land area and mainly occurs in

Manikandan and Tamilmani 787
Figure 6. Spatial variation of severe drought occurrences at (a) 3 month (b) 12 month time scales.
the southern and some parts of eastern areas at 3-month time scales. As the time scale increases to 12-month, low drought vulnerability is the largest class and covers 61.46% and mainly distributed in the central and southern parts. Finally drought vulnerability map showed that the high and moderate vulnerability areas are mainly in the northern part of basin, while the areas with low vulnerability to drought are mainly concentrated in the southern parts of the basin (Figure 8). The increase in drought vulnerability may result from an increased frequency and severity of meteorological drought, which then may lead to increased societal vulnerability to drought. The results reached in this study can be an essential step toward addressing the issue to drought vulnerability in the basin and can guide for drought
management strategies for mitigation purposes. Conclusions In this study meteorological drought vulnerability in the PAP basin was assessed by analyzing historical occurrences of drought categories at varying time scales by applying SPI method. Drought vulnerability index were computed by incorporating the drought severity maps prepared at different severity levels in terms of occurrences of droughts for identifying areas most frequently hit by drought events in the basin. The spatial variation of moderate, severe and extreme drought occurrences have been identified for the PAP basin at 3
788 Sci. Res. Essays
Figure 7. Spatial variation of extreme drought occurrences at (a) 3 month (b) 12 month time scales.
and 12 month time scales. Moderate droughts are mainly distributed in south central parts and north eastern parts at short duration drought. Severe droughts are occurred in northern, north eastern and south western parts. Extreme droughts are concentrated in northern, north western and south western parts. Moderate droughts usually occur in the eastern central, northern central and southern central at short duration drought. Severe drought is found to occur in northern, north western, western, southwestern parts. Extreme drought is mainly distributed in the northern parts. High drought vulnerability areas are mainly distributed in the central and northern parts and covers major parts at short duration time scales. At long duration time scales high
vulnerability mainly occurs in the northern parts. The identification of venerable areas and characterization of drought categories in the PAP basin will be useful for developing drought preparedness plan and formulating mitigation strategies within the basin. ACKNOWLEDGEMENT This research work was financially supported by the Council of Scientific and Industrial Research (CSIR), Human Resource Development Group (Extra Mural Research Division), New Delhi under the research fellowship program.

Manikandan and Tamilmani 789
Figure 8. Drought vulnerability maps at (a) 3 month and (b) 12 month time scales.
REFERENCES Bin H, Aifeng L, Jianjun W, Lin Z, Ming L (2011). Drought hazard
assessment and spatial characteristics analysis in China. J. Geogr. Sci. 21(2):235-249.
Edossa DC, Babel MS, Gupta AD (2010). Drought analysis in the Awash River Basin, Ethiopia. Water Resour. Manage. 24:1441-1460.
Edwards DC, McKee TB (1997). Characteristics of 20th century drought in the United States at multiple timescales. Colorado State University: Fort Collins. Climatol. Report No. 97-2.
Gupta AK, Tyagi P, Sehgal VK (2011). Drought disaster challenges and mitigation in India: Strategic appraisal. Curr. Sci. 100(12):1795-1806.
Guttman NB (1998). Comparing the Palmer drought severity index and the standardised precipitation index. J. Am. Water Res. Assoc. 34:113-121.
Guttman NB (1999). Accepting the standardized precipitation index: a calculation algorithm. J. Am. Water Resour. Assoc. 35(2):311-322.
Hayes MJ, Svoboda MD, Wilhite DA, Vanyarkho OV (1999). Monitoring the 1996 drought using the standardized precipitation index. Bull. Am. Meteorol. Soc. 80:429-438.
Heim Jr RR (2002). A Review of twentieth-century drought indices used in the United States. Bull. Am. Meteor. Soc. 83(8):1149-1165.
Hughes BL, Saunders MA (2002). A drought climatology for Europe. Int. J. Climatol. 22:1571-1592.
Keyantash J, Dracup JA (2002). The quantification of drought: An evaluation of drought indices. Bull. Am. Meteorol. Soc. 83(8):1167-1180.
Kim T, Valdes JB, Aparicio J (2002). Frequency and spatial characteristics of droughts in the Conchos River Basin, Mexico. Water Int. 27(3):420-430.
Loukas A, Vasiliades L (2004) Probabilistic analysis of drought spatiotemporal characteristics in Thessaly region, Greece. Nat. Hazards Earth Syst. Sci. 4:719–731.
McKee TB, Doesken NJ, Kliest J (1993). The relationship of drought frequency and duration to time scales. Proceedings of the 8th Conference on Applied Climatology, 17–22 January, Anaheim, CA. American Meteorological Society, Boston, MA, USA, pp. 179-184.
Mishra AK, Desai VR (2005). Spatial and temporal drought analysis in the Kansabati river basin, India. Intl. J. River Basin Manage. 3(1):31-41.

790 Sci. Res. Essays Mishra AK, Singh VP (2010). A review of drought concepts. J. Hydrol.
391:202-216. Moradi HR, Rajabi M, Faragzadeh M (2011). Investigation of
meteorological drought characteristics in Fars province, Iran. Catena. 84:35-46.
Morid S, Smakhtin V, Moghaddasi M (2006). Comparison of seven meteorological indices for drought monitoring in Iran. Int. J. Climatol. 26(7):971-985.
Pai DS, Sridhar L, Guhathakurta P, Hatwar HR (2011). District-wide drought climatology of the southwest monsoon season over India based on standardized precipitation index (SPI). Nat. Hazards 59:1797-1813.
Patel NR, Chopra P, Dadhwal VK (2007). Analyzing spatial patterns of meteorological drought using standardized precipitation index. Meteorol. Appl. 14(4):329-336.
Shahid S, Behrawan H (2008). Drought risk assessment in the western
part of Bangladesh. Nat. Hazards 46:391-413. Smakhtin VU, Hughes DA (2004). Review, automated estimation and
analysis of drought indices in South Asia. Working Paper 83. International Water Management Institute, Sri Lanka.
Sonmez FK, Komuscu AU, Erkan A, Turgu E (2005). An analysis of spatial and temporal dimension of drought vulnerability in Turkey using the Standardized Precipitation Index. Nat. Hazards 35:243-264.
Thom HCS (1958). A note on the gamma distribution. Monthly Weather Rev. 86:117-122.
Wilhite DA (2000). Drought as a natural hazard: Concepts and definitions, in Drought: A Global Assessment. Edited by Wilhite DA. Routledge, pp. 3-18.