Embed Size (px)
Citation preview

Separation Processes Laboratory PCCC-3
Development of cyclic adsorption process for CODevelopment of cyclic adsorption process for CO2
capture: Process modeling and optimization
Marx D., Joss L., Hefti M., Gazzani M., Mazzotti M.Institute of Process Engineering, ETH Zurich

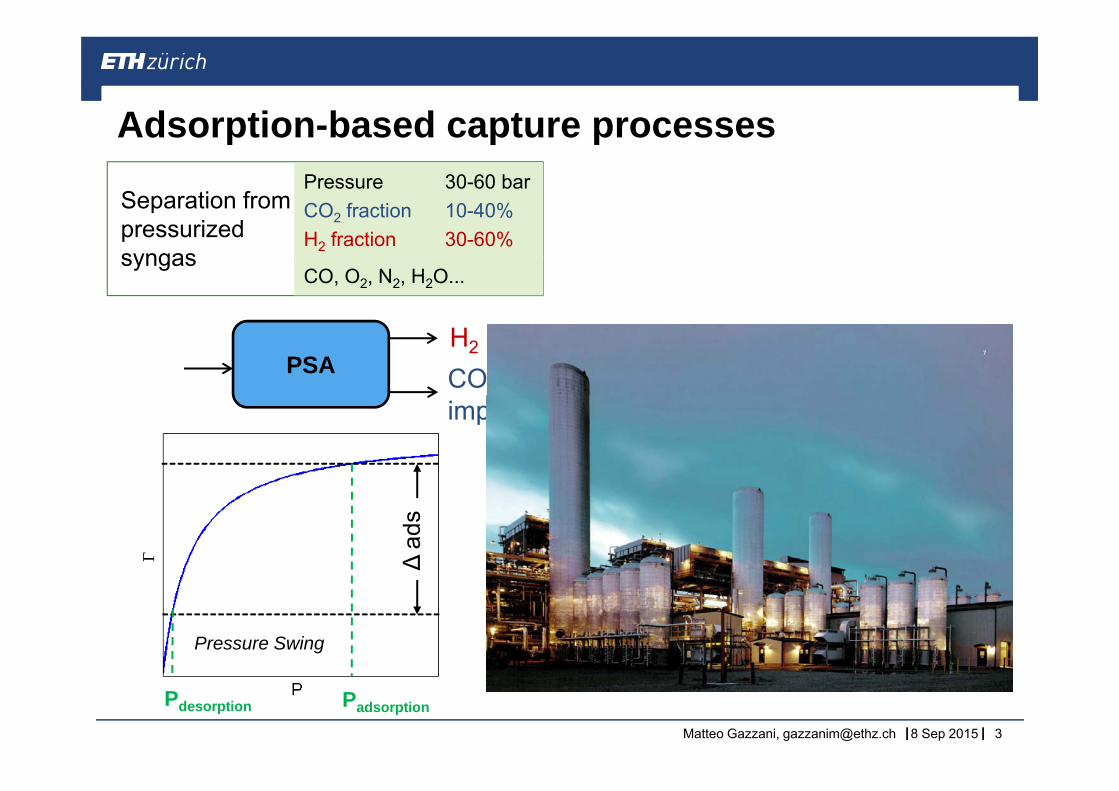
Adsorption-based capture processesAdsorption-based capture processesPressure 30-60 barCO2 fraction 10-40%Separation from CO2 fraction 10 40%H2 fraction 30-60%
CO, O2, N2, H2O...
pressurized syngas
Adsorption-based separation:
• Very high purity of the less retained
PSAH2
CO2 +
y g p ycomponent
• Very low energy requirement• Non-volatility of the sorbent
impurities∆
ads
Pressure Swing
|| || || 8 Sep 2015Matteo Gazzani, [email protected] 2
Pdesorption Padsorption
Adsorption-based capture processesAdsorption-based capture processesPressure 30-60 barCO2 fraction 10-40%Separation from CO2 fraction 10 40%H2 fraction 30-60%
CO, O2, N2, H2O...
pressurized syngas
PSAH2
CO2 +impurities
∆ad
s
Pressure Swing
|| || || 8 Sep 2015Matteo Gazzani, [email protected] 3
Pdesorption Padsorption

Adsorption-based capture processesAdsorption-based capture processesPressure 30-60 barCO2 fraction 10-40%Separation from
Pressure 1 barCO2 fraction 6-15%Post combustionCO2 fraction 10 40%
H2 fraction 30-60%
CO, O2, N2, H2O...
pressurized syngas
CO2 fraction 6 15%N2 fraction 85-94%
Post-combustioncapture
H2O ,O2,...
PSAH2
CO2 +TSA
CO2
N2
impuritiesCO2
Sw
ing
∆ad
s
∆ad
sTadsorption
Tem
per.
S
Pressure Swing Tdesorption
|| || || 8 Sep 2015Matteo Gazzani, [email protected] 4
Pdesorption Padsorption Pprocess

Adsorption-based capture processesAdsorption-based capture processes
Q
Hot fluegasCO2, N2, O2, H2O120-180°C Cold fluegas
TSADrying
Qrec
N2to atmosphere TSA
H2OCO2to storage
to atmosphere
Filippi et al. U.S. Patent 7 153 344 (2002)to storage
Motivation:• Heat recovery from low grade heat sources and no need of compression y g p
energy make temperature-based swing adsorption attractive for CO2 post-combustion capture.
• Gentle separation typical of adsorption process is complemented by low
|| || || 8 Sep 2015Matteo Gazzani, [email protected] 5
primary energy demand.
Talk o tline
Process design &
Talk outline
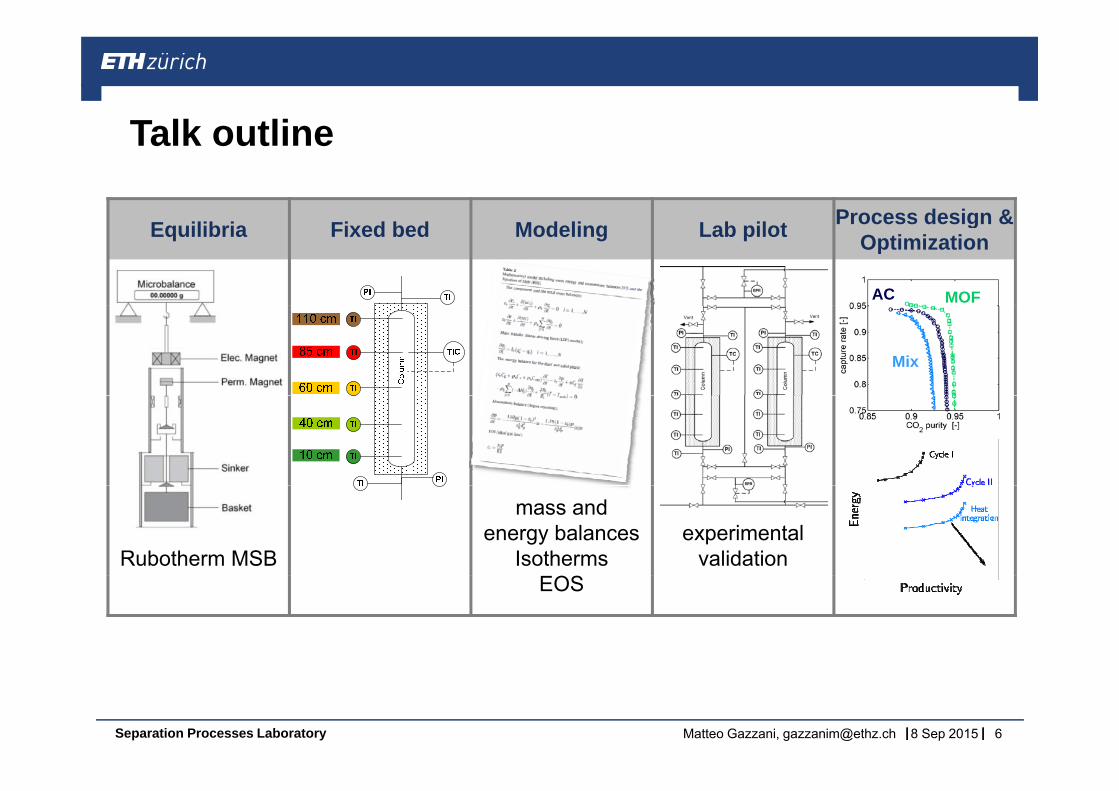
Equilibria Fixed bed Modeling Lab pilot Process design & Optimization
AC MOF
Mix
Rubotherm MSB
mass and energy balances
Isothermsexperimental
validationEOS
|| || ||Separation Processes Laboratory 8 Sep 2015Matteo Gazzani, [email protected] 6
Talk o tline
ModelingCharacterization Validation Process design Improvements
Talk outline
Process design &
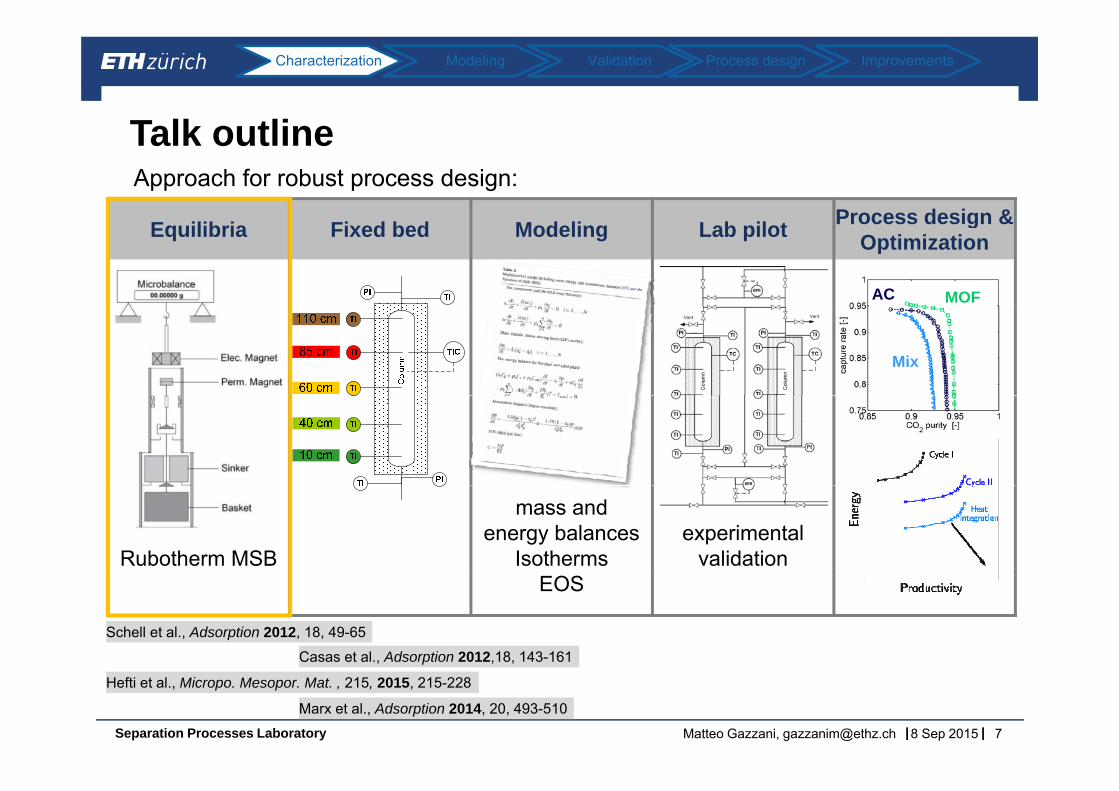
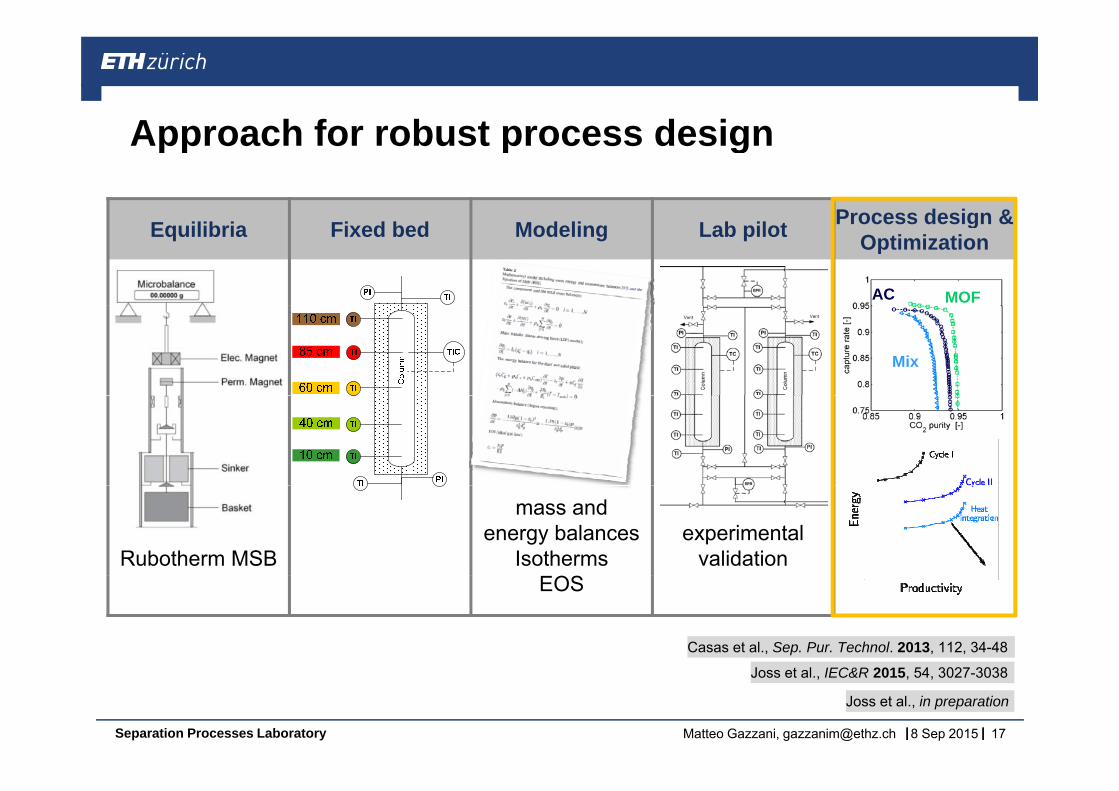
Approach for robust process design:
Equilibria Fixed bed Modeling Lab pilot Process design & Optimization
AC MOF
Mix
Rubotherm MSB
mass and energy balances
Isothermsexperimental
validationEOS
Casas et al., Adsorption 2012,18, 143-161
Schell et al., Adsorption 2012, 18, 49-65
|| || ||Separation Processes Laboratory 8 Sep 2015Matteo Gazzani, [email protected] 7
Marx et al., Adsorption 2014, 20, 493-510
Hefti et al., Micropo. Mesopor. Mat. , 215, 2015, 215-228
Material characteri ation and selection
ModelingCharacterization Validation Process design Improvements
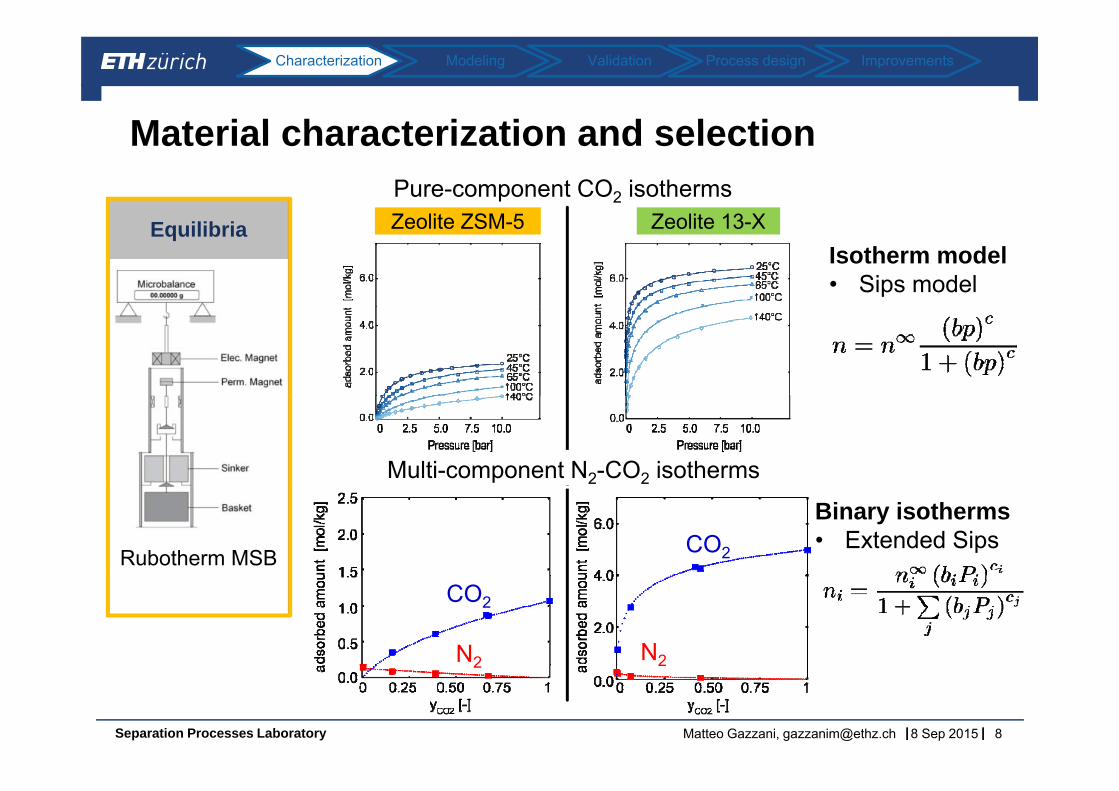
Material characterization and selectionPure-component CO2 isotherms Z lit ZSM 5 Z lit 13 XEquilibria Zeolite ZSM-5 Zeolite 13-X
Isotherm model• Sips model
Multi-component N2-CO2 isotherms
Rubotherm MSB CO2
Binary isotherms• Extended Sips
CO2
N2N2
|| || ||Separation Processes Laboratory 8 Sep 2015Matteo Gazzani, [email protected] 8
22

Approach for rob st process design
ModelingCharacterization Validation Process design Improvements
Approach for robust process design
Process design &Equilibria Fixed bed Modeling Lab pilot Process design & Optimization
AC MOF
Mix
Rubotherm MSB
mass and energy balances
Isothermsexperimental
validationEOS
Schell et al., IEC&R 2013, 52, 8311-8322
M t l IEC&R 2015 54 6035 6045
|| || ||Separation Processes Laboratory 8 Sep 2015Matteo Gazzani, [email protected] 9
Marx et al., in preparation
Marx et al., IEC&R 2015, 54, 6035-6045

Modeling: equations
ModelingCharacterization Validation Process design Improvements
Modeling: equations
1. Mass balances species i voids icu P T
t b b L( ) 0i i i ic n uc yD c
t t z z z
adsorbent (1 ) i
in sTwT
Accumulation Convection
pi
i i in k a n nt
3. Constitutive equationsLinear driving force
Dispersion
1. Non linear adsorption isotherm:
2. Energy balances
wL i b
2T h R T T h R T T
*i( , , )
iin n p T y
2. Equation of State: ideal gas L i w w o w amb
w w
h R T T h R T Tt C a
Acc Exchange column - wall
Exchange wall - outside
3. Pressure: Ergun equation
Lt g b s b ads t g b w b L
1 i
2( ) 0n
jj
j
n hT p T TC C C uC H T T Kt t z t R z z
|| || || 8 Sep 2015Matteo Gazzani, [email protected] 10
Heat of adsorptionAccumulation Convection Exchange column - wall
Conductivity

Modeling: equations
ModelingCharacterization Validation Process design Improvements
Modeling: equations
1. Mass balances species i voids icu P T
t b b L( ) 0i i i ic n uc yD c
t t z z z
adsorbent (1 ) i
in sTwT
pi
i i in k a n nt
3. Constitutive equationsLinear driving force
1. Non linear adsorption isotherm:
2. Energy balances
wL i b
2T h R T T h R T T
*i( , , )
iin n p T y
Mass transfer CO2 kCO2= 0.1 s-1
M t f N k 0 5 L i w w o w ambw w
h R T T h R T Tt C a Mass transfer N2 kN2= 0.5
Internal heat transfer hL= 33 WInternal heat transfer, static hL
0= 22External heat transfer, hW= 220
Lt g b s b ads t g b w b L
1 i
2( ) 0n
jj
j
n hT p T TC C C uC H T T Kt t z t R z z
te a eat t a s e , W 0
|| || || 8 Sep 2015Matteo Gazzani, [email protected] 11
Modeling: validation
ModelingCharacterization Validation Process design Improvements
Modeling: validation
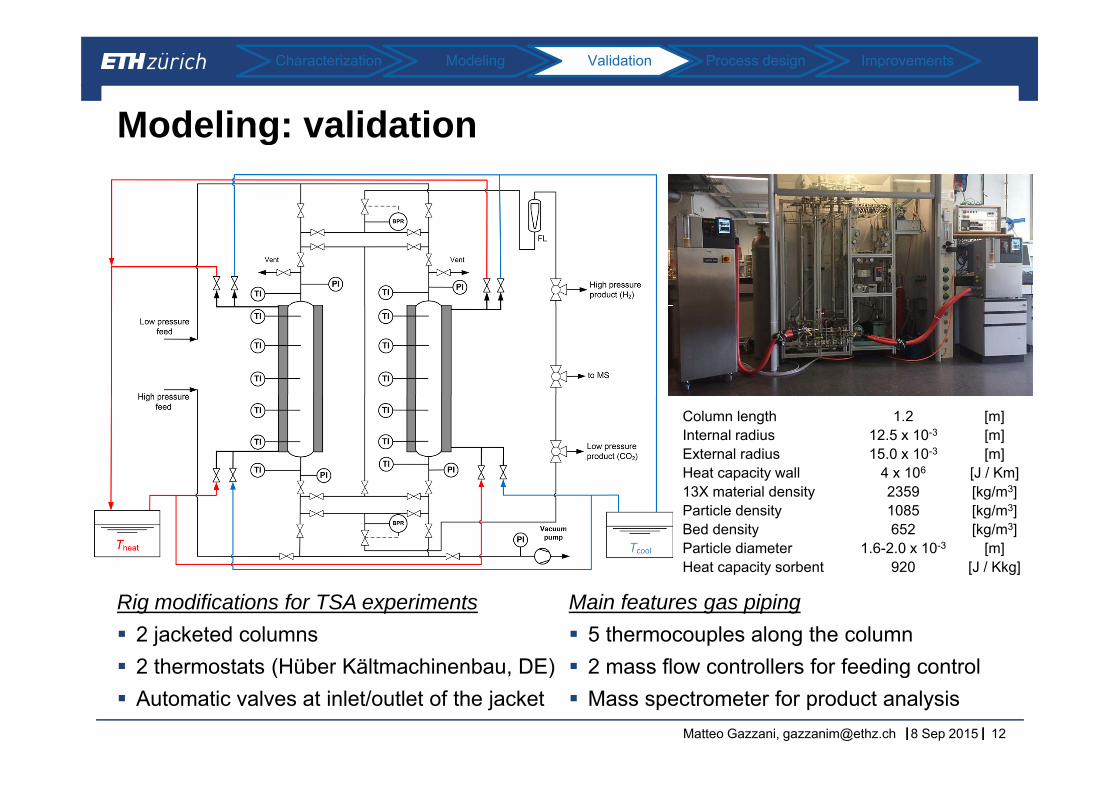
Column length 1.2 [m]Internal radius 12.5 x 10⁻³ [m]External radius 15.0 x 10⁻³ [m]Heat capacity wall 4 x 10⁶ [J / Km]
313X material density 2359 [kg/m3]Particle density 1085 [kg/m3]Bed density 652 [kg/m3]Particle diameter 1.6-2.0 x 10⁻³ [m]Heat capacity sorbent 920 [J / Kkg]
Rig modifications for TSA experiments 2 jacketed columns 2 thermostats (Hüber Kältmachinenbau DE)
Main features gas piping 5 thermocouples along the column 2 mass flow controllers for feeding control
|| || ||
2 thermostats (Hüber Kältmachinenbau, DE) Automatic valves at inlet/outlet of the jacket
2 mass flow controllers for feeding control Mass spectrometer for product analysis
8 Sep 2015Matteo Gazzani, [email protected] 12
Modeling: validation
ModelingCharacterization Validation Process design Improvements
Modeling: validation
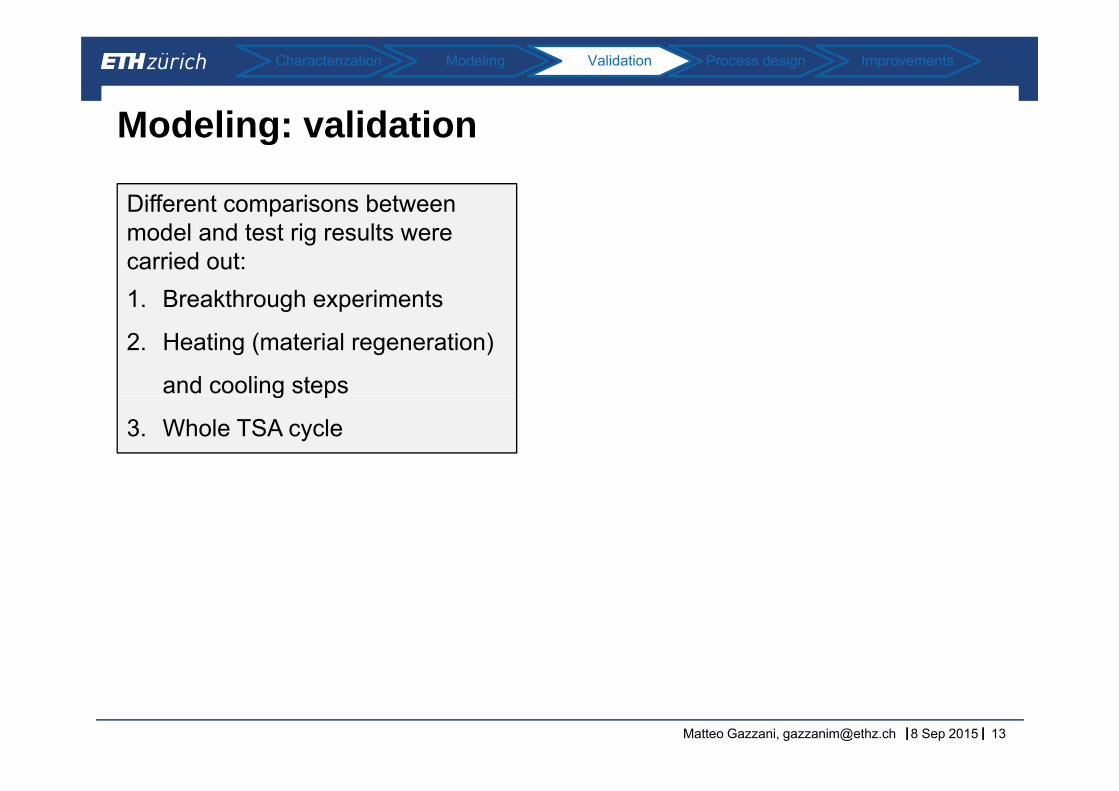
Different comparisons between pmodel and test rig results were carried out:1. Breakthrough experiments1. Breakthrough experiments
2. Heating (material regeneration)
and cooling stepsg p
3. Whole TSA cycle
|| || || 8 Sep 2015Matteo Gazzani, [email protected] 13

Modeling: validation
ModelingCharacterization Validation Process design Improvements
Modeling: validation
Different comparisons between pmodel and test rig results were carried out:1. Breakthrough experiments1. Breakthrough experiments
2. Heating (material regeneration)
and cooling stepsg p
3. Whole TSA cycle
|| || || 8 Sep 2015Matteo Gazzani, [email protected] 14

Modeling: validation
ModelingCharacterization Validation Process design Improvements
Modeling: validation
Different comparisons between pmodel and test rig results were carried out:1. Breakthrough experiments1. Breakthrough experiments
2. Heating (material regeneration)
and cooling stepsg p
3. Whole TSA cycleWaste Simplest TSA cycle for CO2 extraction: (N2) 3‐steps
1. Feeding and adsorption of CO2
CO2Dryfeed
t ime
2. Heating for material regeneration3. Cooling for column preparationFeed:
|| || || 8 Sep 2015Matteo Gazzani, [email protected] 15
Heating CoolingAdsorptionFeed:CO2‐N2 binary (12%‐88%), fixed flow ratetads theat tcool
Modeling: validation
ModelingCharacterization Validation Process design Improvements
Modeling: validation
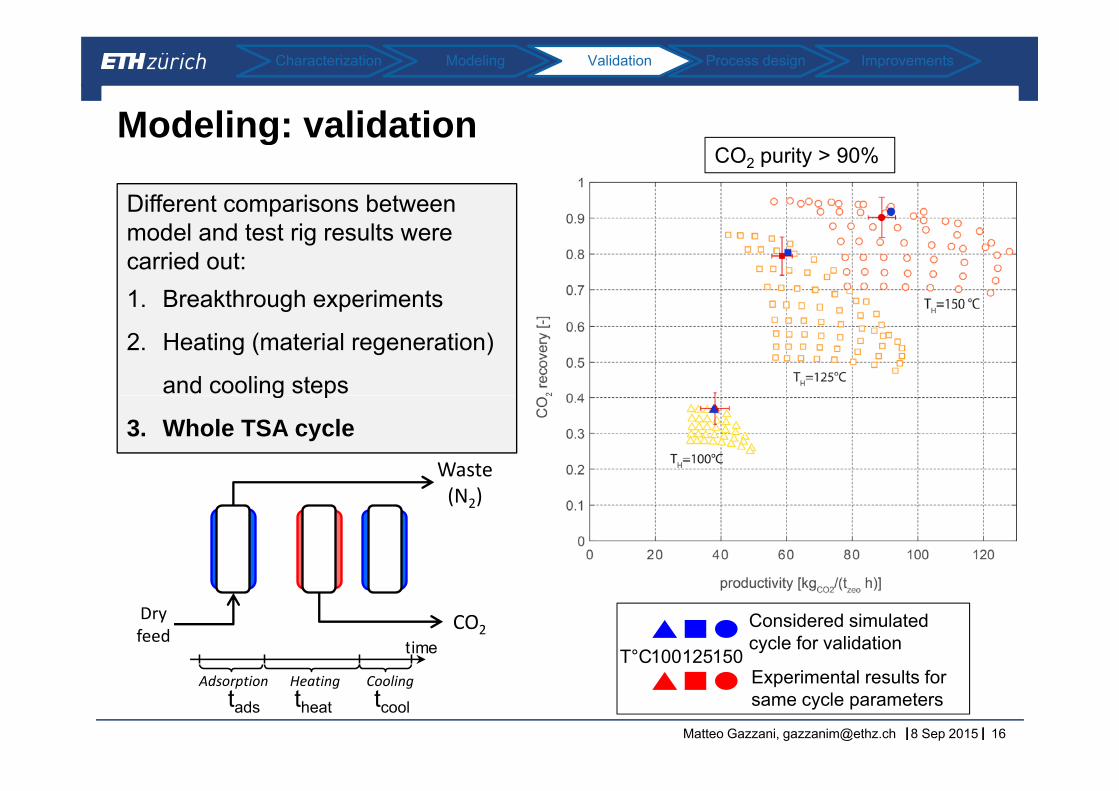
Different comparisons between
CO2 purity > 90%
pmodel and test rig results were carried out:1. Breakthrough experiments1. Breakthrough experiments
2. Heating (material regeneration)
and cooling stepsg p
3. Whole TSA cycleWaste (N2)
Considered simulated cycle for validation
100125150T°C
CO2Dryfeed
t ime
|| || || 8 Sep 2015Matteo Gazzani, [email protected] 16
Experimental results for same cycle parameters
Heating CoolingAdsorptiontads theat tcool
Approach for rob st process designApproach for robust process design
Process design &Equilibria Fixed bed Modeling Lab pilot Process design & Optimization
AC MOF
Mix
Rubotherm MSB
mass and energy balances
Isothermsexperimental
validationEOS
Casas et al., Sep. Pur. Technol. 2013, 112, 34-48
|| || ||Separation Processes Laboratory 8 Sep 2015Matteo Gazzani, [email protected] 17
Joss et al., in preparation
Joss et al., IEC&R 2015, 54, 3027-3038

Process synthesis: boundary conditions
ModelingCharacterization Validation Process design Improvements
Process synthesis: boundary conditions
GasHot fluegasCO N O H O
Boiler
Gas cleaning(Dust,
SOx and
CO2, N2, O2, H2O120-180°C
Cold fluegasSOx and Nox)
Conventional power plant or Drying
Qrec
Cold fluegas
N2p pcombustion process TSA
Drying
H2OCO2
2to atmosphere
Compression and storage
Assumptions:• Binary CO2+N2 (12%-88%) mixture entering
the capture section*
|| || || 8 Sep 2015Matteo Gazzani, [email protected] 18
• Energy for drying: 8 MJth/kgH2O*
* Perry’s Chemical Engineers’ Handbook

Process synthesis: boundary conditions
ModelingCharacterization Validation Process design Improvements
Process synthesis: boundary conditions
GasHot fluegasCO N O H O
Boiler
Gas cleaning(Dust,
SOx and
CO2, N2, O2, H2O120-180°C
Cold fluegasSOx and NOx
Conventional power plant or Drying
Qrec
Cold fluegas
N2p pcombustion process
Drying
H2OCO2
2to atmosphere TSA
Compression and storage
Assumptions:• Binary CO2+N2 (12%-88%) mixture entering
the capture section*
|| || || 8 Sep 2015Matteo Gazzani, [email protected] 19
• Energy for drying: 8 MJth/kgH2O*
* Perry’s Chemical Engineers’ Handbook

Process synthesis: cycle design
ModelingCharacterization Validation Process design Improvements
Process synthesis: cycle design
Cycle AWaste (N2)(N2)
CO2Dryfeed
Heating CoolingAdsorption
t ime
• 3-steps cycle• CO2 is produced as the bed
heated up• Simplest configurationSimplest configuration• Lowest number of variables
|| || || 8 Sep 2015Matteo Gazzani, [email protected] 20

Process synthesis: cycle design
ModelingCharacterization Validation Process design Improvements
Process synthesis: cycle design
Cycle A Cycle BWaste (N2)(N2)
CO2Dryfeed
Adsorption Heating Cooling
t ime
Rinse Purge
• 5 steps cycle• CO2 is produced as the bed
heated up• CO rich recycle enhances purity• CO2 rich recycle enhances purity
and productivity• Make use of recycled N2 to push
CO2 out
|| || || 8 Sep 2015Matteo Gazzani, [email protected] 21
• Increased number of variables
Process synthesis: cycle design
ModelingCharacterization Validation Process design Improvements
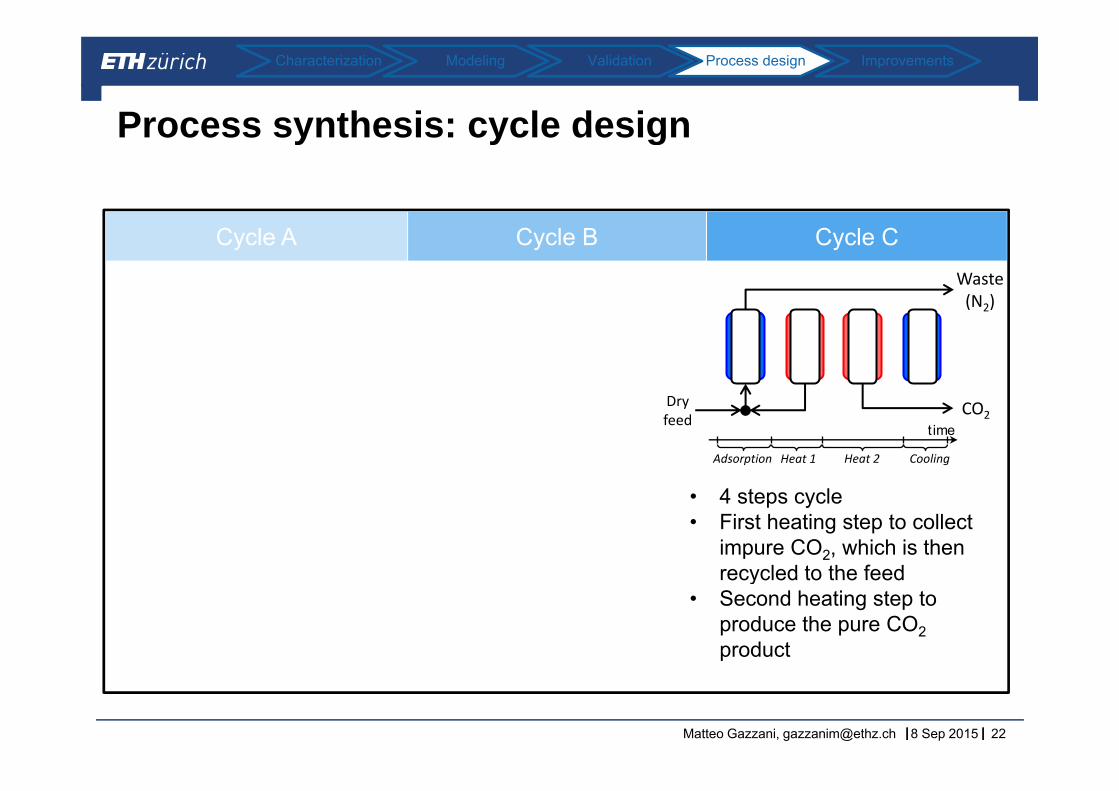
Process synthesis: cycle design
Cycle A Cycle B Cycle CWaste (N2)(N2)
CO2Dryfeed
Heat 2 CoolingAdsorption
t ime
Heat 1
• 4 steps cycle• First heating step to collect
impure CO2, which is then recycled to the feedrecycled to the feed
• Second heating step to produce the pure CO2product
|| || || 8 Sep 2015Matteo Gazzani, [email protected] 22

Process synthesis: heuristic comparison
ModelingCharacterization Validation Process design Improvements
Process synthesis: heuristic comparison
Cycle A Cycle B Cycle CWaste (N2)
Waste (N2)
Waste (N2)
CO2DryfeedCO2
Dryfeed
CO2Dryfeed
t ime feed
Heat 2 CoolingAdsorption
t ime
Heat 1
feed
Adsorption Heating Cooling
t ime
Rinse PurgeHeating CoolingAdsorption
t ime
• Lowest separation f
Rinse-purge combination: Dedicate heating time for performance • Purity and recovery
enhancement Additional step is fast:
I d ifi
evacuation:• Best purity among A, B and
CI d• Improved specific
productivity Compared to Cycle A, we should obtain an
• Improved recovery compared to A
Additional step is slow:• Reduced productivity and
|| || || 8 Sep 2015Matteo Gazzani, [email protected] 23
should obtain an improvement in all indexes
• Reduced productivity and higher energy consumption

Process synthesis: separation performance
ModelingCharacterization Validation Process design Improvements
Process synthesis: separation performance
Recovery-Purity pareto curves can be established by varying the cycle timesy
|| || || 8 Sep 2015Matteo Gazzani, [email protected] 24

Process synthesis: separation performance
ModelingCharacterization Validation Process design Improvements
Process synthesis: separation performance
theat tcool
Recovery-Purity pareto curves can be established by varying the cycle timesheat cool
Cycle A: 3-steps cycle:tads, theat and tcool
y
Waste (N2)
tads CO2Dryfeed
Heating CoolingAdsorption
t ime
|| || || 8 Sep 2015Matteo Gazzani, [email protected] 25

Process synthesis: separation performance
ModelingCharacterization Validation Process design Improvements
Process synthesis: separation performance
Recovery-Purity pareto curves can be established by varying the cycle timestheat tcool
Cycle B: 5-steps cycletads, theat, tcool, tpurge= trinse
y
tpurge
Waste (N2)
tads CO2Dryfeed
Adsorption Heating Cooling
t ime
Rinse Purge
|| || || 8 Sep 2015Matteo Gazzani, [email protected] 26

Process synthesis: separation performance
ModelingCharacterization Validation Process design Improvements
Process synthesis: separation performance
Recovery-Purity pareto curves can be established by varying the cycle timestheat2 tcool
(R,P) = (0.8, 0.8)Cycle C: 4-steps cycletads, theat1, theat2, tcool
y
th t1Waste (N2)
theat1
CO2Dryfeed
Heat 2 CoolingAdsorption
t ime
Heat 1
tads
Cycle C outperforms A and B in term of separation performance
|| || || 8 Sep 2015Matteo Gazzani, [email protected] 27
Process synthesis: energy and productivity
ModelingCharacterization Validation Process design Improvements
Process synthesis: energy and productivity
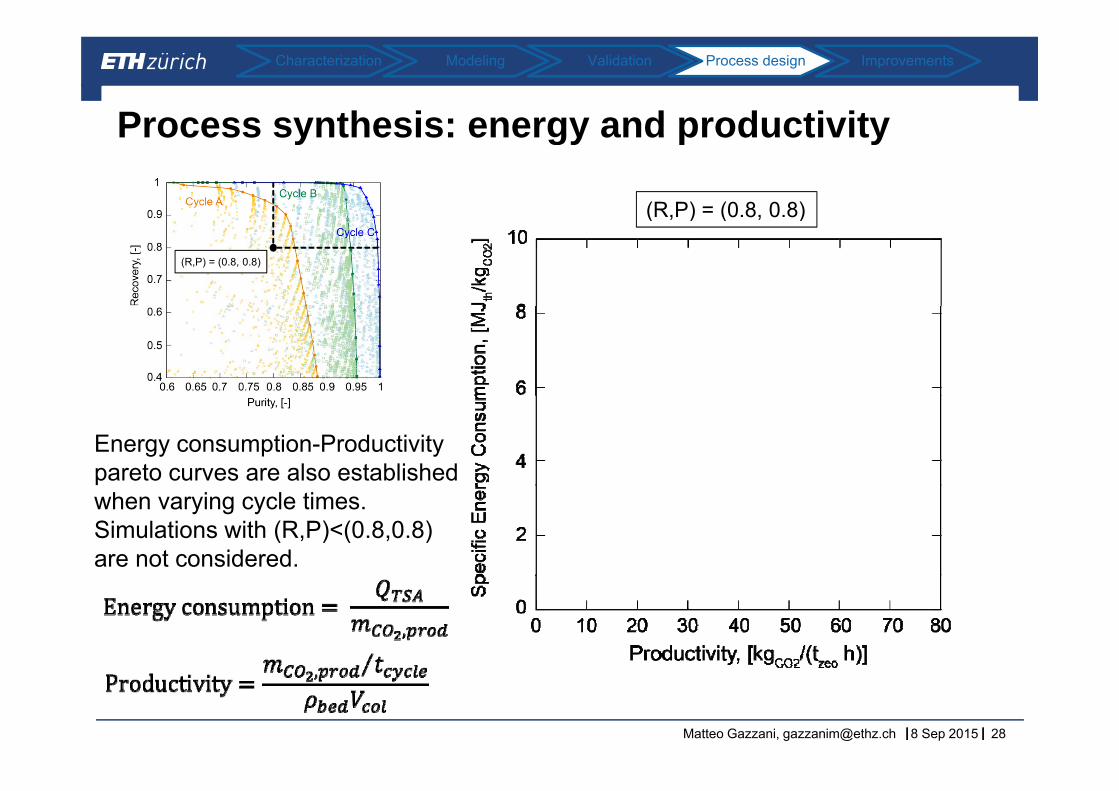
(R,P) = (0.8, 0.8)(R,P) (0.8, 0.8)
(R,P) = (0.8, 0.8)
Energy consumption-Productivity pareto curves are also established when varying cycle times.Simulations with (R,P)<(0.8,0.8) are not considered.
|| || || 8 Sep 2015Matteo Gazzani, [email protected] 28
Process synthesis: energy and productivity
ModelingCharacterization Validation Process design Improvements
Process synthesis: energy and productivity
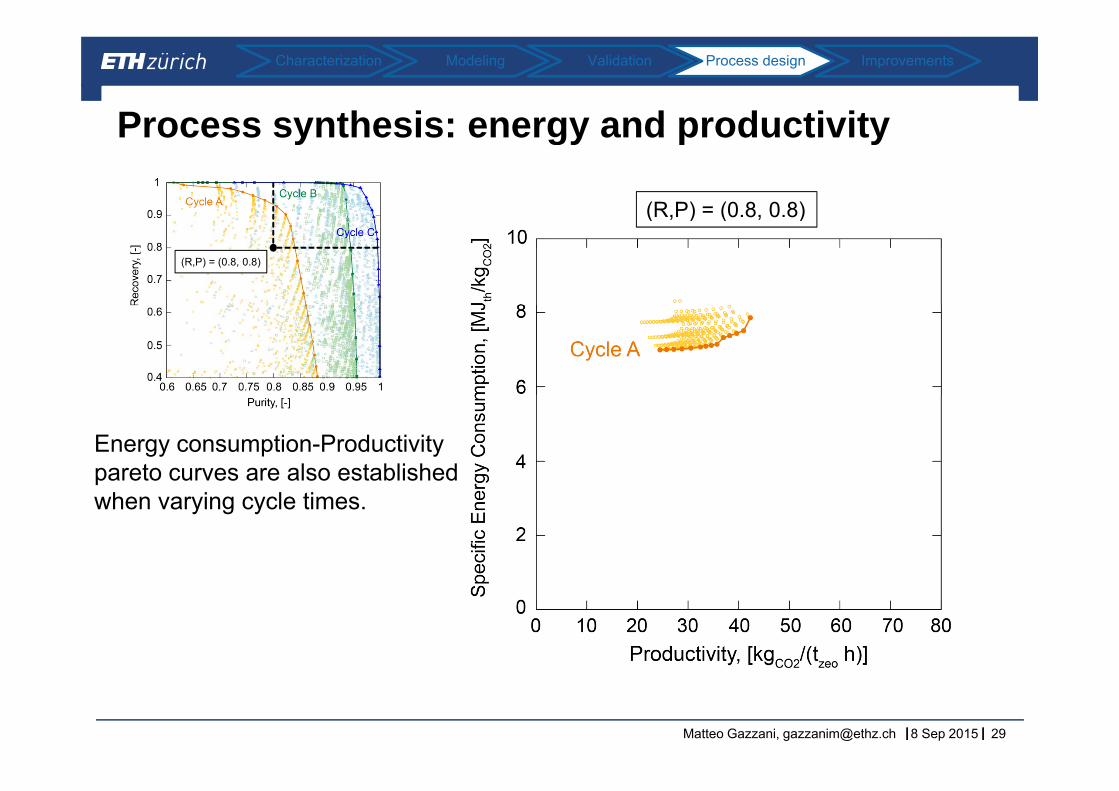
(R,P) = (0.8, 0.8)(R,P) (0.8, 0.8)
(R,P) = (0.8, 0.8)
Energy consumption-Productivity pareto curves are also established when varying cycle times.
|| || || 8 Sep 2015Matteo Gazzani, [email protected] 29
Process synthesis: energy and productivity
ModelingCharacterization Validation Process design Improvements
Process synthesis: energy and productivity
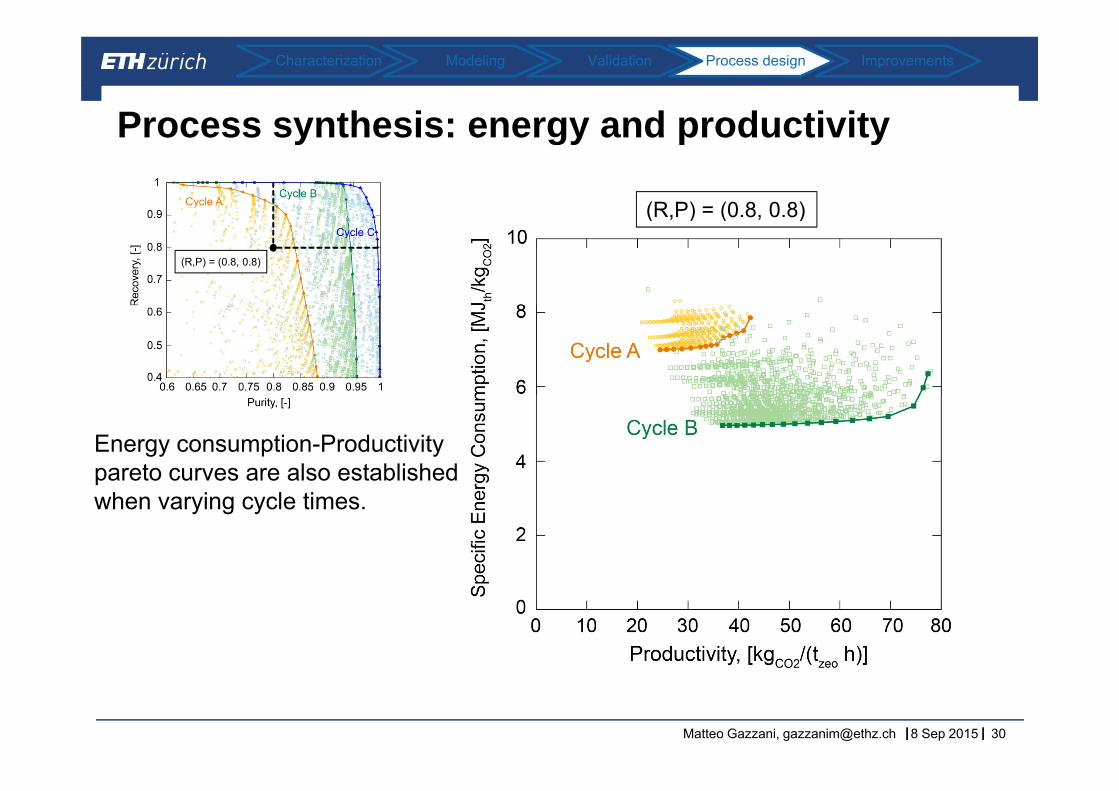
(R,P) = (0.8, 0.8)(R,P) (0.8, 0.8)
(R,P) = (0.8, 0.8)
Energy consumption-Productivity pareto curves are also established when varying cycle times.
|| || || 8 Sep 2015Matteo Gazzani, [email protected] 30
Process synthesis: energy and productivity
ModelingCharacterization Validation Process design Improvements
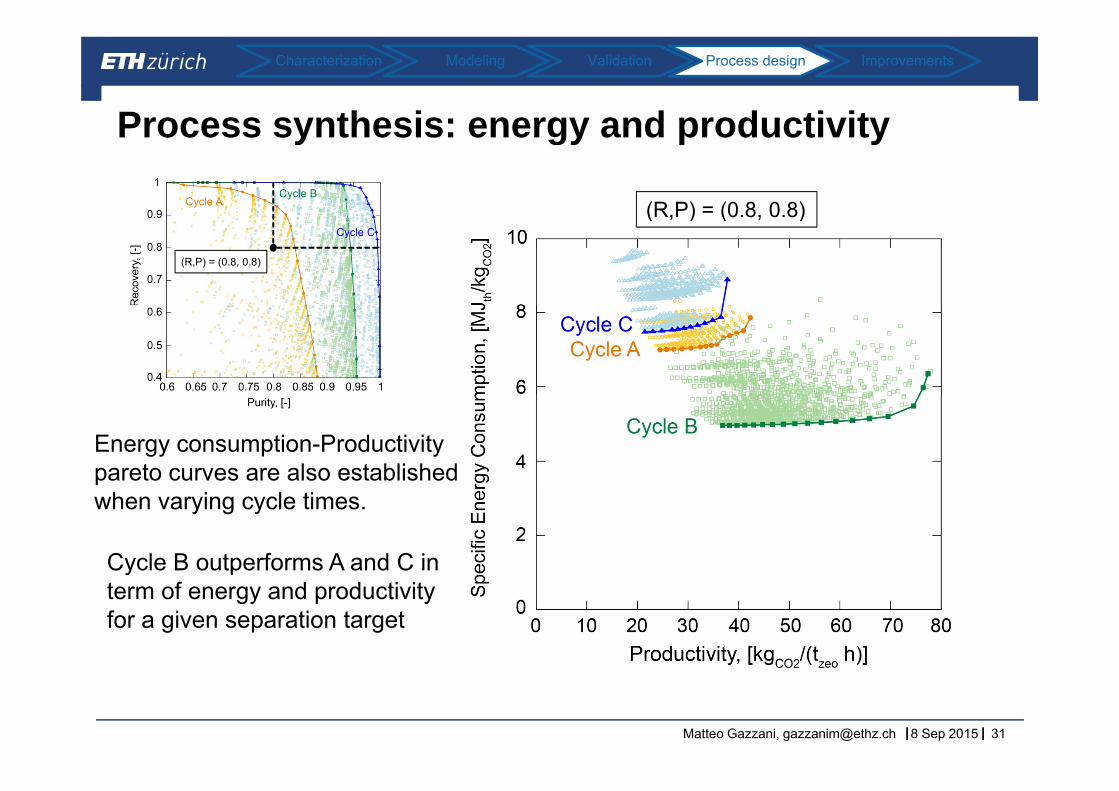
Process synthesis: energy and productivity
(R,P) = (0.8, 0.8)(R,P) (0.8, 0.8)
(R,P) = (0.8, 0.8)
Energy consumption-Productivity pareto curves are also established
Cycle B outperforms A and C in
when varying cycle times.
yterm of energy and productivity for a given separation target
|| || || 8 Sep 2015Matteo Gazzani, [email protected] 31
Process design for CO capture
ModelingCharacterization Validation Process design Improvements
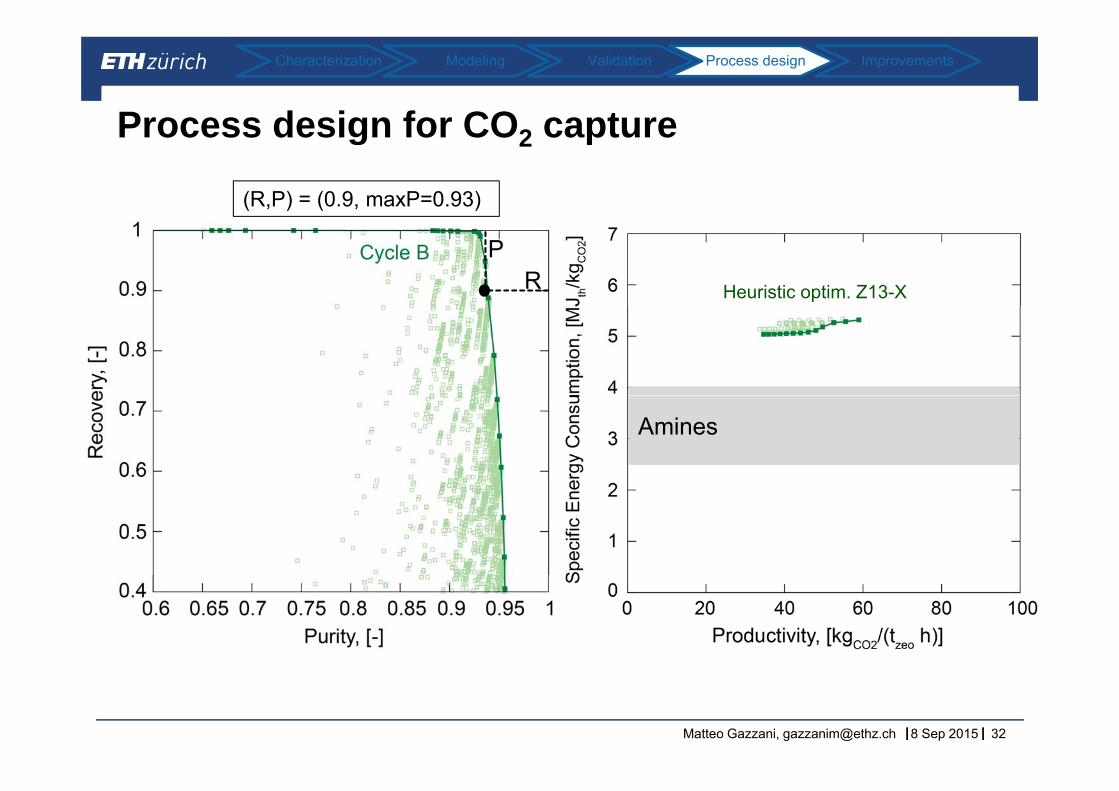
Process design for CO2 capture
(R,P) = (0.9, maxP=0.93)
PR Heuristic optim. Z13-X
Amines
|| || || 8 Sep 2015Matteo Gazzani, [email protected] 32
Process improvement
ModelingCharacterization Validation Process design Improvements
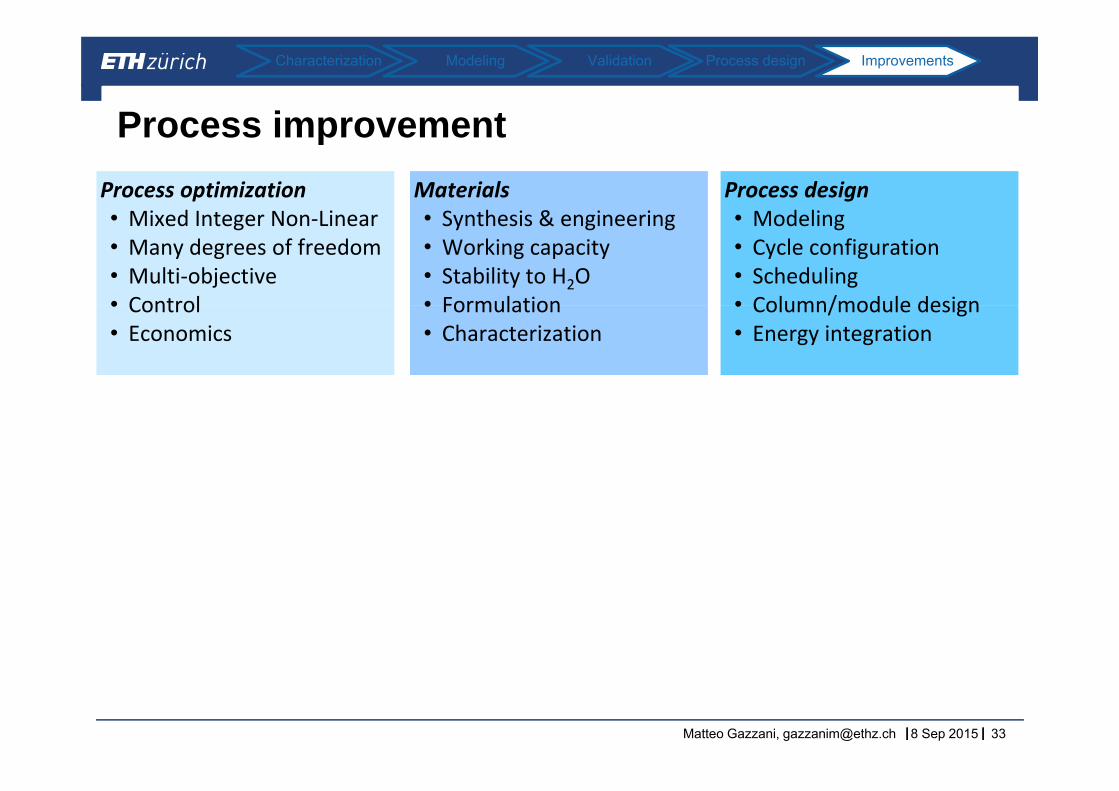
Process improvementMaterials• Synthesis & engineering
Process design• Modeling
Process optimization• Mixed Integer Non Linear • Synthesis & engineering
• Working capacity• Stability to H2O• Formulation
• Modeling• Cycle configuration• Scheduling• Column/module design
• Mixed Integer Non‐Linear• Many degrees of freedom• Multi‐objective• Control • Formulation
• Characterization• Column/module design • Energy integration
• Control• Economics
|| || || 8 Sep 2015Matteo Gazzani, [email protected] 33
Process improvement
ModelingCharacterization Validation Process design Improvements
Process improvementMaterials Process designProcess optimization
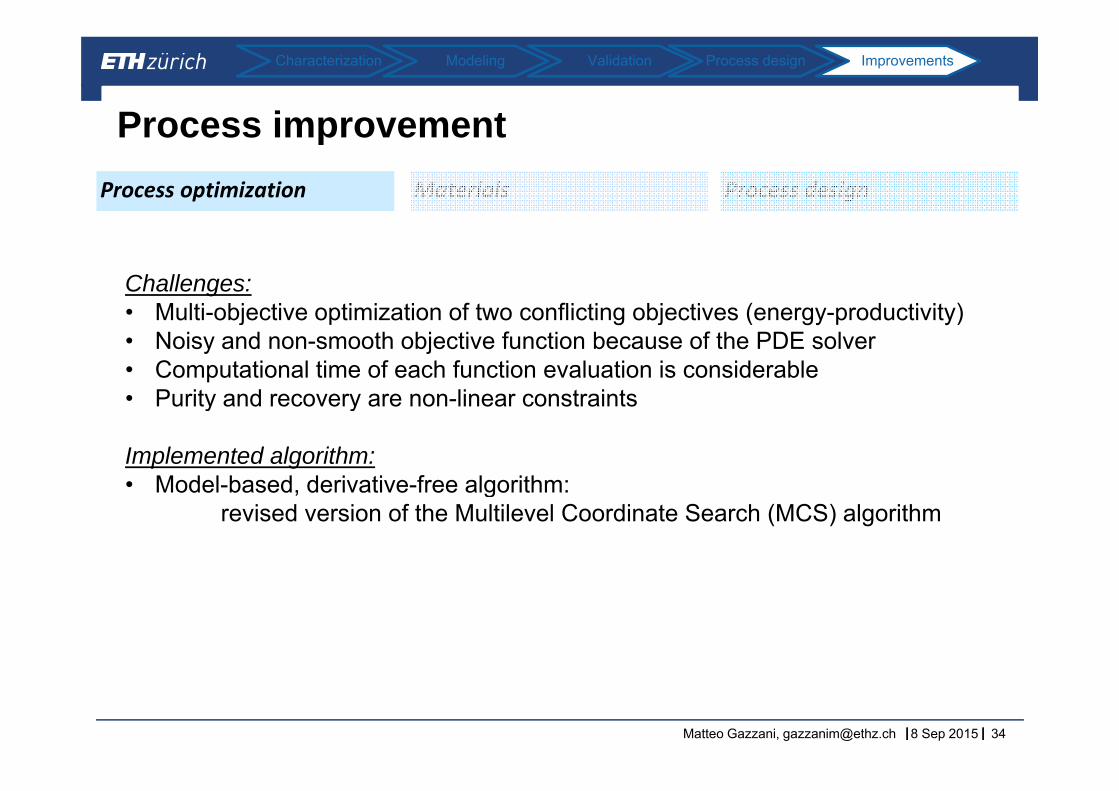
Challenges:M lti bj ti ti i ti f t fli ti bj ti ( d ti it )• Multi-objective optimization of two conflicting objectives (energy-productivity)
• Noisy and non-smooth objective function because of the PDE solver• Computational time of each function evaluation is considerable• Purity and recovery are non linear constraints• Purity and recovery are non-linear constraints
Implemented algorithm:• Model-based derivative-free algorithm:• Model-based, derivative-free algorithm:
revised version of the Multilevel Coordinate Search (MCS) algorithm
|| || || 8 Sep 2015Matteo Gazzani, [email protected] 34
Process improvement
ModelingCharacterization Validation Process design Improvements
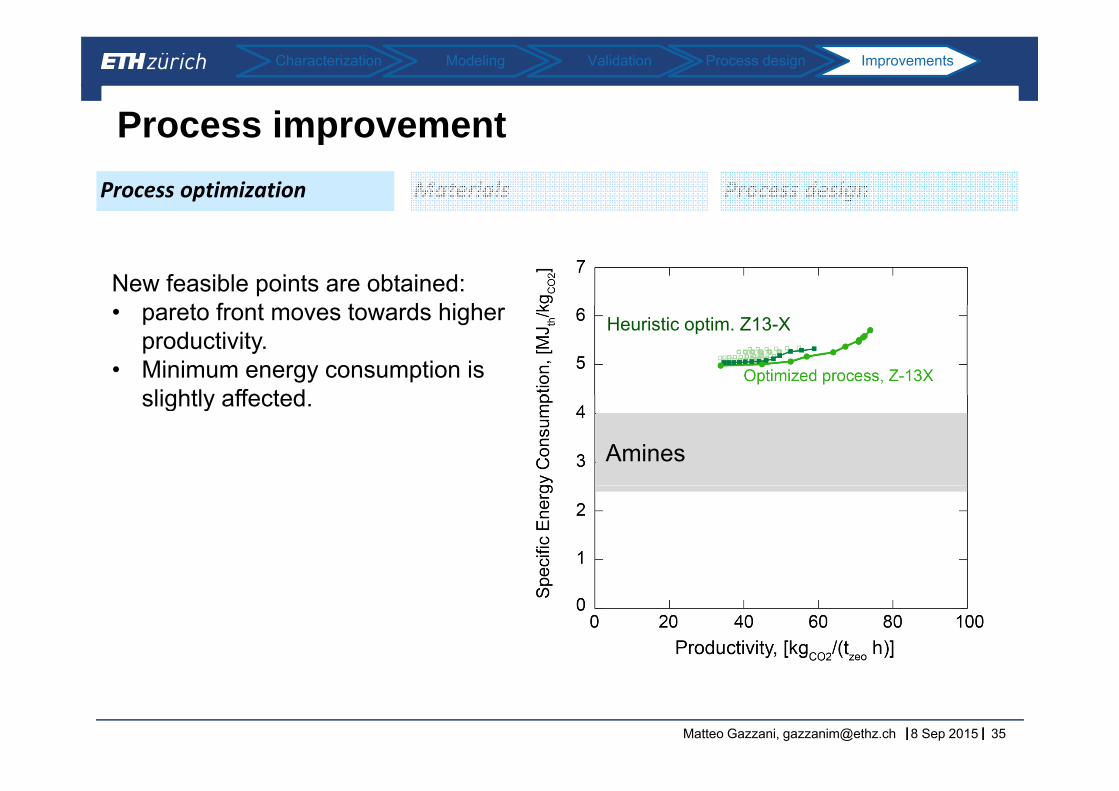
Process improvementMaterials Process designProcess optimization
New feasible points are obtained:t f t t d hi h• pareto front moves towards higher
productivity.• Minimum energy consumption is
slightly affected
Heuristic optim. Z13-X
slightly affected.
Amines
|| || || 8 Sep 2015Matteo Gazzani, [email protected] 35

Process improvement
ModelingCharacterization Validation Process design Improvements
Process improvementMaterials Process designProcess optimization
Mg2(dobdc) (Mg-MOF-47): high CO2 capacity, high g 2 p y gselectivity, potential for TSA
Amines
Xiang et al. Nature Comm. 3:954 (2012)
|| || || 8 Sep 2015Matteo Gazzani, [email protected] 36
Process improvement
ModelingCharacterization Validation Process design Improvements
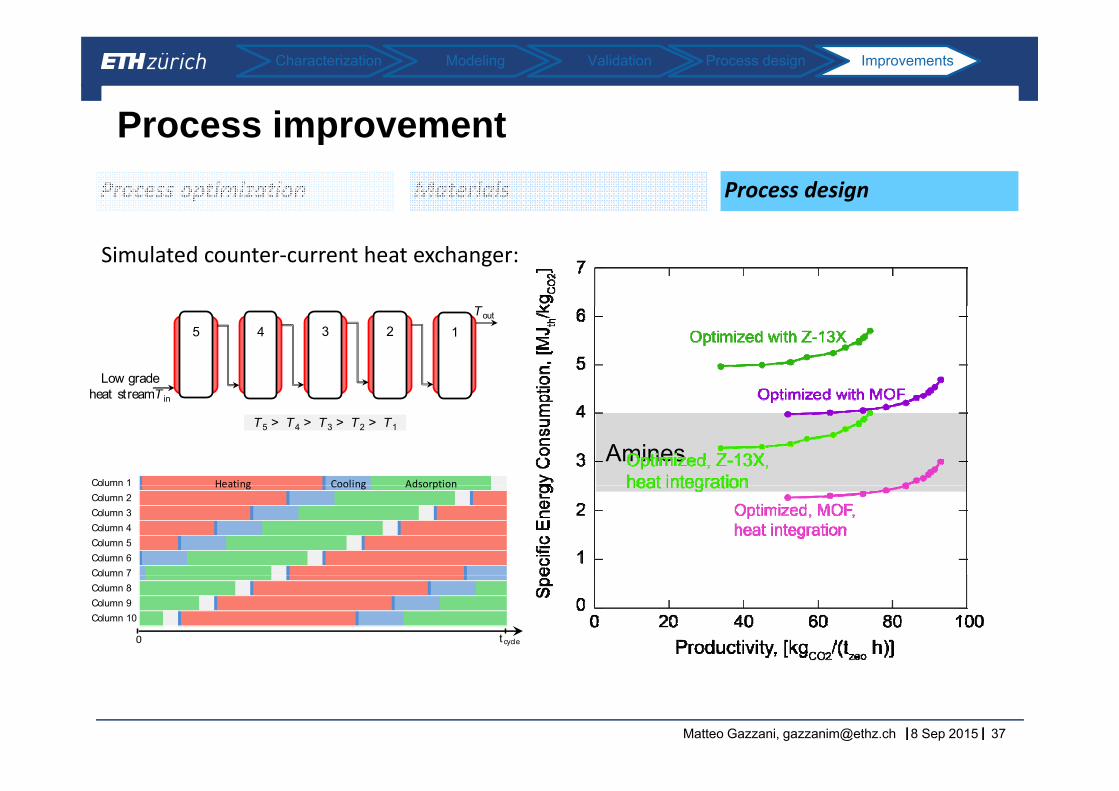
Process improvementMaterials Process designProcess optimization
Simulated counter‐current heat exchanger:
23 15 4
Low grade heat streamT i
Tout
Amines
heat streamT in
T5 > T4 > T3 > T2 > T1
Column 1 AdsorptionHeating CoolingColumn 1Column 2Column 3Column 4Column 5Column 6Column 7
AdsorptionHeating Cooling
Column 7Column 8Column 9Column 10
t cycle0
|| || || 8 Sep 2015Matteo Gazzani, [email protected] 37
ConclusionsConclusions
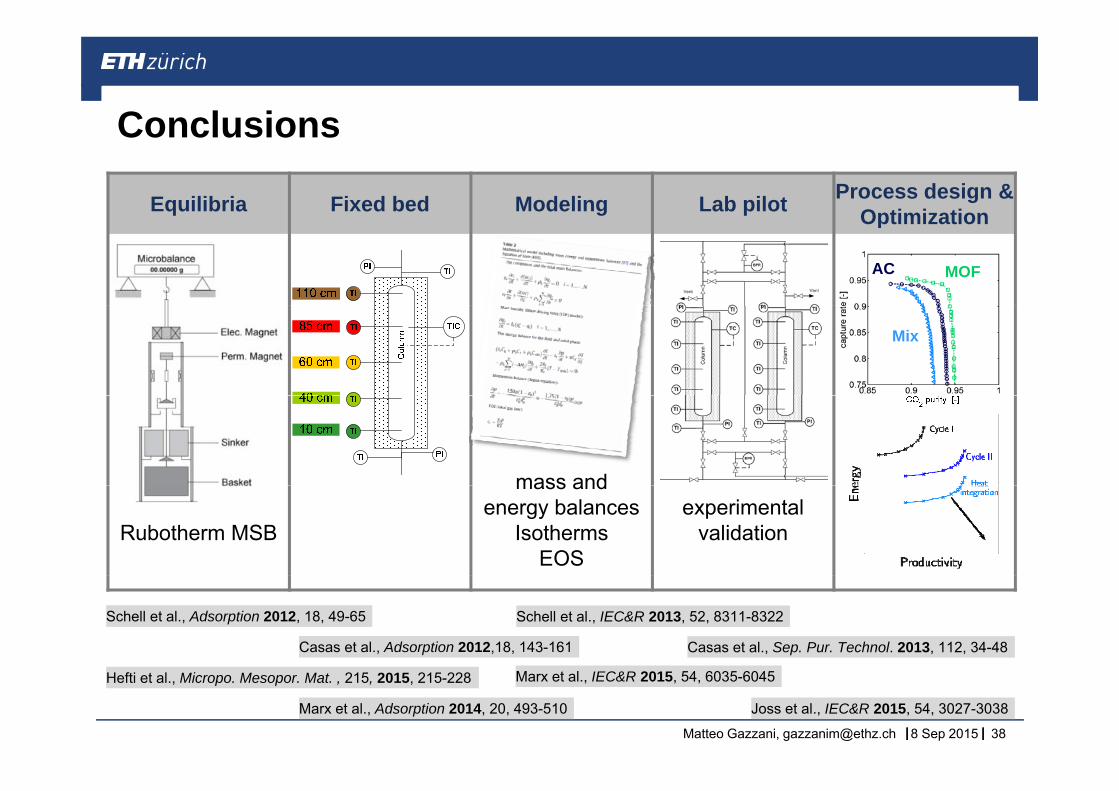
Equilibria Fixed bed Modeling Lab pilot Process design & OptimizationOptimization
AC MOF
Mix
mass and
Rubotherm MSB
mass and energy balances
IsothermsEOS
experimentalvalidation
Casas et al., Adsorption 2012,18, 143-161
Schell et al., Adsorption 2012, 18, 49-65
Casas et al., Sep. Pur. Technol. 2013, 112, 34-48
Schell et al., IEC&R 2013, 52, 8311-8322
|| || || 8 Sep 2015Matteo Gazzani, [email protected] 38
Marx et al., Adsorption 2014, 20, 493-510
Hefti et al., Micropo. Mesopor. Mat. , 215, 2015, 215-228
Joss et al., IEC&R 2015, 54, 3027-3038
Marx et al., IEC&R 2015, 54, 6035-6045
ConclusionsConclusions
Equilibria Fixed bed Modeling Lab pilot Process design & OptimizationOptimization
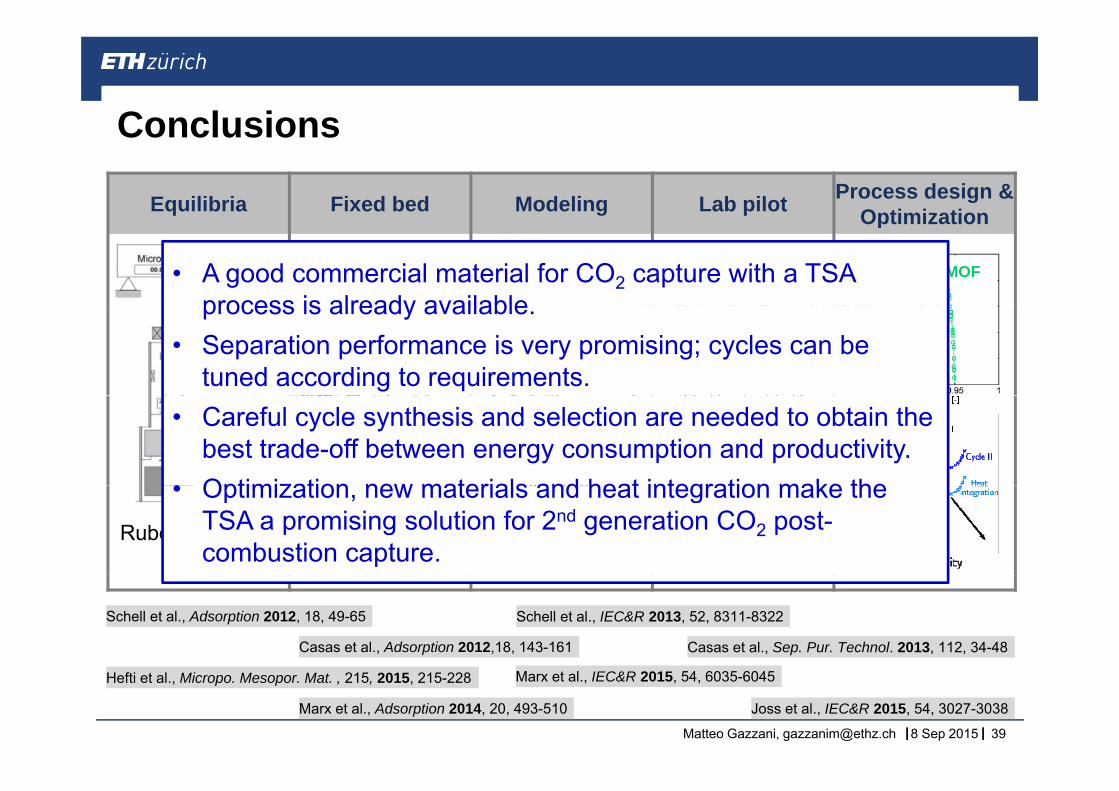
AC MOF• A good commercial material for CO2 capture with a TSA process is already available
Mixprocess is already available.
• Separation performance is very promising; cycles can be tuned according to requirements.
mass and
• Careful cycle synthesis and selection are needed to obtain the best trade-off between energy consumption and productivity.
• Optimization new materials and heat integration make theRubotherm MSB
mass and energy balances
IsothermsEOS
experimentalvalidation
• Optimization, new materials and heat integration make the TSA a promising solution for 2nd generation CO2 post-combustion capture.
Casas et al., Adsorption 2012,18, 143-161
Schell et al., Adsorption 2012, 18, 49-65
Casas et al., Sep. Pur. Technol. 2013, 112, 34-48
Schell et al., IEC&R 2013, 52, 8311-8322
|| || || 8 Sep 2015Matteo Gazzani, [email protected] 39
Marx et al., Adsorption 2014, 20, 493-510
Hefti et al., Micropo. Mesopor. Mat. , 215, 2015, 215-228
Joss et al., IEC&R 2015, 54, 3027-3038
Marx et al., IEC&R 2015, 54, 6035-6045

������ ��� � �
� ������� ����������� � ������������� ���� !"��#$� ��%� �&&���� � �&&����������������$�������' ����(���)�&&� � �� � �� � � � �
Backup slidesBackup slides
|| || ||

Breakthrough experiments on 13XBreakthrough experiments on 13X
Concentration and temperature profiles for the breakthrough experiment with an initial temperature of 25°C, a feed composition of yCO2 = 0.12, and a feed flow rate of 300 cm3/s.
|| || ||
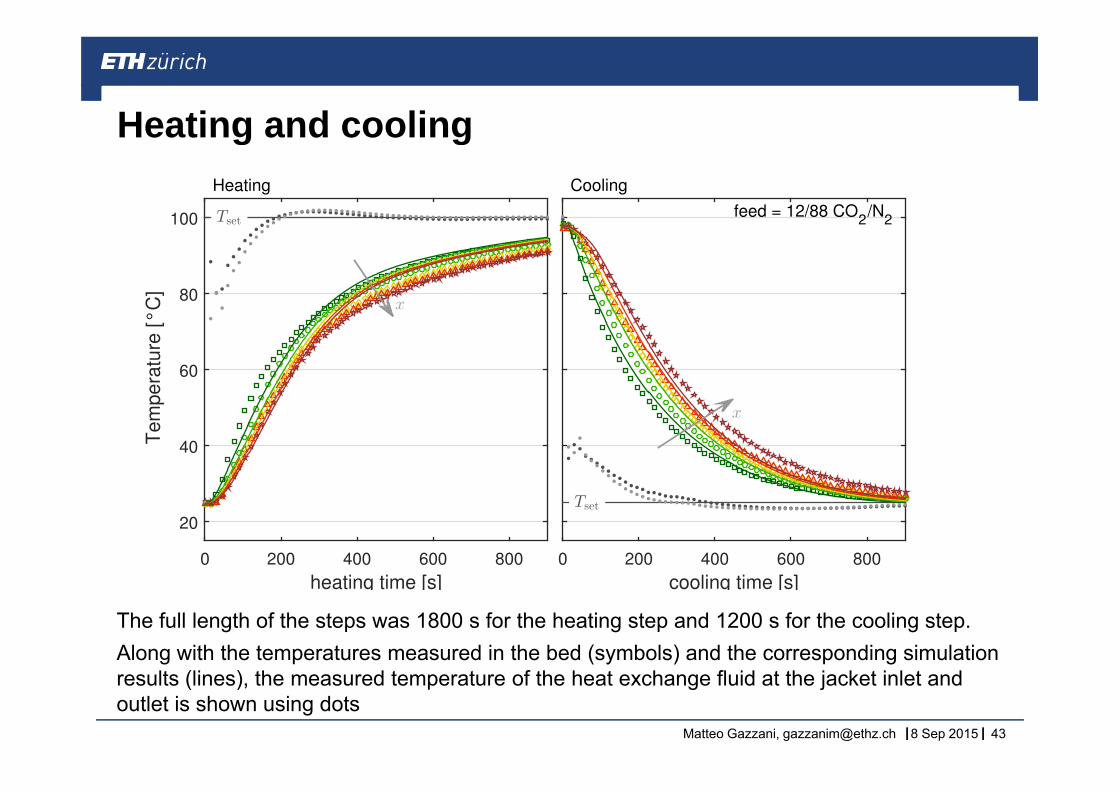
Heating and coolingHeating and cooling
100
Heating
T
Cooling
feed = 12/88 CO2/N2
C] 80
100 Tset
x
feed 12/88 CO2/N2
pera
ture
[°C
60
x
Tem
p
40
x
h i i [ ]0 200 400 600 800
20
li i [ ]0 200 400 600 800
Tset
The full length of the steps was 1800 s for the heating step and 1200 s for the cooling step.Along with the temperatures measured in the bed (symbols) and the corresponding simulation
heating time [s] cooling time [s]
|| || ||
results (lines), the measured temperature of the heat exchange fluid at the jacket inlet and outlet is shown using dots
8 Sep 2015Matteo Gazzani, [email protected] 43

Pure component equilibria
ModelingCharacterization Validation Process design Improvements
Pure component equilibriaZeolite ZSM-5 Zeolite 13-X
O2
P/T conditions
• Pressure:
CO up to 10bar
• Temperature range:25 - 140°C
N2
N
|| || || 8 Sep 2015Matteo Gazzani, [email protected] 44
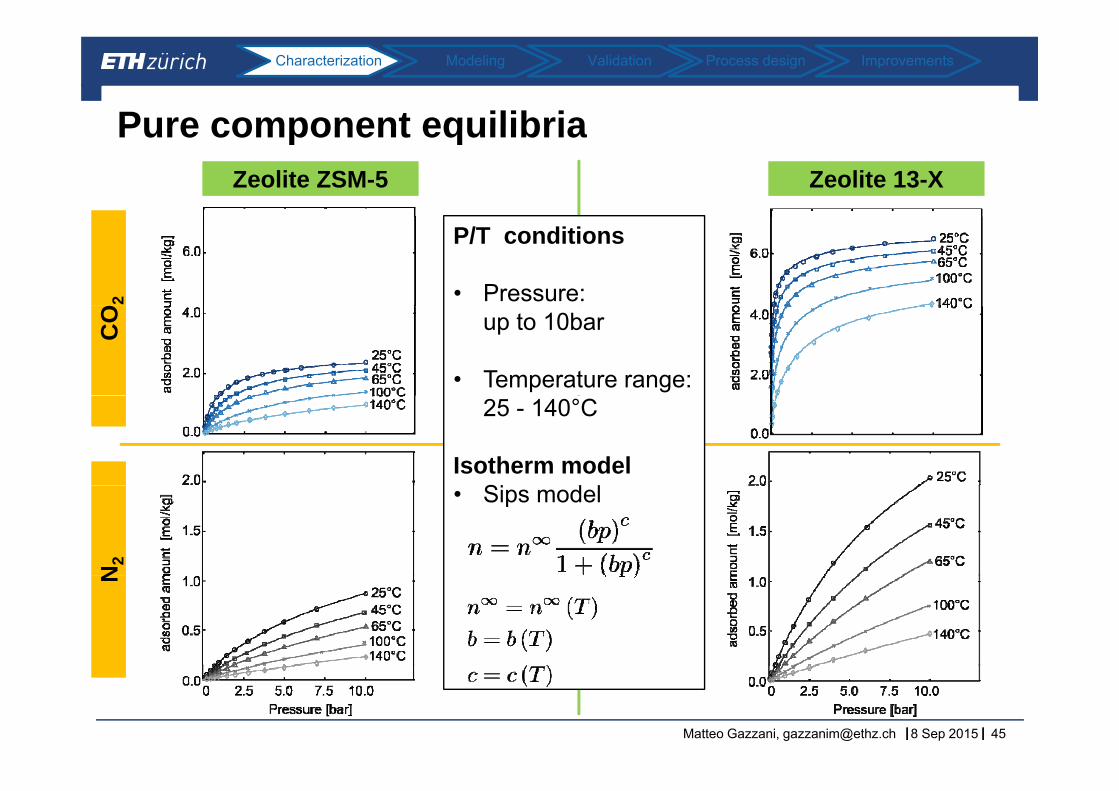
Pure component equilibria
ModelingCharacterization Validation Process design Improvements
Pure component equilibriaZeolite ZSM-5 Zeolite 13-X
P/T conditions
• Pressure:
O2
up to 10bar
• Temperature range:
CO
25 - 140°C
Isotherm modelSi d l• Sips model
N2
N
|| || || 8 Sep 2015Matteo Gazzani, [email protected] 45

Pure component equilibria
ModelingCharacterization Validation Process design Improvements
Pure component equilibriaZeolite 13-XZeolite ZSM-5
P/T conditions
• Pressure:C
1-10 bar
• Temperature range:
25°C
25 and 45°C
5°C
45
|| || || 8 Sep 2015Matteo Gazzani, [email protected] 46
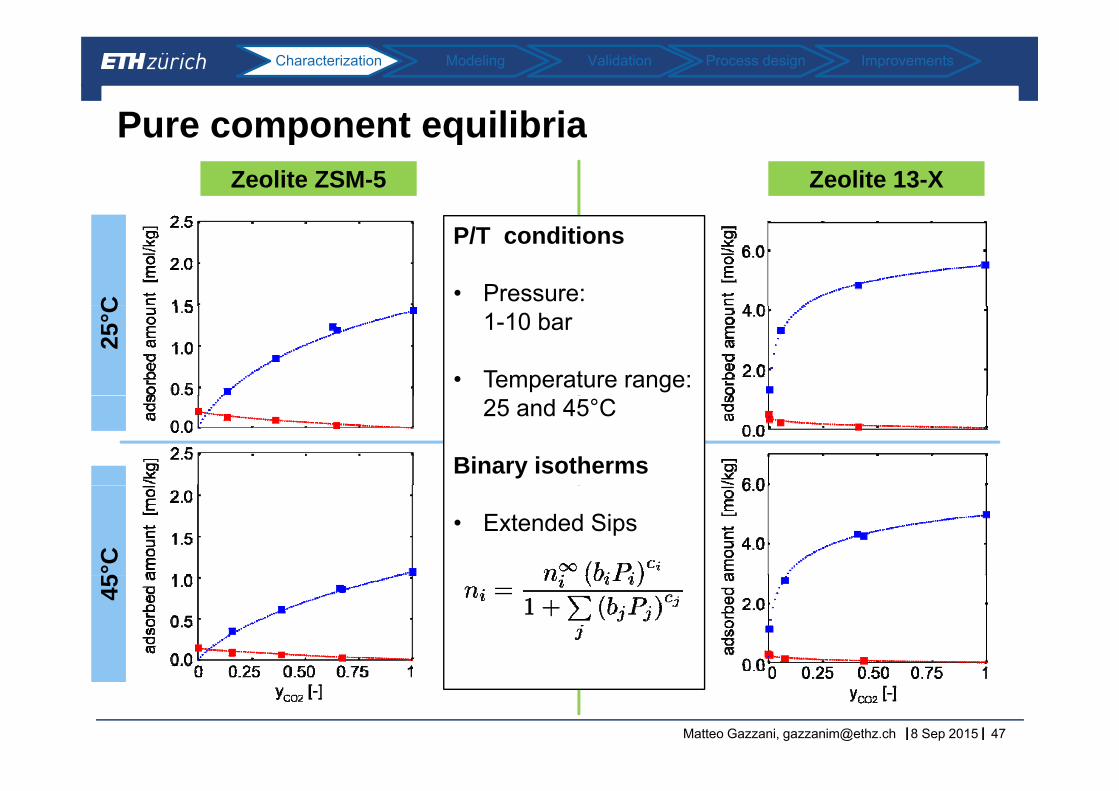
Pure component equilibria
ModelingCharacterization Validation Process design Improvements
Pure component equilibriaZeolite 13-XZeolite ZSM-5
P/T conditions
• Pressure:C
1-10 bar
• Temperature range:
25°C
25 and 45°C
Binary isotherms
• Extended Sips
5°C
45
|| || || 8 Sep 2015Matteo Gazzani, [email protected] 47
Process improvement
ModelingCharacterization Validation Process design Improvements
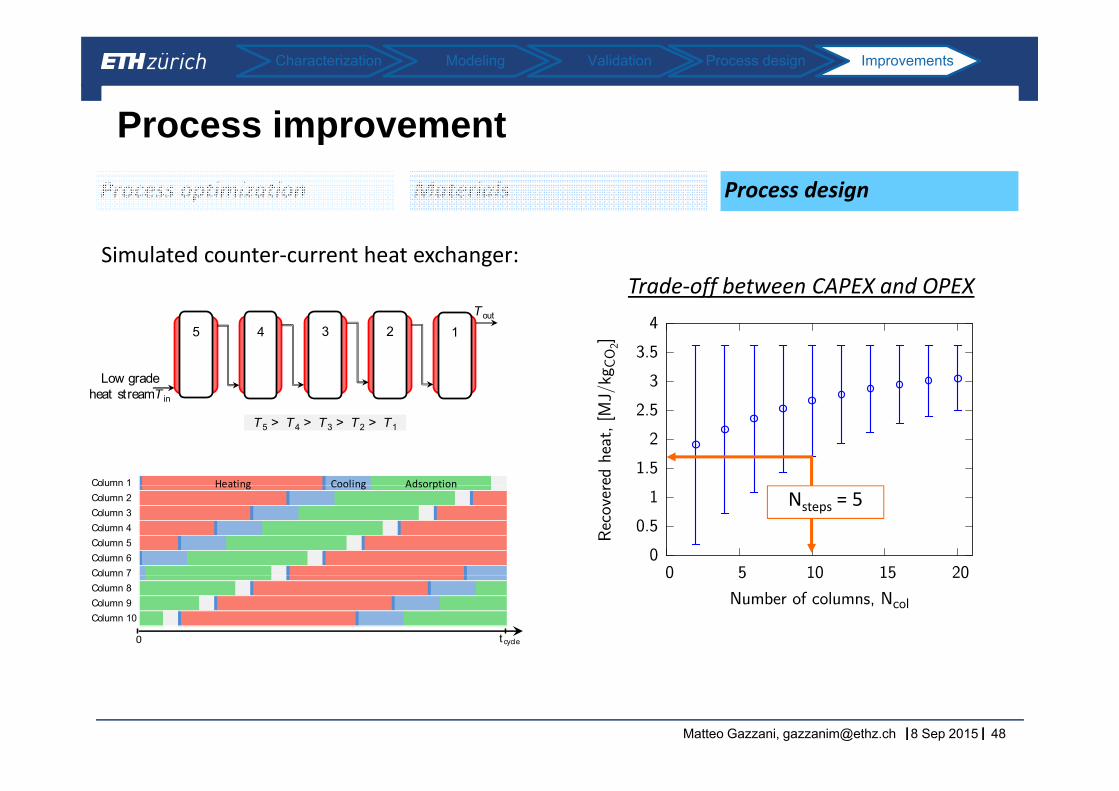
Process improvementMaterials Process designProcess optimization
Simulated counter‐current heat exchanger:Trade‐off between CAPEX and OPEX
23 15 4
Low grade heat streamT i
Tout
heat streamT in
T5 > T4 > T3 > T2 > T1
Column 1 AdsorptionHeating CoolingColumn 1Column 2Column 3Column 4Column 5Column 6Column 7
AdsorptionHeating Cooling
Nsteps = 5
Column 7Column 8Column 9Column 10
t cycle0
|| || || 8 Sep 2015Matteo Gazzani, [email protected] 48
Comparison with existing plants
ModelingCharacterization Validation Process design Improvements
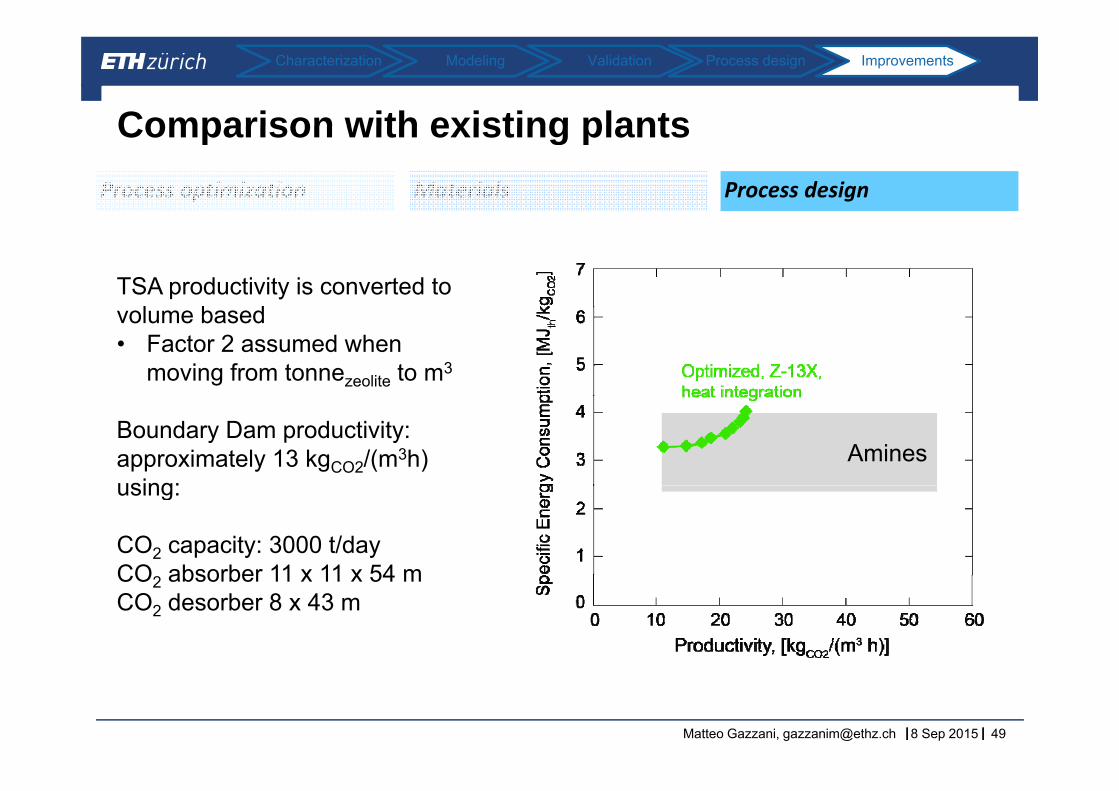
Comparison with existing plantsMaterials Process designProcess optimization
TSA productivity is converted to volume based• Factor 2 assumed when
moving from tonnezeolite to m3
AminesBoundary Dam productivity:approximately 13 kgCO2/(m3h) using:using:
CO2 capacity: 3000 t/dayCO absorber 11 x 11 x 54 mCO2 absorber 11 x 11 x 54 mCO2 desorber 8 x 43 m
|| || || 8 Sep 2015Matteo Gazzani, [email protected] 49