Embed Size (px)
Citation preview
DEVELOPMENT OF BIOCHAR FILLED HIGH DENSITY
POLYETHYLENE COMPOSITE
HAU HUI XIN
A project report submitted in partial fulfilment of the
requirements for the award of Bachelor of Engineering
(Hons.) Petrochemical Engineering
Faculty of Engineering and Green Technology
Universiti Tunku Abdul Rahman
April 2016

ii
DECLARATION
I hereby declare that this project report is based on my original work except for
citations and quotations which have been duly acknowledged. I also declare that it
has not been previously and concurrently submitted for any other degree or award at
UTAR or other institutions.
Signature :
Name : HAU HUI XIN
ID No. : 11AGB04574
Date : 11 APRIL 2016
iii
APPROVAL FOR SUBMISSION
I certify that this project report entitled “DEVELOPMENT OF BIOCHAR
FILLED HIGH DENSITY POLYETHYLENE COMPOSITE” was prepared by
HAU HUI XIN has met the required standard for submission in partial fulfilment of
the requirements for the award of Bachelor of Engineering (Hons.) Petrochemical
Engineering at Universiti Tunku Abdul Rahman.
Approved by,
Signature :
Supervisor : Dr. MATHIALAGAN A/L MUNIYADI
Date : 11 APRIL 2016

iv
The copyright of this report belongs to the author under the terms of the
copyright Act 1987 as qualified by Intellectual Property Policy of Universiti Tunku
Abdul Rahman. Due acknowledgement shall always be made of the use of any
material contained in, or derived from, this report.
© 2016, Hau Hui Xin. All right reserved.

v
ACKNOWLEDGEMENTS
I would like to thank everyone who had contributed to the successful completion of
this project. I would like to express my outmost gratitude to my research supervisor,
Dr. Mathialagan A/L Muniyadi for his invaluable advice, guidance and his enormous
patience throughout the development of the research.
In addition, I would also like to express my gratitude to my loving parents,
Mr. Yong Kek Lam and friends who had helped and given me encouragement.
Besides, I would also like to thank the academic staffs of Petrochemical Laboratory,
who permitted all the required equipment and knowledgeable guidance to complete
the research. Last but not least, I would also like to express my gratitude to my
research moderator, Ms. Leong Siew Yoong for her considerable help in conducting
this research.

vi
DEVELOPMENT OF BIOCHAR FILLED HIGH DENSITY
POLYETHYLENE COMPOSITE
ABSTRACT
Insufficient recycling and recovering of most diversely used high density
polyethylene (HDPE) has drastically increased the amount of plastics waste. Besides,
the growth in oil palm industry has led to a sharp increase in the amount of waste
from palm oil mill effluent (POME), which leads to much environmental pollution.
New inventions in utilization of waste materials as an alternative for reservation of
non-renewable resources have been of prime aim. Thus, in this research work, the
characteristics and potential of Biochar (BC) derived from oil palm sludge as filler in
high density polyethylene was studied. BC filled high density polyethylene
(HDPE/BC) composites were prepared through melt mixing using a Brabender
internal mixer. Small size, individual and loose aggregate structure, high porosity
and compatibility of BC in HDPE attribute to the improved processability, tensile
strength, tensile modulus, toluene resistance and thermal stability of HDPE/BC
composite in comparison to neat HDPE. However, elongations at break and water
resistance of HDPE/BC composite were reduced when BC loading increased. It was
studied that the optimum BC loading in HDPE/BC composite is 2.5 wt% as it
showed the highest tensile strength, improved modulus strength, thermal stability,
toluene resistance and comparable processability although deterioration occurred in
water resistance and elongations at break.

vii
TABLE OF CONTENTS
DECLARATION ii
APPROVAL FOR SUBMISSION iii
ACKNOWLEDGEMENTS v
ABSTRACT vi
TABLE OF CONTENTS vii
LIST OF TABLES x
LIST OF FIGURES xi
LIST OF SYMBOLS / ABBREVIATIONS xiii
LIST OF APPENDICES xiv
CHAPTER
1 INTRODUCTION 1
1.1 Overview 1
1.2 Problem Statements 5
1.3 Project Objectives 8
2 LITERATURE REVIEW 9
2.1 Plastic Recycling 9
2.2 High Density Polyethylene 11
2.2.1 HDPE Structure 11
2.2.2 Properties and Applications of HDPE 12
2.2.3 Recycling of HDPE 13
2.3 Biochar 14
2.3.1 Biochar Production Methods 14

viii
2.3.2 Properties and Applications of Biochar 16
2.3.3 Applications of Biochar in Polymer 18
2.4 Thermoplastic 21
2.4.1 Introduction to Thermoplastic 21
2.4.2 Filler in Thermoplasctic 24
2.4.3 Common Fillers in Thermoplastic 25
2.4.4 Current Development of Thermoplastic 28
3 MATERIALS AND METHODOLOGY 31
3.1 Introduction 31
3.2 Raw Materials 31
3.2.1 High Density Polyethylene (HDPE) 31
3.2.2 Palm Oil Sludge (Precursor of Biochar) 31
3.3 Biochar Preparation 32
3.4 HDPE/Biochar Composite Preparation 33
3.5 Characterization of Biochar 35
3.5.1 Particle Size Analysis (PSA) 35
3.5.2 Fourier Transform Infrared Spectroscopy (FTIR) 35
3.5.3 Thermogravimetric Analysis (TGA) 35
3.5.4 Scanning Electron Microscopy (SEM) 36
3.6 Characterization and Testing of HDPE/Biochar 36
3.6.1 Fourier Transform Infrared Spectroscopy (FTIR) 36
3.6.2 Differential Scanning Calorimetry (DSC) 36
3.6.3 Scanning Electron Microscopy (SEM) 37
3.6.4 Water Uptake and Toluene Swelling Test 37
3.6.5 Tensile Test 38
3.6.6 Thermogravimetric Analysis (TGA) 38
4 RESULTS AND DISCUSSION 39
4.1 Introduction 39
4.2 Characterization of Biochar 39
4.2.1 Particle Size Analysis (PSA) 40
4.2.2 Fourier Transform Infrared Spectroscopy (FTIR) 41

ix
4.2.3 Thermogravimetric Analysis (TGA) 43
4.2.4 Scanning Electron Microscopy (SEM) 43
4.3 Characterization and Properties of HDPE/BC Composite 44
4.3.1 Processing Properties 44
4.3.2 Differential Scanning Calorimetry (DSC) 46
4.3.3 Fourier Transform Infrared Spectroscopy (FTIR) 48
4.3.4 Swelling Test in Water and Toluene 54
4.3.5 Thermogravimetric Analysis (TGA) 56
4.3.6 Tensile Test 59
4.3.7 Scanning Electron Micrscopy (SEM) 62
5 CONCLUSION AND RECOMMENDATIONS 67
5.1 Conclusion 67
5.2 Recommendations 68
REFERENCES 69
APPENDICES 80

x
LIST OF TABLES
TABLE TITLE PAGE
1.1 Oil Production Analysis of Oil Crops 3
3.1 Compounding Formulation of HDPE/BC
Composite 33
4.1 Physical Characteristics of BC, Carbon Black,
Silica and Calcium Carbonate 41
4.2 FTIR Analysis of BC 42
4.3 Thermogravimetric Analysis of BC 43
4.4 The Melting Temperature, Crystallizing
Temperature, and Crystallinity Percentage of
HDPE/BC Composite at Different BC Loading 47
4.5 FTIR Analysis of Unfilled HDPE 50
4.6 FTIR Analysis of HDPE/BC Composite at
Different BC Loading 51
4.7 Thermogravimetric Analysis of HDPE/BC
Composite at Different BC Loading 58
4.8 Ultimate Tensile Strengths, Tensile Modulus and
Elongations at Breakof HDPE/BC Composites at
Different BC Loading 60

xi
LIST OF FIGURES
FIGURE TITLE PAGE
1.1 Malaysia Palm Oil Production by Year 4
1.2 Planted Area of Palm Oil in Malaysia 4
2.1 World Plastic Production 9
2.2 Consumption of Plastic by Segment 10
2.3 Chemical Structure of LDPE and HDPE 12
2.4 Internal Surface and Porosity of BC 17
2.5 SEM Image of Fracture Surface of Epoxy Resins/
Plastic Waste Char Composite 20
2.6 Linkage of Polymer in Thermoplastic 22
2.7 The Amorphous and Semi-Crystalline Structure in
Thermoplastic 23
2.8 Structure of Commercial Calcium Carbonate
Under Microscopy 27
2.9 Polyurethane Foam Filled with Calcium Carbonate
Filler 27
2.10 Interaction of Calcium Carbonate Filler in
Polyurethane Foam 28
2.11 Scanning Electron Microscopy of Extruded
Polyethylene Starch Film 29
2.12 Morphology of Fracture Surface HDPE Composite
Reinforced with Combined Talc and Glass Fiber 30
3.1 Flowchart of Biochar Preparation 32
3.2 Flowchart of HDPE/BC Preparation 34

xii
4.1 Particle Size Distribution of BC 40
4.2 FTIR Spectra of BC 42
4.3 SEM Micrograph of BC at 300x Magnification 44
4.4 Processing Torque of HDPE/BC Composites at
Different BC Loading 46
4.5 FTIR Spectra of Unfilled HDPE, HDPE/1.0 BC
and HDPE/10 BC Composite 52
4.6 Comparison FTIR Spectra of HDPE/BC
Composites at Different BC Loading 53
4.7 Water Uptake Percentage of HDPE/BC
Composites at Different BC Loading 55
4.8 Toluene Swelling Percentage of HDPE/BC
Composites at Different BC Loading 56
4.9 Thermo-Oxidation of HDPE/BC Composites at
Different BC Loading 57
4.10 Ultimate Tensile Strength of HDPE/BC
Composites at Different BC Loading 61
4.11 Tensile Modulus of HDPE/BC Composites at
Different BC Loading 61
4.12 Elongations at Break of HDPE/BC Composites at
Different BC Loading 62
4.13 SEM Micrograph of Tensile Fracture of (a)
Unfilled HDPE, (b) HDPE/2.5 BC and (c)
HDPE/10 BC at 100x Magnification 63
4.14 SEM Micrograph of Tensile Fracture of (a)
Unfilled HDPE, (b) HDPE/2.5 BC and (c)
HDPE/10 BC at 700x Magnification 64
4.15 SEM Micrograph of Tensile Fracture of (a)
Unfilled HDPE, (b) HDPE/2.5 BC and (c)
HDPE/10 BC at 1000x Magnification 66

xiii
LIST OF SYMBOLS / ABBREVIATIONS
ΔHm melting heat (J/g)
ΔH100 melting heat for 100% crystalline poly(ethylene), 293 J/g
BC biochar
BOD biochemical oxygen demand
CaCO3 calcium carbonate
COD chemical oxygen demand
DSC Differential Scanning Calorimetry
FTIR Fourier Transform Infrared Spectroscopy
HDPE high density poly(ethylene)
LDPE low density poly(ethylene)
Mi initial mass of sample prior to water immersion
Ms final mass of sample after absorbing water
NIR Near Infrared Radiation
PA poly(amide)
PE poly(ethylene)
PET poly(ethylene terephthalate)
POME palm oil mill effluent
PP poly(propylene)
PS poly(styrene)
PSA Particle Size Analysis
PVC poly(vinyl chloride)
SEM Scanning Electron Microscopy
SiO2 silicon dioxide
TGA Thermogravimetric Analysis
Wp weight fraction of polymer in sample
wt% weight percent
Xm
c degree of crystallinity

xiv
LIST OF APPENDICES
APPENDIX TITLE PAGE
A Differential Scanning Calorimetry 80
B Thermogravimetric Analysis 85

CHAPTER 1
INTRODUCTION
1.1 Overview
Biochar (BC) is the ancient secret discovered by Amazonian back in the 16th
centuries. The black and fertile soil (terra preta) at Amazon Basin had received the
attention of scientist to discover the great usage of terra preta in soils amendment.
The earth‟s dark black colouring of terra preta contains the most important ingredient,
which is charcoal, to fertilize soil and double the harvest as compared to normal
chemical fertilizer (Wayne, 2012). BC can be produced by charring of agricultural
waste through pyrolysis or thermochemical conversion in oxygen limited
environment (Biochar-international.org, 2015). Besides improving soils‟ quality, BC
also acts as a significant role in the global carbon cycle by which carbon content in
BC resists degradation in soil for thousands of years and reduces the emissions of
methane gas and nitrous oxide to the environment (Biochar.org, 2006).
“Go Green”, the mostly promoted slogan nowadays around the world. In
order to accomplish the “Go Green” target by fully utilizing waste, investigation on
the potential development of BC filled in various applications has been carried out.
For instance, the potential of BC papers consist of BC and paper pulp blending has
been investigated in Rochester, New York (Draper, 2014). According to Chemical
Industry News, the global polymer demand especially on thermoplastic such as high
density polyethylene (HDPE), low density polyethylene (LDPE), polyvinyl chloride
(PVC) and polystyrene (PS) are in drastically increasing trend. Global demand for
plastic has led to pollution problems such as emission of toxic intermediate to

2
surrounding when plastic is being disposed or decomposed inappropriately
(Pollution Issues, 2015). Besides the challenges in recovering and recycling of
plastics, incineration and biodegradation of plastics are the alternative routes to
reduce plastic wastes which is also expensive and hazardous (Eze et al., 2013). Due
to high recycled plastic contamination risks through polymer recycling, reinforce
polymer with organic fillers such as natural fibre is able to improve the
biodegradability of polymer which causes it to be more environmentally friendly and
having low processing cost (Liu et al., 2009).
By far, few researches have been done on the utilization of BC as filler in
manufacturing polymer composites. For example, BC was used as filler in polymer
such as wood polymer composites i.e, epoxy/BC composites (Ahmetli et al., 2013).
Researches have been carried out in order to manufacture a more sustainable,
resilient and financially viable bio-based polymer other than just being used as soil
enhancer (Das et al., 2015). The integration of BC as filler into the polymer is a
powerful method to mitigate climate change as it is not only substituted the use of
fossil fuels but also sequestrated carbon as carbon sink and led to negative emission
of carbon (Biochar.org, 2006). However, the drawbacks of using bio-filler based
polymer are the poor strength and stiffness possesses by organic filled polymer
composites as compared to inorganic filled polymer composites (Das et al., 2015).
Thus, mechanical properties of organic filler filled polymer composites can be
improved by adjusting the filler contents and reducing the filler particle size
(Nwanonenyi et al., 2013) as well as with the addition of additives to enhance the
performance of polymer (Industry Liaison Office, 2015).
Malaysia is a tropical country with high temperatures and humidity
throughout the year that eases the cultivation of tropical oil palm tree in Malaysia.
The fruit of oil palm tree can be derived into edible vegetable oil with high saturated
fats (Wwf.org.au, 2016). Besides, oil palm has the highest oil yielding and required
less plantation land as compared to the other types of crops derived vegetable oil
such as soybean, rapeseed and sunflower which can be verified in Table 1.1
(Sumathi et al., 2008). Therefore, when the demand of oils and fats increased,
Malaysia has become one of the largest vegetable oil contributors in the world. As
illustrated in Figure 1.1, the production of palm oil in Malaysia for the past 50 years

3
showed rapid increasing pace from year to year. In year 2000, the oil palm
production was 12,000 million tons, whereas in year 2010, the oil palm production
already shot to 18,000 million tons. As of year 2015, the production of palm oil has
already reached 20,000 million tons. Therefore, the sharp growth of palm oil
industry in Malaysia has led the oil palm plantation to boast significantly in the
recent year.
According to Malaysian Palm Oil Board, the plantation area of palm oil has
increased nearly to 5.0 million hectares in year 2011. As shown in Figure 1.2, the
planted area of palm oil has increased in a rapid pace, from 0.5 million hectares in
year 1975 to 4.7 million hectares in year 2010. It was forecasted that the demand of
palm oil will continuously increase in years to come as if the demand of world total
oils and fats increased (Sumathi et al., 2008). However, large of amount palm oil
mill effluent (POME) is generated during the production of crude palm oil. POME
contains high organic carbon content by possessing high value of biochemical
oxygen demand (BOD), which makes it commonly to be converted and used as a
fertilizer (Sumathi et al., 2008). Besides, due to the carbon rich features of POME, it
was being converted into BC through thermal decomposition at 400 °C and used as a
potential filler to accommodate HDPE to form HDPE/BC composites in this research.
Table 1.1: Oil Production Analysis of Different Oil Crops (Sumathi et al., 2008)
Oil crop
Production
(million
tons)
% total
production
Average oil
yield
(tons/ha/year)
Total area
(million
ha)
%
Area
Oil palm 36.90 35.90 3.74 9.86 4.50
Soybean 35.19 34.24 0.38 92.63 42.27
Rapeseed 18.34 17.84 0.67 27.29 12.45
Sunflower 11.09 10.79 0.48 22.95 10.47

4
Figure 1.1: Malaysia Palm Oil Production by Year (Indexmundi, 2016)
Figure 1.2: Planted Area of Palm Oil in Malaysia (Palmoilworld, 2016)
In this research, BC derived from palm oil mill effluent (POME) was used as
potential filler in HDPE to form HDPE/BC composites. POME was first undergoing
pyrolysis in a carbonization unit at 400 °C for 117 min of holding time and mixed
with HDPE resins to produce HDPE/BC composites. In addition, HDPE and BC
were mixed and blended at different BC loading: unfilled HDPE, HDPE/1.0 BC,
HDPE/2.5 BC, HDPE/5.0 BC and HDPE/10 BC. Furthermore, a series of
characterizations such as particle size analysis (PSA), fourier transform infrared

5
spectroscopy (FTIR), thermogravimetric analysis (TGA), scanning electron
microscopy (SEM) were conducted on BC produced, whereas FTIR, density test,
differential scanning calorimetry (DSC), SEM, water uptake and toluene swelling
test, tensile test and TGA were conducted on HDPE/BC composites produced. The
main purposes for this research are to study the potential of BC as filler in HDPE
polymer and the effect of BC loading on the properties of HDPE/BC composites.
Besides, addition of BC was expected to improve the thermal stability, toluene
swelling resistance, tensile strength and tensile modulus of material of HDPE/BC
composite.
1.2 Problem Statements
1.2.1 Environmental Problems Caused by POME
Oil palm plantation area in Malaysia has grown in rapid pace from about 3.38
million hectares in the year of 2000 and is forecasted to increase to 5.10 million
hectares by the year 2020 (Jalani et al., 2002).Palm oil mill effluent (POME), which
is resulted from the waste of palm oil mill industry, is normally discharged into
nearby rivers or land after oil palm fruit processing. Consequently, the discharged of
huge amount of POME has resulted pollution problems and brought significant
impact to the environment due to its high chemical oxygen demand (COD) as well as
high concentration of biochemical oxygen demand (BOD) (David et al., 2014).
As the awareness of environmental issues caused by POME increased, the
evolvement on managing POME has been changed from disposal of POME to full
utilization and gain of beneficial from POME and its by-product. Therefore,
recovering of palm oil sludge, the suspended or dissolved solids in POME, is one of
the utilization methods to turn POME into valuable bio-resources (Madaki and Seng,
2013). Palm oil sludge can be converted into useful material such as biochar, through
pyrolysis technique (Thangalazhy et al., 2015).

6
1.2.2 Insufficient Recovering and Recycling of Plastics
Gourmelon (2015) reported that the global plastic consumption is continually raised
while plastic recycling lags. The insufficient recovering and recycling of plastics
caused most of the plastic wastes ended up being landfilled and the original
resources of plastics are wasted (Punčochář et al., 2012). To overcome the non-
biodegradable problem for most of the conventionally used thermoplastics such as
polyethylene (PE), polypropylene (PP) and polyvinyl chloride (PVC), manufacturing
of polymers that can biodegrade such as bio-plastics has been developed (Tokiwa et
al., 2009).
Environmental issues such as emission of greenhouse gases arise which
resulted from the increasing plastic consumption can be conquered with the addition
of BC as filler in polymer to produce bio-plastics (Das et al., 2015). Utilization of
organic wastes derived BC in polymers helps to prevent environmental catastrophe
as BC is able to sequester carbon back to its original plant source (Biochar-
international.org, 2015). Besides making green environment, BC is also able to
optimize the usage of organic wastes at minimum cost due to the abundance of
biomass waste in oil palm plantation (Kong et al., 2014). This makes BC as an
accessible feedstock in comparison with nearly depleted fossil fuels to produce
polymer composites that can biodegrade. Lastly, BC filled polymer is a promising
solution to the plastic disposal issues as it alters the biodegradability of polymers
(Tokiwa et al., 2009) and can be disposed into landfilling without potentially
endangering the ecosystem.
1.2.3 High Cost and Incompatibility of Commercial Fillers in Polymers
Carbon black, silica, calcium carbonate and various clay minerals such as talc, kaolin
and china clay are used extensively in polymers (Dyson, 1990). However, there are
few limitations that caused these commercial fillers to be incompatible to be used in
polymers.

7
i) Silica and clay are one of the commonly used filler in polymers. However,
due to its hydrophilic properties, it is incompatible in hydrophobic
polymer such as thermoplastic olefins as it will result in low mechanical
properties. Therefore, coupling agents, compatibilizers and chemical
surface treatment are needed to improve silica and clay filled polymers
and undesirably increases the processing cost (Mittal, 2011).
ii) Even though carbon black is able to enhance the mechanical properties of
polymers, however, it is costly and expensive as it is sourced from
petroleum feedstock. Besides, carbon black is naturally dark in colour, as
a consequence, the product made up from carbon black polymers cannot
be tailored or changed colour (Katz and Milewski, 1987).
iii) Calcium carbonate is one of the popular non-reinforcing fillers used in
polymers. However, calcium carbon increases the modulus but reduces
the properties due to its large particle size which will cause
agglomeration problems during moulding (Meyer, 1987).
Thus, solutions are found to replace the commercial fillers with alternative
fillers from natural resources which are abundant, low in cost, easily processed,
environmentally friendly and can substitute commercial fillers without reducing or
deteriorating the properties of polymer (Vroman and Tighzert, 2009). In this
research, BC was used as filler to prepare HDPE/BC composites. BC used is
derived from palm oil sludge which is abundantly available in all palm oil mill,
simple processing and low in cost as it is processing from waste. Besides, BC is
potentially to improve the mechanical and thermal properties due to high porosity
BC particles. Furthermore, high carbon content of BC also able to act as similar to
carbon black, whereas smaller particle size of BC particles compared to other types
of filler material may also potentially increase properties significantly with very
low loading, which can help in colour tailoring of the final product.

8
1.3 Project Objectives
The ultimate goal of this project is to produce, characterize and study the potential of
BC as filler in HDPE polymer. The other objectives on this study are:
1. To produce biochar through carbonization process of palm oil mill effluent
(POME).
2. To characterize the physiochemical properties of biochar.
3. To prepare biochar filled HDPE composites and study the effect of biochar
loading on the processing and properties of HDPE/BC composite.

CHAPTER 2
LITERATURE REVIEW
2.1 Plastic Recycling
Plastics are synthetic or semi-synthetic materials manufactured from long-chain
polymers, which are derived from oil and natural gas. Plastic production on 1950
was 1.7 million tons; it is increased averagely at a rate of 8.7 percent per year until
the production of plastic reaches 300 million tons of years 2012 (Plastics Europe,
2013), which can be seen in Figure 2.1. China is the largest plastic production
country with 24 % by weight of plastic has been solely produced; other countries in
Asia has 40 % plastic by weight of world production of plastic; whereas Europe and
North America have 20 % weight of world plastic production (Velis, 2014).
Figure 2.1: World Plastic Production (Plastics Europe, 2013)

10
As illustrated in Figure 2.2, there are approximately about 40 % of plastics
are being used in short-lifespan applications which is also known as the single-use
disposal plastic such as food packaging and films in agricultural. On the other hand,
around 20 - 25 % of plastics are used for long-term infrastructures such as cable
insulation, piping system and structural materials, whereas the remainder plastics are
used for durable plastic applications due to its intermediate lifespan such as
electronic goods, vehicles and furniture (Hopewell et al., 2009).
Figure 2.2: Consumption of Plastic by Segment (Plastics Europe, 2013)
The large quantities of plastic consumption bring significant impacts to the
environment as the recovery and recycling of plastics remain insufficient and
inefficient because of the disposal by landfilling of the most plastic materials
(Gourmelon, 2015). In consequence, more lands are wasted for landfill and plastic‟s
valuable resources are gone into vain as well. Therefore, recycling of plastic would
be very important not only because it reduces the problem of plastic incineration and
landfilling but also converts the waste plastics into useful products as well as to
minimize the waste (Ecologycenter.org, 2015).

11
2.2 High Density Polyethylene (HDPE)
2.2.1 HDPE Structure
Polyethylene, the popular thermoplastic produces from polymerization of ethylene
monomers, is commonly used in producing consumer product. High density
polyethylene (HDPE), is also known as linear polyethylene, it has a linear polymer
structure which produced from ethylene monomers through Ziegler-Natta catalytic
reaction. Furthermore, the joining of carbon and hydrogen atoms is linear in HDPE
structures which result in high molecular weight thermoplastic materials. In addition,
HDPE is a long chain ethylene polymer lined up regularly to form semi-crystalline
structure with low degree of branching (Bbc.co.uk, 2014). Degree of branches
determines the crystalline proportions in HDPE structure, which may affect the
density and strength of HDPE (Lester, 2015). The low degree of branches causes the
HDPE polymer chains packed closely and tightly, results a high density polymer
with high crystalline structure which also gives high strength and moderate stiffness
to the thermoplastic (Encyclopedia Britannica, 2015).
Figure 2.3 illustrates the difference between the chemical structure of HDPE
and LDPE. As illustrated in the Figure 2.3, LDPE is a long polyethylene chain with
high degree of branches, whereas HDPE has low degree of branches. Therefore, the
intermolecular forces between HDPE molecules are stronger as compared to LDPE.
Thus, HDPE possesses better mechanical and higher tensile strength as compared to
LDPE (Plasticmoulding.ca, 2015).

12
Figure 2.3: Chemical Structure of LDPE and HDPE (Encyclopedia Britannica,
2015)
2.2.2 Properties and Applications of HDPE
HDPE is comparatively denser than other derivatives of polyethylene with a specific
gravity of 0.95. Furthermore, HDPE has good mechanical strength with relatively
hard and high impact properties. Besides, HDPE are chemically inert and has a very
high resistance to chemicals and corrosion. In addition, HDPE is able to withstand
high temperature up to 120 °C without properties being affected (Thomas, 2013).
The melting point of HDPE is defined when the crystalline structure completely
transformed into amorphous state. When HDPE is being stretched, the internal
arrangement structure of HDPE will elongate and the molecular chains will start to
slip over one another. In consequences, deformation in structure may result on
fracture and the stiffness of HDPE will be reduced when ultimate tensile strength of
HDPE is reached (Lester, 2015).
The inherent properties of HDPE raised the market demand and consumption
as compared to other polyethylene derived thermoplastics. The durability of HDPE
contributes to its widely use in blow and injection moulding applications in polymer
industry (Icis, 2010). In blow moulding application, HDPE resins are being melted

13
and emerged to the mould as hollow under high pressure to manufacture plastic films,
bottles, containers, automotive fuel tanks and watering cans (British Plastics
Federation, 2015). Apart from that, injection moulding process of HDPE is able to
manufacture various types of plastic applications such as bottle caps, toys, packaging
containers and household goods. On the other hand, extrusion process of HDPE are
used to produce products such as insulator and long profile HDPE pipes, which is
commonly applicant for water, natural gas and drainage system in the world (Icis,
2010).
2.2.3 Recycling of HDPE
As the demand of plastics increase globally, the plastics manufacturing rate is up to
100 million tons annually. However, due to most of the ubiquitous and versatile
plastics are non-biodegradable, therefore, recycling of plastics is introduced globally
to reduce the waste and plastic resources. Plastics have become one of the toughest
to collect and recycle materials in the world, where polyethylene terephthalate (PET)
and HDPE are the most dominant recyclable plastic in the market. Yet, there is only
31 % of PET and 28 % of HDPE being recycled in the past few years (Szaky, 2015).
Thus, it is important to make plastics to be economically and environmentally
sustainable to conserve the resources and reduce the plastics waste by recycling and
recovering the waste to other useful products (American Chemistry Council, 2015).
Recycled HDPE is firstly to be sorted according to their densities and cleaned
to remove dirt and ducts on unwanted plastics. Near Infrared Radiation (NIR), is one
of the popular technologies to sort out HDPE from other types of plastic by
irradiating infrared radiation to the rigid plastic, the detector will base on the
electromagnetic energy passes through it to determine the spectrum of plastic to
achieve sorting purposes. However, NIR sorting technique is not applicable in dark
colour because dark coloured product plastic is unable to absorb the infrared waves
irradiated by the camera (Maris et al., 2012). After sorting, recycled HDPE will be
shredded into small pieces and further reprocessed into pellets after melting of
shredded pieces (Thomas, 2013).

14
Commonly, recycled HDPE is used in manufacturing of non-food application
bottles, plastic piping, flower cans and trash cans (Heathland, 2009). Due to the
nature attributes of HDPE, recycled HDPE materials have wide range of applications
in industry. The strong wear resistance and ability to withstand moisture attack
properties of HDPE allow it to be used in marine manufacture such as boat seating,
decking and hull construction. In addition, recycled HDPE can also be used as
partition for bathroom, signage and recreation construction such as playhouse
structures (Metemplastics, 2015).
Apart from being recycled, HDPE waste is being converted into useful
energy resources through recovering the potential energy generated from waste
incineration process and landfilling. The released landfill gas contributes to around
2 % of greenhouse gas emissions annually in the global. The major emitted landfill
gas from landfilling is methane gas, which is the second most prevalent greenhouse
gas. The energy recovery process is completed by using sophisticated system in
landfilling sites to collect the released methane gases. The collected methane gas is
later being treated and used as fuel sources or converted into carbon dioxide gas,
which is released to the atmosphere (Klinghoffer and Castaldi, 2013). Recovering
energy from waste HDPE is not only able to conserve the resource, it also protect
human health by reducing the emission of greenhouse gases to the environment.
2.3 Biochar
2.3.1 Biochar Production Methods
Biochar (BC), a carbon enriched charcoal which produced from thermochemical
decomposition of biomass (Biochar-international.org, 2013). Woodchips, animal
manure and crop residues are the examples of biomass which can be convert into BC
(Tang et al., 2013). BC is normally being produced through thermochemical
conversion of biomass, the most popular and convenient method to convert biomass
as a potential renewable energy source (Thangalazhy et al., 2015). Thermochemical
conversion of biomass includes the process of combustion, gasification, liquefaction

15
and carbonization of biomass to decompose it into three different solid, liquid and
gaseous fractions product (Özçimen and Karaosmanoğlu, 2004).
Pyrolysis is the most common thermal conversion process to produce BC
from biomass. It involves heating of biomass under oxygen-limiting conditions to
produce bio-oil, char and non-condensable gases (Ronsse, 2013). Thermal
decomposition of the polymeric constituents in biomass starts when the combustion
temperature reaches around 350 - 550 °C. The rate of decomposition of biomass for
the distributions and yield of BC is depending on the process parameters: heating
rate, heating temperature, pressure and types of feedstock (Jahirul et al., 2012). For
instance, fast pyrolysis with high heating rates will maximize the production of
liquid bio-oil due to the low vapour residence time during combustion of biomass
(Ronsse, 2013). On the other hand, in slow pyrolysis, vapours have higher residence
time to react with the solid phase and produce more BC compared to fast pyrolysis.
To summarize, the content of carbon percentage in BC is increased with the
temperature and heating rate of pyrolysis (Mohan et al., 2014). The parameters used
in this research was modified from the research of Sukiran (2011), where POME was
pyrolysis at 400 °C with 27 °C/min heating rate and 117 min retention time without
the presence of oxygen in order to maximize the carbon content of BC produced.
Liquefaction is another method of producing BC from biomass.
Thermochemical liquefaction is a low temperature and high pressure process to
produce BC and bio-oil from biomass with solvent such as methanol and ethanol
participation. Temperature uses in liquefaction is ranging from 260 - 350 °C with
pressure of 5 - 20 MPa. BC acts as a by-product in biomass liquefaction process,
whereas bio-oil is the main products from the yield. However, BC produced from
liquefaction process contains high contents of oxygen functional groups in its
constituents. Therefore, in comparatively, pyrolysis gives higher BC yield than
liquefaction process, but liquefaction BC has better performance than pyrolysis
process due to the high content of oxygen-containing functional groups in BC
constituents (Leng et al., 2015).

16
2.3.2 Properties and Applications of Biochar
Biochar is a char particles enriched with carbon and has high porosity with large
specific internal surface area in its structure. The large internal surface area allows
BC to have better retention power in storing water and nutrients (Tang et al., 2013).
Besides, the physical properties of BC are depending on the original biomass used
and also the BC conversion process through carbonization or pyrolysis system
(Lehmann and Joseph, 2009).
BC is categorized into three categories based on the carbon content in it:
Class 1 BC, more than 60 % of carbon content; Class 2 BC, carbon content ranges
from 30 - 60 %; Class 3 BC, carbon content ranges from 10 - 30 %. Carbon content
in BC may vary depends on the process conditions of residence time and pyrolysis
heating rate (Mohan et al., 2014). According to Sukiran (2011), BC produced from
empty fruit bunches at 400 °C with 30 min/°C heating is belong to class 1 BC as the
content of carbon was 65 %. Thus, it is envisaged that BC produced in this research
is belong to class 1 BC. In addition, process conditions also alter the structural
arrangement of BC produced. This includes the pre- and post-handling of BC,
temperature, material used and heating rate during the conversion process. For
instance, BC produced from high pyrolysis temperature has larger surface area and
provides better adsorption ability than those produced from low pyrolysis
temperature (Tang et al., 2013). Furthermore, the mechanical strength possessed by
BC is determined through its density, whereas the density of BC is determined by its
degree of porosity. As illustrated in Figure 2.4, BC has highly porous structure with
large internal surface area within it.

17
Figure 2.4: Internal Surface and Porosity of BC (Australian Sustainable
Business - The Switch Report, 2015)
The advantageous properties of BC make it popular to be used in soil
amendment applications as the high specific surface area of BC improves its
moisture and nitrogen retention in soil (Tang et al., 2013). Due to its adsorption and
retention capability, BC is widely used in agriculture as soil amendment for nutrient
supplements or fertilizers. It is reported that the yield has significantly increased with
the application of BC as soil amendment in agriculture due to the capability of BC in
improving nutrient uptake of plants with its large internal surface area (Schmidt et al.,
2014).
Apart from that, BC is also widely used as an adsorbent in water remediation.
The sorption capacities of BC make it useful in removing organic and inorganic
contaminants from water by using biological methods. Chemical precipitation, the
most commonly used method to remove contaminants from water, uses hydroxide,
sulphides, carbonate, and phosphate in the water treatment process. However, the
drawback of chemical precipitation is the disposal problems of sludge produced from
the precipitation. Therefore, removing contaminants in water with biological
methods has been introduced by using selective adsorption with biological materials
such as mineral oxides and activated carbon for water treatment (Schmidt, 2012).

18
Activated carbon is expensive due to its high processing cost, which have
raised the market attention and demand of BC in water remediation. BC is a more
sustainable and low cost derivatives of carbon possessing high adsorption towards
hydrocarbons, organic and inorganic ions. BC can be easily produced through
carbonization process by using agricultural waste materials, fibers from plants and
also waste from oil palm processing. The large internal surface area and capacity to
exchange cation makes BC adsorb and bind effectively with inorganics components
and ammonium (Schmidt, 2012). The use of BC as adsorbent is not only for
removing contaminants from water; it also adsorbs nutrients within it and can be
subsequently used as soil amendment in agriculture to fertilize plants (Mohan et al.,
2014).
2.3.3 Applications of Biochar in Polymer
Apart from being soil amendment and adsorbent, BC also acts as potential filler in
polymer composite preparation which capable of enhancing the physical and
mechanical properties of BC filled polymer composites (Biocharnow.com, 2015).
Demand of fossil fuels increases with the growth of population, and causes the
depletion of the non-renewable resources in the world. Thereby, the aid of BC as
filler in polymer is not only able to improve composites‟ performance in sustainable
way; but also reduces the dependence on using oil-based consumption in making
polymer to conserve the environment (Biocharnow.com, 2015). Polymer has either
crystalline or amorphous or semi-crystalline structure, which causes the mechanical
strength of polymers to be varied from each other. Therefore, the introduction of
fillers into polymer as reinforcing agent may imparts many benefits through
improving both mechanical and chemical strength and also dimensional stability of
the neat polymer (Shenoy, 1999). While optimizing the function of polymer, the aids
of fillers in polymer also help to minimize the cost of the product and to improve the
processability of the composite material.
Wood polymer biochar composites, is an example of BC filled polymer
composite development in recent year. Wood polymer biochar composites are
widely used in manufacturing furniture or act as construction material for building

19
and automotive mobile (Ashori, 2008). The high internal surface area, high carbon
content and hydrophobic properties of plant/woody biomass converted BC makes it
potential filler in wood and polymer composites, by lowering the moisture
absorption of wood polymer biochar composites. Furthermore, BC is co-injected into
wood and polymer composites due to the high thermal degradation temperature of
more than 200 °C which makes it more thermally stable than commercially used
wood (Das et al., 2015).
The processing of wood polymer composites with BC filler involve the
compounding process at slightly higher melting temperature of polymer and
moulding the mixture under high pressure and temperature into desire products.
Composite wood solely into polymer gives high impartment force for the product
while it only requires low cost of production. The tendency of wood to attract water
is the largest drawback because it causes swelling in the thickness and dimensional
stability of wood polymer composite decreases due to the poor wood fiber dispersion
in the matrix (Ashori, 2008). This diminished the outdoor usage of wood polymer
composite. Therefore, coupling agent is introducing to bind the wood fiber in the
polymer for the mechanical strength enhancement purposes. However, this increase
the production cost of wood polymer composite which is undesirable (Das et al.,
2015).
Biochar are desired more as filler material in producing polymer composite
due to its advantageous properties: low in cost, easy to obtain and able to reduce the
dependence on using fossil fuels as resources (Biocharnow.com, 2015). Ahmetli et al.
(2013) has reported that the char particles derived from plastic waste, wood shavings
and pine cone connected well in the matrix of epoxy/char composites. According to
Ahmetli et al. (2013), the epoxy/char composites displayed uniform BC distribution
on the fracture surface under scanning electron microscopy (SEM); however, the
high brittleness of BC reduce the percentage elongation and increase the surface
coarseness of composites. The image of fracture surface of plastic waste derived char
filled epoxy composite is shown in Figure 2.5. Besides, the epoxy composites filled
with char filler derived from different sources (plastic waste, wood shavings and
pine cone) was not only led to the improvement in mechanical and thermal

20
properties, but also decreased the moisture diffusivity of epoxy/char composites
(Ahmetli et al., 2013).
In addition, the organized distribution of BC aligned well to each other and
also with the epoxy matrix in the epoxy/char composites in the research conducted
by Ahmetli et al. (2013). With the good reinforcing force due to good alignment
between char filler and epoxy matrix, the composite formed has high impact strength
and resilient force. It was studied that the tensile strength, Young‟s modulus and
thermal properties improves with the increasing percentage of BC up to 15 wt% used
as filler in composite. However, the elongation percentage and tensile strength of
composite reduces when the filler reached the optimum and critical filler level in
compounding process (Ahmetli et al., 2013).
Figure 2.5: SEM Image of Fracture Surface of Epoxy Resins/ Plastic Waste
Char Composite (Ahmetli et al., 2013)
Apart from that, Ho et al. (2015) has reported that the mechanical properties
of polylactic acid reinforced with bamboo charcoal derived from bamboo plants
increased with the content of bamboo charcoal up to 7.5 wt%. Besides, it was found
that the polylactic acid/bamboo char composites possessed low decomposition rate
and excellent absorption capacity compared to pure polylactic acid, which made the
composite suitable to be used in food storage applications (Ho et al., 2015). In
addition, it was also reported that the bamboo char filler has neat and good
21
dispersion in polylactic acid matrix, which is similar to Ahmetli et al. (2013)‟s
finding, where the char derived from plastic waste, wood shavings and pine cone
distributed uniformly in the epoxy‟s matrix. Thus, the addition of bamboo charcoal
in polylactic acid were found to improve the mechanical, thermal and optical
properties of polylactic acid/bamboo char composite as the tensile strength, flexural
and ductility increased when the bamboo char loading was increased to 7.5 wt% (Ho
et al., 2015).
Furthermore, the development of polyvinyl alcohol/BC composite was
conducted by Nan et al. (2015) with the mixed hardwood derived BC. It was
reported that the addition of hardwood char into polyvinyl alcohol showed similar
electrical conductivity with carbon nanotubes and graphene filled polyvinyl alcohol
composites. Besides, it was also reported that the polyvinyl alcohol/BC composites
possessed high thermal stability as the decomposition and degradation temperature
of polyvinyl alcohol/BC composites were relatively high but the mechanical strength
of composite were reduced. In addition, polyvinyl alcohol/BC composite has higher
electrical conductivity than carbon nanotubes and graphene filled polyvinyl alcohol
composites. Apart from that, Nan et al. (2015) also reported that BC was distributed
homogenously throughout the polyvinyl alcohol matrix at 2 wt% and 6 wt% BC
loading. Thus, the author has concluded that BC can be alternative filler that used to
replace high cost carbon nanotubes and limited performance graphene filler in
manufacturing electrical utilization such as electrical type sensors.
2.4 Thermoplastic
2.4.1 Introduction to Thermoplastic
Thermoplastic is made up from intermolecular linked polymers with Van der Waals
forces above transition temperature to form polymer with linear or branching
structure on its backbone. The properties of thermoplastic are depending on the
molecular arrangements and the degree of interaction between molecules in the
polymer chains. Therefore, thermoplastic is classified into two categories based on

22
the crystallinity concentration is its structure, which can be divided into amorphous
and crystalline structure (Adhesiveandglue.com, 2015). In addition, thermoplastic is
able to be melted and reformed into various shape upon cooling from the viscous
phase; unlike thermoset, which is which is hard and irreversibly heating polymer
(OpenLearn, 2011). As illustrated in Figure 2.6, molecules linked to one another to
form long polymer chain without cross-linkage in between.
Figure 2.6: Linkage of Polymer in Thermoplastic (Adhesiveandglue.com, 2015)
Generally, polymers dominant with amorphous in structure are hard, brittle
and stiff at high temperature. The random arrangement of polymer chains can
indirectly affects the elasticity of thermoplastic materials (Adhesiveandglue.com,
2015). Besides, amorphous polymer is also termed as „glassy‟ when it is below the
glass transition temperature with disordered polymer chains arrangement. On the
other hand, when amorphous polymers are above the glass-transition temperature but
below the melting temperature, it becomes rubbery and possesses good elongation
properties with low loading. This causes most of the amorphous polymers are used
below the transition temperature.
When amorphous polymers are heated above the melting temperature, it
becomes viscous in behaviour; however, the viscosity decreases with the increasing
temperature and rate of strain and gives visco-elastic behaviour (Furness, 2014). Due
to the random polymer chains arrangement, amorphous thermoplastics exhibit poor
fatigue and wear resistance. Besides, the random polymer chain structure causes
chemicals to penetrate in the structure, thereby; it has poor chemical resistance

23
properties. Polyvinyl chloride, polystyrene and polycarbonate are the examples of
amorphous thermoplastics (Psgtech.edu, 2015).
Apart from that, thermoplastic materials with high crystallinity ranging from
20 - 90% are known as semi-crystalline polymers (Xanthos, 2010). Unlike
amorphous structure, semi-crystalline is compact and has better polymer chain
alignment in its structure and it is normally processed above the melting temperature.
The well aligned polymer chains in the crystalline region help in improving the
strength of thermoplastic, enable it to withstand high mechanical loading (Furness,
2014). Semi-crystalline thermoplastic is opaque with good fatigue toughness and
wear resistance. However, semi-crystalline polymer has low elasticity compared to
amorphous polymer due to the crystalline region in its structure. Examples of semi-
crystalline thermoplastics are PE, PP and polyamide (PA) (Psgtech.edu, 2015).
Figure 2.7 illustrates the amorphous and semi-crystalline structure of
thermoplastic. As illustrated in figure, amorphous thermoplastic has random polymer
chains arrangement which provides loosen polymer structure whereas semi-
crystalline structure has well-aligned polymer chains which is compact and tightly
packed structure compared to amorphous thermoplastics.
Figure 2.7: The Amorphous and Semi-Crystalline Structure in Thermoplastic
(Polymerexpert.biz, 2015)

24
Extrusion and injection moulding are the most widely used method for
processing thermoplastic into useful applications. In extrusion process, the
thermoplastic resins are being melted and extruded in a barrel with uniform cross-
sectional area through a die to form a long profile thermoplastic product. Whereas in
injection moulding, thermoplastics resins are firstly to be melted and flow under
pressure to fill in the mould through die to form desired shape at the end of the
chamber. When the mould filled with hot melted thermoplastic is hydraulically
cooled, the thermoplastics product will be ejected from the mould and further
process to the final product (Vichem, 2015).
2.4.2 Filler in Thermoplastic
Filler is the inorganic or organic materials that are added into polymer not only to
strengthen the composite, but also to reduce the product cost. Non-reinforcing filler
acts as extenders that improve the viscoelasticity of composite but does not exhibit
reinforcing effect on the composite. Calcium carbonate and clay are the examples of
non-reinforcing fillers which help to impart composite‟s colour as well as to increase
the viscosity of composite. On the other hand, reinforcing filler improves the
performance of composites by increasing the fracture resistance and stiffness of
composite. The most commonly used reinforcing fillers are carbon black and silica,
which enhances the mechanical properties of composites by improving the matrix of
polymer composites (Visakh et al., 2013).
In addition, organic filler are materials that contain cellulosics, lignins,
proteins and synthetics; whereas inorganic fillers are materials that contain
carbonates, oxides, silicates, sulphates and carbon (Shenoy, 1999). Calcium
carbonate and aluminium trihydrate are the examples of inorganic fillers which are
commonly used in industry due to their ability in enhancing composites‟ strength,
abundant and cheap properties. On the other hand, the low specific gravity and with
lignins and cellulosics shell flour, wood flour and char are the examples of organic
fillers used in polymer (Carraher and Sperling, 1983).

25
Generally, fillers are acted as additives to moderately increase the polymer
modulus and improve mechanical properties of polymer. Besides, filler is an inert
material that dispersed physically in the polymer matrix without affecting the
molecular structure of composites. The major advantageous of filler is it lowers the
cost of materials required by reducing the usage of polymer while giving better
polymer modulus. In addition, the properties of polymer can be altered by the types
of filler used (Xanthos, 2010).
Apart from lowering the cost, fillers also reduce strain and increase stiffness
of composites when it pinches to the polymer matrix. The effectiveness of filler in
reinforcing polymer is characterized by the aspect ratio of fillers. High surface area
ratio of filler to its volume will enhance the reinforcement effectiveness of fillers in
composite. Moreover, the interfacial bond between fillers and polymer in the
interfacial region is the key of improving mechanical strength in the composites. The
strong adhesion by Van der Waals force between fillers and polymer causes the
formation of strong chemical bond within the composite. Consequently, it reinforces
the interaction forces between polymer and filler, thus, improves the reinforcing
effects (Xanthos, 2010).
2.4.3 Common Fillers in Thermoplastic
Carbon black, silica, calcium carbonate (CaCO3) and mineral clays such as china
clay, talc and kaolin are among the common used fillers in polymer. The dark
coloured filler, carbon black is commonly being compounded as reinforcing,
colouring and opacifying agent in thermoplastics. The planal hexagonal nets of
carbon atoms in carbon black makes it crystalline in nature and gives it chemically
and physically strong properties which is suitable to be used as reinforcing agents in
thermoplastics. Besides reinforce the mechanical properties of thermoplastic end
products, carbon black is able to increase the thermal conductivity and stabilize
against ultraviolet light or ultraviolet protection. However, the drawbacks of using
carbon black fillers are unable to change the end product‟s colour and it is expensive
in cost (Katz and Milewski, 1987).

26
The synthetic silica is one of the common used filler in thermoplastic. The
amorphous silicon dioxide structure of SiO2 causes it to be wide range of diameter
particle sizes (Drobny, 2007). Due to large particles in size and may form aggregated
structure between hydrogen bond and silanol groups surface, therefore, it is a well-
known non-reinforcing filler and good coupling agent in thermoplastics (Thomas,
2012). The main function of SiO2 filler in thermoplastics are to reduce the shrinkage
and cracking in thermoplastic product, improve the dimensional stability of
thermoplastic under heat and prevent film blocking in the thermoplastic matrix
(Drobny, 2007). The applications of SiO2 filled thermoplastics are to be used as
thickening in paints and coatings, and also anti-block agent in packaging films
(Thomas, 2012).
CaCO3 is simple to reduce into a specific particle size to compatible with the
polymer resins in compounding (Ktron, 2014). CaCO3 is widely used as filler in the
applications of PVC, PP and PE. The reasons for it to be popular among other fillers
are mainly due to its abundant and low cost properties. Besides giving economy,
CaCO3 also exhibits mechanical modification properties in polymer (Xanthos, 2010).
Furthermore, CaCO3 has relatively high refractive index which provides good optical
properties compared to other filler and this makes it suitable to be an opacifying
pigments in polymer. In addition, CaCO3 filler also helps in improving both impact
strength and stiffness of polymer when the filler size is compatible to the resins in
compounding (Ktron, 2014). However, CaCO3 is soft with poor abrasion resistance
and poor stability in acidic conditions due to its alkalinity (Ciullo, 1996).
Generally, the fine granulometry of fillers enables it to be well distributed in
polymer matrix when it is introducing into polymeric material. As illustrated in
Figure 2.8, CaCO3 is presented in irregular shape with coarse granulometry.
Therefore, this causes agglomeration of CaCO3 particles in polymer matrix during
compounding which can be seen in Figure 2.9. Moreover, Figure 2.10 illustrates the
poor interaction of CaCO3 fillers in polymeric matrix. The agglomeration of fillers in
polymer matrix lead to poor interaction of filler with the polymer will reduce the
strength and cause early deformation of polymeric products (Sant'Anna et al., 2008).
As the CaCO3 filler has low interaction and poor mechanical adhesion to the

27
polymer matrix, therefore, it needs to be sieved into defined particles size before
using as fillers in polymer.
Figure 2.8: Structure of Commercial Calcium Carbonate under Microscopy
(Sant'Anna et al., 2008)
Figure 2.9: Polyurethane Foam Filled with Calcium Carbonate Filler
(Sant'Anna et al., 2008)

28
Figure 2.10: Interaction of Calcium Carbonate Filler in Polyurethane Foam
Matrix (Sant'Anna et al., 2008)
2.4.4 Current Development of Thermoplastic
Thermoplastic starch has currently been developed due to its biodegradability. Starch
is a low cost material produced from maize, wheat, rice and potato (Xie et al., 2014).
Large scale of starch is transformed into polymeric state with entangled
polysaccharide chains of amylase and amylopectin through structural degradation of
starch at low temperature with sufficient quantity of plasticizer such as glycerol and
water (Saiah et al., 2012).
Starch is made up from spherical or oval granules in different sizes with
smooth surface, low volume of porosity and free from crack properties. The
hydrogen bonding between starch molecules destruct during plasticization, while
new hydrogen bonds between plasticizer and starch molecules are formed
simultaneously (Saiah et al., 2012). Thereby, thermoplastic starch is produced as
film through extrusion process. The semi-crystalline structure of extruded
thermoplastic starch under microscopy is illustrated in Figure 2.11.

29
Figure 2.11: Scanning Electron Microscopy of Extruded Polyethylene Starch
Film (Saiah, Gattin and Sreekumar, 2012)
The relatively good enhancement properties such as good barrier and thermal
properties of having starch in thermoplastic has widen its application in market such
as bags, flower arrangement accessories, packaging film, planting pots and tapes
(Smith, 2005). Apart from biodegradable and low costing required characteristics,
the reasons for starch to be used in thermoplastics are also due to its abundance and
easily available properties. However, there are few limitations of thermoplastic
starch: water soluble, poor resistance and mechanical strength compared to other
thermoplastic (Cyras et al., 2008). The poor water resistance properties of
thermoplastic starch are due to the hydroxyl groups in the structure causes swelling
of starch when it is exposed to water (Mohammadi Nafchi et al., 2013).
Even though thermoplastic starch can be widely used in various products,
however, the improvement on water resistance and mechanical properties still need
to be explored and researched. One of the ways to overcome the weakness of
thermoplastic starch are by modifying and blending the starch with other
thermoplastic polymers to provide superior mechanical properties to it (Saiah et al.,
2012). As thermoplastic starch is a type of bio-plastic, which is biodegradable plastic,
hence, more studies on the thermoplastic starch are currently being carried out in
order to widen its application to niche market and maintain a green environment (Xie
et al., 2014).

30
Apart from that, HDPE composites reinforced with hybrid inorganic fillers is
one of the current thermoplastic developments that use the combination of talc and
glass fiber. Besides, the main objectives of using the combined talc and glass fiber in
HDPE are to make low cost composite with the aids of talc and mechanical
properties enhancement on HDPE with the reinforcement of glass fibers. The
combined talc and glass fiber and blended with HDPE to form HDPE composites. In
HDPE composites, glass fibers are bounded nicely and arranged perpendicularly to
the HDPE matrix whereas talc is bounded in parallel and perpendicularly to the
HDPE composites and form little bonding within the fracture surface which is
illustrated in Figure 2.12. Hence, HDPE composites reinforced with combined talc
and glass fibers improves the mechanical properties and modulus of HDPE
composites due to less available void in HDPE matrix. Furthermore, it also performs
good thermal expansion by reducing the deformation or dimension changing of
composites when exposed to heat (Huang et al., 2013).
Figure 2.12: Morphology of Fracture Surface HDPE Composites Reinforced
with Combined Talc and Glass Fibers Filler (Huang et al., 2013)
However, the mechanical properties of combined talc and glass fibers
reinforced HDPE composites are varied with the proportions of talc and glass fibers
in filler mixture. Large portion of glass fibers in mixture will lead to better
mechanical performance in composites whereas increase in talc proportion will
reduce the performance of composites but increase the recyclability and reduce cost
of composites (Huang et al., 2013).

CHAPTER 3
MATERIALS AND METHODOLOGY
3.1 Introduction
This chapter includes the details of raw materials being used for the preparation of
HDPE/BC composite, source of materials and composite preparation method
specified with the parameters. Besides, this chapter also includes the preparation of
BC, HDPE/BC composite, characterization of BC and characterization and testing of
HDPE/BC composites.
3.2 Raw Materials
3.2.1 High Density Polyethylene (HDPE)
The HDPE resins used were supplied by Lotte Chemical Titan (M) Sdn. Bhd.
3.2.2 Palm Oil Sludge (Precursor of Biochar)
The palm oil sludge used to convert biomass was obtained from Tian Shiang Oil
Mill (Air Kuning) Sdn. Bhd., which is located in Air Kuning, Perak, Malaysia.

32
Palm Oil Sludge
Hot Biochar
Dried Sludge
Cooled Biochar
Fine Biochar Biochar
3.3 Biochar Preparation
Firstly, the fresh palm oil sludge obtained was dried in oven at 110 °C for 24 hours
to remove moisture. Then, the dried sludge was undergoing pyrolysis at 400 °C for
117 min with 27 °C/min heating rate in a carbonization unit. BC was then being
crushed and grinded into less than 45 μm particle size. The preparation of BC is
showed as in Figure 3.1.
Figure 3.1: Flowchart of Biochar Preparation
Pyrolysis
Temperature: 400 °C
Heating Rate: 27 °C/ min
Holding Time: 117 min
Drying
Temperature: 110 °C
Time: 24 hours
Cooling
Time: 4 hours Crushing
and
Grinding
Characterization
- FTIR
- Particle Size Analysis
- TGA
- SEM

33
3.4 HDPE/Biochar Composite Preparation
HDPE resins and BC were pre-dried in vacuum oven for 24 hours at 80 oC.
HDPE/BC composites were produced by melt mixing method using rheometer
Brabender® Plastograph® EC 815652. The composite mixing was carried out based
on the compounding formulation as in Table 3.1 at melting temperature of HDPE,
160 °C for 8 min at 60 rpm rotation.
Table 3.1: Compounding Formulation of HDPE/BC Composites
Compound HDPE (wt%) Biochar (wt%)
1 100.0 0
2 99.0 1.0
3 97.5 2.5
4 95.0 5.0
5 90.0 10.0
The graph of processing torque of the composites was obtained from the
Brabender internal mixer. The HDPE/BC composites were pressed into sheets using
hydraulic hot and cold press machine GT-7014-A30C at 170 °C. The lumps of
composites were preheated for 5 min and pressed for 3 min, followed by 2 min of
cooling. The preparation of HDPE/BC composites is illustrated as in Figure 3.2.

34
HDPE/BC
Compound
HDPE/BC
Composites
Biochar
Processing:
-Torque
- DSC
Properties:
- Tensile
- Water Uptake
- Toluene Swelling Resistance
-TGA
Proving:
- SEM
- FTIR
Figure 3.2: Flowchart of HDPE/BC Composite Preparation
Blending with HDPE in Brabender
Internal Mixer
Temperature: 160 °C
Mixing Time: 8 min
Mixing Speed: 60 rpm
BC Composition: 0, 1, 2.5, 5 and 10 wt%
Hot and Cold Press
Temperature: 170 °C
Preheat Time: 5 min
Pressed Time: 3 min
Cooling Time: 2 min
Characterization and Testing

35
3.5 Characterization of Biochar
3.5.1 Particle Size Analysis (PSA)
Particle size analysis (PSA) was a size indication of a particles presented in
proportions from the total amount of 100 % in the particle sample group. In PSA test,
volume, area length and amount were used as the standard dimension to determine
particle amount (Shimadzu Corporation, 2015). The cumulative distribution of
particles passing the sieve expresses the percentage of the particles amount from
specific particles sizes or below. Mastersizer 2000, Hydro 2000 MU (A) was used to
analyse the particle size distribution of BC in this research.
3.5.2 Fourier Transform Infrared Spectroscopy (FTIR)
FTIR was carried out by using Perkin Elmer Spectrum ex1 to identify the types of
chemical bonds and functional groups in BC. BC was mixed homogeneously with
KBr and pressed into pellet form for FTIR test. The analysis was carried out to
determine the absorption band with a wavelength from 4000 - 400 cm-1
with 4 scans
at a resolution of 4 cm-1
.
3.5.3 Thermogravimetric Analysis (TGA)
TGA was performed to determine the decomposition temperature and thus, the
thermal stability BC. Measurements were carried out under a nitrogen atmosphere
using a heating rate of 20°C/min from 30 - 600 °C using Mettler Toledo TGA
SDTA851 E.
36
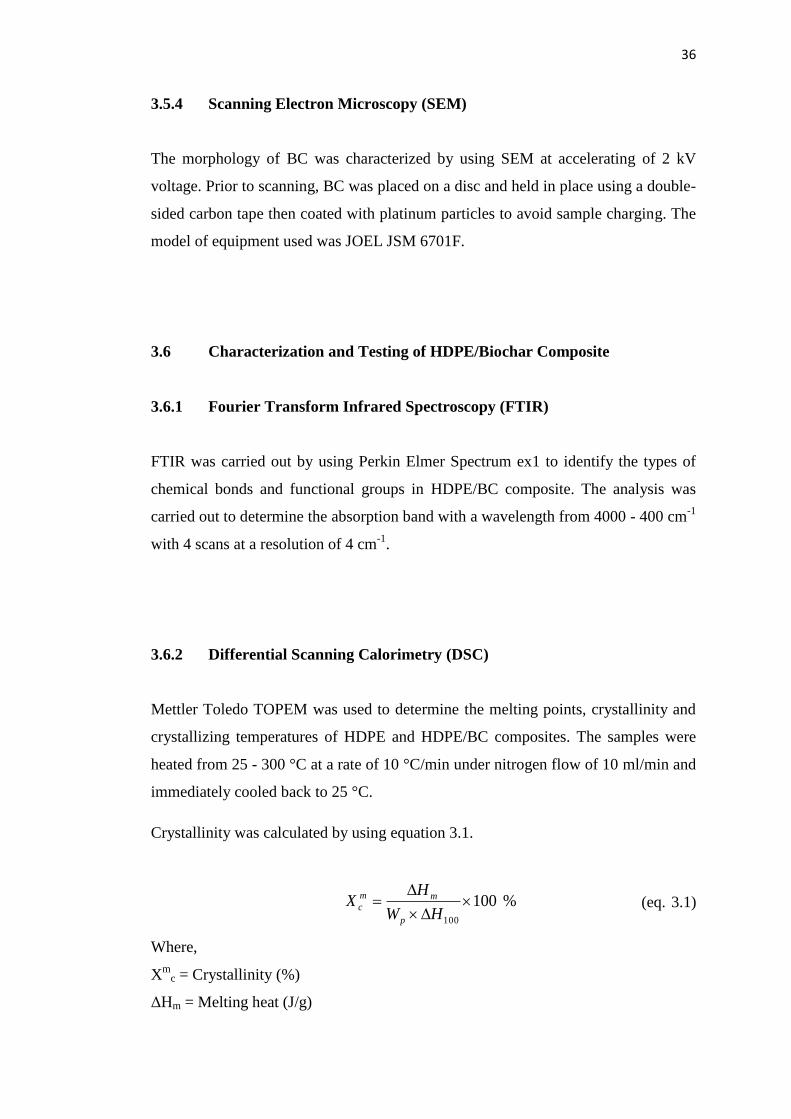
3.5.4 Scanning Electron Microscopy (SEM)
The morphology of BC was characterized by using SEM at accelerating of 2 kV
voltage. Prior to scanning, BC was placed on a disc and held in place using a double-
sided carbon tape then coated with platinum particles to avoid sample charging. The
model of equipment used was JOEL JSM 6701F.
3.6 Characterization and Testing of HDPE/Biochar Composite
3.6.1 Fourier Transform Infrared Spectroscopy (FTIR)
FTIR was carried out by using Perkin Elmer Spectrum ex1 to identify the types of
chemical bonds and functional groups in HDPE/BC composite. The analysis was
carried out to determine the absorption band with a wavelength from 4000 - 400 cm-1
with 4 scans at a resolution of 4 cm-1
.
3.6.2 Differential Scanning Calorimetry (DSC)
Mettler Toledo TOPEM was used to determine the melting points, crystallinity and
crystallizing temperatures of HDPE and HDPE/BC composites. The samples were
heated from 25 - 300 °C at a rate of 10 °C/min under nitrogen flow of 10 ml/min and
immediately cooled back to 25 °C.
Crystallinity was calculated by using equation 3.1.
%100
100
HW
HX
p
mm
c (eq. 3.1)
Where,
Xm
c = Crystallinity (%)
ΔHm = Melting heat (J/g)

37
ΔH100 = Melting heat for 100 % crystalline polyethylene, 293 J/g (Ibeh, 2011)
Wp = Weight fraction of polymer in sample
3.6.3 Scanning Electron Microscopy (SEM)
The morphology of HDPE/BC composites was characterized by using SEM at
accelerating voltage of 2kV. The model of equipment used was S-3400N. Prior to
scanning, HDPE/BC composites were placed on a disc and held in place using a
double-sided carbon tape then coated with platinum particles to avoid sample
charging.
3.6.4 Water Uptake and Toluene Swelling Resistance
HDPE/BC composites specimens with the dimensions of 30 x 5 x 2 mm were cut
from the compression moulded sheet and the swelling test was carried out using
distilled water and toluene as a solvent in accordance with ASTM D471-79. The test
pieces were weighed using an electronic balance and initial mass (Mi) of the
specimens in gram were recorded. The test pieces were then immersed in toluene for
72 hours and conditioned at 25 °C, in dark place. After 72 hours, the test pieces were
weighed again and the mass of the specimens after immersion (Ms) in distilled water
and toluene were recorded. Water and solvent resistance of HDPE/BC composite
was evaluated from the swelling percentage of composite in distilled water and
toluene. The lower swelling percentage indicates the higher water and solvent
resistance of HDPE/BC composite. Swelling percentage was calculated based on
equation 3.2.
Swelling Percentage = [(Ms – Mi) / Mi] x 100 % (eq. 3.2)

38
3.6.5 Tensile Test
Tensile test was carried out according to ASTM D638 under ambient condition to
measure the elastic modulus, ultimate tensile strength and elongation at break of
HDPE/BC composites. The test was conducted by using Tinius Olsen H10KS-0748
with a load cell of 450 N, at a crosshead speed of 50 mm/min.
3.6.6 Thermogravimetric Analysis (TGA)
TGA was performed to determine the decomposition temperature and thus, the
thermal stability HDPE/BC composites. Measurements were carried out under a
nitrogen atmosphere using a heating rate of 20 °C/min from 30 - 600 °C using
Mettler Toledo TGA SDTA851 E.

CHAPTER 4
RESULTS AND DISCUSSION
4.1 Introduction
This chapter includes the results and discussion on the characterization and
evaluation on HDPE/BC composite as compared to BC and unfilled HDPE. In
addition, results for characterization and testing such as particle size analysis,
processing torque, differential scanning calorimetry (DSC), fourier transform
infrared (FTIR), water uptake and toluene swelling test, thermo gravimetric analysis
(TGA), tensile test and scanning electron microscopy (SEM) were interpreted with
respect to the past research works done. Furthermore, all characterization and testing
were conducted based on the ASTM standards to ensure the controlled testing
condition. Results and data obtained from testing were tabulated and summarized in
this chapter as the support for the explanation and discussion on the tests performed.
4.2 Characterization of Biochar
4.2.1 Particle Size Analysis (PSA)
Particle size analysis was performed on BC particles to determine the mean particle
diameter, specific surface area and the particle size distribution which is crucial in
studying the effect of BC as potential filler in HDPE. Figure 4.1 illustrates the
particle size distribution of BC. Based on the data obtained from particle size
analysis, the particle size of BC ranges from 0.2245 - 148.2635 μm. However,

40
the BC particle used in composite preparation was limited between 0.2245 - 45 μm
by sieving. This is to ease and control the processing of HDPE/BC composites and to
reduce the tendency of agglomeration of larger BC particles at higher BC loading.
Figure 4.1: Particle Size Distribution of BC
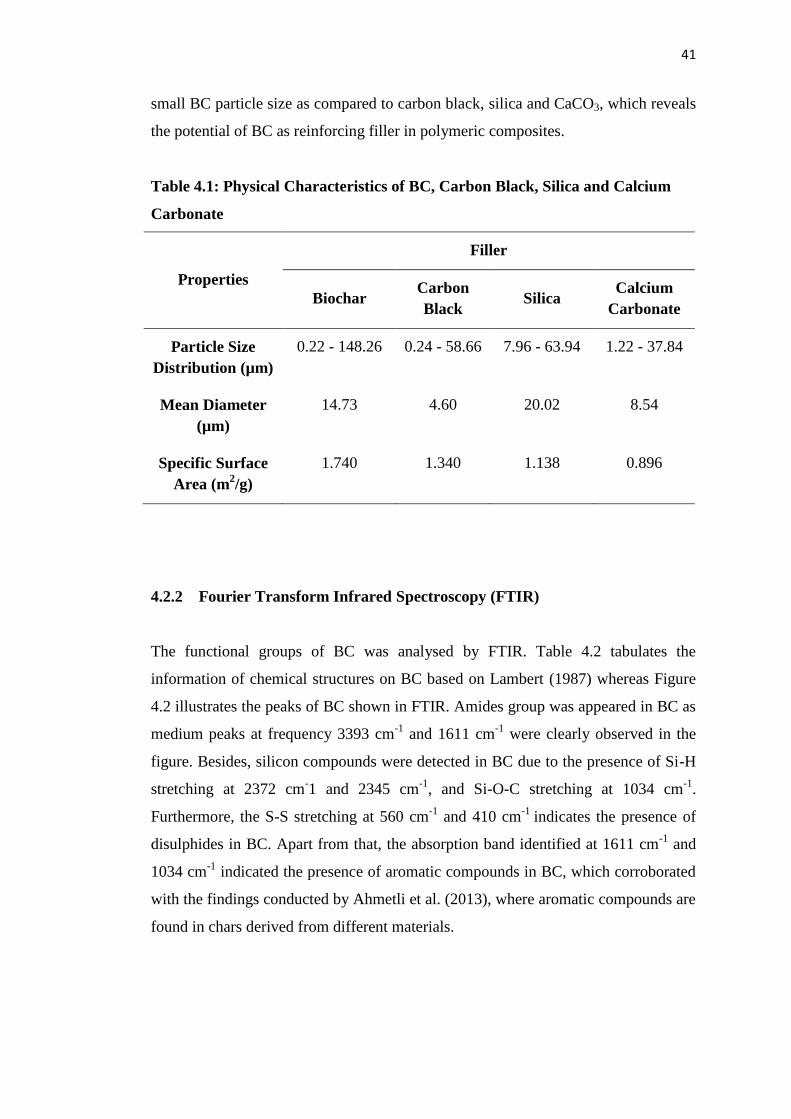
Table 4.1 tabulates the comparisons between the physical characteristics of
BC as compared with carbon black, silica and CaCO3 through particle size analysis.
BC has broad particle size distribution as compared to commercial fillers carbon
black, silica and CaCO3. Broad particle size distribution may contribute to more
diversity in application of BC which requires different particle size range.
Furthermore, across the broad particle size distribution, the mean diameter of BC is
14.73 μm, whereas the mean diameter of carbon black, silica and CaCO3 are 4.60 μm,
20.02 μm and 8.54 μm respectively.
Comparatively, BC has the largest specific surface area of 1.740 m2/g,
whereas carbon black, silica and CaCO3 having specific surface area of 1.340 m2/g,
1.138 m2/g and 0.896 m
2/g. Specific surface area represents the surface area of filler
exposed in the unit weight of the filler which is responsible for any sort of
interaction with polymer matrix. According to Rothon (2002), the specific surface
area of filler is closely related to the density, shape and particle size distribution of
fillers. Thus, high specific surface area indicates high porosity of BC and leads to
41
small BC particle size as compared to carbon black, silica and CaCO3, which reveals
the potential of BC as reinforcing filler in polymeric composites.
Table 4.1: Physical Characteristics of BC, Carbon Black, Silica and Calcium
Carbonate
Properties
Filler
Biochar Carbon
Black Silica
Calcium
Carbonate
Particle Size
Distribution (µm)
0.22 - 148.26 0.24 - 58.66 7.96 - 63.94 1.22 - 37.84
Mean Diameter
(µm)
14.73 4.60 20.02 8.54
Specific Surface
Area (m2/g)
1.740 1.340 1.138 0.896
4.2.2 Fourier Transform Infrared Spectroscopy (FTIR)
The functional groups of BC was analysed by FTIR. Table 4.2 tabulates the
information of chemical structures on BC based on Lambert (1987) whereas Figure
4.2 illustrates the peaks of BC shown in FTIR. Amides group was appeared in BC as
medium peaks at frequency 3393 cm-1
and 1611 cm-1
were clearly observed in the
figure. Besides, silicon compounds were detected in BC due to the presence of Si-H
stretching at 2372 cm-1 and 2345 cm
-1, and Si-O-C stretching at 1034 cm
-1.
Furthermore, the S-S stretching at 560 cm-1
and 410 cm-1
indicates the presence of
disulphides in BC. Apart from that, the absorption band identified at 1611 cm-1
and
1034 cm-1
indicated the presence of aromatic compounds in BC, which corroborated
with the findings conducted by Ahmetli et al. (2013), where aromatic compounds are
found in chars derived from different materials.

42
Table 4.2: FTIR Analysis of BC (Stuart, 2004)
Frequency (cm-1
) Peak Assignments
3400 - 3380 Primary amides group with N-H
stretching
2400 - 2000 Silicon compounds with Si-H stretching
1650 - 1610 Primary amides group with N-H
deformation
1620 - 1580 Aromatic compounds with C=C
stretching
1100 - 1030 Silicon compounds with Si-O-C
stretching
1045 - 1015 Aromatic compounds with CH in-plane
bending
550 - 430 Disulphides group with S-S stretch
Figure 4.2: FTIR Spectra of BC
3393
2372
1611
1034
777
560
471

43
4.2.3 Thermogravimetric Analysis (TGA)
The thermal degradability of BC was identified by using TGA. From the data
obtained, BC possessed high thermal stability as it did not fully decompose upon
heating up from 30 - 600 °C. Hence, BC exhibited high thermal degradation
temperature or high thermal stabilizing effect. In addition, the thermal degradation of
BC happened only in one stage. As tabulated in Table 4.3, the remaining solid
residue of BC after heating to 600 °C was 84.23 %, which indicated only 15.77 % of
BC was burnt off from the heating. Thus, the high thermal stabilizing effect of BC
has the tendency to increase the thermal stability of composite (Das et al., 2016),
whereas in this research, BC is able to increase the thermal stability of HDPE/BC
composite.
Table 4.3: Thermogravimetric analysis of BC
BC loading (wt%) Maximum weight
loss (%) Residue (%)
Stabilization
(%)
Raw BC 15.77 84.23 115.86
4.2.4 Scanning Electron Microscopy (SEM)
The morphology of BC was analysed with SEM. As illustrated in Figure 4.3, BC
exhibit less interaction between the particles and tends to appear as an individual
particles with broad particle size distribution. The individual and broad particle size
distribution of BC provides good dispersion in HDPE matrix. As reported by
Ahmetli et al. (2013), char particles distribute well in the matrix and provide good
interaction between char and the polymer matrix. Besides, cracks also can be
observed clearly on the surface of BC particles under SEM. Crack on the BC surface
is not only allowed more penetration of HDPE to BC particles, but also enhanced
interlocking between HDPE and BC particles. In addition, the porous structure of
BC also has been analysed and shown in Figure 4.3. The highly porous structure of

44
BC provides good interlocking between HDPE and BC, thus, has tendency to
improve tensile strength of HDPE/BC composite.
Figure 4.3: SEM Micrograph of BC at 300x Magnification
4.3 Characterization and Properties of HDPE/BC Composite
4.3.1 Processing Properties
The melt processing characteristic of HDPE/BC composites were studied through the
melt mixing of HDPE pellets and BC powder in a Brabender Internal Mixer. Torque
is not only indicates the viscosity of composites, but also shows the rheological
behavior such as stiffness and processability of the composites formed (Demir et al.,
2006). However, the torque rheometry obtained is highly depends on the operating
conditions which is the temperature, pressure and rotor speed, and the structural of
materials such as molecular weight and particle size (Silva et al., 2014).
In the mixing chamber, HDPE absorbs heat supplied and melts before being
mixed with BC particles. Therefore, the loading peak of torque is mainly depends on
the feeding amount of HDPE as the shearing action between HDPE pellets will
create high frictional force, which causes the shear stress to increase and eventually
results in high processing torque value. As illustrated in Figure 4.4, the loading
torque values reduces from 0 - 1 wt% BC loading, which levels up and increases
from 2.5 - 10 wt% BC loading. In comparison, it was observed that the HDPE/BC

45
composites have lower torque value compared to unfilled HDPE; however, the
torque value of 10 wt% BC is the highest loading torque among all BC loading as
well as unfilled HDPE.
Reducing in the feed amount of HDPE pellets signifies the reduction in
HDPE charged weight and also the melt viscosity within the mixing chamber.
Therefore, less frictional forces and shearing action between the molten HDPE and
BC powder has yielded low loading torque in the mixer from 0 - 1 wt% BC loading
in this case. Furthermore, particle size of BC is one of the factors that also influenced
the torque value of composites. When the BC loading is not significant, the BC with
small particle size will create insignificant frictional forces and yield low processing
torque value. However, when BC loading is increased, the frictional forces due to the
shearing action between HDPE/BC composites increased. As a consequence, torque
increased with the amount of BC, from 1 - 5 wt%. Apart from that, 10 wt% BC
loading has the highest torque as the BC added absorbed the heat required to prior
melt the HDPE pellets. Thus, more energy is needed to melt and blend HDPE
containing 10 wt% BC, eventually resulted in 10 wt% BC loading has the highest
processing torque.
Apart from that, the stabilization torque is the stable torque value which
indicates the homogeneous dispersion of filler in HDPE. The increment in
stabilization torque indicates the enhancement of interaction between BC and HDPE
matrix (Demir et al., 2006). Small size of BC manages to trickle in between the
HDPE matrix upon the mixing, melting and blending in the chamber. It was
observed that the stabilization torque of HDPE/BC composites gradually decreased
with the increased of BC loading, however, the stabilization torque for 1 - 10 wt%
did not exceed the unfilled HDPE. Thus, it can be postulated that the BC did not
stiffen the matrix formed, while more shears were used to disperse the small size BC
particles within the HDPE matrix and eventually yielding high stabilization torque
with the increasing BC loading.

46
Figure 4.4: Processing Torque of HDPE/BC Composites at Different BC
Loading
4.3.2 Differential Scanning Calorimetry (DSC)
Table 4.4 illustrates the DSC results obtained for HDPE and HDPE/BC composite
with increasing BC loading. The effect of BC loading on the melting temperature
(Tm), crystallizing temperature (Tc) and degree of crystallinity (Xm
c) was measured.
In comparison, the melting temperature has reduced 2 °C when the BC loading
increased from 0 - 10 wt%. However, from Table 4.4, it can be observed that there is
no significant change in overall melting and crystallizing temperature of all different
loading of HDPE/BC composites.
From literature, the pure HDPE has 293 J/g of enthalpy of crystallization.
The nucleating effect of BC helps the crystallization to occur sooner than pure
HDPE. According to Kanagaraj et al. (2008), the degree of crystallinity in
composites increased when there is nucleation site available for crystallization of
polymer to happen. As shown in Table 4.4, BC acts as the nucleation side for crystal
to grow, thus, degree of crystallinity of HDPE/BC composites increase at low BC
loading up to 2.5 wt% due to the fast growing of crystal structure on the nucleation
sides of BC.

47
However, when BC loading was increased to 5 wt% and 10 wt%, the degree
of crystallinity has reduced gradually. This phenomenon may due to the hindrance of
large amount of BC particles, which retards the growth of crystalline structure within
the HDPE/BC composites. The melting and crystallization of composites are mainly
depending on the polymer; in this case, HDPE is the main contributor for melting
and crystallization events to occur (Das et al., 2016). Therefore, when BC loading
increased to 5 wt% and 10 wt%, the degree of crystallinity in HDPE/BC composites
reduced.
Apart from that, the small particle size of BC has enhanced the dispersion of
BC within the polymer matrix. Thus, the well dispersed of BC in HDPE/BC
composites has hindered the growth of crystalline structure and caused the degree of
crystallinity of HDPE/BC composites to reduce at 5 wt% and 10 wt% BC loading.
The end result of DSC is in line with the finding of Das et al. (2016), where the
intensity of crystallinity decreased when the amount BC loading increased. On the
other hand, DSC also showed the similar trend as that of the torque. Addition of BC
into HDPE results in decreased stabilization torque, comparable Tm and Tc as well as
low reduction in degree of crystallinity which suggests the suitability of BC as filler
in HDPE. Addition of BC does not significantly affect the processing of HDPE thus
has a great potential for any HDPE applications.
Table 4.4: The Melting Temperature, Crystallizing Temperature and
Crystallinity Percentage of HDPE/BC Composites at Different BC Loading
Biochar Loading (%) Wp Tm (°C) Tc (°C) Xm
c (%)
0 1.000 132.41 114.85 62.20
1.0 0.990 132.11 117.26 67.80
2.5 0.975 131.92 115.82 65.84
5.0 0.950 130.60 114.22 62.85
10.0 0.900 130.09 114.52 45.97

48
4.3.3 Fourier Transform Infrared Spectroscopy (FTIR)
The functional groups of HDPE/BC composites at different BC loading were
analysed by FTIR. Table 4.5 tabulates the information of chemical structures on
unfilled HDPE whereas Table 4.6 tabulates the chemical structures of HDPE/BC
composites at different frequency based on Stuart (2004). FTIR analysis can be used
to detect any changes brought in HDPE with the addition of BC, indicated by the
appearance or disappearance of certain peaks of either HDPE or BC which signifies
the presence of chemical interaction between HDPE and BC. On the other hand,
FTIR spectra of unfilled HDPE, HDPE/1.0 BC and HDPE/2.5 BC were shown in
Figure 4.5. As illustrated in Figure 4.5, peaks at all different composition of
HDPE/BC composites possessed similar trend in FTIR spectra. In comparison,
HDPE possess high peaks intensity from 1800 - 2500 cm-1
and 850 - 1200 cm-1
frequency compared to HDPE containing 1 wt% and 10 wt% BC loading.
Furthermore, HDPE also possessed wider bands around 3000 cm-1
and 1460 cm-1
frequency than HDPE/1.0 BC and HDPE/10 BC composite. Most of the peaks
shown in IR spectra of unfilled HDPE indicate the presence of C-H bending of
alkane groups.
Apart from that, the peaks showed at different frequency ease the
determination of functional groups in HDPE/BC composites. For instance, the
absorption band at 2951 cm-1
was clearly detected due to the stretching of aliphatic
C-H bond. With the presence of peaks at a frequency of 1462 cm-1
, 1369 cm-1
and
1305 cm-1
, it was identified that the alkanes group were appeared in the HDPE/BC
composites. Furthermore, silicon compounds were also detected in HDPE/BC
composites as Si-H stretching at 2018 cm-1
, 2149 cm-1
and 2349 cm-1
are presented in
FTIR spectra along with the Si-O-C stretching at frequency around 1081 cm-1
,
whereas the presence of ethers group in HDPE/BC can also be determined through
the C-O-C stretching from 900 - 1300 cm-1
(Stuart, 2004).
According to Ahmetli et al. (2013), aromatic compounds are presented in
chars derived by different materials. Likewise, as reported by Das, Sarmah and
Bhattacharyya (2016), wastes such as sewage sludge and poultry litter derived BC
showed aromatic mode at 1600 cm-1
. In similar, aromatic compounds in HDPE/BC

49
composites were clearly identified due to the presence of absorption band of
aliphatic C-H stretching below 3000 cm-1
, along with the presence of overtones and
combination bands from 1700 - 2000 cm-1
, C=C stretching at 1430 - 1650 cm-1
, the
in-plane bending from 1000 - 1250 cm-1
, and out-of-plane bending at 690 - 900 cm-1
in the FTIR spectra.
In comparison, bands around frequency of 2950 cm-1
become narrow when
BC loading increased from 0 - 10 wt%, which shown in region A from Figure 4.6.
Same goes to the peak around 1462 cm-1
, region B has become narrower when the
BC loading increased. In addition, the intensity of peaks from 1800 - 2500 cm-1
decreased gradually when the levels of BC loading increased from 0 - 10 wt% as the
peaks at 1896 cm-1
, 2018 cm-1
and 2345 cm-1
were obviously reduced. Besides, the
peaks intensity at 1304 cm-1
and 1367 cm-1
also reduced when more BC was blended
with HDPE resins.
On the other hand, as shown in Figure 4.6, the peaks in region C were
merged and formed a broader peak, whereas peak at 721 cm-1
has split into two when
BC loading increased from 0 - 10 wt%. However, the growth of aromatic structure in
HDPE/BC composites was observed from Figure 4.5 when the levels of BC loading
increased. This result is corroborated with the findings of Ahmetli et al. (2013),
where composites possessed growing aromatic structure trend when chars are added.
Apart from that, peak at 1590 cm-1
became observable when BC loading increased.
The increased intensity in this peak indicates BC has induced the presence amines
group with N-H bending in HDPE/BC composite.
When BC amount increased, the proportion of each HDPE blend reduced. As
a consequence, the corresponding FTIR peaks have become less intensive and
broaden which can be seen from Figure 4.5. Addition of BC increased the
concentration of free radicals in composites (Das et al., 2016). Thus, inclusion high
amount of BC steadily reduced the intensity and broaden the peaks in HDPE/BC
composites. However, no new peaks have been observed in HDPE/BC composite as
compared to the raw HDPE and BC, which indicated that there is no chemical
reaction took place between BC and HDPE. Besides, any improvement in

50
mechanical properties is responsible due to any physical interaction such as
interlocking of HDPE chains at BC surface cracks and porosity.
Table 4.5: FTIR Analysis of Unfilled HDPE (Stuart, 2004)
Frequency (cm-1)
Peak Assignment
2951 Alkanes with methyl symmetric C-H
stretching
3000 - 2800 Aromatic compounds with aliphatic C-
H stretching
3000 - 2400 Carboxyl group with O-H stretching
2000 - 1700 Aromatic compounds with overtones
and combination bands
1650 - 1430 Aromatic compounds with C=C
stretching
1462 Alkanes group with methylene
scissoring
1369 Alkanes group with methyl symmetrical
C-H bending
1305 Alkanes group with methylene wagging
1250 - 1000 Aromatic compounds with C-H in-plane
bending
900 - 690 Aromatic compounds with C-H out-of-
plane bending
720 Alkanes group with methylene rocking
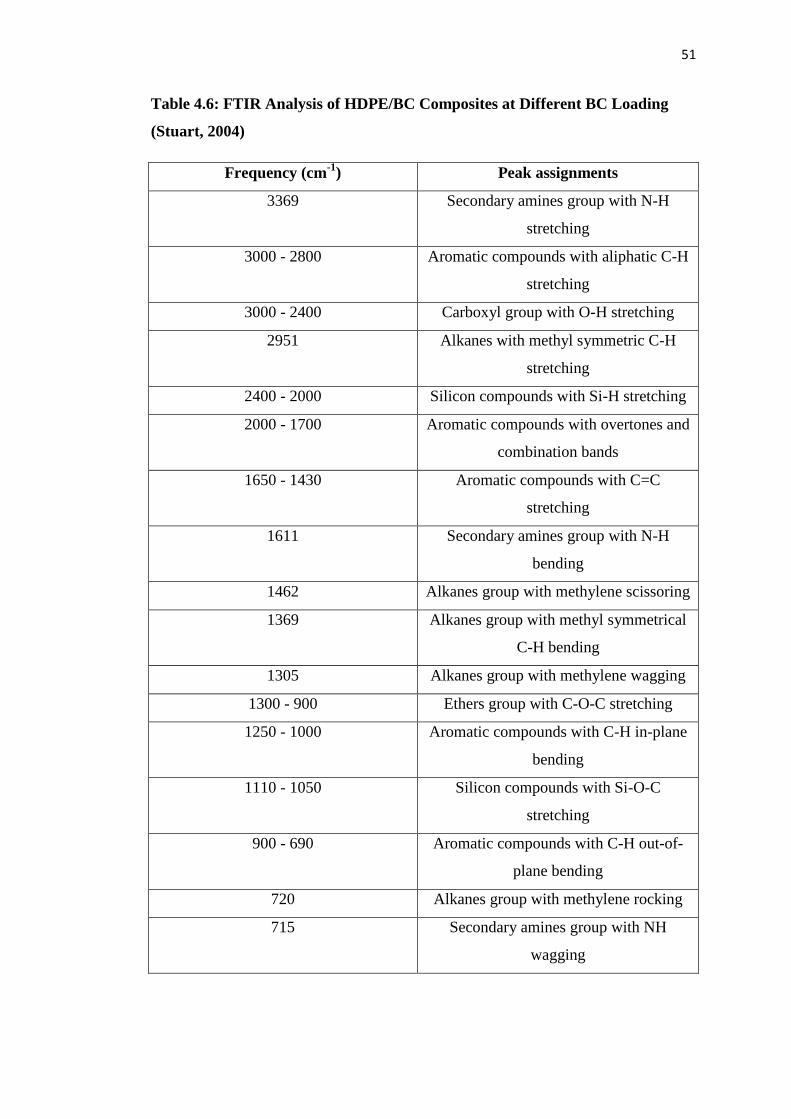
51
Table 4.6: FTIR Analysis of HDPE/BC Composites at Different BC Loading
(Stuart, 2004)
Frequency (cm-1
) Peak assignments
3369 Secondary amines group with N-H
stretching
3000 - 2800 Aromatic compounds with aliphatic C-H
stretching
3000 - 2400 Carboxyl group with O-H stretching
2951 Alkanes with methyl symmetric C-H
stretching
2400 - 2000 Silicon compounds with Si-H stretching
2000 - 1700 Aromatic compounds with overtones and
combination bands
1650 - 1430 Aromatic compounds with C=C
stretching
1611 Secondary amines group with N-H
bending
1462 Alkanes group with methylene scissoring
1369 Alkanes group with methyl symmetrical
C-H bending
1305 Alkanes group with methylene wagging
1300 - 900 Ethers group with C-O-C stretching
1250 - 1000 Aromatic compounds with C-H in-plane
bending
1110 - 1050 Silicon compounds with Si-O-C
stretching
900 - 690 Aromatic compounds with C-H out-of-
plane bending
720 Alkanes group with methylene rocking
715 Secondary amines group with NH
wagging

52
Figure 4.5: FTIR Spectra of Unfilled HDPE, HDPE/1.0 BC and HDPE/10 BC Composite

53
Figure 4.6: Comparison FTIR Spectra of HDPE/BC Composites at Different BC Loading
HDPE/1.0 BC
Unfilled HDPE
HDPE/2.5 BC
HDPE/5.0 BC
HDPE/10 BC

54
4.3.4 Swelling Test in Water and Toluene
Swelling test in water was conducted to study the water absorption capacity of
HDPE/BC composite as compared to HDPE. BC is organic filler that is highly
porous and capable of absorbing water. Thus, this testing is essential to determine
the stability of BC in HDPE at environment that contains moisture. According to
Ahmetli et al. (2013), aside leading to degeneration in mechanical and thermal
properties of material, moisture diffusivity will also affect the adhesion binding on
the composites. Water absorption is highly dependent on BC‟s surface properties
such as surface area exposed, degree of porosity, oxygenated group and carbon
content within BC (Behazin et al., 2015). In addition, difference in crystallinity
degree of polymer, polarity of polymer, types and amount of filler used can lead to
notable changes in the water sorption of composites (Ahmetli et al., 2013).
Figure 4.7 illustrates the water uptake of HDPE/BC composites at different
BC loading. It can be clearly observed that the swelling path of HDPE/BC
composites increased sharply at the beginning, then constant from 2.5 - 5 wt% BC
loading and increased again when BC loading increased to 10 wt%. When BC is
exposed to water, hydrogen bonding forms from the combination of oxygenated
groups within BC and water molecules, which causes it to possess high affinity
towards water molecules (Behazin et al., 2015). Thus, BC filler has acted as the
penetration part for water to be absorbed into HDPE/BC composites. Comparatively,
the hydrophobic and non-polar nature has caused HDPE matrix to have least affinity
to water. As a consequence, HDPE/BC composites with higher BC allows more
penetration parts for composites to form hydrogen bond with water compared to
unfilled HDPE and HDPE/BC composites with low BC loading. In overall, the water
absorption percentage of HDPE/BC composites was considered low as the highest
water sorption percentage was up to around 0.2 %. Hence, it can be said that addition
of BC shows negligible effect on water absorption capacity of HDPE.

55
Figure 4.7: Water Uptake Percentage of HDPE/BC Composites at Different BC
Loading
Apart from that, hydrophobic nature has caused HDPE to have strong affinity
towards non-polar solvent such as toluene. Thus, swelling test in toluene was
conducted to study the stability of HDPE/BC composite in toluene. As illustrated in
Figure 4.8 the chemical swelling percentage of HDPE/BC composites was declined
slowly when BC loading increased from 0 - 1 wt%. This situation happened was due
to the insignificant amount BC did not affect the HDPE matrix within the HDPE/BC
composites. However, when BC loading increased to 2.5 wt%, it can be observed
that the toluene swelling percentage started to decline more as increase in BC
amount indicates the reducing of HDPE matrix in composites. BC particles have
entrapped and adsorbed on the matrix surface of HDPE during the mixing process
(Gurovich et al., 2004). Thus, BC particles have reduced the mobility of matrix and
blocked the HDPE matrix from absorbing the solvent and resulted in decreased
toluene swelling percent. Besides, it can be observed from Figure 4.8 that 2.5 wt% of
BC loading was saturated point where the toluene swelling percent started to
stabilize by declining steadily. Therefore, it can be said that the toluene swelling
resistance of HDPE/BC composites improved when BC loading was increased as it
leads to more dispersion and interaction between BC and HDPE, and reduced the
solvent penetration path into HDPE matrix.

56
Figure 4.8: Toluene Swelling Percentage of HDPE/BC Composites at Different
BC Loading
4.3.5 Thermogravimetric Analysis (TGA)
Figure 4.9 illustrates the weight loss percentage of HDPE/BC composites at different
BC loadings. According to Zou et al. (2004), polymer will prior to oxidize before
filler (carbon nanotube) starts to degrade in the composites, whereas in this case,
HDPE will prior to oxidize before BC in HDPE/BC composites. As illustrated in
Figure 4.9, it can be observed that the all HDPE/BC composites possessed multiple
thermal degradation behavior, except raw BC. The initial thermal degradation
happened just after 160 °C whereas second thermal degradation occurred after
400 °C. The first decomposition of HDPE/BC composites is most likely contributed
by the HDPE, while the second decomposition is contributed by the degradation of
BC itself.

57
Figure 4.9: Thermo-Oxidation of HDPE/BC Composites at Different BC
Loading
In general, inclusion of BC into HDPE has shifted the thermal degradation
temperature of HDPE/BC composites to a higher value. As shown in Figure 4.9, it
can be observed that at the highest loading of BC (10 wt%) has the highest solid
remaining residue. The weight loss percentage of HDPE/BC composites at final
TGA temperature increased accordingly from unfilled HDPE > HDPE/1.0 BC >
HDPE/2.5 BC > HDPE/5.0 BC > HDPE/10 BC. On the other hand, the thermal
stability of raw BC is high (Das et al., 2015), thus, the inclusion of BC has enhanced
the overall thermal stability performance of composites (Das et al., 2016). Hence,
thermal stability enhancement of HDPE by BC addition is aligned with the findings
performed by Das et al. (2016).
Table 4.7 summaries the thermogravimetric analysis of HDPE/BC
composites. It can be observed that the thermal stabilizing effect of HDPE/BC
composites increased with the increasing BC loading. Initially, the stabilization
effect of HDPE/BC composites increased gradually from 1 - 2.5 wt% BC loading;
however, double increment of stabilization percentage was observed when BC
loading increased to 5 wt%, whereas at 10 wt% BC loading, the stabilization
percentage increased up to 9 %. Therefore, it can be said that the addition of BC in

58
HDPE improved the thermal stability of HDPE/BC composites, which is able to
become potential area for the future research.
According to Ismail and Mathialagan (2011), high thermal stability fillers
entrapped on the surface of polymer matrix will result in shifting the thermal
degradation temperature of composite to a high value. Thus, the addition of high
thermal stability BC into HDPE formed entrapments of BC in the interface of matrix,
which hindered the diffusions of volatile by-product and shifted the thermal
degradation temperature to higher value.
Besides, addition of BC into HDPE is not only increased the thermal stability
due to thermally stable BC; however, when BC loading increased, the path for
volatile by-product of combustion was blocked which resulted in self-extinguishing
of BC and caused no further combustion on HDPE/BC composite at high
temperature. Consequently, more char formation or residues at high temperature
when BC loading increased in HDPE/BC composite. Besides, high BC loading
containing in HDPE/BC composite may block the heat transfer and further
temperature rise on the lower or below materials of BC. Thus, it reduced the
tendency of the remaining solid residue from burning completely.
Table 4.7: Thermogravimetric Analysis of HDPE/BC Composites at Different
BC Loading
BC loading (wt%) Maximum weight
loss (%) Residue (%)
Stabilization
(%)
0.0 99.28 0.72 -
1.0 98.52 1.48 1.06
2.5 98.23 1.77 1.46
5.0 97.25 2.75 2.82
10.0 92.67 7.33 9.18
Raw BC 15.77 84.23 115.86

59
4.3.6 Tensile Test
Table 4.8 summarizes the ultimate tensile strengths, tensile modulus and elongations
at break of HDPE/BC composites at different BC loading. Ultimate tensile strength
or tensile strength refers to the maximum stress of composite able to withstand
before failure occurred when external force is exerted to pull the composite, whereas
E-modulus or elastic modulus is composite‟s stiffness measurement or the resistance
of composite to deform when stress is applied (Matinlinna, 2014). It can be observed
from Figure 4.10, that the ultimate tensile strength of HDPE/BC composites
increased gradually from 0 - 2.5 wt% BC loading (32.29 - 35.8 MPa), then,
decreased slowly from 2.5 - 10 wt% BC loading (35.8 - 32.51 MPa).
According to Das et al. (2016), the changes in mechanical properties of
composites is due to the intrinsic characteristics of BC that added into composites
have resulted the interaction between composites to be varied. Thus, in this case, the
addition of BC into HDPE caused HDPE/BC composites to exhibit different tensile
strengths as compared to unfilled HDPE. More BC added into HDPE also indicates
more carbon content in the HDPE/BC composite. The highly porous structure of BC
allowed more penetration of HDPE and provided more reinforcement as interlocking
between BC and HDPE increased. Hence, the tensile strength of HDPE/BC
composites increased when BC loading increased from 0 - 5 wt%.
However, tensile strength of HDPE/BC composites decreased when BC
loading was increased to 5 wt% and 10 wt%. This phenomenon may due to the large
amount of BC particles caused agglomeration of BC happened in HDPE/BC
composite. Therefore, when BC loading was too high, HDPE/BC composites were
not able to withstand high stress and yielded low ultimate tensile strength. Apart
from that, the addition of BC has improved the tensile modulus of HDPE/BC
composites from 1235.5 MPa at 0 wt% BC loading to 1320.5 MPa at 10 wt% BC
loading which can be noted in Figure 4.11. The infiltration of HDPE into BC has
yielded strong mechanical interlocking in HDPE/BC composites. Thus, both strength
and stiffness of HDPE/BC composites has significant increment when BC loading
increased. On the other hand, as presented in Figure 4.12, the percentage elongation
at break of HDPE/BC composites reduced sharply when BC loading increased.

60
Comparatively, unfilled has the highest elongation percentage (453.75 %) whereas
the highest 10 wt% BC loading has the lowest break percentage.
It can be said that although BC has provided necessary resistance for
HDPE/BC composite to overcome the deformation when stress was applied;
however, the improved strength and stiffness compromised with the ductility of
HDPE/BC composites. Therefore, the percentage of elongation before breaking
decreased when BC loading increased in HDPE/BC composites. The results obtained
from this research was similar to the past research conducted by Das et al. (2016),
where the tensile strength and moduli of composites filled with organic wastes
derived BC improved with increased BC loading, as well as the decrement in
elongation percentage when BC loading increased.
Table 4.8: Ultimate Tensile Strengths, Tensile Modulus and Elongations at
Break of HDPE/BC Composites at Different BC Loading
Parameters
BC loading
0 1.0 2.5 5.0 10.0
UTS (MPa) 32.29 32.86 35.80 33.33 32.51
Stdev 0.92 0.04 1.03 0.25 0.11
E-Mod (MPa) 1235.5 1256.5 1267.5 1276.5 1320.5
Stdev 41.72 53.03 37.48 4.95 4.95
Break % 453.75 231.65 145.15 80.75 21.06
Stdev 21.57 4.03 19.30 5.44 0.53

61
Figure 4.10: Ultimate Tensile Strength of HDPE/BC Composites at Different
BC Loading
Figure 4.11: Tensile Modulus of HDPE/BC Composites at Different BC Loading

62
Figure 4.12: Elongations at Break of HDPE/BC Composites at Different BC
Loading
4.3.7 Scanning Electron Microscopy (SEM)
The morphology of HDPE/BC composites at 0 wt%, 2.5 wt% and 10 wt% BC
loading were analyzed by SEM. Figure 4.13 (a) illustrates the morphology of
unfilled HDPE, whereas Figure 4.13 (b) and Figure 4.13 (c) shows the morphology
of HDPE/2.5 BC and HDPE/10 BC respectively. In contrast, unfilled HDPE has flat
and smoother surface compared to HDPE/2.5 BC and HDPE/10 BC. The smooth
surface of unfilled HDPE indicated the high tensile modulus and lowest tensile
strength on unfilled HDPE, which aligned with tensile test‟s results.
Besides, the smooth surface and less crack propagation path presented in the
morphology also indicated the flexibility of HDPE and allowed high elongation at
break of unfilled HDPE, which corroborated with the tensile test‟s results obtained.
Comparatively, HDPE/2.5 BC has relatively smooth surface and less matrix tearing
than HDPE/10BC. Apart from that, tearing of matrix can be clearly noted in Figure
4.13 (c). Matrix tearing happened due to the agglomeration of BC particles in matrix,
where the agglomeration of BC particles can be seen in Figure 4.15 (c). Thus, the
rough surface of HDPE/10 BC has the lowest elongation of break which is in line
with the results obtained from tensile test.

63
Figure 4.13: SEM Micrograph of Tensile Fracture of (a) Unfilled HDPE, (b)
HDPE/2.5 BC and (c) HDPE/10 BC at 100x Magnification
Figure 4.14 (a) shows also smooth surface with a lot of micro-bubbles
appeared in unfilled HDPE. The water moisture entrapped in HDPE caused the
presence of micro-voids in the morphology of unfilled HDPE. In addition, Figure
4.14 (b) shows that HDPE/2.5 BC has relatively smooth but rougher surface than
unfilled HDPE. Morphology with rougher surface at 2.5 wt% BC loading indicated
good interaction between HDPE and BC in the composite as more penetration of
HDPE matrix was allowed into the highly porous and cracked structure of BC.
Besides, no clustering of BC particles was observed in the morphology of 2.5 wt%
BC loading also represented good dispersion of BC particles in the HDPE/BC
composite matrix.

64
As illustrated in Figure 4.14 (b), air gap was presented in morphology at BC
loading 2.5 wt%. The presence of air gap indicated no chemical reaction between
HDPE and BC in the HDPE/BC composites, which also act as the propagation path
for cracking to occur when stress is applied. Therefore, rougher surface at 2.5 wt%
BC provided high strength in HDPE/BC composite by allowing more crack
propagation when stress was applied. The morphology analyzed for 2.5 wt% BC
loading was similar to the findings conducted by Ahmetli et al. (2013) and Ho et al.
(2015), where BC distributed uniformly in the matrix of HDPE/BC composite. On
the other hand, the morphology of HDPE/10 BC shows the tearing-out matrix with
clustering BC particles. Thus, it can be said that BC particles were not disperse well
in HDPE matrix as BC particles tend to agglomerate in the matrix, hence, less
interaction between HDPE and BC which resulted in low flexibility of HDPE/BC
composite and led to low elongation break at 10 wt% BC loading.
Figure 4.14: SEM Micrograph of Tensile Fracture (a) Unfilled HDPE, (b)
HDPE/2.5 BC and (c) HDPE/10 BC at 700x Magnification
Micro-voids
(a)
Air-
gaps
(b) (c)
Clustering BC particles
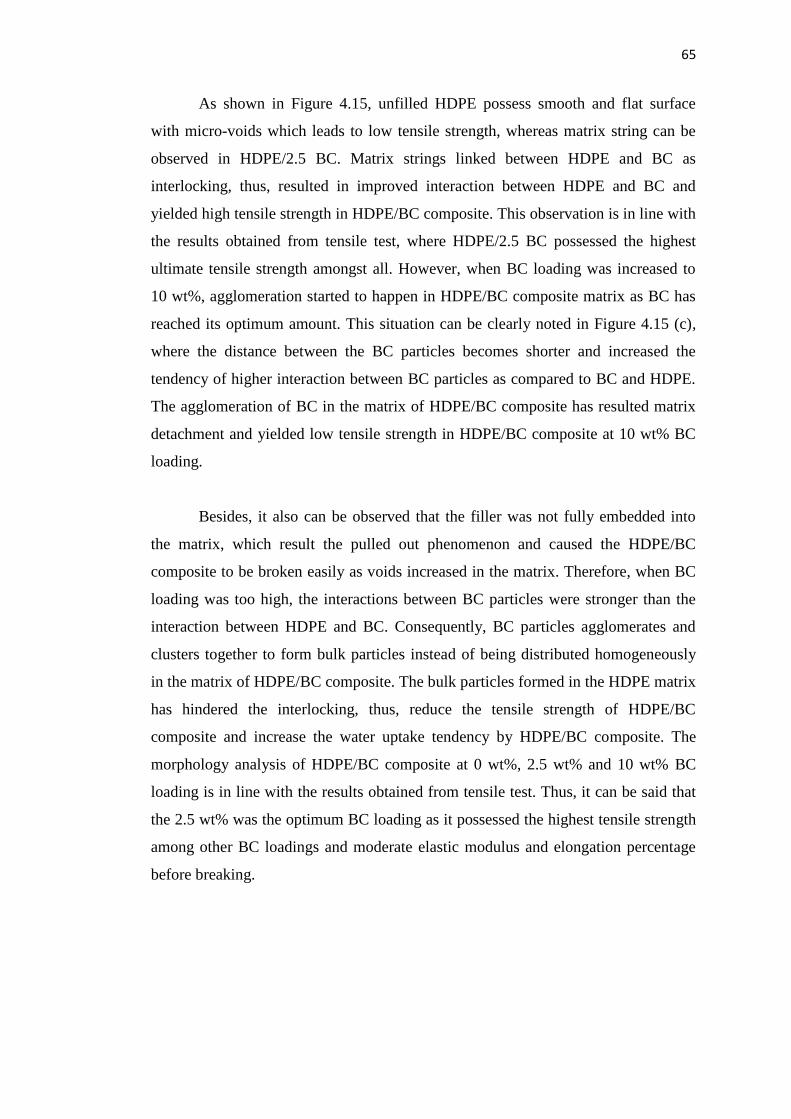
65
As shown in Figure 4.15, unfilled HDPE possess smooth and flat surface
with micro-voids which leads to low tensile strength, whereas matrix string can be
observed in HDPE/2.5 BC. Matrix strings linked between HDPE and BC as
interlocking, thus, resulted in improved interaction between HDPE and BC and
yielded high tensile strength in HDPE/BC composite. This observation is in line with
the results obtained from tensile test, where HDPE/2.5 BC possessed the highest
ultimate tensile strength amongst all. However, when BC loading was increased to
10 wt%, agglomeration started to happen in HDPE/BC composite matrix as BC has
reached its optimum amount. This situation can be clearly noted in Figure 4.15 (c),
where the distance between the BC particles becomes shorter and increased the
tendency of higher interaction between BC particles as compared to BC and HDPE.
The agglomeration of BC in the matrix of HDPE/BC composite has resulted matrix
detachment and yielded low tensile strength in HDPE/BC composite at 10 wt% BC
loading.
Besides, it also can be observed that the filler was not fully embedded into
the matrix, which result the pulled out phenomenon and caused the HDPE/BC
composite to be broken easily as voids increased in the matrix. Therefore, when BC
loading was too high, the interactions between BC particles were stronger than the
interaction between HDPE and BC. Consequently, BC particles agglomerates and
clusters together to form bulk particles instead of being distributed homogeneously
in the matrix of HDPE/BC composite. The bulk particles formed in the HDPE matrix
has hindered the interlocking, thus, reduce the tensile strength of HDPE/BC
composite and increase the water uptake tendency by HDPE/BC composite. The
morphology analysis of HDPE/BC composite at 0 wt%, 2.5 wt% and 10 wt% BC
loading is in line with the results obtained from tensile test. Thus, it can be said that
the 2.5 wt% was the optimum BC loading as it possessed the highest tensile strength
among other BC loadings and moderate elastic modulus and elongation percentage
before breaking.

66
Figure 4.15: SEM Micrograph of Tensile Fracture (a) Unfilled HDPE, (b)
HDPE/2.5 BC and (c) HDPE/10 BC at 1000x Magnification
Matrix string
Agglomerate
BC particles
(b) (c)
(a)

CHAPTER 5
CONCLUSION AND RECOMMENDATIONS
5.1 CONCLUSION
BC filled HDPE composite has been successfully prepared through melt blending
using a Brabender internal mixer with 8 min of processing time at 160 °C and 60
rpm.
Characterization of BC revealed that BC are highly potential as filler in
HDPE due to the presence of surface porosity and cracks which may contribute to
physical interaction via HDPE chain interlocking at BC surface. Particles of BC are
irregular in shape with individual or small aggregate structure which suggests that it
can be easily dispersed in HDPE matrix. Besides, particle size distribution of BC
falls in the range of other commercial fillers. Furthermore, BC also has high thermal
stability and does not contain any reactive hydrophilic groups, thus, it is compatible
with HDPE.
Testing results also showed that the processing torque, melting temperature
(Tm), crystallization temperature (Tc) and degree of crystallinity was not significantly
affected with BC loading into HDPE which suggest comparable processing of
HDPE/BC in comparison to neat HDPE. Apart from that, addition of BC has
improved the chemical resistance, thermal stability, tensile strength and tensile
modulus of HDPE/BC composite. However, elongations at break and resistance
towards water of HDPE/BC composite have been decreased with the addition of BC.

68
The optimum loading of BC to produce the best HDPE/BC is 2.5 wt% which
shows good BC dispersion in HDPE, and resulting in the highest tensile strength,
high thermal stability, high toluene resistance and comparable processability as
compared to unfilled HDPE. Further addition of BC above 2.5 wt% results in
deterioration on tensile properties thou the thermal, chemical and processability was
improved. Besides, HDPE/BC composite with high BC loading has darker colour
than low BC loading, thus, it limits the usage of HDPE/BC composite.
5.2 RECOMMENDATIONS
In order to improve the outcome of this research, few recommendations are made
such as:-
Extrusion machine should be used to conduct the melt mixing of HDPE/BC.
This would greatly provide homogenous mixing between HDPE and BC,
hence, good dispersion of BC on HDPE can be achieved and better quality
of HDPE/BC composite would be obtained.
Biodegradability on HDPE/BC composite can be studied in the further
research. BC is organic filler which may lead the composite to be
biodegradable. Thus, weathering test and soil burial test can be conducted to
determine the biodegradability of BC filled HDPE composite.

69
REFERENCES
Adhesiveandglue.com. (2015). Thermoplastic - Definition and Examples of
Thermoplastic. [online] Available at: http://www.adhesiveandglue.com/
thermoplastic.html [Accessed 14 Aug. 2015].
Ahmetli, G., Kocaman, S., Ozaytekin, I. and Bozkurt, P. (2013). Epoxy composites
based on inexpensive char filler obtained from plastic waste and natural
resources. Polymer Composites, 34(4), pp.500-509.
American Chemistry Council. (2015). Sustainability and Recycling. [online]
Available at: https://plastics.americanchemistry.com/Sustainability-Recycling
[Accessed 21 Aug. 2015].
Ashori, A. (2008). Wood-plastic composites as promising green-composites for
automotive industries. Bioresource Technology, 99(11), pp.4661-4667.
Australian Sustainable Business - The Switch Report. (2015). The Biochar
Phenomenon. [online] Available at: http://www.theswitchreport.com.au/
tech/biochar-phenomenon/ [Accessed 13 Aug. 2015].
Bbc.co.uk. (2014). Molecular Structure and Properties. [online] Available at:
http://www.bbc.co.uk/schools/gcsebitesize/science/21c_pre_2011/materials/mol
ecstructpropertiesrev1.shtml [Accessed 8 Aug. 2015].
Behazin, E., Ogunsona, E., Rodriguez-Uribe, A., Mohanty, A., Misra, M. and Anyia,
A. (2015). Mechanical, Chemical, and Physical Properties of Wood and
Perennial Grass Biochars for Possible Composite Application. BioResources,
11(1).

70
Biochar.org. (2006). Biochar Carbon Sequestration - Home. [online] Available at:
http://www.biochar.org/joomla [Accessed 11 Jul. 2015].
Biochar-international.org. (2013). IBI White Paper: Pyrolysis and Gasification of
Biosolids to Produce Biochar. [online] Available at: http://www.biochar-
international.org/sites/default/files/IBI_white_paper_biosolids_biochar_final.pdf
[Accessed 5 Jul. 2015].
Biochar-international.org. (2015). Terms and Definitions | International Biochar
Initiative. [online] Available at: http://www.biochar-international.org/definitions
[Accessed 5 Jul. 2015].
Biocharnow.com. (2015). Biochar Now. [online] Available at:
http://biocharnow.com/index.php/applications/bio-filler [Accessed 5 Jul. 2015].
British Plastics Federation. (2015). Plastics Processes. [online] Available at:
http://www.bpf.co.uk/plastipedia/processes [Accessed 8 Aug. 2015].
Carraher, C. and Sperling, L. (1983). Polymer Applications of Renewable-Resource
Materials. Boston, MA: Springer US.
Ciullo, P. (1996). Industrial Minerals and Their Uses. Westwood, N.J.: Noyes
Publications.
Cyras, V., Manfredi, L., Ton-That, M. and Vázquez, A. (2008). Physical and
mechanical properties of thermoplastic starch/montmorillonite nanocomposite
films. Carbohydrate Polymers, 73(1), pp.55-63.
Das, O., Sarmah, A. and Bhattacharyya, D. (2015). A sustainable and resilient
approach through biochar addition in wood polymer composites. Science of The
Total Environment, 512-513, pp.326-336.
Das, O., Sarmah, A. and Bhattacharyya, D. (2015). Structure–mechanics property
relationship of waste derived biochars. Science of The Total Environment, 538,
pp.611-620.

71
Das, O., Sarmah, A. and Bhattacharyya, D. (2016). Biocomposites from waste
derived biochars: Mechanical, thermal, chemical, and morphological properties.
Waste Management, 49, pp.560-570.
Das, O., Sarmah, A., Zujovic, Z. and Bhattacharyya, D. (2016). Characterisation of
waste derived biochar added biocomposites: chemical and thermal modifications.
Science of The Total Environment, 550, pp.133-142.
David Bala, J., Lalung, J. and Ismail, N. (2014). Palm Oil Mill Effluent (POME)
Treatment ‘‘Microbial Communities in an Anaerobic Digester’’: A Review. 1st
ed. [ebook] Available at: http://www.ijsrp.org/research-paper-0614/ijsrp-
p3007.pdf [Accessed 5 Jul. 2015].
Demir, H., Atikler, U., Balköse, D. and Tıhmınlıoğlu, F. (2006). The effect of fiber
surface treatments on the tensile and water sorption properties of
polypropylene–luffa fiber composites. Composites Part A: Applied Science and
Manufacturing, 37(3), pp.447-456.
Draper, K. (2014). Biochar Paper – elevating biochar from novelty to ubiquity. The
Biochar Journal 2014. [online] Available at: http://www.biochar-
journal.org/en/ct/15 [Accessed 11 Jul. 2015].
Drobny, J. (2007). Handbook of Thermoplastic Elastomers. Norwich, NY: William
Andrew Pub.
Dyson, R. (1990). Engineering Polymers. Glasgow: Blackie.
Ecologycenter.org. (2015). Plastics Task Force | Ecology Center. [online] Available
at: http://ecologycenter.org/plastics/ptf/ [Accessed 8 Aug. 2015].
Encyclopedia Britannica. (2015). High-Density Polyethylene. [online] Available at:
http://global.britannica.com/science/high-density-polyethylene [Accessed 8 Aug.
2015].
Eze, I., Madufor, I. and Obidiegwu, M. (2013). The Effects of Bamboo Powder on
Some Mechanical Properties of Recycled Low Density Polyethylene (RLDPE)
Composites. SAVAP International, 4(2223-9944), pp.409 - 419.

72
Furness, J. (2014). Thermoplastics - An Introduction. 1st ed.
Gourmelon, G. (2015). Global Plastic Production Rises, Recycling Lags |
Worldwatch Institute. [online] Available at: http://www. worldwatch.org/global-
plastic-production-rises-recycling-lags [Accessed 8 Aug. 2015].
Gurovich, D., Macosko, C. and Tirrell, M. (2004). The Influence of Filler-Filler and
Filler-Polymer Interactions on the Physical Properties of Silica-Filled Liquid
Polyisoprene. Rubber Chemistry and Technology, 77(1), pp.1-12.
Heathland.nl. (2009). Heathland - Recyclables and Thermoplastic Resins. [online]
Available at: http://www.heathland.nl/hdpe-recycling.html [Accessed 21 Aug.
2015].
Ho, M., Lau, K., Wang, H. and Hui, D. (2015). Improvement on the properties of
polylactic acid (PLA) using bamboo charcoal particles. Composites Part B:
Engineering, 81, pp.14-25.
Hopewell, J., Dvorak, R. and Kosior, E. (2009). Plastics recycling: challenges and
opportunities. Philosophical Transactions of the Royal Society B: Biological
Sciences, 364(1526), pp.2115-2126.
Huang, R., Xu, X., Lee, S., Zhang, Y., Kim, B. and Wu, Q. (2013). High Density
Polyethylene Composites Reinforced with Hybrid Inorganic Fillers:
Morphology, Mechanical and Thermal Expansion Performance. Materials, 6(9),
pp.4122-4138.
Ibeh, C. (2011). Thermoplastic materials. Boca Raton, FL: CRC Press.
Icis. (2010). Polyethylene - High Density (HDPE) Uses and Market Data. [online]
Available at: http://www.icis.com/resources/news/2007/11/06/9076152/
polyethylene-high-density-hdpe-uses-and-market-data/ [Accessed 8 Aug. 2015].
Indexmundi. (2016). Malaysia Palm Oil Production by Year. [online] Available at:
http://www.indexmundi.com/agriculture/ [Accessed 29 Mar. 2016].

73
Industry Liaison Office. (2015). Bio-friendly Fillers for Polymers. [online] Available
at: http://ilo.osu.edu/2010/09/14/bio-friendly-fillers-for-polymers/ [Accessed 12
Jul. 2015].
Ismail, H. and Mathialagan, M. (2011). Curing Characteristics, Morphological,
Tensile and Thermal Properties of Bentonite-Filled Ethylene-Propylene-Diene
Monomer (EPDM) Composites. Polymer-Plastics Technology and Engineering,
50(14), pp.1421-1428.
Jahirul, M., Rasul, M., Chowdhury, A. and Ashwath, N. (2012). Biofuels Production
through Biomass Pyrolysis - A Technological Review. Energies, 5(12),
pp.4952-5001.
Jalani, B., Basiron, Y., Darus, A., Chan, K. and Rajanaidu, N. (2002). Prospects of
Elevating National Oil Palm Productivity: A Malaysian Perspective. Oil Palm
Industry Economic Journal, 2(2), pp.1-9.
Kanagaraj, S., Guedes, R., Oliveira, M. and Simões, J. (2008). Dynamic Mechanical
Analysis of Multi-Walled Carbon Nanotube/HDPE Composites. Journal of
Nanoscience and Nanotechnology, 8(8), pp.4008-4012.
Katz, H. and Milewski, J. (1987). Handbook of Fillers for Plastics. New York: Van
Nostrand Reinhold Co.
Klinghoffer, N. and Castaldi, M. (2013). Waste to Energy Conversion Technology.
Philadelphia, PA.
Kong, S., Loh, S., Bachmann, R., Rahim, S. and Salimon, J. (2014). Biochar from oil
palm biomass: A review of its potential and challenges. Renewable and
Sustainable Energy Reviews, 39, pp.729-739.
Ktron. (2014). Calcium Carbonate in Plastics Compounding. [online] Available at:
http://www.ktron.com/industries_served/Plastics/Calcium_Carbonate_in_Plastic
s_Compounding.cfm [Accessed 14 Aug. 2015].
Lambert, J. (1987). Introduction to Organic Spectroscopy. New York: Macmillan.

74
Lehmann, J. and Joseph, S. (2009). Biochar for Environmental Management.
London: Earthscan.
Leng, L., Yuan, X., Huang, H., Shao, J., Wang, H., Chen, X. and Zeng, G. (2015).
Bio-char derived from sewage sludge by liquefaction: Characterization and
application for dye adsorption. Applied Surface Science, 346, pp.223-231.
Lester H, G. (2015). History and Physical Chemistry of HDPE. 1st ed. [ebook]
Available at: https://plasticpipe.org/pdf/chapter-1_history_physical_chemistry_
hdpe.pdf [Accessed 10 Aug. 2015].
Liu, H., Wu, Q. and Zhang, Q. (2009). Preparation and properties of banana fiber-
reinforced composites based on high density polyethylene (HDPE)/Nylon-6
blends. Bioresource Technology, 100(23), pp.6088-6097.
Madaki, Y. and Seng, L. (2013). Palm Oil Mill Effluent (POME) from Malaysia
Palm Oil Mills: Waste or Resource. International Journal of Science,
Environment, 2(6), pp.1138 – 1155.
Maris, E., Aoussat, A., Naffrechoux, E. and Froelich, D. (2012). Polymer tracer
detection systems with UV fluorescence spectrometry to improve product
recyclability. Minerals Engineering, 29, pp.77-88.
Matinlinna, J. (2014). Handbook of Oral Biomaterials.
Metemplastics. (2015). Applications for Indoor and Outdoor Use - Marine,
Playground, Partition and More | Metem. [online] Available at:
http://metemplastics.com/applications [Accessed 21 Aug. 2015].
Meyer, R. (1987). Handbook of Polyester Molding Compounds and Molding
Technology. New York: Chapman and Hall.
Mittal, V. (2011). Advances in Polyolefin Nanocomposites. Boca Raton: CRC Press.
Mohammadi Nafchi, A., Moradpour, M., Saeidi, M. and Alias, A. (2013).
Thermoplastic starches: Properties, challenges, and prospects. Starch - Stärke,
65(1-2), pp.61-72.

75
Mohan, D., Sarswat, A., Ok, Y. and Pittman, C. (2014). Organic and inorganic
contaminants removal from water with biochar, a renewable, low cost and
sustainable adsorbent – A critical review. Bioresource Technology, 160, pp.191-
202.
Nan, N., DeVallance, D., Xie, X. and Wang, J. (2015). The effect of bio-carbon
addition on the electrical, mechanical, and thermal properties of polyvinyl
alcohol/biochar composites. Journal of Composite Materials, 50(9), pp.1161-
1168.
Nwanonenyi, S., Obidiegwu, M. and Onuegbu, G. (2013). Effects of Particle Sizes,
Filler Contents and Compatibilization on The Properties of Linear Low Density
Polyethylene Filled Periwinkle Shell Powder. The International Journal of
Engineering, 2(2), pp.1-8.
OpenLearn. (2011). Introduction to Polymers. [online] Available at:
http://www.open.edu/openlearn/science-maths-technology/science/chemistry/
introduction-polymers/content-section-0 [Accessed 15 Aug. 2015].
Özçimen, D. and Karaosmanoğlu, F. (2004). Production and characterization of bio-
oil and biochar from rapeseed cake. Renewable Energy, 29(5), pp.779-787.
Palmoilworld. (2016). Welcome to the Malaysian Palm Oil Board // Malaysian Palm
Oil Industry // Washington, DC // 1-202-572-9768. [online] Available at:
http://www.palmoilworld.org/about_malaysian-industry.html [Accessed 29 Mar.
2015].
Plasticmoulding.ca. (2015). Polyethylene | Chemical Composition and Properties.
[online] Available at: http://www.plasticmoulding.ca/polymers/
polyethylene.htm [Accessed 6 Aug. 2015].
Plastics Europe, (2013). Plastics – the Facts 2013. 1st ed. [ebook] Available at:
http://www.plasticseurope.org/documents/document/20131014095824-final_
plastics_the_facts_2013_published_october2013.pdf [Accessed 29 Mar. 2016].

76
Pollution Issues. (2015). Plastic - Water, Environmental, United States, Types,
Impact, Industrial, Liquid, Toxic, Power, Sources, Disposal, Use, Oil, Pollution
Problems. [online] Available at: http://www.pollutionissues.com/Pl-Re/
Plastic.html [Accessed 11 Jul. 2015].
Polymerexpert.biz. (2015). Polymers and Composites. [online] Available at:
http://www.polymerexpert.biz/PolymersandComposites.html [Accessed 14 Aug.
2015].
Psgtech.edu. (2015). Thermoplatics. [online] Available at: http://www.psgtech.edu/
department/production/ultrasonicwelding/html/thermoplastics.html [Accessed
14 Aug. 2015].
Punčochář, M., Ruj, B. and Chatterj, P. (2012). Development of Process for Disposal
of Plastic Waste Using Plasma Pyrolysis Technology and Option for Energy
Recovery. Procedia Engineering, 42, pp.420-430.
Ronsse, F. (2013). Report on Biochar Production Techniques. 1st ed. [ebook]
Available at: http://www.biochar-interreg4b.eu/reportonbiocharproduction
techniques/ [Accessed 14 Aug. 2015].
Rothon, R. (2002). Particulate Fillers for Polymers. Shawbury, U.K.: Rapra
Technology Ltd.
Saiah, R., Gattin, R. and Sreekumar, P. (2012). Properties and Biodegradation
Nature of Thermoplastic Starch. Thermoplastic Elastomers.
Sant'Anna, S., Souza, D., Araujo, D., Carvalho, C. and Yoshida, M. (2008). Physico-
chemical analysis of flexible polyurethane foams containing commercial
calcium carbonate. Mat. Res., 11(4), pp.433-438.
Schmidt, H. (2012). Treating liquid manure with biochar. Ithaka Journal. [online]
Available at: http://www.ithaka-journal.net/druckversionen/e062012-bc-
manure.pdf [Accessed 14 Aug. 2015].

77
Schmidt, H., Kammann, C., Niggli, C., Evangelou, M., Mackie, K. and Abiven, S.
(2014). Biochar and biochar-compost as soil amendments to a vineyard soil:
Influences on plant growth, nutrient uptake, plant health and grape quality.
Agriculture, Ecosystems & Environment, 191, pp.117-123.
Shenoy, A. (1999). Rheology of Filled Polymer Systems. Dordrecht: Kluwer.
Shimadzu Corporation. (2015). Particle Size Distribution Dependent on Principle of
Measurement: SHIMADZU (Shimadzu Corporation). [online] Available at:
http://www.shimadzu.com/an/powder/support/practice/p01/lesson02.html
[Accessed 21 Aug. 2015].
Silva, E., Ribeiro, L., Nascimento, M. and Ito, E. (2014). Rheological and
mechanical characterization of poly (methyl methacrylate)/silica (PMMA/SiO2)
composites. Mat. Res., 17(4), pp.926-932.
Smith, R. (2005). Biodegradable Polymers for Industrial Applications. Cambridge:
Woodhead.
Stuart, B. (2004). Infrared Spectroscopy. Chichester, Eng.: J. Wiley.
Sukiran, (2011). Production and Characterization of Bio-Char from the Pyrolysis of
Empty Fruit Bunches. American Journal of Applied Sciences, 8(10), pp.984-988.
Sumathi, S., Chai, S. and Mohamed, A. (2008). Utilization of oil palm as a source of
renewable energy in Malaysia. Renewable and Sustainable Energy Reviews,
12(9), pp.2404-2421.
Szaky, T. (2015). The Many Challenges of Plastic Recycling | Sustainable Brands.
[online] Available at: http://www.sustainablebrands.com/news_and_views/
waste_not/tom_szaky/many_challenges_plastic_recycling [Accessed 21 Aug.
2015].
Tang, J., Zhu, W., Kookana, R. and Katayama, A. (2013). Characteristics of biochar
and its application in remediation of contaminated soil. Journal of Bioscience
and Bioengineering, 116(6), pp.653-659.

78
Thangalazhy-Gopakumar, S., Al-Nadheri, W., Jegarajan, D., Sahu, J., Mubarak, N.
and Nizamuddin, S. (2015). Utilization of palm oil sludge through pyrolysis for
bio-oil and bio-char production. Bioresource Technology, 178, pp.65-69.
Thomas, G. (2013). Recycling of High-Density Polyethylene (HDPE or PEHD). AZo
Network. [online] Available at: http://www.azocleantech.com/article.recycling/
[Accessed 8 Aug. 2015].
Thomas, S. (2012). Polymer Composites. Weinheim: Wiley-VCH.
Tokiwa, Y., Calabia, B., Ugwu, C. and Aiba, S. (2009). Biodegradability of Plastics.
IJMS, 10(9), pp.3722-3742.
Velis, C. (2014). Global Recycling Markets: Plastic Waste. 1st ed. [ebook] Vienna.
Available at: http://www.iswa.org/fileadmin/galleries/Task_Forces/TFGWM_
Report_GRM_Plastic_China_LR.pdf [Accessed 8 Aug. 2015].
Vichem. (2015). Vi-Chem Corporation - Elastomeric Products for Auto, Industrial,
Consumer, Construction, Electrical, and Medical Industries. [online] Available
at: http://www.vichem.com/processes.htm [Accessed 24 Aug. 2015].
Visakh, P., Thomas, S., Chandra, A. and Mathew, A. (2013). Advances in
Elastomers I. Berlin: Springer.
Vroman, I. and Tighzert, L. (2009). Biodegradable Polymers.Materials, 2(2),
pp.307-344.
Wayne, E. (2012). Conquistadors, Cannibals and Climate Change - A brief history
of biochar. 1st ed. [ebook] Pro-Natura International. Available at:
http://www.pronatura.org/wp-content/uploads/2013/02/History-of-biochar.pdf
[Accessed 11 Jul. 2015].
Wwf.org.au. (2016). What is palm oil. [online] Available at: http://www.wwf.org.au/
our_work/saving_the_natural_world/forests/palm_oil/ [Accessed 26 Mar. 2016].
Xanthos, M. (2010). Functional Fillers for Plastics. Weinheim: Wiley-VCH.

79
Xie, F., Luckman, P., Milne, J., McDonald, L., Young, C., Tu, C., Pasquale, T.,
Faveere, R. and Halley, P. (2014). Thermoplastic Starch. Journal of Renewable
Materials, 2(2), pp.95-106.
Zou, Y., Feng, Y., Wang, L. and Liu, X. (2004). Processing and properties of
MWNT/HDPE composites. Carbon, 42(2), pp.271-277.

80
APPENDICES
APPENDIX A: Differential Scanning Calorimetry
(a) Unfilled HDPE

81
(b) HDPE/1.0 BC
(c) HDPE/2.5 BC

82
(d) HDPE/5.0 BC
(e) HDPE/10 BC

83
(f) Combined DSC Curve

84
APPENDIX B: Thermogravimetric Analysis
(a) Raw Biochar
(b) Unfilled HDPE

85
(c) HDPE/1.0 BC
(d) HDPE/2.5 BC

86
(e) HDPE/5.0 BC
(f) HDPE/10 BC