Embed Size (px)
Citation preview

International Journal of Remote Sensing and Earth Sciences Vol.13 No.1 Juni 2016 : hal 51 – 60
51
DEVELOPMENT OF ANNUAL LANDSAT-8 COMPOSITE OVER
CENTRAL KALIMANTAN, INDONESIA USING AUTOMATIC
ALGORITHM TO MINIMIZES CLOUD
Kustiyo1,*)
1Remote Sensing Technology and Data Centre, LAPAN
*)E-mail: [email protected]
Received:......; Accepted:........; Published:.....
ABSTRACT
Since January 2013, Landsat-8 data can be freely accessed from LAPAN, making it possible to use the all available Landsat-8 data to produce the cloud-free Landsat-8 composite images. This study used Landsat-8 archive images in 2015, Operational Land Imager (OLI) sensor in 30 meter resolution, geometric correction level of L1T. The eight data in L1T of 118-062, southern part of Central Kalimantan were used to produce a cloud-free composite image. Radiometric correction using Top of Atmosphere (TOA) and Bidirectional Reflectance Distribution Function (BRDF) algorithm to produce reflectance images have been applied, and then the most cloud-free pixels were selected in composite result. Six composite methods base on greeness, open area and haze indices were compared, and the best one was selected using visual analysis. The analysis shows that the composite algorithm using Max (Max (NIR, SWIR1) / Green) produces the best image composite.
Keyword : Landsat-8, composite, cloud-free 1. INTRODUCTION
Since January 2013, National Aeronautics and Space Institute (LAPAN) have been provided free terrain corrected (Level 1T) or systematic terrain corrected (L1GT) of Landsat-8 images. So, the Landsat-8 temporal composites and mosaics of Indonesia could be generated periodically. The Landsat 8 Operational Land Imager (OLI) sensor is the most recent in a series of Landsat-8 sensors that acquire medium resolution multi-spectral data over an approximately 183 km×170 km extent, with a 16 day revisit capability. Every Landsat overpass of Indonesia is acquired by LAPAN, providing 22 or 23 acquisitions per year per path/row (Ju and Roy 2008).
Regional mosaics of Landsat imagery are increasingly being developed to meet national monitoring and reporting needs across land-use and resource sectors, for example, in Canada (Wulder et al. 2002), the Congo basin (Hansen et al. 2008), and Indonesia (Kustiyo et al. 2015). Large volume Landsat processing was developed by the Landsat Ecosystem Disturbance Adaptive Processing System (LEDAPS) that
processed over 2100 Landsat Thematic Mapper and ETM+ acquisitions to provide wall-to-wall surface reflectance coverage for North America for the 1990s and 2000s (Masek et al. 2006).
Compositing procedures are applied to reduce cloud and aerosol contamination, fill missing values, and reduce the data volume (Cihlar and Manak 1994). The mosaic processing steps included conversion of digital numbers to calibrated radiance to top of atmosphere reflectance and brightness temperature, per-band radiometric saturation identification, cloud screening, re-projection, and compositing (Roy et al. 2010).
The compositing images could be used in any application, especially in producing land cover maps. Global land cover maps have been produced with multiple-year data from Landsat (Gong et al. 2013) and single- year Landsat-like imagery (Chen et al. 2014), with reported overall accuracies ranging from 65–80%. Land cover maps can be updated by identification and mapping of changed areas, leaving unchanged areas in the original map intact. Some large-area land cover programs currently apply such a change-updating
Kustiyo
52
approach, for example European CORINE Land Cover (Büttner et al. 2004) or the US NLCD (Xian et al. 2009).
The composting approach in this research is designed top referentially select valid land surface observations with minimal cloud, and atmospheric haze contamination. The processing approach is intentionally designed to facilitate automated processing with minimal human intervention, including no chronological order of the Landsat acquisition and processing dates. The benefit of automatic algorithm is to process image composite over Indonesia more efficiently. The previous method using the manual and semi-automated algorithm, so the composite process was time consuming.
Analysis of Landsat data archive over Indonesia for the past 15 years indicated that cloud cover has become a major problem for LAPAN in providing composite data for various applications. Besides, it is necessary to process Landsat-8 data in near real time, particularly for updating composite mosaics shortly after data acquisition by LAPAN.
This paper had been presented in the 2-nd International Conference of Indonesian Society for Remote Sensing in Jogjakarta in 2016, also it was published in the conference proceedings, Kustiyo (2016). Some modification and review were done especially in equation expressions, citations and references.
2. DATA AND METHOD
2.1. Data and Research Sites
The Landsat-8 data are nominally
processed as Level 1 terrain corrected (L1T) data. The L1T data are available in GeoTIFF format in the Universal Transverse Mercator (UTM) map projection with World Geodetic System 84 (WGS84) datum which is compatible with heritage GLS and Landsat MSS data sets. The Level 1T processing includes radiometric correction, systematic geometric correction, precision correction using ground control chips, and the use of a digital
elevation model to correct the parallax error due to local topographic relief. While most Landsat data are processed as L1T (i.e., precision and terrain-corrected), certain acquisitions do not have sufficient ground control for precision, respectively. In these cases, the best level of correction is applied and, the data are processed to Level 1GT systematic (L1GT).
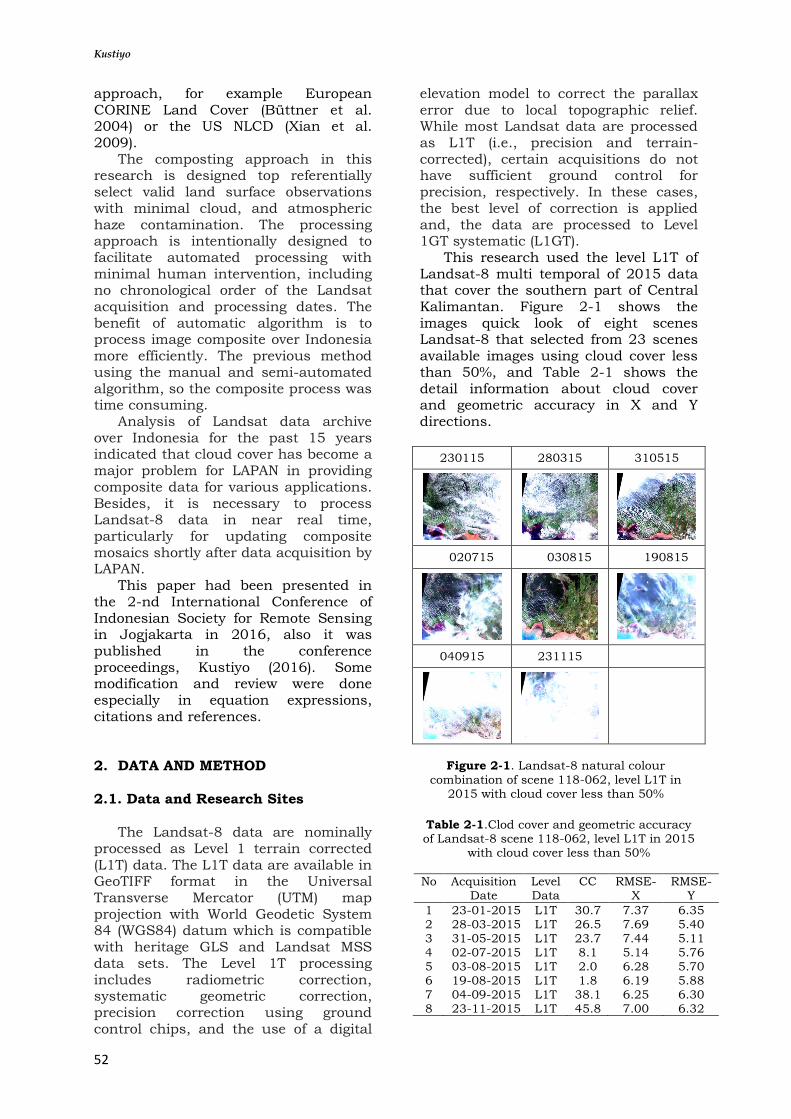
This research used the level L1T of Landsat-8 multi temporal of 2015 data that cover the southern part of Central Kalimantan. Figure 2-1 shows the images quick look of eight scenes Landsat-8 that selected from 23 scenes available images using cloud cover less than 50%, and Table 2-1 shows the detail information about cloud cover and geometric accuracy in X and Y directions.
230115 280315 310515
020715 030815 190815
040915 231115
Figure 2-1. Landsat-8 natural colour
combination of scene 118-062, level L1T in 2015 with cloud cover less than 50%
Table 2-1.Clod cover and geometric accuracy of Landsat-8 scene 118-062, level L1T in 2015
with cloud cover less than 50%
No Acquisition Date
Level Data
CC RMSE-X
RMSE-Y
1 23-01-2015 L1T 30.7 7.37 6.35 2 28-03-2015 L1T 26.5 7.69 5.40 3 31-05-2015 L1T 23.7 7.44 5.11 4 02-07-2015 L1T 8.1 5.14 5.76 5 03-08-2015 L1T 2.0 6.28 5.70 6 19-08-2015 L1T 1.8 6.19 5.88 7 04-09-2015 L1T 38.1 6.25 6.30 8 23-11-2015 L1T 45.8 7.00 6.32
Development of Annual Landsat-8 Composite Over Central Kalimantan, ……….
53
2.2. Method
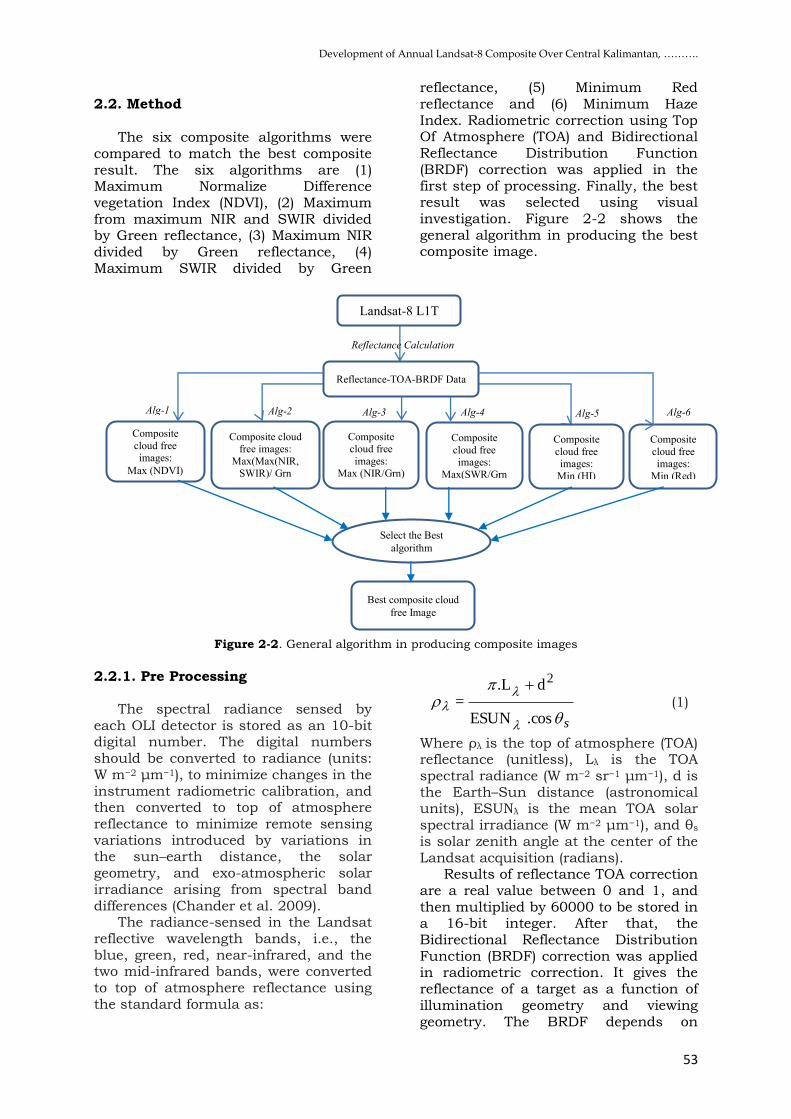
The six composite algorithms were
compared to match the best composite result. The six algorithms are (1) Maximum Normalize Difference vegetation Index (NDVI), (2) Maximum from maximum NIR and SWIR divided by Green reflectance, (3) Maximum NIR divided by Green reflectance, (4) Maximum SWIR divided by Green
reflectance, (5) Minimum Red reflectance and (6) Minimum Haze Index. Radiometric correction using Top Of Atmosphere (TOA) and Bidirectional Reflectance Distribution Function (BRDF) correction was applied in the first step of processing. Finally, the best result was selected using visual investigation. Figure 2-2 shows the general algorithm in producing the best composite image.
Figure 2-2. General algorithm in producing composite images
2.2.1. Pre Processing
The spectral radiance sensed by each OLI detector is stored as an 10-bit digital number. The digital numbers should be converted to radiance (units: W m−2 μm−1), to minimize changes in the instrument radiometric calibration, and then converted to top of atmosphere reflectance to minimize remote sensing variations introduced by variations in the sun–earth distance, the solar geometry, and exo-atmospheric solar irradiance arising from spectral band differences (Chander et al. 2009).
The radiance-sensed in the Landsat reflective wavelength bands, i.e., the blue, green, red, near-infrared, and the two mid-infrared bands, were converted to top of atmosphere reflectance using the standard formula as:
s
.cosESUN
d.L=
2 (1)
Where ρλ is the top of atmosphere (TOA) reflectance (unitless), Lλ is the TOA spectral radiance (W m−2 sr−1 μm−1), d is the Earth–Sun distance (astronomical units), ESUNλ is the mean TOA solar spectral irradiance (W m−2 μm−1), and θs is solar zenith angle at the center of the Landsat acquisition (radians).
Results of reflectance TOA correction are a real value between 0 and 1, and then multiplied by 60000 to be stored in a 16-bit integer. After that, the Bidirectional Reflectance Distribution Function (BRDF) correction was applied in radiometric correction. It gives the reflectance of a target as a function of illumination geometry and viewing geometry. The BRDF depends on
Select the Best
algorithm
Best composite cloud
free Image
Landsat-8 L1T
Reflectance-TOA-BRDF Data
Composite
cloud free images:
Max (NDVI)
Reflectance Calculation
Alg-1
Composite cloud free images:
Max(Max(NIR, SWIR)/ Grn
Composite cloud free
images: Max (NIR/Grn)
Composite
cloud free images:
Max(SWR/Grn
)
Composite
cloud free images:
Min (Red)
Alg-2 Alg-3 Alg-4 Alg-6
Composite
cloud free images:
Min (HI)
Alg-5

Kustiyo
54
wavelength and is determined by the structural and optical properties of the surface, such as shadow-casting, multiple scattering, mutual shadowing, transmission, reflection, absorption, and emission of surface elements, facet orientation distribution, and facet density.
2.2.2 Composite Algorithm
The composite algorithm selected the
best pixel in the same location from more than 2 images. The clearest pixel must be selected using certain algorithm. In general, the reflectance from visible to Short Wave Infra-Red (SWIR) that was measured by satellite sensor become higher in the haze and cloud condition, the clearest pixel was the minimum reflectance. More higher the wavelength the more affected by haze and cloud condition, the visible band is more affected by haze and cloud condition compared with the Near Infra-Red (NIR) and SWIR bands. Using this idea, this research proposes 6 algorithms for selecting the clearest images, and comparing them to decide the best one.
The 1-st algorithm was the maximum NDVI, the formula is:
IMbx(i,j) = Ibx,n(i,j); x: 1,2,…..m n is image number, so that: NDVIn (i,j) = Max (NDVI1-m (i,j) ) (2)
Where IMbx(i,j): reflectance band bx, in row colom (i,j) from image mosaic; Ibx,n(i,j): reflectance band bx, in row colom (i,j) from image number n; NDVIn (i,j) : NDVI value in row colom (i,j) from image number n; NDVI1-m : NDVI value from the 1-st to m-th data; m: number of data used in mosaic. The formula of 6 algorithms that were used are:
j))(i,I+ j)(i,(I
j))(i,I- j)(i,(I= j)(i, NDVI
NIRNIR
NIRNIR (3)
j)(i,I
j))(i,I, j)(i,Max(I= j)(i,NS_G
GRN
SWIRNIR (4)
Where NS_G : MaxNirSwir_Grn
Nir_Grn(i,j) = INIR(i,j) / IGRN(i,j) (5) Swir_Grn(i,j) = ISWIR(i,j) / IGRN(i,j) (6) Red (i,j) = IRED(i,j) (7) HI(i,j) = (3.2 * IBLU(i,j)) - IRED(i,j) (8) Where HI is haze index, Ibx(i,j): reflectance band bx, in row colom (i,j). For formula 3, 4, 5, and 6 the selection criteria were maximum, but for formula 7 and 8, the selection criteria were minimized.
3. RESULTS AND DISCUSSION 3.1. Results
The results were provided in 2 visual combinations, true color combination using swir-1, nir, and red in RGB domain, and natural color combination using red, green and blue in RGB domain. The composite results with true color combinations of the six models in this research can be seen in Figure 3-1. Visually, the composite results can be grouped into three groups, group-1 is (a), (b) and (c), group-2 is (d) and groups-3 is (e) and (f). Group 1, the general appearance is dominated by the green color in the land area, and blue and white color of the sea. In the land area, the vegetation object was selected as composite result, but in the sea area the composite result still cloudy. Group 2, the composite result was dominated by red colour, the open land object was selected as composite result. In the sea area, some are still cloudy, this is same as with group 1. Group 3, no cloud in the land area, but many shadows with black colour. In the sea area, no cloud was there.
Group 1 and group 2 can be used as cloud free image composite algorithm in land area but cannot be used in water area, especially in the sea. Otherwise, group 3 can be used as a cloud free composite algorithm in water area. The results show that in one result there is no cloud in the land, and in others results there are no cloud in the water area, combining both will produce the result become better in the land, and better in the water.

Development of Annual Landsat-8 Composite Over Central Kalimantan, ……….
55
(a) (b)
(c) (d)
(e) (f)
Figure 3-1.RGB (Swir, Nir, Red) composite results in difference algorithm (a) maximum NDVI, (b) maximum_maximum_NIR_Swir_div _Green, (c) maximum_NIR_div_Green, (d) Maximum_Swir_div_Green, (e) minimum_red, and (d) minimum_haze_index
(a) (b)
(c) (d)
(e) (f)
Figure 3-2. RGB (Red, Green, Blue) composite results in difference algorithm (a) maximum NDVI, (b) maximum_maximum_NIR_Swir_ div_Green, (c) maximum_NIR_div_Green, (d) Maximum_Swir_div_Green, (e) minimum_red, and (d) minimum_haze_index
Figure 3-2 shows the composite results in natural colour combination, this natural colour combination could well detect the hazy area, because it used the visible wavelength. This combination could well detect the water condition. All results in Figure 3-2 shows the some hazy area in the land area, and white colour in water area in group 1 and group 2, especially in group 2 the result is more hazy compared with group 1 results. In group 3, the water area is more colourful, and less hazy. Therefore, further comparative analysis was done in land area in group 1 and group 2. 3.2. Discussion
In the results shows that group 1 and group 2 results are better in land area, but group 3 results are better in water area. The detail analysis and discussion will be focused on land area, so that, only the group 1 and group 2 will be compared more detail. Detail analysis has been done in five difference location, it was shown in Figure 3-3.
The discussion focused order of the selected pixel in the results. The discussion just for group 1 and group 2. Group 3 was not included because too many mistakes in land area, there are still many shadowy areas. In the group 3, pixel with shadow was selected in the composite image, because the shadow has a minimum value of red reflectance and minimum of haze index. Table 3-1 presents the order and some mistake (e.g. Wrong choice in selecting the clear pixel) in group 1 and group 2 to match the best algorithm.
Further analysis over land areas in group 1 and group 2 as shown in Figure 3-3 indicates that algorithm number 1 (maximum NDVI) still has some mistake especially in the border of cloud shadow. Actually, the pixel with cloud and shadow was eliminated and was changed with other clear pixel, but a pixel in the cloud shadow border caused the NDVI value higher so it was selected in composite processed. The same case also could be found in the results algorithm number 3 (maximum _NIR_div_Green). The results from algorithm number 4 still have some mistake, especially in hazy area, the

Kustiyo
56
some hazy area has the bigger value, so it be selected in the composite result. The result from algorithm number 2, there is no mistake.
Based on those results, the algorithm number 2 (maximum maxi- mum_NIR, Swir_div_Green) produce the best result of Landsat-8 composite over
land area. The result of true colour combinations is enough in visual interpretation, but using the natural colour combination in some hazy area still appears. Increasing the composting period reduced the percentage of cloudy and hazy area.
Table 3-1. Order by selecting pixel of the composite results and some mistakes
No Algorithm Order by selecting pixel Mistakes
1 Maximum NDVI (1) Vegetation; (2) water; (3) Open area
Some shadow border
2 maximum_maximum_NIR_Swir_div_Green
(1) Vegetation; (2) water; (3) Open area
-
3 maximum_NIR_div_ Green
(1) Vegetation; (2) water; (3) Open area
Little shadow border
4 maximum_Swir_div_ Green
(1) Vegetation; (2) water; (3) Open area
Some white cloud
Hazy pixel in open land
No (a) (b) (c) (d) Note
1
In (a) (b) (c) as vegetation, but
in (d) as open area
2
Hazy in (d)
3
Some shadow border in (a)
Little shadow border in (c)
4
Hazy in (d)
In (a) (c) as water, but in (b) as open area
5
(b) (e) Are clear, but (a) (c) blur
Figure 3-3.RGB (Swir, Nir, Red) composite result sing difference algorithm (a) maximum NDVI, (b) maximum_maximum_NIR_Swir_div_Green, (c) maximum_NIR_div_Green, (d) Maximum_Swir_div_Green

Development of Annual Landsat-8 Composite Over Central Kalimantan, ……….
57
4. CONCLUSION The research described in this paper
represents preliminary results of a project with the goal of providing a consistent mosaic of Indonesia using Landsat-8 in 30 meter pixel resolution. Such data are needed to monitor land-cover change, especially in forest monitoring.
The result shows that the maximum (maximum (NIR, SWIR) Green) algorithm was the best algorithm in compositing the images. The result of true colour combinations is enough in visual interpretation, but using the natural colour combination in some hazy area still appears. Increasing the composting period reduced the percentage of cloudy and hazy area.
Difference algorithm produce different results in land and water area, future research is needed to combine any algorithm that matches in land also in water area. ACKNOWLEDGMENTS This research was supported by the head of Programmed and Facility Division of Remote Sensing Technology and Data Centre, LAPAN and Landsat-8 acquisition team that provide us the Landsat-8 standard imagery data. We are thankful to our colleagues who provided the strong motivation in finishing this paper.
REFERENCES
Büttner G, Feranec J, Jaffrain G, Mari L, Maucha G, Soukup T (2004) The Corine Land Cover 2000 Project. EARSeL eProceedings 3(3): 331–346.
Chander G, Huang C, Yang L, Homer C, Larson C (2009). Developing consistent Landsat data sets for large area applications: The MRLC 2001 protocol. IEEE Geoscience and Remote Sensing Letters 6(4): 777–781.
Chen C, Chen Z, Li M, Liu Y, Cheng L, Ren Y (2014) Parallel relative radiometric normalization for remote sensing image mosaics. Computers and Geosciences 73:28–36
Cihlar J, Manak D (1994) Evaluation of Compositing Algorithms for AVHRR Data Over Land. IEEE Transactions on Geoscience and Remote Sensing 32(2): 427–437. doi: 10.1109/36.295057
Gong P (2013) Finer resolution observation
and monitoring of global land cover: first mapping results with Landsat TM and ETM+ data. International Journal of Remote Sensing, 34(7): 2607–2654.
Hansen MC, Roy DP, Lindquist E, Adusei B, Justice CO, Altstatt A (2008) A method for integrating MODIS and Landsat data for systematic monitoring of forest cover and change and preliminary results for Central Africa. Remote Sensing of Environment 112: 2495–2513.
Ju J, Roy DP (2008) The availability of cloud-free Landsat ETM+ data over the conterminous United States and globally. Remote Sensing of Environment, 112(3):
1196–1211. doi: 10.1016/j.rse.2007.08.011
Kustiyo, “Development of Annual Composite Algorithm Using Landsat-8 to Minimizes Cloud,” in ICOIRS Proceedings, pp. 113-120, 2016
Kustiyo, Roswintiarti O, Tjahyaningsih A, Dewanti R, Furby S, Wallace J (2015) Annual forest monitoring as part of the Indonesia’s National Carbon Accounting System. International Archives of the Photogrammetry, Remote Sensing and Spatial Information Sciences - ISPRS Archives, 40(7W3): 441–448.
Masek JG, Vermote EF, Saleous NE, Wolfe R, Hall FG, Huemmrich KF, Gao F, Kutler J,
Lim T (2006) A landsat surface reflectance dataset for North America, 1990-2000. IEEE Geoscience and Remote Sensing Letters 3(1): 68–72
Roy DP, Ju J, Kline K, Scaramuzza PL, Kovalskyy V, Hansen M, Loveland TR, Vermote E, Zhang C (2010) Web-enabled Landsat Data (WELD): Landsat ETM+ composited mosaics of the conterminous United States. Remote Sensing of Environment 114(1): 35–49
Wulder M, Loubier E, Richardson D (2002) Landsat-7 ETM+ orthoimage coverage of
Canada. Canadian Journal of Remote Sensing 28(5): 667–671
Xian G, Homer C, Fry J (2009) Updating the 2001 National Land Cover Database land cover classification to 2006 by using Landsat imagery change detection methods. Remote Sensing of Environment 113(6):1133–1147