Embed Size (px)
Citation preview

DEVELOPMENT OF AN INTEGRATED TRAIN DRIVER
PERFORMANCE MODEL
MOHD AZLIS SANI BIN MD JALIL
THESIS SUBMITTED IN FULFILMENT OF THE
REQUIREMENTS
FOR THE DEGREE OF DOCTOR OF PHILOSOPHY
FACULTY OF ENGINEERING
UNIVERSITY OF MALAYA
KUALA LUMPUR
2015

UNIVERSITI MALAYA
ORIGINAL LITERARY WORK DECLARATION
Name of Candidate: MOHD AZLIS SANI MD JALIL
(I.C/Passport No:780103–01–5839)
Registration/Matric No: KHA080044
Name of Degree: Doctor of Philosophy
Title of Project Paper/Research Report/Dissertation/Thesis (“this Work”):
Development of An Integrated Malaysian Train Driver Performance Model
Field of Study: Ergonomics
I do solemnly and sincerely declare that:
(1) I am the sole author/writer of this Work;
(2) This Work is original;
(3) Any use of any work in which copyright exists was done by way of fair dealing
and for permitted purposes and any excerpt or extract from, or reference to or
reproduction of any copyright work had been disclose expressly and sufficiently
and the title of the Work and its authorship had been acknowledge in this Work;
(4) I do not have any actual knowledge nor ought I reasonably to know that the
making of this work constitutes an infringement of any copyright work;
(5) I hereby assign all and every right in the copyright to this Work to the University
of Malaya (“UM”), who henceforth shall be owner of the copyright in this Work
and that any reproduction or use in any form or by any means whatsoever is
prohibited without the written consent of UM having been first had and
obtained;
(6) I am fully aware that if in the course of making this Work I have infringed any
copyright whether intentionally or otherwise, I may be subject to legal action or
any other action as may be determined by UM.
Candidate’s Signature Date:
Subscribed and solemnly declared before,
Witness’s Signature Date:
Name:

iii
ABSTRACT
The purpose of this study was to develop an integrated performance model of
train drivers. A human performance measure was developed, integrating several
significant factors of the train driver, and a theoretical framework specified for train
driver was established from an extensive review of the literatures. This framework
formed the foundation of the study in order to understand the significant factors
influencing the performance of a train driver. Three main domains of human, activity
and context were proposed to represent the key indicators of the train driver's
performance.
The evaluation was conducted on train drivers of a major train operating
company (TOC) in Malaysia, focusing only on drivers of intercity passenger trains and
freight trains. 229 respondents had participated in the quantitative paper-and-pencil
survey conducted, and the data obtained was subsequently analysed using SPSS
software. An integrated framework was then tested using structural equation modelling
(SEM)-PLS approach in theSmartPLS software to determine the relationship among the
significant factors of train driver performance. Fourteen factors were hypothesized and
tested under the three main domains, namely fatigue, job related tension (internal and
external conflict), job satisfactions, occupational stress and sleepiness, which were
grouped under human domain; while driving task and job demand represented the
activity domain; and lastly, the context domain consisted of the working condition,
safety culture, safety issue, working environment and work facilities.
The results indicated that fatigue, job related tension (internal conflict) and
occupational stress; under human domain were found to be the significant factors which
influence the performance of train drivers. For the activity domain, hypothesis testing
proved that driving task, was significant factor. In the context domain; three factors
were found to be significant. These include safety culture, working environment and

iv
working condition. To summarize, the study identified a total of seven significant
factorswhich include occupational stress, job related tension – internal conflict, fatigue,
driving task, work environment, safety culture and working condition. However, the
results have failed to support the remaining seven factors of job related tension (external
conflict), job satisfactions, sleep, job demand, work facilities, and safety issue.
Significant to this research was that an integrated Malaysian train driver
performance model has been successfully developed for identifying the significant
factors that influence train driver performance, highlighting the interaction between
human factors, human activities and its context. Through this approach, this study has
looked at the significant factors in holistic and comprehensive perspective without
ignoring other potential domains of factors. Therefore, this model would benefit the rail
industry by assisting them in identifying the factor(s) That require close observation and
improvement. Thus, the overall performance of the industry would be upgraded and
contributes to the betterment of the system and the rail industry.

v
ABSTRAK
Tujuan kajian ini adalah pembangunan model bersepadu untuk prestasi pemandu
keretapi. Suatu ukuran prestasi insani telah dibangunkan, dengan mengintegrasikan
beberapa faktor penting berkaitan pemandu keretapi. Lanjutan daripada itu, rangka kerja
teori telah dibangunkan terlebih dahulu berasaskan kajian ilmiah yang mendalam.
Rangka kerja teori ini telah menjadi asas kepada kajian ini, digunakan untuk memahami
faktor – faktor penting yang mempengaruhi pemandu keretapi. Tiga domain utama iaitu
manusia, aktiviti dan konteks telah dicadangkan untuk mewakili penunjuk utama di
dalam penilaian prestasi pemandu keretapi.
Penilaian telah dijalankan ke atas pemandu keretapi syarikat pengendali keretapi
utama (TOC) di Malaysia, yang memfokuskan hanya kepada pemandu – pemandu
keretapi penumpang antarabandar dan keretapi barang. Seramai 229 responden telah
terlibat di dalam kaji selidik kuantitatif yang menggunakan kertas dan pensil, dan data
yang telah dikutip ini, dianalisa menggunakan perisian SPSS. Rangka kerja bersepadu
ini kemudiannya diuji menggunakan model persamaan berstruktur (SEM) - dengan
pendekatan PLS menggunakan perisian SmartPLS untuk menentukan perkaitan di
antara faktor – faktor penting ke atas prestasi pemandu keretapi. Empat belas faktor
telah dihipotesis dan diuji di bawah tiga domain utama; iaitu kelesuan, ketegangan
berkaitan kerja (konflik dalaman dan luaran), kepuasan bekerja, tekanan pekerjaan dan
ketiduran, di mana ianya di kumpulkan di bawah domain manusia. Manakala tugasan
pemanduan dan keperluan kerja mewakili domain aktiviti. Yang terakhir adalah domain
konteks yang mengandungi keadaan kerja, budaya keselamatan, isu keselamatan,
persekitaran kerja dan kemudahan kerja.
Dapatan kajian mendapati kelesuan, ketegangan berkaitan kerja (konflik
dalaman) dan tekanan pekerjaan; di dalam kelompok domain manusia adalah signifikan
terhadap prestasi pemandu keretapi. Untuk domain aktiviti pula, ujian hipotesis telah

vi
membuktikan bahawa tugasan memandu adalah signifikan terhadap prestasi. Manakala
untuk domain konsep; tiga faktor telah didapati signifikan; iaitu budaya keselamatan,
persekitaran kerja dan keadaan kerja. Secara kesimpulannya, tujuh faktor didapati
signifikan di dalam kajian ini iaitu tekanan pekerjaan, ketegangan berkaitan kerja
(konflik dalaman), kelesuan, tugasan memandu, persekitaran kerja, budaya keselamatan
dan keadaan kerja. Walau bagaimanapun, dapatan kajian telah gagal untuk
membuktikan tujuh faktor lagi mempengaruhi prestasi pemandu keretapi; iaitu
ketegangan berkaitan kerja (konflik luaran), kepuasan bekerja dan ketiduran, keperluan
kerja, kemudahan kerja dan isu keselamatan.
Adalah menjadi kepentingan terhadap kajian ini di mana model bersepadu
pemandu keretapi Malaysia telah dibangunkan dengan jayanya. Ia digunakan untuk
menentukan faktor – faktor penting yang mempengaruhi prestasi kerja mereka yang
mengetengahkan hubungan di antara faktor manusia, aktiviti manusia dan konteks.
Melalui pendekatan ini, kajian ini telah meneliti faktor – faktor penting dengan kaedah
yang paling komprehensif dan menyeluruh tanpa mengabaikan sebarang domain yang
berkaitan. Oleh yang demikian, model ini akan berfaedah kepada industri keretapi
dengan membantu mereka mengenalpasti faktor – faktor manakah yang perlu dipantau
dan ditambahbaik. Maka, prestasi keseluruhan industri tersebut akan dapat
dipertingkatkan dan menyumbang kepada kejayaan dan kebaikan sistem serta industri
keretapi secara amnya.

vii
DEDICATION
To my parents, Md Jalil Maslan and Azizah Osman;
my wife Nor Hamisah Mohamed Nor;
my daughter Nur Arissa and my son Ariz Safiyy

viii
ACKNOWLEDGMENT
All praises are due to Allah who had given blessing, strength and knowledge in
finishing this journey. My sincere appreciation and gratitude goes to my supervisor
Associate Professor Dr Siti Zawiah Md Dawal for her guidance, understanding and
concern. Her professional experiences and academic knowledge helped me in
completing this thesis. I also wish to thank my co-supervisor, Dr Norhayati Zakwan of
UTM for her guide on the methodological part of this study.
I am particularly grateful to Professor Ramayah Thurasamy of USM for his help,
guidance and motivation especially on SEM and PLS approach. Thank you to my
friend, Abdul Hafaz Ngah for his kindness and introduced me to Prof Ramayah. Special
thanks goes to Alias Abdullah, Eida Nadirah, Dr Salwa Hanim and my fellow friends in
Faculty of Engineering, UM for your support and kindness.
I take this opportunity to express gratitude to my Dean, Prof. Dr Yusri Yusof
and all of my department and faculty members for their help and support. I also thank
my parents and family for the encouragement, support and attention.
This study would not be successful without love and endless support from my
wife and children. They are at all time together with me, without fail. Their
encouragement and love make me stronger and sustain to complete this study.
I also place on record, my sense of gratitude to one and all, who directly or
indirectly, have lent their hand in this study.

ix
TABLE OF CONTENTS
Abstract ............................................................................................................................ iii
Abstrak .............................................................................................................................. v
Dedication ....................................................................................................................... vii
Acknowledgment ........................................................................................................... viii
Table of Contents ............................................................................................................. ix
List of Figures .....................................................................................................................
List of Tables...................................................................................................................... i
List of Abbreviations........................................................................................................ iii
List of Appendices ..............................................................................................................
Chapter 1 : Introduction .................................................................................................... 1
1.1 Background ........................................................................................................ 1
1.2 Problem statement .............................................................................................. 3
1.3 Research objectives ............................................................................................ 5
1.4 Significance of the Study ................................................................................... 5
1.5 Scope of the Study .............................................................................................. 6
1.6 Structure of Thesis .............................................................................................. 7
Chapter 2 : Literature Review ........................................................................................... 9
2.1 Introduction ........................................................................................................ 9
2.2 Human Performance ........................................................................................... 9
2.3 A brief about train driver in Malaysia .............................................................. 11
2.4 Human performance in the railway system ...................................................... 13
2.5 Significant human performance models ........................................................... 20
2.5.1 The cognitive task analysis (CTA) model ................................................. 20

x
2.5.2 The Situational Model ............................................................................... 22
2.5.3 Bailey model (1996) .................................................................................. 23
2.5.4 Chang’s extended SHEL model (2010) .................................................... 25
2.5.5 Baines et. al theoretical framework (Baines et al., 2005) ......................... 27
2.6 Comparison of selected human performance models ....................................... 28
2.7 Summary .......................................................................................................... 34
Chapter 3 : Theoretical Framework and Hypotheses ...................................................... 36
3.1 Introduction ...................................................................................................... 36
3.2 Theoretical Framework .................................................................................... 36
3.3 Factors affecting human ................................................................................... 37
3.3.1 Occupational Stress and Job-related Tension (JRT) ................................. 38
3.3.2 Job Satisfaction ......................................................................................... 39
3.3.3 Fatigue ....................................................................................................... 40
3.3.4 Sleepiness .................................................................................................. 42
3.4 Workers activities ............................................................................................. 44
3.4.1 Job demand ............................................................................................... 44
3.4.2 Driving task ............................................................................................... 45
3.5 Working environment ....................................................................................... 46
3.5.1 Working hours ........................................................................................... 48
3.6 Safety ................................................................................................................ 49
3.7 Chapter Summary ............................................................................................. 50
Chapter 4 : Methodology ................................................................................................ 52
4.1 Methodological Overview ................................................................................ 52
4.2 Research Design ............................................................................................... 54

xi
4.3 The Survey Method .......................................................................................... 54
4.3.1 Self-administered questionnaire ................................................................ 55
4.3.2 Pre-testing and expert validation ............................................................... 59
4.4 Performance measurement ............................................................................... 60
4.5 Profile of the respondents ................................................................................. 60
4.5.1 Sample size................................................................................................ 63
4.6 Data collection .................................................................................................. 67
4.7 Structural Equation Modeling .......................................................................... 68
4.8 Preliminary Data Analysis ................................................................................ 68
4.8.1 Data Screening .......................................................................................... 69
4.8.2 Treatment of missing data ......................................................................... 72
4.8.3 Common Method Bias .............................................................................. 75
4.8.4 Response bias ............................................................................................ 76
4.8.5 Reliability Analysis ................................................................................... 77
4.9 Chapter Summary ............................................................................................. 79
Chapter 5 : Results & Analysis ....................................................................................... 80
5.1 Introduction ...................................................................................................... 80
5.2 Factor Analysis ................................................................................................. 80
5.2.1 Human domain .......................................................................................... 82
5.2.2 Activity domain ......................................................................................... 87
5.2.3 Context domain ......................................................................................... 89
5.2.4 Summary of factor analysis ....................................................................... 92
5.3 Evaluation of the measurement model ............................................................. 94
5.3.1 Internal consistency reliability .................................................................. 94

xii
5.3.2 Convergent validity ................................................................................. 104
5.3.3 Discriminant Validity .............................................................................. 108
5.4 Evaluation of the structural model ................................................................. 110
5.4.1 The performance model .......................................................................... 114
5.5 Summary ........................................................................................................ 117
Chapter 6 : Discussions and Benchmarking ................................................................. 118
6.1 Introduction .................................................................................................... 118
6.2 The developed model of Malaysian train driver performance ....................... 118
6.3 Factors of human domain which affecting train driver performance ............. 119
6.4 Factors of activity domain which affecting train driver performance ............ 123
6.5 Factors of context domain which affecting train driver performance ............ 124
6.6 Benchmarking of the model with other related studies .................................. 129
6.6.1 Advantages of this model ........................................................................ 136
6.7 Significant contributions of the study ............................................................ 137
6.7.1 Significant theoretical contributions of the train driver performance ..... 137
6.7.2 Significant managerial contributions of the train driver performance .... 138
6.8 Objectives’ achievements of the study ........................................................... 139
Chapter 7 : Conclusion and Recommendations ............................................................ 140
7.1 Conclusion ...................................................................................................... 140
7.2 Recommendations for Future Research ......................................................... 141
References ..................................................................................................................... 143
List of publications and paper presented ....................................................................... 153
Appendices .................................................................................................................... 163
Appendix 1: Employee Performance Standard Form – for Non-executive .............. 164
xiii
Appendix 2: Questionnaire (Bahasa Malaysia)......................................................... 166
Appendix 3: Questionnaire (English)........................................................................ 176
Appendix 4: Review from experts ............................................................................ 185
Appendix 5: Amount of Missing Data ...................................................................... 187
Appendix 6: Factor analysis for human domain ....................................................... 191
Appendix 7: Factor analysis for Activity domain ..................................................... 196
Appendix 8 : Factor analysis for context domain ..................................................... 201
Appendix 9: Train timetable ..................................................................................... 207
Appendix 10: Epworth Sleepiness Scale (ESS) Permission Email ........................... 209
Appendix 11: Letter to experts .................................................................................. 210
Appendix 12: Evaluation form for expert ................................................................. 211
Appendix 13: Appreciation letter to experts ............................................................. 212
Appendix 14: Letter to TOC for field study at depots .............................................. 213
Appendix 15: Letter to TOC for field study at the locomotives ............................... 214
Appendix 16: Consent letter...................................................................................... 215
Appendix 17: Consent form ...................................................................................... 216

LIST OF FIGURES
Figure 2.1: Train driving task ......................................................................................... 13
Figure 2.2: Human capabilities and the recognize-act cycle in CTA model (Hamilton &
Clarke, 2005) ................................................................................................................... 21
Figure 2.3: Situational model of driver performance in interacting with AWS (McLeod
et al., 2005) ..................................................................................................................... 23
Figure 2.4: Bailey’s basic model of human performance (Bailey, 1996) ....................... 24
Figure 2.5: The structural model for extended SHEL research model (Chang & Yeh,
2010) ............................................................................................................................... 26
Figure 2.6: The human performance modelling theoretical framework ......................... 28
Figure 3.1: The theoretical framework of Malaysian train driver performance ............. 37
Figure 3.2: Venn-diagram of Human-machine-environment relationship (adapted from
Boff (2006)) .................................................................................................................... 47
Figure 3.3: Comparison of human performance models / frameworks .......................... 50
Figure 4.1: The research process flow chart ................................................................... 53
Figure 4.2: Age of the respondents (in percentage) ........................................................ 62
Figure 4.3: Work duration among respondents (in percentage)...................................... 62
Figure 4.4: Location of the depots and its connections................................................... 65
Figure 4.5: Summary of preliminary data analysis ......................................................... 69
Figure 4.6 : Example of histogram for item JRT 5 ......................................................... 70
Figure 4.7: Example of box-whisker diagram for item JRT 5 ........................................ 71
Figure 5.1: Flow chart of factor analysis ........................................................................ 81
Figure 5.2: Factors of human domain for measuring train driver performance .............. 86
Figure 7.1: Scree plot of human domain ....................................................................... 191
Figure 7.2: Comparison of Eigenvalue between real data and simulated ..................... 193

i
LIST OF TABLES
Table 2.1: Previous studies on factors relating to human performance in rail. ............... 17
Table 2.2: Comparison table of human performance models and frameworks .............. 33
Table 4.1: Summary of the items of questionnaire for train drivers ............................... 56
Table 4.2: Summary of the questionnaire ....................................................................... 57
Table 4.3: Profile of the respondents .............................................................................. 61
Table 4.4: Pearson correlation test between age and duration of work .......................... 63
Table 4.5: Distribution of the train drivers...................................................................... 64
Table 4.6: Number of responses collected at different depots ........................................ 67
Table 4.7: Number of responses based on reporting depots ........................................... 68
Table 4.8: Little’s MCAR significance value for each factor ......................................... 74
Table 4.9: Total variance explained ................................................................................ 76
Table 4.10: Results of reliability test .............................................................................. 78
Table 5.1: Factors in human domain ............................................................................... 83
Table 5.2: Factor analysis of human domain .................................................................. 84
Table 5.3: Five-factor solution for human domain ......................................................... 85
Table 5.4: Factors in activity domain .............................................................................. 87
Table 5.5: Factor analysis of activity domain ................................................................. 87
Table 5.6: Results of the factor analysis of activity domain ........................................... 88
Table 5.7: Factor analysis of context domain ................................................................. 90
Table 5.8: Results of the factor analysis of context domain ........................................... 91
Table 5.9: Loading and cross loadings of items to measure composite reliability ......... 96
Table 5.10: Loadings and cross loadings after 3-time algorithm .................................. 101
Table 5.11: Results of the measurement model ............................................................ 104
Table 5.12: Results of the final measurement model .................................................... 106
Table 5.13: Discriminant validity of construct ............................................................. 109

ii
Table 5.14: List of the hypotheses of the modified model ............................................ 110
Table 5.15: Path coefficients’ and hypothesis testing ................................................... 111
Table 5.16: Factors affecting performance of the Malaysian train drivers ................... 114
Table 6.1: Benchmarking of the integrated model with previous literatures ................ 132
Table 7.1: Parallel analysis of human domain .............................................................. 192

iii
LIST OF ABBREVIATIONS
ANOVA : Analysis of variance
ATC : Air traffic control
AVE : Average variance extracted
AWS : Automatic Warning System
CB-SEM : Covariance-based structural equation modelling
CR : Composite reliability
CTA : Cognitive task analysis
DT : Driving task
EEG : Electroencephalography
EFA : Exploratory factor analysis
EM : Expectation Maximization
ESS : Epworth Sleepiness Scale
ETS : Electric train service
FFS : Flinders Fatigue Scale
GLC : Government-linked company
HFACS : Human Factors Analysis and Classification System
HFE : Human factors / ergonomics
HRM : Human resource management
ICAO : The International Civil Aviation Organization
JCH : Job characteristics
JD-R : Job Demand-Resources
JRT : Job-related tension
KMO : Kaiser-Meyer-Olkin measures of sampling adequacy
KPI : Key performance indicators
MAR : Missing at random
MCAR : Missing completely at random
MI : Multiple Imputation
NMAR : Not missing at random
OED : Oxford English Dictionary
OSHEN : Occupational Safety, Health and Environment Department
OSPAT : Objective performance test
PCA : Principal component analysis
PLS : Partial least square

iv
PMS : Performance Management System
PVT : Psychomotor vigilance task
QMS : Quality management system
REQUEST : Rail Ergonomics Questionnaire
RT : Response task
SC : Safety culture
SEM : Structural equation modelling
SI : Safety issue
SOP : Standard operating procedure
SPAD : Signal passed at danger
SPAD : Suruhanjaya Pengangkutan Awam Darat
SPSS : Statistical Package for the Social Sciences
STR : Occupational stress
TOC : Train operating company
UK : United Kingdom
VAS : Subjective alertness tests
WC : Working condition
WE : Working environment

LIST OF APPENDICES
Appendix 1: Employee Performance Standard Form – for Non-executive .................. 164
Appendix 2: Questionnaire (Bahasa Malaysia) ............................................................ 166
Appendix 3: Questionnaire (English) ........................................................................... 176
Appendix 4: Review from experts ................................................................................ 185
Appendix 5: Amount of Missing Data .......................................................................... 187
Appendix 6: Factor analysis for human domain ........................................................... 191
Appendix 7: Factor analysis for Activity domain ......................................................... 196
Appendix 8 : Factor analysis for context domain ......................................................... 201
Appendix 9: Train timetable ......................................................................................... 207
Appendix 10: Epworth Sleepiness Scale (ESS) Permission Email............................... 209
Appendix 11: Letter to experts...................................................................................... 210
Appendix 12: Evaluation form for expert ..................................................................... 211
Appendix 13: Appreciation letter to experts ................................................................. 212
Appendix 14: Letter to TOC for field study at depots .................................................. 213
Appendix 15: Letter to TOC for field study at the locomotives ................................... 214
Appendix 16: Consent letter ......................................................................................... 215
Appendix 17: Consent form .......................................................................................... 216

1
CHAPTER 1 : INTRODUCTION
1.1 Background
Human factors / ergonomics (HFE) focuses on the interaction of human with
their environment. The traditionally concept of HFE has always focused on the
interrelationship between three main elements of human-machine-environment. The
human element is a major component in any relationship with machine and the
environment (Branton, 1987). This relationship can be best described using the human
performance model (Wilson, 1990). Developments in HFE has seen the introductions
of new terms to redefine machine and environments, in the form of the physical
environment (‘things’), the organisational environment and the social environment
(Carayon & Smith, 2000; Parsons, 2000; Wilson, 2000). This concept of HFE is
applicable in the evaluation of individuals and daily work activities, and has been
incorporated in assessment of employees in the industries. Numerous studies have been
conducted to evaluate the relationship between human and these major environmental
elements. Although the focus of these studies may vary, with some looking on the
physical environment while others may address the issue on organisation aspects, their
objectives remained the same which is to improve the performance and the well-being
of employees by integrating human into a better system (Dul et al., 2012).
Performance is an important aspect for the industry, and is a priority to be
achieved either by an individual or an organisation especially in handling complex task
or working on demanding situations (Klein et al., 2010). There is a difference in how
performance is measured from the viewpoints of human resource management (HRM)
and HFE. In HRM, performance is measured based on reward, individual achievement
in completion of tasks and determination of certain key performance indicators (KPIs)
(Stojadinović et al., 2014). On the other hand, other influential factors are by the HFE

2
to define the performance of employees such as job characteristics, working conditions
and the environments (Kahya, 2007). Job performance is a valuable element and an
important dependent variable for achieving high quality work output and services
(Kahya, 2009). To remain competitive and maintain a high level of job performance,
the employee itself is the main focus to be taken care of (Layer et al., 2009).
Performance of the employee and the system is important in the transportation
industry, especially in public transportations, where high performance of the
organisation would result in increased safety conditions (Haque et al., 2013). Ignorance
of the performance of employees may lead to undesirable results. Accidents in the
transportation industry frequently occur especially on the road. However, for the
railway, ships and aviation industries the frequency of accidents is very low (Evans,
2011), although the occurrence of accidents usually results in a large number of
injuries, casualties and devastations. Thus, it is in the interest of these industries to
seriously maintain high work performance, improve the safety levels and awareness to
avoid catastrophes (Silla & Kallberg, 2012). HFE has been increasingly accepted an
important tool to improve human performance and safety at every level, to ensure a
safe transportation system (Clarke, 2005; Wickens et al., 2004). In summary, human
performance is vital to the transportation industry and requires more attention
and awareness to improve safety in order to avoid accidents, injuries and loss of life.
This study focuses in the evaluation on the key employee in the train industry, namely
the train drivers, and how their work performances contribute to the level of safety in
the railway system.
Past studies on evaluation of train driver performance has mostly focused on
only one or very few relationships between influencing factors. There has yet to be any
effort in integrating these influencing factors, with no studies conducted for train
drivers in Malaysia. The recent development of rail industry in Malaysia; with the

3
extension of existing light rapid train (LRT) lines, introduction of Electric Train
Service (ETS), newly developed MyRapid Transit (MRT) and later will be high speed
rail from Kuala Lumpur to Singapore become great motivation for this study. There is a
need to ensure the factors influencing the key personnel of the system; which is the
train driver will be addressed and considered at all time. With the new challenges by
having great expansion in rail services, the authority and the train operating companies
(TOCs) should ensure the safety and efficieny of the overall system. Therefore, this
study will attempt to address this limitation by developing an integrated model of train
driver performance based on HFE, which would give a holistic and comprehensive
detail of driver capacities, capabilities and limitations.
1.2 Problem statement
The performance of train drivers have been studied during the past decade,
largely in the United Kingdom after the train accident which happened at Ladbroke
Grove on 5th
October 1999 (Stanton & Walker, 2011; Sutherland & Groombridge,
2001; Wilson & Norris, 2005a). These studies have focused on causal factors such as
cognitive, workload, fatigue, sleepiness and analysis of task. There were also studies on
accident analysis, new design of cab, safety and operating system (Darwent et al., 2008;
Dorrian et al., 2006, 2007; Edkins & Pollock, 1997; Farrington-Darby, Wilson, et al.,
2005; Jay et al., 2008).
However, there are very limited literatures on the performance of train driver as
an integrated model which relates the various influencing factors. Past research has
focused on assessment of individual influencing factors, overlooking the possibilities of
interactions between them. Furthermore, these factors were not categorised
systematically, whether based on its common characteristics or on the HFE basic

4
interacting domains of human – machine – environment. Understanding the
relationship between the performance of train drivers and factors influencing their
performance would enable their integration into the development of a performance
model (Baines et al., 2005). The availability of this performance model would offer a
holistic approach in evaluation of train driver performance to ensure the safety of the
train journey as well as the overall system (Williamson et al., 2011). In addition, the
performance evaluation would improve the quality of service, reduce degree of risk and
avoid occurrence of accidents. Most studies on train driver performance have been
conducted in European countries, especially in the United Kingdom. To date, there has
yet to be any study conducted on performance measurement of train drivers in
Malaysia.
To develop the integrated performance model for train drivers, an extensive
literature survey would be conducted to identify influential key factors upon which a
theoretical framework could be established.. A quantitative based method based on the
structural equation modelling (SEM) can then be used to test and confirm the
relationship among these influencing factors.

5
1.3 Research objectives
The main objective of this study is to develop an integrated performance model
for train drivers. To achieve this aim, the following measurable objectives are
appropriately defined:
a) To identify significant factors of human performance in train driving;
b) To establish a framework of train driver performance;
c) To determine the relationships among significant factors which influence train
driver performance;
d) To develop an integrated train driver performance model.
1.4 Significance of the Study
To date, it was found that an integrated model of train driver performance has
yet to be fully developed, especially in Malaysia. This study attempts to address this
limitation by developing an integrated model of train driver performance, by using train
drivers in Malaysia as respondents. This model will provide a comprehensive
understanding of human performance by incorporating three main domains of human
performance; human – activity – context. Past studies have evaluated these factors
either individually or with limited interactions between the factors. This model can then
be subsequently used by researchers as an important reference point to venture into
evaluating other affecting factors of human performance, in different areas of study. In
addition, train operating companies (TOC) can utilise this model as a guideline to
improve the design of workplace and tasks, train infrastructure as well as raising the
level of awareness among employees. This will ensure that the company remains
profitable, competitive and safe, and maintains a high level of performance of

6
employees and the organisation. This integrated model provides a holistic
understanding of train driver performance, without compromising other criteria in order
to ensure that the overall safety and performance is constantly maintained.
This study also provides an alternative approach for integrating a number of
variables (factors) into one comprehensive model. A systematic evaluation and analysis
procedure using structural equation modelling (SEM) technique is introduced in order
to explore newly proposed variables in the model, and to test the significant level of the
hypothesis. This SEM technique could be used by researchers for other areas of studies
involving improvement and testing of proposed integrated model.
1.5 Scope of the Study
This study consist of three major domains influencing the performance train
drivers in Malaysia namely drivers’ activities, context and human domains. These
domains cover the generic factors of human performance as proposed by Bailey (1996),
Baines et al. (2005) and Chang and Yeh (2010). A total of sixty factors were extracted
from their studies, although to consider all of the proposed factors in this study, given
the constraint of time and resources, is quite impossible. However, the selections of
domains and factors for this study are considered sufficient within the scope of the
research work. These three domains (activities, context and human) are considered to
be sufficient in representing human performance within the timeframe of the research.
The major reference of this study is based on the research by Ryan, Wilson,
Sharples, Morrisroe, et al. (2009) on the development of the Rail Ergonomics
Questionnaire (REQUEST) instrument with several adaptations and modifications. This
comprehensive instrument was designed especially for railway workers and has been
refined and developed over a number of years. Additions to the REQUEST instrument

7
were made based on the studies of Strahan et al. (2008), (Johns, 1991, 1992, 1993),
Johns and Hoaking (1997), Gradisar et al. (2007), Austin and Drummond (1986) and
Dawal et al. (2009).
The present study was conducted on the train drivers of a major train operating
company (TOC) in Malaysia. Since all the train drivers were males, there were no data
for female respondents. The survey was conducted on intercity passenger and freight
train drivers. These types of trains are characterised by their long haul journeys with a
minimum of four hours trips, which may have a significant impact on the safety of the
rail network.
1.6 Structure of Thesis
This thesis is divided into seven chapters. Chapter One provides an introduction
of the research topic, with an overview and overall discussion on human performance
as well as its importance towards safety. The objectives of the study and its limitations
are also discussed in this chapter and the significance of the study is highlighted.
Chapter Two provides a review of existing human performance models, generic
models and theoretical frameworks. This chapter also reviews the relevant literature
related to the factors that form the proposed relationship of human performance. It
concludes with the summary of the importance significant findings from the literature.
Chapter Three reviews the proposed model of human performance for train
drivers. The discussion expands on the factors affecting human, workers activities,
working environment and safety towards the performance of the driver. Finally, this
chapter concluded with the research hypotheses.
Chapter Four illustrates the methods and procedures used in the study. It begins
with an explanation of the proposed model, which was developed based on the
literature review. The discussion continues on the instrument adaptation and
measurement, respondent characteristics and survey implementation, method of data
analysis and finally the overview of structural equation modelling (SEM) technique.

8
Chapter Five presents the results of the survey. It consists of data screening and
preparation for SEM applications, reliability analysis and factor analysis. The
developed model had been tested for measurement model and validated through
structural model; which the hypotheses had been tested.
Chapter Six summarizes the findings, discusses the effects and implications and
benchmarks the model with those from other studies.
Chapter Seven concludes the overall findings and offer suggestions for future
research.

9
CHAPTER 2 : LITERATURE REVIEW
2.1 Introduction
This chapter will explore the various literatures that are relevant to the topic of
this study. The review will include overviews on the concepts of human performance,
their relationship to the railway industry, and an evaluation of existing models and
frameworks. In addition, this review will also assist in identifying the research gaps,
and summarising the direction of this research.
2.2 Human Performance
Human performance concept provides a framework for understanding and
predicting factors affecting the performance of employees, which will contribute
positively to the overall success of a complex man-machine system (Pew & Baron,
1983). Traditionally, ergonomics assessments are concerned on the individual level,
such as those related to physical work, manual handling, workplaces, and equipment’s
used. However, recent trends in ergonomics are focusing on human factors at the
system level (Wilson, 2014), which acknowledges the interactions between various
components and influencing factors surrounding the employee (Marras & Hancock,
2014). This approach brings the individual factors back together, rather than evaluating
them separately. A broad area of ergonomics specialisation is addressed by
macroergonomics, which attempts to integrate every aspect of ergonomics into
consideration (Karsh et al., 2014).
The integration of influential factors of human performance has been proposed
by many researchers. For example, Ryan (1988) has discussed the needs in combining
theoretical issues with practical issues in the development of human performance

10
assessment system. Theoretical issues consist of human behaviour, performance
indicators, performance measures and logic model, whereas practical issues involve
objective safety criteria, objective performance data, sampling and validation. This
integration is necessary to correctly develop the model for a complex system
environment. Integrating these components of human performance measures would, in
theory, accurately represent vulnerabilities brought to the system performance and its
outputs (Gore & Jarvis, 2005). Due to the complexity in the system environment,
Baines et al. (2005) has categorised the influential factors of human performance into
three categories of ‘key human centred factors’, namely the individual (human),
physical environment and organisational environment. This theoretical framework
hypothesizes potential factors affecting workers performance would include the major
components of microergonomics and macroergonomics within an integrative
framework. The formation of theoretical framework has its basis on previous literatures
and the usual approach in developing such framework is to first list all potential factors.
These identified factors are then screened in accordance to the research objectives and
subsequently tested empirically using combinations of qualitative and quantitative
techniques.
Some studies have focused on a single factor only, enabling an in depth
evaluation of the individual factor. In some cases, even a small, insignificantly
perceived factor may have an effect in a considerable manner. For example, Juslén and
Tenner (2005) evaluated the effect of human performance with small modifications of
the workplace by changing the lighting environment. Subsequent model of the
employee performance with respect to the level of lighting was obtained, proving that a
small, insignificantly perceived factor can have significant effects on the overall results.
Investigations on human performance factors have been conducted across a wide
range of industries, such as in air traffic control systems, design processes in factories,

11
train driving activities and ship navigations (Baines et al., 2005; Gore & Smith, 2006;
Gould et al., 2009; Mason et al., 2005). Due to the increasing awareness of the
importance of human performance factors, many sectors have incorporated
considerations for human performance factors early on during the design stages of
systems and work environments.
In principal, human performance centres on two main questions, namely, “what
are the appropriate direct worker activities and associated performance measures on
which a framework should be based?’ and ‘what factors are most likely to have an
impact on these measures?’(Baines et al., 2005).
This study on the development of an integrated train driver performance model
aims to provide the necessary information to designers, engineers and the management
in understanding human performance for overall system improvements and increasing
the level of safety in railway management.
2.3 A brief about train driver in Malaysia
The railway is one of the oldest public transportation in Malaysia, introduced in
the late 19th
century. Initial development of the nation's railway system was established
in 1885 with the introduction of the British steam locomotives for transporting tin from
the tin mines in Taiping to Port Weld. These steam engines were later replaced by
diesel engines and electrified locomotives, which are being used until today. Currently,
there is only one train operating company (TOC) in Peninsular Malaysia, covering more
than 1600 km of railway routes throughout the country. In addition, ongoing expansion
of the current rail service is expected to increase the number of users and traffic
throughout the network. This requires gradual improvements to the overall performance
of the railway system either from the individual or the organisation, to ensure smooth
and safe running of the system. However, the level of interest in railway is relatively

12
low as compared to aviation and road transportations, most probably due to significantly
low number of accidents occurring on the railway system. Nevertheless, safety is a
major concern among rail authorities (Wilson & Norris, 2005b). Furthermore,
catastrophic events, such as the Ladbroke Grove accident in October 1999 has become a
catalyst for increasing the railway safety as well as improvement in human
factors application within the rail industry, particularly in the UK (Mills, 2005; Stanton
& Walker, 2011; Sutherland & Groombridge, 2001; Weyman et al., 2005).
Train drivers can be divided into three categories as drivers for freight train,
passenger train or the commuter train (urban light train). A train driver first would
undergo training at the Railway Academy, organised by the TOC. Upon completion of
the training, they will be assigned freight train driving duties, to assimilate them with
the working conditions. Experienced drivers are entrusted to operate the passenger
trains, and is aided with an assistant, to ensure the safely and smooth operation of the
locomotive.
A train driver is normally assigned an 8 hours shift per day, for six days a week.
A break of at least nine hours is given between every eight hours driving duties.
Running bungalows are provided by the TOC as accommodation facilities at designated
depots which allow the train drivers to rest between duty periods.
In addition to driving the trains, the drivers are also responsible to oversee any
problems during the journey such as occurrence of technical problems, natural disasters
and human errors. With safety as their main priority, the drivers would also need to
ensure train punctuality and avoidance of delays. Figure 2.1 shows the general overview
of the train driver’s routine which was developed based on Rules and Regulations Book,
Standard Operation Procedure of the train drivers.

13
2.4 Human performance in the railway system
The train driver is amongst the most important group in the railway system. In
Malaysia, even with the introduction of electric trains in 1995, the responsibilities and
functions of the drivers are still important. Among the challenges faced by train drivers
today are the increasing number of train services on single or double tracks with a
variety of freight trains, passenger trains, electric commuter trains and fast electric train
(Electric Train Service – ETS). These require increased attention of the driver and the
crew to avoid any difficulties or accidents throughout the train journey. However,
studies on human performance in the railway industry are still in its infancy in
Malaysia, and literatures on the subject are thus unavailable. For this reason, most of the
literature review for this study has relied on literatures from other countries, especially
from western nations.
Reporting in for today task
Took the locomotive at depots
Begin task at starting station
Coordinate time with the station manager
Changing info with the station manager
Gain authority to proceed and release
appropriate signal for leaving station block
Siren the hon after receiving hand signal
from the station manager
Go on with the journey abide by the rules and regulations
End task by handling work and
locomotives at station/depot
Figure 2.1: Train driving task

14
Performances of workers are important for the designers or engineers during the
design or improvement of equipment’s, interfaces, jobs or systems (Wilson, 2014).
Understanding of the human performance is not only done when the system is in place
and working, but can be as early on in design stage, which may reduce the potential of
error and improve the design, safety and effectiveness. Human performance in
ergonomics is not limited to safety, comfort and satisfaction. It can support the
reputation of the organisation, and its business strategy to stay competitive and
sustainable (Dul & Neumann, 2009).
In the railway industry, error-free operation is very critical to ensure the safety
of the system. Circumstances from any train-related accidents would incur high costs
and damage (Evans, 2011). Railway safety does not focus on the train locomotives only,
but also expands on aspects of the passengers, track staff, control room staff and other
relevant staff. Train drivers are one of the important stakeholders for ensuring safety of
passengers, the train locomotives and the system (Wilson, 2006; Wilson & Norris,
2005b). A landmark train accident in Ladbroke Grove in 5th
October 1999, with 400
injuries and 31 deaths, has triggered an extensive evaluation of railway safety in the
UK. It was reported that human error was the main cause of the accident, due to signal
passed at danger (SPAD) and the subsequent head-on collision events (Stanton &
Walker, 2011). Although rail ergonomics is evolving slower than other branches of
transport ergonomics (Wilson & Norris, 2005b), there is an increase in the level of
awareness on the importance of human factors in the railway industry, and is very
crucial for improving system reliability, safety and human performance (Clarke, 2005).
Human capabilities and limitations are the main factors which would contribute
to the safety of the individual and the system. These factors should be considered during
early stages of the design; corresponding to the needs, knowledge and characteristics of
the workers (Shahrokhi & Bernard, 2009). Improvements may be delayed if there is

15
lack of understanding on human performance of the organization (Genaidy et al., 2007).
Human performance measures are required to be used as a predictor in addressing the
increasing demand for improvements in system and safety, or as an objective tool to
evaluate the need to improve the design of work, equipment and the environments.
Table 2.1 shows a list of thirty two previous studies over the past twenty five
years on human performance in railway since 1986. At least seventeen factors affecting
the performance of train drivers were discussed in these studies. Each article have at
least discussed two or more factors, except some studies which have deliberated on the
general safety and human performance as the main discussion. Interrelations between
factors on the performance of the driver were also discussed in order to further
understand the influence of factors on one another.
Table 2.1 shows that safety / safety culture was the predominating factor
discussed by the researchers (12 out of 32). As highlighted previously, the level of
safety is crucial and will always be the highest priority in the railway industry. Three
studies have exclusively discussed on safety (Clarke, 1998; Farrington-Darby, Pickup,
et al., 2005; Ugajin, 1999). They highlighted the importance of the safety culture to
reduce the risk of accidents and to improve the level of safety in the organization. Other
researchers have examined the relationship between the safety and shiftwork of the train
driver. Joshi et al. (2001) have studied the interactions of the train driver's reaction
towards the train control system in shiftwork; and its potential for safety risk.
Researchers were also interested to evaluate human performance in relation to the
interactions of safety with other factors. For example, (Härmä et al., 2002) studied the
effect of irregular shift on sleepiness of the train drivers. This study has not only
focused on sleepiness but also has looked into its by-product in the form of fatigue.
They have recommended that adjustment on shift system may improve sleepiness
problem among train drivers.

16
Hamilton and Clarke (2005) proposed a model to describe performance of the
driver in relation to infrastructure features and operational conditions. Through the
proposed model, driver behaviour could be predicted by using performance times for
discrete actions. It had also utilised cognitive task analysis (CTA) to predict workload
and operator performance time. This study was focused on cognitive and mental
workload of the driver. It was hoped to identify human performance problems for the
train driver empirically.
The list shown in Table 2.1 summarises the distribution of interest among
researchers, which factors were discussed the most and gives a general overview of
human performance study involving train driver around the world.

17
Table 2.1: Previous studies on factors relating to human performance in rail.
*WL = workload
Variables
Co
gn
itiv
e
Men
tal
WL
Ph
ysi
cal
WL
Ale
rtn
ess
Aw
aren
ess
Str
ess
Wo
rkin
g t
ask
Vig
ilan
ce
Fat
igu
e
En
vir
on
men
t
Wo
rkin
g
con
dit
ion
s
Sle
ep
Sh
ift
wo
rk
Job
ro
tati
on
/
sch
edu
lin
g
Saf
ety
/sa
fety
cult
ure
Hu
man
per
form
ance
1 Austin and Drummond (1986) X X X
2 Edkins and Pollock (1997) X X
3 Clarke (1998) X
4 Ugajin (1999) X
5 Felici et al. (2000) X X
6 Joshi et al. (2001) X X
7 Kecklund et al. (2001) X X X X X
8 Härmä et al. (2002) X X X
9 Hockey and Carrigan (2003) X X
10 Cothereau et al. (2004) X
11 McLeod et al. (2005) X X
12 Jansson et al. (2005) X X

18
Table 2.1: Previous studies on factors relating to human performance in rail (cont.)
*WL = workload
Variables
Co
gn
itiv
e
Men
tal
WL
Ph
ysi
cal
WL
Ale
rtn
ess
Aw
aren
ess
Str
ess
Wo
rkin
g t
ask
Vig
ilan
ce
Fat
igu
e
En
vir
on
men
t
Wo
rkin
g
con
dit
ion
s
Sle
ep
Sh
ift
wo
rk
Job
ro
tati
on
/
sch
edu
lin
g
Saf
ety
/sa
fety
cult
ure
Hu
man
per
form
ance
13 Hamilton and Clarke (2005) X X X X
14 Lamond et al. (2005) X X
15 Pickup et al. (2005) X
16 Farrington-Darby, Wilson, et al. (2005) X
17 Murali (2005) X X
18 Jones et al. (2005) X
19 Shepherd and Marshall (2005) X
20 Dorrian et al. (2006) X
21 Luke (2006) X X
22 Philip and Åkerstedt (2006) X X
23 Dorrian et al. (2007) X X X
24 Chau et al. (2007) X

19
Table 2.1: Previous studies on factors relating to human performance in rail (cont.)
Variables
Co
gn
itiv
e
Men
tal
WL
Ph
ysi
cal
WL
Ale
rtn
ess
Aw
aren
ess
Str
ess
Wo
rkin
g t
ask
Vig
ilan
ce
Fat
igu
e
En
vir
on
men
t
Wo
rkin
g
con
dit
ion
s
Sle
ep
Sh
ift
wo
rk
Job
ro
tati
on
/
sch
edu
lin
g
Saf
ety
/sa
fety
cult
ure
Hu
man
per
form
ance
25 Jay et al. (2008) X X
26 Darwent et al. (2008) X
27 Kumar and P.K. (2008) X X X
28 Baysari et al. (2008) X
29 Birlik (2009) X
30 Koohi (2009) X
31 Ku and Smith (2010) X X
32 Dorrian et al. (2011) X X X X

20
2.5 Significant human performance models
Human performance concept offers a comprehensive understanding on the
relationship between human and its surrounding (equipment and environment) (Wilson,
1990). Consequently, modelling of human performance enable us to identify human
performance problems in an objective and quantifiable manner (Hamilton & Clarke,
2005). The model is an attempt to integrate almost all potential factors together, as a
simplified tool which includes every items involved into consideration.
Most researchers have tended to limit their research scope to individual
evaluation of factors as discussed in previous section. Few have integrated these factors
to be evaluated as a whole package. Prior to developing the integrated human
performance model, it is necessary to discuss existing performance model, from which
the basic model of the human performance can be improved. From the review,
commonality and differences can be listed and the most appropriate model can be
subsequently developed.
2.5.1 The cognitive task analysis (CTA) model
Hamilton & Clarke (2005) proposes the CTA (Cognitive Task Analysis) model,
as shown in Figure 2.2, which emphasizes the interaction of the train driver
performance with infrastructure features and operational conditions. It also intended to
evaluate the infrastructure and cab drivability as a general tool for drivability
assessment.
By utilizing cognitive theory and modeling techniques, this model measures
performance of the driver’s ability to interact and process the information between
infrastructures at the lineside and cab interfaces. Train speed is the major parameter to
be measured, as it results from the driver’s action as well as perception and cognition.

21
This model is capable in predicting performance time, workload and error proneness in
different operational conditions. The CTA model will benefit signals passed at danger
(SPAD) risk management strategies and the designers of cabs and infrastructures.
One advantage of this model is that it is very useful to evaluate existing railway
facilities, especially near train stations, road crossing and in the city. It could also be
used as an assessment tool for new facilities or simulated for newly proposed facilities.
Every detail of facilities along the rail track could be investigated to predict possible
distractions or disturbances that could affect the driver's alertness and cognitive
workload.
The major setback of this model is that it could not be used for generalisation
purposes. This model is most suitable for localised evaluations, based on the designated
Figure 2.2: Human capabilities and the recognize-act cycle in CTA model
(Hamilton & Clarke, 2005)

22
area of study. In addition, it only focuses one very few aspect of human performance i.e.
interaction of mental workload with infrastructure facilities and alertness.
2.5.2 The Situational Model
The Situational Model, developed by McLeod, Walker and Moray (2005),
depicts an analysis of train driver performance towards Automatic Warning System
(AWS). The objective of this model, shown in Figure 2.3, is to understand and assess
the risks of driver unreliability associated with extended use of AWS where existing
simple information-processing based models are considered inadequate. The extended
AWS may create a number of cognitive complexities to the driver as the system
depends on the driver to interpret the alert, since there can be inaccurate signals in-cab
visual reminder and time delays for 'active' information which may vary from a few
seconds to several minutes.
It is important to understand performance and cognition of the driver in the
context and situation at the time a signal is intended to influence driver's behaviours.
This situational model is used as a guide to identify factors that might be important
influences on the driver’s state of mind leading up to the time the AWS signal is
encountered. It is evident that the model focuses on the driving performance at a
specific time, in a specific situation and specific content with regards to AWS.

23
Figure 2.3: Situational model of driver performance in interacting with AWS
(McLeod et al., 2005)
Although the model has been claimed as the best method to examine real-time
cognition, it has limited usage in assessing the level of risk associated with extended
AWS in predicting driver’s reliability. It is working model which has been used for
predicting real-time cognition of train driver reaction towards AWS in the cab. It differs
from information-processing based approaches which unable to predict situational
factors, at real-time.
2.5.3 Bailey model (1996)
Bailey (1996) proposed three elements required when predicting human
performance, which are a) understanding of the human, b) the activity being performed
and c) the context in which it is performed. In this generic model, as shown in Figure

24
2.4, the human factor becomes the major element, which influences the overall
performance either positively or negatively.
Human includes the complex system of sensors, brain processing and
responders, which affect a wide range of capabilities. In this generic model, the sensors
would include vision and hearing; the brain processing would include the ability to
think, reasoning and decision making and the responders would include the functions of
arms, fingers and mouth.
A system designer can propose the best design but do not have much control on
the user (human). Alternatively, they could control certain conditions on their
designated activities. Factors affecting activity, which has the potential to degrade
performance, should be recognized by the designers. Bailey’s model final consideration
is context; referring to the conditions in which the particular activity is performed by a
human. Significant difference would be observed when the same activity is performed
in a different place or weather conditions, which are referred to as context. Thus the
Bailey fundamental model does not consider certain part of human. Instead it correlates
every aspect for better understanding of human performance.
Human
Activity
Context
Figure 2.4: Bailey’s basic model of human performance (Bailey, 1996)

25
However, in its fundamental form, the Bailey model is a general hypothetical
and theoretical model. Although empirical studies based on the model is yet to be
conducted, it agrees well with macroergonomics concept which integrates affecting
components with human as the main concern (Imada & Carayon, 2008). Baines et al.
(2005) proposed three main key human centered groups in his theoretical framework,
which are very similar to the macroergonomics model and concepts. These broad
models would possibly suit the evaluations for any kind of human activities, although
further studies should be conducted to verify their suitability.
2.5.4 Chang’s extended SHEL model (2010)
Chang et al. (2010) examined the interactions of interfaces in air traffic control
(ATC) by using extended SHEL model to describe ATC practice systematically. The
original SHEL model, introduced by Edwards (1972), had been used by the
International Civil Aviation Organization (ICAO) to understand human performance
factors in aviation safety. A complete system operates when each of components
interacted with each other. The effect of these interactions is provided by the SHEL
model, where S (software – rules, procedures, computer programs, symbiology, etc.), H
(hardware – machine), E (environment – the situation in which other components must
function) and L (liveware -human) are the components of the model. Chang et al. (2010)
described the components (S,H,E and L) as the human performance factors while the
interactions between human performance factors as the human performance interfaces
of the SHEL model. In this extended model, Chang et al. (2010) has also included the
organisational aspects in their effort to understand the nature of human error. They
tested the liveware (human) component interacting with other components; and have
found a significant role in the interactions between controllers and the organisation on
the human performance level. Thus it was concluded that the individual differences or

26
peer influences have fewer relevant roles as compared to organisation influences when
interacting with the software (S), hardware (H) and environment (E) of the ATC system,
as shown in Figure 2.5.
By using questionnaire surveys developed from various literatures, they have
measured six constructs and formulated a model based on structural equation modelling
(SEM) approach. The model was an effort to integrate the interactions of human with
other interfaces (factors/components). The extended SHEL model was used with clearly
stated interactions between human – human, which other models did not highlight. In
brief, this model can be used to describe the nature of human error, problem
identification and investigation into sources of problem. The model by its nature is very
critical, since is it used to assess the performance of ATC in the aviation industry. It can
be still be applicable to other type of controllers such as in rail control system and
building controllers.
Figure 2.5: The structural model for extended SHEL research model (Chang &
Yeh, 2010)
L
Knowledge DM Skills
Situation
awareness
Training
Safety culture
Communication
Comfort
Workplace
Automation
Maintenance
Equipment
Procedures
Checklists
Teamwork
Coordination
L-L
L-E
L-H
L-S
L-O
27
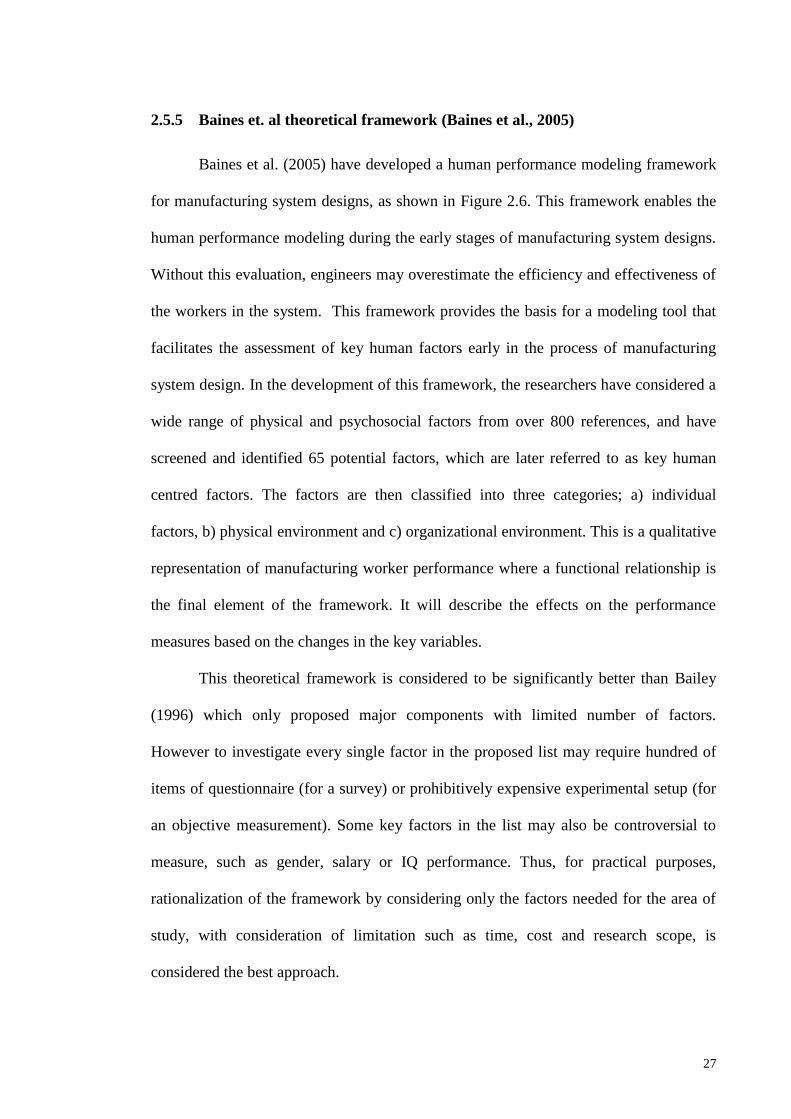
2.5.5 Baines et. al theoretical framework (Baines et al., 2005)
Baines et al. (2005) have developed a human performance modeling framework
for manufacturing system designs, as shown in Figure 2.6. This framework enables the
human performance modeling during the early stages of manufacturing system designs.
Without this evaluation, engineers may overestimate the efficiency and effectiveness of
the workers in the system. This framework provides the basis for a modeling tool that
facilitates the assessment of key human factors early in the process of manufacturing
system design. In the development of this framework, the researchers have considered a
wide range of physical and psychosocial factors from over 800 references, and have
screened and identified 65 potential factors, which are later referred to as key human
centred factors. The factors are then classified into three categories; a) individual
factors, b) physical environment and c) organizational environment. This is a qualitative
representation of manufacturing worker performance where a functional relationship is
the final element of the framework. It will describe the effects on the performance
measures based on the changes in the key variables.
This theoretical framework is considered to be significantly better than Bailey
(1996) which only proposed major components with limited number of factors.
However to investigate every single factor in the proposed list may require hundred of
items of questionnaire (for a survey) or prohibitively expensive experimental setup (for
an objective measurement). Some key factors in the list may also be controversial to
measure, such as gender, salary or IQ performance. Thus, for practical purposes,
rationalization of the framework by considering only the factors needed for the area of
study, with consideration of limitation such as time, cost and research scope, is
considered the best approach.

28
2.6 Comparison of selected human performance models
Three models / frameworks, proposed by Chang and Yeh (2010), Baines et al.
(2005) and Bailey (1996), were selected for comparison to provide the basis for the
development of the new model for this study. The comparison of the three models is
shown in Table 2.2. These models were selected because it’s proposed the basic
grouping or categorization of factors which covers the three main important areas
relating to the major domains of ergonomics, namely, human – environment – machine;
compared to other models. The basic categorization provides clear segmentation of
influential factors of the human performance; therefore it will aid to develop a
comprehensive model which holistically covers every aspects of the human
performance.
The comparison was made based on the factors listed and explained by each of
model / framework. Then, these factors were grouped depending on similarities of the
∆𝑃𝑖𝑗 = 𝑓 ∆𝑉𝑗
Dependability Distribution
Activity Time Distribution
Error Rate Distribution
Absenteeism Rate
Accident Rate
Staff Turnover Rate
Discrete Event
Simulation
Product Based Measures
(e.g. lead-time, volume)
Resource Based Measures
(e.g. availability, utilization)
Individual
Physical environment
Organisational environment
Functional
Human Performance
Output Variables
Existing DES Modelling Capability
Key Human Centered Factors
‘g’ (general cognitive ability)
Conscientiousness
Extroversion
Neuroticism
Organisational Commitment
Job satisfaction
Age
Work-related Attitudes, Beliefs, Values
Work Ethic
Goals
Agreeableness
Openness
Gender
IQ
Locus of Control
Skills level, range and experience
Noise level
Air temperature
Light level
Humidity
Ventilation
Shift patterns
Work teams
Maintenance
Training
Job rotation
Communication
Diversity
Hierarchical structure
Climate
Figure 2.6: The human performance modelling theoretical framework
(Baines et al., 2005)
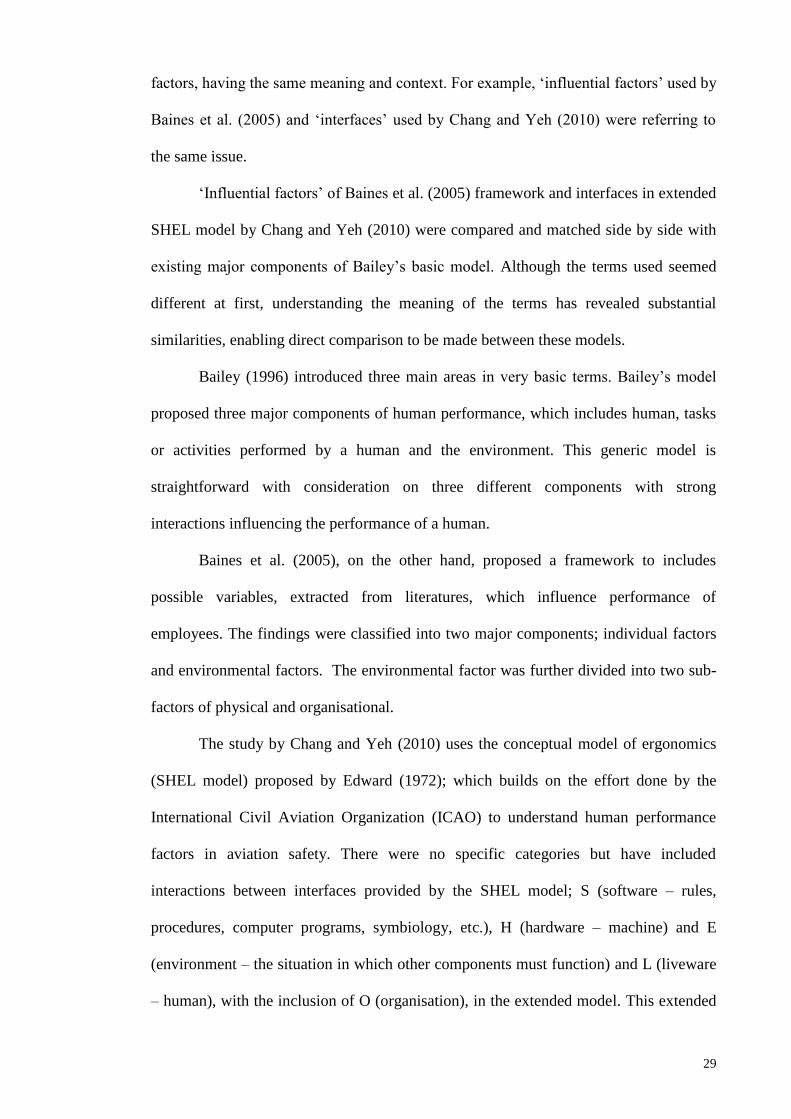
29
factors, having the same meaning and context. For example, ‘influential factors’ used by
Baines et al. (2005) and ‘interfaces’ used by Chang and Yeh (2010) were referring to
the same issue.
‘Influential factors’ of Baines et al. (2005) framework and interfaces in extended
SHEL model by Chang and Yeh (2010) were compared and matched side by side with
existing major components of Bailey’s basic model. Although the terms used seemed
different at first, understanding the meaning of the terms has revealed substantial
similarities, enabling direct comparison to be made between these models.
Bailey (1996) introduced three main areas in very basic terms. Bailey’s model
proposed three major components of human performance, which includes human, tasks
or activities performed by a human and the environment. This generic model is
straightforward with consideration on three different components with strong
interactions influencing the performance of a human.
Baines et al. (2005), on the other hand, proposed a framework to includes
possible variables, extracted from literatures, which influence performance of
employees. The findings were classified into two major components; individual factors
and environmental factors. The environmental factor was further divided into two sub-
factors of physical and organisational.
The study by Chang and Yeh (2010) uses the conceptual model of ergonomics
(SHEL model) proposed by Edward (1972); which builds on the effort done by the
International Civil Aviation Organization (ICAO) to understand human performance
factors in aviation safety. There were no specific categories but have included
interactions between interfaces provided by the SHEL model; S (software – rules,
procedures, computer programs, symbiology, etc.), H (hardware – machine) and E
(environment – the situation in which other components must function) and L (liveware
– human), with the inclusion of O (organisation), in the extended model. This extended

30
SHEL model with an additional ‘liveware-organisation’ interface addresses the
importance of organisational factors to the human performance.
The main factor of human performance studies is the ‘human’ itself. Bailey
named it as ‘human’, Baines termed it as ‘individual factors’ while Chang and Yeh
(Edward, 1972) referred to it as ‘liveware’. Bailey outlined that human includes a
complex system of sensors (vision and hearing), brain processing (the ability to think,
reasoning and decision making) and responders (arms, fingers and a mouth). These are
the basic and fundamental component of a human performing a job and reacting with
the environment. The ‘individual factor’, as described by Baines, contains six major
categories - personality, demographics, physiology, cognition, motivation and skills;
which is a detailed list of factors affecting human performance for the human
component. In contrast, the ‘human’ components in extended SHEL model are the
‘liveware’ and interface of ‘liveware – liveware’. Similar to ‘individual factors’,
liveware consider personal attributes of the individual. ‘Liveware – liveware’ interface
refers to the relationships between workers (controllers) that are characterised by social
psychological aspects of the team, including cooperation, teamwork, leadership, and
personality interactions. Researchers are beginning to appreciate the interactions of
human with its surroundings; including environment, organisation, machineries, and
technologies (Marras & Hancock, 2014). The concept that human interactions are
actually part of human factor system discipline is mentioned in recent literatures
(Wilson, 2014). Human performance studies could not proceed without the inclusion of
the ‘human’ aspect, and it is very challenging since human may limit the system and
widens the range of system elements and dimensions that are needed to be considered
(Carayon & Smith, 2000).
Alongside the ‘human’ component or domain, ‘activity’ is another important
domain which interacts with ‘human’. This was proposed by Bailey et. al (1996) to refer

31
to the activity being performed by a human. As an employee, performing the job is one
of the activities to be completed. There are various types of jobs depending on the
nature of the business. However, Baines et. al (2005) did not include the activity
component in the framework developed for the manufacturing activities. In the SHEL
model, the interaction between liveware (human) with hardware is termed the human–
machine interface/ interaction. It also means the interactions between the workers
(controller) and the physical aspects of the system that are provided to perform the
designated tasks, including display and control equipment, automation facilities,
maintenance and recovery facilities, and visual facilities. This domain is significant to
the human performance as it leads to various impacts depending on the demand of the
job and how it is performed. It may cause either positive or negative impact on the
employee such as productivity, job-related tension, high performance, job satisfaction
and stress (Schaufeli & Bakker, 2004).
Baines et. al (2005) proposed a more comprehensive list as compared to Bailey
et al (1996). The list comprised of physical and organisational factors which includes
the influential items in details. Baines et. al (2005) divided the environmental factors
into two categories; physical and organisational, based on its nature. The physical
environmental factors relate to the physical environment of the work place such as
humidity, temperatures and lighting. This relates directly on physical comfortness,
safety, health issue, hazard and ergonomics. Similarly, the extended SHEL model by
Chang and Yeh (2010) are comparable to the model by Baines (2005) in their definition
of the ‘liveware-environment’ and ‘liveware – organisational’ interfaces. There are
numerous studies on the topic of physical environmental aspect as it is very influential
and significant to the performance of an employee. In contrast, the organisational
environment is related to the behaviour, culture and ethics of the organisation. This
leads to job satisfaction and other psychological issues which are very significant and

32
relevant nowadays. In addition, the interaction with non – physical aspect of the system
including procedures, rules, checklists, documentation, maps and charts, and computer
software are considered as part of the evaluation.
Table 2.2 summarises the comparison of these models, highlighting the factor
groups that affects the performance of a human at work. The list comprehensively
shortlists more than sixty influencing factors which can be applicable to a wide
spectrum of industries. To consider all factors in an evaluation may be impractical for a
specific study, so it is recommended that the researcher carefully chooses the influential
factors most relevant to their particular studies.

33
Table 2.2: Comparison table of human performance models and frameworks
Bailey et. al (1996) Baines et. al (2005) Chang & Yeh (2010)
Human
includes complex system of sensors,
brain processing and
responders
sensors - vision and
hearing;
brain processing - the
ability to think, reasoning and decision
making
responders - arms, fingers and a mouth
Individual
‘g’ (General cognitive ability)
Conscientiousness
Extroversion
Neuroticism
Organizational commitment
Job satisfaction
Age
Work-related attitudes, beliefs, values
Work ethic
Goals
Agreeableness
Openness
Gender
IQ
Locus of control
Skills, level, range and experience
Lifestyle
Sleep patterns
Health
Biorhythms
Circadian rhythms
Family status
Education
Strength/stamina
Attention
Concentration
Ethnicity
Religion
Adaptability
Schemas
Diet
Agility/dexterity
Analytic/creative
Form
Liveware
personal attributes of the individual controller,
including knowledge and
experience, attitude and behaviour, situation
awareness, decision
making skills, and health.
Liveware – liveware
the relationships between workers (controllers) that
are characterised by social psychological
aspects of the team,
including cooperation,
teamwork, leadership, and
personality interactions.
Activity
Activity being performed by a human
Liveware – hardware
referred to as the human–machine interface/
interaction
interaction between the
workers and the physical aspects of the system that
are provided to perform
tasks,
including monitor and
control equipment,
automation facilities, maintenance and recovery
facilities, and visual
facilities.
Context
place, time and environment of the
particular activity is
performed by a human
e.g. : there is a very
significant different when the same activity
performed in different
place and weather
Physical environment
Noise level
Air temperature
Light level
Humidity
Ventilation
Carbon monoxide
Ozone
Vibration frequency
and intensity
Daylight/(full spectrum) light
Carbon dioxide
Noise frequency
Oxygen
Light frequency/colour
Noise duration
Lighting/glare
Lighting/reflections
Noise predictability
Liveware – environment
the interaction between the controller and the
operating environment in
which the tasks are performed
including workplace design, noise, temperature,
lighting, air quality, and
relaxation settings.
Organisational environment
Shift patterns
Work teams
Maintenance
Training
Job rotation
Communication
Diversity
Hierarchical structure
Climate
Leadership
Payment systems
Recruitment/orientation
Employment security
Liveware – organisation
the interaction between the controller and the
organisational aspects of the system
including workload allocation, organisational
structure, policies and
rules, communication, safety culture, and
training.
Liveware – software
the interaction between the controller and the non-
physical aspects of the system that are required to
perform tasks,
including procedures, rules, checklists,
documentation, maps and charts, and computer
software.

34
2.7 Summary
This chapter has provided an essential review of the importance of human
performance study in the context of the transportation industries. Several models and
frameworks related to the performance of an employee were discussed. Past literatures
on human performance of the train drivers provides an understanding of the affecting
factors and its interacting effects. It was found that most studies have focused on
individual factors, with less attention on the interactions between these influencing
factors. Hamilton & Clarke (2005) proposes the CTA (Cognitive Task Analysis) model
emphasizes the interaction of the train driver performance with infrastructure features
and operational conditions. This model could be used as an assessment tool for new
facilities or simulated for newly proposed facilities. Meanwhile, the situational model
developed by McLeod, Walker and Moray (2005) is used as a guide to identify factors
that might be important influences on the driver’s state of mind leading up to the time
the AWS signal is encountered. Three models / frameworks, proposed by Chang and
Yeh (2010), Baines et al. (2005) and Bailey (1996), were selected for comparison to
provide the basis for the development of the new model for this study as discussed in
Section 2.6.
Several theoretical frameworks were analysed to understand the overall view of
the factors which can affect the performance of the train drivers. The literatures also
highlighted the need for collective evaluations of the factors, without neglecting other
factors which may interrelate. To evaluate individual factors, there are several
established methods used by researchers, whether through objective or subjective
measurements. Past methods have also shown that a survey using questionnaire is still
valid and reliable for collecting the data need to measure the interacting factors of
employee’s performance (Annett, 2002). The review of the literatures has provided the
basis to develop the new integrated framework for this study. Thus, this study proposes

35
a development of an integrated model to focus on the interacting factors influencing the
performance of train drivers

36
CHAPTER 3 : THEORETICAL FRAMEWORK AND
HYPOTHESES
3.1 Introduction
This chapter will discuss and develop the research framework which will be
used for the remainder of this study. The discussion will also focus on the factors
affecting human performance, which are considered as independent variables. Finally,
the relevant hypotheses would be formulated accordingly.
3.2 Theoretical Framework
The frameworks of Bailey (1996), Baines et al. (2005) and the model of Chang
and Yeh (2010) were referred to in developing the theoretical framework of this study.
These models were chosen as a reference because of their clear approach in grouping
the factors/variables. The comparison made between the three frameworks has shown
matching similarities even though the terminologies used were different.
The three main domains identified are human, workers' activities and context (or
working environment) (Bailey, 1996; Baines et al., 2005; Chang & Yeh, 2010). In the
context of the performance of train drivers, an additional aspect which should be
considered is safety. Consideration of safety awareness is believed to be important for
improved performance of the train drivers. Next sections will discuss details of the
domains and its factors accordingly.

37
3.3 Factors affecting human
In a complex system, the human itself is the most important component to be
measured, as highlighted by the frameworks of Bailey (1996), Baines et al. (2005) and
the model developed by Chang and Yeh (2010). The person (human/employee) and the
process form a closed loop system to ensure the success of the working system (Wilson,
1995). For this study, five independent variables are chosen which are related to the
human domain. The variables are occupational stress, job related tension, job
satisfaction, fatigue and sleepiness. These variables are discussed in detail in following
sections.
Job demand Driving task
Safety Working
environment
Human
Performance
Occupational
stress
Activities
Job
satisfaction
Fatigue
H1
H2
H3
H5
H6 H7
H4
H8 Sleepiness
Job-related
tension
H9
Context
Figure 3.1: The theoretical framework of Malaysian train driver performance

38
3.3.1 Occupational Stress and Job-related Tension (JRT)
From a psychological point of view, stress is a descriptive term used to describe
the feeling of pressure and strain. This term is also referred to in biological sciences,
including stress on physiological or biological nature. The physical body would respond
accordingly to the stress experienced, for example, responding to extreme
environments, temperature, noise, diseases, sleepiness as well as emotions (Bourne &
Yaroush, 2003).
Occupational stress or job stress describes the stress caused by working and the
job environment (Trivellas et al., 2013). Workers feel the pressure and strain due to
environmental factors, leading to experiences of occupational stress. Poor job design,
layout setting, and high workload are highly potential stressors (Jou et al., 2013). These
stressors contribute to the increase level of stress among workers during their
interaction with the work environment and while completing their job tasks. Reactions
from this stress will result in job-related tension (JRT), which are workers experiencing
stress while working (Yahaya et al., 2009 ). In addition, job-related tension would cause
high employee turnover and decrease in job satisfaction (Boyd et al., 2009).
Interactions between these two elements (worker-work environment) require
proper planning. Job design can be used to identify suitable arrangements for the
workers to work in the best conditions and environment (Genaidy et al., 2007). The
interaction between workers – work environment is critical especially in the
transportation industry. The interaction between human (worker) and the environment
has been highlighted by (Bailey, 1996; Baines et al., 2005; Chang & Yeh, 2010) . Thus,
failure to meet this general requirement would usually create uncomfortable
environment and leads to stress of the worker in the form of occupational stress.

39
As highlighted in the effort-reward imbalance model proposed by Tsutsumi and
Kawakami (2004), it is advisable to measure occupational stress simultaneously with
job satisfaction. Thus, for this study, the following hypotheses are posited:
H1 Occupational stress has a significant effect on the performance of train
drivers
H2 Job-related tension has a significant effect on the performance of train drivers
3.3.2 Job Satisfaction
Job satisfaction is a feeling by an employee towards their job, work
environments and other affecting factors such as amount of salary, motivation and
working hours (Jou et al., 2013). Rewards as a form of occupational motivation will
affect the level of effort given by the employees. Careful consideration in the effort and
reward system can provide improved task accomplishment and job satisfaction
(Genaidy et al., 2007). Therefore, it is important for the organization to understand what
motivates employees and how they are motivated.
Improved working environment will increase level of job satisfaction, which
leads to increased human performance. Juslén and Tenner (2005) found that the
performance of employee increases as the lighting conditions were upgraded. In
addition, it was found that job satisfaction increases with age of employee. Older
employee were found to have the ability adapting to the working environment and make
the necessary adjustments to satisfy their expectations (Dawal et al., 2009). The
tendency of employee to resign will be reduced if the job satisfaction level is increased,
which can be brought about with decrease in office conflicts and improved physical
work environment (Jou et al., 2013).

40
Job satisfaction is one of the important construct to measure performance of
employees. In the past, job satisfaction was only concerned with the perception and
feeling of employees towards their job and working environment. However, in recent
years, job satisfaction does not only address the satisfaction of the employee, but is also
seen as a measure for the organizational performance as a whole (Genaidy et al., 2007).
Thus the following hypothesis is proposed on job satisfaction:
H3 Job satisfaction has a significant effect on the performance of train drivers
3.3.3 Fatigue
In addition to occupational stress, fatigue is also a serious issue for the rail
industry which can affect the safety of the railway operations (Desmond & Matthews,
2009; Dorrian et al., 2007). In contrast to stress, which is a feeling caused by pressure or
strain, fatigue is the consequence or by-product of physical activities (Williamson et al.,
2011). Fatigue is a state between being awake and asleep, and its onset is thought to be
gradual, resulting in the person falling asleep. Investigators have directly related
drivers’ fatigue with safety (Strahan et al., 2008), vigilance, performance and
inefficiency of work (Dorrian et al., 2006, 2007).
The nature of driving task includes interacting with the environment,
monotonous driving and shiftwork (Dorrian et al., 2011; Fletcher & Dawson, 2001).
Shiftwork is a common routine for train driver. Since the duty roster is based on the
train schedule, drivers are likely to experience work-related fatigue, which will
significantly affect the level of safety (Dorrian et al., 2006). Shiftworks are usually
associated with sleep problem and can lead to work-related fatigue if the drivers sleep
cycles are irregular (Fletcher & Dawson, 2001).

41
Fletcher and Dawson (2001) have measured the alertness and performance of
193 train drivers in Australia. Their analysis has shown that fatigue significantly
correlated with alertness and performance. Their developed model was able to predict
that driver fatigue increases for each consecutive working days, although it could not
predict alertness and performance. A high level of alertness was registered for drivers
working within the 8 hours of shiftwork. However the score deteriorates if the workshift
exceeds 8 hours. The studies have also stressed on the importance of providing
sufficient sleep and rest for the drivers after period of shift. The model has given the
correlation between fatigue, alertness and performance on the safety of the entire
operations.
Subsequent studies have further evaluated the effect of fatigue during train
driving, examining the relationship between fatigue, braking behaviour and speeding
during speed restrictions (Dorrian et al., 2006, 2007). It was found that fatigue increases
over time and resulted in decreased vigilance and efficiency. Highly-fatigued drivers
were found to be applying less braking at speed restriction sections and had often
exceeded the speed limit by more than 10%. On the other hand, some fatigued drivers
were also found to have lowered decision-making ability and were likely to apply over
braking which increased fuel consumptions and unnecessary wear on the brake systems.
Work-related accidents are the leading cause of work-related injury and death in many
countries, and many studies have been carried out to identify the causal factors. Strahan
et al. (2008) have studied the relationship between safety-climate, occupational stress
and work-related driver fatigue. It was found that fatigue-related behaviour can be
predicted through occupational stress measures. This significant predictor can assist the
organisation or the company to recognise possible fatigue-related behaviours and risks
in their employee and operations. The organisation can then take necessary remedial

42
actions to reduce the stress level of the employee as early as possible (Bourne &
Yaroush, 2003).
The relationship between safety and fatigue has been proven by both simulated
and actual case studies (Horrey et al., 2011; Williamson et al., 2011). The effect of
fatigue is experienced across a wide range of occupations such as in healthcare and
medical services (Ross, 2008), manufacturing sector (Dawson et al., 2011), road driving
(Kee et al., 2010) as well as train driving (Dorrian et al., 2011; Härmä et al., 2002).
Consequently, the following hypothesis is posited:
H4 Fatigue has a significant effect on the performance of train drivers
3.3.4 Sleepiness
Sleepiness is defined as the tendency to fall asleep whereas fatigue generally
indicates a lack of energy (Shahid et al., 2010). Fatigue is reduced after a period of rest
while sleepiness is alleviated after sleeping. Sleepiness follows the circadian rhythm
with a low level of sleepiness during the morning and high levels during the evening
and night (Dahlgren, 2006). Studies of chronic restriction indicated that when the period
of restriction is not extended beyond 5 nights, the reduction of sleep to 5–6 hours per
night does not typically result in waking behavioural deficits. Individuals could restrict
their sleep to 4.7 hours per night for up to 5 nights, or to as little as 2.9 hours per night
for 2 nights, before the onset of behavioural deficits (Lamond et al., 2005).
Stone (2005) has noted that it is particularly important to provide sufficient time
between consecutive night shifts to allow for a nap prior to the subsequent night shift,
especially when sleep after the preceding shift has been insufficient. It is therefore

43
recommended that there should be adequate rest between shifts. A 12-hour minimum
rest period is the current requirement, and if adhered to, would be sufficient for most
types of work shift. A rest period of 14 hours between consecutive night shifts would be
desirable to allow for sufficient recovery. Lack of sleep of less than 5 hours sleep in a
24 hours period will significantly increase the fatigue-relationship and works error
Dorrian et al. (2011).
Akerstedt (1995) has indicated the relationship between shift work with
sleepiness, and has highlighted the effect of truncated sleep, longer waking time and
long hours of work on increased sleepiness. The sleep-wake cycle and its
synchronization with light-darkness and biological rhythms is disturbed by the shift
work, especially shift at night (Garbarino et al., 2002). In terms of occupational safety,
workplace sleepiness should be major concern of the company as the consequences of
the sleepiness during work hours result in catastrophic results, such as the 1986
Chernobyl nuclear power plant disaster (DeArmond & Chen, 2009). Various tools have
been developed to assess sleepiness such as the Epworth Sleepiness Scale (ESS) by
Johns (1991) to assess daytime sleepiness which is widely used by many researchers in
evaluation of workplace sleepiness.
Driving a train requires sustained attention of the driver, especially on long-haul
train services. The evaluation on train drivers performance would focus on the
relationship on hours of work, sleepiness, fatigue and vigilance (Philip & Åkerstedt,
2006). The work of the train driver is characterised by a working norm in shift,
monotonous driving, longer working hours and high safety requirements (Dorrian et al.,
2011). Accordingly, the following hypothesis is asserted:
H5 Sleepiness has a significant effect on the performance of train drivers

44
3.4 Workers activities
One of the important aspect which influences human performance is an activity
being performed by a human (Bailey, 1996). Activity is referred to as the job or task
performed by the employee, usually requested by the superior. In many industries, the
task or job is requested and communicated through the standard operating procedure
(SOP). Using the SOP, employees will follow the flow of work designed by the
management. If the company has a quality management system (QMS) in place, the job
will be properly documented in the manual or work procedure as required by the QMS.
With this SOP or procedure, the employees are guided and have proper documentation
for reference. Chang and Yeh (2010) referred to workers activity as liveware - hardware
interaction, referring to the interaction between the workers and the physical aspects of
the system.
3.4.1 Job demand
Work activities required by the management or superior can be summarised into
the job demand. Job demands refer to “physical, psychological, social, or organizational
aspects of the job that require sustained physical and/or psychological (cognitive and
emotional) effort or skills and are therefore associated with certain physiological and/or
psychological costs” (Schaufeli & Bakker, 2004). A number of research on employee
improvements and have utilised the Job Demand-Resources (JD-R) model (Brauchli et
al., 2013), and the relationship between job demand – job resources; burnout and work
engagement were studied for various types of occupations (Brauchli et al., 2013; Fernet
et al., 2004; Janssen et al., 2004; Mauno et al., 2007; Schaufeli & Bakker, 2004; Turner
et al., 2012). Job demand may become occupational stressors if the demand and
responses are not balanced such as in situations of high demand and requirements with

45
negative responses (Schaufeli & Bakker, 2004). However, there is a lack of information
on how job demand directly relates to human performance.
Therefore, in this study, job demand is selected as one of the influential factors
on the performance of the train driver. Thus, the following hypothesis is proposed:
H6 Job demand has a significant effect on the performance of train drivers
3.4.2 Driving task
Driving a locomotive requires dynamic control and involves real-time decision-
making. Drivers need to be alert and aware of the surroundings and take note of signals,
information, rule books requirements and safety messages throughout the journey
(Kecklund et al., 2001). Research on train-driving would focus on physical task or
mental-related task. Most studies conducted in the past have concentrated on physical
workload and fatigue, sleepiness and other factors related to physical effect from train-
driving activities as discussed in Section 2.4. However, recent studies have started to
explore on mental related effects such as driving attention and alertness, mental
workload and other mental stressors (Wilson & Norris, 2005a).
Monotonous driving for a long period may lead to fatigue of the driver, and
reduces their vigilance to monitor and respond to events and information received
throughout the journey (Jap et al., 2010). A series of studies conducted by Jap et al.
(2011) have evaluated the extent of fatigue in monotonous train-driving using
electroencephalography (EEG), and have recommended an early detection and
prediction system to ensure safety of the driving and the system.
Driving task is hypothesized as having significant relationship with the
performance of the train driver. Consequently, the following hypothesis is posited:
H7 Driving task has a significant effect on the performance of train drivers

46
3.5 Working environment
One important element which may influence the performance of train drivers is
the working environment. In this study, the environment factor would be referred to as
‘context’, a similar term used by Bailey (1996). Baines et al. (2005) divided the
environment into two (2) aspects; physical and organisational environment. This
interrelationship was also highlighted by Curry and McKinney (2006) to be an
important element in the investigation matrix of accidents. Past studies have
investigated direct relationships either between human-environment or human-machine;
without looking at the overall view of human – machine – environment
interrelationship. Thus, in this study, the environment (context) factor would be
simultaneously evaluated alongside the machine and human factors. The Venn-diagram
in Figure 3.2 shows the interrelationship between these three factors (Boff, 2006).
In the transportation industry, the working environment, in particular, the
physical environment is a significant stressor. Interactions between the worker and the
environment would affect the outcome of the job demand. In the study on bus drivers,
Kompier (1996) has found that the drivers would always complain about their
workplace conditions including the temperature, level of noise, seat and layout design,
high level of vibration and bad illuminations. It shows that the working environment for
transportation workers is important as their workplaces are dynamic and are exposed to
the natural environment. Results from bad working environment may influence other
constructs (i.e. stress, job-related tension etc.) as well as safety (Stanton & Salmon,
2011).

47
Chau et al. (2007), in their study on the effect of environmental factors on industrial
injuries and accidents among train drivers, have found that a quarter (24.5%) of the
causes of occupational injuries were from environmental factors. Environmental factors
includes the ground in bad condition, holes in the ground, a slippery ground due to rain,
humidity, snow, glazed frost, presence of grease or oil, encumbered ground, stone or
object on the ground, sloping ground, bank for railway, restricted work space, reduced
visibility during the night, reduced visibility during the daylight (premise poorly
lighted), cold, heat, wind, and rain.
It is clearly shown that environmental factors may affect the performance of
train drivers and have been discussed previously by several researchers in their models
and frameworks (Bailey, 1996; Baines et al., 2005; Chang & Yeh, 2010). Hence, the
working environment is hypothesized as having significant relationship with the
performance of the train driver.
H8 Working environment has a significant effect on the performance of train
drivers
Human Machine
Environment
Figure 3.2: Venn-diagram of Human-machine-environment relationship
(adapted from Boff (2006))

48
3.5.1 Working hours
The study on fatigue and shiftwork in UK train drivers by Stone (2005) have
shown that the duration of the shift length is a key factor leading to fatigue. The
research revealed that accident rates in shift workers are 25% higher on twelve-hours
shifts as compared to eight-hour shifts. Thus, it is important to restrict the amount of
overtime taken at the end of a shift. Furthermore, the impacts of long duty periods on
fatigue are likely to be most severe on night and early morning shifts. Long periods of
continuous duty, such as in continuous driving without a break, can significantly
increase the level of fatigue. It is therefore important to ensure that rest breaks are taken
at appropriate times in order to reduce risk. Ideally, breaks should last at least 15
minutes and free from any work-related activities.
Kecklund (1999) stated that as far as workload is concerned, it is important to
study the components of shifts over a 24-hours period. One point of particular
importance is the influence of working hours on the normal circadian rhythm of
wakefulness and sleep. Dahlgren (2006) conducted an experimental study in which
participants were followed for one work week with normal hours (8 hours) and another
week of overtime with 4 extra hours of regular work (12 hours) without any external
stress. The work hours were simply extended in time and work was performed at normal
pace. The results have shown that one week of overtime work with a moderate level of
workload was not associated with any major effect of physiological stress markers.
Nevertheless, sleep was negatively affected, with shorter sleeps during overtime work,
and increased problems with fatigue and sleepiness.

49
3.6 Safety
In the railway system, the safety level is crucial and the demand for a safe environment
is ever increasing. A number of studies have discussed on the safety in transportation;
including various aspects of safety, safety performance and safety culture (Stanton &
Salmon, 2011). Because of its importance, safety in train operating company (TOC) is
under the responsibility of the Occupational Safety and Health Department. This study
will incorporate safety in the proposed framework together with human factor, activity
and the environment.
The driver is the key person who operates the vehicle (vehicle is consider as the
machine in this particular case). The tasks as a driver are very demanding since they
have to fulfil many requests and requirements of work (Baysari et al., 2009). In
addition, they need to maintain their skill of driving, especially passenger trains, and
should be alert and vigilant of the environment during monotonous driving (Edkins &
Pollock, 1997; McLeod et al., 2005). These requirements of strict safety regulations
may conflict with the tight schedule demands. Such activities will lead to mental and
physical fatigue, which have been shown to deteriorate performance and safety levels
(Williamson et al., 2011). Accidents have been shown to be caused by human due to
fatigue and other related causes (Kim et al., 2010; Kirwan, 1990). Therefore, the safety
of the train journey and the passengers would mainly depend on the driver.
Accordingly, the following hypothesis is asserted:
H9 Safety has a significant effect on the performance of train drivers

50
3.7 Chapter Summary
This chapter have formulated the theoretical framework and hypotheses of this
study. The theoretical framework builds upon three prior models and macroergonomics
concepts. The three domains, namely ‘human’, ‘activity’ and ‘context’ are proposed
based on the comparison of these three existing models, as shown in Figure 3.3.
Figure 3.3: Comparison of human performance models / frameworks
Bailey et. al (1996) Baines et. al (2005) Chang & Yeh (2010)
Human Individual
Liveware
Physical
environment
Organisational
environment
Liveware - liveware
Liveware - environment
Liveware - hardware
Liveware - organisation
Liveware - software
Activity specific job task
Context
Place, time and
environment of
the particular
activity is
performed by a
human

51
Nine hypotheses are proposed for considerations and their results will be
discussed in the following chapters. The hypotheses which has significant effect on the
train drivers are:
H1 Occupational stress
H2 Job-related tension
H3 Job satisfaction
H4 Fatigue
H5 Sleepiness
H6 Job demand
H7 Driving task
H8 Working environment
H9 Safety

52
CHAPTER 4 : METHODOLOGY
4.1 Methodological Overview
This study utilises a quantitative research approach, based on eight main steps of
the research process (Bordens & Abbot, 2008). The steps, consist of idea, hypothesis
development, research design, population and sample, type of measurement, data
collection, data analysis and report writing. The preparation phase, outlined in Chapter
One and Two, involved a comprehensive literature review to identify current issues on
human performance and safety of train drivers in Malaysia and other regions, especially
in well developed nations such as from the United Kingdom (UK) and European
countries. The theoretical framework for this study was formulated from the analysis
and comparison of several existing frameworks and models. This framework and its
associated hypotheses were proposed in Chapter Three.
The next phase of the study is to select the most appropriate research design.
This phase would involve utilisation of relevant surveys and observation methods
consisting of observation and questionnaires distributions. The instruments to measure
are determined carefully to measure correlations between variables. The questionnaires
are thoroughly reviewed by experts and stakeholders to ensure validity of contents and
suitability of the questions before subsequent distribution to target respondents. SPSS
and Structural Equation Modeling (SEM) are used to screen, process and prepare the
collected data for analysis. These processes will be introduced in this chapter and
further explained in Chapter Five.
The final phase of this study will describe the correlation between human
performance and other influential factors from which a train driver performance model
would be developed using Structural Equation Modeling. Details of the research
methodology are illustrated in Figure 4.1.

53
Figure 4.1: The research process flow chart
Start
Review of the literature
Identify significant factors
Establish theoretical framework
Establish instrument
Expert
validation
Data collection (survey)
Data
Pre-
testing
Preliminary data analysis
Data screening Missing data
analysis
Common
method bias Response bias
Reliability
analysis
Factor analysis
Measurement model
Composite reliability
Convergent validity
Discriminant validity
Structural model
(Hypothesis testing)
The integrated model

54
4.2 Research Design
Research in ergonomics requires appropriate tools for gathering data and
information (Dempsey et al., 2005). The choice of tools, such as direct observations,
questionnaires, objective and subjective measurements, are selected depending on the
problem being investigated (Berlin et al., 2009).
In this study, subjective rating scales would be the main method used to gather
responses from the subjects and the environment (Annett, 2002; Wilson & Nigel, 1995).
Demand and effects of the employees’ wellbeing would be investigated to evaluate their
performance (Wilson, 1995). A questionnaire survey would be used to obtain individual
responses, which is known to be the best method for collecting perceptions and opinions
from the driver with regard to their performance (Ryan, Wilson, Sharples, Morrisroe, et
al., 2009).
4.3 The Survey Method
Past researchers have proposed a number of factors which are thought to affect
the performance of train drivers. However, to best understand the situation, it is
appropriate to obtain the responses and perceptions directly from the train drivers
themselves. For this study, the questionnaire-based survey method would be used to
collect these information, since the technique has been widely used by past researchers
in ergonomic studies (Annett, 2002). The information obtained from a well-designed
survey can be a good representation of the overall train driver population (Rattray &
Jones, 2007). The results from the survey can then be compared with their performance
scores rated by their superior in the Performance Management System (PMS); an
Employee Performance Standard Form – for Non-executive as attached in Appendix 1.

55
4.3.1 Self-administered questionnaire
The survey questionnaire used in this study was developed from the
combination of several existing validated measurements of past research. It is a
common practise to adopt and adapt existing validated measurements from established
sources (Ryan, Wilson, Sharples, Morrisroe, et al., 2009). The advantage of using
existing validated questionnaires is that the researcher does not need to reassess the
measurements for validity and reliability. In addition, newly collected data can be
compared easily with past results. Respondents would answer the questions
accordingly and the data gathered would be analysed using Statistical Package for the
Social Sciences (SPSS) and Smart PLS software.
The items of the newly adapted instrument were selected from several validated
measurements to measure the variables outlined in the theoretical framework. The
wordings chosen for the questionnaire items were made simple and understandable for
the respondents. It also needs to be logical, neatly organised, systematic and have good
structure (Rattray & Jones, 2007). The existing validated measurements, which are
worded in English, were carefully translated into Bahasa Malaysia (Malaysian
language) and verified by experts to ensure linguistic and contextual accuracy. The
translations were necessary since most of the respondents were well-versed only in
Bahasa Malaysia.
The final draft of the questionnaire consisted of seven sections, comprising of a
demographic section and six sections containing questions related to the constructs.
Each respondent were expected to complete the questionnaire within 45 minutes. The
outline of the questionnaire is summarized in Table 4.1 and a sample of the
questionnaire is attached in Appendix 2 and 3. The instrument consisted of 148-items
for measuring nine variables. Table 4.2 depicts the number of items, sources and
variables that had been measured by each item.

56
Table 4.1: Summary of the items of questionnaire for train drivers
Domains Variables /
Indicators
Literature
(Sources)
Items
(in coding)
HUMAN Job
satisfaction
(Ryan, Wilson, Sharples,
Morrisroe, et al., 2009)
JS1 – JS5
(Ryan, Wilson, Sharples,
Morrisroe, et al., 2009)
JS6 – JS8
Stress /
Occupational
Stress
(Ryan, Wilson, Sharples,
Morrisroe, et al., 2009)
STR1 – STR20
Job-related
tension
(Strahan et al., 2008) JRT1 – JRT15
Fatigue (Gradisar et al., 2007) Section 5
Q 1 – 7
Sleep
(Johns, 1991), (Johns, 1992),
(Johns, 1993), (Johns & Hoaking,
1997)
Epworth
Sleepiness Scale
ACTIVITY Job demand (Ryan, Wilson, Sharples,
Morrisroe, et al., 2009)
JCH1 – JCH6
(Austin & Drummond, 1986) JCH7
Driving task (Austin & Drummond, 1986) DT1 – DT5
CONTEXT Working
environment
and working
condition
(Ryan, Wilson, Sharples, &
Clarke, 2009; Ryan, Wilson,
Sharples, Morrisroe, et al., 2009)
WE1 – WE7
(Dawal, 2005) WE8 – WE15
(Austin & Drummond, 1986) WC1 – WC7
Safety (Austin & Drummond, 1986) SI1 – SI7
(Ryan, Wilson, Sharples,
Morrisroe, et al., 2009)
SC1 – SC15

57
Table 4.2: Summary of the questionnaire
Section Description Number of items
Section 1 Front page with description of study to the
respondent
6
Consent letter -
Section 2 Part A and B - Job satisfaction 8
Part C and D – Job characteristics 12
Part E – Job-related tension 15
Part F – Occupational stress 20
Section 3 Fatigue 13
Section 4 Part A – Working condition 7
Part B – Working environment 15
Section 5 Part A – Safety issue 7
Part B – Safety culture 15
Section 6 Flinders Fatigue Scale 7
Section 7 Epworth Sleepiness Scale 8
A brief description of each section is as follow:
Section 1
This demographic section contains six questions on gender, range of age,
duration of employment in the TOC, current position, duration of current post and
reporting depot. This information are important to understand the respondents’
background for subsequent correlation analysis.
The questionnaire booklet contains a cover letter to explain the purpose of the
study and researcher's contact information’s. Respondents are required to consent being
involved in the survey by filling in the agreement form included with the cover letter.
A small token of appreciation was given to all respondents, with the permission of the
TOC management, to appreciate their voluntarily involvement in the research and as an
incentive for other potential respondents to participate in the survey.

58
Section 2
This section consists of six sub-sections (Parts A-F) containing fifty five
questions, which relates to train driver’s workload based on various aspects. Part A and
B focus on job satisfaction, Part C and D are on job characteristics, Part E is on job-
related tension and lastly Part F focuses on occupational stress.
Section 3
In this section, thirteen questions were presented to assess fatigue. Respondents
were asked about their duration of work per week, per trip and per month. In addition,
their shift patterns and rest durations were also enquired.
Section 4
Section 4 required the respondents to assess their perception on individual
working environment. It is divided into two parts; Part A on working conditions and
Part B on working environment.
Section 5
This section includes two parts on safety issues and safety culture. It consists of
twenty two questions adopted from Austin and Drummond (1986) and Ryan, Wilson,
Sharples, Morrisroe, et al. (2009).
Section 6
This section contains the Flinders Fatigue Scale (FFS) (Gradisar et al., 2007),
an established instrument used to measure fatigue experienced by the train drivers. It
is a simple, self-administered questionnaire with 7-items and sensitive measure with
strong psychometric properties.

59
Section 7
This section contains daytime sleepiness assessment developed by Johns (1991).
This scale is used for the train drivers to rate their chances of dozing off or falling
asleep in eight typically different situations.
4.3.2 Pre-testing and expert validation
A survey having good questionnaire design and pilot testing would provide
validity and reliability of the instrument (Collins, 2003). Nevertheless, although the
survey was developed from adaptation of existing validated questionnaire, there is still
the need to test the content, arrangement and structure of the items. Pre-testing would
ensure that the respondents understand and be able to fill in their answers (Coluci et al.,
2009). In addition, pre-testing allows validation from experts to identify unsuitable and
out-of-topic items.
A list of experts was chosen from the academics, authorities and industries to
assist in the evaluation of the instrument of both the English and Bahasa Malaysia
questionnaires. A summary of their reviews and recommendations is attached in
Appendix 4.
The pre-testing stage had also involved trial runs on two personnel from the
TOC. The researcher was present with the respondents while they answer the
questionnaire, and any feedback and ambiguity in the items were quickly addressed.
The pre-test respondents were able to understand the items in the questionnaire,
averaging 30-40 minutes to complete the survey.

60
4.4 Performance measurement
The performance evaluation of train drivers are conducted once a year by their
respective superior officers using the Employee Performance Standard Form – Non-
executive (PMS – Performance Management System), as attached in Appendix 1. This
form is prepared by the Human Resource Department of TOC and is endorsed by the
management. It consists of six sections (Section A-F). Section A contains the details of
the employee such as the name of employee, designation, reporting depot and evaluator.
Section B contains the list of training attended, achievements and contributions to the
company. Employee performance is measured in Sections C and D, which includes
knowledge of tasks, customer service, attitude, discipline, responsibility, team working,
effort and appearance. The evaluation is rated on a scale of 1 to 5; 5-beyond standard;
4-over standard; 3-following standard; 2-below standard and 1-far below standard.
Section E contains medical leaves and non-payable leave. It will also list any
disciplinary record for the current year. The marks are summed up in Section F and the
total score is calculated to obtain the overall achievement score for that particular year.
In this study, the PMS records from 2008 to 2011, corresponding to a 4 years period,
were considered in the evaluation.
4.5 Profile of the respondents
The respondents of this study were the employees of the train operating
company (TOC). This TOC operates several type of trains; passenger and freight trains
using locomotives in Peninsular Malaysia, urban light train from Seremban to Tanjung
Malim and electric train services (ETS) from Kuala Lumpur to Ipoh. The TOC also
provide long-haul services using diesel locomotives in Peninsular Malaysia.

61
In this study, only the train drivers for passenger and freight trains were selected
due to the nature of long-haul operations. Table 4.3 presents a profile of the 229
respondents. All of the train drivers in the TOC were male with 14.8 percent (34
people) below 25 years old, 25.8 percent (59 people) between 25 to 34 years old, 34.1
percent (78 people) between 35 to 44 years old and 25.3 percent (58 people) are 45 – 56
years old. The retirement age for the drivers is 56 years old. The overall age distribution
of the train drivers is shown in Figure 4.2.
Table 4.3: Profile of the respondents
Demographic profile Frequency Valid Percent
Gender Male 229 100
Female 0 0
Age <25 34 14.8
25 - 34 59 25.8
35 - 44 78 34.1
45 - 56 58 25.3
Total 229 100.0
Duration of
work
< 1 year 14 6.2
1 - 5 years 43 19.0
6 - 10 years 27 11.9
11 - 19 years 64 28.3
> 20 years 77 34.1
Missing value 3 1.3
Total 226 100.0
Over half of the respondents have worked for more than ten years with the TOC.
From the 62.4 percent of the respondents having worked more than 11 years, 77 people
(34.1 percent) have worked for more than 20 years while 64 people (28.3 percent) have
worked between 11 to 19 years as train drivers. Only 14 respondents have less than one
year experience. Figure 4.3 shows the distribution of the working years of the
respondents, showing that most of the respondents were experienced drivers.

62
Figure 4.2: Age of the respondents (in percentage)
Figure 4.3: Work duration among respondents (in percentage)
A Pearson correlation test was performed to check whether there is a
relationship between age and working duration. Table 4.4 shows that there is a
significant correlation between age of the train drivers and their working duration with
the company, with r = 0.86 at p < 0.01.
14.8
25.8
34.1
25.3
0
5
10
15
20
25
30
35
40
<25 25 - 34 35 - 44 45 - 56
6.2
19
11.9
28.3
34.1
1.3
0
5
10
15
20
25
30
35
40
< 1 year 1 - 5 years 6 - 10 years 11 - 19 years > 20 years Missingvalue

63
Table 4.4: Pearson correlation test between age and duration of work
Age
Work duration Pearson Correlation .857**
Sig. (2-tailed) .000
N 226
**. Correlation is significant at the 0.01 level (2-tailed).
4.5.1 Sample size
The population of this study is defined as all drivers of the locomotives under
the TOC nationwide, except for the drivers of the urban light train from Seremban to
Tanjung Malim and electric train services (ETS) from Kuala Lumpur to Ipoh. The
drivers are located in ten different depots throughout Peninsular Malaysia, from the
most northern state in Perlis until the most southern region in Singapore. The
distribution of the train drivers is shown Table 4.5 as reported by Occupational Safety,
Health and Environment Department (OSHEN) of the TOC.
Random sampling was performed for distribution of the questionnaire. The
sampling were divided into five groups, namely, northern (Prai and Ipoh), central
(Kuala Lumpur), southern (Gemas) and eastern (Kuala Lipis) regions. The survey
invigilator was stationed at each depot and waited for arrival of train drivers throughout
the day. The participation of the train drivers were on a voluntary basis, with no prior
instructions or arrangements from the TOC. The results of this random exercise will be
discussed in the Section 4.6.

64
Table 4.5: Distribution of the train drivers
Depot / Station State Total
1 Kuala Lumpur Intercity Kuala Lumpur 39
2 Kuala Lumpur freight Kuala Lumpur 66
3 Pelabuhan Klang Selangor 24
4 Gemas Negeri Sembilan 90
5 Kempas Baru Johor 9
6 Singapore Singapore 6
7 Kuala Lipis Pahang 28
8 Tumpat Kelantan 34
9 Ipoh Perak 114
10 Prai Pulau Pinang 116
11 Padang Besar Perlis 22
TOTAL 548
The surveys were conducted at five depots, since these were the major depots
which the train drivers may gather. For example, by stationing at Prai depot,
respondents from Padang Besar, Prai and Ipoh were gathered at this depot during their
off-duty as illustrated in Figure 4.4.

65
Legend:
Survey were conducted at this depots
A sampling method was applied to gather response from the train drivers. The
sample size required for this study is calculated based on Bartlett (2001), setting the
alpha level at 0.05 with acceptable error at 5% and estimated standard deviation of 0.5,
giving :
𝑛0 =𝑡2𝑝𝑞
𝑑2
𝑛0 =(1.96)2(0.5)(0.5)
(0.050)2
𝑛0 = 196
Where t = value for selected alpha level of 0.025 in each tail = 1.96.
(the alpha level of 0.05 indicates the level of risk the researcher is willing to take that
true margin of error may exceed the acceptable margin of error).
Padang Besar
Prai
Ipoh
Kuala Lumpur
Gemas
Singapore
Pelabuhan Klang
Kuala Lipis
Tumpat
Figure 4.4: Location of the depots and its connections

66
Where (p)(q) = estimate of variance = 0.25.
(maximum possible proportion (0.5) * 1-maximum possible proportion (0.5) produces
maximum possible sample size).
Where d = acceptable margin of error for proportion being estimated = 0.05
(error researcher is willing to except).
For a population of 548 drivers, the required sample size is 384. However, since
the required samples (384) exceeded 5% of the population (548 x 0.05 = 28), the
Cochran’s (1977) correction formula should be used to calculate the final sample size:
𝑛1 =𝑛0
1 +𝑛0
𝑝𝑜𝑝𝑢𝑙𝑎𝑡𝑖𝑜𝑛
𝑛1 =196
1 +196
548
𝑛1 = 144.4
𝑛1 ≈ 145
Therefore, for population of 548 drivers, the minimum sample size required was 145
respondents.

67
4.6 Data collection
A self-administered survey, completed individually by the locomotive drivers
and junior drivers, was conducted among the train drivers of the TOC. Off-duty
respondents from the depots were selected randomly either at the depot’s office or at the
resting rooms in the ‘running bungalow’. The ‘running bungalow’ is a rest facility,
furnished with air-conditioned bedrooms and rest area, for outstation drivers from other
depots. The distributed questionnaires were filled immediately by the respondents, with
the researcher present at the survey location to provide assistance.
229 respondents had participated in the data collection from five different depots
across Peninsular Malaysia. To ensure location accuracy, the response script was
labelled accordingly to indicate the survey location (depot) and the count. For example,
the code KL003 indicates data was collected at Kuala Lumpur depot and the serial
number was 003. To avoid redundancy, the respondent's name was cross-checked with
the list of train drivers provided by the company. Table 4.6 depict the distribution of
responses collected at five different depots while Table 4.7 shows the origin of the
drivers.
Table 4.6: Number of responses collected at different depots
# Collecting depot Number of responses
collected
Percentage
1 Kuala Lumpur 72 31.4
2 Prai 56 24.5
3 Ipoh 45 19.7
4 Gemas 20 8.7
5 Kuala Lipis 36 15.7
Total 229 100

68
Table 4.7: Number of responses based on reporting depots
# Depot Responses Percentage
1 Kuala Lumpur 32 14.0
2 Prai 66 28.8
3 Singapore 2 0.9
4 Ipoh 65 28.4
5 Gemas 33 14.4
6 Tumpat 25 10.9
7 Kuala Lipis 6 2.6
Total 229 100.0
4.7 Structural Equation Modeling
Structural equation modelling (SEM) technique is used in this study to evaluate
the model and to determine the relationships between variables. In general, SEM is
divided into two types; covariance-based (CB-SEM) and variance-based partial least
squares (PLS-SEM) (Hair, Sarstedt, et al., 2012b). CB-SEM is used for confirming
theories while PLS-SEM is a prediction variance-based approach which used in
exploratory research to develop theories (Hair et al., 2014; Hair, Ringle, et al., 2012).
For this study, since the research is in the exploratory stage in determining the
relationship between variables in measuring the performance of the train driver, the
PLS-SEM approach is considered to be the most suitable.
4.8 Preliminary Data Analysis
Preliminary data analysis, in which the raw data is screened and analysed, is
required before structural equation modelling (SEM) could be performed. SPSS

69
software is used for preliminary data analysis. The process sequence is summarized in
Figure 4.5.
4.8.1 Data Screening
The raw data obtained from the survey was screened for missing values, outliers
and not applicable (N/A) responses. This is an important step to ensure data are
correctly inserted at the initial phase. In addition, there is a possibility of error in the
data entry stage due to the large volume of input data. Normality test was not
conducted for data in this research as PLS does not require normal-distributed input
data (Haenlein & Kaplan, 2004; Hair, Sarstedt, et al., 2012a).
Screening of the data began with identification of outliers. The presence of
outliers would affect the calculation of data variance and factors correlations
(Stanimirova et al., 2007; Timm, 2002). Outliers are identified using boxplots (box-
whisker diagram) and histograms (Field, 2005). In this study, the number of outliers
Figure 4.5: Summary of preliminary data analysis
Preliminary Data
Analysis
Data screening
Factor analysis
Missing value Outliers N/A response Bias Reliability analysis
Principal component
analysis

70
were not found as the respondents were only had limited choice on the selection scale.
Example of histogram and box-whisker diagram are shown in Figure 4.6 and Figure 4.7,
indicated the point of outliers which were actually the extreme answer from particular
respondent, but their choices of answer were still in the range of Likert-scale choices.
Figure 4.6 : Example of histogram for item JRT 5

71
Figure 4.7: Example of box-whisker diagram for item JRT 5
There were four constructs containing ‘Not Applicable N/A’ responses as an
addition to the 5–point Likert scale, which are working condition (WC), working
environment (WE) and safety culture (SC). Due to different type and class of
locomotives, some items might not be applicable for the respondents to answer. The
assumption made was that the drivers had at least one-time experience in driving each
type of locomotive. The N/A responses were then treated as missing value (Lee et al.,
2007).

72
4.8.2 Treatment of missing data
The presence of missing data is common and unavoidable in any quantitative
study (Rubin, 1976). This missing data should be analysed and treated to avoid biased
conclusions (Byrne, 2010). Data screening is also recommended prior to presentation of
results, as advised by the APA Task Force on Statistical Inference (Wilkinson & Task
Force Stat, 1999).
Past strategies on handling missing data includes excluding or deleting the cases
with missing data (Baraldi & Enders, 2010; Stanimirova et al., 2007). However,
deletion of cases, such listwise and pairwise deletion, would cause loss of important
information, reduce statistical power and increase bias of estimation (Nakagawa &
Freckleton, 2008). With the advancement in computational power, missing data can be
treated using stochastic imputation methods, stochastic regression, expectation-
maximization algorithm (EM) and multiple imputation (MI) (Schlomer et al., 2010).
For best practices, Hair et al. (2010), Schlomer et al. (2010) and Wilkinson &
Task Force Stat (1999) recommended researchers to report the amount of missing data,
the data pattern and the method used for treatment of missing data.
The data from 229 respondents were screened using SPSS software and the
percentages of missing responses were measured for each item (Schlomer et al., 2010),
as shown in Appendix 5. SPSS is one of most common software used for handling
survey data and provides module to assess and evaluate missing data analysis, and these
numerous complexes statistical procedures rely on the expectation maximization
algorithm to impute missing data is best using SPSS (Hair et al., 2014). It also provides
application to perform preliminary data analysis i.e. data screening, common method
and response bias, reliability analysis and factor analysis before proceed to SEM
approach using Smart PLS (Schlomer et al., 2010). Other than SPSS, artificial neural
network (ANN) and genetic algorithm could be used to predict missing value for
73
replacing the ‘emptiness’ of the data but very limited; unable to conduct the missing
value analysis (Mussa & Marwala, 2005; Setiawan et al., 2008).
From the table, the percentage of missing value ranges from 0 to 23.1 percent.
As reported by Schlomer et. al (2010), there are several cut-off values proposed by
different authors; 5% (Schafer, 1999), 10% (Bennett, 2001; Hair et al., 2010) and 20%
(Peng et al., 2006). In this study, 7 items were in the range of 5 – 20 % and one item,
WE1 was more than 20% (23.1%). Item WE1 was deleted as it exceeded the minimum
cut-off value, as suggested by Peng, et al. (2006).
To analyse the pattern of missing data, Little’s MCAR test is used to evaluate
each construct to identify randomness and missingness pattern. The three patterns of
missingness, introduced by Rubin (1976) and Little and Rubin (1987) as cited in Byrne
(2010), are; 1) missing completely at random (MCAR), 2) missing at random (MAR)
and 3) not missing at random (NMAR). This missingness pattern was used to determine
suitable treatment for missing values. “Briefly, MCAR is a process in which the
missing-ness of the data is completely independent of both the observed and the missing
values, and MAR is a process in which the missing-ness of the data depends on the
observed values, but is independent of the missing values. When the missing data
mechanism is neither MCAR nor MAR and, in particular, the missing-ness depends on
the missing values themselves, the process is called missing not at random (MNAR).”
Table 4.8 shows results of missing data randomness on Little (1988) MCAR
significance value for each factor. For this test, the null hypothesis is that the data are
missing completely at random, and the p value is significant at the 0.05 level. If the
value is less than 0.05, the data are not missing completely at random. The data may be
missing at random (MAR) or not missing at random (NMAR). A significant null
hypothesis (p value > 0.05) is indicative of MCAR. If the significance value is less than
0.05, the data might be MAR or NMAR. Past researcher normally assumed MAR

74
(Schlomer et al., 2010) for non MCAR factors. In this study, three factors were non-
MCAR, namely occupational stress, working condition and performance.
Once the pattern of either MCAR or MAR has been determined, the missing
values can be treated using modern missing data technique by either Multiple
Imputation (MI) or Expectation Maximization (EM). Multiple data sets with different
imputed values are prepared and the analyses are then performed on each data set. This
technique provides unbiased estimates for MCAR and MARS data (Baraldi & Enders,
2010; Burns et al., 2011).
Multiple imputation (MI) were performed for factors with MCAR using 25
imputations data sets whereas expectation-maximization algorithm (EM) were utilised
for factors with MAR (Baraldi & Enders, 2010; Hair et al., 2010).
Table 4.8: Little’s MCAR significance value for each factor
Construct Little’s MCAR significance
value
Decision
Job satisfaction 0.377 MCAR
Occupational stress 0.001 MAR
Job-related tension 0.100 MCAR
Fatigue 0.054 MCAR
Sleepiness 0.304 MCAR
Job demand 0.925 MCAR
Driving task 0.506 MCAR
Working environment 0.405 MCAR
Working condition 0.034 MAR
Safety issue 0.760 MCAR
Safety culture 0.832 MCAR
Performance 0.000 MAR
Legend : (MCAR) missing completely at random
(MAR) missing at random (MAR)
(NMAR) not missing at random (NMAR)

75
4.8.3 Common Method Bias
The research methods may influence construct measurements and that this
influence, or method bias, can lead to false conclusions. A common method bias test
can be conducted as an evaluation for random and systematic measurement error that
affects the estimates of the relationship between measures (Podsakoff et al., 2003).
Harman’s single-factor test is the most widely used approach to prove the existence of
common method bias (Ou et al., 2010; Podsakoff et al., 2003). The assumption by
performing Harman’s single-factor test was; there will be a common method variance if
one general factor explains the majority of the covariance among variables.
To conduct Harman’s single factor test, exploratory factor analysis (EFA) with
unrotated factor solution was performed for all of the variables. As shown in Table 4.9,
the principal factors revealed the presence of eleven factors (column component) with
equal variance within the range of 18.5 – 3.1 percent (% of variance column).
Cumulatively, it shows that eleven factors had explained 100% of the measured items.
Thus, this suggests the non-presence of common method bias.

76
Table 4.9: Total variance explained
Component
Extraction Sums of Squared
Loadings
Total
% of
Variance
Cumulative
%
1 21.808 18.482 18.482
2 17.546 14.870 33.351
3 14.768 12.515 45.866
4 12.937 10.964 56.830
5 10.755 9.115 65.945
6 9.996 8.471 74.416
7 8.785 7.445 81.861
8 6.815 5.775 87.636
9 6.396 5.420 93.056
10 4.529 3.838 96.894
11 3.665 3.106 100.000
12 - - 100.000
13 - - 100.000
14 - - 100.000
15 - - 100.000
4.8.4 Response bias
Response bias is a general term that refers to conditions or factors that take place
during the process of responding to surveys, affecting the way responses are provided.
Such circumstances lead to a non-random deviation of the answers from their true
value. In this study, non-response bias was not an issue since the survey was distributed
directly to the respondent during their 'off-duty' periods at the 'running bungalows'.
Ambiguities in any part of the survey can be answered immediately by the researcher
present during the administration of the survey. The response was 100 percent since the
questionnaire were completed immediately.

77
A one-way ANOVA was conducted to test for significant difference between
locations of surveys at different depots. Since the data were collected from five different
depots, five groups of respondents based on their reporting depot were tested for
differences. Firstly, a test of homogeneity was conducted to determine whether the
variances between depots for the average performance scores are equal. The results
have shown homogeneity of variances, as assessed by Levene's Test of Homogeneity of
Variance (p = 0.466). Hence, there was no statistically significant difference in average
performance score between the different depots, F(4,224) = 2.282, p = 0.061.
The results showed insignificant differences between depots on their average
performance scores, thus, implying there were no biases of the data.
4.8.5 Reliability Analysis
Cronbach’s alpha coefficient was used to assess the consistency of the
measurement items. In general, a Cronbach's alpha value of more than 0.5 is desirable,
as suggested by Sekaran, (2003). Table 4.10 summarizes the results of the reliability
test, showing the final alpha values for all factors were between 0.529 to 0.917. It is
noted that the alpha value for job characteristics construct (JCH) was 0.452 prior to
deletion of item JCH4, however omitting JCH4 in the calculations improved the value
to 0.529. It can be concluded that the measurements are reliable since the alpha values
had exceeded the recommended value of 0.5 for exploratory studies.

78
Table 4.10: Results of reliability test
Factor Measurement
items
Cronbach’s
α
Number
of items
Number of
item deleted
Final
number of
items
Job
satisfaction JS 1 – JS 8 0.725 8 0 8
Occupational
Stress
STR 1 – STR
20 0.917 20 0 20
Job related
tension
JRT 1 – JRT
15 0.832 15 0 15
Fatigue FF 1-4
FF 6-7 0.842 6 0 6
Sleepiness FSL 1-8 0.731 8 0 8
Job demand JCH 1-3
JCH 5-7
0.529
(0.452)a
7 1
JCH 4 6
Driving task DT 1- 5 0.563 5 0 5
Work
environment WE 2 - 15 0.675 14 0 14
Working
condition WC 1 – 7 0.720 7 0 7
Safety issue SI 1 – 7 0.777 7 0 7
Safety culture SC 1 – 15 0.708 15 0 15
Performance PMS 2008 -
2011 0.765 4 0 4
a initial alpha value

79
4.9 Chapter Summary
This chapter explains the overall methodology used in this study. Firstly, the
theoretical framework and hypotheses were developed based on past models and
literatures. The measurement instruments were adapted from past validated instruments,
with thorough reviews from experts and stakeholders. A Pencil – and – paper
questionnaire based on subjective rating scales approach was taken to collect the data
from the respondents.
The targeted respondents were train drivers who drove passenger and freight
trains of the TOC. They were randomly picked from five depots along the line of
Peninsular Malaysia. A total of 229 samples were collected from the population of 548
drivers.
SPSS software was used for data screening and analysis. Preliminary data
analysis containing data screening, treatment of missing data, test for common method
bias and response bias was performed. A reliability analysis using Cronbach’s alpha
coefficient was performed to assess the measurement items’ consistency. The
relationships among factors will be conducted using SEM software and SmartPLS.

80
CHAPTER 5 : RESULTS & ANALYSIS
5.1 Introduction
This chapter presents the analysis conducted and the empirical results obtained
with regard to the research hypotheses. The initial statistical analysis was conducted
using Statistical Package for Social Science (SPSS) version 20.0. This software was
used for the data entry, data screening, preliminary data analysis, descriptive statistics
of the data and the reliability analysis (Cronbach alpha). Subsequently, structural
equation modelling (SEM) technique, using Smart PLS software, was utilised to
evaluate the interrelationship among variables and for testing of the hypotheses.
5.2 Factor Analysis
Factor analysis technique is used for data reduction and to evaluate the
significance of relationships among variables (Russell, 2002). The objective of factor
analysis is parsimony, which attempts to reduce the number of variables but still retains
the maximum amount of common variance (Tinsley & Tinsley, 1987).
Principal components analysis with Promax rotation (Russell, 2002) was used to
reduce the large number of items in the driver performance measures to a smaller
number of reliable factors (Glendon & Litherland, 2001; Lu & Shang, 2005). The items
were categorized into three main categories or domains, based on Bailey (1996),
Baines, et al. (2005) and Y.H. Chang & Yeh (2010), which were human, activity and
context. The principal component analysis can then be performed for each domain
instead of analysing the overall items together. Figure 5.1 shows the process flow of the
factor analysis.

81
Initially, principal component analysis with Promax rotation was perform
without fixing the number of factors. From the analysis of Kaiser-Meyer-Olkin
measures of sampling adequacy (KMO), the value need to be more than 0.7 (>0.7)
Satisfy with number of factors
Start
Factor analysis
Check
KMO
value
Scree plot
Monte Carlo simulation
Parallel
analysis
Check
item
loading
Pattern matrix
<0.7
>0.7
Not satisfy with
number of factors
>0.5
<0.5, delete item
Finish
Figure 5.1: Flow chart of factor analysis

82
which indicated that the data is appropriate for the analysis (Hair et al., 2010). This
KMO measures is to identify the factor is stable with enough varibles to adequately
measures all of the factors (Field, 2005). The data then plotted using scree plot (Cattell
1966 as mentioned by Reise, et al. (2000)). In general, the number of factors can be
identified from the scree plots, but occasionally, the scree plot analysis was unable to
indicate the number of factors clearly (Russell, 2002). An improved procedure, called
parallel analysis (Reise et al., 2000) is then conducted by comparing the eigenvalues
from real data and simulated data. Monte Carlo simulation was used to generate the
simulated data. “In a parallel analysis, random data sets are generated on the basis of the
same number of items as in the real data matrix. Then the scree plot of the eigenvalues
(percentage of variance accounted for by a dimension) from the real data is compared
with the scree plot of the eigenvalues from the random data (simulated data). The point
where the two plots meet provides the researcher with a good idea of the absolute
maximum number of factors that should be extracted. The factors are accepted if the
eigenvalue of the actual data was greater than the simulated data. Then, the individual
factor loadings were checked, if it is less then 0.5, it should be deleted (Field, 2005).
5.2.1 Human domain
In the research model, the human domains consists of five possible factors,
namely, job satisfaction, occupational stress, job related tension, fatigue and sleepiness.
In this principal component analysis (PCA), fatigue and sleepiness were excluded since
these factors were specially designed for particular symptoms of fatigue and sleepiness.
The level of fatigue was measured using Flinders Fatigue Scale (Gradisar et al., 2007)
while sleepiness by Epworth Sleepiness Scale (Johns, 1991, 1992). So, the principal
component analysis was performed only on 43-item of human domain questionnaire

83
data from 229 respondents. Table 5.1 shows the distribution of items in the proposed
factors for human domain.
Table 5.1: Factors in human domain
Factors Measurement
items
Number of
items
Number of
item deleted
(initial)
Remarks
Job satisfaction JS 1 – JS 8 8 0
43-item
Occupational
stress
STR 1 – STR
20 20 0
Job related tension JRT 1 – JRT
15 15 0
Fatigue FF 1-4
FF 6-7 6 0
Not included in
PCA
Sleepiness FSL 1-8 8 0 Not included in
PCA
From the initial 43 items analysed, only 36 items were accepted, having loading
of more than 0.4 and loaded on five-factor solution. As compared to only two factors
proposed in the theoretical framework, namely occupational stress and job satisfaction,
the factor analysis technique suggested five-factor solution for an improved
interpretation of the human domain. Three factors were proposed for the previous
‘occupational stress’ factor, namely occupational stress, job-related tension (internal
conflicts), and job-related tension (external conflicts). Job satisfaction is divided into
two factors, namely, job satisfaction 1 and job satisfaction 2.

84
Table 5.2: Factor analysis of human domain
#
analysis
KMO
value
No. of factors
fixed
Paralel
analysis
(suggested no
of factors
Total variance
explained
Items
deleted
1 0.853 0 5 62.9% 6
2 0.838 5 5 66.4% 1
3 0.829 5 5 47.8% 0
The 5-factor solution is the best proposed result after items deletion and was
measured with item loading, KMO value, and eigenvalue comparison for parallel
analysis. Previously, there were 3 factors before the factor analysis. However, 5-factor
solution is more suitable based on the factor analysis and review of the items. Factors
were renamed based on the items in that particular grouping. Table 5.3 shows the 36
items loaded on five-factors with its individual loading. Figure 5.2 represents the five-
factor solution with (1) job satisfaction (JS), (2) job satisfaction 2 (JS2), (3) job-related
tension (JRT), (4) job-related tension 2 (JRT2), and (5) occupational stress (STR). The
detail of the analysis is described in Appendix 6.

85
Table 5.3: Five-factor solution for human domain
Component
1 2 3 4 5 1 STR16 Occupational stress 16 0.764 - - - - 2 STR10 Occupational stress 10 0.756 - - - - 3 STR9 Occupational stress 9 0.740 - - - - 4 STR4 Occupational stress 4 0.722 - - - - 5 STR11 Occupational stress 11 0.656 - - - - 6 STR5 Occupational stress 5 0.642 - - - - 7 STR3 Occupational stress 3 0.637 - - - - 8 STR12 Occupational stress 12 0.634 - - - - 9 STR2 Occupational stress 2 0.616 - - - - 10 STR14 Occupational stress 14 0.574 - - - - 11 STR1 Occupational stress 1 0.553 - - - - 12 STR8 Occupational stress 8 0.516 - - - - 13 STR18 Occupational stress 18 0.506 - - - - 14 STR13 Occupational stress 13 0.470 - - - - 15 STR19 Occupational stress 19 0.468 - - - - 16 JRT5 Job-related tension 5 - 0.718 - - - 17 JRT13 Job-related tension 13 - 0.663 - - - 18 JRT7 Job-related tension 7 - 0.633 - - - 19 JRT4 Job-related tension 4 - 0.617 - - - 20 JRT12 Job-related tension 12 - 0.583 - - - 21 JRT9 Job-related tension 9 - 0.543 - - - 22 JRT11 Job-related tension 11 - 0.536 - - - 23 JRT3 Job-related tension 3 - 0.479 - - - 24 JRT15 Job-related tension 15 - 0.447 - - - 25 JS5 Job satisfaction 5 - - 0.799 - - 26 JS4 Job satisfaction 4 - - 0.783 - - 27 JS2 Job satisfaction 2 - - 0.756 - - 28 JS1 Job satisfaction 1 - - 0.711 - - 29 JS3 Job satisfaction 3 - - 0.618 - - 30 JS6 Job satisfaction 6 - - - 0.860 - 31 JS7 Job satisfaction 7 - - - 0.835 - 32 JS8 Job satisfaction 8 - - - 0.792 - 33 JRT2 Job-related tension 2 - - - - 0.753
34 JRT1 Job-related tension 1 - - - - 0.544
35 JRT8 Job-related tension 8 - - - - 0.417
36 JRT14 Job-related tension 14 - - - - 0.410
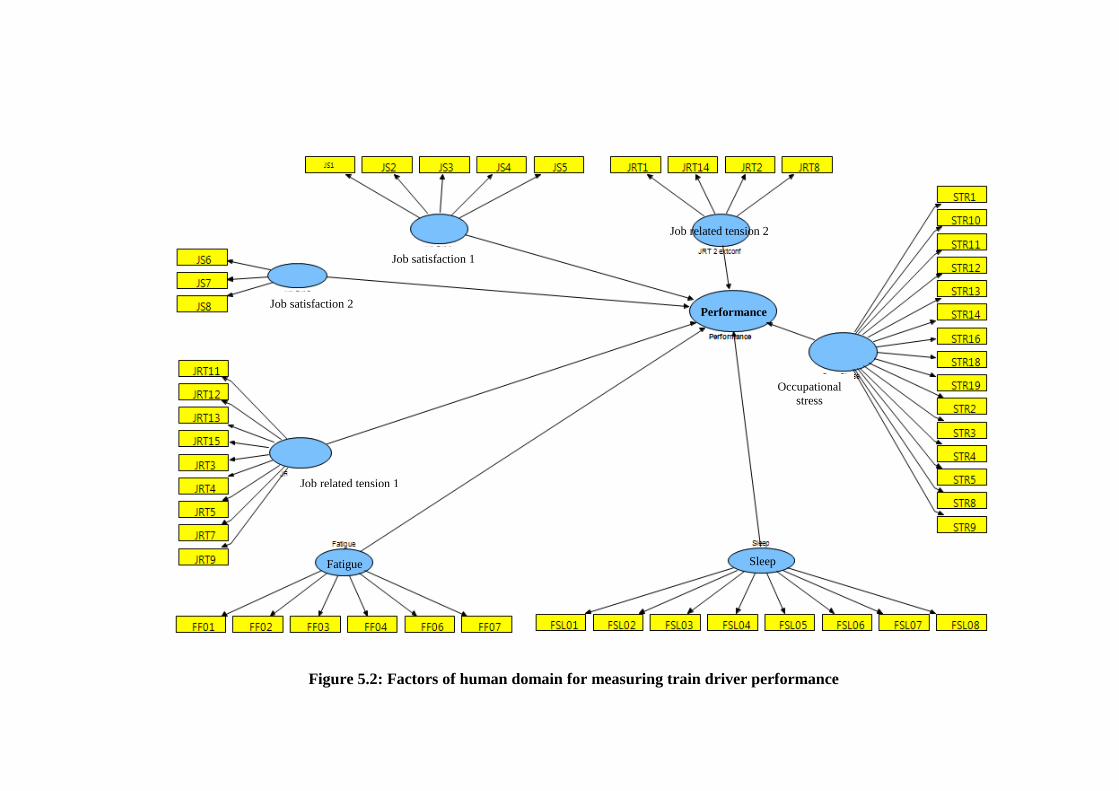
86
Job satisfaction 1
Job satisfaction 2
Job related tension 1
Fatigue Sleep
Job related tension 2
Occupational
stress
Performance
Figure 5.2: Factors of human domain for measuring train driver performance

87
5.2.2 Activity domain
As proposed in the theoretical framework, measuring performance based on
activity of train driver would consist of two possible factors; job demand and driving
task. Eleven-item from the activity domain questionnaire data of 229 respondents were
evaluated to identify the appropriate number of constructs. Table 5.4 shows the
distribution of items in the proposed factors of activity domain. One item, JCH4, was
deleted in the preliminary reliability test and is not considered in the subsequent
evaluation procedures.
Table 5.4: Factors in activity domain
Factors Measurement
items
Number of
items
Number of
item deleted
(initial)
Remarks
Job demand JCH 1-3
JCH 5-7 7 1 JCH 4 deleted
Driving task DT 1- 5 5 0 -
Table 5.5: Factor analysis of activity domain
#
analysis
KMO
value
No. of factors
fixed
Parallel
analysis
(suggested no.
of factors
Total variance
explained
Items deleted
1 0.674 0 3 58.2% 0
2 0.674 3 3 49% 2
3 0.63 3 - 53.8% 2
4 0.637 2 - 50.6% 0
Factor analysis was then conducted for the activity domain. Table 5.5
summarizes the four consecutive analyses which were conducted to identify the number
of factors and items for the activity domain. After three consecutive analyses with
deletion of four items, the criteria of 0.5 loading was retained but with 2-factor solution.
The number of items remained was seven, which would initially suggest a 3-factor
solutions with two items per factor. However, this would disperse the items and would

88
not be suitable for further analysis (Russell, 2002). Thus, a 2-factor solution is
selected, as suggested in the original research framework, which were the driving task
and job demand.
The final factor analysis for the activity domain was conducted for seven items,
2-factor solution and a minimum 0.4 factor loading. The Kaiser-Meyer-Olkin measures
of sampling adequacy (KMO) value of 0.637 (Hair et al., 2010) indicated the data is
regarded to be appropriate for the analysis with 50.6% of the variance.
Table 5.6: Results of the factor analysis of activity domain
Component
1 2
DT2 Driving Task 2 0.775 0.024
DT1 Driving Task 1 0.710 0.151
DT3 Driving Task 3 0.682 -0.221
DT4 Driving Task 4 0.615 0.057
JCH2 Job Demand 2 -0.043 0.788
JCH1 Job Demand 1 -0.048 0.724
JCH5 Job Demand 5 0.155 0.591
Eigenvalue 1.978 1.564
Percentage variance (50.6) 28.26 22.35
Table 5.6 summarizes the result of the factor analysis for the activity domain,
showing the items are grouped in its own component, i.e. all items marked with DT had
loading of more than 0.4 (indicated in bold) in component 1 while items marked with
JCH were grouped in component 2. These result confirms that each of these constructs
are unidimensional and factorially distinct and that all items used to measure a
particular construct are loaded on a single factor.

89
Figure 5.3: Factors of activity domain for measuring train driver performance
Figure 5.3 shows schematically the relationship between factors of activity
domain with performance of the train driver. It consists of four items for driving task
and three items for job demand. The details of the analysis is described in Appendix 7.
5.2.3 Context domain
Initially, the context domain consisted of two possible factors which were work
environment and safety, as proposed in theoretical framework. A principal component
analysis with Promax rotation was performed on the 42-item context domain
questionnaire data from 229 respondents. Factor analysis procedure was conducted for
five iterations on the 42 items to determine the number of appropriate factors for
measuring the performance of train drivers.
H8
H9

90
Table 5.7: Factor analysis of context domain
#
analysis
KMO
value
No. of factors
fixed
Paralel
analysis
(suggested no.
of factors
Total variance
explained
Items deleted
1A 0.751 - 7 67.4% 10
1B 0.751 7 - 50.4% 6
2 0.757 7 6 53.1% 4
3 0.758 - 6 50.6% 2
4 0.763 6 - 52.49% 0
Table 5.7 summarize the five consecutive analyses taken to determine the
number of factors for the context domain. The final analysis for context domain resulted
in the deletion of two items (SC01 and SC11) to arrive at a 6-factor solution and a
minimum of 0.4 factor loading. Kaiser-Meyer-Olkin measures of sampling adequacy
(KMO) value of 0.763 (Hair et al., 2010) indicated the data is regarded to be appropriate
for the analysis with 52.49% of the variance. The details of the analyses are discussed in
Appendix 8.
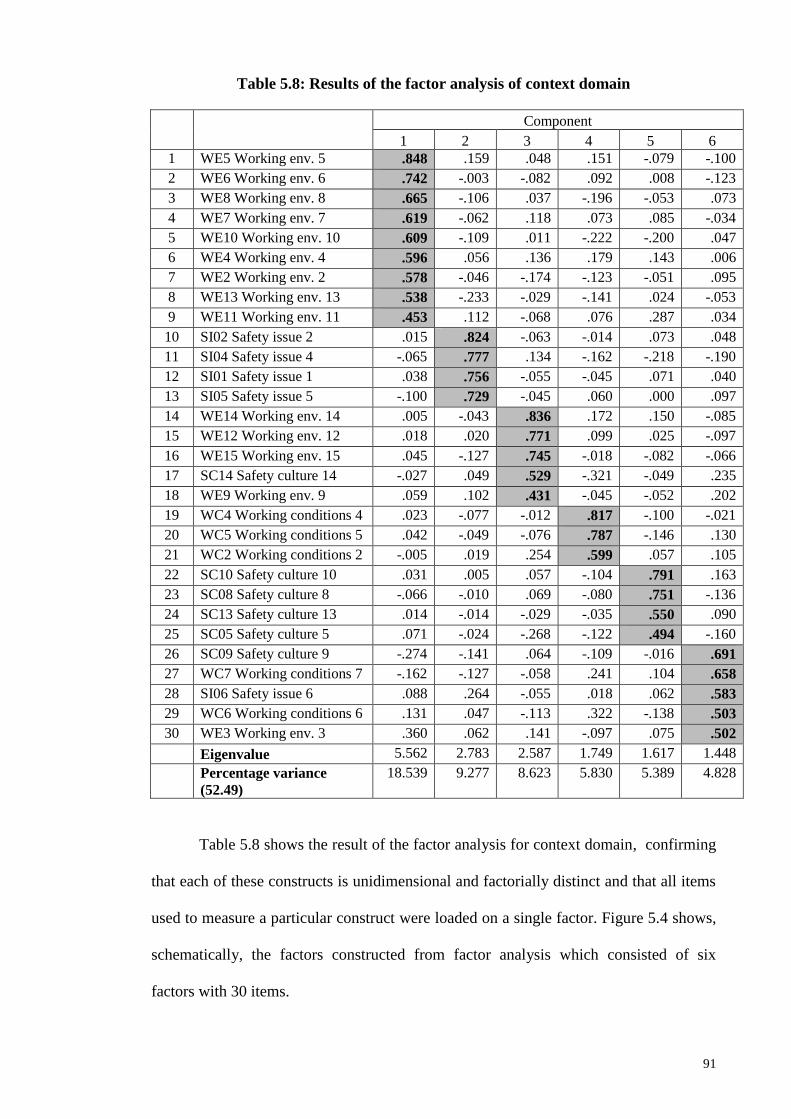
91
Table 5.8: Results of the factor analysis of context domain
Component
1 2 3 4 5 6
1 WE5 Working env. 5 .848 .159 .048 .151 -.079 -.100
2 WE6 Working env. 6 .742 -.003 -.082 .092 .008 -.123
3 WE8 Working env. 8 .665 -.106 .037 -.196 -.053 .073
4 WE7 Working env. 7 .619 -.062 .118 .073 .085 -.034
5 WE10 Working env. 10 .609 -.109 .011 -.222 -.200 .047
6 WE4 Working env. 4 .596 .056 .136 .179 .143 .006
7 WE2 Working env. 2 .578 -.046 -.174 -.123 -.051 .095
8 WE13 Working env. 13 .538 -.233 -.029 -.141 .024 -.053
9 WE11 Working env. 11 .453 .112 -.068 .076 .287 .034
10 SI02 Safety issue 2 .015 .824 -.063 -.014 .073 .048
11 SI04 Safety issue 4 -.065 .777 .134 -.162 -.218 -.190
12 SI01 Safety issue 1 .038 .756 -.055 -.045 .071 .040
13 SI05 Safety issue 5 -.100 .729 -.045 .060 .000 .097
14 WE14 Working env. 14 .005 -.043 .836 .172 .150 -.085
15 WE12 Working env. 12 .018 .020 .771 .099 .025 -.097
16 WE15 Working env. 15 .045 -.127 .745 -.018 -.082 -.066
17 SC14 Safety culture 14 -.027 .049 .529 -.321 -.049 .235
18 WE9 Working env. 9 .059 .102 .431 -.045 -.052 .202
19 WC4 Working conditions 4 .023 -.077 -.012 .817 -.100 -.021
20 WC5 Working conditions 5 .042 -.049 -.076 .787 -.146 .130
21 WC2 Working conditions 2 -.005 .019 .254 .599 .057 .105
22 SC10 Safety culture 10 .031 .005 .057 -.104 .791 .163
23 SC08 Safety culture 8 -.066 -.010 .069 -.080 .751 -.136
24 SC13 Safety culture 13 .014 -.014 -.029 -.035 .550 .090
25 SC05 Safety culture 5 .071 -.024 -.268 -.122 .494 -.160
26 SC09 Safety culture 9 -.274 -.141 .064 -.109 -.016 .691
27 WC7 Working conditions 7 -.162 -.127 -.058 .241 .104 .658
28 SI06 Safety issue 6 .088 .264 -.055 .018 .062 .583
29 WC6 Working conditions 6 .131 .047 -.113 .322 -.138 .503
30 WE3 Working env. 3 .360 .062 .141 -.097 .075 .502
Eigenvalue 5.562 2.783 2.587 1.749 1.617 1.448
Percentage variance
(52.49)
18.539 9.277 8.623 5.830 5.389 4.828
Table 5.8 shows the result of the factor analysis for context domain, confirming
that each of these constructs is unidimensional and factorially distinct and that all items
used to measure a particular construct were loaded on a single factor. Figure 5.4 shows,
schematically, the factors constructed from factor analysis which consisted of six
factors with 30 items.

92
Figure 5.4: Factors of context domain for measuring train driver performance
5.2.4 Summary of factor analysis
From the proposed theoretical model presented in Chapter 3, the data were
analysed using factor analysis technique to determine the number of variables (Russell,
2002). Fifteen factors were identified to be influential factors of train driver
performance. Figure 5.6 represents the overall fifteen factors which were expected to
have positive relationship with the performance of the train driver. Hypotheses from
this proposed model will then be tested using structural equation modelling (SEM) to
confirm its relationship.
Safety issue
Work environment
Work environment 2 Context
Safety
Working
condition
Performance

93
Figure 5.5: Train driver performance model after factor analysis
Job satisfaction 2 Job satisfaction 1 JRT ext. conflict
JRT internal
conflict
Fatigue
Sleep Safety issue
Performance
Safety
Occupational
stress
Working condition
Context Work environment
2
Work environment
Job demand
Driving task

94
5.3 Evaluation of the measurement model
A systematic analysis using a partial least square (PLS) approach is used, which
presents the results in two steps (Anderson & Gerbing, 1991; Chin, 2010). The first step
examined the validity and reliability of the survey items in the measurement model,
whereas the second step analyses the structural model. The measurement model
consists of composite reliability to evaluate internal consistency, and convergent
validity by using average variance extracted (AVE). Discriminant validity was assessed
using the Fornell-Larcker criterion and cross loadings.
5.3.1 Internal consistency reliability
Composite reliability is a measure of internal consistency reliability, which can
be used instead of the traditional criterion of Cronbach’s alpha. Thus, PLS-SEM can
utilise composite reliability to prioritize the indicators according to their individual
reliability (Hair et al., 2014).
To measure composite reliability, the individual reliability of the items to their
respective constructs is first determined. The significant cut-off value was set at 0.5
(Hair et al., 2010) and any item below this value will be deleted. Furthermore, items
with the lowest loading in a particular construct or factor was also deleted and the cross-
loadings were calculated. Table 5.9 shows the item loadings and cross loadings between
items for the first iteration of the analysis. The loadings for each item are highlighted in
bold numberings and grey boxes while the items marked for deletion are marked in
white bold font and black boxes.
As can be seen in Table 5.9, items with low loading value of 0.5 were marked.
In the first iteration of the analysis, items with loadings of 0.5 were individually
removed. With each removal, there may be a possibility of increase in loading of the

95
remaining items, thus careful consideration was taken to remove items individually and
reassessing the overall loading values.
The cross-loading analysis was conducted for each removal of items. These
delete-and-run processes were continued until the third iteration to ensure the items
were having significant values. The results of the delete-and-run process are presented
in Table 5.10.

96
Table 5.9: Loading and cross loadings of items to measure composite reliability
Group Human Activity Context Perfor-
mance
Items Job Sat
2
Job Sat
1
JRT1
intconf
JRT 2
extconf
Occp
Stress Fatigue Sleep
Driving
task
Job
Demand
Safety
culture
Safety
Issue
Work
condition
Work
facility
Work
Env2
Work
Env
Perfor-
mance
JS6 0.869 0.098 -0.020 -0.036 -0.114 0.031 -0.001 0.011 0.053 -0.016 0.066 0.055 -0.078 0.034 0.192 -0.042
JS7 0.906 0.075 -0.138 -0.069 -0.055 0.078 0.006 -0.057 -0.009 -0.027 -0.056 -0.055 -0.047 -0.038 0.143 -0.049
JS8 0.713 0.001 -0.068 0.021 0.006 0.041 0.013 0.037 -0.060 0.067 -0.047 -0.029 -0.101 -0.013 0.047 -0.018
JS1 0.077 0.621 -0.153 -0.190 -0.030 0.213 0.079 -0.258 0.331 0.246 0.087 -0.016 -0.160 -0.274 0.123 -0.039
JS2 0.109 0.810 -0.237 -0.191 -0.088 0.292 0.075 -0.170 0.216 0.356 -0.045 -0.068 -0.238 -0.189 0.029 -0.121
JS3 0.034 0.658 -0.207 -0.063 -0.002 0.198 0.143 -0.042 -0.001 0.361 -0.118 0.000 -0.138 -0.140 0.043 -0.090
JS4 0.050 0.849 -0.305 -0.205 0.003 0.278 0.149 -0.245 0.184 0.333 -0.040 -0.086 -0.200 -0.119 0.001 -0.120
JS5 0.036 0.769 -0.228 -0.068 -0.002 0.208 0.137 -0.183 0.154 0.324 0.031 -0.042 -0.206 -0.242 -0.048 -0.054
JRT11 -0.092 -0.227 0.695 0.375 0.082 -0.294 -0.199 0.285 -0.064 -0.246 -0.078 0.053 0.149 0.051 0.034 0.147
JRT12 -0.054 -0.173 0.472 0.284 0.053 -0.202 -0.078 0.222 0.011 -0.281 -0.032 0.137 0.203 0.120 -0.077 -0.009
JRT13 -0.036 -0.052 0.507 0.263 -0.025 -0.233 -0.156 0.323 0.135 -0.093 0.024 0.164 0.077 0.171 -0.024 0.047
JRT15 -0.034 -0.208 0.578 0.315 0.051 -0.337 -0.139 0.348 0.094 -0.225 0.070 0.210 0.200 0.212 -0.013 0.136
JRT3 -0.034 -0.177 0.644 0.366 0.036 -0.317 -0.063 0.370 0.016 -0.215 0.012 0.126 0.184 0.157 -0.082 0.137
JRT4 -0.053 -0.225 0.494 0.294 -0.069 -0.355 -0.061 0.357 0.079 -0.261 0.044 0.131 0.289 0.294 0.052 -0.018
JRT5 -0.086 -0.180 0.671 0.288 0.089 -0.297 -0.154 0.385 0.108 -0.236 -0.003 0.145 0.262 0.171 0.042 0.128
JRT7 -0.091 -0.265 0.695 0.245 0.124 -0.261 -0.134 0.224 0.095 -0.252 0.045 0.160 0.274 0.117 0.029 0.155
JRT9 0.019 -0.206 0.522 0.238 0.007 -0.304 -0.034 0.392 -0.001 -0.234 0.043 0.195 0.226 0.226 -0.066 0.049
JRT1 -0.048 -0.207 0.347 0.726 0.056 -0.336 -0.179 0.386 -0.057 -0.124 0.020 0.216 0.093 0.101 -0.126 0.080
JRT14 -0.031 -0.107 0.374 0.808 0.079 -0.159 -0.064 0.334 0.040 -0.149 0.022 0.084 0.033 0.099 -0.190 0.098
JRT2 0.009 -0.064 0.232 0.487 -0.036 -0.083 -0.034 0.360 -0.076 -0.102 -0.045 0.058 0.025 0.060 -0.172 0.017

97
Group Human Activity Context Perfor-
mance
Items Job Sat
2
Job Sat
1
JRT1
intconf
JRT 2
extconf
Occp
Stress Fatigue Sleep
Driving
task
Job
Demand Safety
Safety
Issue
Work
condition
Work
facility
Work
Env2
Work
Env
Perfor-
mance
JRT8 -0.078 -0.214 0.435 0.316 -0.005 -0.197 0.072 0.283 -0.031 -0.243 -0.112 0.019 0.087 0.229 -0.256 0.005
STR1 -0.002 0.150 -0.183 -0.094 0.472 0.265 -0.005 -0.195 -0.117 0.117 -0.090 0.044 -0.169 -0.159 0.049 0.145
STR10 0.074 0.183 -0.286 -0.220 -0.114 0.364 0.072 -0.340 -0.041 0.216 0.025 0.014 -0.151 -0.111 -0.089 -0.019
STR11 0.128 0.265 -0.409 -0.239 -0.042 0.414 0.078 -0.332 -0.108 0.365 -0.062 -0.089 -0.263 -0.166 0.089 -0.053
STR12 0.067 0.216 -0.179 -0.147 -0.071 0.382 -0.013 -0.259 0.030 0.196 0.003 -0.047 -0.103 -0.159 0.021 -0.020
STR13 0.100 0.250 -0.291 -0.229 0.025 0.284 -0.080 -0.333 0.067 0.065 0.064 -0.081 -0.028 -0.182 0.135 0.041
STR14 0.109 0.177 -0.287 -0.232 -0.285 0.300 0.083 -0.254 -0.079 0.188 -0.033 -0.055 -0.192 -0.117 0.068 -0.140
STR16 0.152 0.228 -0.336 -0.202 -0.127 0.389 0.082 -0.379 0.013 0.236 -0.021 0.009 -0.158 -0.167 -0.046 -0.087
STR18 0.181 0.236 -0.347 -0.153 -0.207 0.349 0.112 -0.277 -0.012 0.224 -0.072 -0.133 -0.175 -0.148 -0.061 -0.082
STR19 0.169 0.207 -0.292 -0.147 0.347 0.201 0.005 -0.343 0.055 0.154 -0.044 -0.078 -0.135 -0.123 0.050 0.134
STR2 -0.012 0.111 -0.271 -0.162 0.398 0.320 0.054 -0.251 -0.171 0.094 -0.042 -0.052 -0.134 -0.164 0.057 0.084
STR3 0.001 0.088 -0.215 -0.252 -0.007 0.267 0.071 -0.235 0.009 0.192 -0.031 -0.163 -0.079 -0.080 -0.010 -0.052
STR4 0.042 0.042 0.023 -0.050 0.560 0.157 -0.087 -0.126 -0.182 0.107 -0.050 0.017 -0.041 -0.037 0.039 0.164
STR5 -0.077 0.113 -0.185 -0.119 0.371 0.185 -0.090 -0.159 -0.055 0.194 0.008 -0.030 -0.171 -0.020 0.007 0.065
STR8 0.055 0.270 -0.286 -0.145 -0.045 0.352 0.020 -0.214 -0.048 0.232 -0.037 -0.101 -0.122 -0.160 -0.066 -0.019
STR9 0.090 0.015 -0.189 -0.261 0.028 0.318 -0.023 -0.315 -0.050 0.112 0.004 -0.105 -0.039 -0.078 0.045 -0.003
FF01 -0.002 0.325 -0.416 -0.286 -0.008 0.720 0.109 -0.389 -0.053 0.308 -0.124 -0.260 -0.149 -0.134 -0.021 -0.048
FF02 0.080 0.243 -0.444 -0.238 -0.086 0.840 0.245 -0.343 -0.055 0.236 -0.186 -0.210 -0.200 -0.103 -0.116 -0.171
FF03 0.047 0.241 -0.332 -0.289 -0.043 0.839 0.196 -0.420 -0.007 0.198 -0.142 -0.215 -0.197 -0.031 -0.132 -0.213
FF04 -0.095 0.221 -0.293 -0.067 -0.062 0.532 0.064 -0.158 0.017 0.126 -0.069 -0.101 -0.169 0.001 -0.083 -0.037
FF06 0.040 0.324 -0.324 -0.212 -0.044 0.747 0.092 -0.312 0.009 0.204 -0.120 -0.224 -0.156 -0.104 -0.088 -0.106
FF07 0.085 0.216 -0.307 -0.200 -0.011 0.726 0.127 -0.255 0.043 0.165 -0.108 -0.154 -0.139 -0.025 -0.048 -0.107
FSL01 -0.015 0.167 -0.157 -0.162 0.076 0.131 0.135 -0.170 -0.024 0.101 0.005 -0.109 -0.006 -0.217 0.033 0.020
FSL02 -0.011 0.123 -0.138 -0.167 -0.118 0.253 0.793 -0.146 -0.007 0.045 -0.051 -0.050 0.044 -0.070 -0.113 -0.075

98
Group Human Activity Context Perfor-
mance
Items Job Sat
2
Job Sat
1
JRT1
intconf
JRT 2
extconf
Occp
Stress Fatigue Sleep
Driving
task
Job
Demand Safety
Safety
Issue
Work
condition
Work
facility
Work
Env2
Work
Env
Perfor-
mance
FSL03 -0.091 0.146 -0.112 -0.191 -0.119 0.160 0.398 -0.109 -0.030 0.063 0.016 -0.038 0.022 0.015 -0.156 -0.029
FSL04 0.031 -0.066 0.155 -0.016 -0.041 0.134 -0.159 0.023 -0.067 -0.123 -0.029 -0.011 0.059 0.065 0.050 0.039
FSL05 0.048 0.184 -0.007 0.063 0.021 0.237 0.238 -0.057 -0.121 0.021 -0.109 -0.035 -0.110 -0.046 -0.137 -0.002
FSL06 -0.148 0.060 0.128 -0.037 0.004 0.089 -0.051 -0.032 0.014 0.045 0.079 -0.037 0.066 0.063 -0.047 0.023
FSL07 0.039 0.098 0.045 0.010 -0.088 0.241 0.363 -0.017 -0.063 0.006 -0.104 0.017 0.015 0.024 -0.124 -0.027
FSL08 -0.024 0.065 -0.002 -0.063 -0.026 0.173 -0.126 -0.063 0.117 -0.008 0.086 -0.035 0.021 0.121 0.055 0.011
DT1 0.028 -0.068 0.406 0.388 -0.042 -0.224 -0.100 0.698 0.069 -0.111 -0.010 0.075 0.124 0.121 -0.088 0.110
DT2 -0.015 -0.270 0.417 0.383 0.029 -0.458 -0.117 0.766 0.007 -0.181 -0.039 0.154 0.128 0.206 -0.045 0.110
DT3 -0.009 -0.180 0.281 0.367 0.027 -0.249 -0.026 0.772 -0.143 -0.154 -0.007 0.119 0.054 0.158 -0.089 0.138
DT4 -0.086 -0.099 0.332 0.158 -0.069 -0.343 -0.151 0.522 -0.004 -0.112 0.027 0.194 0.152 0.117 -0.036 0.065
JCH1 -0.035 0.173 0.077 -0.005 -0.089 -0.003 -0.022 -0.054 0.722 -0.049 0.186 0.048 0.056 -0.031 0.050 -0.032
JCH2 0.009 0.174 0.061 -0.053 -0.062 0.011 0.009 -0.056 0.836 0.018 0.095 0.090 0.116 0.088 0.094 -0.043
JCH5 0.052 0.101 0.023 0.054 -0.098 -0.053 -0.046 0.050 0.547 0.028 0.174 0.051 -0.019 0.130 0.040 -0.026
SC05 -0.038 0.393 -0.408 -0.184 -0.045 0.301 0.071 -0.188 -0.012 0.808 -0.048 -0.192 -0.324 -0.257 -0.024 -0.188
SC08 0.027 0.310 -0.145 -0.089 -0.043 0.141 0.044 -0.119 -0.005 0.756 0.000 -0.097 -0.215 -0.058 0.037 -0.157
SC10 0.027 0.246 -0.224 -0.190 -0.157 0.178 0.067 -0.171 0.032 0.688 -0.005 0.001 -0.205 -0.079 0.093 -0.109
SC13 -0.039 0.242 -0.130 -0.031 -0.006 0.045 0.054 -0.060 -0.011 0.487 0.003 -0.045 -0.128 -0.103 -0.093 -0.080
SI01 -0.041 0.053 -0.040 -0.003 -0.057 -0.122 -0.033 -0.080 0.177 0.079 0.814 0.136 -0.017 -0.007 0.094 0.068
SI02 0.014 0.024 -0.017 -0.037 -0.011 -0.079 -0.051 -0.044 0.191 0.039 0.762 0.144 0.034 -0.020 0.118 0.027
SI04 0.040 -0.137 -0.016 0.006 -0.100 -0.102 -0.036 0.023 0.099 -0.175 0.661 0.088 0.035 0.110 0.125 0.032
SI05 -0.004 -0.112 0.100 0.053 0.044 -0.199 -0.141 0.056 0.142 -0.070 0.806 0.237 0.138 0.023 0.073 0.063
SC09 -0.044 -0.250 0.299 0.189 0.084 -0.272 -0.015 0.253 0.033 -0.204 0.070 0.393 0.222 0.129 -0.013 0.031
SI06 0.057 0.031 -0.028 0.027 0.014 -0.172 -0.061 0.080 0.115 0.051 0.314 0.612 0.063 0.042 0.107 0.124
WC6 0.021 -0.031 0.175 0.117 -0.038 -0.185 -0.003 0.131 0.032 -0.234 0.111 0.625 0.223 0.043 0.106 0.123

99
Group Human Activity Context Perfor-
mance
Items Job Sat
2
Job Sat
1
JRT1
intconf
JRT 2
extconf
Occp
Stress Fatigue Sleep
Driving
task
Job
Demand Safety
Safety
Issue
Working
condition
Work
conditi
on
Work
Env2
Work
Env
Perfor-
mance
WC7 -0.153 -0.150 0.275 0.206 0.053 -0.191 0.003 0.160 0.107 -0.173 0.042 0.680 0.252 0.089 -0.058 0.149
WE3 0.081 0.054 0.047 0.047 0.110 -0.045 0.042 0.019 -0.031 0.047 0.067 0.503 -0.016 0.016 0.176 0.139
WC2 -0.029 -0.202 0.206 0.011 -0.106 -0.164 -0.023 0.089 0.113 -0.273 0.069 0.185 0.423 0.282 0.061 0.019
WC4 0.026 -0.090 0.190 0.062 -0.006 -0.201 -0.013 0.084 0.145 -0.202 0.035 0.168 0.657 0.105 0.087 0.028
WC5 -0.092 -0.253 0.307 0.078 0.039 -0.206 0.007 0.146 0.061 -0.313 0.061 0.214 0.986 0.143 0.081 0.165
SC14 -0.023 -0.136 0.200 0.154 0.103 -0.179 -0.185 0.210 0.100 -0.166 0.133 0.171 0.059 0.462 0.040 -0.057
WE12 -0.097 -0.228 0.228 0.031 -0.020 -0.112 -0.006 0.113 0.161 -0.230 0.083 0.095 0.154 0.695 0.033 -0.074
WE14 0.032 -0.166 0.163 0.097 0.025 -0.058 -0.045 0.148 0.106 -0.124 0.038 0.098 0.196 0.867 -0.012 -0.110
WE15 -0.008 -0.225 0.150 0.182 0.008 -0.086 -0.110 0.176 -0.082 -0.218 -0.077 0.082 0.083 0.654 -0.131 -0.059
WE9 -0.065 -0.143 0.142 0.069 0.160 -0.206 -0.159 0.025 0.111 -0.206 0.128 0.225 0.093 0.037 0.069 0.061
WE10 -0.010 0.185 -0.214 0.061 -0.022 0.249 0.096 -0.024 -0.018 0.113 -0.125 -0.018 -0.192 -0.126 -0.375 -0.063
WE11 0.103 0.207 -0.235 -0.158 -0.022 0.128 0.052 -0.133 0.064 0.243 0.083 0.061 -0.156 -0.107 0.085 0.024
WE13 -0.032 0.269 -0.228 0.015 -0.043 0.259 0.153 -0.071 -0.148 0.332 -0.202 -0.089 -0.263 -0.102 -0.328 -0.035
WE2 0.104 0.179 -0.161 -0.015 -0.005 0.093 0.033 0.005 -0.093 0.249 -0.110 -0.017 -0.216 -0.219 0.264 0.085
WE4 0.201 0.150 -0.104 -0.169 0.053 0.124 -0.181 -0.095 0.063 0.142 0.028 0.127 -0.050 0.018 0.441 0.060
WE5 0.125 0.287 -0.352 -0.234 0.001 0.235 0.023 -0.246 0.078 0.157 0.028 0.047 -0.116 -0.082 0.227 0.035
WE6 0.148 0.273 -0.323 -0.082 0.017 0.268 0.015 -0.167 -0.015 0.233 -0.041 0.005 -0.227 -0.174 0.038 0.010
WE7 0.030 0.120 -0.151 0.049 -0.068 0.197 0.142 0.013 -0.068 0.188 -0.067 -0.051 -0.191 -0.047 -0.530 -0.104
WE8 0.130 0.257 -0.204 0.032 -0.021 0.207 0.044 -0.089 -0.032 0.241 -0.131 -0.008 -0.266 -0.145 -0.217 -0.015
PMS2008 -0.028 -0.178 0.177 0.028 0.325 -0.141 -0.048 0.083 -0.118 -0.158 0.020 0.157 0.064 -0.078 0.168 0.763
PMS2009 -0.054 -0.116 0.224 0.129 0.305 -0.203 -0.117 0.179 0.004 -0.172 0.067 0.185 0.151 -0.106 0.127 0.816
PMS2010 -0.053 -0.095 0.147 0.089 0.232 -0.115 -0.126 0.121 -0.032 -0.129 0.071 0.145 0.069 -0.096 0.096 0.729
PMS2011 -0.003 0.038 0.050 0.088 0.162 -0.090 -0.042 0.077 0.009 -0.145 0.056 0.162 0.173 -0.130 0.181 0.678

100
Three iterations of the cross-loadings analysis were conducted with a total of 27
deletions in the 1st iteration and a further 6 items in the 2nd iteration. This cross-
loadings assessment measures the relationship of each item to other factors. Table 5.11
shows the final result of the items loading, showing that loadings highlighted in bold
were measuring a particular factor while others were cross-loadings. This confirms the
composite reliability of the items, where all items with high loading were measuring a
particular factor but loaded lower on other factors (Ramayah et al., 2011). Loading of
the item on its particular construct (factor) should be high, but its contribution to other
constructs (factors) should be low (Chin, 2010).

101
Table 5.10: Loadings and cross loadings after 3-time algorithm
Group Human Activity Context Perfor-
mance
Items Fatigue Occp
Stress
JRT1
intconf
JRT 2
extconf
Job Sat
1
Job Sat
2
Driving
task
Job
Demand
Working
condition
Safety
culture
Safety
Issue Sleep
Work
Env2
Work
conditi
on
Perfor-
mance
FF01 0.718 0.289 -0.420 -0.277 0.325 -0.002 -0.389 -0.052 -0.253 0.305 -0.122 0.167 -0.139 -0.136 -0.045
FF02 0.839 0.283 -0.445 -0.239 0.244 0.081 -0.343 -0.055 -0.194 0.248 -0.183 0.282 -0.094 -0.186 -0.166
FF03 0.840 0.265 -0.335 -0.292 0.240 0.048 -0.421 -0.005 -0.203 0.207 -0.141 0.269 -0.067 -0.195 -0.211
FF04 0.533 0.124 -0.295 -0.072 0.222 -0.096 -0.158 0.022 -0.092 0.128 -0.066 0.155 -0.001 -0.167 -0.037
FF06 0.748 0.237 -0.327 -0.228 0.324 0.040 -0.312 0.012 -0.208 0.212 -0.117 0.187 -0.106 -0.151 -0.106
FF07 0.725 0.302 -0.310 -0.208 0.215 0.086 -0.255 0.044 -0.138 0.185 -0.107 0.178 -0.047 -0.133 -0.105
STR1 0.265 0.801 -0.193 -0.081 0.150 -0.001 -0.197 -0.116 0.056 0.125 -0.091 0.063 -0.141 -0.156 0.146
STR19 0.201 0.672 -0.296 -0.138 0.207 0.170 -0.344 0.053 -0.069 0.153 -0.042 -0.009 -0.110 -0.130 0.140
STR2 0.320 0.786 -0.276 -0.161 0.111 -0.011 -0.251 -0.174 -0.040 0.100 -0.040 0.093 -0.139 -0.124 0.085
JRT11 -0.294 -0.147 0.696 0.361 -0.227 -0.093 0.286 -0.061 0.046 -0.246 -0.078 -0.165 0.067 0.152 0.146
JRT13 -0.233 -0.208 0.514 0.254 -0.051 -0.037 0.325 0.134 0.160 -0.087 0.023 -0.074 0.129 0.070 0.047
JRT15 -0.337 -0.277 0.570 0.323 -0.208 -0.035 0.348 0.093 0.195 -0.203 0.067 -0.091 0.189 0.201 0.130
JRT3 -0.316 -0.241 0.644 0.346 -0.177 -0.034 0.370 0.011 0.115 -0.228 0.008 -0.049 0.162 0.176 0.134
JRT5 -0.296 -0.314 0.677 0.283 -0.180 -0.087 0.386 0.107 0.137 -0.229 -0.002 -0.096 0.160 0.256 0.128
JRT7 -0.260 -0.119 0.695 0.239 -0.265 -0.091 0.225 0.101 0.141 -0.271 0.042 -0.016 0.146 0.258 0.154
JRT9 -0.304 -0.228 0.526 0.223 -0.207 0.018 0.392 0.001 0.185 -0.236 0.041 -0.001 0.181 0.217 0.050
JRT1 -0.336 -0.130 0.355 0.732 -0.206 -0.047 0.386 -0.058 0.207 -0.140 0.018 -0.213 0.092 0.086 0.082
JRT14 -0.159 -0.121 0.371 0.813 -0.107 -0.031 0.333 0.038 0.078 -0.145 0.021 -0.071 0.087 0.041 0.096

102
Table 5.10: Loadings and cross loadings after 3-time algorithm (cont.)
Group Human Activity Context Perfor-
mance
Items Fatigue Occp
Stress
JRT1
intconf
JRT 2
extconf
Job Sat
1
Job Sat
2
Driving
task
Job
Demand
Working
condition
Safety
culture
Safety
Issue Sleep
Work
Env2
Work
conditi
on
Perfor-
mance
JS1 0.213 0.144 -0.154 -0.191 0.620 0.077 -0.257 0.333 0.005 0.250 0.087 0.052 -0.297 -0.150 -0.039
JS2 0.292 0.171 -0.240 -0.181 0.806 0.107 -0.169 0.217 -0.046 0.360 -0.044 0.084 -0.211 -0.231 -0.118
JS3 0.198 0.127 -0.210 -0.074 0.666 0.034 -0.042 0.001 0.010 0.347 -0.117 0.127 -0.158 -0.124 -0.093
JS4 0.278 0.208 -0.306 -0.204 0.847 0.048 -0.244 0.184 -0.074 0.307 -0.037 0.171 -0.133 -0.193 -0.118
JS5 0.208 0.146 -0.227 -0.068 0.768 0.036 -0.182 0.153 -0.029 0.299 0.032 0.123 -0.223 -0.201 -0.053
JS6 0.031 0.023 -0.021 -0.034 0.096 0.863 0.011 0.052 0.062 -0.003 0.066 -0.024 0.023 -0.081 -0.040
JS7 0.079 0.110 -0.139 -0.073 0.076 0.907 -0.058 -0.012 -0.055 -0.020 -0.055 -0.020 -0.041 -0.047 -0.050
JS8 0.041 0.063 -0.069 0.020 0.001 0.722 0.036 -0.063 -0.030 0.062 -0.048 -0.003 -0.055 -0.095 -0.019
DT1 -0.224 -0.239 0.406 0.370 -0.067 0.028 0.700 0.062 0.053 -0.112 -0.012 -0.116 0.079 0.131 0.110
DT2 -0.458 -0.235 0.419 0.370 -0.268 -0.014 0.764 0.005 0.135 -0.175 -0.040 -0.152 0.180 0.122 0.107
DT3 -0.249 -0.271 0.284 0.346 -0.178 -0.010 0.768 -0.142 0.118 -0.164 -0.008 -0.029 0.131 0.050 0.135
DT4 -0.343 -0.257 0.337 0.154 -0.099 -0.086 0.529 -0.008 0.182 -0.119 0.024 -0.150 0.102 0.141 0.067
JCH1 -0.002 -0.102 0.075 -0.006 0.172 -0.037 -0.054 0.750 0.049 -0.046 0.187 -0.036 -0.013 0.048 -0.036
JCH2 0.011 -0.035 0.060 -0.041 0.172 0.008 -0.056 0.835 0.089 0.018 0.095 0.001 0.080 0.110 -0.044
JCH5 -0.053 -0.059 0.029 0.058 0.100 0.051 0.051 0.513 0.049 0.031 0.174 -0.040 0.146 -0.024 -0.024
SI06 -0.172 0.029 -0.032 0.022 0.033 0.057 0.081 0.114 0.610 0.047 0.310 -0.139 0.027 0.060 0.120
WC6 -0.185 -0.121 0.178 0.121 -0.031 0.019 0.130 0.032 0.634 -0.222 0.110 0.022 0.086 0.215 0.124
WC7 -0.190 -0.157 0.279 0.211 -0.149 -0.152 0.161 0.103 0.678 -0.204 0.040 -0.008 0.122 0.242 0.150
WE3 -0.045 0.212 0.044 0.059 0.053 0.078 0.020 -0.027 0.509 0.071 0.069 0.019 0.016 -0.020 0.140
SC05 0.300 0.196 -0.413 -0.178 0.394 -0.036 -0.188 -0.017 -0.182 0.810 -0.047 0.032 -0.270 -0.301 -0.185
SC08 0.141 0.113 -0.149 -0.076 0.310 0.027 -0.119 -0.004 -0.086 0.793 0.002 0.045 -0.100 -0.208 -0.158

103
Table 5.10: Loadings and cross loadings after 3-time algorithm (cont.)
Group Human Activity Context Perfor-
mance
Items Fatigue Occp
Stress
JRT1
intconf
JRT 2
extconf
Job Sat
1
Job Sat
2
Driving
task
Job
Demand
Working
condition
Safety
culture
Safety
Issue Sleep
Work
Env2
Work
conditi
on
Perfor-
mance
SC10 0.178 0.060 -0.227 -0.180 0.247 0.027 -0.170 0.029 0.013 0.695 -0.004 0.040 -0.082 -0.200 -0.108
SI01 -0.122 -0.025 -0.042 0.003 0.053 -0.042 -0.080 0.177 0.137 0.082 0.819 -0.012 -0.021 -0.019 0.069
SI02 -0.079 0.000 -0.018 -0.022 0.023 0.012 -0.044 0.191 0.144 0.046 0.771 -0.011 -0.018 0.030 0.030
SI04 -0.102 -0.126 -0.011 0.012 -0.138 0.039 0.023 0.100 0.086 -0.161 0.666 -0.011 0.104 0.028 0.034
SI05 -0.199 -0.103 0.100 0.063 -0.113 -0.005 0.057 0.141 0.231 -0.089 0.794 -0.119 0.045 0.134 0.061
FSL02 0.254 0.056 -0.135 -0.171 0.124 -0.011 -0.147 -0.006 -0.046 0.041 -0.048 0.928 -0.047 0.039 -0.078
FSL03 0.160 0.078 -0.114 -0.185 0.145 -0.091 -0.109 -0.033 -0.032 0.064 0.017 0.577 -0.002 0.019 -0.026
FSL07 0.242 -0.023 0.046 0.004 0.098 0.040 -0.016 -0.063 0.019 0.006 -0.103 0.564 0.011 0.023 -0.026
WE12 -0.112 -0.143 0.232 0.030 -0.228 -0.098 0.113 0.158 0.086 -0.216 0.085 0.028 0.781 0.127 -0.077
WE14 -0.058 -0.136 0.168 0.096 -0.166 0.031 0.147 0.099 0.094 -0.110 0.037 -0.017 0.908 0.179 -0.109
WE15 -0.086 -0.145 0.155 0.172 -0.225 -0.009 0.176 -0.089 0.075 -0.237 -0.079 -0.115 0.704 0.069 -0.062
WC4 -0.201 -0.156 0.195 0.076 -0.090 0.025 0.085 0.145 0.159 -0.212 0.032 0.029 0.129 0.649 0.027
WC5 -0.207 -0.178 0.312 0.075 -0.252 -0.092 0.147 0.063 0.202 -0.311 0.058 0.039 0.161 0.992 0.163
PMS2008 -0.141 0.184 0.170 0.024 -0.178 -0.027 0.082 -0.116 0.159 -0.163 0.019 -0.019 -0.058 0.058 0.754
PMS2009 -0.203 0.063 0.217 0.132 -0.115 -0.053 0.179 0.005 0.183 -0.173 0.065 -0.055 -0.076 0.157 0.797
PMS2010 -0.115 0.147 0.144 0.097 -0.096 -0.053 0.122 -0.036 0.151 -0.127 0.072 -0.080 -0.099 0.079 0.754
PMS2011 -0.091 0.125 0.047 0.097 0.037 -0.004 0.077 0.009 0.171 -0.141 0.057 -0.071 -0.092 0.175 0.687

104
5.3.2 Convergent validity
Convergent validity was assessed through factor loadings, composite reliability
and average variance extracted (AVE) (Hair et al., 2010). The loading of the items
should be greater than 0.5 with composite reliability (CR) values of 0.7 (Hair et al.,
2010). The average variance extracted (AVE) proposed by Fornell and Larcker (1981)
was to measure the variance amount from the indicators relative to measurement error.
For convergent validity, the AVE values should be more than 0.5 (Chin, 2010).
Table 5.11: Results of the measurement model
Domain Factors Items Loading AVE CR
Fatigue
FF01 0.718
0.549 0.878
FF02 0.839
FF03 0.840
FF04 0.533
FF06 0.748
FF07 0.725 Job related
tension (external
conflict)
JRT1 0.732 0.598 0.748
JRT14 0.813
Job related
tension (internal
conflict)
JRT11 0.696
0.586 0.813
JRT13 0.514
Human
JRT15 0.570
JRT3 0.644
JRT5 0.677
JRT7 0.695
JRT9 0.526
Job Satisfaction 1
JS1 0.620
0.557 0.861
JS2 0.806
JS3 0.666
JS4 0.847
JS5 0.768
Job Satisfaction 2
JS6 0.863
0.696 0.872 JS7 0.907
JS8 0.722
Occupational
Stress
STR1 0.801
STR19 0.672 0.570 0.798
STR2 0.786

105
Table 5.11: Results of the measurement model (cont.)
Domain Factors Items Loading AVE CR
Human Sleep
FSL02 0.928
0.504 0.742 FSL03 0.577
FSL07 0.564
Activity
Driving task
DT1 0.700
0.486 0.788 DT2 0.764
DT3 0.768
DT4 0.529
Job Demand
JCH1 0.750
0.507 0.748 JCH2 0.835
JCH5 0.513
Context
Working
condition
SI06 0.610
0.373 0.702 WC6 0.634
WC7 0.678
WE3 0.509
Safety Culture
SC05 0.810
0.589 0.811 SC08 0.793
SC10 0.695
Safety Issue
SI01 0.819
0.585 0.848 SI02 0.771
SI04 0.666
SI05 0.794
Working
Environment 2
WE12 0.781
0.643 0.842 WE14 0.908
WE15 0.704
Work Facilities WC4 0.649
0.703 0.819 WC5 0.992
Performance
PMS2008 0.754
0.561 0.836 PMS2009 0.797
PMS2010 0.754
PMS2011 0.687
Table 5.11 summarizes the results of the measurement model, showing that the
values for loadings and CR for all the domains of human, activity and context are
generally greater than the cut-off value for loadings and composite reliability (CR).
However, two factors of driving task and working condition had AVE values below the
cut-off value of 0.5 recommended by Fornell and Larcker (1981). Therefore, there
should be a re-examination of the measurement model.

106
The re-examination is conducted by individual removal of the lowest items for
each particular factor and recalculating the PLS algorithm. Items DT4 and WE3 were
removed, since they did not meet the AVE minimum value of 0.5. After deletion of item
DT4, the AVE values of driving task factor and working condition improved from 0.486
to 0.579 and from 0.373 to 0.503, respectively.
Table 5.12 presents the results after recalculation, showing that all the constructs
have met the recommended values and are thus reliable and valid. The values
highlighted in grey boxes shows the improved values after deletion of unreliable items.
Table 5.12: Results of the final measurement model
Domain Factors Items Loading AVE CR
Fatigue
FF01 0.718
0.549 0.878
FF02 0.839
FF03 0.840
FF04 0.533
FF06 0.748
FF07 0.725
Job related tension
(external conflict) JRT1 0.732
0.598 0.748
JRT14 0.813
Job related tension
(internal conflict)
JRT11 0.696
0.586 0.813
JRT13 0.514
JRT15 0.570
Human JRT3 0.644
JRT5 0.677
JRT7 0.695
JRT9 0.526
Job Satisfaction 1
JS1 0.620
0.557 0.861
JS2 0.806
JS3 0.666
JS4 0.847
JS5 0.768

107
Table 5.12: Results of measurement model (cont.)
Domain Factors Items Loading AVE CR
Job Satisfaction 2
JS6 0.863
0.696 0.872
JS7 0.907
JS8 0.722
Occupational Stress
STR1 0.801
0.570 0.798 Human STR19 0.672
STR2 0.786
Sleep
FSL02 0.928
0.504 0.742
FSL03 0.577
FSL07 0.564
Activity
Driving task
DT1 0.700
0.579 0.788 DT2 0.764
DT3 0.768
Job Demand
JCH1 0.750
0.507 0.748 JCH2 0.835
JCH5 0.513
Context
Working condition
SI06 0.610
0.503 0.702 WC6 0.634
WC7 0.678
Safety Culture
SC05 0.810
0.589 0.811 SC08 0.793
SC10 0.695
Safety Issue
SI01 0.819
0.585 0.848 SI02 0.771
SI04 0.666
SI05 0.794
Working Environment
2
WE12 0.781
0.643 0.842 WE14 0.908
WE15 0.704
Work Facilities WC4 0.649
0.703 0.819 WC5 0.992
Performance
PMS2008 0.754
0.561 0.836 PMS2009 0.797
PMS2010 0.754
PMS2011 0.687

108
5.3.3 Discriminant Validity
Discriminant validity is another assessment of the constructs (factors) to test the
validity of the measurement. Discriminant validity tests whether believed unrelated
constructs are indeed unrelated. Thus the cross-construct correlations should be very
low, whereas it should measure strongly the construct it attempts to reflect (Chin, 2010).
The discriminant validity of this study is presented in Table 5.13, showing the average
variance extracted (AVE) of the factor (construct), indicated in bold, is much greater
than the squared correlations for each constructs. This indicates adequate discriminant
validity is achieved. Since the measurement model demonstrated adequate convergent
validity and discriminant validity, this indicated that each factor (construct) was unique
and captured phenomena not represented by other factors in the model (Hair et al.,
2014).
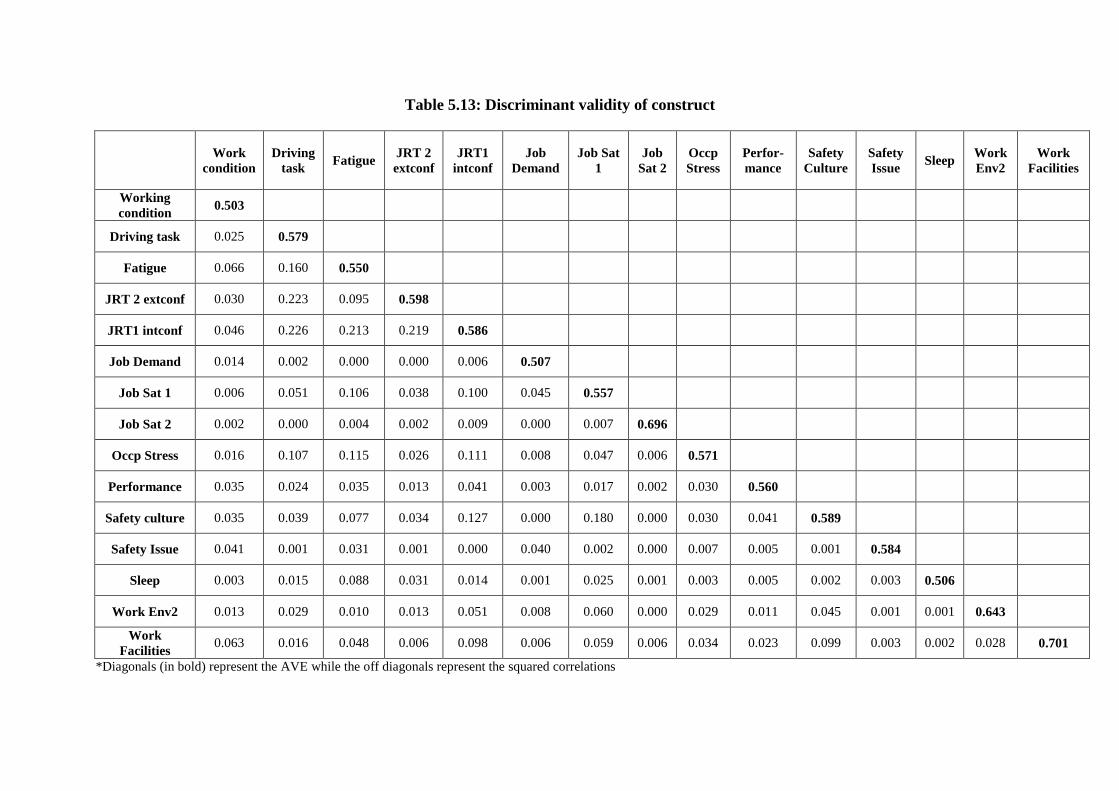
109
Table 5.13: Discriminant validity of construct
Work
condition
Driving
task Fatigue
JRT 2
extconf
JRT1
intconf
Job
Demand
Job Sat
1
Job
Sat 2
Occp
Stress
Perfor-
mance
Safety
Culture
Safety
Issue Sleep
Work
Env2
Work
Facilities
Working
condition 0.503
Driving task 0.025 0.579
Fatigue 0.066 0.160 0.550
JRT 2 extconf 0.030 0.223 0.095 0.598
JRT1 intconf 0.046 0.226 0.213 0.219 0.586
Job Demand 0.014 0.002 0.000 0.000 0.006 0.507
Job Sat 1 0.006 0.051 0.106 0.038 0.100 0.045 0.557
Job Sat 2 0.002 0.000 0.004 0.002 0.009 0.000 0.007 0.696
Occp Stress 0.016 0.107 0.115 0.026 0.111 0.008 0.047 0.006 0.571
Performance 0.035 0.024 0.035 0.013 0.041 0.003 0.017 0.002 0.030 0.560
Safety culture 0.035 0.039 0.077 0.034 0.127 0.000 0.180 0.000 0.030 0.041 0.589
Safety Issue 0.041 0.001 0.031 0.001 0.000 0.040 0.002 0.000 0.007 0.005 0.001 0.584
Sleep 0.003 0.015 0.088 0.031 0.014 0.001 0.025 0.001 0.003 0.005 0.002 0.003 0.506
Work Env2 0.013 0.029 0.010 0.013 0.051 0.008 0.060 0.000 0.029 0.011 0.045 0.001 0.001 0.643
Work
Facilities 0.063 0.016 0.048 0.006 0.098 0.006 0.059 0.006 0.034 0.023 0.099 0.003 0.002 0.028 0.701
*Diagonals (in bold) represent the AVE while the off diagonals represent the squared correlations

110
5.4 Evaluation of the structural model
Once it has been determined that the factors are reliable and valid, the
subsequent process is to analyse the structural model by testing the hypothesis
(Anderson & Gerbing, 1991; Chin, 2010). The assessment of the structural model is
used to determine whether the concept which has been selected is empirically
confirmed.
The modified model consists of three domains with fourteen hypotheses. Table
5.14 lists the hypotheses of the modified model after factor analysis process.
Table 5.14: List of the hypotheses of the modified model
E.g.: (Factor) has a significant effect on the performance of train driver
Domain Hypothesis
Human
H1 Occupational stress
H2a Job related tension (internal conflict)
H2b Job related tension (external conflict)
H3a Job satisfaction (1)
H3b Job satisfaction (2)
H4 Fatigue
H5 Sleepiness
Activity
H6 Job demand
H7 Driving task
Context
H8a Working environment
H8b Work facilities
H9a Safety culture
H9b Safety issue
H10 Working condition

111
Hypothesis testing was used to examine the path loadings and β-value between
constructs of the inner model. Furthermore, bootstrapping technique was implemented
with t-statistics to test for significance. Table 5.15 shows the path coefficients’ and the
results of hypothesis testing.
Table 5.15: Path coefficients’ and hypothesis testing
Cluster Hypothesis Beta
Standard
Error t-value Decision
Human
H1 Occupational Stress →
Performance 0.328 0.074 4.448*** Significant
H2a Job related tension (internal
conflict) → Performance 0.148 0.074 1.998** Significant
H2b Job related tension
(external conflict)→
Performance
-
0.043 0.073 0.587 Not significant
H3a Job Satisfaction 1 →
Performance -
0.042 0.071 0.584 Not significant
H3b Job Satisfaction 2 →
Performance -
0.045 0.069 0.648 Not significant
H4 Fatigue → Performance -
0.085 0.073 1.371* Significant
H5 Sleep → Performance -
0.026 0.080 0.327 Not significant
Activity H6
Job Demand →
Performance -
0.037 0.086 0.428 Not significant
H7 Driving task →
Performance 0.141 0.065 2.170** Significant
Context
H8a Working environment→
Performance -
0.176 0.073 2.417*** Significant
H8b Work facilities →
Performance 0.076 0.070 1.089 Not significant
H9a Safety culture→
Performance -
0.133 0.065 2.065** Significant
H9b Safety Issue →
Performance 0.060 0.084 0.712 Not significant
H10 Working condition→
Performance 0.120 0.062 1.935** Significant
Note: *(10%) p<0.1 = 1.28; **(5%) p<0.05 = 1.645 ; *** (1%) p<0.01=2.33 | One-tailed test
From the seven hypotheses drawn for human domain, three factors were found
to be not significant. The non-significant factors were job related tension (external
conflict) and two factors of job satisfactions. Fatigue was positively related (t= 1.371,
p<0.1) with the performance of the train driver. Other factors tested for hypotheses for

112
the human domain were job related tension (internal conflict) (t=1.998, p<0.05) and
occupational stress (t=4.448, p<0.01) towards performance of the train driver.
For the activity domain, the driving task was found to have positive relationship
to performance as its hypothesis is significant (t = 2.170, p<0.05). Conversely, the job
demand was found as a non-significant factor on train driver performance (t = 0.428).
The context domain has five factors, from which only three factors had
significant hypothesis. The significant factors having direct positive effects on the
performance of train drivers wer safety culture (t=2.065, p<0.05), working environment
(t=2.417, p<0.01) and working condition (t=1.935, p<0.05). On the other hand, safety
issue and working condition were found to be non-significant to the performance of the
driver.
Figure 5.6 shows the overall graphical representation of the model. From the
fourteen hypotheses tested, only seven were accepted which were found to have a
strong influence on the performance of the train driver. These hypotheses are: H1
(occupational stress), H2a (job related tension – internal conflict), H4 (fatigue), H7
(driving task), H8a (work environment), H9a (safety culture) and H10 (working
condition).

113
Figure 5.6: Structural model of train driver performance model
Job satisfaction 2 Job satisfaction 1
JRT internal conflict
JRT external conflict
Performance
Fatigue
Sleep
Driving task
Job demand
Safety issue
Work environment
Working condition
Safety culture
Occupational
stress
Facilities

114
5.4.1 The performance model
Fourteen factors were initially evaluated by hypothesis testing, from which
seven factors were identified to be significant. Table 5.16 lists the seven factors which
influence the performance of train drivers in Malaysia, which are job-related tension
(internal conflict), fatigue, occupational stress, driving task, work environment, working
condition and safety. The integrated performance model of Malaysian train drivers is
presented graphically in Figure 5.7.
Table 5.16: Factors affecting performance of the Malaysian train drivers
Cluster Hypothesis
Human
H1 Occupational stress in Malaysia
H2a Job related tension (internal conflict)
H4 Fatigue
Activity H7 Driving task
Context
H8a Work environment
H9a Safety culture
H10 Working condition
*(Factor) has a significant effect on the performance of train drivers

115
The integrated train driver performance model was developed based on SEM-
PLS algorithm, utilising shapes (oval and rectangles) and arrows to show the
relationship between constructs and indicator variables. A simplified representation is
shown in Figure 5.8, consisting of 3 concentric circles. The innermost circle is the main
objective of the study on the performance of the train driver. The outermost circle is
divided into three to indicate the three domains influencing the performance of the train
drivers, which are human, context and activity; as discussed in Chapter Three. The
middle circle represents the factors which affects the performance of the train driver.
For clarity, the colour schemes for the factors are chosen to be similar to their respective
associated domain. This middle circle is dynamic, meaning that for future studies;
factors can be inserted or removed to suit the circumstances of that particular study.
However, the factors added would still be grouped under the three major domains. The
simplified version of the integrated Malaysian train driver performance model is
Figure 5.7: Malaysian train driver integrated performance model
JRT internal
conflict
Performance
Occupational
stress
Safety
culture
Fatigue
Driving task Work environment
Working
condition

116
deemed to be easily understood by the general public and could be used as guidance for
the management and stakeholders in managing human capital in the TOC.
Figure 5.8: An integrated Malaysian train driver performance
model

117
5.5 Summary
Three domains, namely human, activity and context, were proposed to
categorise the fourteen factors. The relationships between factors were evaluated
iteratively using SEM-PLS. The measurement model was also evaluated through
composite reliability, prioritizing the indicators according to their individual reliability.
This evaluation technique validated that all items with high loading were measuring a
particular factor but were loaded lower on other factors. The convergent validity was
also measured and confirmed that the items used were valid, reliable, and correlated
positively to measure the same construct (factor). Discriminant validity was performed
to assess the validity of the measurements, to ensure that constructs were not measuring
other constructs or overlapping constructs. It is expected that the cross-construct
correlations should be very low but would measure strongly the construct it attempts to
reflect. It was found that all factors have average variance extracted (AVE) values
greater than 0.5, indicating that each factor was unique and captured phenomena not
represented by other factors in the model.
From the originally proposed structural model having fourteen hypotheses, only
seven hypotheses were found to be significant. These are job-related tension (internal
conflict), fatigue, occupational stress, driving task, work environment, working
condition and safety culture. The results highlighted that the three domains i.e. human,
context and activity with their seven factors are important in developing an integrated
train driver performance model for Malaysia.

118
CHAPTER 6 : DISCUSSIONS AND BENCHMARKING
6.1 Introduction
This chapter is divided into six sections on the summary of the results and
discussions of the findings. The developed model of Malaysian train driver performance
with factors affecting in particular domains of this study is discussed in the second until
fifth sections, while Section Six highlights the benchmarking study. The significant
contributions of this study conclude this chapter.
6.2 The developed model of Malaysian train driver performance
A theoretical framework of train driver performance was proposed and
developed in the earlier stage of this study. This framework consists of the potential
influential factors, identified through extensive review of the literatures, based on the
three main frameworks of Bailey (1996), Baines et al. (2005) and the model of Chang
and Yeh (2010). Three main domains were introduced to categorise the main key
indicators for measuring human performance namely, the human, activity and context
for the Malaysian train drivers.
A survey was conducted based on the proposed framework to test the
comprehensiveness of the model through fourteen hypotheses. The data analysis was
conducted using SPSS and SEM, from which a model was then developed and tested
empirically to identify the association between human performance and the three main
influential domains; human, activity and context for the Malaysian train drivers.
From the hypothesis testing as reported in Section 5.4, seven out of fourteen
hypotheses were found to be significant and supported the relationship suggested in the
theoretical framework. The significant factors were occupational stress (H1), job related

119
tension (internal conflict) (H2a), fatigue (H4), driving task (H7), working environment
(H8a), safety culture (H9a) and working condition (H10). The remaining seven
hypotheses were found to be insignificant. This results show that the performance of the
train driver is not only influenced by the individual itself, but also from external factors
of job demand, safety and working environment. An integrated model of Malaysian
train driver performance was finally developed and proposed as one of the
comprehensive model for the study the performance of train drivers as well as for
general human performance measure.
The discussion on the factors affecting the performance of the train driver based
on its domain will be presented in the next following sections.
6.3 Factors of human domain which affecting train driver performance
This section discusses the results of the hypotheses testing on the relationships
between the train driver with factors of the human domain; i.e. occupational stress, job
related tension, job satisfaction, fatigue and sleepiness.
In the proposed model, seven hypotheses (H1 – occupational stress, H2a - job
related tension (internal conflict), H2b - job related tension (external conflict), H3a and
H3b – job satisfaction, H4 – fatigue and H5 – sleepiness) were put forward,
representing the influence of ‘human’ on train driver performance. Mixed results were
obtained for the relationship between ‘human’ and performance. Occupational stress,
H1 (t=4.448, p<0.01); job related tension – external conflict, H2b (t=1.998, p<0.05) and
fatigue, H4 (t=1.371, p<0.1) were found to have strong correlations with performance.
Others were found to be insignificant.
The influence of occupational stress (H1) (t=4.448, p<0.01) and job-related
tension (internal conflicts) (H2a)(t=1.998, p<0.05) on the train driver performance
agrees well with the findings of past studies which have reported that occupational

120
stress, caused by poor job design, layout setting, and high workload, are highly potential
stressors which contribute to the increase level of stress (Jou et al., 2013). These
external factors would intensify the mental pressure on the driver and ultimately affect
their performance. In addition, job-related tension is the result from this stress and
pressure, particularly caused by external factors (Yahaya et al., 2009 ). Thus, the stress
and tension experienced by the driver were caused by their working environment and
conditions, and was not due their own internal factors such as family, financial or
relationship at work.
Fatigue (H4) (t=1.371, p<0.1) was also found to be a significant contributor to
the performance level of the train driver. This results is not surprising as fatigue
correlated significantly with alertness and performance of the driver (Dorrian et al.,
2011; Dorrian et al., 2006, 2007; Fletcher & Dawson, 2001).. There is a relationship
between safety, occupational stress and work-related driver fatigue, as reported by past
studies on work-related accidents (Strahan et al., 2008). Other researchers have also
related fatigue with safety, and have identified its significant influence the performance
of the driver (Horrey et al., 2011; Williamson et al., 2011). Fatigue could cause
reductions in the interactions between the driver and the train, resulting in an increased
risk of accidents (Dorrian et al., 2007). It also reduces the level of alertness of signals,
signs and the surroundings while driving (Hamilton & Clarke, 2005; Lamond et al.,
2005). As time passes, the level of fatigue will gradually increase and if left unabated,
will result in the driver falling asleep (Strahan et al., 2008). Previous studies have
mentioned that driving a locomotive is a monotonous and boring task, and it will lead to
fatigue and the driver becoming sleepy (Dorrian et al., 2011; Fletcher & Dawson, 2001).
Thus, these findings suggest that the performance of the train drivers were
mostly relying on external factors that influenced their behaviours and reactions rather
than internal factors. As such, job related tension – internal conflict (H2a), job

121
satisfaction (H3a and H3b) and sleepiness (H5) were found insignificant towards the
performance of the train driver.
Sleepiness, H5 (t=0.327) was found insignificant on the performance of the
driver. The insignificance of sleepiness is probably due to the set-up of the train
schedules and the duration of shifts. Train drivers in Peninsular Malaysia are located at
seven different main depots, as reported in sub-chapter 4.6. Based on the observation of
the train schedules (shown in Appendix 9), the drivers will drive the locomotive from
one depot to the subsequent depot and there will be an exchange of crew members at the
depots. The longest shift duration is for the 7 hours 50 minutes journey from
Woodlands, Singapore to Kuala Lumpur on the 'Ekspres Rakyat’ train route. Upon
reaching Kuala Lumpur, there would be a change of crew for the subsequent 5 hours 50
minutes journey from Kuala Lumpur to Butterworth, Pulau Pinang. Similarly, the
journey between depots for other routes averaged around 4 hours from one depot to
another. Thus the length of shift and working hours is still within the permissible limit
outlined in the Malaysia Employment Act 1955 (Amendment 2012). It has been
reported that longer working hours were not an influential factor of sleepiness, although
workload significantly influences fatigue (Dorrian et al. (2011). The train driver shifts
were designed to provide enough sleep and rest, with proper facilities such as air-
conditioned room with bathroom at the ‘running bungalow’ provided for the drivers.
Therefore, with enough rest and sleep, the train drivers should not have problems with
sleepiness.
Another hypothesis, the internal conflict which leads to job-related tension was
also found to be insignificant to the train driver performance. In this study, the internal
conflict factor focuses on the emotion and self-perception of the individuals, and differs
from job-related tension (external conflict). The job-related tension (external conflict)
(H2b) (t=1.998, p<0.05) has a strong relationship on the performance of the driver,

122
although it appears to contradict with the job-related tension caused by internal conflict
(H2a). It was found that an internal conflict which leads to job-related tension was not
significant to the performance. In this study, the internal conflict has focused on the
emotion and self-perception of the individuals. Thus, the results have indicated that the
drivers were confident that they do not have internal conflicts that would affect their
performance. This confidence is perhaps due to their understanding of their scope of
work, their own capability to perform the job and that they were not concerned with the
perception of others towards them. Hence, the results were found to be insignificant.
Another interesting finding was the relationship between job satisfaction and
performance of the train driver. It was found that job satisfaction did not have a direct
positive effect on the performance of the train driver. Genaidy et al. (2007) suggested
that if the effort and reward is balanced, employees will be more satisfied with their job
and results in better accomplishment of their work. In this study, almost 60% of the
drivers were above 35 years old with over 75% having worked for more than six years.
This statistics agrees well with previous study by Dawal et al. (2009) which indicated
that satisfaction can be related with the age of the employee, their ability to adapt with
the working environment and adjustment of their expectation and level of satisfaction.
The TOC in this study is a government-linked company (GLC), which provide good
facilities and benefits to their employees such as medical coverage, pension scheme and
staff quarters. These benefits can be a major factor for employees to remain loyal with
the company and to accordingly adjust their level of satisfaction of the job. Thus, job
satisfaction is an insignificant factor of train driver performance.

123
6.4 Factors of activity domain which affecting train driver performance
In the “activity” domain, the driving task and job demand were hypothesized as
important determinants of train driver performance. The hypotheses of job demand (H6)
and driving task (H7) were formulated to examine this relationship. The result, as
shown in section 5.4, has identified that the driving task (H7) positively influenced the
performance of the train driver. (t=2.170, p<0.05).
This suggests that the train drivers were concerned of their activities while
driving; which requires them to be alert and aware of the surroundings and several
information along the track (Hamilton & Clarke, 2005). Similar reasoning were given
by Kecklund et al. (2001) on the relationship of vigilance with train-driving activity.
The train driver's activities in the driving cab include not only controlling of the power
throttle, but also to verify that the locomotive is running in good condition, be alert with
surrounding environments including illegal trespassers, signals, radio contact with
control centre, and to ensure that both crews are always awake and paying attention
since driving a locomotive is a boring and monotonous task (Jap et al., 2010). With
these burden of responsibilities, the driving task is a significant stressor to the
performance of the train driver.
The job demand is a work activity to be completed by the employees, as
required by the superior or management (Schaufeli & Bakker, 2004). Surprisingly, the
analysis has shown that the job demand was found insignificant, in contrast to the
driving task which was significant to the performance of the train driver. Further
analysis have shown that the performance of the train driver were more dependent on
the immediate demand during the performance of the job, rather than the demand from
the management. Demands from the superior and organisation were expected as a
normal daily routine for the drivers. However since most of the demand were routine in
nature, in which the train drivers are only required to follow their duty roster, be

124
observant of standard operating procedure before driving and to be on standby for
incomplete crew members. Furthermore, the company also provide accommodation
facilities for those who are not from that reporting depot. The job demand is thus not a
stressor to their performance as the demand was balanced and did not have high
requirements (Schaufeli & Bakker, 2004).
6.5 Factors of context domain which affecting train driver performance
The literatures have highlighted the environment as one of the important
elements influencing performance of the worker. In this study, factors surrounding the
train drivers in the ‘context’ domain were evaluated to determine their relationship to
the performance of the train driver. Five hypotheses were identified and posited,
representing the ‘context’ domain which includes work environment, work facilities,
safety culture, safety issue and working condition.
Consistent with earlier expectations, the result of this study has shown that the
work environment, hypothesized in H8a, is an important variable influencing the
performance of the train driver. This is further supported by past findings by Kahya
(2007) and Niu (2010), both suggested that working condition, hypothesized in H10, are
significant factor affecting performance of the employees.
Work is defined as “something to be done or something to do” (Oxford English
Dictionary, 2013). Most literatures have regarded 'working conditions' and 'working
environment' as interchangeable terms to refer to the physical surroundings of the
workplace (Kahya, 2007; Kecklund et al., 1999). However, in literal terms, the working
environment could be defined as “something to be done at the area surrounding a place
or a thing” while working conditions refers to “something to be done at certain
circumstances” which normally refers to work activities, working time and other
working aspects ("Definition of 'condition', first published 1891," 2013; "Definition of

125
'environment', OED 3rd Edition, June 2011," 2013; "Definition of 'work', first published
1928," 2013). Baines et al. (2005) defined work environment as physical environment
which relates to the workplace situation such as noise, temperature, and lighting. On the
other hand, the term “organisational environment” was used to refer to the working
activities, aspects, job rotation etc. instead of “working condition”. Thus, the approach
in this study is to differentiate work environment and working conditions as two
separate factors influencing the performance of the train driver.
The analysis of the data has shown that the performance of the train driver is
affected by the working environment (H8a). These findings are in agreement with the
findings by Kompier (1996) which found that the drivers were always complaining on
the comfort level at their workplace. In addition the working environment in the
transportation industry is dynamic and are exposed to the natural environment. The hot
and humid weather of Malaysia can be discomforting, particularly in locomotives
unequipped with air-conditioners. Poor working environment inside the driving cab can
also lead to discomfort and uneasiness, which may affect other factors (i.e. stress, job-
related tension etc.) as well as safety (Stanton & Salmon, 2011).
The working condition, hypothesized in H10, was also found to be significant to
the performance of the train driver. Past research has yet to address the relationship
between job characteristics and working conditions on employee’s performance ( Kahya
(2007). The ‘working condition’ is differentiated from the ‘work environment’,
referring more towards the organisational environment, as discussed by Baines et al.
(2005). Job rotation and schedule, shift and employment issue are some of the items
within this factor (construct).
The analysis has shown that the train drivers agreed that working conditions
have an influence on their performance. Their work tasks are based on shift work and
dependent on the work schedule designed and provided by their supervisor. Improper

126
management of the shift work and schedule may give rise to dissatisfaction of the job
rotation and other job-related procedures and guidelines, and ultimately affect the
performance of the train drivers (Taris & Schreurs, 2009).
Similarly, the relationship among colleagues and supervisors also plays an
important role. Presence of amicable relationship creates a conducive environment and a
nice place to work (Yan & Turban, 2009). The absence of good relationship may lead to
other problem such as stress and burn out. Supervisor and the superiors have an
important role in creating a conducive working condition. Since the findings from this
study suggests that working conditions are significant to the performance of the train
drivers, steps can be taken by the superior and the management to improve the working
conditions for the drivers.
'Work facilities' was found to be insignificant, in contrast to the significant
relationships of the working condition and work environment. The train drivers are
required to be at the station one hour before driving, and then would spend most of their
time working in the driving cab of the locomotive. Apart from a small number of new
locomotives, most of the locomotives were old and not equipped with air-conditioners.
The absence of air-conditioners may lead to discomfort, although the findings from this
study have found that this was not a significant factor (Austin & Drummond, 1986).This
is probably due to the good natural ventilation and air, as the rail tracks are mostly in
suburban and rural areas, which are less polluted than in urban environments.
As previously mentioned in Chapter Four, a train journey in Malaysia from one
depot to another would take only four to five hours. This work setting ensures that the
drivers have ample time to go to the washroom and have their meals in between shifts.
Due to the present layout of the single rail track, except for the Seremban - Kuala
Lumpur – Ipoh sector having double tracks, the freight trains are required to wait at
certain station or depot to give way to the express or passenger trains. During that time,

127
the train driver and crew would also have enough time to ease themselves. In addition,
the TOC also provide comfortable air-conditioned accommodation facilities at the
depots for them to rest and sleep. Thus, since the train drivers were satisfied with the
availability of these basic facilities, the work facilities, as hypothesised in H8b, had no
significant relationship with performance of the train driver.
In the railway industry, the issue of safety is very pertinent and can become a
threatening event to the TOC (Stanton & Salmon, 2011). This safety issue is related to
safety problems caused by external parties, which includes persons on track, illegal
trespassing, vandalism and strangers attack (Austin & Drummond, 1986). In this study,
it was found that the issue of safety, as hypothesize in H9b, did not have a positive
influence on the performance of the train driver.
The current construction of the double track project by the TOC and the
government of Malaysia has incorporated extra precaution on public safety (Land
Public Transport Commission, 2012). Safety fencing are being built alongside the track
to prevent trespassing, especially as the new system is based on electrified locomotives
which are much quieter and faster than the diesel counterparts. The track areas are also
gazetted as restricted zones to the public, in contrast to past times where the public were
able to cross the train tracks, especially in villages. Furthermore, the old diesel
locomotives were noisy and noticeable from a distance and the number of train running
were small due to the single track system. The double track project also includes
upgrading of railway stations with improved facilities to cater for the requirements of
the new trains and safety regulations. Safety personnel are promoted as auxiliary police
to safeguard critical locations such as the stations, depots and other restricted areas.
Bridge crossings or tunnels are also being built at the stations to keep cases of illegal
track crossing to a minimum. The safety department of the TOC has also begun safety

128
awareness campaign for the public, especially for villagers in the rural area along the
rail track.
Since the issue of safety and safety compliance has been taken into account by
the management of the TOC, it was thus found to be insignificant to the performance of
the train driver.
Safety culture, as hypothesized in H9a, is another aspect of safety which may
have a relationship on human performance. The results, as shown in Section 5.4,
support the notion that safety culture influences the performance of the train driver
(H9a). The concept of safety culture was initially introduced after the devastating
accident of Chernobyl in 1986 (Reiman & Rollenhagen, 2014). The railway industry is
considered to be a safety-critical domain (Stanton & Salmon, 2011); therefore it is
important for the company to ensure safety in all of its services and stakeholders
including passengers, employees and the system itself.
To achieve a situation which is considered safe, there is a need to nurture safety
among employees as well as having the commitment from management of the company
as part of the organisational culture (Glendon & Stanton, 2000). Furthermore, the
requirement of safety is legally required. In Malaysia, the Act 463 Railway Act 1991
("Railways Act 1991," Latest amendment 2010) outlined the obligatory requirement of
safety which requires the TOC to ensure the safety of their services and premises during
construction, installation and operation phases. This act is regulated by the Land Public
Transport Commission (Suruhanjaya Pengangkutan Awam Darat –
SPAD)("Suruhanjaya Pengangkutan Awam Darat Act 2010," 2010). To inculcate the
safety culture among the employees, the company provides them with the Track Safety
Handbook for quick reference. The implementation of related legislations and safety
awareness efforts among employees show the importance of embedding the safety
culture as part of the organisational culture to be embraced by the employees.

129
The company should not jeopardize everyone by neglecting safety aspects. As
shown in past incidents where a lapse in safety have resulted in catastrophic impact to
the industry. For example, the Ladbroke accident (Brambilla & Manca, 2010; Stanton &
Walker, 2011) where lives have been lost, have also ruined the reputation of the
company, the nation and the confidence of customers.
In addition to the Track Safety Handbook, the TOC in this study has also set up
a special department, namely the Department of Occupational Safety, Health and
Environment (OSHEN), to cater for every aspects of safety within the company. The
officers in the department would be responsible to monitor and investigate the level of
safety awareness in the organisation. Furthermore, the department will manage
procedures, legislation and campaign on safety in the effort to inculcate safety culture
among employees. Thus since the drivers are directly influenced by these efforts by the
TOC, it was thus found that that safety culture was a strong influential factors of the
train driver performance.
6.6 Benchmarking of the model with other related studies
There are a number of models and frameworks in existence, designed to fulfil
the various contexts of particular research. This newly developed model can be
compared with past models from the literatures. Table 6.1 shows an overview of the
comparison between the proposed model of this study with other existing models and
literature on train drivers from around the world.
The comparison is made based on several details. The first column of table
shows the authors and the year the article is published, to indicate the timeline of the
study. The table also shows brief descriptions of the model or framework, the
measurement methods and its sampling factor. The most important comparison is the

130
key indicators selected for each particular model or framework. The comparison can be
made on the choice of factors for the domains of human, activity or context.
In most models, the ‘human’ domain was the main focus and interest, indicating
the preferential importance of ‘human’ in performance study of employees. However,
‘human’ is a domain containing a large number of factors, inclusive of cognitive, job
satisfaction, and gender. Fletcher and Dawson (2001) has developed a work-related
fatigue model of 193 train drivers in the UK, focusing on fatigue by evaluating
sleepiness and alertness using sleep / work diaries and fatigue model due to hours of
work. The emphasis was on physiological factor, i.e. sleepiness and fatigue with
relation to hours of work. Performance of the train driver was measured through
alertness level and objective performance test (OSPAT). However, this model did not
consider the environmental factor (context domain).
Two other models related to railway have focused on the cognitive performance
of the train driver; and its relationship with work environment and job-task. In 2005,
Hamilton & Clarke (2005), through their Cognitive Task Analysis (CTA) model,
investigated cognitive ability of the train drivers in the UK and their reaction with
signals and signs along the track to check on signal pass at danger (SPAD) scenario.
Similarly, McLeod et al. (2005) have also studied cognitive aspect of train drivers in the
UK, focusing on Automatic Warning System (AWS) which was also related to SPAD
scenario. These two research work had focused on the cognitive response of the train
driver while driving to reduce SPAD incidents.
Six articles from Australia had focused particularly on fatigue of the train
drivers. Lamond et al. (2005) studied alertness of fifteen train drivers of Adelaide –
Melbourne relay trip by assessing their sleepiness through activity monitoring and sleep
diary. Dorrian et al. (2006) have used simulation studies to evaluate the alertness of the
train drivers and their fatigue levels. The study was further extended in 2007 to relate

131
fatigue and alertness with incorrect response of cognitive disengagement towards safety
of the train driving. Jap et al. (2011) also conducted a simulation study of fifty male
train drivers to investigate fatigue using EEG (electroencephalography) activity
monitoring. Darwent et al. (2008) have studied on the sleepiness and performance of the
long relay train drivers between Adelaide and Perth, focusing on the relationship
between sleep and performance of the train drivers. In addition, the work environment
and their working condition were also considered. Although three basic influential
domains were addressed, it had only considered certain criteria, i.e. sleepiness (human),
driving, work environment and working condition. Fatigue during extended rail
operations was also investigated by Jay et al. (2008), which utilised a 5-min response
task (RT) and 7-point Samn-Perelli Fatigue Checklist on nine male drivers. From the six
articles on the evaluation of Australian train drivers, five studies have centred solely on
fatigue of the train drivers, using either simulation study or actual driving, focusing on
long-haul train operations. Another study was examined sleepiness of the train drivers
and its relationship with their driving activities, work environment and working
condition. The limitations of these past studies were the sole focus on only fatigue or
sleepiness, without consideration to other factors which may also influence the
performance of the train drivers. The absence of consideration for other factors can
misdirect the research direction and may result in inaccurate conclusions in
investigations involving human performance as a whole.
Only one literature did a review of forty rail safety investigations; to understand
the contribution of human factors and ergonomics (HFE) to railway accidents. This
literature was absolutely discussed on accidents and safety of the rail industry in
Australia.

132
Table 6.1: Benchmarking of the integrated model with previous literatures
Authors Brief descriptions Measurement method Target group,
sample
Domain
Human Activity Context
Fletcher and
Dawson
(2001)
Field-based validations
of a work-related
fatigue model
Sleep/work diaries,
wore actigraphs
Fatigue model
Subjective alertness
test (VAS)
Objective
performance test
(OSPAT)
193 train
drivers
UK
Sleepiness
Fatigue
Alertness
Hours of
work
Hamilton &
Clarke
(2005)
CTA Model
Train driver
performance in
interaction with
infrastructure features
Development of a
human factors SPAD
hazard checklist
Line speed on driver
interaction with
signals and signs
250 train
drivers
UK
Cognitive Driving Infrastructure
McLeod et
al. (2005)
Situational
Model
Train driver
performance in
interaction with
Automatic Warning
System (AWS) AWS provides audible
alert for SPAD
Structured interviews
with train drivers
20 scenarios
of AWS
usage
Train drivers
UK
Cognitive
Driving

133
Authors Brief descriptions Measurement method Target group,
sample
Domain
Human Activity Context
Lamond et
al. (2005) Train drivers’ sleep
and alertness during
short relay operations
Activity monitor
Sleep diary
Actiware-sleep
software
15 drivers
Adelaide –
Melbourne
relay trip
Australia
Alertness
Sleepiness
Driving
Dorrian et al.
(2006) Effects of fatigue on
train handling during
speed restrictions
Simulation driving
10-min PVT
100 mm VAS
20 male train
drivers from
Queensland
depots
Australia
Fatigue
Alertness
Simulated
driving
Dorrian et al.
(2007) Effects of fatigue
increasing inefficiency
and accident risk
Simulation driving
10-min PVT
100 mm VAS
20 male train
drivers from
Queensland
depots
Australia
Fatigue
Alertness
Simulated
driving
Incorrect
responses
Cognitive
disengagement
Safety
Darwent et
al. (2008) sleep and performance
of train drivers during
an extended freight-
haul operation
Mini-Mitter
Actigraph-L activity
monitoring devices –
to assess sleep/wake
states
Sleep diary
10 male train
drivers
Long relay
Adelaide –
Perth
Australia
Sleep
Performance
Extended
freight-haul
driving
Work
environment
Working
condition
Jay et al.
(2008) Driver fatigue
during extended
rail operations
5-min response task
(RT) – using PVT
7-point Samn–Perelli
Fatigue Checklist
9 male drivers
Australia
Fatigue

134
Authors Brief descriptions Measurement method Target group,
sample
Domain
Human Activity Context
Baysari et al.
(2009) Review of 40 rail
safety investigation to
understand
contribution of HFE to
railway accidents
Report review
Adoptation of
HFACS (Human
Factors Analysis and
Classification
System)
Rail safety
Australia
Accidents and
safety
Jap et al.
(2011) Comparison of EEG
activity among train
drivers during
monotonous driving
Simulation driving
EEG activity
monitoring
50 male train
drivers
Australia
Fatigue
Mental fatigue
Azlis Sani
Jalil (2015) Integrated train driver
performance model
27-items
questionnaire
229
respondents
Train drivers
Malaysia
Occupational
stress
Job related
tension
Fatigue
Work
(driving)
task
Work
environment
Working
conditions
Safety culture

135
Subjective measurements are often used in investigation involving performance
of workers. The technique is widely used in ergonomics study to understand certain
issues in human factors, although whether the approach is acceptable as scientific
measurement has been a topic of debate (Annett, 2002). Nevertheless, there are several
objective measurements methods that have been used in ergonomics study (Fagarasanu
& Kumar, 2002), although their applications have been very limited especially on the
number of respondents to be measured. An example of the use of objective
measurements is the application of Electroencephalogram (EEG) signals to investigate
mental fatigue (Jap et al., 2011; Kar et al., 2010). However, in this study; subjective
measurements were mainly used, utilising the paper-pencil questionnaire survey to
gather information from 229 train drivers.
In contrast to previously developed models, the proposed model in this study
presents an integrative model as discussed in previous chapter. The three main domains
of human, activity and context were identified from past literatures and have been
evaluated thoroughly. Occupational stress, job related tension and fatigue were the
results of improper task-design and poor work environment and working conditions.
These factors were investigated simultaneously to study its relationship with the
performance of the train driver. In addition, this model includes consideration of the
safety culture, whereas other models tend to study safety aspects separately. Thus, this
model integrates the various important aspects and factors in a complete package for the
evaluation of human performance. The model is characterising to be dynamic, in which
factors can be customised within the three main domains to create an improved human
performance study in HFE.
In conclusion, the previous referred models mostly from the UK and Australia
addressed similar arising issues of their train drivers. Fatigue, driving activity and
sleepiness were among factors mostly investigated. Yet, the characteristics of the

136
performance were similar between Malaysia, UK and Australia. However, this
integrated model provides better and more complete model evaluating human
performance.
6.6.1 Advantages of this model
Major advantages of this model include:
a) Management of the TOC would be able to use this model when designing job
task of the train driver. To reduce stress, tension and fatigue, the job task should
be well planned and supported with good work environment and working
conditions. If these criteria are fulfilled, then the issues on safety can be well
addressed and inculcated in the working culture.
b) Investigators may use this model to investigate problems on performance and
human behavior while driving. Potential factors affecting performance could
then be investigated.
c) To provide an improved work environment, the management could use the
model to study the influential factors of work environment or organizational
environment of the workplace.
d) To achieve increased performance, safety of the workplace plays an important
role. Safety should also be a culture in TOC, in which high performance is
obtained within a safe working environment, ensuring job satisfaction and
happiness among the train driver.

137
6.7 Significant contributions of the study
This study has investigated the relationship between the three key factors
(domains); namely human, activity and context on the performance of the train driver.
In general, the finding from this study adds into the pool of knowledge in the literature,
especially in term of the integrative model of the performance of the train drivers.
Furthermore, the findings of this study can assist the management of the TOC in their
decision making and planning processes in term of improving the performance of the
train drivers.
6.7.1 Significant theoretical contributions of the train driver performance
Theoretically, the performance of employee is important to ensure the overall
system run smoothly with very minimum risks. This study introduced an integrative
framework for understanding key influential factors of the employees’ performance, in
this case was the train drivers. The newly developed framework highlights the
interactions between human factors, human activities and its context. Through
macroergonomics approach, this study has looked at the influential factors holistically,
without ignoring other potential domains or factors.
By investigating the influence of human factors; namely occupational stress,
job-related tension and sleepiness to the performance of train driver, this study helps to
understand how job-design contributed to the stress and tension among the train drivers,
which also had influenced the level of fatigue. Key indicators for understanding job
performance rely on the psychological and physiological factors of the employees, the
job routine and contextual factors such work environment and working conditions. An
improved work environment and working condition generate less stress and tension, as
well as lowering the level of fatigue of the employee. In addition, safety is of upmost

138
priority, especially for public related services. An environment of safety and general
feeling of being safe would enhance the performance of employees.
The seven shortlisted factors are interrelated to one another and further
investigations could be made on investigating several influential factors simultaneously.
6.7.2 Significant managerial contributions of the train driver performance
From a managerial perspective, this study highlights the importance for the
management of TOC to develop and address the relationship between the factors
contributing to the employees’ performance. This integrative model would benefit the
management of TOC in assisting to identify the factor(s) which should be observed and
improved based on their actual and existing performance evaluation exercise. As
discovered in this study, since the factors can be interrelated, the management should
not only rely on the individual factors when evaluating employees’ performance.
Instead, they should look into the bigger picture during their planning for better
performance and improvements. Design of job, shift scheduling, rest time, rest area and
facilities, relationship among peers and supervisors are some example of the details
which should be considered by the management while planning the job task and
evaluating performance of the employee.
Furthermore, it was confirmed by the results of this study that safety culture has
a positive influence on the train driver performance. Thus, safety culture should be
further enhanced among employees for the benefit of all. If the contributing factors
identified in this study are well addressed, then it is expected that the performance of
both the employees and the system would improve, giving benefits and increased safety
confidence to the company.

139
6.8 Objectives’ achievements of the study
Objectives of this study had been set up at beginning and its drove this study towards
achieving it. First objective was to identify significant factors of human performance in
train driving. This was achieved through extensive literature related to the train driver
performance, mostly in UK and Australia as the basis of the study. From this literature
study, a framework was established as a guide for the model development. This
achieved the second objective. Once the framework established, it was used to conduct
a survey among train drivers to collect their perceptions towards their own performance.
The data collected were then analysed to determine the relationship among significant
factors of their performance. This achieved the third objective. Finally, the model was
developed to integrate those significant factors and to illustrate the performance of the
train drivers.

140
CHAPTER 7 : CONCLUSION AND RECOMMENDATIONS
7.1 Conclusion
This study makes a notable contribution to the knowledge on human
performance by proposing a model that was empirically tested to investigate the
influential factors of train driver performance. A significant relationship was found
between the train driver performance and several factors in the human domain, which
were the occupational stress, job related tension and fatigue. Furthermore, it has also
identified the driving task as one of the influential factors of train driver performance.
The work environment, working condition and safety culture in the ‘context’ domain
were also having significant relationship with the performance of the train driver. This
study was conducted on the train drivers of the major train operating company (TOC) in
Malaysia, focusing only on drivers of intercity passenger trains and freight trains.
In this study, several significant contributions were successfully achieved.
Firstly, the significant factors affecting the performance of the train driver were
identified through an extensive review of the literatures from studies conducted around
the world. The lack of available human performance measures which integrates
performance influential factors was identified and a theoretical framework specific for
train drivers was proposed. This framework formed the foundation of this study in order
to understand the influential factors affecting the performance of train drivers. Three
main domains were then proposed to establish the empirical basis of the model, namely
the human, activity and context to represent the key indicators of the train drivers
performance. Based on this theoretical framework, a quantitative paper-and-pencil
survey was conducted among 229 respondents. The data collected was analysed using
SPSS software and the relationships among significant factors of train driver's
performance were determined. Subsequent development of an integrated framework

141
was tested using structural equation modelling (SEM)-PLS approach using SmartPLS
software to determine the relationship among the influential factors. Finally, an
integrated model of the Malaysian train driver performance was developed and
completed. Although evaluation of employee performance has been developed in
several past models, the model developed in this study addresses some of the limitations
of past models. The newly proposed model integrates the factors affecting the
performance of the train driver under the three main domains of human, activity and
context. The model indicates that the management should not only focus on the
individual employee, but should also be aware of other surrounding factors which may
affect their overall performance.
Finally, this study has strengthened the understanding and importance of human
performance within the context of public transportation industry, especially for the
drivers.
7.2 Recommendations for Future Research
The integrative model developed in this study can be used as a foundation for
future studies. Several potential areas for future research could be ventured based on
this model. Future work could extend the study to develop a comprehensive integrated
human performance model that includes other related influential factors listed by
previous literatures such as alertness, health condition, individual’s driving and decision
making skills, commitment of the employee and extensive safety climate.
In addition, different geographical areas or context may influence the
significance of the factors evaluated. Thus future work could consider reinvestigating
factors that were found insignificant in this study such as sleepiness, job satisfaction,
safety issues and job demand. Although these factors did not support the hypothesis in
this particular study, variations in geographical and context may change the influence of

142
these factors. Different technique of investigation, rather than survey could be
performed especially on objective measurement. This will ensure empirical data could
be collected and to verify the model developed.
Cross-cultural study could be undertaken for future work to test the integrative
model to other groups of employee from different geographical areas. Comparison
could then be made between these groups of populations. In addition, the model could
also be used to test other types of commercial drivers, such as drivers of buses, trucks or
light urban trains. There might be differences on their routine of work, job setting, work
environment and even the organizational culture which would differ from the results of
this study, from which a significant comparison could be made.
In general, the integrative model developed is a very useful tool for analysing
the factors affecting the performance of the employee. Therefore it is important for
future research to widen the study to cover other transportation companies for their
immediate benefit and advantages; and for the overall improvement of the service to the
nation.

143
REFERENCES
Akerstedt, T. (1995). Work hours and sleepiness. Neurophysiologie Clinique/Clinical
Neurophysiology, 25(6), 367-375.
Anderson, James C., & Gerbing, David W. (1991). Predicting the Performance of
Measures in a Confirmatory Factor Analysis With a Pretest Assessment of Their
Substantive Validities. Journal of Applied Psychology, Vol. 76(No. 5), 732 -
740.
Annett, John. (2002). Subjective rating scales: science or art? Ergonomics, 45, 966-987.
Austin, A., & Drummond, P. D. (1986). Work problems associated with suburban train
driving. Applied Ergonomics, 17(2), 111-116.
Bailey, Robert W. (1996). Human performance engineering : designing high quality,
professional user interfaces for computer products, applications, and systems
(3rd ed.). New Jersey: Prentice Hall.
Baines, T. S., Asch, R., Hadfield, L., Mason, J. P., Fletcher, S., & Kay, J. M. (2005).
Towards a theoretical framework for human performance modelling within
manufacturing systems design. Simulation Modelling Practice and Theory,
13(6), 486-504.
Baraldi, Amanda N., & Enders, Craig K. (2010). An introduction to modern missing
data analyses. Journal of School Psychology, 48(1), 5-37.
Bartlett, J. E., II, Kotrlik, J. W., & Higgins, C. (2001). Organizational Research:
Determining Appropriate Sample Size in Survey Research. Information
Technology, Learning, and Performance Journal, 19(1).
Baysari, Melissa T., McIntosh, Andrew S., & Wilson, John R. (2008). Understanding
the human factors contribution to railway accidents and incidents in Australia.
Accident Analysis & Prevention, 40(5), 1750-1757.
Baysari, Melissa T., Caponecchia, Carlo, McIntosh, Andrew S., & Wilson, John R.
(2009). Classification of errors contributing to rail incidents and accidents: A
comparison of two human error identification techniques. Safety Science, 47(7),
948-957.
Bennett, Derrick A. (2001). How can I deal with missing data in my study? Australian
and New Zealand Journal of Public Health, 25(5), 464-469.
Berlin, Cecilia, Örtengren, Roland, Lämkull, Dan, & Hanson, Lars. (2009). Corporate-
internal vs. national standard - A comparison study of two ergonomics
evaluation procedures used in automotive manufacturing. International Journal
of Industrial Ergonomics, 39(6), 940-946.
Birlik, Gülin. (2009). Occupational Exposure to Whole Body Vibration - Train Drivers.
International Scientific Journal of Occupational Health and Safety, 47, 5-10.
Boff, Kenneth R. (2006). Revolutions and shifting paradigms in human factors &
ergonomics. Applied Ergonomics, 37(4), 391-399.
Bordens, Kenneth S., & Abbot, Bruce B. (2008). Reseacrh Design and Methods (7th
ed.). New York: McGraw Hill.
Bourne, L.E., & Yaroush, R.A. . (2003). Stress and cognition: A cognitive
psychological perspective. Unpublished manuscript, NASA grant NAG2-1561.
Boyd, Nancy G., Lewin, Jeffrey E., & Sager, Jeffrey K. (2009). A model of stress and
coping and their influence on individual and organizational outcomes. Journal of
Vocational Behavior, 75(2), 197-211.
Brambilla, Sara, & Manca, Davide. (2010). The Viareggio LPG railway accident: Event
reconstruction and modeling. Journal of Hazardous Materials, 182(1-3), 346-
357.

144
Branton, Paul. (1987). In praise of ergonomics - a personal perspective International
Reviews of Ergonomics, 1, 1-20
Brauchli, Rebecca, Schaufeli, Wilmar B., Jenny, Gregor J., Füllemann, Désirée, &
Bauer, Georg F. (2013). Disentangling stability and change in job resources, job
demands, and employee well-being — A three-wave study on the Job-Demands
Resources model. Journal of Vocational Behavior, 83(2), 117-129.
Burns, Richard A., Butterworth, Peter, Kiely, Kim M., Bielak, Allison A. M., Luszcz,
Mary A., Mitchell, Paul, . . . Anstey, Kaarin J. (2011). Multiple imputation was
an efficient method for harmonizing the Mini-Mental State Examination with
missing item-level data. Journal of Clinical Epidemiology, 64(7), 787-793.
Byrne, Barbara M. (2010). Structural equation modeling with AMOS: Basic concepts,
applications, and programming. Multivariate applications series. (2nd ed.).
New York, NY, US: Routledge/Taylor & Francis Group.
Carayon, Pascale, & Smith, Michael J. (2000). Work organization and ergonomics.
Applied Ergonomics, 31(6), 649-662.
Chang, Y. H., & Yeh, C. H. (2010). Human performance interfaces in air traffic control.
Applied Ergonomics, 41(1), 123-129.
Chau, Nearkasen, Gauchard, Gerome, Dehaene, Dominique, Benamghar, Lahoucine,
Touron, Christian, Perrin, Philippe, & Mur, Jean-Marie. (2007). Contributions of
occupational hazards and human factors in occupational injuries and their
associations with job, age and type of injuries in railway workers. International
Archives of Occupational and Environmental Health, 80(6), 517-525.
Chin, Wynne W. (2010). How to Write Up and Report PLS Analyses: Handbook of
Partial Least Squares. In Esposito Vinzi, Vincenzo, Chin, Wynne W., Henseler,
Jörg, & Wang, Huiwen (Eds.), (pp. 655-690): Springer Berlin Heidelberg.
Clarke, Sharon (1998). Safety culture on the UK railway network. WORK & STRESS,
12(3), 285-292.
Clarke, Theresa. (2005). The Ergonomics Programme at Network Rail. In Wilson, John
R., Norris, Beverly, Clarke, Theresa, & Mills, Ann (Eds.), Rail Human Factors:
Supporting the Integrated Railway (pp. 19 - 21): Ashgate.
Collins, Debbie. (2003). Pretesting survey instruments: An overview of cognitive
methods. Quality of Life Research, 12(3), 229-238.
Coluci, Marina Z. O., Alexandre, Neusa M. C., & Rosecrance, John. (2009). Reliability
and validity of an ergonomics-related Job Factors Questionnaire. International
Journal of Industrial Ergonomics, 39(6), 995-1001.
Cothereau, C., de Beaurepaire, C., Payan, C., Cambou, J. P., Rouillon, F., & Conso, F.
(2004). Professional and medical outcomes for French train drivers after "person
under train" accidents: three year follow up study. Occupational and
Environmental Medicine, 61:, 488-494.
Curry, David, & McKinney, John M. (2006). Utilizing the Human, Machine, and
Environment Matrix in investigations. Journal of Hazardous Materials, 130(1–
2), 122-127.
Dahlgren, Anna (2006). Work stress and overtime work – effects on cortisol, sleep,
sleepiness and health. Stockholm University. Retrieved from [23]
Darwent, David, Lamond, Nicole, & Dawson, Drew. (2008). The sleep and performance
of train drivers during an extended freight-haul operation. Applied Ergonomics,
39(5), 614-622.
Dawal, S. Z., Taha, Z., & Ismail, Z. (2009). Effect of job organization on job
satisfaction among shop floor employees in automotive industries in Malaysia.
International Journal of Industrial Ergonomics, 39(1), 1-6.

145
Dawal, S.Z. (2005). A Study of Ergonomics Factors Affecting Job Satisfaction in Work
Design for Automotive Industries in Malaysia. (Ph.D. Ph.D thesis), University of
Malaya, Kuala Lumpur, Malaysia.
Dawson, Drew, Ian Noy, Y., Härmä, Mikko, Åkerstedt, Torbjorn, & Belenky, Gregory.
(2011). Modelling fatigue and the use of fatigue models in work settings.
Accident Analysis & Prevention, 43(2), 549-564.
DeArmond, Sarah, & Chen, Peter Y. (2009). Occupational safety: The role of
workplace sleepiness. Accident Analysis & Prevention, 41(5), 976-984.
Definition of 'condition', first published 1891. (2013). Oxford University Press.
Definition of 'environment', OED 3rd Edition, June 2011. (2013). Oxford University
Press.
Definition of 'work', first published 1928. (2013). Oxford University Press.
Dempsey, Patrick G., McGorry, Raymond W., & Maynard, Wayne S. (2005). A survey
of tools and methods used by certified professional ergonomists. Applied
Ergonomics, 36(4), 489-503.
Desmond, Paula A., & Matthews, Gerald. (2009). Individual differences in stress and
fatigue in two field studies of driving. Transportation Research Part F: Traffic
Psychology and Behaviour, 12(4), 265-276.
Dorrian, Jillian, Baulk, Stuart D., & Dawson, Drew. (2011). Work hours, workload,
sleep and fatigue in Australian Rail Industry employees. Applied Ergonomics,
42(2), 202-209.
Dorrian, Jillian, Roach, Gregory D., Fletcher, Adam, & Dawson, Drew. (2006). The
effects of fatigue on train handling during speed restrictions. Transportation
Research Part F: Traffic Psychology and Behaviour, 9(4), 243-257.
Dorrian, Jillian, Roach, Gregory D., Fletcher, Adam, & Dawson, Drew. (2007).
Simulated train driving: Fatigue, self-awareness and cognitive disengagement.
Applied Ergonomics, 38(2), 155-166.
Dul, Jan, & Neumann, W. Patrick. (2009). Ergonomics contributions to company
strategies. Applied Ergonomics, 40(4), 745-752.
Dul, Jan, Bruder, Ralph, Buckle, Peter, Carayon, Pascale, Falzon, Pierre, Marras,
William S., . . . van der Doelen, Bas. (2012). A strategy for human
factors/ergonomics: developing the discipline and profession. Ergonomics,
55(4), 377-395.
Edkins, Graham D., & Pollock, Clare M. (1997). The influence of sustained attention on
Railway accidents. Accident Analysis & Prevention, 29(4), 533-539.
Evans, Andrew W. (2011). Fatal train accidents on Europe's railways: 1980-2009.
Accident Analysis & Prevention, 43(1), 391-401.
Fagarasanu, Mircea, & Kumar, Shrawan. (2002). Measurement instruments and data
collection: a consideration of constructs and biases in ergonomics research.
International Journal of Industrial Ergonomics, 30(6), 355-369.
Farrington-Darby, Trudi, Pickup, Laura, & Wilson, John R. (2005). Safety culture in
railway maintenance. Safety Science, 43(1), 39-60.
Farrington-Darby, Trudi, Wilson, John R., & Norris, Beverly J. (2005). Investigating
Train Driver Behaviour: The Use of Lineside Information When Regulating
Speed. In Wilson, John R., Norris, Beverly, Clarke, Theresa, & Mills, Ann
(Eds.), Rail Human Factors: Supporting the Integrated Railway (pp. 60 - 69):
Ashgate.
Felici, M., Sujan, M. A., & Wimmer, M. (2000). Integration of functional, cognitive and
quality requirements. A railways case study. Information and Software
Technology, 42(14), 993-1000.

146
Fernet, Claude, Guay, Frédéric, & Senécal, Caroline. (2004). Adjusting to job demands:
The role of work self-determination and job control in predicting burnout.
Journal of Vocational Behavior, 65(1), 39-56.
Field, Andy. (2005). Discovering Statistics Using SPSS. London: Sage Publications.
Fletcher, Adam, & Dawson, Drew. (2001). Field-based validations of a work-related
fatigue model based on hours of work. Transportation Research Part F: Traffic
Psychology and Behaviour, 4(1), 75-88.
Garbarino, Sergio , Carli, Fabrizio De, Nobili, Lino, Mascialino, Barbara, Squarcia,
Sandro, Penco, Maria Antonietta, . . . Ferrillo, Franco. (2002). Sleepiness and
Sleep Disorders in Shift Workers: A Study on a Group of Italian Police Officers.
Sleep, 25(6).
Genaidy, A., Salem, S., Karwowski, W., Paez, O., & Tuncel, S. (2007). The work
compatibility improvement framework: An integrated perspective of the human-
at-work system. Ergonomics, 50(1), 3-25.
Glendon, A. I., & Stanton, N. A. (2000). Perspectives on safety culture. Safety Science,
34(1–3), 193-214.
Glendon, A. I., & Litherland, D. K. (2001). Safety climate factors, group differences
and safety behaviour in road construction. Safety Science, 39(3), 157-188.
Gore, Brian F., & Jarvis, Peter. (2005, October). Modeling the complexities of human
performance. In Systems, Man and Cybernetics, 2005 IEEE International
Conference on (Vol. 2, pp. 1604-1609). IEEE.
Gore, Brian F., & Smith, Jeffrey D. (2006). Risk assessment and human performance
modelling: the need for an integrated systems approach. International Journal of
Human Factors Modelling and Simulation, 1(1), 119-139.
Gould, Kristian S., Røed, Bjarte K., Saus, Evelyn-Rose, Koefoed, Vilhelm F., Bridger,
Robert S., & Moen, Bente E. (2009). Effects of navigation method on workload
and performance in simulated high-speed ship navigation. Applied Ergonomics,
40(1), 103-114.
Gradisar, Michael, Lack, Leon, Richards, Hayley , Harris, Jodie, Gallasch, Julie,
Boundy, Michelle, & Johnston, Anna. (2007). The Flinders Fatigue Scale:
Preliminary Psychometric Properties and Clinical Sensitivity of a New Scale for
Measuring Daytime Fatigue associated with Insomnia. Journal of clinical sleep
medicine: official publication of the American Academy of Sleep Medicine, 3(7),
722-728.
Haenlein, Michael, & Kaplan, Andreas M. . (2004). A Beginnerʼs Guide to Partial Least
Squares Analysis. Understanding Statistics, 3(4), 283-297.
Hair, Joseph F., Ringle, Christian M., & Sarstedt, Marko. (2012). Partial Least Squares:
The Better Approach to Structural Equation Modeling? Long Range Planning,
45(5–6), 312-319.
Hair, Joseph F., Black, William C. , Babin, Barry J., & Anderson, Rolph E. . (2010).
Multivariate Data Analysis (7th ed.): Prentice Hall.
Hair, Joseph F., Sarstedt, Marko, Ringle, Christian, & Mena, Jeannette. (2012a). An
assessment of the use of partial least squares structural equation modeling in
marketing research. Journal of the Academy of Marketing Science, 1-20.
Hair, Joseph F., Sarstedt, Marko, Ringle, Christian M., & Mena, Jeannette A. (2012b).
An Assessment of the Use of Partial Least Squares Structural Equation
Modeling in Marketing Research. Journal of the Academy of Marketing Science,
forthcoming.
Hair, Joseph F., Hult, G. Tomas M., Ringle, Christian, & Sarstedt, Marko. (2014). A
Primer on Partial Least Squares Structural Equation Modeling (PLS-SEM).
USA: SAGE Publications, Inc.

147
Hamilton, W. Ian, & Clarke, Theresa. (2005). Driver performance modelling and its
practical application to railway safety. Applied Ergonomics, 36(6), 661-670.
Haque, M. M., Chin, H. C., & Debnath, A. K. (2013). Sustainable, safe, smart—three
key elements of Singapore’s evolving transport policies. Transport Policy,
27(0), 20-31.
Härmä, M., Sallinen, M., Ranta, R., Mutanen, P., & Müller, K. (2002). The effect of an
irregular shift system on sleepiness at work in train drivers and railway traffic
controllers. Journal of Sleep Research, 11(2), 141-151.
Hockey, B., & Carrigan, N. (2003). Human Factors in Railway Systems : Implications
for Safety.
Horrey, William J., Noy, Y. Ian, Folkard, Simon, Popkin, Stephen M., Howarth, Heidi
D., & Courtney, Theodore K. (2011). Research needs and opportunities for
reducing the adverse safety consequences of fatigue. Accident Analysis &
Prevention, 43(2), 591-594.
Imada, Andrew S., & Carayon, Pascale. (2008). Editors’ comments on this special issue
devoted to macroergonomics. Applied Ergonomics, 39(4), 415-417.
Janssen, Peter P. M., Peeters, Maria C. W., Jonge, Jan de, Houkes, Inge, & Tummers,
Gladys E. R. (2004). Specific relationships between job demands, job resources
and psychological outcomes and the mediating role of negative work–home
interference. Journal of Vocational Behavior, 65(3), 411-429.
Jansson, Anders , Olsson, Eva , & Kecklund, Lena (2005). Acting or reacting? A
cognitive work analysis approach to the train driver task. In Wilson, John R.,
Norris, Beverly, Clarke, Theresa, & Mills, Ann (Eds.), Rail Human Factors:
Supporting the Integrated Railway (pp. 40 - 49): Ashgate.
Jap, Budi Thomas, Lal, Sara, & Fischer, Peter. (2010). Inter-hemispheric
electroencephalography coherence analysis: Assessing brain activity during
monotonous driving. International Journal of Psychophysiology, 76(3), 169-
173.
Jap, Budi Thomas, Lal, Sara, & Fischer, Peter. (2011). Comparing combinations of
EEG activity in train drivers during monotonous driving. Expert Systems with
Applications, 38(1), 996-1003.
Jay, Sarah M., Dawson, Drew, Ferguson, Sally A., & Lamond, Nicole. (2008). Driver
fatigue during extended rail operations. Applied Ergonomics, 39(5), 623-629.
Johns, Murray W. . (1991). A New Method for Measuring Daytime Sleepiness: The
Epworth Sleepiness Scale. Sleep, 14(6), 540-545.
Johns, Murray W. . (1992). Reliability and Factor Analysis of the Epworth Sleepiness
Scale. Sleep, 15(4), 376-381.
Johns, Murray W. . (1993). Daytime Sleepiness, Snoring and Obstructive Sleep Apnea:
The Epworth Sleepiness Scale. Chest, 103, 30-36.
Johns, Murray W. , & Hoaking, Bruce (1997). Excessive Daytime Sleepiness: Daytime
Sleepiness and Sleep Habits of Australian Workers. Sleep, 20(10), 844-849.
Jones, Christopher B., Dorrian, Jillian, Rajaratnam, Shantha M. W., & Dawson, Drew.
(2005). Working hours regulations and fatigue in transportation: A comparative
analysis. Safety Science, 43(4), 225-252.
Joshi, V. V., Kaufman, L. M., & Giras, T. C. (2001). Human behavior modeling in train
control systems. In Reliability and Maintainability Symposium, 2001.
Proceedings. Annual (pp. 183-188). IEEE.
Jou, Rong-Chang, Kuo, Chung-Wei, & Tang, Mei-Ling. (2013). A study of job stress
and turnover tendency among air traffic controllers: The mediating effects of job
satisfaction. Transportation Research Part E: Logistics and Transportation
Review(0).

148
Juslén, Henri, & Tenner, Ariadne. (2005). Mechanisms involved in enhancing human
performance by changing the lighting in the industrial workplace. International
Journal of Industrial Ergonomics, 35(9), 843-855.
Kahya, Emin. (2007). The effects of job characteristics and working conditions on job
performance. International Journal of Industrial Ergonomics, 37(6), 515-523.
Kahya, Emin (2009). The effects of job performance on effectiveness. International
Journal of Industrial Ergonomics, 39, 96-104.
Kar, Sibsambhu, Bhagat, Mayank, & Routray, Aurobinda. (2010). EEG signal analysis
for the assessment and quantification of driver's fatigue. Transportation
Research Part F: Traffic Psychology and Behaviour, 13(5), 297-306.
Karsh, Ben-Tzion, Waterson, Patrick, & Holden, Richard J. (2014). Crossing levels in
systems ergonomics: A framework to support ‘mesoergonomic’ inquiry. Applied
Ergonomics, 45(1), 45-54.
Kecklund, Göran , Åkerstedt, Torbjörn , Ingre, Michael , & Söderström, Marie (1999).
Train drivers’ working conditions and their impact on safety, stress and
sleepiness: a literature review, analyses of accidents and schedules. National
Institute for Psychosocial Factors and Health. Stress Research Report, 288.
Kecklund, L., Ingre, M., Kecklund, G., Soderstrom, M., Akerstedt, T., Lindberg, E., . . .
Almqvist, P. (2001). The TRAIN - project: Railway safety and the train driver
information environment and work situation - A summary of the main results. In
Signalling Safety, London.
Kee, SzeSeen, Tamrin, Shamsul Bahri Mohd, & Goh, YongMeng. (2010). Driving
Fatigue and Performance among Occupational Drivers in Simulated Prolonged
Driving. Global Journal of Health Science, 2(1), 167.
Kim, Dong San, Baek, Dong Hyun, & Yoon, Wan Chul. (2010). Development and
evaluation of a computer-aided system for analyzing human error in railway
operations. Reliability Engineering & System Safety, 95(2), 87-98.
Kirwan, Barry. (1990). Human reliability assessment In Wilson, John R. & Corlett, E
Nigel (Eds.), Evaluation fo Human Work (2nd edition ed., pp. 921 - 968): Taylor
& Francis.
Klein, M. C. A., van Lambalgen, R. M., & Treur, J. (2010, Aug. 31 2010-Sept. 3 2010).
An Agent Model for Analysis of Human Performance Quality. In Web
Intelligence and Intelligent Agent Technology (WI-IAT), 2010 IEEE/WIC/ACM
International Conference on.
Kompier, M.A.J. . (1996). Working paper CONDI/T/WP.2/1996 - Bus drivers:
Occupational stress and stress prevention.
Koohi, Iraj. (2009). Accidents Analysis of Rail Transportation Industry in Iran. World
Applied Sciences Journal, 7(3), 358-365.
Ku, Chia-Hua, & Smith, Michael J. (2010). Organisational factors and scheduling in
locomotive engineers and conductors: Effects on fatigue, health and social well-
being. Applied Ergonomics, 41(1), 62-71.
Kumar, Amit, & P.K., Sinha. (2008). Human Error Control in Railways. Jordan Journal
of Mechanical and Industrial Engineering, 2(4), 183 - 190.
Lamond, Nicole, Darwent, David, & Dawson, Drew. (2005). Train drivers' sleep and
alertness during short relay operations. Applied Ergonomics, 36(3), 313-318.
Land Public Transport Commission, Malaysia. (2012). Laporan Tahunan 2012 -
Penambahbaikan Pengangkutan Awam.
Layer, J. K., Karwowski, W., & Furr, A. (2009). The effect of cognitive demands and
perceived quality of work life on human performance in manufacturing
environments. International Journal of Industrial Ergonomics, 39(2), 413-421.

149
Lee, Yi-Fang, Altschuld, James W., & White, Jeffry L. (2007). Problems in needs
assessment data: Discrepancy analysis. Evaluation and Program Planning,
30(3), 258-266.
Little, Roderick J. A. (1988). A Test of Missing Completely at Random for Multivariate
Data with Missing Values. Journal of the American Statistical Association,
83(404), 1198-1202.
Lu, Chin-Shan, & Shang, Kuo-chung. (2005). An empirical investigation of safety
climate in container terminal operators. Journal of Safety Research, 36(3), 297-
308.
Luke, T, Brook-Carter,N, Parkes, AM, Grimes, E and Mills, A (2006). An investigation
of train driver visual strategies. Cogn Tech Work(8), 15–29.
Marras, W. S., & Hancock, P. A. (2014). Putting mind and body back together: A
human-systems approach to the integration of the physical and cognitive
dimensions of task design and operations. Applied Ergonomics, 45(1), 55-60.
Mason, Steve , Baines, Tim , Kay, John M. , & Ladbrook, John (2005). Improving the
Design Process for Factories: Modeling Human Performance Variation. Journal
of Manufacturing Systems, 24(1), 47 - 54.
Mauno, Saija, Kinnunen, Ulla, & Ruokolainen, Mervi. (2007). Job demands and
resources as antecedents of work engagement: A longitudinal study. Journal of
Vocational Behavior, 70(1), 149-171.
McLeod, Ronald W., Walker, Guy H., & Moray, Neville. (2005). Analysing and
modelling train driver performance. Applied Ergonomics, 36(6), 671-680.
Mills, Ann. (2005). The RSSB Human Factors Programme. In Wilson, John R., Norris,
Beverly, Clarke, Theresa, & Mills, Ann (Eds.), Rail Human Factors: Supporting
the Integrated Railway (pp. 13 - 18): Ashgate.
Murali, M.C. . (2005). The Human Element in Train Safety on Indian Railways. In
International Railway Safety Conference 2005, Cape Town Cape Town.
Mussa, Abdella, & Marwala, T. (2005, 13-16 April 2005). The use of genetic algorithms
and neural networks to approximate missing data in database. In
Computational Cybernetics, 2005. ICCC 2005. IEEE 3rd International
Conference on.
Nakagawa, Shinichi, & Freckleton, Robert P. (2008). Missing inaction: the dangers of
ignoring missing data. Trends in Ecology & Evolution, 23(11), 592-596.
Niu, Shengli. (2010). Ergonomics and occupational safety and health: An ILO
perspective. Applied Ergonomics, 41(6), 744-753.
Ou, Carol X.J., Davison, Robert M. , Zhong, Xuepan , & Liang, Yi (2010). Empowering
employees through instant messaging. Information Technology & People, 23(2),
193-211.
Parsons, K. C. (2000). Environmental ergonomics: a review of principles, methods and
models. Applied Ergonomics, 31(6), 581-594.
Peng, Chao-Ying Joanne, Harwell, Michael, Liou, Show-Mann, & Ehman, Lee H.
(2006). Advances in Missing Data Methods and Implications for Educational
Research. In Sawilowsky, Shlomo S. (Ed.), Real Data Analysis (pp. 31-78).
Greenwich: Information Age.
Pew, Richard W., & Baron, Sheldon. (1983). Perspectives on human performance
modelling. Automatica, 19(6), 663-676.
Philip, Pierre, & Åkerstedt, Torbjorn. (2006). Transport and industrial safety, how are
they affected by sleepiness and sleep restriction? Sleep Medicine Reviews, 10(5),
347-356.
Pickup, Laura, Wilson, John R., Norris, Beverley J., Mitchell, Lucy, & Morrisroe, Ged.
(2005). The Integrated Workload Scale (IWS): A new self-report tool to assess
railway signaller workload. Applied Ergonomics, 36(6), 681-693.

150
Podsakoff, P. M., MacKenzie, S. B., Lee, J. Y., & Podsakoff, N. P. (2003). Common
method biases in behavioral research: A critical review of the literature and
recommended remedies. Journal of Applied Psychology, 88(5), 879-903.
Railways Act 1991, Act 463, Laws of Malaysia (Latest amendment 2010).
Ramayah, T., Lee, Jason, & In, Julie. (2011). Network collaboration and performance in
the tourism sector. Service Business, 5(4), 411-428.
Rattray, Janice, & Jones, Martyn C. (2007). Essential elements of questionnaire design
and development. Journal of Clinical Nursing, 16(2), 234-243.
Reiman, Teemu, & Rollenhagen, Carl. (2014). Does the concept of safety culture help
or hinder systems thinking in safety? Accident Analysis & Prevention, 68(0), 5-
15.
Reise, S. P., Waller, N. G., & Comrey, A. L. (2000). Factor analysis and scale revision.
Psychol Assess, 12(3), 287-297.
Ross, Jacqueline. (2008). Fatigue: Do You Understand the Risks to Safety? Journal of
PeriAnesthesia Nursing, 23(1), 57-59.
Rubin, D. B. (1976). Inference and missing data. Biometrika, 63(3), 581-592.
Russell, Daniel W. (2002). In Search of Underlying Dimensions: The Use (and Abuse)
of Factor Analysis in Personality and Social Psychology Bulletin. Personality
and Social Psychology Bulletin, 28(12), 1629-1646.
Ryan, Brendan, Wilson, John R., Sharples, Sarah, & Clarke, Theresa. (2009). Attitudes
and opinions of railway signallers and related staff, using the Rail Ergonomics
Questionnaire (REQUEST). Applied Ergonomics, 40(2), 230-238.
Ryan, Brendan, Wilson, John R., Sharples, Sarah, Morrisroe, Ged, & Clarke, Theresa.
(2009). Developing a Rail Ergonomics Questionnaire (REQUEST). Applied
Ergonomics, 40(2), 216-229.
Ryan, Thomas G. (1988, 5-9 June 1988). Human performance measurement: issues and
challenges. In Human Factors and Power Plants, 1988., Conference Record for
1988 IEEE Fourth Conference on.
Schafer, J. L. (1999). Multiple imputation: a primer. Statistical Methods in Medical
Research, 8(1), 3-15.
Schaufeli, Wilmar B. , & Bakker, Arnold B. . (2004). Job demands, job resources, and
their relationship with burnout and engagement: a multi-sample study. Journal
of Organizational Behavior(25), 293-315.
Schlomer, Gabriel L., Bauman, Sheri, & Card, Noel A. (2010). Best Practices for
Missing Data Management in Counseling Psychology. Journal of Counseling
Psychology, 57(1), 1-10.
Setiawan, N. A., Venkatachalam, P. A., & Hani, A. F. M. (2008, 27-30 May 2008).
Missing Attribute Value Prediction Based on Artificial Neural Network and
Rough Set Theory. In BioMedical Engineering and Informatics, 2008. BMEI
2008. International Conference on.
Shahid, Azmeh, Shen, Jianhua, & Shapiro, Colin M. (2010). Measurements of
sleepiness and fatigue. Journal of Psychosomatic Research, 69(1), 81-89.
Shahrokhi, M., & Bernard, A. (2009). A framework to develop an analysis agent for
evaluating human performance in manufacturing systems. CIRP Journal of
Manufacturing Science and Technology, 2(1), 55-60.
Shepherd, Andrew, & Marshall, Edward. (2005). Timeliness and task specification in
designing for human factors in railway operations. Applied Ergonomics, 36(6),
719-727.
Silla, Anne, & Kallberg, Veli-Pekka. (2012). The development of railway safety in
Finland. Accident Analysis & Prevention, 45(0), 737-744.
Stanimirova, I., Daszykowski, M., & Walczak, B. (2007). Dealing with missing values
and outliers in principal component analysis. Talanta, 72(1), 172-178.

151
Stanton, Neville A., & Salmon, Paul M. (2011). Planes, trains and automobiles:
Contemporary ergonomics research in transportation safety. Applied
Ergonomics, 42(4), 529-532.
Stanton, Neville A., & Walker, Guy H. (2011). Exploring the psychological factors
involved in the Ladbroke Grove rail accident. Accident Analysis & Prevention,
43(3), 1117-1127.
Stojadinović, Zoran , Marinković, Dejan , & Ivković, Branislav (2014). Human resource
performance measurement framework for construction projects and companies.
Technical Gazette, 21(1), 69-78.
Stone, B., McGuffog, A., Spencer, M., Turner, C., & Mills, A. . (2005). Fatigue and
shiftwork in UK train drivers. In International Conference on Fatigue
Management in Transportation Operations, Seattle.
Strahan, Clint, Watson, Barry, & Lennon, Alexia (2008). Can organisational safety
climate and occupational stress predict work-related driver fatigue?
Transportation Research Part F: Traffic Psychology and Behaviour, 11(6), 418-
426.
Suruhanjaya Pengangkutan Awam Darat Act 2010, (2010).
Sutherland, C., & Groombridge, L. (2001). The Paddington rail crash: identification of
the deceased following mass disaster. Science & Justice, 41(3), 179-184.
Taris, Toon W., & Schreurs, Paul J. G. (2009). Well-being and organizational
performance: An organizational-level test of the happy-productive worker
hypothesis. WORK & STRESS, 23(2), 120-136.
Timm, Neil H. (2002). Applied Multivariate Analysis: Springer New York.
Tinsley, Howard E., & Tinsley, Diane J. (1987). Uses of factor analysis in counseling
psychology research. Journal of Counseling Psychology, 34(4), 414-424.
Trivellas, Panagiotis, Reklitis, Panagiotis, & Platis, Charalambos. (2013). The Effect of
Job Related Stress on Employees’ Satisfaction: A Survey in Health Care.
Procedia - Social and Behavioral Sciences, 73(0), 718-726.
Tsutsumi, Akizumi, & Kawakami, Norito. (2004). A review of empirical studies on the
model of effort-reward imbalance at work: reducing occupational stress by
implementing a new theory. Social Science & Medicine, 59(11), 2335-2359.
Turner, Nick, Stride, Chris B., Carter, Angela J., McCaughey, Deirdre, & Carroll,
Anthony E. (2012). Job Demands–Control–Support model and employee safety
performance. Accident Analysis & Prevention, 45(0), 811-817.
Ugajin, Hiroshi. (1999). Human Factors Approach to Railway Safety. Quarterly Report
of RTRI, 40(1), 5-8.
Weyman, Andrew, O'Hara, Rachel, & Jackson, Alan. (2005). Investigation into issues
of passenger egress in Ladbroke Grove rail disaster. Applied Ergonomics, 36(6),
739-748.
Wickens, Christopher D. , Lee, John D. , Liu, Yili , & Becker, Sallie E. Gordon (2004).
An Introduction To Human Factors Engineering (2nd Edition ed.): Pearson -
Prentice Hall.
Wilkinson, L., & Task Force Stat, Inference. (1999). Statistical methods in psychology
journals - Guidelines and explanations. American Psychologist, 54(8), 594-604.
Williamson, Ann, Lombardi, David A., Folkard, Simon, Stutts, Jane, Courtney,
Theodore K., & Connor, Jennie L. (2011). The link between fatigue and safety.
Accident Analysis & Prevention, 43(2), 498-515.
Wilson, John R. . (1990). A framework and a context for ergonomics methodology. In
Wilson, John R. & Corlett, E Nigel (Eds.), Evaluation fo Human Work (2nd
edition ed., pp. 1-39): Taylor & Francis.

152
Wilson, John R. . (1995). Chapter 1 : A Framework and a Context for Ergonomics
Methodology. In John R, Wilson & Corlett, E Nigel (Eds.), Evaluation of
Human Work (2nd. ed.): Taylor and Francis.
Wilson, John R. . (2000). Fundamentals of ergonomics in theory and practice. Applied
Ergonomics, 31(6), 557-567.
Wilson, John R. . (2006). Interaction with virtual environments. International Journal
of Human-Computer Studies, 64(3), 157-157.
Wilson, John R. . (2014). Fundamentals of systems ergonomics/human factors. Applied
Ergonomics, 45(1), 5-13.
Wilson, John R. , & Norris, Beverley J. (2005a). Special issue on rail human factors.
Applied Ergonomics, 36(6), 647-648.
Wilson, John R. , & Norris, Beverley J. (2005b). Rail human factors: Past, present and
future. Applied Ergonomics, 36(6), 649-660.
Wilson, John R. , & Nigel, Corlett E. (Eds.). (1995). Evaluation of Human Work (2nd
ed.): Taylor & Francis.
Yahaya, Azizi , Yahaya, Noordin, Arshad, Kamariah, Ismail, Jasmi, Jaalam, Saini, &
Zakariya, Zurihanmi (2009 ). Occupational Stress and its Effects towards the
Organization Management. Journal of Social Sciences, 5(4), 390-397.
Yan, Wan, & Turban, Daniel B. (2009). Work, happiness, and unhappiness. The
Journal of Positive Psychology, 4(2), 193-195.

153
LIST OF PUBLICATIONS AND PAPER PRESENTED
1 Azlis Sani Jalil, et al. (2009). General fatigue investigation on Malaysian train
drivers. International Conference for Technical Postgraduates (Techpos 2009).
Kuala Lumpur.
2 Azlis Sani Jalil and Siti Zawiah Md Dawal (2010). Future Human Performance
Model for Malaysian Train Driver. IAENG International Conference on Industrial
Engineering (ICINDE'10), Hong Kong.
3 Azlis Sani Jalil and Siti Zawiah Md Dawal (2011). Human Performance in
Transportation: A Comparative Study of Human Performance Models. The 2011
International Conference on Traffic and Transportation Engineering (ICTTE
2011), Dubai, UAE.
4 Azlis Sani Jalil, et al. (2011). Understanding Human Performance Aspects in
Transportation Safety. 2011 2nd International Conference on Mechanical and
Manufacturing Engineering (ICME 2011), Putrajaya, Malaysia.
5 Azlis Sani Jalil, et al. (2011). "Sleepiness among train drivers: A case study in
Malaysia." Malaysian Journal of Ergonomics (MJEr) Special Issue Special Issue:
21-29.
6 Jalil Azlis-Sani, S. Z. M. D., Norhayati Mohmad Zakwan and Mohd Faizal
Mohideen Batcha (2013). Measuring Human Performance of Malaysian Train
Drivers : A Factor Analysis. 17th International Conference on Industrial
Engineering Theory, Applications and Practice, Pusan National University, Busan,
Korea.
7 Jalil Azlis-Sani, S. Z. M. D., Norhayati Mohmad Zakwan and Mohd Faizal
Mohideen Batcha (2013). Measuring Human Performance of Malaysian Train
Drivers : Developing Model Using PLS Approach. 17th International Conference
on Industrial Engineering Theory, Applications and Practice, Pusan National
University, Busan, Korea.
8 Jalil Azlis-Sani, S. Z. M. D. a. N. M. Z. (2013). Validity and Reliability Testing
on Train Driver Performance Model Using A PLS Approach. The 2nd
International Conference on Ergonomics (ICE 2013), Kuala Lumpur, Malaysia.
154

155

156

157

158

159

160

161

162

163
APPENDICES

164
Appendix 1: Employee Performance Standard Form – for Non-executive

165

166
Appendix 2: Questionnaire (Bahasa Malaysia)
Soal selidik Soal selidik ke atas prestasi manusia untuk pemandu keretapi Malaysia
Tuan / puan yang saya hormati, Saya Mohd Azlis Sani Md Jalil (nombor staf 00775) seorang kakitangan akademik Universiti Tun Hussein Onn Malaysia sedang melakukan satu kajian bertajuk “Development of Malaysian Train Driver Performance Model”. Soal selidik ini bertujuan untuk mengumpul maklumat berkaitan prestasi manusia di kalangan pemandu keretapi di Malaysia. Objektif utama kajian ini adalah untuk menentukan faktor-faktor yang mempengaruhi prestasi seorang pemandu. Kajian ini adalah kerjasama di antara UM dan Jabatan Keselamatan Pekerjaan, Kesihatan dan Persekitaran (OSHEN), KTMB. Data ini akan menyediakan kebaikan kepada penyelidik dan pihak-pihak berkepentingan di dalam usaha mempertingkatkan prestasi sedia ada. Maklumat yang diperolehi hanya akan digunakan secara sulit, untuk tujuan kajian ini sahaja. Sila baca dengan teliti dan ambil masa tuan/puan untuk menjawab borang soal selidik ini. Borang ini mengandungi 3 bahagian utama dengan beberapa sub-bahagian di dalamnya. Di mana yang sesuai, bulatkan jawapan atau lengkapkan jawapan di tempat kosong yang disediakan. Terima kasih untuk masa dan penglibatan tuan/puan. Researcher/penyelidik : Supervisor/penyelia : Mohd Azlis Sani Md Jalil Assoc. Prof. Dr. Siti Zawiah Md Dawal Dept. of Engineering Design & Manufacturing, Dept. of Engineering Design & Manufacturing, Faculty of Engineering, Faculty of Engineering, University of Malaya, University of Malaya, 50603 Kuala Lumpur. 50603 Kuala Lumpur. Tel: 019 – 211 2692 Tel: 03-7967 5251 Fax: 03-79675330 Email : [email protected] Email: [email protected]
VERSI BAHASA
MALAYSIA

167
1.0 MAKLUMAT UMUM Sila tandakan (√) untuk jawapan anda di ruangan yang disediakan.
1. Jantina
Lelaki Perempuan
2. Umur
Bawah 25 35 – 44 Over 56
25 – 34 45 – 56
3. Tempoh bekerja di industri keretapi
Kurang dari 1 tahun 6 – 10 tahun 20 tahun atau lebih
1 – 5 tahun 11 – 19 tahun
4. Jawatan anda sekarang
Locomotive inspector Pemandu lokomotif Pengajar
Lain – lain (sila nyatakan) ______________________
5. Tempoh memegang jawatan sekarang
Kurang dari 1 tahun 6 – 10 tahun 20 tahun atau lebih
1 – 5 tahun 11 – 19 tahun
6. Depoh bertugas
Kuala Lumpur Ipoh Tumpat
Prai (Butterworth) Gemas Kuala Lipis
Singapura
2.0 BEBANAN TUGAS
Sila bulatkan nombor yang memberikan jawapan terbaik anda.
A. Kod Adakah anda berpuas hati dengan aspek – aspek berikut di dalam tugasan anda?
Sangat
setuju Setuju Neutral Tidak
setuju Sangat tidak
setuju
1 JS1 Keadaan kerja secara fizikal 1 2 3 4 5
2 JS2 Tugasan anda secara keseluruhan 1 2 3 4 5
3 JS3 Penghargaan yang diperolehi untuk tugasan yang cemerlang 1 2 3 4 5
4 JS4 Tahap tanggungjawab yang diamanahkan kepada anda 1 2 3 4 5
5 JS5 Peluang untuk menggunakan kebolehan anda 1 2 3 4 5
B. Bulatkan nombor yang menunjukkan tahap anda berpuashati dengan kerja anda.
Sangat lebih
daripada yang
dihajati
Lebih daripada
yang dihajati
Munasabah
Kurang daripada
yang dihajati
Sangat kurang
daripada yang
dihajati
1 JS6 Secara umum, saya rasa hari bekerja saya dalam sebulan adalah: 1 2 3 4 5
2 JS7 Secara umum, saya rasa jumlah masa bekerja saya dalam sebulan adalah: 1 2 3 4 5
3 JS8 Secara umum, saya rasa hari bekerja saya secara berturutan adalah: 1 2 3 4 5

168
C. Sila nilaikan aspek – aspek berikut di dalam tugasan anda
Sangat setuju
Setuju Neutral Tidak setuju
Sangat tidak
setuju
1 JCH1
Saya sentiasa melakukan aktiviti asas yang sama 1 2 3 4 5
2 JCH2
Saya perlu meneliti beberapa perkara serentak 1 2 3 4 5
3 JCH3
Saya berurusan dengan masalah yang sukar diselesaikan 1 2 3 4 5
4 JCH4
Saya jarang terganggu dan sering mempunyai masa terluang semasa bekerja 1 2 3 4 5
5 JCH5
Saya rasa kerja saya sangat mencabar 1 2 3 4 5
6 JCH6
Kesilapan di pihak saya akan menggugat keselamatan 1 2 3 4 5
D. Sila nyatakan hingga tahap mana anda bersetuju atau tidak dengan kenyataan – kenyataan berikut.
Sangat setuju
Setuju Neutral Tidak setuju
Sangat tidak
setuju
1 JCH7
Saya memerlukan lebih tumpuan berfikir berbanding daripada apa yang saya suka 1 2 3 4 5
2 DT1 Keretapi beroperasi tidak mengikut jadual perjalanannya. 1 2 3 4 5
3 DT2 Saya menjadi sangat mengantuk apabila memandu 1 2 3 4 5
4 DT3 Saya merasa jemu dan bosan terhadap kerja yang sama (rutin). 1 2 3 4 5
5 DT4 Saya sering memandu ketika waktu puncak 1 2 3 4 5
6 DT5 Saya dibekalkan pindaan jadual waktu pada hari perjalanan 1 2 3 4 5
E. Sila nyatakan hingga tahap mana anda bersetuju atau tidak dengan kenyataan – kenyataan berikut.
Sangat setuju
Setuju Neutral Tidak setuju
Sangat tidak
setuju
1 JRT1
Saya merasakan hanya mempunyai sedikit kuasa (wibawa) untuk melaksanakan tanggungjawab yang diamanahkan kepada saya
1 2 3 4 5
2 JRT2
Saya tidak jelas dengan skop (ruang lingkup) dan tanggungjawab kerja saya 1 2 3 4 5
3 JRT3
Saya tidak mengetahui peluang untuk peningkatan atau kenaikan pangkat yang wujud buat saya 1 2 3 4 5
4 JRT4
Saya merasakan mempunyai beban tugas yang terlalu berat 1 2 3 4 5
5 JRT5
Saya terfikir tidak berupaya memuaskan hati dengan tuntutan yang bercanggah di kalangan individu sekeliling saya
1 2 3 4 5
6 JRT6
Saya merasa tidak layak untuk melaksanakan tugasan tersebut 1 2 3 4 5
7 JRT7
Saya tidak mengetahui apakah pandangan penyelia terhadap saya, dan bagaimana beliau menilai prestasi saya
1 2 3 4 5
8 JRT8
Pada hakikatnya, saya tidak mendapat maklumat yang 1 2 3 4 5

169
diperlukan untuk menjalankan tugas saya
9 JRT9
Saya perlu mebuat keputusan kepada perkara – perkara yang mempengaruhi kehidupan orang yang dikenali 1 2 3 4 5
10 JRT10
Saya merasakan mungkin tidak disukai dan diterima oleh orang – orang yang bekerja di sekeliling saya 1 2 3 4 5
11 JRT11
Saya merasa tidak berupaya untuk mempengaruhi keputusan dan tindakan penyelia yang akan menjejaskan pekerjaan saya
1 2 3 4 5
12 JRT12
Saya tidak mengetahui apakah harapan rakan sekerja terhadap saya 1 2 3 4 5
13 JRT13
Saya terfikir adakah jumlah kerja yang saya lakukan mungkin akan mempengaruhi bagaimana ia akan diselesaikan
1 2 3 4 5
14 JRT14
Perasaan saya apabila saya terpaksa melakukan kerja yang berlawanan dengan prinsip saya 1 2 3 4 5
15 JRT15
Perasaan saya apabila kerja yang saya lakukan mengganggu kehidupan keluarga saya 1 2 3 4 5
F. Sila nyatakan tahap tekanan yang dialami daripada pelbagai sebab.
Kami menyedari tekanan yang dialami adalah berbeza mengikut masa, tetapi sila jawab dengan penilaian paling baik tentang tugas saya secara umum
Tiada tekanan langsung
_____________________
Terlalu tertekan
1 STR1
Mempunyai kerja yang terlalu banyak untuk dilaksanakan 0 1 2 3 4 5
2 STR2
Tertekan dengan masa dan tempoh akhir 0 1 2 3 4 5
3 STR3
Kesukaran menukar shif kerja saya 0 1 2 3 4 5
4 STR4
Tidak mempunyai kerja yang mencukupi 0 1 2 3 4 5
5 STR5
Sentiasa selari dengan teknologi terkini 0 1 2 3 4 5
6 STR6
Terancam akan kehilangan kerja 0 1 2 3 4 5
7 STR7
Bosan dan tugasan berulang – ulang 0 1 2 3 4 5
8 STR8
Apabila membuat keputusan penting 0 1 2 3 4 5
9 STR9
Terasa terasing 0 1 2 3 4 5
10 STR10
Mempunyai kekurangan kuasa dan pengaruh 0 1 2 3 4 5
11 STR11
Kekurangan sokongan dan galakan daripada penyelia 0 1 2 3 4 5
12 STR12
Kekurangan kakitangan 0 1 2 3 4 5
13 STR13
Latihan yang tidak mencukupi 0 1 2 3 4 5
14 STR14
Pengurusan shif yang lemah 0 1 2 3 4 5
15 STR15
Sedikit peluang untuk pengembangan peribadi dan kerjaya 0 1 2 3 4 5
16 STR16
Tuntutan kerja ke atas kehidupan peribadi saya 0 1 2 3 4 5
17 STR Terlalu banyak tugas pentadbiran atau 0 1 2 3 4 5

170
17 kertas kerja
18 STR18
Terpaksa berhadapan dengan kejadian diluar kawalan saya 0 1 2 3 4 5
19 STR19
Keyakinan diri yang rendah terhadap syarikat 0 1 2 3 4 5
20 STR20
Kekurangan komunikasi dan tempat rujukan 0 1 2 3 4 5
3.0 KELESUAN A. Tandakan (√) untuk jawapan anda atau dengan mengisi tempat kosong
1 FH0
1 Secara purata berapa jam anda bekerja dalam seminggu (termasuk kerja lebih masa)?
< 20 jam 20 – 40 jam 40 – 60 jam > 60 jam
2 FH0
2 Secara umum, purata berapa jam untuk menamatkan satu perjalanan (trip)?
2 – 3 jam 3 – 6 jam 6 – 8 jam > 8 jam
3 FH0
7 Dalam masa setahun, secara purata berapa hari sebulan anda telah bekerja?
< 10 hari 10 – 20 hari 20 – 30 hari
4 FH0
3 Apakah pola kelaziman shif anda?
FSH02
Awal pagi hingga malam (pusingan ke hadapan) Hari tetap
Malam hingga awal pagi (pusingan ke belakang) 12 jam sehari /12 jam semalam
Lain – lain (sila nyatakan) ___________________
5 FH04 Dalam masa 12 bulan lepas, apakah shif yang anda bekerja secara berturut-turut tanpa hari rehat?
FSH05
Awal pagi hingga malam (pusingan ke hadapan) Hari tetap
Malam hingga awal pagi (pusingan ke belakang) 12 jam sehari /12 jam semalam
Lain – lain (sila nyatakan) ___________________
6 FSH06 Dalam setahun lepas, berapa kerap anda mendapat rehat kurang 12 jam di antara shif?
Tidak pernah Jarang – jarang Kadang kala Selalu
7 FSH07
Adakah anda fikir anda boleh mendapat tidur yang cukup selepas waktu bekerja siang atau waktu bekerja malam?
Ya Tidak
8 FSH08
Adakah anda fikir anda boleh mendapat peluang yang cukup untuk berehat semasa bekerja?
Ya Tidak
9
FSH 09
Apakah tahap kelesuan yang dialami akibat kerja yang dilakukan?
Tiada langsung Sedikit sahaja Jumlah yang munasabah
Banyak juga Sangat banyak

171
10 FSH 10 Bilakah anda mengalami tahap kelesuan tertinggi semasa shif siang dan malam?
Siang hari Permulaan shif Semasa shif Penghujung shif
Sepanjang masa shif Tidak berkaitan
Malam Permulaan shif Semasa shif Penghujung shif
Sepanjang masa shif Tidak berkaitan
11 FSH 11
Pada pandangan anda, apakah penyebab kelesuan yang anda alami?
_______________________________________________________________________________________
12 FSH 12 Dalam 4 minggu ini, adakah anda mengenalpasti sebarang tanda (symptom) masalah fizikal (cth. rasa sakit,
tidak selesa atau keletihan melampau) di mana-mana bahagian badan, sama ada semasa atau selepas shif kerja anda?
Ya Tidak
13 FSH 13
Jika Ya, sila berikan sedikit makluman berkenaan masalah tersebut, dan pada pandangan anda, apakah punca masalah tersebut.
_______________________________________________________________________________________
4.0 PERSEKITARAN KERJA A. Sila nyatakan setakat mana anda bersetuju dengan pernyataan – pernyataan di bawah.
Sangat setuju
Setuju Neutral Tidak setuju
Sangat tidak
setuju
1 WC
1 Kemudahan komunikasi yang ada tidak lengkap untuk kegunaan semasa kecemasan 1 2 3 4 5
2 WC2
Piawaian (standard) penyenggaraan ruang pemanduan (cabs) yang lemah 1 2 3 4 5
3 WC3
Gangguan kepada ruang pemanduan yang kosong (ditinggalkan) oleh individu yang tiada kebenaran masuk 1 2 3 4 5
4 WC4
Kemudahan tandas yang tidak memuaskan 1 2 3 4 5
5 WC5
Kemudahan makanan yang tidak memuaskan 1 2 3 4 5
6 WC6
Anda ambil peduli bahawa keretapi mungkin akan mengalami kerosakan semasa anda memandunya 1 2 3 4 5
7 WC7
Terpaksa memperuntukkan sebilangan masa untuk berulang alik ke tempat kerja 1 2 3 4 5
B. Bagaimanakah perasaan anda terhadap tempat kerja anda?
Sangat setuju
Setuju Neutral Tidak setuju
Sangat tidak
setuju
1 WE1
Ruang kaki dibawah meja adalah memadai 1 2 3 4 5
2 WE2
Secara keseluruhan, kerusi adalah selesa 1 2 3 4 5
3 WE3
Semua peralatan yang saya kerap guna di stesen kerja adalah di dalam had jangkauan saya 1 2 3 4 5

172
4 WE4
Semua kertas maklumat yang saya perlukan mudah ditemui 1 2 3 4 5
5 WE5
Secara umumnya, susun atur stesen kerja saya adalah baik 1 2 3 4 5
6 WE6
Terdapat ruang yang mencukupi untuk bergerak di ruangan operasi 1 2 3 4 5
7 WE7
Kawasan kerja ini adalah bebas daripada risiko renjatan (cth. Kabel) 1 2 3 4 5
8 WE8
Umumnya, saya berasa selesa dengan suhu tempat kerja saya 1 2 3 4 5
9 WE9
Saya berpeluh dengan banyaknya semasa menjalankan kerja 1 2 3 4 5
10 WE10
Persekitaran kerja saya sangat senyap dan selesa 1 2 3 4 5
11 WE11
Saya dapat lihat kerja saya dengan jelas 1 2 3 4 5
12 WE12
Di sini sangat panas dan saya tidak selesa di sini 1 2 3 4 5
13 WE13
Saya rasa selesa dan kurang berpeluh 1 2 3 4 5
14 WE14
Di sini sangat bising dan sukar untuk berkomunikasi di sini 1 2 3 4 5
15 WE15
Cahaya lampu sangat malap dan sukar untuk melihat dan menjalankan kerja saya 1 2 3 4 5
5.0 KESELAMATAN A. Bagaimana anda mengambil berat berkaitan aspek – aspek keselamatan di tempat kerja?
Sangat ambil berat
Ambil berat
Neutral Tidak ambil berat
Sangat tidak ambil berat
1 SI01
Anda ambil berat berkenaan vandalisme– cth: ada individu merosakkan keretapi, meletakkan halangan di atas landasan
1 2 3 4 5
2 SI02
Anda ambil berat tentang kemungkinan akan mencederakan atau mengakibatkan kehilangan nyawa seseorang
1 2 3 4 5
3 SI04
Anda memandu di landasan semasa pekerja penyelenggaraan sedang bekerja 1 2 3 4 5
4 SI05
Anda ambil berat berkenaan kemungkinan terjatuh akibat halangan semasa bergerak keluar daripada ruang pemanduan pada waktu malam
1 2 3 4 5
5 SI06
Anda ambil berat kemungkinan diserang 1 2 3 4 5
6 SI07
Anda ambil berat tentang kemungkinan tergelincir semasa memanjat masuk dan keluar apabila keretapi tidak berada di platform
1 2 3 4 5

173
B. Sila nyatakan setakat mana anda bersetuju dengan pernyataan – pernyataan di bawah.
Sangat setuju
Setuju Neutral Tidak setuju
Sangat tidak
setuju
1 SC01
Keselamatan adalah keutamaan di dalam syarikat ini 1 2 3 4 5
2 SC02
Di tempat kerja saya, pihak pengurusan mengabaikan isu-isu keselamatan 1 2 3 4 5
3 SC03
Penyelia meminta bantuan saya untuk menyelesaikan masalah di tempat kerja 1 2 3 4 5
4 SC04
Pengurusan bertindakbalas dengan cepat terhadap sebarang isu keselamatan 1 2 3 4 5
5 SC05
Penyelia selalu memaklumkan kepada saya berkenaan isu – isu berkaitan keselamatan 1 2 3 4 5
6 SC06
Saya digalakkan untuk memberi idea berkenaan keselamatan 1 2 3 4 5
7 SC07
Jika saya melaporkan sesuatu isu keselamatan, saya terasa seperti dipersalahkan kerana masalah tersebut 1 2 3 4 5
8 SC08
Saya boleh mendekati penyelia saya untuk berbincang tentang masalah kerja 1 2 3 4 5
9 SC09
Sering tidak cukup pekerja untuk melakukan tugas dengan cara yang selamat 1 2 3 4 5
10 SC10
Maklumbalas daripada sesuatu kejadian kemalangan adalah baik 1 2 3 4 5
11 SC11
Saya tidak boleh melakukan kerja jika saya terlalu mengikut prosedur dan peraturan 1 2 3 4 5
12 SC12
Adalah tidak mustahil untuk membiasakan diri dengan semua prosedur yang berkaitan dengan kerja saya 1 2 3 4 5
13 SC13
Latihan kerja juga meliputi aspek keselamatan yang kritikal 1 2 3 4 5
14 SC14
Kadang kala, tindakan orang lain membantutkan saya daripada melakukan kerja secara cekap 1 2 3 4 5
15 SC15
Tindakan saya akan mempengaruhi keselamatan orang lain yang menjalankan tugas mereka 1 2 3 4 5

174
6.0 SKALA KELESUAN FLINDERS Kami berminat dengan pengalaman anda merasai kelesuan (letih, jemu, kepenatan) dalam masa 2 minggu lepas. Kami tidak bermaksud rasa mengantuk (terasa seperti ingin tertidur). Sila bulatkan maklumbalas yang sesuai berdasarkan perasaan anda secara purata di dalam tempoh 2 minggu ini.
Tidak sama sekali
Berpatutan Amat
1 FF01 Adakah kelesuan merupakan masalah bagi anda?
1 2 3 4 5
2 FF02 Adakah kelesuan menyebabkan anda bermasalah untuk menjalankan tugas harian anda (cth.: kerja, sosial, berkeluarga)?
1 2 3 4 5
3 FF03 Adakah kelesuan menyebabkan anda murung?
1 2 3 4 5
4 FF04 Berapa kerap anda mengalamai kelesuan?
0 hari/minggu
1-2 hari/minggu
3-4 hari/minggu
5-6 hari/minggu
7 hari/minggu
5 FF05 Bilakah masa-masa dalam sehari anda selalunya sering mengalami kelesuan? (Sila tandakan √ di dalam kotak (boleh lebih dari 1 kotak))
Awal pagi Pertengahan pagi
Tengah hari
Petang Lewat petang
Lewat malam
Tidak sama sekali
Berpatutan Amat
6 FF06 Bagaimana teruk kelesuan yang anda alami?
1 2 3 4 5
Tidak sama sekali
Berpatutan Amat
7 FF07 Adakah kelesuan anda disebabkan oleh tidur yang kurang nyenyak?
1 2 3 4 5

175
7.0 SKALA MENGANTUK EPWORTH Bagaimana anda terlelap di dalam situasi berikut, berbeza dengan hanya merasa letih?
Ia merujuk kepada amalan biasa di dalam kehidupan anda baru – baru ini.
Sekiranya anda tidak melakukannya baru – baru ini, cuba bayangkan bagaimana ia boleh mendatangkan kesan kepada anda.
Guna skala berikut untuk memilih nombor yang paling sesuai untuk setiap keadaan:
0 = tidak akan tertidur
1 = kemungkinan kecil akan terlelap
2 = berkemungkinan akan terlelap
3 = kemungkinan besar akan terlelap
Ia adalah penting untuk anda menjawab setiap soalan dengan jawapan yang terbaik
Situasi Peluang untuk terlelap (0 – 3)
FSL 01 Duduk dan membaca
FSL02 Menonton TV
FSL03 Duduk, tidak aktif di tempat awam (cth.: teater atau mesyuarat)
FSL04 Sebagai penumpang di dalam kereta selama sejam tanpa kereta berhenti rehat
FSL05 Berbaring untuk berehat pada waktu tengah hari apabila keadaan mengizinkan
FSL06 Duduk dan berbicara dengan seseorang
FSL07 Duduk dengan senyap selepas makan tengah hari tanpa alcohol (minuman keras)
FSL08 Di dalam kereta, apabila kereta berhenti seketika di dalam trafik
Skala ini diambil dan diguna dengan kebenaran daripada:
M.W. Johns 1990-97
Terima kasih di atas kerjasama tuan/puan.

176
Appendix 3: Questionnaire (English)
Questionnaire Survey on Human Performance of Malaysian Train Driver
Soal selidik ke atas prestasi manusia untuk pemandu keretapi Malaysia
Kepada responden, Soal selidik ini bertujuan untuk mengumpul maklumat berkaitan prestasi manusia di kalangan pemandu keretapi di Malaysia. Objektif utama kajian ini adalah untuk menentukan faktor-faktor yang mempengaruhi prestasi seorang pemandu. Kajian ini adalah kerjasama di antara UM dan Jabatan Keselamatan Pekerjaan, Kesihatan dan Persekitaran (OSHEN), KTMB. Data ini akan menyediakan kebaikan kepada penyelidik dan pihak-pihak berkepentingan di dalam usaha mempertingkatkan prestasi sedia ada. Maklumat yang diperolehi hanya akan digunakan secara sulit, untuk tujuan kajian ini sahaja. Sila baca dengan teliti dan ambil masa anda untuk menjawab borang soal selidik ini. Borang ini mengandungi 3 bahagian utama dengan beberapa sub-bahagian di dalamnya. Di mana yang sesuai, bulatkan jawapan atau lengkapkan jawapan di tempat kosong yang disediakan. Terima kasih untuk masa dan penglibatan anda. Dear respondent, This questionnaire aims to gather information about human performance among train drivers in Malaysia. The main objective of this survey is to determine influential factors affecting performance of the driver. This research is a collaboration between UM and the Department of Occupational Safety, Health and Environment (OSHEN), KTMB. The data will provide practical benefits to the researcher and stakeholders in order to improve the existing practices. The information provided will only be used with confidentially, strictly for the purposes of this study. Please read carefully and take your time during answering this survey form. This questionnaire consists of 3 main sections with several sub-sections. Where the appropriate, circle the answer or complete the answer in the space provided. Thank you for your time and participation. Researcher/penyelidik : Supervisor/penyelia : Mohd Azlis Sani Md Jalil Assoc. Prof. Dr. Siti Zawiah Md Dawal Dept. of Engineering Design & Manufacturing, Dept. of Engineering Design & Manufacturing, Faculty of Engineering, Faculty of Engineering, University of Malaya, University of Malaya, 50603 Kuala Lumpur. 50603 Kuala Lumpur. Tel: 019 – 211 2692 Tel: 03-7967 5251 Fax: 03-79675330 Email : [email protected] Email: [email protected]
ENGLISH VERSION

177
1.0 GENERAL INFORMATION Please tick (√) your answer in the space provided.
1. What gender are you?
Male Female
2. Please indicate your age group
Under 25 35 – 44 Over 56
25 – 34 45 – 56
3. How long have you been working in the railway industry?
Less than 1 year 6 – 10 years 20 years or more
1 – 5 years 11 – 19 years
4. Your current post
Locomotive inspector Locomotive driver Trainer
Others (please specify) ______________________
5. How long have you been in your current posting?
Less than 1 year 6 – 10 years 20 years or more
1 – 5 years 11 – 19 years
6. What is your reporting depot?
Kuala Lumpur Ipoh Tumpat
Prai (Butterworth) Gemas Kuala Lipis
Singapore
2.0 WORKLOAD
Please circle the number which corresponds to your best answer.
B. Circle the number which corresponds to how satisfied you feel about your job.
Much more than I desire
more than I desire
About the right
Less than I desire
Much less than I desire
1 JS6 In general, I feel my working days per month are: 1 2 3 4 5
2 JS7 In general, I feel my working hours per are: 1 2 3 4 5
3 JS8 In general, I feel my working days in the row are: 1 2 3 4 5
A. Do you satisfy with these following aspects in your job?
Very satisfied
Moderately satisfied
Neutral Moderately dissatisfied
Very dissatisfied
1 JS1 The physical working conditions 1 2 3 4 5
2 JS2 Your job as a whole 1 2 3 4 5
3 JS3 The recognition you get for good work 1 2 3 4 5
4 JS4 The amount of responsibility you are given 1 2 3 4 5
5 JS5 Your opportunity to use your abilities 1 2 3 4 5
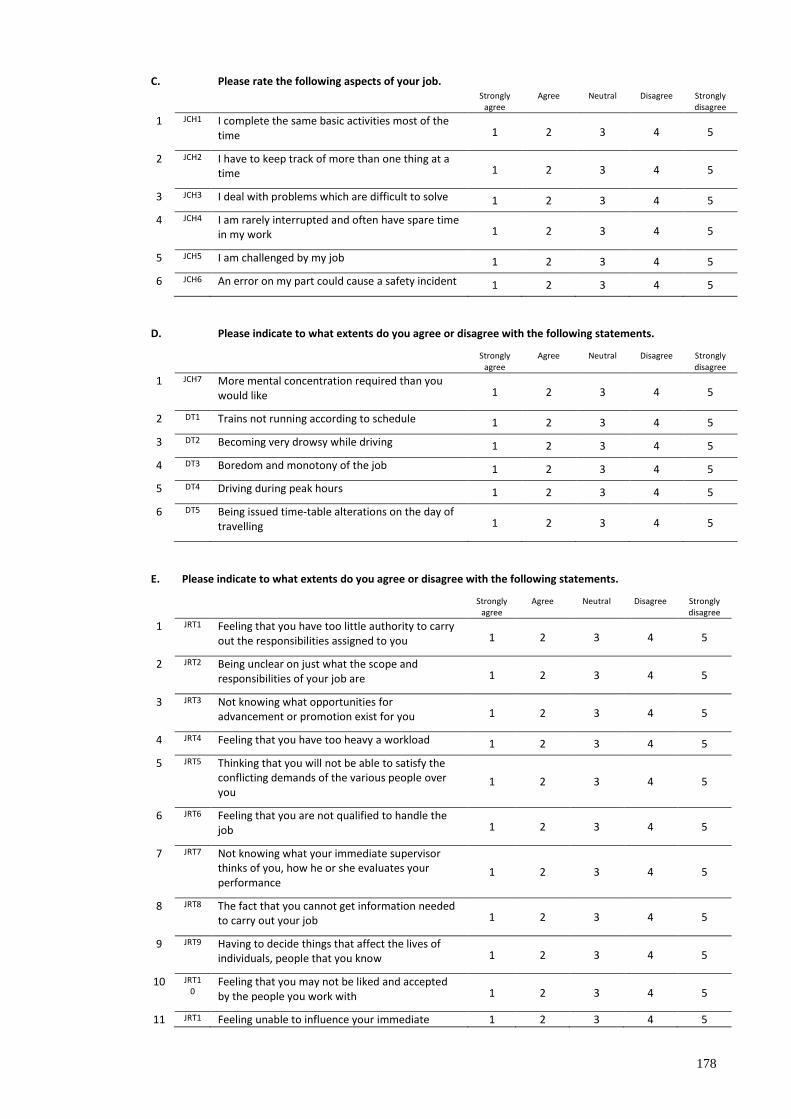
178
C. Please rate the following aspects of your job.
Strongly agree
Agree Neutral Disagree Strongly disagree
1 JCH1 I complete the same basic activities most of the time 1 2 3 4 5
2 JCH2 I have to keep track of more than one thing at a time 1 2 3 4 5
3 JCH3 I deal with problems which are difficult to solve 1 2 3 4 5
4 JCH4 I am rarely interrupted and often have spare time in my work 1 2 3 4 5
5 JCH5 I am challenged by my job 1 2 3 4 5
6 JCH6 An error on my part could cause a safety incident 1 2 3 4 5
D. Please indicate to what extents do you agree or disagree with the following statements.
Strongly agree
Agree Neutral Disagree Strongly disagree
1 JCH7 More mental concentration required than you would like 1 2 3 4 5
2 DT1 Trains not running according to schedule 1 2 3 4 5
3 DT2 Becoming very drowsy while driving 1 2 3 4 5
4 DT3 Boredom and monotony of the job 1 2 3 4 5
5 DT4 Driving during peak hours 1 2 3 4 5
6 DT5 Being issued time-table alterations on the day of travelling 1 2 3 4 5
E. Please indicate to what extents do you agree or disagree with the following statements.
Strongly agree
Agree Neutral Disagree Strongly disagree
1 JRT1 Feeling that you have too little authority to carry out the responsibilities assigned to you 1 2 3 4 5
2 JRT2 Being unclear on just what the scope and responsibilities of your job are 1 2 3 4 5
3 JRT3 Not knowing what opportunities for advancement or promotion exist for you 1 2 3 4 5
4 JRT4 Feeling that you have too heavy a workload 1 2 3 4 5
5 JRT5 Thinking that you will not be able to satisfy the conflicting demands of the various people over you
1 2 3 4 5
6 JRT6 Feeling that you are not qualified to handle the job 1 2 3 4 5
7 JRT7 Not knowing what your immediate supervisor thinks of you, how he or she evaluates your performance
1 2 3 4 5
8 JRT8 The fact that you cannot get information needed to carry out your job 1 2 3 4 5
9 JRT9 Having to decide things that affect the lives of individuals, people that you know 1 2 3 4 5
10 JRT10
Feeling that you may not be liked and accepted by the people you work with 1 2 3 4 5
11 JRT1 Feeling unable to influence your immediate 1 2 3 4 5

179
1 supervisor’s decisions and actions that affect you
12 JRT12
Not knowing just what the people you work with expect of you 1 2 3 4 5
13 JRT13
Thinking that the amount of work you have to do may interfere with how well it gets done 1 2 3 4 5
14 JRT14
Feeling that you have to do things on the job that are against your better judgment 1 2 3 4 5
15 JRT15
Feeling that your job tends to interfere with your family life 1 2 3 4 5
F. Please indicate the amount of stress you experience from various causes.
No stress at all
_____________________________ A great deal of stress
1 STR1 Having too much work to do 0 1 2 3 4 5
2 STR2 Time pressures and deadlines 0 1 2 3 4 5
3 STR3 Difficulty in changing my shifts 0 1 2 3 4 5
4 STR4 Having not enough work to do 0 1 2 3 4 5
5 STR5 Keeping up with new technology 0 1 2 3 4 5
6 STR6 Threat of job loss 0 1 2 3 4 5
7 STR7 Boring and repetitive tasks 0 1 2 3 4 5
8 STR8 Making important decisions 0 1 2 3 4 5
9 STR9 Feeling isolated 0 1 2 3 4 5
10 STR10 Having a lack of power and influence 0 1 2 3 4 5
11 STR11 Lack of support and encouragement from superiors 0 1 2 3 4 5
12 STR12 Staff shortages 0 1 2 3 4 5
13 STR13 Inadequate training 0 1 2 3 4 5
14 STR14 Poor organisation of my shifts 0 1 2 3 4 5
15 STR15 Few opportunities for personal and career development 0 1 2 3 4 5
16 STR16 Demands of work on my home and private life 0 1 2 3 4 5
17 STR17 Too many administrative or paper work tasks 0 1 2 3 4 5
18 STR18 Having to deal with incidents outside my control 0 1 2 3 4 5
19 STR19 Low morale in the company 0 1 2 3 4 5
20 STR20 Lack of consultation and communication 0 1 2 3 4 5

180
3.0 FATIGUE A. Where the appropriate, tick (√) the answer or complete the answer in the space provided.
1 FH01 On average how many hours do you work perweek (including overtime)?
< 20 hours 20 – 40 hours 40 – 60 hours > 60 hours
2 FH02 In general, on average how many hours does it take to finish a trip? ____________ Hours
2 – 3 hours 3 – 6 hours 6 – 8 hours > 8 hours
3 FH03 Over the past year, on average how many days per month have you worked?
< 10 days 10 – 20 days 20 – 30 days
4 FSH02 What is your typical shift pattern?
Earlies–lates–nights(forward rotation) permanent days
nights–lates–earlies(backward rotation) 12 hourdays/12 hournights
Other please specify ___________________
5 FH04 During the past 12 months, what is the most consecutive shifts you worked without a rest day?
___________Shifts
Earlies–lates–nights(forward rotation) permanent days
nights–lates–earlies(backward rotation) 12 hourdays/12 hournights
Other please specify ___________________
6
FSH06 During the past year, how often have you had less than 12 hours off between shifts?
Never Very occasionally Sometimes Frequently
7 FSH07 Do you feel that you are able to get adequate sleep after day time or night time working?
Yes No
8 FSH08 Do you feel that you have adequate opportunity to take breaks whilst at work?
Yes No
9 FSH09 How much do you suffer from fatigue because of work?
Not at all Just a little Moderate amount
Quite a lot A great deal
10 FSH10 When do you feel that you suffer most from fatigue on day and night shifts?
Days Start of a shift middle of a shift end of a shift
Throughout the shift not applicable
Nights Start of a shift middle of a shift end of a shift
Throughout the shift not applicable

181
11 FSH11 What do you think are the main causes of any fatigue you have?
_____________________________________________________________________________________
12 FSH12
In the last 4 weeks have you noticed any symptoms of physical problems (e.g.feelings of pain, aches, discomfort or excessive tiredness) in any part of your body, either during or soon after your workshift?
Yes No
13 FSH13 If Yes, please give brief details of the problem, and what you think may have caused the problem
____________________________________________________________________________________
4.0 WORK ENVIRONMENT A. Please indicate to what extents do you agree or disagree with the following statements.
Strongly agree
Agree Neutral Disagree Strongly disagree
1 WC1 Inadequate communication facilities available for use in emergency situations 1 2 3 4 5
2 WC2 Poor standard of maintenance of cabs 1 2 3 4 5
3 WC3 Interference of unattended cabs by unauthorised persons 1 2 3 4 5
4 WC4 Unsatisfactory toilet facilities 1 2 3 4 5
5 WC5 Unsatisfactory meal facilities 1 2 3 4 5
6 WC6 Concern that the train will break down while you are driving it 1 2 3 4 5
7 WC7 Having to spend a considerable amount of time travelling to and from work 1 2 3 4 5
B. How do you feel about your workplace?
If a statement is not relevant for your workplace please circle the not applicable (NA) box.
Strongly agree
Agree Neutral Disagree Strongly disagree
1 WE1 The legroom underneath the desk is adequate 1 2 3 4 5
2 WE2 Overall, the chair is comfortable 1 2 3 4 5
3 WE3 All the equipment I use frequently at the workstation is within easy reach 1 2 3 4 5
4 WE4 All the paper information I require is easy to find 1 2 3 4 5
5 WE5 Overall, the layout of my workstation is good 1 2 3 4 5
6 WE6 There is sufficient room to move around the operations floor 1 2 3 4 5
7 WE7 The area is free of trip hazards (e.g. cables) 1 2 3 4 5
8 WE8 Generally, I feel comfortable with temperature of my workplace 1 2 3 4 5
9 WE9 I sweat heavily while performing my work 1 2 3 4 5
10 WE10 My work environment is very quiet and comfortable 1 2 3 4 5
11 WE11 I can see my work clearly 1 2 3 4 5
12 WE12 It is very hot and I feel uncomfortable here 1 2 3 4 5

182
13 WE13 I feel comfortable and less sweating 1 2 3 4 5
14 WE14 It is very noisy and difficult to communicate here 1 2 3 4 5
15 WE15 The light is very dim and it is very difficult to see and perform my work 1 2 3 4 5
5.0 SAFETY A. How do you concern about safety aspects in your workplace?
Very unconcern
Moderately unconcern
Neutral Moderately concern
Very concern
1 SI01 Concern about 'school-boy pranks' - e g, tampering with train, obstacles on track 1 2 3 4 5
2 SI02 Concern about the possibility of killing or injuring persons 1 2 3 4 5
3 SI04 Driving along track where track maintenance workers are working 1 2 3 4 5
4 SI05 Concern about tripping over obstacles when moving about outside the cab at night-time 1 2 3 4 5
5 SI06 Concern about being assaulted 1 2 3 4 5
6 SI07 Concern about slipping when climbing in and out of cab when train not at a platform 1 2 3 4 5
B. Please indicate to what extents do you agree or disagree with the following statements.
Strongly agree
Agree Neutral Disagree Strongly disagree
1 SC01 Safety has a high priority within the company 1 2 3 4 5
2 SC02 In my workplace management ignore safety issues 1 2 3 4 5
3 SC03 My manager consults me to assist in resolving work place problems 1 2 3 4 5
4 SC04 Management react quickly to any safety concerns 1 2 3 4 5
5 SC05 My manager always informs me about relevant safety issues 1 2 3 4 5
6 SC06 I am encouraged to offer ideas on safety 1 2 3 4 5
7 SC07 If I report a safety issue I feel I am blamed for the problem 1 2 3 4 5
8 SC08 I can approach my manager to discuss problems regarding work 1 2 3 4 5
9 SC09
There are not always enough people to do the job safely 1 2 3 4 5
10 SC10 Feedback from any safety incident is good 1 2 3 4 5
11 SC11 I am unable to do my job if I follow procedures and rules exactly 1 2 3 4 5
12 SC12 It is not possible to be familiar with all the procedures relevant to my job 1 2 3 4 5
13 SC13 Training covers the safety critical aspects of the job 1 2 3 4 5
14 SC14 Sometimes the actions of others hinder me from doing my job efficiently 1 2 3 4 5
15 SC15 My actions affect how safely other people can do their job 1 2 3 4 5

183
5.0 FLINDERS FATIGUE SCALE We are interested in the extent that you have felt fatigued (tired, weary, exhausted) over the last two weeks. We do not mean feelings of sleepiness (the likelihood of falling asleep). Please circle the appropriate response in accordance with your average feelings over this two-week period.
Not at all Moderately Extremely
1 FF01 Was fatigue a problem for you? 1 2 3 4 5
2 FF02 Did fatigue cause problems with your everyday functioning (e.g., work, social, family)?
1 2 3 4 5
3 FF03 Did fatigue cause you distress? 1 2 3 4 5
4 FF04 How often did you suffer from fatigue?
0 days/week
1-2 days/week
3-4 day/week
5-6 days/week
7 days/week
5 FF05 At what time(s) of the day did you typically experience fatigue? (Please tick box(es))
Early morning Mid morning
Midday
Mid afternoon Late afternoon
Late evening
Not at all Moderate Extreme
6 FF06 How severe was the fatigue you experienced?
1 2 3 4 5
Not at all
Moderate Entirely
7 FF07 How much was your fatigue caused by poor sleep?
1 2 3 4 5

184
6.0 EPWORTH SLEEPINESS SCALE How likely are you to doze off or fall asleep in the following situations, in contrast to feeling just tired?
This refers to your usual way of life in recent times.
Even if you haven’t done some of these things recently try to work out how they would have affected you.
Use the following scale to choose the most appropriate number for each situation:
0 = would never doze
1 = slight chance of dozing
2 = moderate chance of dozing
3 = high chance of dozing
It is important that you answer each question as best you can.
Situation Chance of Dozing (0-3)
FSL 01 Sitting and reading
FSL02 Watching TV
FSL03 Sitting, inactive in a public place (e.g. a theatre or a meeting)
FSL04 As a passenger in a car for an hour without a break
FSL05 Lying down to rest in the afternoon when circumstances permit
FSL06 Sitting and talking to someone
FSL07 Sitting quietly after a lunch without alcohol
FSL08 In a car, while stopped for a few minutes in the traffic
THANK YOU FOR YOUR COOPERATION M.W. Johns 1990-97

185
Appendix 4: Review from experts
Seksyen 1 Seksyen 2 Seksyen 3 Seksyen 4 Seksyen 5 Keseluruhan
1 Expert 1
(Industry)
Soalan – soalan
mencukupi. Mungkin
boleh tambah jenis
tren yang dipandu
Terdapat banyak
soalan yang tidak
berkaitan tugas-tugas
pemandu lokomotif.
Terlalu banyak
soalan
Bagus untuk
penilaian
Bagus untuk
penilaian
Baik & mencukupi
untuk penilaian
Secara keseluruhan semua soalan
dapat member penilaian kepada
objektif kaji selidik ini.
2 Expert 2
(Industry)
Soalan – soalan yang
dikemukakan adalah
menepati kehendak
soal selidik
OK. Tanya lebih
detail
OK OK. Soalan yang
menepati kehendak
keselamatan di
tempat bekerja
OK Keseluruhan soalan yang
diberikan akan membantu KTMB
dalam meningkatkan kualiti
pengurusan, kesihatan pekerja di
tempat kerja.
3 Expert 3
(University -
Engineering)
Bahagian ini jika
sesuai, masukkan
soalan tentang
penyakit yang ada
pada pekerja semasa
mula bekerja,
masalah pada
pendengaran,
penglihatan dll.
Kenapa bah. (A) ada
7 jawapan? Secara
keseluruhan boleh
diterima tapi ada
soalan apabila dibaca
tidak berapa jelas.
Ada bahagian tidak
jelas soalan atau
pilihannya
Ada soalan ayatnya
tergantung dan tidak
jelas
Boleh diterima Terjemahan soalan – soalan ini
perlu dilakukan lagi kerana
apabila baca soalan-soalannya,
saya tidak jelas maksudnya dan
terpaksa rujuk versi Bahasa
Inggeris.
4 Expert 4
(DOSH)
1) Skill (Likert) – tak seragam – Bhg A & E
– easy to analysis.
2) Ada soalan yang sukar difahami – soalan
yang berulang – ulang dalam bentuk yang
berbeza.
Terlampau banyak soalan, mengelirukan,
objektif soalan tak jelas – Hasil kajian secara
keseluruhan??
1) Permudahkan,
ringkaskan, be friendly
to public understanding
(layman)
Literature as a guide only – not
need to copy 100%, make
adjustment to suit your study /
project objective.

186
Seksyen 1 Seksyen 2 Seksyen 3 Seksyen 4 Seksyen 5 Keseluruhan
5 Expert 5
(University –
Management)
1) Likert scale Q2A
& Q2B –
respondent tend
to be confused!
2) Why not
standardize?
Scared that yo will
face difficulty doing
the analysis.
Q3A1-3, 11 –
suggest to use range.
Lebih mudah untuk
dianalisis dan
responden to answer.
Q3B4-5 : think of
standardization
Q4A & B : Check
again. Isn’t better to
standardize ?
6 Expert 6
(University -
Engineering)
Baik dan sesuai 1) Kenapa guna
skala 7 untuk
soalan 2.0 A
Elok dijelaskan
thema sub kategori
untuk B, C dan D.
1) Umumnya baik
Ada sedikit kesilapan
perkataan cth ada
dalam BI
Umumnya baik Perlukah subjek
mengetahui Flinders
dan Epworths
Secara umumnya baik dan sesuai
walaupun soalannya agak banyak
7 Expert 7
(University –
Management)
OK Sugges corrections
for BM & English
version – please see
the questionnaire
attached
e) Q2B1, Q2B6,
Q2C1-6, Q2D1,
Q2D3, Q2D4,
Q2D5, Q2E2,
Q2E19, Q2E20
OK OK Suggest correction
for question no. 7 –
English version
Why should Mr John thanking the
participants on your behalf?

187
Appendix 5: Amount of Missing Data
N Mean Std.
Deviation
Missing
Count Percent
JS1 227 2.56 .809 2 .9
JS2 225 2.57 .837 4 1.7
JS3 224 2.73 1.113 5 2.2
JS4 227 2.28 .892 2 .9
JS5 226 2.35 .848 3 1.3
JS6 229 2.93 .592 0 .0
JS7 229 2.93 .614 0 .0
JS8 229 3.02 .688 0 .0
STR1 229 2.71 1.137 0 .0
STR2 227 2.64 1.164 2 .9
STR3 227 2.51 1.364 2 .9
STR4 222 1.87 1.187 7 3.1
STR5 227 2.28 1.292 2 .9
STR6 228 3.08 1.542 1 .4
STR7 228 2.09 1.442 1 .4
STR8 228 2.76 1.320 1 .4
STR9 228 1.88 1.429 1 .4
STR10 226 2.41 1.425 3 1.3
STR11 226 2.52 1.415 3 1.3
STR12 227 2.77 1.473 2 .9
STR13 228 2.66 1.343 1 .4
STR14 227 2.87 1.340 2 .9
STR15 228 2.79 1.331 1 .4
STR16 227 2.63 1.378 2 .9
STR17 227 1.78 1.315 2 .9
STR18 227 2.94 1.410 2 .9
STR19 225 2.27 1.340 4 1.7
STR20 227 2.47 1.294 2 .9
JRT1 228 2.66 .987 1 .4
JRT2 228 3.39 .934 1 .4
JRT3 229 3.07 1.159 0 .0
JRT4 227 2.56 .991 2 .9
JRT5 226 2.61 .869 3 1.3
JRT6 228 3.92 .800 1 .4
JRT7 227 2.33 .973 2 .9
JRT8 228 3.44 .896 1 .4
JRT9 226 2.75 .891 3 1.3
JRT10 228 3.22 .913 1 .4
JRT11 228 2.91 .911 1 .4

188
N Mean Std.
Deviation
Missing
Count Percent
JRT12 226 2.63 .886 3 1.3
JRT13 227 2.66 .796 2 .9
JRT14 229 2.90 1.071 0 .0
JRT15 229 3.14 1.077 0 .0
FF01 226 2.98 1.030 3 1.3
FF02 225 2.96 1.127 4 1.7
FF03 225 2.65 1.132 4 1.7
FF04 219 2.30 .704 10 4.4
FF06 225 2.89 .766 4 1.7
FF07 225 3.22 1.020 4 1.7
FSL01 225 .94 .777 4 1.7
FSL02 224 1.07 .839 5 2.2
FSL03 224 .95 .859 5 2.2
FSL04 225 1.38 .998 4 1.7
FSL05 225 1.80 .991 4 1.7
FSL06 224 .29 .634 5 2.2
FSL07 223 1.47 1.008 6 2.6
FSL08 224 .30 .610 5 2.2
JCH1 228 2.13 .715 1 .4
JCH2 225 2.24 .817 4 1.7
JCH3 226 2.70 .887 3 1.3
JCH4 227 3.09 .943 2 .9
JCH5 229 1.64 .671 0 .0
JCH6 229 1.54 .722 0 .0
JCH7 225 2.23 .795 4 1.7
DT1 229 2.59 1.111 0 .0
DT2 222 3.18 1.016 7 3.1
DT3 228 3.40 1.017 1 .4
DT4 224 2.79 .878 5 2.2
DT5 226 2.99 1.052 3 1.3
WC1 226 2.52 .990 3 1.3
WC2 226 1.99 .924 3 1.3
WC3 221 2.68 .954 8 3.5
WC4 216 1.90 .983 13 5.7
WC5 205 2.18 .923 24 10.5
WC6 226 2.01 .947 3 1.3
WC7 228 2.44 .939 1 .4
WE1 176 2.93 .882 53 23.1
WE2 226 3.71 1.084 3 1.3
WE3 209 2.92 .825 20 8.7
WE4 206 2.98 .872 23 10.0
N Mean Std. Missing
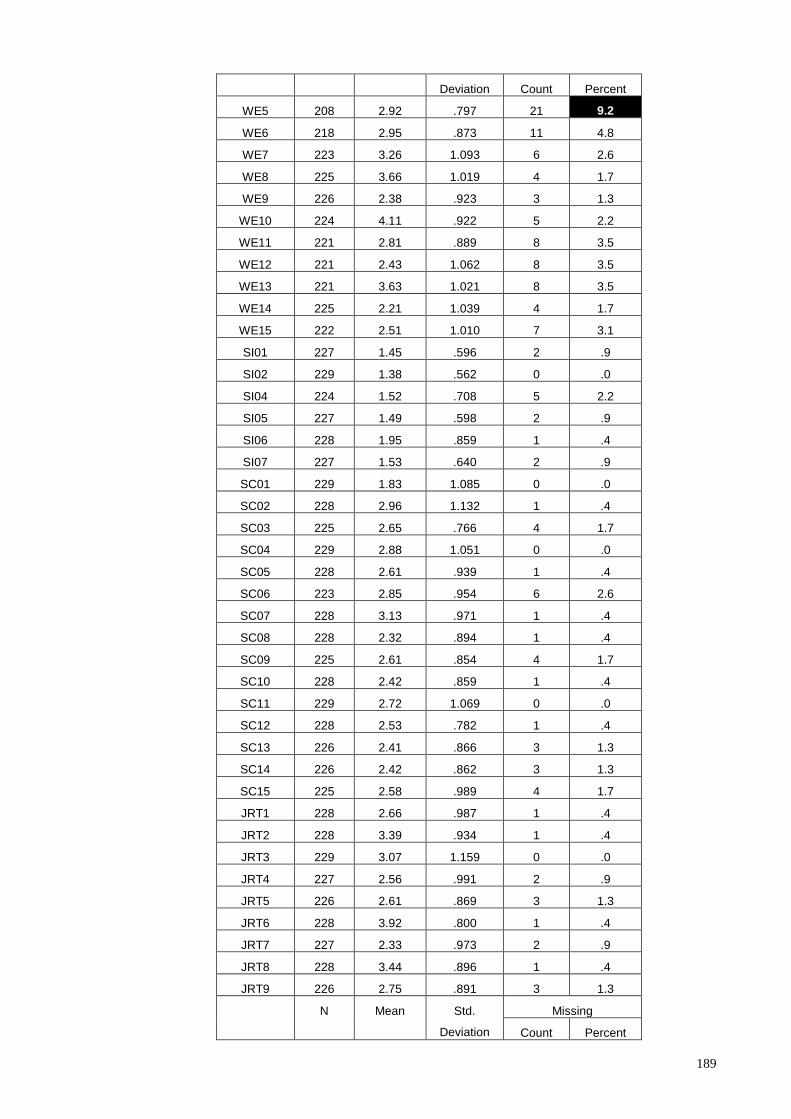
189
Deviation Count Percent
WE5 208 2.92 .797 21 9.2
WE6 218 2.95 .873 11 4.8
WE7 223 3.26 1.093 6 2.6
WE8 225 3.66 1.019 4 1.7
WE9 226 2.38 .923 3 1.3
WE10 224 4.11 .922 5 2.2
WE11 221 2.81 .889 8 3.5
WE12 221 2.43 1.062 8 3.5
WE13 221 3.63 1.021 8 3.5
WE14 225 2.21 1.039 4 1.7
WE15 222 2.51 1.010 7 3.1
SI01 227 1.45 .596 2 .9
SI02 229 1.38 .562 0 .0
SI04 224 1.52 .708 5 2.2
SI05 227 1.49 .598 2 .9
SI06 228 1.95 .859 1 .4
SI07 227 1.53 .640 2 .9
SC01 229 1.83 1.085 0 .0
SC02 228 2.96 1.132 1 .4
SC03 225 2.65 .766 4 1.7
SC04 229 2.88 1.051 0 .0
SC05 228 2.61 .939 1 .4
SC06 223 2.85 .954 6 2.6
SC07 228 3.13 .971 1 .4
SC08 228 2.32 .894 1 .4
SC09 225 2.61 .854 4 1.7
SC10 228 2.42 .859 1 .4
SC11 229 2.72 1.069 0 .0
SC12 228 2.53 .782 1 .4
SC13 226 2.41 .866 3 1.3
SC14 226 2.42 .862 3 1.3
SC15 225 2.58 .989 4 1.7
JRT1 228 2.66 .987 1 .4
JRT2 228 3.39 .934 1 .4
JRT3 229 3.07 1.159 0 .0
JRT4 227 2.56 .991 2 .9
JRT5 226 2.61 .869 3 1.3
JRT6 228 3.92 .800 1 .4
JRT7 227 2.33 .973 2 .9
JRT8 228 3.44 .896 1 .4
JRT9 226 2.75 .891 3 1.3
N Mean Std.
Deviation
Missing
Count Percent

190
JRT10 228 3.22 .913 1 .4
JRT11 228 2.91 .911 1 .4
JRT12 226 2.63 .886 3 1.3
JRT13 227 2.66 .796 2 .9
JRT14 229 2.90 1.071 0 .0
JRT15 229 3.14 1.077 0 .0

191
Appendix 6: Factor analysis for human domain
Initially, principal component analysis with Promax rotation was perform
without fixing the number of factors. From the analysis of Kaiser-Meyer-Olkin
measures of sampling adequacy (KMO), the value of 0.853 obtained indicated that the
data is appropriate for the analysis (Hair et al., 2010).
The data of 43-items of human domain were then plotted using scree plot, as
shown in Figure 5.1 (Cattell 1966 as mentioned by Reise, et al. (2000)). In general, the
number of factors can be identified from the scree plots, but in this case, the scree plot
analysis was unable to indicate the number of factors clearly (Russell, 2002). An
improved procedure, called parallel analysis (Reise et al., 2000) is then conducted by
comparing the eigenvalues from real data and simulated data. Monte Carlo simulation
was used to generate the simulated data. “In a parallel analysis, random data sets are
generated on the basis of the same number of items as in the real data matrix. Then the
Figure 7.1: Scree plot of human domain

192
scree plot of the eigenvalues (percentage of variance accounted for by a dimension)
from the real data is compared with the scree plot of the eigenvalues from the random
data (simulated data). The point where the two plots meet provides the researcher with a
good idea of the absolute maximum number of factors that should be extracted.”
Table 5.2 shows the eigenvalue comparison between real data and simulated
data, showing eleven factors with eigenvalues greater than 1.0 and the total variance
explained was 62.9% of the total variance. The factors are accepted if the eigenvalue of
the actual data was greater than the simulated data. From Table 5.2 and Figure 5.2, it
can be seen that a 5-factor solution of real data would have larger eigenvalue than the
simulated data.
Table 7.1: Parallel analysis of human domain
Factor
Real data Simulated
Decision Eigenvalue
% of
Variance
Cumulative
% Eigenvalue
1 9.804 22.801 22.801 1.9447 Accepted
2 3.457 8.039 30.840 1.8434 Accepted
3 2.498 5.809 36.649 1.7608 Accepted
4 2.264 5.265 41.914 1.6893 Accepted
5 1.679 3.905 45.819 1.6247 Accepted
6 1.515 3.523 49.342 1.5682 -
7 1.391 3.235 52.577 1.5134 -
8 1.173 2.727 55.304 1.4619 -
9 1.128 2.624 57.928 1.4172 -
10 1.107 2.574 60.502 1.3722 -
11 1.038 2.414 62.916 1.3304 -
12 .968 - - 1.2907 -
13 .958 - - 1.2517 -
14 .872 - - 1.2106 -
15 .865 - - 1.1735 -
However, this suggested solution would be difficult to be interpreted because
five items have individual loading of less than 0.4 (Hair et al., 2010) and one item
(JRT10) was loaded on two factors with differences of less than 0.1 (Snell and Dean,

193
1992). Thus, for the subsequent analysis, the items removed were STR20, STR7, STR6,
JRT6, STR17 and JRT10.
The next analysis was conducted on the remaining 37 items, which gave a
Kaiser-Meyer-Olkin (KMO) value for sampling adequacy of 0.838 and eleven-factor
solution with 66.4% total variance. One item, STR15, was loaded less than 0.4 and
would be excluded in the subsequent procedure. A parallel analysis comparing
eigenvalues between actual and simulated data generated using Monte Carlo simulation
still indicated a five-factor solution.
The third iteration was performed with 36 items (excluding STR15), and was
limited to five-factor solution. The measures of sampling adequacy were 0.829 with
47.8% total variance. All 36 items had loading of more than 0.4 (Hair et al., 2010) and
.000
2.000
4.000
6.000
8.000
10.000
12.000
1 2 3 4 5 6 7 8 9 1011121314151617181920
Real data
Simulated
Figure 7.2: Comparison of Eigenvalue between real data and simulated

194
were loaded on five-factor solution without redundancy. Table 5.3 shows the summary
of factor analysis conducted for the human domain.
A consequent analysis of 37 remaining items with 6-item deletion indicated 0.838 KMO
value, 11-factor solution with 66.4% total variance. One item (STR15) was loaded less
than 0.4. Comparison on eigenvalue with simulated data generated using Monte Carlo
simulation still indicates 5-factor solution.
The third analysis was conducted with 36 items (1-item deletion STR15) and limited to
5-factor solution as depicted in Table A6-1: 5-factors solution. Kaiser-Meyer-Olkin
measures of sampling adequacy (KMO) was 0.829 with 47.8% total variance. All 36-
items had loading more than 0.4 (Hair et al., 2010) and were loaded on 5-factor solution
without redundancy.
Table A6-1: 5-factor solution for Human domain
1 2 3 4 5
STR16 Occupational stress 16 0.764
STR10 Occupational stress 10 0.756
STR9 Occupational stress 9 0.740
STR4 Occupational stress 4 0.722
STR11 Occupational stress 11 0.656
STR5 Occupational stress 5 0.642
STR3 Occupational stress 3 0.637
STR12 Occupational stress 12 0.634
STR2 Occupational stress 2 0.616
STR14 Occupational stress 14 0.574
STR1 Occupational stress 1 0.553
STR8 Occupational stress 8 0.516
STR18 Occupational stress 18 0.506
STR13 Occupational stress 13 0.470
STR19 Occupational stress 19 0.468
JRT5 Job-related tension 5 0.718
JRT13 Job-related tension 13 0.663
JRT7 Job-related tension 7 0.633
JRT4 Job-related tension 4 0.617
JRT12 Job-related tension 12 0.583

195
JRT9 Job-related tension 9 0.543
JRT11 Job-related tension 11 0.536
JRT3 Job-related tension 3 0.479
JRT15 Job-related tension 15 0.447
JS5 Job Satisfaction 5 0.799
JS4 Job Satisfaction 4 0.783
JS2 Job Satisfaction 2 0.756
JS1 Job Satisfaction 1 0.711
JS3 Job Satisfaction 3 0.618
JS6 Job Satisfaction 6 0.860
JS7 Job Satisfaction 7 0.835
JS8 Job Satisfaction 8 0.792
JRT2 Job-related tension 2 0.753
JRT1 Job-related tension 1 0.544
JRT8 Job-related tension 8 0.417
JRT14 Job-related tension 14 0.410

196
Appendix 7: Factor analysis for Activity domain
Analysis I
Principal component analysis was performed for the first time for 11-items with Promax
rotation. KMO value was 0.674 (Hair et al., 2010) identified the data considered to be
appropriate for the analysis. Four-factor solution with 58.2% of the variance was
suggested for this data. Then, to confirm number of factors, researcher performed a
parallel analysis (Reise et al., 2000) depicted in Table A7-1.
Table A7-1
Factor
Initial Eigenvalues Simulated
Decision Total
% of
Variance
Cumulative
% Eigenvalue
1 2.419 21.993 21.993 1.3629 Accepted
2 1.721 15.646 37.640 1.2578 Accepted
3 1.255 11.406 49.046 1.1912 Accepted
4 1.008 9.167 58.212 1.1114
5 .862 7.833 66.045 1.0438
6 .813 7.387 73.432 0.9903
7 .689 6.267 79.698 0.9247
8 .632 5.742 85.440 0.8664
9 .616 5.604 91.043 0.8161
10 .521 4.736 95.779 0.7469
11 .464 4.221 100.000 0.6886
From the parallel analysis, it shows that 3-factor solution was suggested where real data
eigenvalues were more than the simulated value. Figure A7-1 also represent the
comparison between two types of eigenvalue.

197
Figure A7-1
All items had loading more than 0.4 (Hair et al., 2010), therefore no deletion of items at
this stage. However, this 4-factor solution was not selected as the suggestion using 4-
factors was not supported by the parallel analysis (Reise et al., 2000) previously as
depicted in Table A7-1 and Figure A7-1.
Table A7-2: Pattern matrix
Table A7-2 shows the distribution of items among 4 suggested constructs. Construct
number 2 and 4 had only 2 items respectively. Yet, this could not be accepted as the
Component
1 2 3 4
DT3 Driving Task 3 0.867
DT2 Driving Task 2 0.788
DT1 Driving Task 1 0.560
JCH1 Job Characteristics 1 0.812
JCH2 Job Characteristics 2 0.792
DT5 Driving Task 5 0.860
DT4 Driving Task 4 0.491
JCH3 Job Characteristics 3 0.478
JCH7 Job Characteristics 7 0.440
JCH6 Job Characteristics 6 0.817
JCH5 Job Characteristics 5 0.598
.000
.500
1.000
1.500
2.000
2.500
3.000
1 2 3 4 5 6 7 8 9 10 11
Factor
Parallel

198
minimum number of items for Structural Equation Modeling (SEM) analysis requires
minimum of 3 items (Russell, 2002).
So, another analysis with different criteria was conducted to apply data reduction
technique. This process were repeated to gain appropriate number of factors with
supported by the analysis and the results were examined (Tinsley & Tinsley, 1987).
Analysis II
Another analysis was conducted with the minimum factor loading was set to 0.5 (Hair et
al., 2010) and 3-factor solution without any deletion of item. Measuring of sample
adequacy (MSA) using KMO value and eigenvalues were same as previous analysis
with 0.4-factor loading. It was 49% total variance explained with 3-factor solution.
Table A7-3: Pattern matrix
With Promax rotation, pattern matrix was generated. Inter-correlated items with 0.5
loading and more were grouped in one particular component or factor. However, 2
items (JCH7 and JCH 3) were loaded less than 0.5 and will be deleted in the next
procedure.
Analysis III
Component
1 2 3
DT2 Driving Task 2 0.758
DT3 Driving Task 3 0.711
DT1 Driving Task 1 0.677
DT4 Driving Task 4 0.602
JCH7 Job Characteristics 7
JCH2 Job Characteristics 2 0.772
JCH1 Job Characteristics 1 0.679
JCH5 Job Characteristics 5 0.598
JCH3 Job Characteristics 3
DT5 Driving Task 5 0.819
JCH6 Job Characteristics 6 -0.553

199
Additional analysis was performed as the previous solution was not appropriate because
of item loading criteria. The setting was the same as previous with 0.5-factor loading
and 3-factor solution with two items, JCH 7 and JCH 3 were deleted. KMO value was
0.63 (Hair et al., 2010) and 53.8% variance explained. From the analysis of partial
correlation, measures of sampling adequacy (MSA) in anti-image matrices indicates
item DT5 with loading of 0.408, lower than minimum value 0f 0.5. Therefore, this item
needs to be deleted. Then, analysis continued with examination of loading on pattern
matrix. It was identified item JCH6 was not belong to any factor as it loading was lower
than 0.5. Thus, this item also needs to be deleted.
Analysis IV
After 3 consecutive analyses with deletion of 4 items, researcher decided to retain the
criteria of 0.5 loading but with 2-factor solution. Remaining items available were 7 after
4 deletion in previous analysis, it might disperse the items if the researcher remaining 3-
factor solution. Each factor might have 2 items, and this is not suitable for further
analysis (Russell, 2002). As a result, the researcher decided to maintain 2 factors as
suggested in original research framework for activity domain which are Driving Task
(DT) and Job Demand (JCH).
Final analysis for activity domain was conducted with 7 items, 2-factor solution and
minimum 0.5 factor loading. Kaiser-Meyer-Olkin measures of sampling adequacy
(KMO) value of 0.637 (Hair et al., 2010) indicated the data deemed to be appropriate
for the analysis with 50.6% of the variance.
Table A7-4: Results of the Factor Analysis
Component

200
1 2
DT2 Driving Task 2 0.775 0.024
DT1 Driving Task 1 0.710 0.151
DT3 Driving Task 3 0.682 -0.221
DT4 Driving Task 4 0.615 0.057
JCH2 Job Characteristics 2 -0.043 0.788
JCH1 Job Characteristics 1 -0.048 0.724
JCH5 Job Characteristics 5 0.155 0.591
Eigenvalue 1.978 1.564
Percentage variance (50.6) 28.26 22.35
Table S depicts the result of the factor analysis. These result confirm that each of these
constructs is unidimensional and factorially distinct and that all items used to measure a
particular construct loaded on a single factor.

201
Appendix 8 : Factor analysis for context domain
Analysis I
Principal component analysis was performed for 42-items with Promax rotation. KMO
value was 0.751 (Hair et al., 2010) identified the data considered to be appropriate for
the analysis. Thirteen-factor solution with 67.4% of the variance was suggested for this
data.
From the analysis of partial correlation, measures of sampling adequacy (MSA) in anti-
image matrices indicates item SC15 with loading of 0.447 and item SC12 with loading
of 0.370; lower than minimum value of 0.5. Therefore, these items need to be deleted.
Then, analysis continued with an examination of loading on pattern matrix. It was
identified 8 items were not belong to any factor as it loading was lower than 0.5. There
were WE4, WC1, SI07, SC03, SC06, WC2, WC7 and SC14. Thus, these items need to
be deleted.
Parallel analysis was carried out to confirm number of factors as suggested by Reise, et
al. (2000). Comparison table of real and simulated Eigenvalues depicted in Table A8-1.
Seven-factor solution was suggested as Eigenvalue of real data were more than
simulated Eigenvalue. However, researcher needs to conduct another analysis with 10-
item deletion as suggested.

202
Table A8-1
Factor
Initial Eigenvalues Simulated
Decision Total
% of
Variance
Cumulative
% Eigenvalue
1 7.401 17.622 17.622 1.9268 Accepted
2 3.384 8.057 25.679 1.8167 Accepted
3 3.177 7.565 33.245 1.7385 Accepted
4 2.009 4.784 38.029 1.6716 Accepted
5 1.875 4.464 42.493 1.6103 Accepted
6 1.776 4.229 46.722 1.552 Accepted
7 1.539 3.665 50.387 1.4997 Accepted
8 1.403 3.340 53.727 1.4535
9 1.365 3.250 56.977 1.4041
10 1.190 2.833 59.810 1.365
11 1.147 2.730 62.540 1.3163
12 1.058 2.519 65.059 1.2753
13 1.001 2.384 67.443 1.2376
Analysis II
Analysis I suggested to delete 10 items for the following analysis. However, researcher
found the number of deleted items was too high. Therefore, researcher decided to
conduct similar analysis with original 42-items but setting 7-factor solution as suggested
previously through parallel analysis and minimum of 0.4 item loading (Hair et al.,
2010).
Measuring of sample adequacy (MSA) using KMO value was 0.751. It was 50.39%
total variance explained with 7-factor solution.
Then, partial correlation analysis, measures of sampling adequacy (MSA) in anti-image
matrices indicates 2 items were lower than minimum value of 0.5; SC15 and SC12.
Analysis continued with an examination of loading on pattern matrix. It was identified 3
items were not belong to any factor as it loading was lower than 0.4. There were
SC02N, SC04 and WC1. Another 2 items; WE3 and SC03 were loaded on 2 factors.

203
However, item WE3 was not deleted because the differences of the loading were more
than 0.1. Therefore, these items (SC15, SC12, SC02N, SC04, WC1 and SC03) need to
be deleted.
Analysis III
Analysis III was performed as the previous solution was not appropriate because of item
loading criteria. Six items (SC15, SC12, SC02N, SC04, WC1 and SC03) were deleted.
KMO value was 0.757 (Hair et al., 2010) and 53.1% variance explained with 7-factor
solution. Inspection of loading on pattern matrix indicated 4 items; WC3, SC07N and
SC06 were lower than 0.4 and not belong to any of the factor. At the same time, item
SI07 was loaded on 2 factors with differences less than 0.1 and should be deleted.
Therefore, these 4 items should be deleted for the next analysis.
Because of number of items reduced (42 items to 36 items); another parallel analysis
was conducted to determine appropriate number of factor-solution. Six-factor solution
was suggested by the parallel analysis as shown in Table A8-2.
Table A8-2
Factor
Initial Eigenvalues Simulated
Decision Total
% of
Variance
Cumulative
% Eigenvalue
1 6.355 17.654 17.654 1.8318 Accepted
2 3.233 8.981 26.634 1.7315 Accepted
3 2.969 8.247 34.882 1.6485 Accepted
4 1.869 5.191 40.072 1.5834 Accepted
5 1.683 4.675 44.747 1.5215 Accepted
6 1.597 4.437 49.184 1.4655 Accepted
7 1.411 3.918 53.102 1.4125
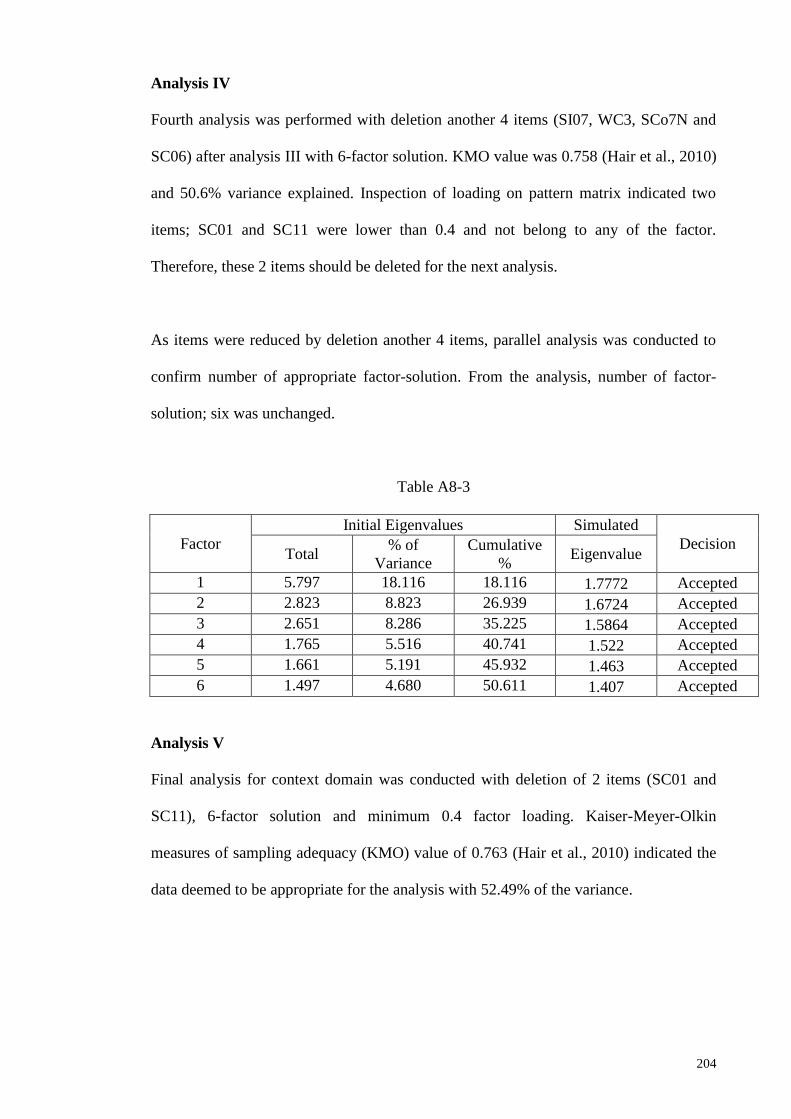
204
Analysis IV
Fourth analysis was performed with deletion another 4 items (SI07, WC3, SCo7N and
SC06) after analysis III with 6-factor solution. KMO value was 0.758 (Hair et al., 2010)
and 50.6% variance explained. Inspection of loading on pattern matrix indicated two
items; SC01 and SC11 were lower than 0.4 and not belong to any of the factor.
Therefore, these 2 items should be deleted for the next analysis.
As items were reduced by deletion another 4 items, parallel analysis was conducted to
confirm number of appropriate factor-solution. From the analysis, number of factor-
solution; six was unchanged.
Table A8-3
Factor
Initial Eigenvalues Simulated
Decision Total
% of
Variance
Cumulative
% Eigenvalue
1 5.797 18.116 18.116 1.7772 Accepted
2 2.823 8.823 26.939 1.6724 Accepted
3 2.651 8.286 35.225 1.5864 Accepted
4 1.765 5.516 40.741 1.522 Accepted
5 1.661 5.191 45.932 1.463 Accepted
6 1.497 4.680 50.611 1.407 Accepted
Analysis V
Final analysis for context domain was conducted with deletion of 2 items (SC01 and
SC11), 6-factor solution and minimum 0.4 factor loading. Kaiser-Meyer-Olkin
measures of sampling adequacy (KMO) value of 0.763 (Hair et al., 2010) indicated the
data deemed to be appropriate for the analysis with 52.49% of the variance.

205
Table A8-4
Component
1 2 3 4 5 6
WE5 Working env. 5 .848 .159 .048 .151 -.079 -.100
WE6 Working env. 6 .742 -.003 -.082 .092 .008 -.123
WE8 Working env. 8 .665 -.106 .037 -.196 -.053 .073
WE7 Working env. 7 .619 -.062 .118 .073 .085 -.034
WE10 Working env. 10 .609 -.109 .011 -.222 -.200 .047
WE4 Working env. 4 .596 .056 .136 .179 .143 .006
WE2 Working env. 2 .578 -.046 -.174 -.123 -.051 .095
WE13 Working env. 13 .538 -.233 -.029 -.141 .024 -.053
WE11 Working env. 11 .453 .112 -.068 .076 .287 .034
SI02 Safety issue 2 .015 .824 -.063 -.014 .073 .048
SI04 Safety issue 4 -.065 .777 .134 -.162 -.218 -.190
SI01 Safety issue 1 .038 .756 -.055 -.045 .071 .040
SI05 Safety issue 5 -.100 .729 -.045 .060 .000 .097
WE14 Working env. 14 .005 -.043 .836 .172 .150 -.085
WE12 Working env. 12 .018 .020 .771 .099 .025 -.097
WE15 Working env. 15 .045 -.127 .745 -.018 -.082 -.066
SC14 Safety culture 14 -.027 .049 .529 -.321 -.049 .235
WE9 Working env. 9 .059 .102 .431 -.045 -.052 .202
WC4 Working conditions 4 .023 -.077 -.012 .817 -.100 -.021
WC5 Working conditions 5 .042 -.049 -.076 .787 -.146 .130
WC2 Working conditions 2 -.005 .019 .254 .599 .057 .105
SC10 Safety culture 10 .031 .005 .057 -.104 .791 .163
SC08 Safety culture 8 -.066 -.010 .069 -.080 .751 -.136
SC13 Safety culture 13 .014 -.014 -.029 -.035 .550 .090
SC05 Safety culture 5 .071 -.024 -.268 -.122 .494 -.160
SC09 Safety culture 9 -.274 -.141 .064 -.109 -.016 .691
WC7 Working conditions 7 -.162 -.127 -.058 .241 .104 .658
SI06 Safety issue 6 .088 .264 -.055 .018 .062 .583
WC6 Working conditions 6 .131 .047 -.113 .322 -.138 .503
WE3 Working env. 3 .360 .062 .141 -.097 .075 .502
Eigenvalue 5.562 2.783 2.587 1.749 1.617 1.448
Percentage variance (52.49) 18.539 9.277 8.623 5.830 5.389 4.828

206
Table A8-4 depicts the result of the factor analysis. These result confirm that each of
these constructs is unidimensional and factorially distinct and that all items used to
measure a particular construct loaded on a single factor.

207
Appendix 9: Train timetable

208

209
Appendix 10: Epworth Sleepiness Scale (ESS) Permission Email

210
Appendix 11: Letter to experts
En Suhaimi Ali,
Department of Occupational Safety, Health and Environment,
Keretapi Tanah Melayu Berhad,
Ibu Pejabat Korporat,
Jalan Sultan Hishamuddin,
50621 Kuala Lumpur. 9th
March 2011
Dear Sir,
Questionnaire Evaluation by Expert
I am a Ph.D. (Ergonomics) student at Faculty of Engineering, University of Malaya and
currently conducting a research for development of a human performance model for Malaysian
train drivers. The objective of this study is to evaluate effects of workload and fatigue on
performance and safety of the train driver. This study will help to improve and as an effort to
solve existing problems and drawbacks in the railway industry.
As an expert in railway industry, I do appreciate your interest in my research. Your comments
and suggestions during the evaluation will be very beneficial to this study. Your participation is
highly appreciated.
I will send a hard copy, and replies envelop via mail and should be reached to you very soon.
It will be grateful if you may response before 22nd
of March 2011 as I could resume with the
next stage of the study.
Thanking you in advance for your time and participation.
Yours sincerely,
Mohd Azlis Sani Md Jalil
Dept. of Engineering Design & Manufacturing,
Faculty of Engineering,
University of Malaya,
50603 Kuala Lumpur.
Email : [email protected]
cc. Associate Prof. Dr Siti Zawiah Md Dawal
Project Supervisor

211
Appendix 12: Evaluation form for expert
Evaluation form for expert / Borang Penilaian Pakar
Please evaluate and comments the questionnaire provided to you.
Sila nilaikan dan komen borang soal selidik yang disediakan kepada anda.
Section 1.0 General Information / Seksyen 1.0 Maklumat Umum
______________________________________________________________________
______________________________________________________________________
______________________________________________________________________
Section 2.0 Workload / Seksyen 2.0 Beban tugas
______________________________________________________________________
______________________________________________________________________
______________________________________________________________________
Section 3.0 Fatigue / Seksyen 3.0 Kelesuan
______________________________________________________________________
______________________________________________________________________
______________________________________________________________________
Section 4.0 Safety / Seksyen 4.0 Keselamatan
______________________________________________________________________
______________________________________________________________________
______________________________________________________________________
Section 5.0 Established survey instrument / Seksyen 5.0 Instrumen kaji selidik terdahulu
______________________________________________________________________
______________________________________________________________________
______________________________________________________________________
Overall / Keseluruhan
______________________________________________________________________
______________________________________________________________________
______________________________________________________________________

212
Appendix 13: Appreciation letter to experts
En. Husdin bin Che Amat,
Director
Industrial Hygiene and Ergonomics
Department of Occupational Safety and Health
(Ministry of Human Resource)
Level 2, 3 & 4, Block D3, Complex D
Federal Government Administrative Centre
62530 W. P. Putrajaya. 3rd
June 2011
Dear Sir,
Letter of Appreciation
This letter is to express my appreciation on behalf of my supervisor, Associate Prof. Dr
Siti Zawiah Md Dawal for your feedbacks, comments and participation in evaluation of
my survey instrument.
Your comments and suggestions are very beneficial to this study. Your participation is
highly appreciated.
Thank you very much.
Yours sincerely,
Mohd Azlis Sani Md Jalil
Dept. of Engineering Design & Manufacturing,
Faculty of Engineering,
University of Malaya,
50603 Kuala Lumpur.
Email : [email protected]
cc. Associate Prof. Dr Siti Zawiah Md Dawal
Project Supervisor

213
Appendix 14: Letter to TOC for field study at depots
Kepada;
En. Zakaria Sulong,
Pengurus Besar,
Department of Safety, Health and Environment (S.H.E),
Keretapi Tanah Melayu Berhad,
Ibu Pejabat Korporat,
Jalan Sultan Hishamuddin, 50621 Kuala Lumpur.
PERMOHONAN MENJALANKAN KERJA LAPANGAN DI DEPOH – DEPOH
KTMB
Dengan segala hormatnya, perkara di atas adalah dirujuk.
2. Pihak kami ingin merakamkan penghargaan kepada pihak tuan yang selama ini
telah memberikan kerjasama yang sangat baik di dalam penyelidikan berkaitan
“Development of Malaysian Train Driver Performance Model”.
3. Justeru itu, bagi meneruskan penyelidikan ini, saya ingin memohon kebenaran
pihak tuan bagi pelajar Ph.D. kami untuk menjalankan kerja lapangan di Depoh – depoh
KTMB seperti maklumat berikut:
Nama penyelidik : Mohd Azlis Sani Md Jalil
No. Matrik : KHA 080044
No. KP : 780103 – 01 – 5839
4. Dilampirkan jadual perancangan kerja lapangan yang akan dilakukan. Tarikh
dan tempat adalah tertakluk kepada kebenaran daripada pihak tuan. Penyelidik kami
boleh dihubungi melalui nombor 019 – 211 2692 atau email [email protected].
5. Kami amat berharap permohonan ini mendapat perhatian seterusnya kelulusan
daripada pihak tuan. Kerjasama tuan kami amat hargai dan di dahului dengan ucapan
terima kasih.
Sekian. Terima kasih.
Prof. Madya Dr Siti Zawiah Md Dawal

214
Appendix 15: Letter to TOC for field study at the locomotives
Kepada;
Tuan Haji Sarbini bin Tijan,
Pengurus Besar Operasi,
Keretapi Tanah Melayu Berhad,
Ibu Pejabat Korporat,
Jalan Sultan Hishamuddin, 50621 Kuala Lumpur.
PERMOHONAN MENJALANKAN KERJA LAPANGAN DI LOKOMOTIF
Dengan segala hormatnya, perkara di atas adalah dirujuk.
2. Kami ingin merakamkan penghargaan kepada pihak KTMB yang selama ini
telah memberikan kerjasama yang sangat baik di dalam penyelidikan berkaitan
“Development of Malaysian Train Driver Performance Model” khususnya semasa kaji
selidik yang dijalankan di depoh-depoh sebelum ini.
3. Justeru itu, bagi meneruskan penyelidikan ini, saya ingin memohon kebenaran
pihak tuan bagi pelajar Ph.D. kami untuk menjalankan kerja lapangan di lokomotif –
lokomotif seperti maklumat berikut:
Nama penyelidik : Mohd Azlis Sani Md Jalil
No. Matrik : KHA 080044
No. KP : 780103 – 01 – 5839
4. Dilampirkan jadual perancangan kerja lapangan yang akan dilakukan. Tarikh
dan tempat adalah tertakluk kepada kebenaran daripada pihak tuan. Penyelidik kami
boleh dihubungi melalui nombor 019 – 211 2692 atau email [email protected].
5. Kami amat berharap permohonan ini mendapat perhatian seterusnya kelulusan
daripada pihak tuan. Kerjasama tuan kami amat hargai dan di dahului dengan ucapan
terima kasih.
Sekian. Terima kasih.
Prof. Madya Dr Siti Zawiah Md Dawal
Penyelia
s.k. Tuan Haji Abdul Mokti bin Zakaria
Pengurus Besar,
Department of Occupational Safety, Health & Environment (OSHEN),
Keretapi Tanah Melayu Berhad.

215
Appendix 16: Consent letter
1 Mac 2011.
Kepada responden yang dihormati,
Tuan,
JEMPUTAN UNTUK MENGAMBIL BAHAGIAN DI DALAM KAJI SELIDIK
Saya adalah seorang pelajar Ph.D (Ergonomik) di Fakulti Kejuruteraan, Universiti
Malaya dan pada masa ini sedang menjalankan kajian pembangunan model prestasi
manusia terhadap pemandu keretapi di Malaysia. Objektif kajian ini adalah untuk
menilai kesan – kesan beban tugas dan kelesuan ke atas prestasi dan keselamatan
pemandu keretapi. Kajian ini diharapkan dapat membantu mempertingkatkan dan juga
sebagai suatu usaha untuk menyelesaikan masalah yang terjadi di dalam industri dewasa
ini.
Sebagai seorang yang berpengalaman, saya amat menghargai keterlibatan tuan di dalam
kajian saya ini. Saya memerlukan sedikit pertimbangan tuan untuk menjawab soalan –
soalan di dalam borang soal selidik yang disediakan. Data – data terkumpul adalah
rahsia dan hanya akan digunakan untuk tujuan akademik sahaja.
Adalah menjadi harapan saya jika tuan dapat memberikan kerjasama dan pertimbangan
tuan.
Sekian. Terima kasih.
Yang benar,
Mohd Azlis Sani Md Jalil,
Pelajar Ph.D (Ergonomik),
Jabatan Kejuruteraan Rekabentuk dan Pembuatan,
Fakulti Kejuruteraan,
Universiti Malaya,
50603 Kuala Lumpur.
Email : [email protected]
sk. Prof. Madya Dr Siti Zawiah Md Dawal
Penyelia Projek

216
Appendix 17: Consent form
Surat Keizinan oleh Responden
Tajuk projek : Pembangunan Model Prestasi Manusia untuk Pemandu Keretapi
Malaysia
(Development of Malaysian Train Driver Performance Model)
Penyelidik : Mohd Azlis Sani bin Md Jalil
Penyelia : Prof. Madya Dr Siti Zawiah Md Dawal
Tujuan :
Kajian ini dilakukan untuk mengkaji kesan – kesan bebanan tugas dan kelesuan
terhadap prestasi dan keselamatan pemandu keretapi. Kaji selidik ini akan mendapat
data hasil daripada pandangan dan persepsi pemandu keretapi yang telah berpengalaman
di dalam industry ini. Hasil daripada dapatan kaji selidik ini, model prestasi manusia
akan dibangunkan. Kaji selidik ini adalah sebahagian daripada kajian kedoktoran
(Ph.D.)
Prosedur :
Responden perlu menjawab soalan – soalan yang dikemukakan di dalam borang kaji
selidik. Borang ini mengandungi 5 bahagian utama dan dianggarkan masa menjawab
adalah selama 30 minit. Responden perlu memilih jawapan yang dirasakan amat sesuai
dan tiada betul atau salah untuk kesemua jawapan tersebut.
Risiko :
Tiada sebarang risiko kepada responden semasa atau selepas menjawab soalan – soalan
ini.
Kerahsiaan :
Maklumat responden adalah dijamin rahsia. Setiap jawapan adalah rahsia dan borang
soal selidik yang telah dijawab akan hanya ditanda dengan nombor kod. Hanya data
yang telah diproses dan dianalisis akan digunakan. Nama responden tidak akan
digunakan dalam sebarang laporan.
Sukarela :
Keterlibatan responden di dalam kaji selidik ini adalah secara sukarela, tanpa sebarang
paksaan.
Hak untuk menarik diri :
Responden mempunyai hak untuk menarik diri daripada kajian ini pada bila – bila
masa.
Bil:

217
Kebenaran responden
Saya telah membaca dan memahami Surat Keizinan untuk kaji selidik ini. Dengan ini,
saya secara sukarela bersetuju untuk mengambil bahagian di dalam kaji selidik ini.
Responden, Penyelidik,
TT:________________________ ________________________
Nama: _____________________ Mohd Azlis Sani Md Jalil
No. kakitangan : _____________ No. matrik : KHA 080044
Tarikh : ____________________ Tarikh : _________________


![Fax 075-581-6137 com · Fax 075-581-6137 com Tel 075-581-0001 Mail info@kr-geihi] URL LINE IOC ! 2001 TAKI](https://img.dokumen.tips/doc/110x75/5f0458907e708231d40d8656/fax-075-581-6137-com-fax-075-581-6137-com-tel-075-581-0001-mail-infokr-geihi-url.jpg)