Embed Size (px)
Citation preview

Development of an integrated quality management Framework for manufacturing organisations
KHAMKHAM, Mohamed
Available from Sheffield Hallam University Research Archive (SHURA) at:
http://shura.shu.ac.uk/19159/
This document is the author deposited version. You are advised to consult the publisher's version if you wish to cite from it.
Published version
KHAMKHAM, Mohamed (2017). Development of an integrated quality management Framework for manufacturing organisations. Doctoral, Sheffield Hallam University.
Copyright and re-use policy
See http://shura.shu.ac.uk/information.html
Sheffield Hallam University Research Archivehttp://shura.shu.ac.uk

Development of an integrated quality management
Framework for manufacturing organisations
Mohamed Khamkham
A thesis submitted in partial fulfilment of the requirements of
Sheffield Hallam University for the degree of Doctor of
Philosophy
October 2017


Acknowledgements
First of all, I would like to express my sincere and earnest thanks to Allah’s
greatness for the gift of life, for His blessings and for giving me the health and
strength to finish this work.
Secondly, I am wholeheartedly thankful to my supervisor, Prof Sameh Saad, for
his guidance and continuous encouragement throughout the research. I am
grateful and speechless for his invaluable support and dedication.
I would like also to extend my gratitude to those who participated in the
questionnaire surveys resulting in its high response rate. Without their valuable
contributions, this research would not be accurate.
My profound gratitude also goes to my brother and friend, Sulieman Agela, who
had offered me this opportunity to study PhD in the United Kingdom.
I would like to acknowledge and pray for the spirit of my brother Mousa who had
offered me this opportunity to complete may postgraduate study, and the spirit
of my father who was the last words to me pray every success in this journey
and also the spirit of my mother who was pried to me with every reconcile.
I owe my sincerest thanks and gratitude to my wife, who in addition to her
continued encouragement and understanding took the load of the children,
home (and me) and provided an environment that, allowed me minimal
disruption in order to finish this study successfully.
Finally, I would like to thank the most beloved people in my life, my kind
brothers, for their continuous care and support. I am also grateful to my
adorable sisters, for their kindness and support.

List of abbreviations:
AHP: Analytic Hierarchy Process
ASQ: American Society for Quality
ARMI model: (Approve, Resources, Member, Interested, Interested party)
COPQ: Cost of Poor Quality
CP: Process Capability Potential
CPk: Process Capability Actual
CSFs: Critical Success Factors
CTC: Critical To Cost
CTQ: Critical, To, Quality
CTS: Critical To Schedule
DFSS: Design for Six-Sigma
DMAIC: Define, Measure, Analyse, Improve and Control
DMDIV: Define, Measure, Design, Improve and Verify
DOE: Design of Experiment
DPMO: Defect per Million Opportunity
DPU: Defect per Unit
EFA: Exploratory Factor Analysis
FA: Factor Analysis
FMEA: Failure Mode Effect and Analysis
GRPI checklist: (Group, Resources, Process, Interpersonal Relations)
IQM: Integration Quality Management
IQM-FW: Integrated Quality Management Framework
ISO: International Organisation for Standardization
KIP: Key Indicator Performance
LSS: Lean Six-Sigma
LSS-M: Lean Six-Sigma Integrated Model
OEE: Overall Evaluation Effectiveness

PCA: Process Capability Analysis
PDCA: Plan, Do, Check and Act
QCC: Quality Control Circle
QFD: Quality Function Deployment
QIT: Quality Improvement Team
ROI: Return on Investment
RPN: Risk Priority Number
RTY: Rolled Throughput Yield
SIPOC: Supplier Input Process Output Customer
SPC: Statistical Process Control
SPSS: Statistical Package for Social Science
SS: Six-Sigma
SS-TQM: Six-Sigma TQM integrated Model
SUF: Single Unite Flow
TPM: Total Productive Maintenance
TQM: Total Quality Management
VOB: Voice of Business
VOC: Voce of Customer
VOP: Voice of Process
VSM: Value Stream Mapping
QMMs: Quality Management Methods

Publications from the Thesis
Saad, M.S. and Khamkham, M. (2016),"Development of Lean Six-Sigma
conceptual implementation model for manufacturing organisations", Proceeding
of the 14th International Conference on Manufacturing Research, incorporating
the 31st National Conference on Manufacturing Research, September 6-8,
2016, Loughborough University, UK, Vol 3, pp. 497-502.
Saad, M.S. and Khamkham, M. (2016). "A conceptual model for successful
implementation of lean Six-Sigma for manufacturing organisations".
International Journal of Lean Six Sigma.
Saad, M.S. and Khamkham, M. (2017), "Development of a business excellence
conceptual model for manufacturing organization - A Six-Sigma and TQM
integrated approach". Proceeding of the 15th International Conference on
Manufacturing Research, incorporating the 32st National Conference on
Manufacturing Research, September 5-7, 2017, Greenwich university London
UK
Saad, M.S. and Khamkham, M. (2017) "A multi-criteria decision-making for
evaluating integrated quality-management performance". International Journal
of Quality & Reliability Management.

Abstract
During the last couple of decade's operation management methods such as
Six-Sigma, Lean Manufacturing and TQM have been implemented by many
organizations to facilitate the production lines and to improving the operation
performance. However, none of these models able to solve all organisation
problems when implemented alone, whereas integrated management models
such as Lean Six-Sigma, have been empowered organisations to exceed the
improvement rates and achieves competitive advantage. The aim of this
research study is to develop an integrated quality management framework,
consists of two models which are; Lean Six-Sigma integrated model and Six-
Sigma TQM integrated model, to help manufacturing organisations to eliminate
the quality issues and to improve and modernize quality system.
The study explores the literature pertinent to the topic, in order to identify the
key drivers that are required to develop the proposed models and the
framework. The study adopted a quantitative approach method for developing
and validating the proposed models and the framework. Initially, Questionnaire
surveys were conducted for the validation of the proposed models, the models
were endorsed by a significant number of industrialists, quality professionals
and academics from various manufacturing organisations. The models were
integrated together and, therefore, the key drivers for developing the framework
were identified. Furthermore, a multi-criteria decision-making method (AHP)
was applied to evaluate and prioritise the key components of the framework.
Based on an (AHP) evaluation the framework is designed and its
implementation procedures were developed. The questionnaire survey was
designed and conducted for the purpose of validating the framework and its
implementation procedures.
The key findings of this study clearly demonstrated that the development of the
proposed models and the framework should enable manufacturing
organisations to achieve their desired objectives effectively.
Finally, the proposed framework and the integrated models were designed to
provide impetus and guidance for manufacturing organisations in order to
achieve significant improvement in the manufacturing organisations'
performance and, as such, make a key contribution to academic knowledge.
vii
Table of Contents Chapter One: .......................................................................................................... 18
Introduction ............................................................................................................ 18
1.1. Introduction ....................................................................................................... 18
1.2. Background ....................................................................................................... 18
1.3. Research questions .......................................................................................... 20
1.4. Research aim .................................................................................................... 20
1.5. Research objectives .......................................................................................... 21
1.6. Overview of the thesis ....................................................................................... 22
Chapter two: ........................................................................................................... 26
Literature review .................................................................................................... 26
2.1. Introduction to Quality management ................................................................. 26
2.1.1. Definition and concept of Quality management .............................................. 28
2.1.2. Quality management methods, tools and techniques .................................... 29
2.1.3. The importance of quality tools and techniques ............................................. 30
2.2. Six-Sigma Initiative ........................................................................................... 30
2.2.1. What does Six-sigma mean? ......................................................................... 31
2.2.2. Six-Sigma strategy ......................................................................................... 32
2.2.3. Six-sigma methodology .................................................................................. 32
2.2.4. Six-Sigma tools and techniques ..................................................................... 34
2.2.5. Six-Sigma and statistical thinking ................................................................... 36
2.3. The Lean Manufacturing Approach ................................................................... 36
2.3.1. The concept of Lean manufacturing ............................................................... 37
2.3.2. Principles of Lean Manufacturing ................................................................... 38
2.3.3. Lean tools and techniques ............................................................................. 39
2.3.4. DMAIC methodology and Lean manufacturing .............................................. 40
2.3.5. The similarity and differences between Six-Sigma and Lean ......................... 41
2.4. Total Quality Management (TQM) ..................................................................... 43
2.4.1. TQM definition ................................................................................................ 43
2.4.2. Concept of TQM ............................................................................................. 44
2.4.3. Essential elements of TQM ............................................................................ 44
2.4.4. TQM strategy and organisation change ......................................................... 45
2.4.5. The similarity and differences between Six-Sigma and TQM ......................... 45
2.5. Integration approach in quality management .................................................... 47

viii
2.5.1. The essential elements for incorporating the integrated approaches ............. 47
2.5.2. How methods and techniques are being integrated? ..................................... 48
2.5.3. The key motivation for the integrated approach to quality management ........ 49
2.5.3.1 The key drivers of the integrated approach in quality management ............. 49
2.5.4. What methods and techniques are often being integrated? ........................... 51
2.5.5. Project motivation for integrating the selected methods ................................. 52
2.5.5.1. The project motivation for integrating Lean and Six-Sigma ......................... 53
2.5.5.2. The project motivation for integrating Six-Sigma and TQM ......................... 55
2.6. The relationship between the organization and the methods selected .............. 57
2.6.1. The relationship between the organisation and TQM ..................................... 58
2.6.2. The relationship between the organisation and Six-Sigma ............................ 58
2.6.3. The relationship between the organisation and Lean manufacturing ............. 59
2.6.4. The relationship between the Six-Sigma and TQM ........................................ 59
2.6.5. The relationship between Lean manufacturing and Six-Sigma ...................... 60
2.7. Summary of the chapter .................................................................................... 61
Chapter Three: ....................................................................................................... 63
Research methodology ......................................................................................... 63
3.1. Introduction ....................................................................................................... 64
3.2. Introduction to research methodology ............................................................... 64
3.2.1. Research philosophy ..................................................................................... 65
3.2.2. Research approaches .................................................................................... 67
3.2.2.1. Quantitative research method ..................................................................... 68
3.2.2.2. Qualitative research method ....................................................................... 68
3.2.2.3. Mixed method ............................................................................................. 69
3.3. Research design and strategy .......................................................................... 69
3.3.1. Selection of the research methodology and techniques ................................. 70
3.3.1.1. Literature review ......................................................................................... 71
3.3.1.2. Questionnaire survey .................................................................................. 72
3.4. Samples selection ............................................................................................. 74
3.5. Data collection and analysis.............................................................................. 75
3.5.1. Integrity data analysis .................................................................................... 76
3.5.2. Descriptive analysis ....................................................................................... 76
3.6. Analytical procedures and validity of the research ............................................ 77
3.6.1. Statistical Packages for Social science (SPSS) ............................................. 77

ix
3.6.2. Analytical Hierarchy Process (AHP) ............................................................... 78
3.7. Pilot study ......................................................................................................... 78
3.8. Research validation .......................................................................................... 79
3.8.1. Reliability analysis .......................................................................................... 80
3.8.2. Validity analysis ............................................................................................. 81
3.8.2.1. Construct validity ......................................................................................... 81
3.8.2.2. Selection the measures of validity analysis ................................................. 82
3.9. Summary of the research methodology ............................................................ 88
Chapter Four: ......................................................................................................... 89
Development and validation of Lean Six-Sigma integrated model .................... 89
4.1. Introduction ....................................................................................................... 90
4.2. What makes Lean Six-Sigma different? ............................................................ 91
4.3. The requirements for Lean Six-Sigma implementation ..................................... 92
4.4. Critical Success Factors of Lean Six-Sigma ..................................................... 93
4.5. The proposed LSS integrated model ................................................................ 94
4.6. Validation of the LSS integrated Model ............................................................. 97
4.6.1 Research methodology ................................................................................... 97
4.6.2. Data collection and analysis ........................................................................... 98
4.6.2.1. Integrity data analysis ................................................................................. 99
4.6.2.2. Descriptive analysis .................................................................................. 103
4.7. Validation of the critical success factors ......................................................... 116
4.7.1. Results of factor analysis ............................................................................. 116
4.8. Discussion ....................................................................................................... 121
4.9. Conclusion ...................................................................................................... 123
Chapter 5: ............................................................................................................. 124
Development and validation of Six-Sigma and TQM integrated model ........... 124
5.1. Introduction ..................................................................................................... 125
5.2. Integrating Six-Sigma and TQM ...................................................................... 126
5.2.1. The critical components of Six-Sigma implementation ................................. 127
5.2.2. The critical components of TQM implementation ......................................... 129
5.3. The CSFs for successful implementation of the SS-TQM integrated model ... 130
5.4. Business excellence in quality management system ...................................... 131
5.5. The strategic plan for developing the SS-TQM integrated model .................... 132
5.6. The proposed SS-TQM integrated model for achieving business excellence . 133
x
5.7. Validation of the SS-TQM integrated Model .................................................... 136
5.7.1. Research methodology ................................................................................ 136
5.7.2. Data collection and analysis ......................................................................... 137
5.7.2.1. Integrity data analysis ............................................................................... 137
5.7.2.2. Descriptive analysis .................................................................................. 141
5.8. Validation of the critical success factors ......................................................... 152
5.8.1. Results of factor analysis test ...................................................................... 152
5.9. Discussion ....................................................................................................... 157
5.10. Conclusions .................................................................................................. 158
Chapter Six ........................................................................................................... 159
The AHP model for evaluating and prioritizing the key drivers of the
proposed Quality Management Integrated Framework .................................... 159
6.1. Introduction ..................................................................................................... 159
6.2. Integrating LSS model with SS-TQM model .................................................... 160
6.3. Identifying the key driver for developing the proposed management quality framework .............................................................................................................. 162
6.4. Analytical hierarchy process (AHP) ................................................................. 164
6.5. Development of the proposed AHP model ...................................................... 166
6.6. Validation of the proposed AHP Model ........................................................... 167
6.6.1. Data collection and analysis ......................................................................... 169
6.6.1.1 Respondents background results ............................................................... 169
6.6.1.2. Results of data generation ........................................................................ 170
6.6.2. Generating of the comparison matrix ........................................................... 170
6.6.3 Pairwise matrix evaluation ............................................................................ 174
6.6.3.1 Problem modelling ..................................................................................... 174
6.6.3.2. Results of the priority preference of sub-criteria with respect to main criteria .................................................................................................................... 176
6.6.3.3. Synthesizing the results ............................................................................ 177
6.6.3.4. Results of the priority preference of the global weights ............................. 177
6.6.4. Sensitivity analysis ....................................................................................... 178
6.5. Discussion ....................................................................................................... 183
6.6. Conclusion ...................................................................................................... 185
Chapter Seven ...................................................................................................... 186
Development of an integrated quality management framework for
manufacturing organisations (IQM-FW) ............................................................. 186
xi
7.1. Introduction ..................................................................................................... 187
7.2. The proposed integrated quality management framework .............................. 187
7.2.1. The main body of the framework .................................................................. 188
7.2.2. The main elements of the framework ........................................................... 188
7.2.3. The operational mechanism of the framework ............................................. 188
7.3. The implementation procedures of IQM framework ........................................ 190
7.3.1. Phase1: Strategic Planning. ......................................................................... 190
7.3.1.1. Strategic soft factors ................................................................................. 190
7.3.1.2. Strategic planning steps ............................................................................ 192
7.3.2. Phase 2; Measurement and evaluation ........................................................ 195
7.3.2.1. Data collection to evaluate the current process performance ................... 195
7.3.2.2. Evaluating the current process by studying the current VSM .................... 195
7.3.2.3. Evaluating the measurements to establish the performance capability ..... 196
7.3.3. Phase 3; Analysis and activation ................................................................. 196
7.3.3.1. Evaluating the quality system and identifying the significant problems ..... 196
7.3.3.2. Undertaken RCA to analyze the causes of the problems .......................... 196
7.3.3.3. Applying SPC to analyse the potential causes of the problems and detect the variation ........................................................................................................... 197
7.3.3.4. Identifying the gap between the current and the desired performance ..... 198
7.3.4. Phase 4; Improvement and monitoring ........................................................ 198
7.3.4.1. Identification of the objectives needed to conduct DOE ............................ 199
7.3.4.2. Conducting DOE ....................................................................................... 200
7.3.4.3. Analyse the results of DOE to obtain statistics significance ...................... 201
7.3.4.4. Evaluate the possible solutions ................................................................. 202
7.3.4.5. Identify the solution and analyse the risk .................................................. 202
7.3.4.6. Standardising the work and implementing the solution ............................. 202
7.3.4.7. Monitoring and enhancing the operation performance .............................. 203
7.3.5. Phase 5; Verifying and continuous improvement ......................................... 204
7.3.5.1. Creating and implementing a control plan ................................................. 204
7.3.5.2. Update the actions aimed at improvement to achieve high quality ........... 204
7.3.5.3. Document the quality issues ..................................................................... 204
7.3.5.4. Evaluating the operating performance and verifying the quality system ... 205
7.4. The CSFs for successful implementation of the proposed framework ............ 207
7.5. Conclusion ...................................................................................................... 208
Chapter 8 .............................................................................................................. 209

xii
Validation of the proposed framework ............................................................... 209
8.1. Introduction ..................................................................................................... 209
8.2. Research methodology ................................................................................... 210
8.3. Data collection and analysis............................................................................ 211
8.3.1. Integrity data analysis .................................................................................. 212
8.3.1.1. Reliability analysis ..................................................................................... 212
8.3.1.2. Validity test and validation the proposed framework ................................. 214
8.3.2. Descriptive analysis ..................................................................................... 215
8.3.2.1 Section A: Background information. ........................................................... 215
8.3.2.2. Section B: Validation of the proposed framework ..................................... 218
8.3.2.3. Evaluation the implementation procedures of the framework .................... 222
8.3.3. Evaluation the importance of the CSFs for the successful implementation of the proposed framework .................................................................................... 231
8.3.4. Validation of the CSFs for successful implementation the proposed framework .............................................................................................................. 232
8.3.4.1. Results of factor analysis .......................................................................... 233
8.4. Discussion ....................................................................................................... 236
8.5. Conclusion ...................................................................................................... 238
Chapter 9 .............................................................................................................. 239
Conclusions, recommendations, contributions to knowledge, research
limitations and future work ................................................................................. 239
9.1. Introduction ..................................................................................................... 240
9.2. Conclusions .................................................................................................... 240
9.2.1 Literature review ........................................................................................... 240
9.2.2. The proposed integrated LSS model ........................................................... 241
9.2.3 The proposed integrated SS-TQM model ..................................................... 242
9.2.4. Analytical hierarchy process model .............................................................. 244
9.2.5 The proposed integrated framework ............................................................. 245
9.3. Contributions to knowledge ............................................................................. 247
9.4. Research limitation ......................................................................................... 248
9.5. Recommendations for further research ........................................................... 248
References............................................................................................................ 250
Appendixes........................................................................................................... 265
Appendix A ............................................................................................................ 265
A-1. Questionnaire1; Evaluation the proposed LSS integrated model ................... 265

xiii
A-2: Questionnaire 2; Evaluation of the proposed SS_TQM Integrated model ...... 274
A-3: Questionnaire 3; Evaluation the proposed integrated quality management framework .............................................................................................................. 283
Appendix B ............................................................................................................ 292
Evaluating and prioritisation the main components of the framework .................... 292
Appendix C ............................................................................................................ 323
The rest of descriptive analysis of LSS integrated model ...................................... 323
Appendix D ............................................................................................................ 331
The rest of descriptive analysis of SS-TQM integrated model ............................... 331
Appendix E ............................................................................................................ 341
The rest of the descriptive analysis of the proposed framework ............................ 341
List of figures
Figure 2. 1. Phases of DMAIC ................................................................................ 33
Figure 2. 2. The project motivation for the integration of Lean and Six-Sigma ......... 54
Figure 2. 3. The project motivation for the integration of Six-Sigma and TQM ......... 57
Figure 3. 1. A nested figure of the research methodology ...................................... 65
Figure 3. 2 selection of the research methodology ................................................. 71
Figure 3. 3. The main steps for calculating factor analysis in this study ................... 87
Figure 4. 1. LSS conceptual model for manufacturing organisations ....................... 96
Figure 4. 2. Areas of industry represented by respondent's organisations............. 105
Figure 4. 3. Organisations location ........................................................................ 106
Figure 4. 4. The correlation among latent factor1 and CSFs ................................. 120
Figure 4. 5. The correlation among latent factor 2 and CSFs ................................ 121
Figure 4. 6. Respondents view on the validity of the proposed model ................... 122
Figure 5. 1. The components of TQM implementation process ............................. 129
Figure 5. 2. The strategic plan for integrating Six-Sigma and TQM ....................... 132
Figure 5. 3. Six-Sigma TQM integrated conceptual model ..................................... 135
Figure 5. 4. The correlation among latent factor 1 and CSFs ............................... 156
Figure 5. 5. The correlation among latent factor 2 and the CSFs .......................... 157
Figure 5. 6. Respondent's judgement with regard to the proposed model ............ 158
Figure 6. 1. The proposed multi criteria decision making model ............................ 167
Figure 6. 2. Respondent's information, years of experience .................................. 169
Figure 6. 3. Respondent's information, type of experience .................................... 170
xiv
Figure 6. 4. A hierarchal view of the entire structure .............................................. 174
Figure 6. 5. Pairwise comparison .......................................................................... 175
Figure 6. 6. The priority preference of the main criteria ......................................... 175
Figure 6. 7. . The priority weights of the sub-criteria with respect with strategic
planning .......................................................................................................... 177
Figure 6. 8. The priority global weights of the sub-criteria ...................................... 178
Figure 6. 9. The actual results of sensitivity study with respect to the goal ............ 180
Figure 6. 10. Five scenarios of sensitivity results of the first scenario ................... 181
Figure 6. 11. The priority weights of the strategic drivers with respect to the goal 184
Figure 7. 1. An integrated quality management framework for manufacturing
organisations .................................................................................................. 189
Figure 8. 1. Latent factor 1; strategic elements ...................................................... 236
Figure 8. 2. Latent factor 2; operational elements .................................................. 236
Figure 8. 3. Respondents judgment about the evaluation of the framework ......... 237
List of tables
Table 2. 1. Sigma levels, dpmo and yield of process (Pyzdek et al., 2014)………...31
Table 2. 2 The damdv methodology adopted from Mehrjerdi (2011)……………….34
Table 2. 3 Six-Sigma tools and techniques …………………………………………….35
Table 2. 4 The differences and similarities between Six-Sigma and Lean
manufacturing adopted from Andersson et al. (2006)…………………………….42
Table 2. 5 The similarity and differences between Six-Sigma and TQM adopted from
(Andersson et al., 2006)..................................................................................... 46
Table 2. 6 The methods and techniques are often found to be integratedthroughout the
literature, adapted from Johannes, (2011)…………………………………………52
Table 3. 1. A summary of philosophy considerations .............................................. 67
Table 3. 3. The main steps of data analysis ............................................................. 76
Table 4. 1. Reliability statistics ................................................................................. 99
Table 4. 2. Item internal correlation of the items measured ................................... 100
Table 4. 3. Item-total statistics ............................................................................... 101
Table 4. 4. Reliability statistics ............................................................................... 102
Table 4. 5. Item-total statistics ............................................................................... 102
Table 4. 6. Test statistics ....................................................................................... 103
Table 4. 7. Respondent's positions ........................................................................ 104
xv
Table 4. 8. KMO and bartlett's test ......................................................................... 117
Table 4. 9. Total variance explained ...................................................................... 117
Table 4. 10. Pattern matrix ..................................................................................... 118
Table 4. 11. Pattern matrix ..................................................................................... 119
Table 4. 12. Structure matrix .................................................................................. 120
Table 5. 1. Reliability statistics .............................................................................. 138
Table 5. 2. Item-total statistics .............................................................................. 139
Table 5. 3. Reliability statistics .............................................................................. 140
Table 5. 4. Test statistics ....................................................................................... 140
Table 5. 5. Organisation position ........................................................................... 142
Table 5. 6. Aria of industry ..................................................................................... 142
Table 5. 7. Country organisation location ............................................................... 143
Table 5. 8. KMO and bartlett's test ......................................................................... 153
Table 5. 9. Total variance explained ...................................................................... 153
Table 5. 10. Pattern matrix ..................................................................................... 154
Table 5. 11. Pattern matrix ..................................................................................... 155
Table 5. 12. Structure matrix .................................................................................. 156
Table 6. 1. Likert scale of relative importance ....................................................... 168
Table 6. 2. Comparison matrix of main criteria ...................................................... 171
Table 6. 3. Comparison matrix of sub-criteria with respect to strategic planning .. 171
Table 6. 4. Comparison matrix of sub-criteria with respect to measurement and
evaluation ....................................................................................................... 172
Table 6. 5. Comparison matrix of sub-criteria with respect to analysis and
activation ......................................................................................................... 172
Table 6. 6. Comparison matrix of sub-criteria with respect to improvement and
monitoring ....................................................................................................... 173
Table 6. 7. Comparison matrix of sub-criteria with respect to verification and
continuous improvement ................................................................................. 173
Table 7. 1. The main pillars of balanced scorecard................................................ 206
Table 8. 1. Reliability statistics ............................................................................... 212
Table 8. 2. Item-total statistics .............................................................................. 213
Table 8. 3. Reliability statistics ............................................................................... 213
Table 8. 4. Item-total statistics ............................................................................... 214
Table 8. 5. Test statistics ....................................................................................... 215
Table 8. 6. Organisation position ........................................................................... 216
xvi
Table 8. 7. Area of industry .................................................................................... 216
Table 8. 8. Organisations location .......................................................................... 217
Table 8. 9. The suitability/capability of the framework ............................................ 218
Table 8. 10. Ability of the framework to determine competitiveness and profit ...... 219
Table 8. 11. Ability of the framework to deal with quality problems ........................ 220
Table 8. 12. Ability of the framework for implementing in practice ......................... 221
Table 8. 13. Ability of the framework to achieve long term success ....................... 221
Table 8. 14. The completeness in the contents of the proposed framework .......... 222
Table 8. 15. Evaluation of the contents of strategic soft factors ............................. 223
Table 8. 16. Evaluation of the applicability of the soft factors of the strategic
planning in phase one ..................................................................................... 223
Table 8. 17. Evaluation of any soft factors missing and should be added to the
strategic planning phase ................................................................................. 223
Table 8. 18. Evaluation of the contents of the strategic steps for preceding the
planning process in phase one ....................................................................... 224
Table 8. 19. Evaluation of any missing in strategic steps and should be added to
the strategic planning phase ........................................................................... 224
Table 8. 20. Evaluation of the contents of phase two (measurement and
evaluation) ...................................................................................................... 224
Table 8. 21. Evaluation of the applicability of the contents in phase two to meet
the key target .................................................................................................. 225
Table 8. 22. Evaluation of any missing in the contents of measurement and
evaluation phase ............................................................................................. 225
Table 8. 23. Evaluation of the contents of phase three (analysis and activation) ... 226
Table 8. 24. Evaluation of the applicability of the contents in phase three capable
to meet the key target (analysis and activation) .............................................. 226
Table 8. 25. Evaluation of any missing in the contents of phase four of the
framework ....................................................................................................... 227
Table 8. 26. Evaluation of the contents of phase four of the proposed framework
(improvement and monitoring) ........................................................................ 227
Table 8. 27. Evaluation of the applicability of the contents in phase four capable
to meet the key target (improvement and monitoring) .................................... 228
Table 8. 28. Evaluation of any missing in the contents of phase four of the
proposed framework ....................................................................................... 228
Table 8. 29. Evaluation of the contents of phase five to meet the key target ......... 228
xvii
Table 8. 30. Evaluation of the applicability of the contents in phase five capable
to meet the key target (verification and continuous improvement) .................. 229
Table 8. 31. Evaluation of any missing information in the contents of phase five of
the framework ................................................................................................ 229
Table 8. 32. Evaluation of the soft implementation factors of the framework ........ 230
Table 8. 33. The soft implementation factors covering anything missing which
should be added ............................................................................................. 230
Table 8. 34. KMO and Bartlett's test ...................................................................... 233
Table 8. 35. Total variance explained .................................................................... 233
Table 8. 36. Pattern matrix ..................................................................................... 234
Table 8. 37. Structure matrix .................................................................................. 235

Chapter One Introduction
18
Chapter One:
Introduction
1.1. Introduction
The thesis in this introductory chapter presents the context for this research; it
starts with a brief background to the research and then states the aim and the
objectives of the research. In the final section, there is an outline of the structure
of the theses.
1.2. Background
Quality managers nowadays are usually overstrained to identify the proper
method for achieving the quality goals in their organisations. However, many
manufacturing organisations, particularly in the developing countries, are facing
many challenges with respect to improving the level of quality compared with
competitors Porter and Yegin (2006). In this regard, (Triki et al., 2006) stated
that such organisations often suffer from a lack of quality experience and
absence of a systematic approach towards organisation management.
Therefore, quality managers have been involved recently to determine the most
effective methodology for achieving goals concerning quality (Harmon, 2010)
also, Johannes (2013) stated that organisations can combine quality methods
and use it in parallel since synergies between quality management methods
exist. However, Johannsen (2011) clarified that integration becomes a means
for employing different quality methods and, therefore, can lead to value-
creating synergies. (Andersson et al., 2006) said integrated quality
management method is a method used to overcome weaknesses from the

Chapter One: Introduction
19
quality system. Thus, in response to those challenges that quality managers are
facing, integration quality management concept can bridge this gap and
overcome quality management problems and put the quality system of
manufacturing organisation in place more effectively. (Johannes, 2013) argued
that integrated quality management methods would be the key development in
today’s business environment. Therefore, the most effective quality methods for
an integrated approach according to Antony (2009) stated that many academics
and practitioners agreed that Six-Sigma is one of the superior quality initiatives
in terms of decreasing the defects and variations of the system. Demast (2004)
declares that Six-Sigma is the greatest complete strategy. Yang (2012) argues
that TQM is also classified as one of the best initiatives in terms of continuous
improvement and quality commitment with Cheng (2008) confirming that TQM is
the prime component of Six-Sigma.
Reichhart and Holweg, (2007) suggested that Lean manufacturing is another
effective method for simplifying the production lines and achieving the process
performance, though, Lean is also focused on achieving cost reduction through
the elimination of waste and fully utilise the workers' capabilities.
Finally, many critical factors of Six-Sigma, Lean and TQM can lead to the
formulation of a successful quality management framework (Andersson, 2006).
Therefore, this research focuses to develop an integrated quality management
framework to provide inputs and guides for the manufacturing organisation in
order to achieve effective improvement performance and sustainable
improvement

Chapter One: Introduction
20
1.3. Research questions
The general question:
How can manufacturing organisations develop and implement a quality
management framework which reaches its full potential through the use of a
manufacturing philosophy and quality management initiatives?
The sub-questions are all connected to the overall question:
What are the successful production methods and quality management
initiatives that can lead to developing an effective integrated quality
management framework? And how can be used together?
What is a powerful model that can be used to improve the manufacturing
processes and how it can be developed and validated?
What is the superior model that can be used for enhancing and unifying
the quality management system of manufacturing organisations? And how
can be developed and validated?
What are the main factors that can lead to combining the models selected
above in order to develop the integrated framework and how can be
implemented and validated?
1.4. Research aim
The research programme aims to develop an integrated quality management
framework for manufacturing organisations in order to eliminate the quality
critical issues and make the quality system in place more effective for the
organisations.

Chapter One: Introduction
21
1.5. Research objectives
1. To carry out a comprehensive literature review to establish current
knowledge and identify research gaps.
2. To identify the key drivers that can lead to a successful development of a
quality management framework, which consists of two models namely; Lean
and Six-Sigma integrated model and TQM and Six-Sigma integrated model.
3. To develop and validate Lean and Six-Sigma integrated model to improve the
processes in manufacturing organisations.
4. To develop and validate TQM and Six-Sigma integrated model to unify the
management system and achieve business excellence in a manufacturing
organisation.
5. To identify the key drivers that can lead to a successful integration between
Lean Six-Sigma model and Six-Sigma TQM model developed above to
produce a robust quality management system for manufacturing
organisations.
6. To develop and validate an appropriate framework by integrating Lean Six-
Sigma model and Six-Sigma TQM model for the manufacturing companies to
improve and modernise the quality system.
7. To identify the critical success factors that lead to a successful
implementation of the tools and techniques of TQM, Lean manufacturing and
Six-Sigma Methods in an integrated fashion.
8. To develop and validate an implementation procedure for the proposed
framework.

Chapter One: Introduction
22
1.6. Overview of the thesis
The thesis is organised into nine chapters relating to various research
objectives and the adopted research design as follows:
Chapter One: Introduction
This chapter provides an introduction to the research study, research questions,
aims and objectives, and an overview of the thesis structure and summary of
the chapter.
Chapter Two: Literature review
The chapter provides a comprehensive review of the literature on the following topics;
1. Introduction to quality management;
2. Quality management methods tools and techniques and the differences
between them;
3. The Six-Sigma initiative;
4. Lean manufacturing;
5. The differences and similarities between Six-Sigma and Lean;
6. The TQM method;
7. The differences and similarity between Six-Sigma and TQM;
8. The integrated approach in quality management, existing integration
approaches, methods and techniques often being integrated and how
methods and techniques are being integrated;
9. The project motivation for integrating Six-Sigma and Lean
10. The project motivation for integrating Six-sigma and TQM;
11. The critical success factors for the usage of each method mentioned
above and
12. The relationship between the proposed methods.
Chapter One: Introduction
23
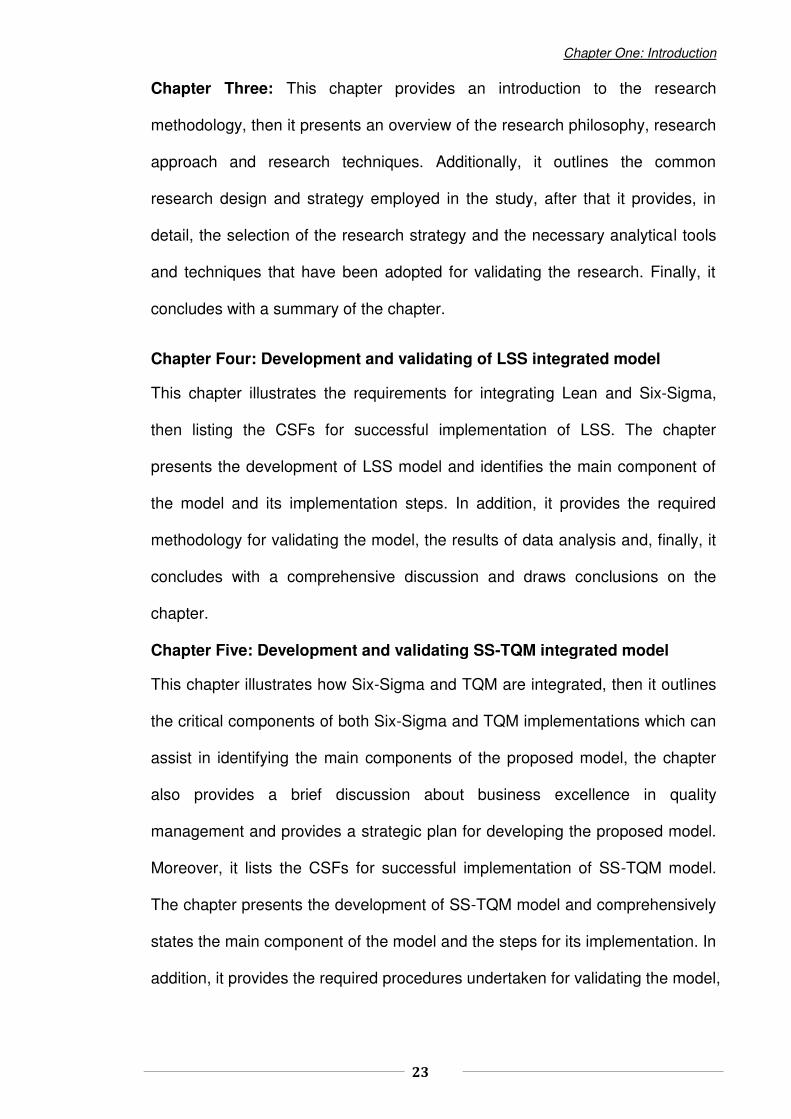
Chapter Three: This chapter provides an introduction to the research
methodology, then it presents an overview of the research philosophy, research
approach and research techniques. Additionally, it outlines the common
research design and strategy employed in the study, after that it provides, in
detail, the selection of the research strategy and the necessary analytical tools
and techniques that have been adopted for validating the research. Finally, it
concludes with a summary of the chapter.
Chapter Four: Development and validating of LSS integrated model
This chapter illustrates the requirements for integrating Lean and Six-Sigma,
then listing the CSFs for successful implementation of LSS. The chapter
presents the development of LSS model and identifies the main component of
the model and its implementation steps. In addition, it provides the required
methodology for validating the model, the results of data analysis and, finally, it
concludes with a comprehensive discussion and draws conclusions on the
chapter.
Chapter Five: Development and validating SS-TQM integrated model
This chapter illustrates how Six-Sigma and TQM are integrated, then it outlines
the critical components of both Six-Sigma and TQM implementations which can
assist in identifying the main components of the proposed model, the chapter
also provides a brief discussion about business excellence in quality
management and provides a strategic plan for developing the proposed model.
Moreover, it lists the CSFs for successful implementation of SS-TQM model.
The chapter presents the development of SS-TQM model and comprehensively
states the main component of the model and the steps for its implementation. In
addition, it provides the required procedures undertaken for validating the model,

Chapter One: Introduction
24
the results of data analysis and the final discussion are included at the end of
the chapter. Finally, the study concluded with brief conclusions on the chapter.
Chapter Six: Identifying and evaluating the key drivers for development of
the proposed framework
The chapter demonstrated how LSS model can be integrated with SS-TQM
model and shows how the key drivers for developing the proposed framework
were identified. It also provides brief discussion about AHP as a means for
assessing the key drivers of the proposed framework, then it presents the
development of AHP model for evaluating and prioritising the key components
of the framework, hence the required steps for validating the model which are
elaborated on, in detail, at the end of the chapter, concluding with a discussion.
Chapter Seven: Development an integrated quality management
framework for manufacturing organisations
The chapter provides in-depth information on the development of the proposed
framework, the main components of the framework and procedures for its
implementation; it includes the mechanism of the framework for attaining high-
quality performance and business excellence within manufacturing
organisations.
Chapter Eight: Validation of the proposed framework
This chapter discusses the main procedures that were undertaken for validating
the framework, the data collection and the main steps of data analysis which
are clarified. The results of data analysis are performed using SPSS-23 and are
provided in this chapter, the validity and reliability analysis used for validating
the framework and its implementation procedures are provided with an
adequacy discussion following.

Chapter One: Introduction
25
Chapter Nine: The final chapter includes; overall conclusions about the key
research findings, some recommendations with the research limitations for
further study highlighted. Finally, the contribution to knowledge is presented.

Chapter Two: Literature review
26
Chapter two: Literature review
2.1. Introduction to Quality management .............................................................................................................. 26
2.1.1. Definition and concept of Quality management .......................................................................................... 28
2.1.2. Quality management methods, tools and techniques ................................................................................. 29
2.1.3. The importance of quality tools and techniques .......................................................................................... 30
2.2. Six-Sigma Initiative ........................................................................................................................................ 30
2.2.1. What does Six-sigma mean? ...................................................................................................................... 31
2.2.2. Six-Sigma strategy ...................................................................................................................................... 32
2.2.3. Six-sigma methodology .............................................................................................................................. 32
2.2.4. Six-Sigma tools and techniques .................................................................................................................. 34
2.2.5. Six-Sigma and statistical thinking ............................................................................................................... 36
2.3. The Lean Manufacturing Approach ................................................................................................................ 36
2.3.1. The concept of Lean manufacturing ........................................................................................................... 37
2.3.2. Principles of Lean Manufacturing ................................................................................................................ 38
2.3.3. Lean tools and techniques .......................................................................................................................... 39
2.3.4. DMAIC methodology and Lean manufacturing ........................................................................................... 40
2.3.5. The similarity and differences between Six-Sigma and Lean ..................................................................... 41
2.4. Total Quality Management (TQM) ................................................................................................................. 43
2.4.1. TQM definition ............................................................................................................................................ 43
2.4.2. Concept of TQM ......................................................................................................................................... 44
2.4.3. Essential elements of TQM ......................................................................................................................... 44
2.4.4. TQM strategy and organisation change ...................................................................................................... 45
2.4.5. The similarity and differences between Six-Sigma and TQM...................................................................... 45
2.5. Integration approach in quality management ................................................................................................. 47
2.5.1. The essential elements for incorporating the integrated approaches .......................................................... 47
2.5.2. How methods and techniques are being integrated? .................................................................................. 48
2.5.3. The key motivation for the integrated approach to quality management ..................................................... 49
2.5.3.1 The key drivers of the integrated approach in quality management .......................................................... 49
2.5.4. What methods and techniques are often being integrated? ........................................................................ 51
2.5.5. Project motivation for integrating the selected methods ............................................................................. 52
2.5.5.1. The project motivation for integrating Lean and Six-Sigma ..................................................................... 53
2.5.5.2. The project motivation for integrating Six-Sigma and TQM ..................................................................... 55
2.6. The relationship between the organization and the methods selected .......................................................... 57
2.6.1. The relationship between the organisation and TQM ................................................................................. 58
2.6.2. The relationship between the organisation and Six-Sigma ......................................................................... 58
2.6.3. The relationship between the organisation and Lean manufacturing .......................................................... 59
2.6.4. The relationship between the Six-Sigma and TQM ..................................................................................... 59
2.6.5. The relationship between Lean manufacturing and Six-Sigma ................................................................... 60
2.7. Summary of the chapter ................................................................................................................................ 61

Chapter One: Introduction
27
2.1. Introduction to Quality management
Quality is a management philosophy developed over decades based on three
interrelated approaches which incorporate; business strategy, methodology,
tools and techniques. Many authors contributed to the development of that
philosophy including Deming, Juran, Ishikawa, Crosby, Shewhart, and
Feigenbaum (Juran, 1999). The key role of quality management is to identify
the opportunities for improvement within processes, products, and services in
order to accomplish high performance in operations and, thereby, satisfy
customer requirements (Vive (2005). As such, quality management has gained
considerable attention in the last three decades in order to enable organisations
to meet the required demand, satisfy customer needs and achieve competitive
advantages.
Therefore, many quality management methods have been developed such as
TQM, Six-Sigma and Lean manufacturing to facilitate the operation system and
achieve high-quality performance for manufacturing and services organisations
(Bhuiyan and Baghel, 2005). However, the literature shows that none of these
approaches is able to solve all of the quality issues for organisations when
adopted alone, whereas a hybrid model, such as LSS, is able to exceed the
improvement rates and achieve an excellence performance (Antony, 2009).
Consequently, integrated quality management methods become the new
effective quality management system in terms of attaining high-quality
performance and sustainable improvements (Antony, 2009; Johannes, 2013)

Chapter One: Introduction
28
2.1.1. Definition and concept of Quality management
Quality is a subjective term; each quality authors has own definition; however,
all definitions in the literature has the same objectives, the common definitions
of quality according to the quality gurus are;
“Non-faulty systems” (Deming, 2000)
“Fitness for use” (Juran, 1988)
And “Conformance to requirements” (Crosby, 1996)
(Deming, 2000; and Crosby, 1992) stated that quality in technical usage can
have two meanings; one the attributes, features, functions of product or
services that are applicable to satisfy the required needs of the customer, the
other is product and services free of errors, defects and any deficiencies. Juran
(1999,) further defined the meaning of quality overall as freedom of deficiencies
which means that a product, service and the whole processes are required to
be free of errors, defects and waste. In this sense, quality is the scope of an
organisation to achieve its main goals. In addition (Juran, 1999) stated high
quality enables companies to achieve customer satisfaction, meet product
scalable and achieve competitive advantage, to increase market share and
increase income. In order to achieve high quality, firms must be controlled the
following factors;
Reduce the error rate;
Decrease the rework;
Avoid or decrease the field failures;
Reduce customer dissatisfaction and
Improve delivery performance.

Chapter One: Introduction
29
2.1.2. Quality management methods, tools and techniques
De Mast (2004.pp199) defined quality methods suggesting; "improvement
strategy comprises a coherent series of concepts, steps, methodological rules
and tools that guide a quality professional in bringing the quality of a process or
product to unprecedented levels (breakthrough)". The most common quality
management methods developed and implemented in practice for over decades
are; TQM, Six-Sigma and ISO. However, quality management tools and
techniques are integrated means used for assessing the quality issues and
monitoring the operation performance, the quality tool is a device that has a
clear role and narrow usage, whereas quality technique has a wider application
(Mcquater, et, al., 1995; Johannes, 2013). According to (Mcquater, et, al., 1995)
classified the tools and techniques based on its applications and functions as
following;
Examples of tools
Cause and effect diagrams;
Pareto analysis;
Control charts;
Histograms and
Flowcharts..etc.
Examples of techniques
Statistical process control(SPC);
Quality function deployment (QFD);
Design of experiments and
Benchmarking.

Chapter One: Introduction
30
2.1.3. The importance of quality tools and techniques
Quality tools and techniques play an important role in terms of guiding an
organisation in achieving continuous improvement, Mcquater et al., (1995)
summarised the importance of quality tools and techniques in the manufacturing
process as follows:
For the evaluation and monitoring the process and product;
For the Involvement of teamwork in the improvement process;
To solve problems easily;
To help for sustaining continuous improvement;
To reinforce staff through problem-solving and
To improve the daily activity business process.
2.2. Six-Sigma Initiative
Six-Sigma is a management system based on statistical thinking developed by
Motorola in 1986, the main aim of Six-Sigma is to improve the quality output,
through reducing the variation in process and eliminating the defects in the
products as low as 3.4 parts per Million opportunities (PPMO) (Henderson and
Evans, 2000). Six-Sigma is a business improvement approach which focuses
on customer satisfaction, cycle time reduction and cost saving, it seeks to
eliminate the causes, errors, defects in both services and process (Keller, 2011).
In addition, it is a rigorous discipline based on data-driven, focused and highly
effective implementation using a set of statistical tools and techniques
(Henderson and Evans, J. R., 2000).

Chapter One: Introduction
31
2.2.1. What does Six-sigma mean?
Sigma (Ϭ) is a Greek letter used by statisticians for measuring the variability;
however, (Ϭ) also refers to the standard deviation measure, Six (6) is a number
refers to the number of the standard deviation on either side of the process
mean, where, in statistical science, the normal distribution for any sample data
comprises six standard deviations (Mehrjerdi, 2004). In addition, Mehrjerdi
(2011) stated that a Sigma level indicates the number of defects that are likely
to have occurred; however, the higher the Sigma level indicated that the
process attained the fewer the defects. Therefore, the Sigma process
corresponds with the defects level which must be 3.4 defects per million
opportunities (DPMO) or less based on the Six-Sigma target; table (2.1)
demonstrates the Sigma level corresponded with the DPMO and the expected
yield for each level.
Table 2. 1. Sigma levels, DPMO and Yield of process (Pyzdek et al., 2014)
Six-Sigma is several packages of statistic metrics and management strategies
integrated as a rigours discipline which can be divided into three parts; Strategy,
Methodology and Metrics (tools and techniques) (Snee and Hoerl, 2005).
Yield of process (%) DPMO Sigma level
68.26 690 000 1.0
95.46 308 000 2.0
99.74 66 8000 3.0
99.9936 6 210 4.0
99.99994 320 5.0
99.9999996 3.4 6.0

Chapter One: Introduction
32
2.2.2. Six-Sigma strategy
Snee and Hoerl (2005); Henderson and Evans (2000), Yang (2012) stated that
the ultimate goal of Six-Sigma is to enable organisations to deliver the greatest
value to the customer and employees; therefore, the key strategy of Six-Sigma
are:
Customer focus; means to understand the customer requirements proactively
and to take proper actions to fully meet the customer needs which is defined
and determined using CTQ techniques or QFD.
Reduce variation; the manufacturing and services process should be set up to
produce no much variation in order to meet customer needs. The set of
statistical and quality tools that are employed to control the variation within the
process
Reduce defects; the products and services must be produced or delivered free
of defects or maximum 3.4 DPMO.
Centred around the target; the focus is to produce superior results and to
obtain an unprecedented level of improvement (Six-Sigma breakthrough).
2.2.3. Six-sigma methodology
(Seen and Hoerl, 2005; Andersson et, al., 2006; Henderson and Evans .2000;
Kumar and Sosnoski, 2009)stated that Six-Sigma including two main
methodologies. DMAIC is the process improvement of Six-Sigma used for
improving the existing process, DAMDV is the other Six-Sigma methodology
used for developing and design new products or processes, these
methodologies are considered the roadmap of Six-Sigma deployment. Both
methodologies are integrated with statistical tools and techniques. However,
this study is focused more on the DAMIC process.

Chapter One: Introduction
33
DMAIC; stand for; Define, Measure, Analysis, Improve and Control.
DMAIC is considered the most powerful process of Six-Sigma in terms of problem-
solving, within existing process, where the power of DMAIC comes from the
effectiveness of the five phases: define, measure, analyse, improve and control.
The function and the mechanism of these steps are described in figure (2.1) below:
How can we start the process and what are priorities? Customer requirements and expectations Project goals and boundaries Process by mapping Business flow
Define
Control
Analysis
Improve
Measure
How the process is measured and how is it performing? Gather information (data collection) about the current situations Compare data to determine the errors and defects Assess the defects that generated Identify the area of problem
How can we identify the causes of defects?
Study the stage of quality effort to identify the root cause of the problems Evaluate the important cause of defectsIdentify the main variables that are most likely make the process variation
How can we remove the causes of the defects? Customer requirements and expectations Project goals and boundaries Process by mapping Business flow
How can we maintain the improvement?
Verify the key variables and evaluate their effects Modify the process variation to stay within the average
DMAIC phases
Figure 2. 1. Phases of DMAIC adopted from Henderson and Evans (2000)

Chapter One: Introduction
34
DMADV; stand for Define, Measure, Analyse, Design and Verify
DMADV is the second methodology of Six-Sigma focussed on improvement and
is similar to the DAMIC phases; however, DMADV includes two different
phases: verifying and design. DMADV is an improvement process that is
basically used to organise the process, or to develop, or design a new product.
It aims to obtain more accurate and effective findings and to achieve high-
quality performance free of deficiencies as well as to guarantee the incremental
improvement in the system. Seen and Hoerl (2005) stated that General Electric
company (GE) corporation developed the DMADV roadmap for the design of
projects which is termed Design For Six-Sigma (DFSS) and since that time it
has become the second methodology for design new product of Six-Sigma. The
DMADV process contains the five steps demonstrated in the table (2. 2) below:
Table 2. 2 The DAMDV methodology adopted from Mehrjerdi (2011)
DMADV Phases
Purpose
Define Identifying the customer requirements and the project goals
Measure Determine the characteristics and the specifications to fulfil
the customer’s needs
Analyse Evaluate the product design to satisfy the customer needs
Design Simplify the details of the product or process to fulfil the
customer needs
Verify Validate the system ability and the design performance to
verify the design’s capability and performance
2.2.4. Six-Sigma tools and techniques
The Six-Sigma initiative focuses on using the quantitative data, along with
process thinking to identify the variation in the process through the use of
statistical tools and techniques (Markarian, 2004). In response to that
(Henderson and Evans, 2000; Pande, et al., 2000) stated that, based on their
Chapter One: Introduction
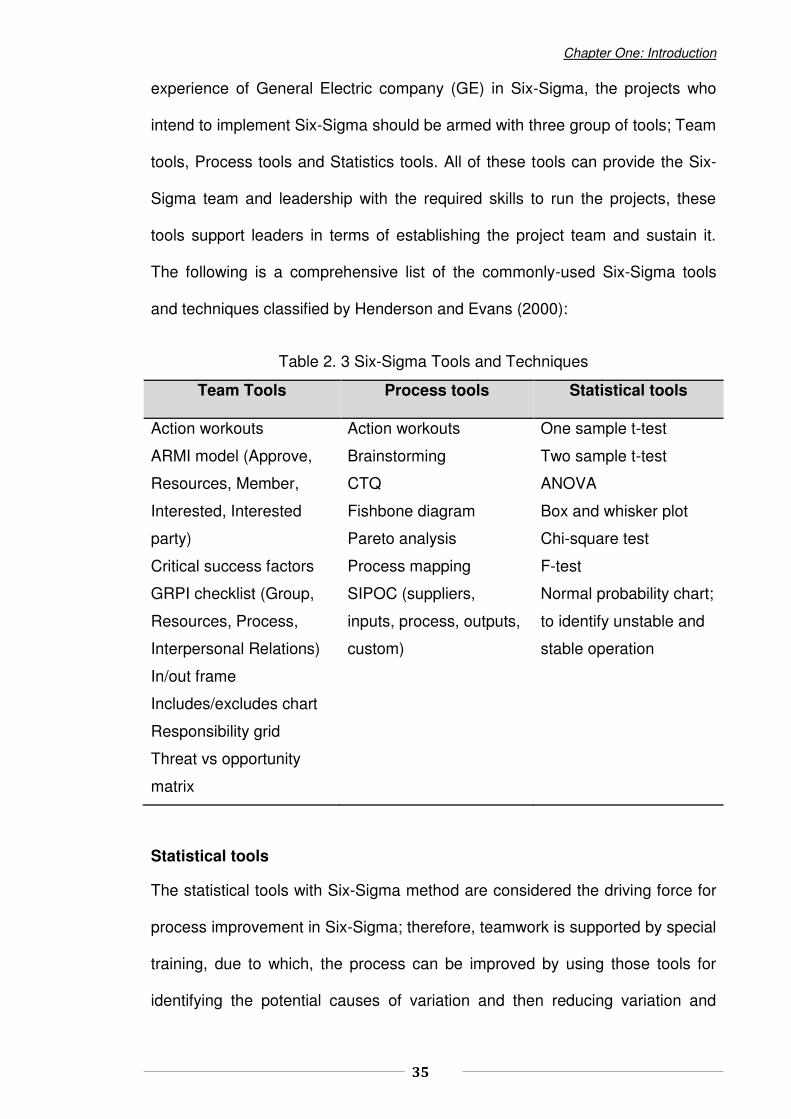
35
experience of General Electric company (GE) in Six-Sigma, the projects who
intend to implement Six-Sigma should be armed with three group of tools; Team
tools, Process tools and Statistics tools. All of these tools can provide the Six-
Sigma team and leadership with the required skills to run the projects, these
tools support leaders in terms of establishing the project team and sustain it.
The following is a comprehensive list of the commonly-used Six-Sigma tools
and techniques classified by Henderson and Evans (2000):
Table 2. 3 Six-Sigma Tools and Techniques
Team Tools
Process tools
Statistical tools
Action workouts
ARMI model (Approve,
Resources, Member,
Interested, Interested
party)
Critical success factors
GRPI checklist (Group,
Resources, Process,
Interpersonal Relations)
In/out frame
Includes/excludes chart
Responsibility grid
Threat vs opportunity
matrix
Action workouts
Brainstorming
CTQ
Fishbone diagram
Pareto analysis
Process mapping
SIPOC (suppliers,
inputs, process, outputs,
custom)
One sample t-test
Two sample t-test
ANOVA
Box and whisker plot
Chi-square test
F-test
Normal probability chart;
to identify unstable and
stable operation
Statistical tools
The statistical tools with Six-Sigma method are considered the driving force for
process improvement in Six-Sigma; therefore, teamwork is supported by special
training, due to which, the process can be improved by using those tools for
identifying the potential causes of variation and then reducing variation and

Chapter One: Introduction
36
defects. Consequently, as it can be seen from the table 2.3 the eight statistical
tools are the most frequently applied in practice (Henderson and Evans, 2000).
2.2.5. Six-Sigma and statistical thinking
Seen and Hoerl (2005) and Seow and Antony (2004) stated that the key driver
of Six-Sigma is to reduce the negative effects of process variation in two ways:
either by shifting the process variation to the desired target level or by reducing
the variation to around the process average. The result in both methods is to
obtain the minimal variation at the right average level; this is basically the key
successful driver for achieving the process performance in Six-Sigma; in short,
the best way to deal with the process variation is to use many statistics tools,
where the concept of statistical methods is to identify, measure and understand
the variation. On the other hand, statistical methods are based on the facts,
figures and data analysis, means, and decision-making which is driven by facts
and based on data. This is the key mechanism of Six-Sigma for eliminating the
defects and improve the process.
2.3. The Lean Manufacturing Approach
Due to the crises that faced the Japanese manufacturing after the Second
World War which disabled the Japanese market and significantly damaged
Japanese manufacturing. As a result, the increase in the rate of redundancy
and the decrease in the size and the value of the Japanese products in the
worldwide market forced the Japanese manufacturer to seek a systematic
approach to modernise the manufacturing system and to improve the value of
products (Drohomeretski et al., 2013). Subsequently, Lean manufacturing
emerged as manufacturing philosophy focused on eliminating all kind of wastes

Chapter One: Introduction
37
and smoothing the production flow, Lean was developed by the Toyota
Corporation based on the framework of Ford's mass production and the
available contributions to operation strategy made by industrialists of that time.
Lean was originally called Toyota production system (TPS) and, over the years,
evolved to just-in-time technique and, ultimately, becomes known as Lean
manufacturing, this philosophy enables manufacturing organisations to reduce
the production lead time and save a number of resources by producing the
required products based on the customer demand (Reichhart and Holweg,
2007).
2.3.1. The concept of Lean manufacturing
Lean manufacturing is defined as a manufacturing philosophy aiming to
eliminate the waste in the operation process and decreasing the number of
resources that are required to perform the manufacturing activities within
organisations (Papadopoulou and Ozbayrak, 2005). The technical definition of
Lean is the identification and removal of all none value-added activities. Lean
manufacturing is based on two concepts; firstly, to achieve cost reduction
through the elimination of waste and, secondly, to fully utilise the workers'
capabilities (Reichhart and Holweg, 2007). Therefore, the theory presented over
the year's shows that the result achieved by Lean includes minimising human
efforts, stocks, lead time, production space and its associated cost without
compromising on quality (Staatsa et al., 2011). The main focus of lean is to
eliminate all types of waste which are specified as anything in the process that
does not add value to the process and the product, the waste identified in seven
forms:
1. Over process;

Chapter One: Introduction
38
2. Over inventory;
3. Overproduction;
4. Rework;
5. Defects;
6. Waiting and
7. Motion.
2.3.2. Principles of Lean Manufacturing
Essentially, the main focus of the Lean manufacturing is to eliminate waste,
achieve continuous workflow; ensure better performance and establish a more
effective work place employing the exact workforce, taking less time, less
equipment and less space. Womack et al., (1990); and Womack et al., (2007)
stated that Lean manufacturing can be implemented through five steps:
Specify value
The first and the most important step in Lean is to focus on the customers and
their needs when specifying values because those values can be only defined
by the ultimate customer; this is vital step to avoid taking the wrong path when
designing or making products for customers.
Identify the value stream
In this stage, all the steps, process, actions and transaction of the production
line are drawn on a map (value stream mapping) from the supplier to the
customer, the aim is to evaluate and assess the current performance of the
system and identify any non-value added.
Flow

Chapter One: Introduction
39
Once the value specified and the value stream is mapped; at this point the work
must give way to the specific products, it is important that employees mentally
get used to producing in small lots to ensure the continues flow and to avoid
having a high level of inventory in between stations and eliminate time wasted
while waiting for the job. This ‘one-piece flow’ is the quickest way to get from
raw materials to finished goods.
Pull
In this step, the benefits of implementing the previous steps will be evident as,
instead of operating according to traditional sales forecasts, production is only
what customer requests. In this case, the company should not produce products
or services until customers place an order.
Perfection
The perfection stage is involved in looking back at mistakes while producing
and offering products to customers and, mainly, continuing to look for a possible
way of reducing the amount of effort, time, space and eliminate wasted.
2.3.3. Lean tools and techniques
Primarily, Lean manufacturing is a method which focuses on achieving
significant improvement in the business process through the elimination of all
wastes of resources and time across the whole business process, Sharam
(2003) stated that various tools and techniques employed by Lean Operation
and every tool and technique plays a role in eliminating the waste in order to
deliver improvement in a specific area; however, Value stream mapping (VSM)
is the key strategy technique of Lean manufacturing since, the key role of this
technique is to identify the current state of the system and draw the desired
Chapter One: Introduction
40
future state of the system, (Furlan, et al., 2011). In this regard, Wilson (2009)
stated that in order to implement Lean, the common tools and techniques that
the companies must be armed with are.
Problem diagnosis techniques; Contains the following techniques:
1. Pareto analysis.
2. Fishbone diagrams.
Quality tools:
1. Poka-Yoke (mistake proofing).
2. Failure Mode and Effective Analysis) (FMEA).
3. Statistics process control (SPC).
Process improvement techniques:
1. 5S (Sort, Sit in order, Shine, Standardise and Sustain).
2. Single Minute Exchange Die (SMED).
3. Visual controls.
2.3.4. DMAIC methodology and Lean manufacturing
DMAIC methodology is considered to be the driving force of Six-Sigma in terms
of problem-solving and sustaining the continuous improvement in particular of
an existing process, DMAIC is the most popular Six-Sigma methodology based
on the Deming cycle (Plan, Do, Check and Act). This cycle is used to improve
existing business process (Andersson, et al. 2006). The DMAIC methodology
has five phases in its improvement cycle integrated with robust tools and
techniques to overcome the quality problems within the system to smooth the
operation’s performance (Drohomeretski, et al. (2013).

Chapter One: Introduction
41
Lean manufacturing is a philosophy and strategy in which the product is based
on the customer demand, the philosophy here is that no product needs to be
produced unless demanded by the customer and, hence, the most powerful tool
associated with the pull system is the signal derived from the Kanban system
which controls the flow of the product stream. because of this, Lean
manufacturing is called a pull system or process improvement. It aims to
improve the process flow and eliminate non-value-added (Snee, 2010). Other
Lean tools such as 5S, VSM, TPM and others are related to the elimination of
waste and improving the process performance and, in doing so, obtain high-
quality output and improve the bottom line performance (Tomas, 2009).
2.3.5. The similarity and differences between Six-Sigma and Lean
In order to evaluate the differences and the similarities between Six-Sigma and
Lean, it is necessary to provide definitions and concepts of both approaches.
Common definitions for each method are provided by Andersson et al. (2006).
Six-Sigma is a business process that enables the organisation to improve the
bottom line through the daily monitoring and controlling the business activities in
such a way as to eliminate the defects and minimise resources use by
employing statistical methods while increasing the customer satisfaction.
Lean manufacturing is a manufacturing philosophy and business strategy
which aims to identify and eliminate the waste and focus on continuous
improvement through smoothing the process of production, based on the
customer demand in pursuit of perfection. It can be seen that the definitions are
different, whereas, the aim and the concept are somewhat similar, where both
concepts are aimed at minimizing a number of waste resources and obtaining a
continuous improvement, customer satisfaction and the financial results.

Chapter One: Introduction
42
Dahlgaard (2006) argued that these approaches have the same origin; both of
them are based on the development of the quality management in Japan after
the second world war; however, the way of achieving the objectives for each
concept are different. Andersson et al. (2006) studied the similarity and
differences between Six-Sigma and come up with the comparison as in shown
in table 2.4 below.
Table 2. 4 The differences and similarities between Six-Sigma and Lean
manufacturing adopted from Andersson et al. (2006)
Concepts Six-Sigma Lean manufacturing
Origin The origin is a quality evaluation by Japanese practitioners. However, developed by Motorola and dispersed by General Electric in the US
The origin is quality evaluation by Japanese practitioners and Toyota
Theory
(Aim)
Reducing the defects to less than 3.4 DPMO by decreasing the process variation using effective methodologies
Eliminating the waste in the process through flowing the product based on the customer demand
Process
(Concept)
Focusing on reducing the process variation and improve processes
Focusing on improving the flow in the process and removing all kind of waste
Approach Systematic, based on planning monitoring controlling and improvement (Project management)
Systematic, based on planning monitoring controlling and improvement (Project management)
Methodologies
(DMAIC Phases) Define, measure, analyse, improve, or (DMDIV)
Pull system (based on the customer demand) evaluating by value stream mapping, flow improvement and perfection
Tools Advanced statistical and analytical tools (The advanced tools integrated with methodologies)
More Analytical tools integrated with quality tools
Primary effects Increasing the organisation bottom line and high financial orientation
Reducing the lead time in order to improve the flow by removing the waste
Secondary effects Achieving financial performance Achieves customer satisfaction by increasing the quality and reducing the cost of products and make the price of the products competitive

Chapter One: Introduction
43
2.4. Total Quality Management (TQM)
Total quality management (TQM) is a philosophy and a method of optimisation
and integration of all functions of the business, it aims to achieve continuous
improvement and satisfy customer needs. ‘Word total’ refers to everything
involved in the organisation, it also covers all the business activities - staff,
process, jobs, resources and time (Powell, 1995). TQM was introduced at the
beginning of 1980 as a quality management system, particularly in
manufacturing field, many writers on quality such as Deming, Ishikawa, Crospy
and Juran have made many contributions to its development (Juran, 1995).
Mainly, TQM is not limited to manufacturing sectors; it also valid to services
sectors. TQM is about changes to management in order to improve the quality
output by focusing on three aspects: structural change, technological change
and cultural change (Boaden, 1997). In response to that Hellsten and Klefsjö
(2000) define TQM as management philosophy based on the core values of
customer focus, continuous improvement, process orientation and employees’
commitment. Consequently, TQM has become one of the powerful quality
initiatives in the field of quality management.
2.4.1. TQM definition
Many authors and researchers have discussed TQM to reach a common
definition; a management philosophy that pursues to achieve continuous
improvement in the whole process in order to achieve a high quality of product
or services that are compatible with the customer requirements (Mehra et al.,
2001). Boaden (2007) believed that quality is a degree of excellence and TQM
is a management strategy which contains the application of quantitative
methods and teamwork to improve the quality of product and services.
Chapter One: Introduction
44
2.4.2. Concept of TQM
TQM is a quality management method by which the employees and
management involved in the continuous improvement of the manufacturing and
/or services process, TQM offers effective strategic tools and techniques to
achieve improvement in quality and in the performance of the organisation
(Mehra et al., 2001). In this regard, Hellsten and Klefsjö (2000) argued that the
techniques in TQM are methods to achieve high-quality output for example self-
assessment, process management and product design. These tools are useful
for analysing the data to support the decision-making. Therefore, TQM covers
all business aspects not only manufacturing; however, every function can be
affected and improved on (Lewis and Smith (1994).
2.4.3. Essential elements of TQM
Deming (1994) believed that TQM system aims to increase internal and external
customer satisfaction and reducing amount of resources, in this context Hellsten
and Klefsjö (2000) pointed out that TQM is a method based on two precepts
which are planning and communication; however, Boaden (1997) discussing the
principle and practices of TQM, (ibid) declared that TQM consists of seven main
elements:
Top management involvement and commitment; everyone involved in the
organisation goals and the customer needs; therefore, everyone should be
aware of time, process and final product output.
Continuous improvement; TQM is not an end state, it never finishes.
Customer focus; All staff should be aware of the core of TQM which satisfy
customer needs.

Chapter One: Introduction
45
Competitive benchmarking; employees should seek the best and trying to
match it or exceed it.
Employees Empowerment; teamwork has wide responsibility and authority to
improve the process and production in every aspect of the organisation.
Team work; people in the organisation are incorporated for the purpose of
problem-solving and group ownership of the process.
Knowledge of TQM tools; all staff must be trained in quality control and
improvement techniques.
2.4.4. TQM strategy and organisation change
Strategy, in general, refers to identifying the vision and defining the
organisational goals along with monitoring the implementation of the process
which is the key role of the leadership. While Senge (1990) lists the key quality
of leadership as the ability to build a shared vision. Bergman and Klefsjö (2002)
advise the strategy of TQM must be built on the management's continuous
commitment. On the other hand, TQM is considered as a comprehensive
organisation-wide change (Bon and Mustafa, 2013), thus the process change is
integrated with TQM philosophy into the organisation, and also the process
change is based on the training and developing the employees along with
changes to organisation structure, values attributes and management style. All
of these factors should be taken into consideration once TQM is implemented.
2.4.5. The similarity and differences between Six-Sigma and TQM
Many quality authors have discussed TQM and Six-Sigma, however, Andersson
et al., (2006) stated that there are many similarity and differences between Six-
Sigma and TQM in many aspects such as origin, theory, process view,

Chapter One: Introduction
46
approach, methodologies, tools and effects. Table (2.5) shows the author
comparisons between Six-Sigma and TQM.
Table 2. 5 The similarity and differences between Six-sigma and TQM adopted
from (Andersson et al., 2006)
Concepts Six-sigma TQM
Origin Quality evaluation by Japanese practitioners; However, developed by Motorola and dispersed by General Electric in the US
The origin is the evaluation of quality by Japanese practitioners.
Theory Reducing the defects to less than 3.4 DPMO by decreasing the process variation using effective methodologies.
Focusing on satisfying the internal and external customers by armed the employees with quality management tools and methodologies to achieve customer satisfaction.
Process Focusing on reducing the process variation and improve processes.
Focusing on the improvement by organising the process to produce the customer satisfaction.
Approach Project management. Employees commitment with the target of the organisation.
Methodologies
(DMAIC phases) for process improvement (DMADV) for developing new product and/ or process.
(PDCA cycle) Problem-solving strategy.
Tools Advanced statistical and analytical tools (The advanced tools integrated with methodologies).
Analytical and statistical tools.
Primary effects
Increasing the organisation bottom line and high financial oriented.
Increase or exceed customer satisfaction.
Secondary effects
Achieving financial performance. Obtains customer loyalty and improves the whole performance.

Chapter One: Introduction
47
2.5. Integration approach in quality management
The integration approach in quality management is a method of combining one
or more quality management methods or techniques to overcome the difficulties
in a quality system and to achieve competitive advantages. Gijo and Rao (2005)
defined integration quality management as a means of combining the
appropriate quality management methods and techniques to attain improvement
in the operation process. Bendell and Tony (2006) said that integration quality
management demands discipline when improving the business process to avoid
the weaknesses in the quality management methods. The meaning of
integration in quality management, according to Johannes (2013), is the parallel
the use of the applicable quality management methods in order to achieve
significant improvement in the business process while adding value to the
quality system.
2.5.1. The essential elements for incorporating the integrated approaches
Johannes (2013) discussed a holistic approach for integration method in quality
management, it can be seen from his study that the basic elements for
formulating the integration method in quality management comprises of five
main elements:
The synergy between quality management methods; a stage of eliminating
the weaknesses of certain quality management methods which enables an
exchange the results between them which resulted in value added.
Procedure model; the sequences of procedures that are taken as the basis
for modification and improvement of the quality system.
Consistency; the consistency refers to compatibility and the harmony in the
behaviours of the methods combined and the procedure model used; it is a

Chapter One: Introduction
48
logical sequence of the activities in the procedure model which assure that
the tasks are performed and contradictions are avoided.
Completeness; that all the component of the proposed methods must be
adequate to fulfil the integration between quality management methods which
including method elements, procedure model and the consistency in the
procedure model.
Value adding; adding value to the quality system means that to develop the
activities of the whole process in which to improve the quality of products and
services and, hence, to satisfy the customer requirements.
2.5.2. How methods and techniques are being integrated?
Essentially, the possible approaches to integration in quality management are
either integrating methods with methods, techniques with techniques or
methods with techniques (Johannes, 2011). Therefore, the literature shows that
the common mechanism of the integrated method in quality management is
based on the possibility of the following motivations; elimination of the
weaknesses in the methods or techniques, the occurrence of synergies
between the homogeneity methods and or techniques and the prerequisite of
enhancing one method to another in the way to exchange the results (Pfeifer et
al, 2004). This view supported by Johannes (2011) who stated that elimination
of the weaknesses and the possibility of occurrence of the synergies among the
methods serves as the key trigger for the integrated approach.

Chapter One: Introduction
49
2.5.3. The key motivation for the integrated approach to quality
management
Johannes (2013) stated that there are four key motivations for integrated
approaches in quality management:
Eliminating the existing weakness in quality management methods and
techniques. The weaknesses and the failings in the quality management
methods and techniques is a critical indication encourage for integrating with
other methods to eliminate those weaknesses and failings.
The existence of synergies between Quality Management Methods and
Techniques; The synergies between quality management methods are
considered the backbone of the integration approach when the synergy is the
stage of exchanging the results between QMMs and techniques which result
in value added.
One method is an existing prerequisite enhancing another one; Whatever the
weaknesses in any method are irrepairable or if it can be eliminated by
another method in a successive way, then methods or techniques need to be
integrated
Fear of missing trends in quality management; This concern that areas of
quality management are flawed or absent can be a key factor that plays an
important role in the way to improve the process in quality management
2.5.3.1 The key drivers of the integrated approach in quality management
Despite the different ways of combining the methods or techniques; the
mechanism of the integrated method is the same Johannsen (2011) stated.
That, based on the integrated models discussed by many theories, the

Chapter One: Introduction
50
integration between quality management methods or techniques can be
incorporated by examining three stages;
Evaluating the quality methods and techniques in terms of homogeneity.
Deriving the synergies between quality management methods and
techniques.
Ensuring and verifying the requirements of the integrated method are being
met (the essential elements of the integration approach).
2.5.3.1.1. Evaluating the methods and techniques for integrated readability
In this stage, quality management methods or techniques are being evaluated
based on their concepts and essential elements to identify the similarity and
differences through which it can be identified to what extent the methods or
techniques are interrelated, this view is supported by De Mast (2004) who
stated that the quality management methods can be compared based on the
following factors in order to identify its eligibility for integration (steps, rules,
concepts, tools).
2.5.3.1.2. Deriving the synergies between quality management methods
Once quality management methods or techniques are selected the second step
is to derive the synergies from the methods, where the synergy is considered
the foundation of the integrated approach. Johannes (2011); however, to
address the question of how to derive the synergies between methods or/and
techniques, adopted four factors from the literature which are frequently used to
achieve the synergies between the quality methods, these factors are
considered the key steps to incorporate the synergies and hence formulating
the integrated approach, the four steps focused to derive the synergies which
are;

Chapter One: Introduction
51
Evaluate the weaknesses and strengths of quality management methods to
derive the synergies.
Find out the common core concept between quality management methods to
derive synergy.
Use the strategy of (PDCA or DMAIC) cycle to enhance the activities of other
method and to generate the procedure model.
Use the proper quality techniques to enhance one method from another.
2.5.4. What methods and techniques are often being integrated?
According to Johannes (2011) stated that the integration between quality
management methods and techniques can be formulated by three ways;
Integrating methods with methods, integrating methods with techniques and
Integrating techniques with Techniques. Johannes (2013) stated that Lean Six-
Sigma is the most frequently integrated model discussed in the literature during
the last two decades and the results of those studies demonstrated the validity
of the integrated models. The view was supported by (Pfeifer et al., 2004;
Sharma, 2003; Shahin, 2004; Revere et al., 2004 and Clegg et al., 2010; Ehie
and Sheu, 2005) who discussed the integration of Six-Sigma and ISO 9000 as
well as Six-Sigma and Lean management. However, table 2.6 below
demonstrated the most integrated quality methods and techniques discussed in
the literature, where column one shows integrating methods with methods, two
methods with techniques and three techniques with techniques.
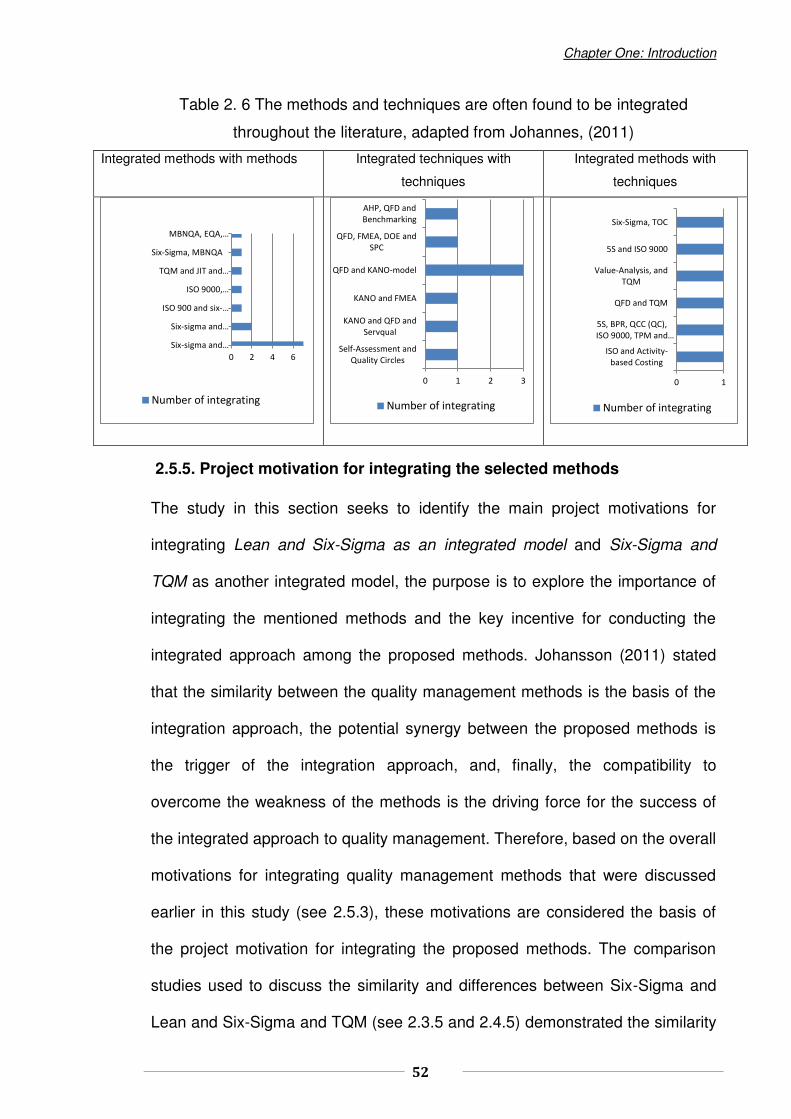
Chapter One: Introduction
52
Table 2. 6 The methods and techniques are often found to be integrated
throughout the literature, adapted from Johannes, (2011)
Integrated methods with methods Integrated techniques with
techniques
Integrated methods with
techniques
2.5.5. Project motivation for integrating the selected methods
The study in this section seeks to identify the main project motivations for
integrating Lean and Six-Sigma as an integrated model and Six-Sigma and
TQM as another integrated model, the purpose is to explore the importance of
integrating the mentioned methods and the key incentive for conducting the
integrated approach among the proposed methods. Johansson (2011) stated
that the similarity between the quality management methods is the basis of the
integration approach, the potential synergy between the proposed methods is
the trigger of the integration approach, and, finally, the compatibility to
overcome the weakness of the methods is the driving force for the success of
the integrated approach to quality management. Therefore, based on the overall
motivations for integrating quality management methods that were discussed
earlier in this study (see 2.5.3), these motivations are considered the basis of
the project motivation for integrating the proposed methods. The comparison
studies used to discuss the similarity and differences between Six-Sigma and
Lean and Six-Sigma and TQM (see 2.3.5 and 2.4.5) demonstrated the similarity
0 2 4 6
Six-sig a a d…
Six-sig a a d…
ISO 9 a d six-…
ISO 9 ,…
TQM a d JIT a d…
Six-Sigma, MBNQA
MBNQA, EQA,…
Number of integrating
0 1 2 3
Self-Assessment and
Quality Circles
KANO and QFD and
Servqual
KANO and FMEA
QFD and KANO-model
QFD, FMEA, DOE and
SPC
AHP, QFD and
Benchmarking
Number of integrating
0 1
ISO and Activity-
based Costing
5S, BPR, QCC (QC),
ISO 9 , TPM a d…
QFD and TQM
Value-Analysis, and
TQM
5S and ISO 9000
Six-Sigma, TOC
Number of integrating
Chapter One: Introduction
53
between these approaches. The project motivations for integrating the selected
methods are summarised in the following section.
2.5.5.1. The project motivation for integrating Lean and Six-Sigma
As discussed earlier in this research, it is clear from the literature that Lean
manufacturing and Six-Sigma are the most frequently integrated methods
studied. Johannes (2011) stated that the integration between Lean and Six-
Sigma was conducted by 7 studies with the aim to improve the process and
eliminate the weaknesses of both methods, most of the studies concluded that
Six-Sigma with DMAIC methodology can serve as the key driver for process
improvement and weed out the quality issues, a view supported by Chen, Li and
Shady, (2010); Bendell (2006) Brett and Queen (2005). Therefore, both
methods are similar and each one can complete the other in many respects.
However, a number of motivations for integrating Lean and Six-Sigma can be
observed based on the similarities and differences study (discussed in 2.3.5.).
The key project motivations for integrating Lean and Six-Sigma are as follows.
In terms of the process planning and management strategy: DMAIC
technique is the key methodology that offers the opportunity for quality
improvement which can draw a robust strategy for improving the business and
operation processes using a set of tools and techniques, the view supported by
Salah et al. (2010). Andersson et al., (2006) agreed that Lean and Six-Sigma
can be used to enhance each other by using DMAIC strategy to achieve the
organisation's objectives effectively.
In terms of evaluating the process performance; Value stream mapping
(VSM) with Lean tools and techniques combined with DMAIC strategy can
enhance the operation process and obtain high performance. Andersson et al.,
(2006); Thomas et al. (2008); Salah, (2010) agreed that value stream mapping

Chapter One: Introduction
54
(VSM) with DMAIC methodology might be used as a platform for assessing the
operation process and Six-Sigma tools and techniques which can be the right
strategy for improving the process performance.
In terms of simplifying the quality problems and sustaining continuous
improvement; Integrating Lean tools and techniques with the advanced
statistical tools of Six-Sigma can be another motivation for integrating both
methods to overcome the fears of complicity and obtaining high performance.
Tomas et al. (2008); Andersson et al. (2006) stated that companies intended to
implement LSS to develop, what can be termed, the process of quality
enhancement which must be armed with specific tools and techniques such as
Six-Sigma statistics.
In terms of the process planning
and management strategy
The project motivation
for integrating Lean and Six-sigma
DMAIC technique is a robust strategy for improving the business and achieve the objectives effectively
1
3
4
5
In terms of evaluation the process
performance
In terms of simplifying the quality problems and sustaining
continuous improvement
2
The
integrated
approach
between
Lean and
Six-Sigma
The strategic focus of both methods are interrelated to each other focusing on customer needs and continues
improvement
Tools and techniques of both methods are the process
power of enhancing the integration approach
The improvement strategic of six -sigma DMAIC eligible to modify the difficulties and to attain sustainable improvements
DMAIC improvement strategy combined with VSM and the other LSS tools and
techniques can create the process power
of LSS improvement
Figure 2. 2. The project motivation for integrating Lean and Six-Sigma
Chapter One: Introduction
55
2.5.5.2. The project motivation for integrating Six-Sigma and TQM
Based on the above concept, the key motivation for integrating Six-Sigma and
TQM can be surmised into the three main motivations; the existing similarity
between Six-Sigma and TQM, the potential synergy between both methods and
the applicability of the methods to overcome its weaknesses.
The similarity between Six-Sigma and TQM; Snee, (2010); Johansson,
(2011); Andersson et al., (2006) agreed that similarities between both methods
exist, as the objectives, concept and the methodology of the methods are
similar; where the objectives of both methods is to drive out the defects, errors
and variation in the products and use the process to satisfy customer
requirements and improve ‘the bottom-line’, the concepts of both methods are;
focusing on customer needs, focusing on process and are based on premise
that the data be used to attain high operation performance and continuous
improvement, the methodology of the methods are also same where TQM
employs the PDCA technique and Six-Sigma utilises the DMAIC strategy in
which DMAIC is already developed based on the PDCA cycle.
The existence synergies between Six-Sigma and TQM; There is a
consensus among the quality authors who are concerned with integrating Six-
Sigma with TQM that the synergy between both methods exists since the
essential elements of both approaches can complement each other and
overcome the existing weakness. (Yang, 2010; Bendell, 2006; Yang et al.,
2007; Yang et al., 2011) Its methodologies are intermingled in a manner which
can provide a robust strategy for the success of the quality system and, finally,
the tools and techniques of both methods are relatively similar, which can be
worked as key drivers for eliminating the critical issues within the system.
Chapter One: Introduction
56
The capability of one method to be prerequisites for another method;
Antony (2009) discussed the difference between Six-Sigma and TQM in a panel
of Academics, experts and practitioners. The study concluded that TQM is a
method that requires enhancement in many aspects during the implementation
stage, for example, TQM used, in practice, a less efficient strategic roadmap for
obtaining better results when compared with Six-Sigma which employed DMAIC
and DMADV. Andersson and Torstensson (2006); and Klefsjo et al. (2001)
stated that Six-Sigma can embrace TQM as a way to overcome many
difficulties by combining and using strategic tools and techniques; moreover,
when Low (2001) and Ho (1996) discussed the implementation of TQM, both
studies agreed that TQM required a stepwise implementation of certain
methods and techniques to obtain better results. Therefore, Six-Sigma can be
used as the baseline when integrating with TQM and this may also be another
motivation for success.

Chapter One: Introduction
57
In terms of the similarity between
Six-Sigma and TQM
The project motivation
for integrating Six-sigma and TQM
The, Aims, objectives and the concepts are similar in which represent the bases of the integration approach
1
3
4
5
The existence synergies between Six-
Sigma and TQM
the applacability of one method
prerequisite for another
2The process improvement of both methods are
interrelated to each other focusing on continues
improvement
Tools and techniques of both methods are the process
power of enhancing the integration approach The integrated approach between
Six-Sigma
and TQM
The improvement strategic of six -sigma DMAIC eligible to modify the difficulties and to success the integration approach
The empirical studies and the literature shows booth methods can be embraced each other in
the way to overcome the existing difficulties
Figure 2. 3. The project motivation between Six-Sigma and TQM
2.6. The relationship between the organization and the methods
selected
In this part of the research, the study intends to identify the relationship between
Six-Sigma, Lean and TQM and the organisation in practice. A number of studies
have provided a clear evidence and confirmed that these methods are related to
each other in many aspects and many authors indicated the benefits that can
be achieved if the methods are integrated.

Chapter One: Introduction
58
2.6.1. The relationship between the organisation and TQM
According to (Miles et al., 1978 pp547) "the organisation is both an articulated
purpose and establishes a mechanism for achieving it". Additionally, the initial
activities and the aim of the organisation are elements defined by the owners of
the organisation, whereas the strategic planning includes; a definition of the
vision, implementation of the strategy and monitoring and controlling of the
process performance are other elements associated with the management
method of the organisation. Srinidhi (1998) stated that the organisation is a set
of interlinked processes, the change of these processes is considered to be the
foundation of the improvement; Accordingly, the efficient organisations must be
armed with the effective quality management method in order to achieve
competitive advantages. (Srinidhi, 1998). Based on this concept it can be seen
that there is a direct link between TQM and the organisation. Prajogo and Sohal
(2006) found there is a positive relation between TQM and the organisation in
practice since TQM establishes a system and culture that proves fertile for the
organisation and for innovation. Srinivasu et al. (2010) determined that TQM is
integrated program permeating the entire organisation.
2.6.2. The relationship between the organisation and Six-Sigma
Six-Sigma as quality management method offers the organisation an effective
organisational culture, where the certified experts (Master Black belts, Black
belts and Green belts) lead the improvement projects (Srinivasu et al., 2009). In
this context Kumar et al., (2008) stated that Six-Sigma provides a clear change
of tangible results in many organisations in practice, moreover, it is a powerful
method which provides DMAIC methodology that led the organisations in
practice to attain incremental improvements (Srinivasu et al., 2009). In addition,

Chapter One: Introduction
59
Cronemyr (2007) cited further benefits that Six-Sigma provides; a company-
wide strategy, an improvement program and a toolbox to deploy Six-Sigma in
the organisation, Hammer (2002, p. 32) warns: "Six-Sigma should be a part of
process management not the other way around". Based on this concept it can
be said that there is a logical and positive link between Six-Sigma and the
organisation, Cronemyr (2007, p. 55) argued that this was always an intrinsic
feature; "Six Sigma is a methodology for making breakthrough improvements, It
was never intended as a system for managing quality in an ongoing manner,
nor was it intended to define the proper criteria for world-class quality
management".
2.6.3. The relationship between the organisation and Lean manufacturing
Lean manufacturing is another method which has a significant relationship with
the organisation in practice and, in particular, in the manufacturing field, which
is focused on adding value to the system by eliminating the waste and
achieving perfection (Snee, 2010), Lean manufacturing was developed by
Toyota as a way of organising manufacturing in order to achieve improvement
in most economic ways, this can be seen in the positive relationship between
the manufacturing organisation, Lean manufacturing and process performance
(Thomas et al., 2008). Andersson et al. (2006) support, suggesting there are
many reasons for introducing the Lean concept and its tools to the organisation
as it makes a substantial contribution to cutting costs and providing competitive
advantages.
2.6.4. The relationship between the Six-Sigma and TQM
Concerning the relationship between Six-Sigma and TQM as quality
management methods, various authors agreed that TQM is useful philosophy
Chapter One: Introduction
60
for management if it is planned properly and implemented, whereas Six-Sigma
is program that seeks to decrease the defects in every product, process and
transaction by using effective tools and techniques focusing on the process
output (Black and Porter;1996, Flynn and Saladin;2006; Srinivasu et al., 2019;
Snee, 2004). In addition, Hammer (2002) stated that Six-Sigma has its rules in
TQM; while, Six-Sigma goes beyond TQM by employing the strategy of DMAIC,
on the other hand, Antony (2009) said that Six-Sigma does not depend on TQM
structure but it can empower the organisation to implement TQM. Based on this
concept, despite the number of differences between these approaches in its
strategies and methodologies, there are many related factors due to the
significant commonalities, the view can be supported by Antony (2009) that Six-
Sigma and TQM are not the same; however, there is no a critical difference
between these methods to quality management.
2.6.5. The relationship between Lean manufacturing and Six-Sigma
Finally, it can be seen, from many studies, that Lean manufacturing and Six-
Sigma are two methods focusing on process improvement by eliminating the
waste and defects in the product and process, the aims of these concepts are
the same and the strategy of achieving their objectives are similar (Andersson
et al., 2006). Moreover, Snee (2010) stated that both Lean and Six-Sigma have
a similar concept providing tools and methodology for changing processes and
improve performance, Snee concludes that those programs can be integrated to
overcome their limitations and making improvements to a business process.
Therefore, it can be said that Lean and Six-Sigma are interrelated with each
other due to the similarity in their principles concepts and methodology
(Andersson et al., 2006). They (ibid) also identified that the five principles and
Chapter One: Introduction
61
the aim of Lean production, as well as the principles and tools behind Six-Sigma,
are embedded in the principles, concepts and tools of the holistic management
philosophy called TQM. This is another indication that Lean Manufacturing has
a positive relation with TQM initiative as both methods are focusing on process
improvement and continuous improvement.
2.7. Summary of the chapter
The chapter began with an introduction to quality management as the main
subject of the research and, then, followed by the definitions and the importance
of quality management methods and techniques which are the key components
of any quality management system. In the second part, the review conducted
above provides details including clarification about definitions, concepts,
components and the key tools and techniques of the main quality management
methods in the study; Six-Sigma, Lean manufacturing and TQM, moreover, a
comparison between the emerging quality methods provides, in detail, the
strengths and weakness of each concept and the most common distinctive
features are covered in order to clarify to what extent these methods can be
compatible with each other. The review of the literature showed that there is a
general agreement among the authors and the academics that the proposed
methods can be integrated and the synergy between them can occur.
The third part of the literature review, discussed the integrated approaches
within quality management, which is the main mechanism of this study - to
develop the proposed models and the framework - the study of the integrated
approach included; definitions of the key terms, the main elements of the

Chapter One: Introduction
62
integration method, the requirements of the integration method and the
motivations of the integration approach in quality management.
Furthermore, the review of the literature discussed in detail, the important
factors that can lead to developing the proposed models and the framework.
These included; identifying the existing integrated approach, the methods and
techniques which are often integrated, the project motivation for integrating Six-
Sigma, TQM and Lean, the CSFs for the usage of each method, in addition, the
critical relationships between the Organisation, Six-Sigma, Lean and TQM.
Finally, based on the review conducted above, the study argued that the
research intends to apply the concept of the integration of quality management
methods providing new means for developing quality management systems in
recent years. The context of the section is directly relevant to the research
questions of this thesis because it forms the cornerstone for the development of
the proposed framework and its components. The next chapter, chapter (3), will
focus on the research methodology applied in this study.
63
Chapter Three:
Research methodology
3.1. Introduction .................................................................................................................................... 64
3.2. Introduction to research methodology ............................................................................................ 64
3.2.1. Research philosophy................................................................................................................... 65
3.2.2. Research approaches ................................................................................................................. 67
3.2.2.1. Quantitative research method .................................................................................................. 68
3.2.2.2. Qualitative research method .................................................................................................... 68
3.2.2.3. Mixed method ........................................................................................................................... 69
3.3. Research design and strategy ....................................................................................................... 69
3.3.1. Selection of the research methodology and techniques ............................................................. 70
3.3.1.1. Literature review ....................................................................................................................... 71
3.3.1.2. Questionnaire survey ............................................................................................................... 72
3.4. Samples selection .......................................................................................................................... 74
3.5. Data collection and analysis .......................................................................................................... 75
3.5.1. Integrity data analysis ................................................................................................................. 76
3.5.2. Descriptive analysis .................................................................................................................... 76
3.6. Analytical procedures and validity of the research ........................................................................ 77
3.6.1. Statistical Packages for Social science (SPSS) ......................................................................... 77
3.6.2. Analytical Hierarchy Process (AHP) ........................................................................................... 78
3.7. Pilot study ....................................................................................................................................... 78
3.8. Research validation ........................................................................................................................ 79
3.8.1. Reliability analysis ....................................................................................................................... 80
3.8.2. Validity analysis ........................................................................................................................... 81
3.8.2.1. Construct validity ...................................................................................................................... 81
3.8.2.2. Selection the measures of validity analysis ............................................................................. 82
3.9. Summary of the research methodology ......................................................................................... 88

Chapter Three: Research Methodology
64
3.1. Introduction
This chapter presents the research methodology adopted throughout the
research study, the chapter starts with an introduction to research methodology,
and it provides an overview of the research philosophy, research approach,
then the research design and strategy. Accordingly, the study provides the
selection of the research methods and techniques employed for conducting the
research. Finally, it explains the analytical procedures used for validating the
research
3.2. Introduction to research methodology
The Oxford English Dictionary Coed (2004) defines research as "the systemic
investigation into and study of materials and sources to establish facts and
reach new conclusions". Other authors described research as systematic
procedures and organised efforts to investigate a certain problem that needs a
solution (Neuman, 2006; McNeill and Chapman, 2005; Sarantakos, 2012).
Moreover, research methodology is defined as an art developed through skills
of inquiry, experimental design, data collection, analysis and measurements
Greenfield (1996). In addition, Arbnor and Bjerke (2008) stated that it is a way
to indicate how the methods are constructed and how the framework is being
developed. Moreover, Robson and Mccartan (2016) observed that the research
strategy methods and techniques must be appropriately selected to address the
research questions.
However, research methodology comprises a number of academic procedures
that are applied to investigate a particular area of study. Therefore, Remenyi
(1998) indicates that, whatever the methods selected, the research should be
systematic rigorous, integrated and focuses, Remenyi et al., (1998) stated that

Chapter Three: Research Methodology
65
the essential drivers of selecting the effective research methodology include;
the topic of the research, the research questions and the available resources.
Therefore, in the research methodology model developed by Kagioglou et al.,
2000), the research methodology can be divided into three main interrelated
schemes which are; research philosophy, research approach and research
techniques as in figure 3-1 below.
Research Philosophy[Ontology and Epistemology]
Research Approach[Qualitative, Quantitative and Mixed Approach]
Research techniques[Literature review, Experiments,
Questionnaire Surveys, Observation, etc.]
Research Philosophy[Ontology and Epistemology]
Figure 3. 1. A Nested Research Methodology adopted from Kagiogluo et al.
(2000)
The research philosophy constitutes the outer section of the pillar which guide
and energise the research approaches and research techniques, where the
research approaches comprise qualitative methods, quantitative methods and/
or mixed method. Research techniques including literature review, experiment
design, survey questionnaires, interview and observation.
3.2.1. Research philosophy
According to (Saunders., 2009), the research philosophy is a comprehensive
term related to the development of the knowledge and the nature of the
knowledge, essentially the research philosophy is based on assumptions which
the researcher viewing the area of being studied, these assumptions are
considered the basis of the research methods and strategy that the researcher

Chapter Three: Research Methodology
66
selected. The view supported by Flowers (2009) who stated that when
research is undertaken the vital point is to consider different paradigms and
concerns of the research philosophy, these considerations will influence the
way in which the researcher the research is designed until the conclusion of the
study. Many authors believe that there are two main philosophical schools in
social science and engineering research; Ontology and Epistemology
(Kagioglou et al., 2000; Bryman,2004; Flowers, 2009). Each one contains
different paradigms that influence the way of thinking about the research
process including topics selection, questions formulation, methods adopted and
research design.
Bryman and Cramer (2005) clarified that Ontological philosophy is concerned
with the nature of reality, in other words, it is a way of thinking that reflects an
interpretation of an individual about constitutes a fact, the ontology philosophy is
divided into realist and relativist paradigms. The Epistemology philosophy is
concerned with possibility, nature, sources and the limitations of the knowledge,
it seeks to answer the question of how the researcher perceives its aim and
gains knowledge about it. The Epistemology philosophy comprises two main
approaches; interpretivism and positivism. Table 3.1 below summaries the main
philosophy consideration.

Chapter Three: Research Methodology
67
Table 3.1. A summary of philosophy considerations (Bryman, 2005; Fizgerald
and Howcroft, 1998)
Ontological consideration
Realist (objectivism)
External world comprises pre-existing
hard and tangible structures.
Structures exist independent of
individual’s ability to acquire
knowledge.
Relativist (Subjectivism)
The existence of multiple realities is a
subjective construction of the mind.
Socially-transmitting terms vary across
different languages and cultures.
Epistemological considerations
Positivist
The application of natural science
methods to the study of social reality
beyond the world conforms to laws of
causation and complex issues can be
reduced through reduction.
Interpretivist
The absence of universal truth and
emphasis on the realism of context.
Understanding and interpretation come
from researcher's own frame of
reference
The most important philosophy paradigm in such study is epistemology; in
which one paradigm is interpretivist which focuses on the development of
knowledge and the building of knowledge by generating ideas through
observation and interpretation using the qualitative approach (Love et al., 2002).
The other approach is positivist, which focuses on the development of
knowledge by investigating the reality, evaluation and observation the facts
using quantitative approach (Blumberg et al., 2005).
3.2.2. Research approaches
In order to provide an effective justification for the methods selected to conduct
the research, it is important to discuss the main approaches to managing the
research methodology (Saunders et al., 2012). The research approach is
concerned with types of methods employed to conduct the research (Blumberg

Chapter Three: Research Methodology
68
et al., 2005). There are three common research methods; the quantitative
research method, qualitative research method and mixed research method
(Saunders et al., 2012).
3.2.2.1. Quantitative research method
Quantitative method is defined as; an inquiry into a social or human problem,
based on testing a hypothesis or a theory composed of variables, measured
with numbers, and analysed with statistical procedures in order to determine
whether the hypothesis or theory holds true Creswell (2013). The aim of the
quantitative approach is to study the relationship between different concepts or
to investigate a certain situation of a specific subject by adopting the techniques
of natural science (Saunders et al., 2009). Accordingly, the quantitative
approach is based on numerical measurements and analysis using statistical
and/or mathematical methods (ibid). The most commonly used quantitative
research is experimental research and survey research, the advantage of
quantitative methods, particularly the questionnaire survey, is that it is faster
and more economical compared with the other methods. However, using the
quantitative approach particularly in social science has been described as being
rigid and providing less detailed information (Bryman and Bell, 2003).
3.2.2.2. Qualitative research method
Qualitative methods are defined as a study or a research using a data collection
process, such as interviews, and data analysis procedures, the categorisation of
data, which produces non-numerical data, Saunders et al., (2009) stated that
the role of the qualitative method seeks to understand, in depth, the behaviour
or action of certain discipline and help to explain the reason for implementing
that action. Qualitative research is based on gathering the significant
information from a group of people or individual, who are involved in the
Chapter Three: Research Methodology
69
relevant issue, in which the researcher is investigating (McNiell and Chapman,
2005). Mainly the data obtained through the qualitative research is categorised
into two groups of research which are; exploratory and attitudinal (Saunders et
al., 2012). Exploration is used when the research is limited in resources in the
main area hence, the interview technique is, usually, the most suitable
technique to collect the data. Attitudinal research; is used to investigate views
and perceptions towards of certain object, where the object refers to a factor,
variable or question.
3.2.2.3. Mixed method
Both methods quantitative and qualitative research methods are combined to
conduct a research, Saunders et al., (2009) stated that the research method
can be either conducted sequentially or concurrently; concurrently, means that
the research method is included from one phase of data collection and analysis,
the point of this design is to enable both of results to be interpreted together to
provide more comprehensive responses to the research questions. Furthermore,
the methods can also be used equally or un-equally dependant on the purpose
of the research; the priority varies between qualitative or quantitative method
and also depends on the preferences of the researcher or the expectation of
directors of the research or the organisation. Sequential, means that the
research conducted in more than one phase of data collection and analyses the
point that the researcher planned to expand on the findings by following one
method with another (Saunders et al., 2012).
3.3. Research design and strategy
Saunders et al., (2012) defined research design as a plan or action as to how
the study is going by answering the research questions. The guide for

Chapter Three: Research Methodology
70
developing any research methodology is to select the suitable research strategy
that should completely address the research questions (Creswell, 2013).
Therefore, the research design starts from the research questions and provide
an appropriate strategy to deliver the research aim and objectives. Additionally,
the research strategy mainly includes; sampling, methods and data collection
techniques, additionally, analytical procedure techniques for analysing the data
collected in order to find out the research results. The sensible decision for
selecting the appropriate methodology must be taken based the purpose of the
study and answering the research questions with the available resources
(Robson and McCartan, 2016), thereby selecting the appropriate research
strategy and effective data collection technique depends on several factors and
conditions including; the research situation, the types of the research questions,
the types and size of data required, and the available resources (Yin, 2003;
Binti Kasim, 2008).
3.3.1. Selection of the research methodology and techniques
The aim of this research is to develop an integrated quality management
framework to improve and modernise the quality system within manufacturing
organisations, based on the purpose of the research, research questions and
the availability of the resource. The research methodology selected include; the
position of the research paradigm for this study is epistemological philosophy
and the research tends more to positivism (favouring the quantitative approach).
The nature of this study is to explore the insight and notion of manufacturing
organisations towards the quality management system and to identify the
effective quality system in practice. Therefore, the approach selected suits the
research questions and fulfils the research aim and objectives, Hair et al.,
(2008) stated that the key strategy of the survey is to enable the research study

Chapter Three: Research Methodology
71
to obtain quantitative and/or qualitative data with full description and inferential
statistics provided, moreover Saunders et al., (2009) argue that quantitative
research method is considered a highly effective approach that can lead to
obtaining reliable and valid results. (Figure 3.2)
Research Approach[ Quantitative approach ]
Research techniques[Literature review, Questionnaire
Surveys]
Research Philosophy[Epistemology]
Figure 3. 2 Selection of the research methodology
The research techniques employed in this study comprise of the literature
review and three different functions of questionnaire surveys as well as a multi-
criteria decision making technique (Analytical Hierarchy Process), (Farrell,
2011) assures the questionnaire can be considered an efficient and reliable
technique to collect the required data, which enables the researchers to gather
data from many respondents within a relatively short timeframe. Three different
questionnaires have been developed and applied to gain the practitioners and
academics insight and information to validate the proposed models and the
framework. Another questionnaire was used to collect the required data for
applying a Multi-Criteria decision-making technique (AHP) in order to evaluate
and prioritise the main components of the framework.
3.3.1.1. Literature review
Lewis and Ritchie (2003) said that term ‘literature’ refers to any sources of
published data; these are called, in research methodology, secondary data, the

Chapter Three: Research Methodology
72
key role of the literature is to explore the required items of secondary data
which is necessary to address the research questions, Lewis and Ritchie (2003)
listed some sources of secondary data; articles in journals, magazine,
newspaper books, reports, conference papers, located on internet. The
literature review is undertaken to address the main research questions that are
required to identify the key drivers developing the proposed models and the
framework, the main methods deeply covered in the literature review are quality
management methods, tools and techniques, Six-Sigma, Lean manufacturing,
TQM and the Integrated approach in quality management methods as well as
the CSFs of the aforementioned methods.
3.3.1.2. Questionnaire survey
Meadows (2003) stated that the key role of the questionnaire survey is that the
questions, methods and the data collected must be able to reflect the objectives
of the investigation, the purpose of the questionnaire is to translate the research
objectives into particular questions, the responses to these questions must
provide data for answering some of the research questions. Based on this
concept this study included three different questionnaires, each one designed,
with some consideration, to cover all the issues that are required to attain the
research investigations in order to achieve the research objectives, the
questionnaires in this study have been sent through a Google survey to a host
of management employees spread across different manufacturing organisations
around the globe.
What makes the questionnaire efficient and reliable?
The good questionnaire design is critical to the success of a survey. Meadows
(2003) stated that selecting the appropriate questions, design the questions in a

Chapter Three: Research Methodology
73
coherent order, selecting the correct scales and using the right questionnaire
format are all critical points to success the survey and obtaining reliable data.
Thereby, Robson, et al. (2016) stated the key characteristic of questionnaire
design are:
Questions should be clear, specific, short and easy to fill in.
Questions must be aimed, coherent and motivated to provide information.
Questions should be free of ambiguity.
The questionnaire must have good design and layout.
The questionnaire should respect the privacy of the respondents.
The questionnaire must use clear and reliable scales and instruments.
3.3.1.2.1. Questionnaire 1
This questionnaire is designed and sent to the participants to collect the data in
order to verify, validate and develop the first Lean Six-Sigma integrated model
proposed for manufacturing organisation, the aim of the questionnaire is to
validate the proposed model, its suitability for manufacture within an
organisation and identifying the CSFs and barriers to successful implementation
of LSS in those organisations. The target population was selected, and the
sample size was identified to conduct the survey.
3.3.1.2.2. Questionnaire 2
This questionnaire is designed to collect data in order to verify, validate and
develop the proposed Six-Sigma TQM integrated model for manufacturing
organisations, the aim is to investigate the suitability of the proposed integrated
Six-Sigma TQM model for achieving business excellence within manufacturing
organisations. This questionnaire was designed for a different purpose; to
collect the required data from professionals and experienced employees in the

Chapter Three: Research Methodology
74
available manufacturing organisations and from academics related to the topic.
The sample size was identified, and the survey was conducted and sent to the
respondents through electronic emails.
3.3.1.2.3. Questionnaire3
This questionnaire was designed to collect the primary data in order to verify,
validate and develop the proposed framework, the aim is to investigate the
suitability of the proposed integrated quality management framework to improve
and modernise the quality system within manufacturing organisation, the
questionnaire was designed in the form of Google survey and distributed
through emails, the participants' selection and the target population was
conducted in the same way of the previous models.
3.4. Samples selection
Sampling is a procedure or process of selecting units (managers, academics,
employees and larger organisations) from a population of interest, a sample
size essentially should be large enough to provide an appropriate number of
participants from the population in order to positively affect the results (Patton,
2005). Saunders et al., (2012) clarified that there are two types of sampling
techniques which is; probability sampling and non-probability sampling. In
general, the probability sampling is required to include a random selection, for
example, elements in the population. Non-probability does not; however, non-
probability does select the participants and their characteristics are based on
the purpose of the research, furthermore, it does not require a statistical
estimate.
The characteristics of the population selected are based on the concept above,
the sampling selection of this research is non-probability sampling and

Chapter Three: Research Methodology
75
purposive sampling; therefore, the target population that has been chosen for all
questionnaires are quality professionals, practitioners, experts, and academics
from various manufacturing organisations and academic education. The
numbers of participants involved in this study were fair-enough to provide
adequate feedback to develop and validate the proposed models and the
framework, where the percentage of the participants in each questionnaire was
relatively high and acceptable (Saunders et al., 2009). See the research
methodology for each model and the framework.
3.5. Data collection and analysis
The data collected from each questionnaire were conducted at a different period
of time; however, the data collected in each questionnaire was reviewed for
completeness and accuracy and underwent several pre-analyses checks on the
quality of data through visual checks and data screening, see data collection
and analysis in each model and the framework, subsequently, the data was
coded and entered into SPSS for producing descriptive and inferential analysis.
Therefore, in order to provide a robust and structured analysis, the collected
data in each questionnaire was organised into three steps summarised in Table
3.2 below.
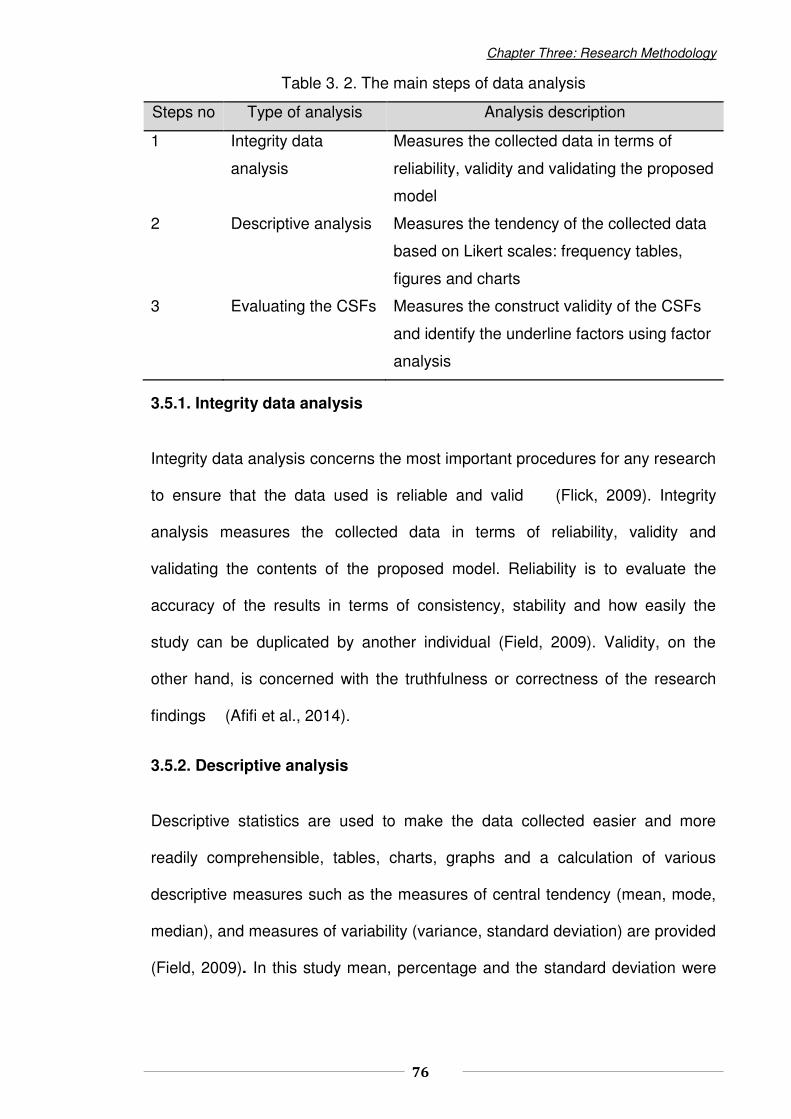
Chapter Three: Research Methodology
76
Table 3. 2. The main steps of data analysis
Steps no Type of analysis Analysis description
1 Integrity data
analysis
Measures the collected data in terms of
reliability, validity and validating the proposed
model
2 Descriptive analysis Measures the tendency of the collected data
based on Likert scales: frequency tables,
figures and charts
3 Evaluating the CSFs Measures the construct validity of the CSFs
and identify the underline factors using factor
analysis
3.5.1. Integrity data analysis
Integrity data analysis concerns the most important procedures for any research
to ensure that the data used is reliable and valid (Flick, 2009). Integrity
analysis measures the collected data in terms of reliability, validity and
validating the contents of the proposed model. Reliability is to evaluate the
accuracy of the results in terms of consistency, stability and how easily the
study can be duplicated by another individual (Field, 2009). Validity, on the
other hand, is concerned with the truthfulness or correctness of the research
findings (Afifi et al., 2014).
3.5.2. Descriptive analysis
Descriptive statistics are used to make the data collected easier and more
readily comprehensible, tables, charts, graphs and a calculation of various
descriptive measures such as the measures of central tendency (mean, mode,
median), and measures of variability (variance, standard deviation) are provided
(Field, 2009). In this study mean, percentage and the standard deviation were

Chapter Three: Research Methodology
77
used to analyse the results on the date it was collected as shown in the
following sub-sections.
3.6. Analytical procedures and validity of the research
This research, as mentioned above, is designed for being conducted through
three stages, the first stage is to develop and validate the first proposed model,
the LSS integrated model; the second stage is to develop and validate the SS-
TQM integrated model. The final stage includes two sub-stages; one applying
Multi-Criteria decision making (AHP) to prioritise and evaluate the main
components of the framework, the second sub-stage is to develop and validate
the proposed framework which is based on the integration of both models.
Therefore, the two data analysis techniques used as analytical procedures for
analysing the primary data in this study are; SPSS software and AHP technique
using Expert Choice software version 11. These techniques are, generally,
considered to be efficient and suitable techniques for interpreting and analysing
the quantitative data in the research (Saunders et al., 2012) and (Saaty,1980).
The techniques are:
3.6.1. Statistical Packages for Social science (SPSS)
SPSS is analytical and predictive software package used to analyse the
quantitative data, SPSS is one of the most utilised software for the analysis of
quantitative data, it provides various types of statistical analysis and how to
interpret data, Field (2013) stated that SPSS is a technique designed to assess
and analyse numerical data which is mostly collected through a series of
questions in form of questionnaire. Therefore, this software is selected as a

Chapter Three: Research Methodology
78
reliable and an effective technique for analysing the quantitative data from this
research collected in questionnaire1, questionnaire2 and questionnaire3.
3.6.2. Analytical Hierarchy Process (AHP)
AHP is selected as an analytical procedure to evaluate and prioritise the
components of the proposed framework. The Analytical hierarchy process is a
multiple-criteria decision-making technique used for organising and analysing
complex decision-making (Vaidya and Kumar 2006). AHP is based on
mathematics and psychological procedures which enables the users to
categorise the priorities and make the best decision by minimising the complex
decisions, the technique relies on computing a series of pair-wise comparisons
and then analysing the results. In order to apply AHP, the questionnaire survey
is designed for the purpose of AHP to collect the required data form
professionals and academics related to the topic, the aim is to evaluate and
decide upon the strategic quality management elements that should form the
integrated quality management performance.
3.7. Pilot study
According to Collis et al. (2013) pilot studies are a crucial means to pre-test and
evaluate the questionnaire survey or the interview in terms of the contents,
clarity and the design of the questions. The aim of the pilot study is to provide
feedback to the researcher which enable detection of any ambiguity and provide
the opportunity to refine the survey, assisting in establishing the content validity
(Sauders et al., 2009), the main purpose of the pilot test is to:
Identify whether the questionnaire is easily understood.
Ensure that all the questions are completely clear and understandable.

Chapter Three: Research Methodology
79
Ensure that the rating scales are understandable.
Determine how long it would take to complete the survey.
Make an initial reliability and validity assessment regarding the
measurement scales.
Therefore, a pilot study had been done for each questionnaire before
distribution to ensure that the questions are free from the ambiguity and raise
the validity of the questionnaires. Three procedures have been completed to
successfully conduct the pilot study in this research; the questioners were
discussed with number of PhD students related to the topic in terms of the
clarity of questions, question contents, questionnaire layout and design, some
modifications have been made including corrections to some questions, a
shortening of the survey and a refinement to the questionnaires layout. Second,
the questionnaires were sent to some PhD and MSc students related to the
topic to assess the reaction of the participants and to estimate the time required
to complete the survey. Finally, the questionnaires were discussed and
reviewed by the director of the study in the aforementioned aspects; the
feedback received from the supervision meant the questionnaires were further
redesigned and modified.
3.8. Research validation
In order to validate and verify the framework and the findings of the research
study, a number of steps and procedures have been conducted to obtain
reliable and valid information and the knowledge to confirm the validity of the
research. According to AERA, APA, and NCME, (1999) validation refers to the
process of systematically collecting evidence to provide justification for the set
of inferences that are intended to be drawn from scores yielded by an

Chapter Three: Research Methodology
80
instrument. Thereby, the most common measures that can provide evidence for
validating any research study are reliability and validity analysis (Flick, 2009),
Reliability is used to evaluate the accuracy of the results in the categories of
consistency, stability and how easily the study they can be duplicated by
another individual, whereas validity is concerned with the truthfulness or
correctness of the research findings (Feld and William, 2002; Afifi et al., 2014;)
3.8.1. Reliability analysis
The reliability test of an instrument is to examine its ability to obtain consistent
measurements; the internal consistencies for a set of measurements indicates
the extent to which the items are identical Field (2009). Therefore, the most
common measure of reliability for quantitative data is the Cronbach alpha index;
the test used to find the internal consistency among the instruments used in the
research, ideally Cronbach alpha should be greater than 0.7 to consider the
items being measured are consistent and reliable (Field, 2013). Therefore, this
test is used to measure whether the items and scales are free of measurement
errors Field (2009). The mathematical formula for calculating Cronbach alpha is:
α= �.+ �− . (3.1)
Where;
K= Number of items
= The average of all covariance between the items and
� = The average variance of each item

Chapter Three: Research Methodology
81
Cronbach alpha test is undertaken to check the reliability of the measures used
to the evaluate LSS integrated model, SS-TQM integrated model and the
framework.
3.8.2. Validity analysis
The validity test is basically used to evaluate two main issues: to what extent
the instruments used are accurate and the extent to which they are measuring
what is supposed to measure (Flick, 2009), In general, validity testing
comprises of content, construct and criterion validity (related validity). Content
validity is not numerically evaluated but based on judgments and normally
established in the literature review; criterion validity refers to the degree a
measure is related to the outcome and construct validity refers to whether the
instruments measure what supposed be measured. (Thompson and Daniel,
1996; Yusof and Aspinwall, 2000). The most important type of validity in such
research is construct validity, where the CSF’s for each model and the
framework are evaluated based on measuring the construct validity for each
factor as illustrated in the next section.
3.8.2.1. Construct validity
Thompson and Daniel (1996) stated that construct validity is a measurement
approach to test whether the instrument’s scales act like the attributes being
measured. Therefore, in order to assess whether the instrument scales
measures what they are supposed to and to identify the construct validity, the
CSFs for each model and the framework must be analysed by factor analysis.
This test is the most common test used to measure the construct validity and to
determine the appropriateness of instruments (Pallant, 2010). Moreover,
Thompson and Daniel (1996) stated that factor analysis and construct validity
Chapter Three: Research Methodology
82
are associated with each other and in published literature considered to be
"factorial validity".
To facilitate the thesis for the reader and to avoid repetition, the statistical
measures used to examine the validity of the research instruments and the
results would be covered in this chapter.
3.8.2.2. Selection the measures of validity analysis
Two types of statistical analysis are employed in this research to evaluate the
instruments of the questionnaires and validating the finding of the research. Chi-
square Goodness of fit is employed to examine the instruments used for
evaluating the models and the framework and, hence, confirm the validation.
Factor analysis is undertaken to measure the instruments used to evaluate the
CSFs of each model and the framework. The reasons why these tools are
selected to confirm the validity of the research are discussed in the following
sections.
3.8.2.2.1. Chi-Square Goodness-of-Fit
According to Pallant (2010), the Chi-Square Goodness of fit is a non-parametric
test used to measure the validity of the statistical assessment, one common
application of this tool is to find out how the observed data of the given
phenomenon is significantly different from the expected data. Chi-Square
Goodness of fit is one of the best statistical tools used to answer the question of
how well do experimental or survey data fit expectations (Field, 2002).
Additionally, (Field, 2002) stated that Chi-square goodness of fit is used to
measure the extent to which the observed values are, statistically, significantly
different from the expected values. Chi-Square Goodness of fit with
corresponding P value is considered to be significant if the P value ≤ 0.05
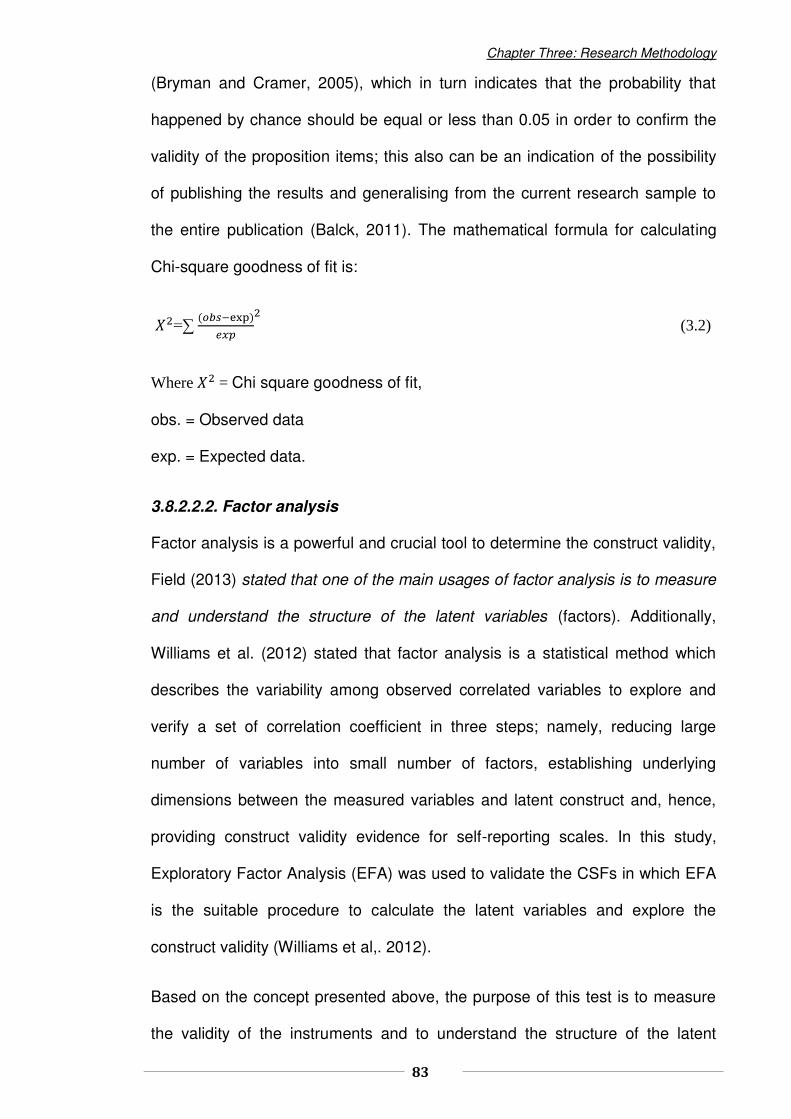
Chapter Three: Research Methodology
83
(Bryman and Cramer, 2005), which in turn indicates that the probability that
happened by chance should be equal or less than 0.05 in order to confirm the
validity of the proposition items; this also can be an indication of the possibility
of publishing the results and generalising from the current research sample to
the entire publication (Balck, 2011). The mathematical formula for calculating
Chi-square goodness of fit is:
� =∑ −exp (3.2)
Where � = Chi square goodness of fit,
obs. = Observed data
exp. = Expected data.
3.8.2.2.2. Factor analysis
Factor analysis is a powerful and crucial tool to determine the construct validity,
Field (2013) stated that one of the main usages of factor analysis is to measure
and understand the structure of the latent variables (factors). Additionally,
Williams et al. (2012) stated that factor analysis is a statistical method which
describes the variability among observed correlated variables to explore and
verify a set of correlation coefficient in three steps; namely, reducing large
number of variables into small number of factors, establishing underlying
dimensions between the measured variables and latent construct and, hence,
providing construct validity evidence for self-reporting scales. In this study,
Exploratory Factor Analysis (EFA) was used to validate the CSFs in which EFA
is the suitable procedure to calculate the latent variables and explore the
construct validity (Williams et al,. 2012).
Based on the concept presented above, the purpose of this test is to measure
the validity of the instruments and to understand the structure of the latent

Chapter Three: Research Methodology
84
variables (factors). Furthermore, the author would go beyond that and intended
to interpret the relationship between the latent variables and the contents of
models in each data analysis.
Exploratory factor analysis (EFA)
The exploratory factor analysis was carried out using SPSS 23 through the
data-reduction factor analysis method, to check the construct validity of each
critical factor. In this analysis, the raised variation is explained by the factors
resulting from factor analysis, the more powerful the instrument’s measure of
what supposed to be measured (Mallak et al.,1997). Furthermore, Principle
Component Analysis (PCA) technique with direct Oblimin rotation method is
used for extracting the factors. (Williams et al., 2012) stated that principal
component analysis is one of the most commonly-used extraction method used
in the literature in order to produce a scale unidimensionally or unifactorial and
direct Oblimin is an appropriate rotation procedure to produce factors that are
more correlated and easy to interpret.
The criteria for assessing factor extraction
The purpose of extraction is to reduce a large number of items into factors
(Williams et al., 2012). In order to obtain scale dimensionality and simplify the
factor solution, typically multi-criteria should be used to analyse factor analysis
(Thompson and Danial, 1996). In this respect, the most common criteria used
by the researchers to produce unidimensionality are;
Factorability test: To check the suitability of data for obtaining factor analysis,
the Kaiser-Meyer-Olkin test (KMO) is used to assess the appropriateness of
data set for factor analysis, this test is basically calculated based on the
correlation matrix, where the higher correlation among the variable the more

Chapter Three: Research Methodology
85
suitable of data for conducting factor analysis test (Field, 2009), KMO can be
calculated mathematically using the following formula (Kaiser, 1981):
� = ∑ ∑ 2≠∑ ∑ 2≠ + ∑ ∑ 2≠ (3.3)
Where: r =Correlation matrix.
a =Partial matrix.
i and j= are the elements of the matrix.
Also, Barlett’s test of sphericity; is used to check if the data presents equal
variation among the variables to ensure if there is a redundancy between the
observed variables, it can be determined by testing if the correlation matrix (R)
diverges significantly from the identity matrix. This can be calculated by
employing the determinate of the correlation matrix|�|, where the variables are
highly correlated if |�| = 1, therefore Barlett’s test of sphericity indicates the
extent to which there is deviation from|�| = 1. This basically calculated by the
following formula quoted from Field (2013):
� = [1 + + − ] �� 1 − |�| (3.4)
Where.
N = number of observations.
P = number of variables.
� = Chi-square.
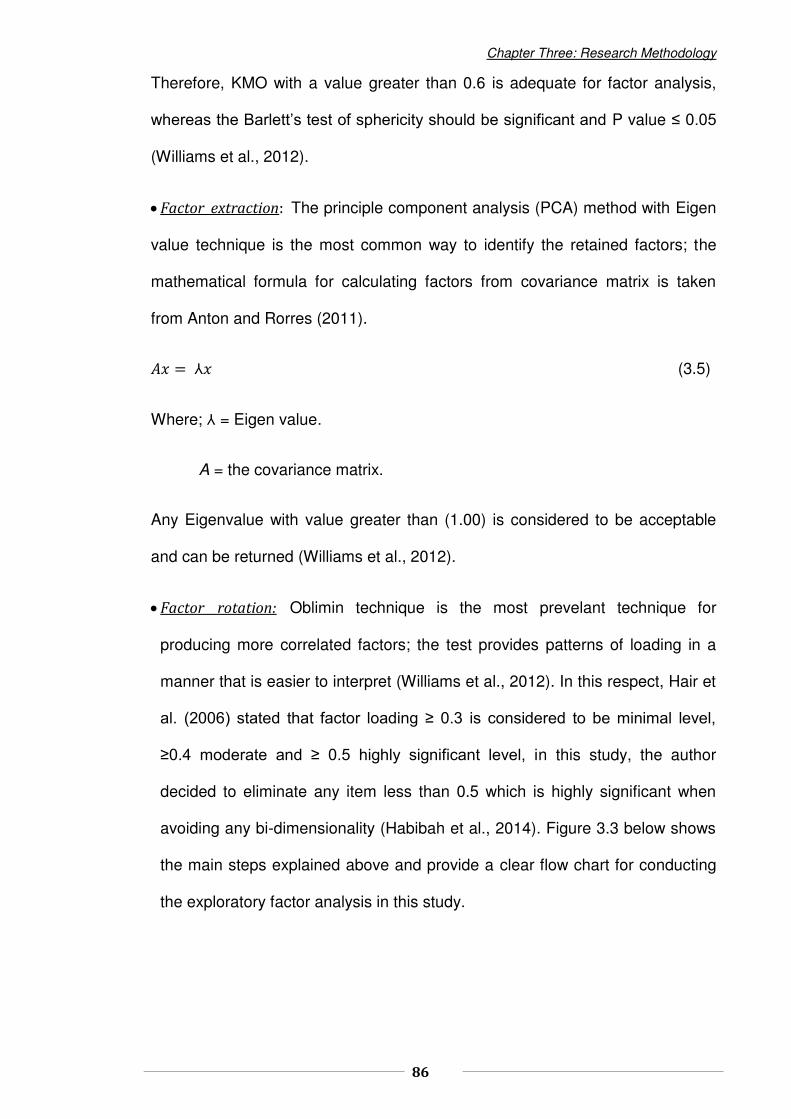
Chapter Three: Research Methodology
86
Therefore, KMO with a value greater than 0.6 is adequate for factor analysis,
whereas the Barlett’s test of sphericity should be significant and P value ≤ 0.05
(Williams et al., 2012).
Factor extraction: The principle component analysis (PCA) method with Eigen
value technique is the most common way to identify the retained factors; the
mathematical formula for calculating factors from covariance matrix is taken
from Anton and Rorres (2011).
�� = ⅄� (3.5)
Where; ⅄ = Eigen value.
A = the covariance matrix.
Any Eigenvalue with value greater than (1.00) is considered to be acceptable
and can be returned (Williams et al., 2012).
Factor rotation: Oblimin technique is the most prevelant technique for
producing more correlated factors; the test provides patterns of loading in a
manner that is easier to interpret (Williams et al., 2012). In this respect, Hair et
al. (2006) stated that factor loading ≥ 0.3 is considered to be minimal level,
≥0.4 moderate and ≥ 0.5 highly significant level, in this study, the author
decided to eliminate any item less than 0.5 which is highly significant when
avoiding any bi-dimensionality (Habibah et al., 2014). Figure 3.3 below shows
the main steps explained above and provide a clear flow chart for conducting
the exploratory factor analysis in this study.
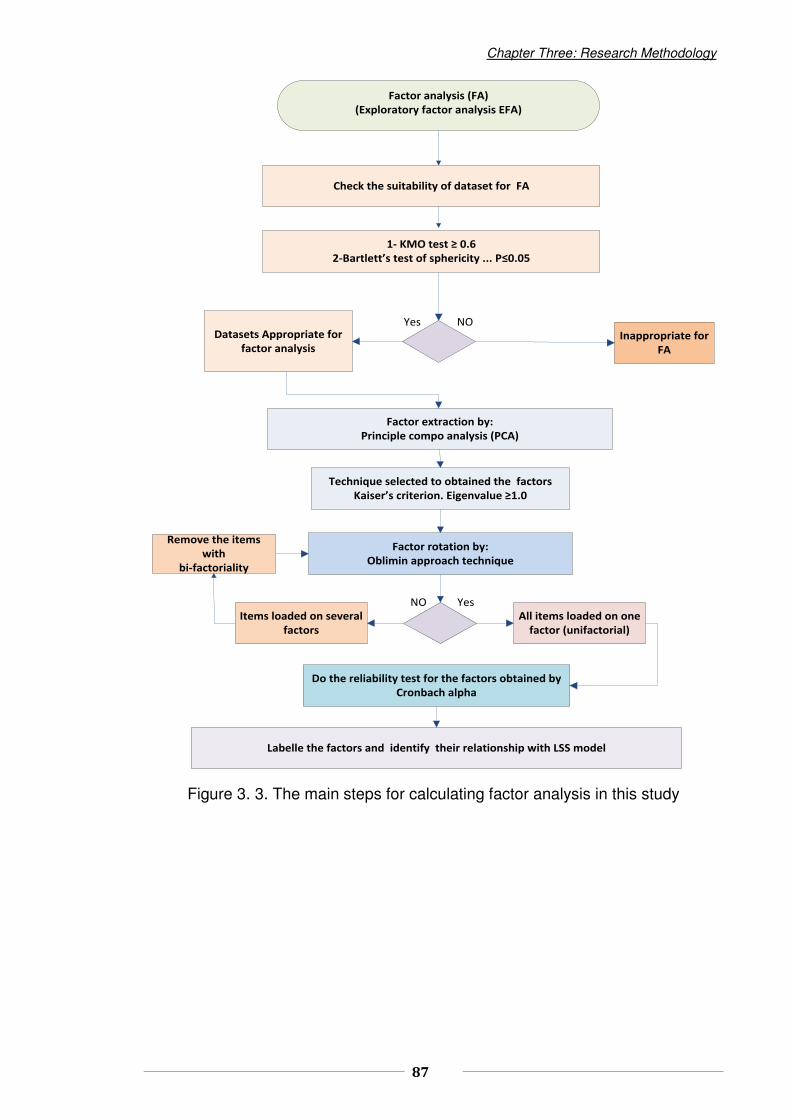
Chapter Three: Research Methodology
87
Factor analysis (FA)
(Exploratory factor analysis EFA)
Check the suitability of dataset for FA
1- KMO test 0.6
2-Bartlett’s test of sphericity ... P 0.05
Datasets Appropriate for
factor analysis
Factor extraction by:
Principle compo analysis (PCA)
Inappropriate for
FA
Technique selected to obtained the factors
Kaiser’s criterion. Eigenvalue 1.0
Factor rotation by:
Oblimin approach technique
Items loaded on several
factors
All items loaded on one
factor (unifactorial)
Do the reliability test for the factors obtained by
Cronbach alpha
Labelle the factors and identify their relationship with LSS model
Remove the items
with
bi-factoriality
NOYes
YesNO
Figure 3. 3. The main steps for calculating factor analysis in this study

Chapter Three: Research Methodology
88
3.9. Summary of the research methodology
This part of the research has outlined the main role of the research
methodology and how the research methodology can employ certain tools and
techniques to achieve the research aims and objectives, the author in this
section focused on the main methodology that can be used in quality
management research. The main aspects of research methodology that were
discussed are research philosophy, research approach and research
techniques; known in research method as Methodological choice (Saunders et
al., 2013).
Accordingly, the research design and strategy section provided the research
methodology selected for conducting the research and achieving the research
objectives. The selection of the research methodology adopted provided
through the three sections of this chapter: 1) The literature review for collecting
the secondary data and developing the proposed models and the framework. 2)
the main investigations, the two different questionnaires used to collect the
primary data for validating the proposed models and a multicriteria decision
making applied to evaluating and prioritising the components of the framework.
In addition, another questionnaire was conducted to collect data for validating
and verifying the framework and its implementation procedures. 3) Analytical
procedures were undertaken to verify and validating the results of the data
collected for the models and the framework and, hence, confirming the validity
of the research. The chapter also highlighted the sample selection and
demonstrated the pilot study that was conducted in the research. The next
chapter focuses on the development and validation of LSS integrated model, it
discusses how the proposed model developed and outlined the main steps and
procedures used for validating the mode.

89
Chapter Four:
Development and validation of Lean Six-Sigma
integrated model
4.1. Introduction .................................................................................................................................... 90
4.2. What makes Lean Six-Sigma different?......................................................................................... 91
4.3. The requirements for Lean Six-Sigma implementation .................................................................. 92
4.4. Critical Success Factors of Lean Six-Sigma .................................................................................. 93
4.5. The proposed LSS integrated model ............................................................................................. 94
4.6. Validation of the LSS integrated Model .......................................................................................... 97
4.6.1 Research methodology ................................................................................................................ 97
4.6.2. Data collection and analysis ....................................................................................................... 98
4.6.2.1. Integrity data analysis .............................................................................................................. 99
4.6.2.2. Descriptive analysis ............................................................................................................... 103
4.7. Validation of the critical success factors ...................................................................................... 116
4.7.1. Results of factor analysis .......................................................................................................... 116
4.8. Discussion .................................................................................................................................... 121
4.9. Conclusion ................................................................................................................................... 123

Chapter Four: Development and Validating LSS model
90
4.1. Introduction
Contemporary manufacturing organisations are facing a relatively dramatic
change in the external environment driven by superfast competition, increasing
demand from the consumers and the non-stable economic climate in many
countries has forced manufacturing managers to expand their strategic thinking
to the long-term in order to attain a competitive advantage. Thus, operation
management models such as Lean, Six-Sigma and TQM have been
implemented to simplify the production lines and to improve the quality
performance. However, none of these approaches is able to deal with the
manufacturing problems when implemented alone, therefore, there is the need
for integrated models like Lean Six-Sigma (Bhuiyan and Baghel, 2005).
This chapter presents the development and validation of Lean Six-Sigma
integrated model for manufacturing organisations to help them to embed the
strategic thinking into long-term planning and achieve a high quality result. The
chapter starts by discussing how LSS is different than the other strategic
approaches and then presents the main requirements for integrating this model
and the main drivers that lead to success when integrating these methods. The
review of the literature pertinent to the topic enables the study to identify the
main components and the strategy of the model, subsequently, the
questionnaires and methodological tools were applied to verify and validate the
model; therefore, the validation steps were carried out and led to the desired
result, which is that the LSS integrated model is workable and can help
manufacturing organisation to achieve competitive advantage.

Chapter Four: Development and Validating LSS model
91
4.2. What makes Lean Six-Sigma different?
Lean Six-Sigma is a successful approach due to the inclusion of a disciplined
and DMAIC methodology which is a systematic strategy for improvement which
leads to rapid project completion within reasonable time periods. Juran et al.,
(1999) stated that in order to create a tangible improvement methodology the
best way is to create an integrated system for managing projects rather than
separate system for Lean or Six-Sigma projects. Therefore, Lean and Six-
Sigma are both formulated into one system including a business strategy and
methodology that increase the process performance and, hence, enhance
customer satisfaction and the bottom line results in terms of cost saving,
improving the organisation’s profitability, cycle time reduction, improving yield
rate, elimination of rework and reduction of the variation (Harry, 1998 and Snee
2010). Also, LSS provides the concepts, strategy and tools that enable the
organisation to change from one way of working to a better way.
This integration between Lean and Six-Sigma can lead to the elimination of all
types of waste in operation process, reducing process variability and defects
which results in business process improvements (Bendell, 2006). In addition,
(Chen Li and Shady, 2010) add that Lean Six-Sigma in its capacity as a hybrid
model leads to a smoothing in the production flow by reducing the inventory
level between work stations, making the operation more flexible by applying
Lean tools and the Six-Sigma improvement strategy. Moreover, Brett and
Queen (2005) clarified that the LSS application, for instance, can enhance the
management of information by improving on the shortcomings of one with the
other. Consequently, it can be argued that Lean Six-Sigma is different to the
other approaches due to the key factor of the critical success factors generated
by the disciplined system.
Chapter Four: Development and Validating LSS model
92
4.3. The requirements for Lean Six-Sigma implementation
Basically, business organisations are always looking for ways to improve their
bottom line; this, generally, can be realised only by obtaining the high-quality
output of product or services necessary to attain competitive advantages.
Therefore, the strategic programs and management methods have been
significantly developed over the last three decades, for instance, Six-Sigma,
TQM, Lean management. This variety of methods frequently puts strained the
organisation's managers in selecting the proper method for dealing with certain
problems (Johannes, 2013). Organisations are now required to operate at the
lowest cost, with greater speed and reliability, develop a superior ability to
change and continuously improve in order to gain competitive advantage (Datta
and Roy, 2011). Repetitive.
The general requirements of the integration approach have been much studied,
for instance, Brinkkemper (1996) stated that the main requirements of the
integration approach are; completeness, consistency and intended purpose.
Johannes (2011) studied these requirements and linked them to the integrated
method in quality management, Johannes (ibid) concluded these requirements
are considered the key factors that are required to obtain the synergies between
methods and hence success in the integration approach. Based on this context
(Salah et al., 2010) stated that Six-Sigma and Lean mutually reinforce and
enhance each other, where DMAIC strategy can be worked as a strategic driver
for process improvement and value stream mapping (VSM) might be used as
platform for Lean and Six-Sigma tools. Moreover, Salah (ibid) advised that
combining Lean techniques into DMAIC and the future state of VSM is a right
way to change the structure of the process.

Chapter Four: Development and Validating LSS model
93
4.4. Critical Success Factors of Lean Six-Sigma
According to (Johnson and Scholes, 2002; Schon, 2006; Youssef, 2006) the
CSFs are important to success any business and considerable attention should
be paid to them and used as a means of benchmarking. The use of CSFs for
the successful implementation of LSS is identified in chapter 2 section (2.6.2)
and based on (Anthony et al., 2002; Hendorson and Evan, 2000; Manville et al.,
2012; Sandholm and Sörqvist, 2002; Goldstein, 2001; Timanset al., 2012).
These CSFs (listed below) are selected for the successful implementation of the
proposed LSS model:
1. Organisational structure;
2. Business plan and Vision;
3. Linking LSS to the customer;
4. Changes in management and organisation culture;
5. Education and training;
6. Top management involvement and participation;
7. Effective communication;
8. Linking LSS to organisation's business strategy;
9. Project selection, prioritisation, reviews and tracking;
10. Linking to Suppliers;
11. Project management and
12. The monitoring and evaluation of performance.

Chapter Four: Development and Validating LSS model
94
4.5. The proposed LSS integrated model
The aim of the proposed model is to simplify LSS implementation to enable
manufacturing organisations to overcome the fear of high cost and the
complexity associated with LSS implementation. The model seeks to utilise the
knowledge within the organisation and breaks down the barriers hindering
individuals from using statistical problem-solving methods by following a step-
by-step guide. The proposed model is based on DMAIC approach which, as the
main strategy, enables the implementation processes to identify opportunities
for quality improvement, increases process performance and reduces variability
and waste in a product or process using statistical tools. However, DMAIC
phases in this model are integrated with each other to draw the implementation
processes and streamline the operating system.
Therefore, the proposed model in figure 4.1 consists of two main components:
Strategic elements, that comprise the key drivers required for successful
implementation of business process. Operation elements, including the key
factors for the successful implementation of the operation system and obtaining
high quality performance, the implementation process of the model is
summarised into four sub processes as follows:
i. Planning and Organisation stage. In this process, the model employs the
strategic tools for organising and planning the implementation process, which
includes four steps: (1) Analyse the market to capture the Voice of Customer
(VOC), evaluate the business process to identify Voice of Business (VOB), and
translate VOC and VOB to Critical to Quality (CTQ) in order to improve the
quality of products: (2) formulate a high-level functional team and identify the
final vision; (3) Establish the overall improvements including process
Chapter Four: Development and Validating LSS model
95
improvement using Supplier Input Process Output Customer (SIPOC); (4)
Create the baseline of LSS metrics and analyse the cost benefits associated
with the strategic planning using CTQ, CTC and CTS.
ii. Enhancement and Stimulation stage. This stage aims to enhance the
process and prepare the work environment for improvement. This can be
conducted through collecting the required data to identify the process behaviour,
determination of the bottle neck and identifying area of waste via VSM,
Identifying the current performance using process capability metric and Sigma
measures, in the end of this stage evaluate the measurement system by
applying the Six-Sigma Gauge RR technique (Repeatability and Reproducibility)
which is a statistical tool that measures the amount of variation in the
measurement system.
iii. Evaluation and Activation stage. The purpose of this step is to apply the
proper statistical tools to eliminate the quality problems, identify the gap
between the current and desired performance and analyse the root causes to
identify the potential improvements by conducting Design of Experiment (DOE).
iv. Improvement and Verification stage. Once the results of DOE are
confirmed, then, the whole operation process is monitored through a controlled
plan using the appropriate LSS tools to attain sustainable improvement for the
operating practice. Finally, the whole process performance is verified via a
balanced scorecard and KPI to assure whether the organisation meets the
business objectives.

Chapter Four: Development and Validating LSS model
96
Establish the key measures (CTQ, CTC and CTS)
Undertake Six-Sigma approach to evaluate the measurement system using Gauge R & R
Start
Recognise the need for change by analysing (Market , Customer and Process)
Form a high level functional Team and setup the vision
Identifying the activities of the current process by establishing SIPOC
Carryout VSM to identify the area of west and the bottle neck
Apply RCA to assess the quality problem using 5 way and
brainstorming
Use Pareto analysis to identify issues critical to quality
Use brainstorming to conduct Cause & effect diagram & to identify root
causes of problems
Assess the potential causes to detect the variation using SPC
List the factors need to be improved
Identify the process capability ( CP, CPK, Yield , DPMO)
Specify the objectives and target result of the
experiment
Analyse the DOE results by ANOVA to obtain statistical
significantApply Six-sigma measures to identify the gap between the Current and the target performance using: δ measure, CP, CPK, Yield and analyse
VSM
Apply TPM for mentoring the performance of the process, use OEE to evaluate the
effectiveness of the quality system
YESNO
Do values provide match
the actual performance
required
Do values provide match
the actual performance
required
Str
ate
gic
Ele
me
nts
Op
era
tio
n E
lem
en
ts
Collecting the required data to evaluate the process performance
Carryout the DOE
Solution foundapply control measures for
evaluating using SPC
Implement solution update the procedures and
documented
Mentoring the action and evaluating the performance of the process using SPC, balanced scorecard, 3C and Kaizen
Verifying the system by measuring the success of the business objectives using KIP
Stage 4Process improvement and verification
Evaluate and standardise the solution by; FMEA, Brainstorming and 5S
Stage 1Process planning and organisation
Stage 2Process enhancement and stimulation
Stage 3Process evaluation and activation
Figure 4. 1. LSS conceptual model for manufacturing organisations

Chapter Four: Development and Validating LSS model
97
4.6. Validation of the LSS integrated Model
4.6.1 Research methodology
A questionnaire survey was developed for this study based on the findings
obtained from the existing literature, a copy of the questionnaire is attached in
appendix (A-1); the questionnaire was divided into five main sections with 22
main questions. The main aim was to investigate the suitability of the proposed
model for manufacturing organisations. The key point of the survey is to analyse
the current trend in LSS implementation in manufacturing organisation, its
methodologies, perceived benefits, critical success factors and the barriers to
successful implementation.
The first section of the questionnaire was about the background information to
gather a clear picture about the respondent’s background and to understand
their awareness of the LSS approach. The second section examined the
suitability of LSS for manufacturing organisations and determined the potential
benefits that might be achieved through its implementation, this part attempted
to investigate the extent to which Lean-Six Sigma would be appropriate to the
respondent’s organisation in terms of long term strategic thinking. It will also
give an indication of the top management and other employees perception
about the LSS approach. The third section investigated the awareness and
usefulness of the LSS tools and techniques to Manufacturing organisations. The
fourth section focused on the evaluation of the proposed model, it was intended
to assess the proposed model based on Six criteria: model contents, Suitability
and capability for manufacturing organisations, the ability of the model to
improve competitiveness, overcome natural LSS implementation difficulties,

Chapter Four: Development and Validating LSS model
98
foresee any difficulty in implementing the proposed model and evaluate the
completeness of the model.
Finally, section five, is the major part of the questionnaire aimed at evaluating
the importance of the CSFs for the successful implementation of the LSS model
and the potential barriers that can impede the implementation process. The
CSFs were identified from the existing literature related to the Lean and Six-
Sigma approach as stated earlier in this study; basically, the CSFs gathered
comprise 12 major factors believed to be crucial for LSS implementation. the
impeding factors including the common causes that hindering the effective
implementation of the LSS approach which comprises 11 factors drawn from
the existing literature (Johannes, 2013; Antony, 2009).
4.6.2. Data collection and analysis
A total of 70 research surveys were sent out to a host of management
employees spread across different manufacturing organisations around the
global, 56 questionnaires were completed and returned within a given time
frame, a percentage considered to be relatively high and acceptable (Saunders
et al., 2009). Statistical software package employed to analyse the data was
collected which is an appropriate method to provide robust and structured
analysis. Bryman (2005) stated that the Statistical Package for Social Science is
the most appropriate statistical software used for social science and
engineering research (see chapter 3 section (3.4.1)). Therefore, SPSS 23 was
used to analyse the data collected in this study, 56 useable questionnaires were
coded and entered into the (SPSS 23) software program, basic statistical
analysis was carried out for the observation of frequencies, percentage, mean
and standard deviation to assess the data.

Chapter Four: Development and Validating LSS model
99
4.6.2.1. Integrity data analysis
4.6.2.1.1. Reliability test
As discussed in chapter 3 the procedure used to ensure the reliability of the
data used for validating LSS model is Cronbach alpha (α) see section (3.6.1).
However, the Cronbach alpha result must be greater than 0.7 to consider the
items being measured are reliable (Field, 2013). As such, a Cronbach alpha test
was undertaken to check the reliability of the measures used to evaluate the
LSS conceptual model, the results in table (4.1) shows that coefficient alpha is
0.804 and the standardized item alpha is 0.720, this slight variation among the
alpha values refers to the variation between the scores of participants and the
overall scores of the questionnaire, however, both are higher than 0.7.
Table4. 1. Reliability statistics
Cronbach's
Alpha
Cronbach's Alpha Based
on Standardized Items N of Items
.804 .720 6
Table (4.2) showed the internal correlation of the item measures, it can be seen
that there are a positive correlation between most of the items except for item
five (Is any difficulty foreseen in Implementing the LSS-Model?) which has
negative correlation with the all the items, also item six (Is any content missing
from the LSS-Model?) has low correlation with all the items.

Chapter Four: Development and Validating LSS model
100
Table4. 2. The internal correlation of the items measured
LSS-M
Contents
rating
Suitability
/capability of
LSS-M
Ability of LSS-M
Boost
Competitiveness
Overcome
Nature LSS
Implementation
Difficulty
Foresee any
difficulty in
Implementing
LSS-M
Any content
missing in
LSS-M
LSS-M Contents rating 1.000 .745 .680 .741 -.056 .179
Suitability /capability of
LSS-M .745 1.000 .738 .814 -.143 .068
Ability of LSS-M to
Boost
Competitiveness.
.680 .738 1.000 .735 -.180 .017
Overcome Natural
Difficulties
implementing LSS.
.741 .814 .735 1.000 -.058 .282
Any difficulty foreseen
in Implementing LSS-
M.
-.056 -.143 -.180 -.058 1.000 -.062
Any content missing
from LSS-M .179 .068 .017 .282 -.062 1.000
The effect can be seen in table (4.3) Item-total statistics. According to Field,
(2009) and Pallant, (2010), the values in the column labelled ‘Corrected Item-
Total Correlation’, covers the correlation between the item and the total score of
the questionnaire, in reliable cases, all the items should be correlated with the
total scores and all the values must be above 0.3. The column labelled
‘Cronbach's Alpha if Item Deleted’ represents the values of overall alpha if the
item is deleted in the calculation, all items in that column should be roughly
around the same value, in other words, alpha can be improved on by deleting
any item that does not match the other values in the column (Pallant, 2010).
Based on the above propositions, the results were shown in table (4.3), column
three ‘Corrected Item-Total Correlation’, item five on the left-hand side of the

Chapter Four: Development and Validating LSS model
101
table (Is any difficulty foreseen in Implementing the LSS-Model?) has a negative
correlation with overall score -0.128. Also, item six (Is any content missing from
the LSS-Model?), in the same column, has low correlation score with value
0.141.
In addition, in column five "Cronbach's Alpha if the Item were Deleted", the
mentioned items have the highest alpha values, 0.863 and 0.835, which do not
match the other values within the column. Therefore, if those items, number
Five and Six, were deleted from the calculation, then the Cronbach alpha would
be improved.
Table4. 3 Item-Total Statistics
As a result, table (4.4) shows the statistics that Cronbach alpha indicated as
reliable, 0.911, and the standardized item ‘alpha’ is 0.913, also in table (4.5)
Item-Total Statistic. In Column three, ‘Corrected Item-Total Correlation’ reveals
that all the items are correlated with a value above 0.3 and, in column five, the
values of the Cronbach alpha, if the items deleted ranged between 0.89 to 0.87,
Scale Mean if
Item Deleted
Scale Variance if
Item Deleted
Corrected Item-
Total Correlation
Squared Multiple
Correlation
Cronbach's Alpha
if Item Deleted
LSS-M Contents rating 15.45 6.711 .788 .631 .713
Suitability /capability of LSS-
M 15.69 6.759 .813 .749 .707
Ability of LSS-M to Boost
Competitiveness. 15.51 6.380 .728 .648 .732
Overcome Nature LSS
Implementation Difficulty. 15.65 6.440 .864 .775 .690
Any difficulty foreseen in
Implementing LSS-M. 17.76 11.355 -.128 .081 .863
Any content missing in LSS-M 17.69 10.717 .141 .222 .835

Chapter Four: Development and Validating LSS model
102
is greater than 0.7. Consequently, it can be concluded that these instruments
have a high level of internal consistency and increased the authors' confidence
in the reliability of the obtained results.
Table4. 4. Reliability Statistics
Cronbach's
Alpha
Cronbach's Alpha Based
on Standardized Items N of Items
.911 .913 4
Table4. 5. Item-total Statistics
Scale Mean if
Item Deleted
Scale Variance if
Item Deleted
Corrected Item-
Total Correlation
Squared Multiple
Correlation
Cronbach's Alpha
if Item Deleted
LSS-M Contents rating 11.87 6.002 .758 .581 .898
Suitability /capability of LSS-
M 12.09 5.899 .848 .733 .868
Ability of LSS-M to boost
Competitiveness. 11.95 5.497 .774 .602 .896
Capability to overcome atural
LSS Implementation Difficulty. 12.04 5.813 .822 .701 .876
4.6.2.1.2. Validity test and validation of the proposed LSS conceptual
model
The main aim of the validity test is to examine the extent to which the
instruments used to evaluate the proposed model measured what they are
intended to; therefore, the Chi-Square Goodness of fit (� (see chapter 3
section (3.6.2.2.1)) was undertaken to check the instruments used in order to
evaluate the proposed model. However, the Chi-Square Goodness of fit with
corresponding P value should be ≤ 0.05 to consider the results are statistically
significant and the instruments used are valid (Bryman and Cramer, 2005),
which means that the probability, which happened by chance, should be equal

Chapter Four: Development and Validating LSS model
103
to or less than 0.05 in order to confirm the validity of the proposition items; this
also can be an indication of the possibility of publishing the results and the
abaility to generalise from the current research sample across the entire
publication (Black, 2011: Zuabi, 2015).
The results of Chi-Square Goodness of fit in table (4.6) demonstrated that the P
values for all measures are less than 0.05, which means that the results are
significantly different from the actual observed values and, taking into
consideration the expected values of all the statements used to evaluate the
proposed model, this confirms that all of the proposition measures considered in
the proposed model are valid. Consequently, in summary, the outcomes from
the reliability and validity analysis confirm that all the proposed model contents
are reliable and valid.
Table4. 6. Test Statistics
Model
Contents
rating
Suitability
/capability of
the model
The Ability of
LSS-M to boost
competitiveness
Overcoming
natural
difficulties
implementing
LSS.
Foresee any
difficulty in
Implementing
the model
Any
missing
content in
the LSS-
Model
Chi-
Square 42.929a 44.909b 30.964a 42.750a 15.680c 31.500d
df 4 4 4 4 1 1
Asymp.
Sig. (P) .000 .000 .000 .000 .000 .000
4.6.2.2. Descriptive analysis
This part of the study outlines the descriptive analysis of the data collected
using SPSS 23, statistical analysis applied to the output of the data collected by
measures of the central tendency including; mean, percentage and standard
Chapter Four: Development and Validating LSS model
104
deviation; thereby, the results of the data were collected and presented in the
following sections in forms of tables, charts and different statistic figures.
4.6.2.2.1. Section A: background information
This section outlines the results of the questionnaires received from the
respondents. The authors believe that the management employees involved in
the survey belong to a trustable target population that can provide reliable
responses to the survey questionnaire. The respondents comprised of mostly
operational managers and quality managers from selected manufacturing
organisations around the world.
1. Respondent's position
The respondents were asked to state their position within their organisation.
The results in the table (4.7) demonstrated that 25% of the respondents are
quality managers, 17.9% are operational managers, also 17.9% are academics,
including quality professionals, who work in the higher education and research
students who are related to industrial engineering. 12.5% directors, 8.9 %
quality engineer, 7.1% belt functions, including; Master Black belt, Black belt,
Green belt and Yellow belt. Working in the same capacity for an organisation,
another 5.4% including project leaders and heads of department. Finally, 5.4%
are coordinators.
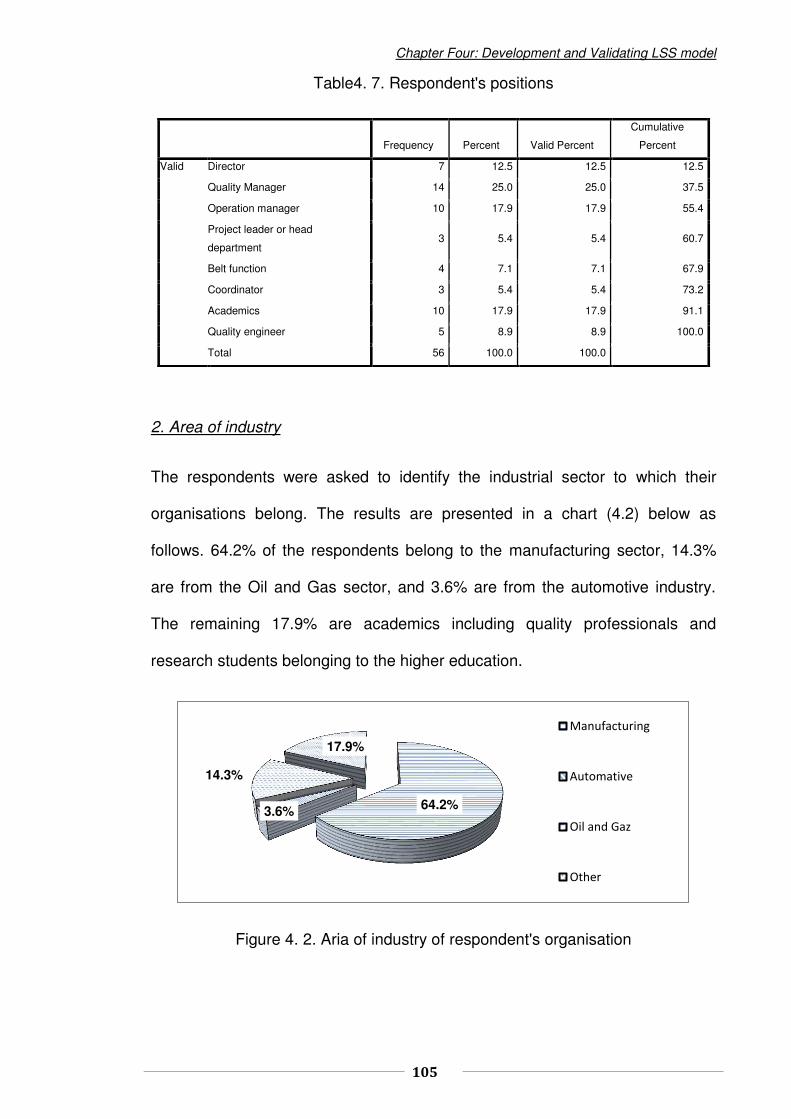
Chapter Four: Development and Validating LSS model
105
Table4. 7. Respondent's positions
2. Area of industry
The respondents were asked to identify the industrial sector to which their
organisations belong. The results are presented in a chart (4.2) below as
follows. 64.2% of the respondents belong to the manufacturing sector, 14.3%
are from the Oil and Gas sector, and 3.6% are from the automotive industry.
The remaining 17.9% are academics including quality professionals and
research students belonging to the higher education.
Figure 4. 2. Aria of industry of respondent's organisation
64.2% 3.6%
14.3%
17.9%
Manufacturing
Automative
Oil and Gaz
Other
Frequency Percent Valid Percent
Cumulative
Percent
Valid Director 7 12.5 12.5 12.5
Quality Manager 14 25.0 25.0 37.5
Operation manager 10 17.9 17.9 55.4
Project leader or head
department 3 5.4 5.4 60.7
Belt function 4 7.1 7.1 67.9
Coordinator 3 5.4 5.4 73.2
Academics 10 17.9 17.9 91.1
Quality engineer 5 8.9 8.9 100.0
Total 56 100.0 100.0

Chapter Four: Development and Validating LSS model
106
3. Country organisation location
The respondents were asked to state the location of their organisations, the
chart (4.3) shows: 20% are from Nigeria, 12% from Libya, 8 % from India, 5%
from UK and China, 2 from the UAE and the remaining locations comprise of
Russia, Germany, Spain and Greece, Each of them 1%.
Figure 4. 3. Organisation’s location
4. Type of quality management system of the respondent organisations.
The respondents were asked to identify the current quality system used in their
organisation. Figure (C-1) in Appendix (C) demonstrated 39.3% of the
respondents use the ISO series in their organisations, 33.9% using TQM, 5.4%
employ Six-Sigma and the rest 21.4% failed to indicate the type of quality
system in their organisation due to using hybrid quality management models
which do not belong to any particular quality management initiative.
0
5
10
15
20
Organisations location
Chapter Four: Development and Validating LSS model
107
5. The level of the awareness with the LSS approach
The respondents were asked if they have ever heard or are aware of LSS.
Figure (C-2) in Appendix (C) shows that 83.9% of the respondents' are aware of
LSS while the remaining 16.1% are not aware or has ever heard of LSS before.
6. The level of awareness with LSS Tools and techniques
LSS tools and techniques were presented to the respondents and were asked
to indicate if they were aware of any of the tools listed in the survey questions.
The results presented in table (C-1) in the appendix (C) show that the majority
of respondents seems to be familiar with most of the tools and indicated that
their level of the awareness with these tools was above 50%, a threshold for
awareness. However, tools such as; Kaizen events, ANOVA, SIPOC, Force
Field Analysis, Poka-Yoke and Run Charts were ranked in the results below
50% by the respondents which means that they are not familiar with these tools
in their organisations and their awareness level with those tools is slightly low
7. The major problems facing quality system of respondent’s organisations
The respondents were asked to indicate if the quality system in their
organisations was capable of dealing with a list of 11 essential factors
considered the key problems leading to failure in any quality system; those
elements were summarized from the literature (see Antony and Banuela (2008)
and Andersson et al., (2006)). Table (C-2) in Appendix (C) demonstrated that
the majority of the respondents indicated that their organisations are able to
deal with most of the problems and the average of the results was above 50%.
However, the results of concerning each element were as follows:
The lack of cost driven priorities: Capable with 51.8%
Chapter Four: Development and Validating LSS model
108
The failure to track which quality efforts work in a market place: Capable with
55.4%
Employee commitment: Capable with 53.6%
Defects: Capable with 53.6%
Decision-making: Capable with 51.8%
The organising of documentation and paperwork for registration; Capable with
53%
The utilisation of problem-solving techniques or validations of the robustness of
the technical solutions - crucial to advance planning: Capable with 55.4%
Risk and uncertainty: Capable with 55.4%
Whereas, with the rest of factors, the organisations were indicated incapable of
dealing with them and the average of resulted fell below 50%:
Investment in training: incapable with 41.1%
Certification by independent auditor: incapable with 48.2%
Inability to analyse how good the processes are: incapable with 42.9%
The respondents also were asked if there are other problems facing their quality
system. The results showed that other problems related to demand
management.
4.6.2.2.2. Section B:
The suitability of LSS for manufacturing organisations and what the
potential benefits that can be achieved through its implementation are:
This section of the questionnaire was designed to assess the manager’s
viewpoint on the suitability of LSS and its benefits to their organisations. This
will give an insight into the potential offered by implementing the Lean Six-

Chapter Four: Development and Validating LSS model
109
Sigma approach by top management and quality professionals within
manufacturing organisations.
1. Attendance of any formal training on Lean or Six-Sigma approaches.
The respondents were asked to state if they have received any formal training
on Lean, Six-Sigma or both. The results in Chart (C-3) in the appendix (C)
showed that 33.9% of the respondents had no formal training on Lean and/or
Six-Sigma, 19.6% of them had formal training on Six-Sigma alone, 14.3% have
formal training on Lean and 33.9% had formal training on both Lean and Six-
Sigma.
2. The duration of using Lean or Six-Sigma approach.
The respondents were asked to state the duration that they have been involved
in Lean and /or Six-Sigma training. Chart C-4 in appendix (C) demonstrated
that; 46.4% of the respondents have never used Lean and/or Six-Sigma, 30.4%
have used it for a period of 1- 2 years, 16.1% have used it for 3 - 5 years, and
the remaining percentage, 3.6%, for 5-10 years with the remainder using it for
more than 10 years.
3. The role of respondents within Lean or Six-Sigma organisation
The respondents were asked about their role within the Lean and or Six-Sigma
organisation. The chart (C-5) in appendix (C) shows that; 41.1% of the
respondents had no Lean Six-Sigma role, 19.6% were team members, 7.1%
were Master Black Belts, yellow belt and practitioners, 5.4% are champions and
trainers each, 3.6% are Black and Green Belt each.

Chapter Four: Development and Validating LSS model
110
4 The potential motivations with LSS approach
The essential elements of both approaches are listed as the key motivation for
adopting the LSS approach, the respondents were asked to indicate the extent
to which those motives will influence their decision in adopting the LSS. The
Likert scale used is 1–Strongly Disagree. 2– Disagree. 3– Moderate. 4– Agree.
5 –Strongly Agree
Table (C-3) in appendix (C) showed that the majority of respondents rated the
highest percentages in favour of agree and strongly agree on Likert scale,
which means that the majority of the respondents are aware that LSS is suitable
for manufacturing organisations.
5. The potential benefits that could be gained by adopting the LSS approach
The quality objectives of both approaches are listed as the key benefits for
adopting LSS approach. The Likert scale was represented as 1–Strongly
Disagree. 2– Disagree. 3– Moderate. 4– Agree. 5 –Strongly Agree
Table (C-4) in appendix (C) showed that the majority of respondents rated the
highest percentage in favour of agree and strongly agree on the Likert scale;
however, the respondents ranked the following elements as the most important
benefits that can be gained:
Improved delivery;
Cultural benefits;
Improved customer satisfaction;
Reducing quality problems, defects and rework;
Higher awareness of quality among employees (quality commitment)
Improved productivity;
Chapter Four: Development and Validating LSS model
111
Enhancing the organisation's competitive position;
Improved sales;
Organised working environment;
Increased customer confidence and relations and
New business opportunities.
4.6.2.2.3. Section C:
Investigating the awareness and usefulness of LSS tools and techniques
to Manufacturing Organisations.
This section of the questionnaire seeks to provide an understanding of the
participant's involvement in those LSS tools and techniques that have been
used in their organization or used by them, and how useful these tools are to
businesses for manufacturing organization and its procedures for
implementation. The aim is to provide an understanding, with the basic of LSS
tools and implementation procedures, that are suitable for manufacturing
organizations.
1. Utilisation of LSS tools and techniques
The respondents were asked to indicate whether they have ever used or have
applied Lean Six-Sigma tools and techniques within their organisation, The
Likert scale was used on a scale of 1-5, where; '1' indicates 'never been used',
'2' indicates 'used only once', '3' indicates 'used rarely', '4' indicates 'used
frequently' and '5' indicates 'used continuously'.
Table (C-5) in appendix (C) shown that the level of familiarity with tools and
techniques are diverse among the participants; however, some Lean tools and
techniques like SMED, Poka-yoka and Kaizen events have been rated
unfamiliar, also 5S, VSM, SMED and Kanban are also slightly unfamiliar to most

Chapter Four: Development and Validating LSS model
112
of the respondents, whereas quality tools and techniques such as SPC,
Process mapping, brainstorming and benchmarking are the most familiar
among the LSS tools and techniques.
2. The usefulness of LSS tools and techniques to respondents' organisation
The participants were asked to indicate if they consider LSS tools and
techniques useful to their organisation, the Likert scale used is; '1' indicates 'not
useful', '2' indicates 'less useful', '3' indicates 'moderate', '4' indicates 'useful',
and '5' indicates 'very useful'.
Table (C-6) in appendix (C) showed that the level of importance with tools and
techniques are very diverse among the participants, in general, the majority of
respondents' rated tools like 5S, Benchmarking and Parato analysis as very
important tools within their organisations and other tools like VSM and SPC
ranked as the most useful tools. However, the majority of the respondents
indicated that the rest of the tools are moderate in terms of the usefulness
within their organisations.
4.6.2.2.4. Section D: Evaluation of the proposed LSS model:
This section of the questionnaire was designed to validate the proposed model
for manufacturing organisations. The aim is to gain an understanding of the LSS
implementation procedures suitable for manufacturing organisations, identify
possible difficulties in implementing the proposed model and reveal the
accuracy level of the contents of the proposed Model in terms of helping
manufacturing organisations to gain competitive advantage in the long run. The
model was presented to the respondents with the respondents asked to
evaluate the model in terms of the following statements about the proposed
model based on the ranking below;

Chapter Four: Development and Validating LSS model
113
1–Strongly Disagree. 2– Disagree. 3– Moderate. 4– Agree. 5 –Strongly Agree
The results are presented as follows;
1. Evaluation - the contents of the proposed model
Table (C-7) in appendix (C) demonstrated that 35% of the respondents strongly
agreed with the contents of the LSS model, 45% agreed, 16% were moderate,
2% disagreed while 2% strongly disagreed. Therefore, 80% in total fully support
the contents of the proposed model. Taking into consideration the results of the
reliability and validity tests shown previously in this chapter, this can be
considered a high percentage.
2. Evaluation - The suitability of the proposed LSS model for manufacturing
organisations:
Table C-8 in appendix (C) demonstrated that 20% of the respondents strongly
agreed with the contents of the LSS model, 51% agreed, 25% were moderate,
2% disagreed while 2% strongly disagreed. Similarly, the suitability of the
proposed model is fully supported, at 71%.
3. Evaluation – The ability of the proposed model to boost competitiveness and
profit
Table (C-9) in appendix (C) showed that up to 38% of the respondents strongly
agreed with the contents of the conceptual LSS model, 31% agreed, 25% were
moderate, 4% disagreed while 2% strongly disagreed. Therefore, 69% fully
supported the proposed model in terms of their capacity to achieve
competitiveness and profit of their organisation.
Chapter Four: Development and Validating LSS model
114
4. Evaluation - The ability of the model to overcome the complexity of LSS
implementation:
Table (C-10) in appendix (C) demonstrated that 25% of the respondents
strongly agreed with the contents of the LSS model, 50% agreed, 20% were
moderate, 3% disagreed while 2% strongly disagreed. Then in total, 75% were
entirely in agreement that the proposed model will overcome the complexity of
the implementation.
5. Evaluation – Covering any potential difficulty in implementing the proposed
model
Table (C-11). In appendix (C) demonstrated that 82% of the respondents
indicated that they foresee no difficulty implementing the proposed model.
However, 18% listed some difficulties, such as the existence of too many
models. Some markets being more subject to the prices of goods and services
than quality, process or internal procedures. Organisation's size, the high cost
of training and the ability to adopt the model to suit organisation with multiple
products or services were other key factors.
6. Evaluation - Identifying anything missing and should be added to the contents
of the proposed model.
Table (C-12) in appendix (C) demonstrated that 89% of the respondents
indicated that the contents of the model are complete. Only 11% suspected that
something was missing from the model. They suggested that adequate training
should be included in the conceptual model; ANOVA should be adopted as a
method of testing the results from DOE against the actual prediction and
incentives that were introduced to encourage team cooperation.

Chapter Four: Development and Validating LSS model
115
4.6.2.2.5. Section E: Evaluation - the CSFs and factors impeding the
successful implementation of LSS:
This section of the survey was intended to understand the CSFs required for a
successful implementation of Lean Six-Sigma and also the barriers that can
hinder the implementation process in the manufacturing organisation.
1. Evaluating-the importance of the CSFs in the implementation of LSS
The main aim of this part of the study is to assess the CSFs that are required
for successful implementation of LSS. The respondents were asked to rate the
importance of 12 CSFs in the survey, The Likert scale used in this part are: 1-5,
where 1 - Not important 2 – Slightly important 3 – Important 4 – quite Important
5-Very important
Table (C-13) in appendix (C): demonstrated that most of the CSF’s were
considered to be important since the majority of the respondents indicated that
the highest percentage level (%) fell between Moderate and very important on
the scale. However, certain CSF’s were rated of higher importance with a rate
higher than 50%: Training and education, top management involvement and
participation, linking to business strategy, monitoring and evaluation of
performance and effective Communication were classified as very important
CSFs and have been rated as 69.1%, 62.5, 58.2%, 51.9% and 50.9%,
respectively. These are the most important CSFs for a successful Lean Six-
Sigma implementation.
2. Factors impeding LSS implementation
The respondents were asked to rate the extent to which the 11 identified
barriers factors can impede the successful implementation of LSS in
manufacturing organisations. Eleven barriers factors were identified by the
existing literature review (Johannes, 2013), (Antony, 2009) and (Andersson et
Chapter Four: Development and Validating LSS model
116
al., 2006). These barriers factors were rated using the Likert scale of 1-5; where
1- corresponds to very low, 2- Low, 3- Moderate, 4-High and 5-Very high.
Table (C-14) in appendix (C) demonstrated that the majority of the respondents
indicated that the greatest percentage level (%) fell on the high side of Likert
scale for the most impeding factors. Poor training and coaching and the lack of
tangible results were considered to be the most impeding factors for LSS
implementation, whereas the greatest percentage for these two factors fell very
high Likert scale with a percentage of 42.9% and 37%, respectively.
4.7. Validation of the critical success factors
In order to validate the CSFs, the questionnaire instruments must be measured
in terms of validity to ensure whether the accuracy and truthfulness of the
results obtained are valid and to what extent the instruments measure what they
are supposed to measure. As discussed in chapter 3 section (3.6.2.2), factor
analysis undertaken to assess the instruments was used to evaluate the CSFs
and, thereby, to confirm the construct validity.
4.7.1. Results of factor analysis
The first step is a factorability test: This is used to examine the
appropriateness of the data for factor analysis. The results in table (4.8).
demonstrated that all the requirements are met, where KMO is 0.823 and the
sphericity test is significant.
Note; (df) in this test is basically calculated using the following formula (Kaiser,
1981)
df = ((number of items)*(number of items-1))/2

Chapter Four: Development and Validating LSS model
117
Table 4. 8. KMO and Bartlett's Test
Second factor extraction; the results obtained from the first trail were
relatively satisfactory, since the results of PCA in table (4.9) extracted only 2
latent factors. With Eigenvalue exceeding 1.00 and accounting for 61.69% of
the total variation necessary to meet the requirements in which latent factors
are the underlying factors or the variables that are not directly observed.
However, the latent factors are typically obtained through statistical calculations
taken from the observation of the variables. Additionally, the latent variable
relates to the set of observed variables, finally, latent factors in factor analysis
are considered to be a measurement for construct validity (Williams et al. 2012).
in this study two latent factors extracted, and it will be interpreted and labelled in
further step.
Table 4.9. Total Variance Explained
Kaiser-Meyer-Olkin Measure of Sampling Adequacy. .823
Bartlett's Test of Sphericity Approx. Chi-Square 353.131
df 66
Sig. .000
Latent factors
Initial Eigenvalues Extraction Sums of Squared Loadings
Rotation Sums
of Squared
Loadingsa
Total % of Variance Cumulative % Total % of Variance Cumulative % Total
1 6.290 52.419 52.419 6.290 52.419 52.419 5.510
2 1.113 9.276 61.696 1.113 9.276 61.696 5.331
3 .841 7.012 68.708
4 .741 6.175 74.883
5 .687 5.722 80.605
6 .545 4.539 85.144
7 .487 4.058 89.202
8 .394 3.284 92.487
9 .373 3.109 95.596
10 .239 1.988 97.584
11 .175 1.462 99.046
12 .115 .954 100.000
Extraction Method: Principal Component Analysis.
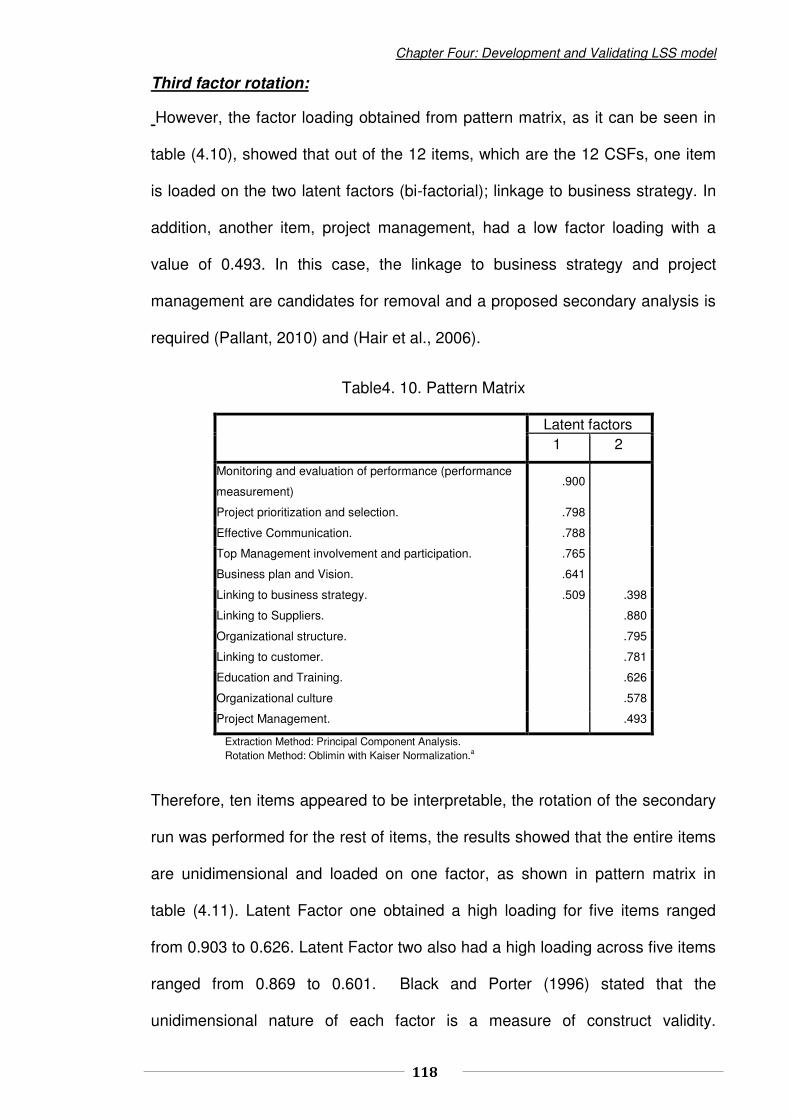
Chapter Four: Development and Validating LSS model
118
Third factor rotation:
However, the factor loading obtained from pattern matrix, as it can be seen in
table (4.10), showed that out of the 12 items, which are the 12 CSFs, one item
is loaded on the two latent factors (bi-factorial); linkage to business strategy. In
addition, another item, project management, had a low factor loading with a
value of 0.493. In this case, the linkage to business strategy and project
management are candidates for removal and a proposed secondary analysis is
required (Pallant, 2010) and (Hair et al., 2006).
Table4. 10. Pattern Matrix
Latent factors 1 2
Monitoring and evaluation of performance (performance
measurement) .900
Project prioritization and selection. .798
Effective Communication. .788
Top Management involvement and participation. .765
Business plan and Vision. .641
Linking to business strategy. .509 .398
Linking to Suppliers. .880
Organizational structure. .795
Linking to customer. .781
Education and Training. .626
Organizational culture .578
Project Management. .493
Extraction Method: Principal Component Analysis. Rotation Method: Oblimin with Kaiser Normalization.a
Therefore, ten items appeared to be interpretable, the rotation of the secondary
run was performed for the rest of items, the results showed that the entire items
are unidimensional and loaded on one factor, as shown in pattern matrix in
table (4.11). Latent Factor one obtained a high loading for five items ranged
from 0.903 to 0.626. Latent Factor two also had a high loading across five items
ranged from 0.869 to 0.601. Black and Porter (1996) stated that the
unidimensional nature of each factor is a measure of construct validity.
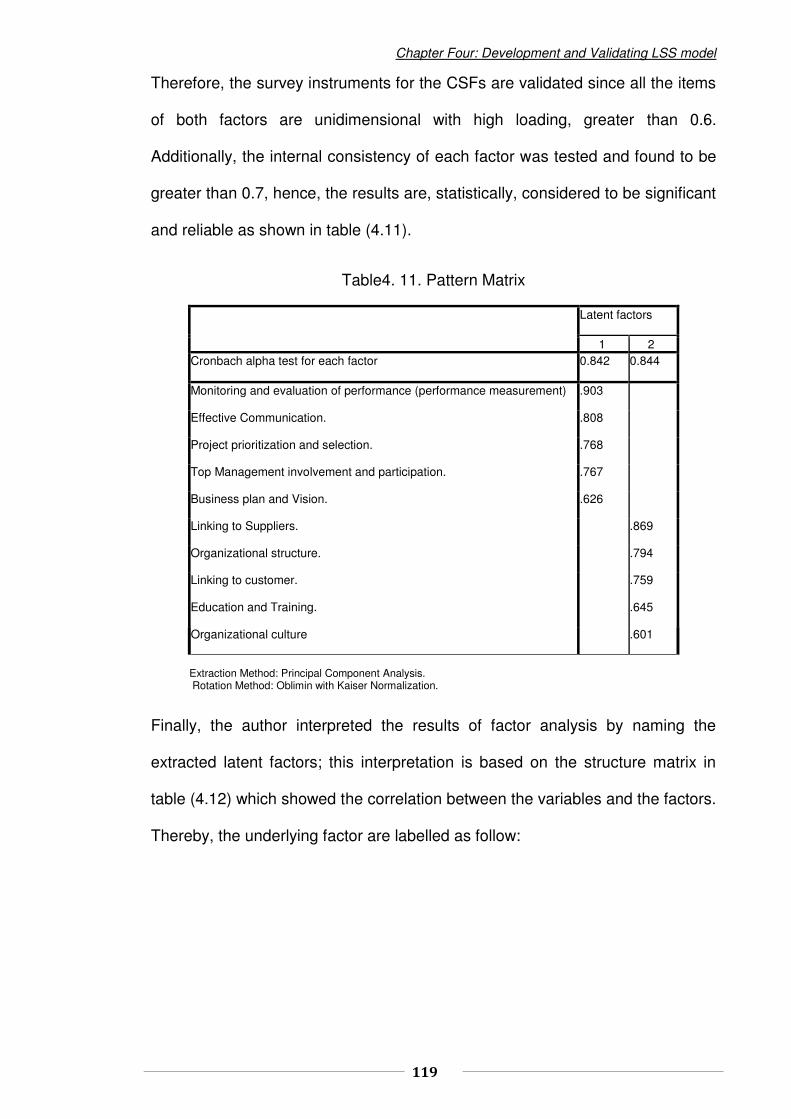
Chapter Four: Development and Validating LSS model
119
Therefore, the survey instruments for the CSFs are validated since all the items
of both factors are unidimensional with high loading, greater than 0.6.
Additionally, the internal consistency of each factor was tested and found to be
greater than 0.7, hence, the results are, statistically, considered to be significant
and reliable as shown in table (4.11).
Table4. 11. Pattern Matrix
Latent factors
1 2 Cronbach alpha test for each factor 0.842 0.844
Monitoring and evaluation of performance (performance measurement) .903
Effective Communication. .808
Project prioritization and selection. .768
Top Management involvement and participation. .767
Business plan and Vision. .626
Linking to Suppliers. .869
Organizational structure. .794
Linking to customer. .759
Education and Training. .645
Organizational culture .601
Extraction Method: Principal Component Analysis. Rotation Method: Oblimin with Kaiser Normalization.
Finally, the author interpreted the results of factor analysis by naming the
extracted latent factors; this interpretation is based on the structure matrix in
table (4.12) which showed the correlation between the variables and the factors.
Thereby, the underlying factor are labelled as follow:

Chapter Four: Development and Validating LSS model
120
Table4. 12. Structure Matrix
Latent factors
1 2
Monitoring and evaluation of performance (performance measurement). .852 .461
Project prioritization and selection. .830 .535
Effective Communication. .798 .491
Business plan and Vision. .768 .597
Linking to business strategy. .749 .705
Top Management involvement and participation. .734 .408
Linking to Suppliers. .453 .834
Organisational structure. .502 .809
Education and Training. .599 .760
organisational culture .582 .718
Linking to customer. .356 .712
Project Management. .585 .667
Extraction Method: Principal Component Analysis. Rotation Method: Oblimin with Kaiser Normalization
Latent Factor 1. Operation elements
These elements are highly correlated with latent factor 1, as shown in table
(4.12), the elements represent 52.4% of the variance, see table 4.9. The items
are related to the operation process of LSS-model and have a significant impact
on the process performance; in this study, these elements are considered to be
the key successful driver for implementation of the LSS model, the internal
consistency of this factor is 0.842. The correlation among the observed items
(CSFs) and latent factor are shown in Table 4.12 and Figure 4.4.
Mentoring and evaluation of
performance
Effective communication
Business plan and vision
Project prioritization
Top management involvement
Factor 1
Operation elements
Figure 4. 4. The correlation between Latent factor 1 and CSFs
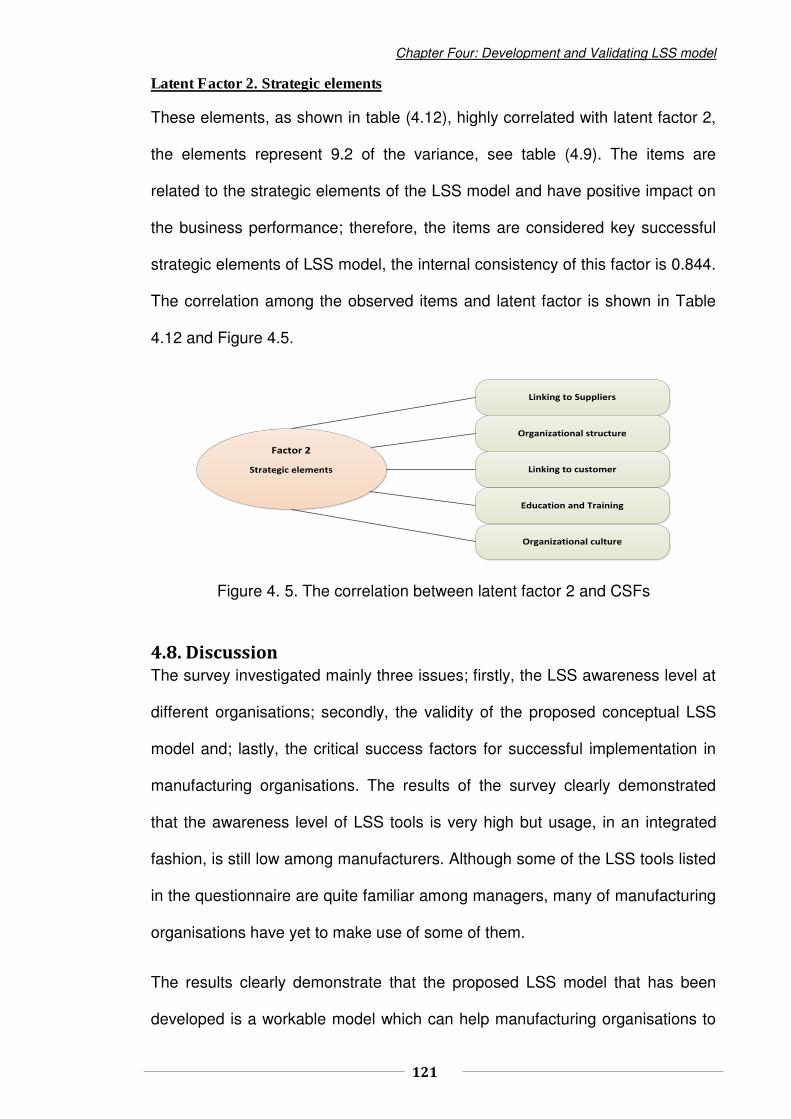
Chapter Four: Development and Validating LSS model
121
Latent Factor 2. Strategic elements
These elements, as shown in table (4.12), highly correlated with latent factor 2,
the elements represent 9.2 of the variance, see table (4.9). The items are
related to the strategic elements of the LSS model and have positive impact on
the business performance; therefore, the items are considered key successful
strategic elements of LSS model, the internal consistency of this factor is 0.844.
The correlation among the observed items and latent factor is shown in Table
4.12 and Figure 4.5.
Linking to Suppliers
Organizational structure
Organizational culture
Linking to customer
Education and Training
Factor 2
Strategic elements
Figure 4. 5. The correlation between latent factor 2 and CSFs
4.8. Discussion
The survey investigated mainly three issues; firstly, the LSS awareness level at
different organisations; secondly, the validity of the proposed conceptual LSS
model and; lastly, the critical success factors for successful implementation in
manufacturing organisations. The results of the survey clearly demonstrated
that the awareness level of LSS tools is very high but usage, in an integrated
fashion, is still low among manufacturers. Although some of the LSS tools listed
in the questionnaire are quite familiar among managers, many of manufacturing
organisations have yet to make use of some of them.
The results clearly demonstrate that the proposed LSS model that has been
developed is a workable model which can help manufacturing organisations to
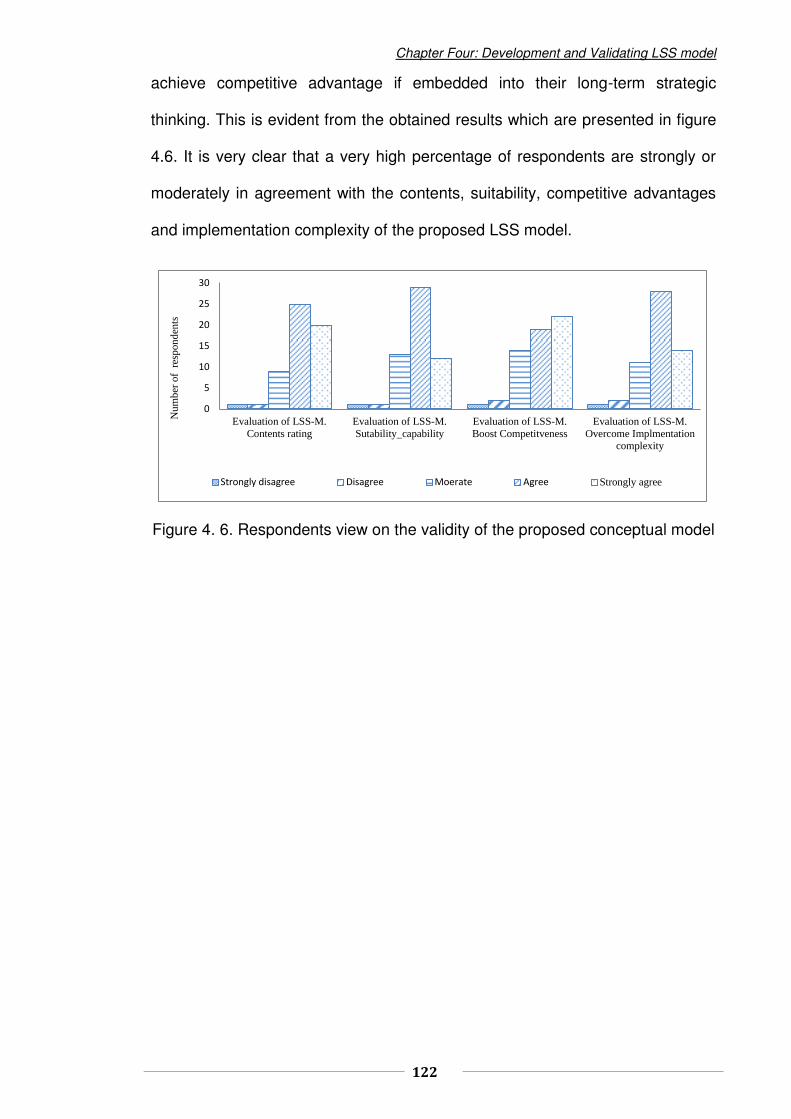
Chapter Four: Development and Validating LSS model
122
achieve competitive advantage if embedded into their long-term strategic
thinking. This is evident from the obtained results which are presented in figure
4.6. It is very clear that a very high percentage of respondents are strongly or
moderately in agreement with the contents, suitability, competitive advantages
and implementation complexity of the proposed LSS model.
Figure 4. 6. Respondents view on the validity of the proposed conceptual model
0
5
10
15
20
25
30
Evaluation of LSS-M.Contents rating
Evaluation of LSS-M.Sutability_capability
Evaluation of LSS-M.Boost Competitveness
Evaluation of LSS-M.Overcome Implmentation
complexity
Strongly disagree Disagree Moerate Agree Strongly agree
Num
ber
of r
espo
nden
ts

Chapter Four: Development and Validating LSS model
123
4.9. Conclusion
The study in this chapter demonstrated the output of the key question of the
research, the development of the Lean Six-Sigma implementation model for
manufacturing organisations and the realisation of the main objectives. Lean
Six-Sigma implementation requires the full commitment from the top
management and the employees involved. To gain competitive advantage for a
long term period, Lean Six-Sigma implementation should be integrated into the
organisations through long-term strategic thinking. This will shape the
management’s strategies and vision to which the managers have to be
committed and also guide the employees to achieve improved processes,
reduce variations, reduce waste and meet or surpass customers’ expectations.
Although Lean Six-Sigma has been implemented in a good number of
manufacturing organisations around the world there are still many others only
recently made aware of it and, for them, Lean Six-Sigma implementation is still
at an early stage.
Even for those organisations that have used most of the 26 LSS tools and
techniques presented in this research, the majority are yet to adopt Lean and
Six-Sigma as an integrated approach and embrace this initiative into their
strategic planning, hence the need for the proposed developed model. Most of
the organisations already have the required culture that will make the
implementation process easier but a lot has to be done in terms of training and
education so that most managers will fully understand LSS and the potential
benefits. It is expected that the proposed model will bridge the gap between the
theoretical and practical sides of Lean Six-Sigma implementation in
manufacturing organisations and consequently have a positive economic impact
on their strategic objectives.

124
Chapter 5:
Development and validation of Six-Sigma and TQM
integrated model
5.1. Introduction .................................................................................................................................. 125
5.2. Integrating Six-Sigma and TQM ................................................................................................... 126
5.2.1. The critical components of Six-Sigma implementation ............................................................. 127
5.2.2. The critical components of TQM implementation ..................................................................... 129
5.3. The CSFs for successful implementation of the SS-TQM integrated model ............................... 130
5.4. Business excellence in quality management system ................................................................... 131
5.5. The strategic plan for developing the SS-TQM integrated model ................................................ 132
5.6. The proposed SS-TQM integrated model for achieving business excellence ............................. 133
5.7. Validation of the SS-TQM integrated Model ................................................................................ 136
5.7.1. Research methodology ............................................................................................................. 136
5.7.2. Data collection and analysis ..................................................................................................... 137
5.7.2.1. Integrity data analysis ............................................................................................................ 137
5.7.2.2. Descriptive analysis ............................................................................................................... 141
5.8. Validation of the critical success factors ...................................................................................... 152
5.8.1. Results of factor analysis test ................................................................................................... 152
5.9. Discussion .................................................................................................................................... 157
5.10. Conclusions ................................................................................................................................ 158

Chapter Five: Development and Validating SS-TQM model
125
5.1. Introduction
The rapid development of the application of technology in the recent years has
caused considerable change in the market environment. Consequently,
improving business process has become the major priority for manufacturing
and services organisations. This dramatic change has forced businesses to
pursue speed, innovation, quality and value (Yang, 2004). This has meant that
quality management has gained considerable attention and provided a new
approach to management systems such as integrated quality management and
business excellence.
This chapter starts by discussing how Six-Sigma and TQM is being integrated,
then it provided a comprehensive study regarding the essential elements and
implementation procedures of each method in order to understand the strategic
and the implementation procedures of the methods, additionally covering the
critical success factors for the successful implementation of the proposed
conceptual model which is also selected and identified. Furthermore, business
excellence in quality management is discussed as well as a clarification as to
how to produce performance excellence and obtain sustainable improvement
within a quality system. There is a proposal for a strategic plan to achieve
business excellence in quality management along with the development of this
plan and the way in which the plan guides the study to develop the proposed
modal. Finally, a questionnaire survey was applied to verify and validate the
model; therefore, the validation steps were carried out in order to lead to the
desired result.

Chapter Five: Development and Validating SS-TQM model
126
5.2. Integrating Six-Sigma and TQM
Based on the previous comparison between Six-Sigma and TQM that clarified
the similarity and differences the two methods (see chapter 3 section (2.4.5))
and by referring to the project motivation for both methods (discussed in chapter
3 section (2.5.5.2)) the project motivation provided the research with three key
drivers for integrating Six-Sigma and TQM. These are; the similarity between
both methods, the existing synergy between both approaches and how Six-
Sigma can be incorporated as the core method of the proposed model due to
the power provided by the DMAIC improvement strategy as well as the use of
its tools and techniques. In addition, the critical relationship between these
methods (see chapter two sections (2.7.4)) revealed that both methods can
complement each other, with respect to process implementation and
achievement of the final results. Finally, how the CSFs identified for
implementing the methods can help to facilitate the implementation process of
the proposed model.
However, to develop a robust integrated model the essential elements and
procedures for implementation of each method must be studied and discussed
in order to identify the strategic and the operational components of the
proposed model. Additionally, the CSFs for successful implementation and the
proposed conceptual model also must be identified. Finally, business
excellence in quality management should be discussed and a clarification as to
how to achieve performance excellence and obtain sustainable improvement in
quality system. In this way, the strategic plan for achieving business excellence
in quality management would be developed to guide the study for developing
the proposed model.
Chapter Five: Development and Validating SS-TQM model
127
5.2.1. The critical components of Six-Sigma implementation
Yang (2012), Henderson and Evans (2000), Srinivasu et al. (2009) discussed
how to implement Six-Sigma; However, there is a consensus among these
studies that the implementation process of Six-Sigma initiative consisting of
three main components;
1. Process Improvement of Six-sigma (DMAIC).
2. Staff roles for effective operations.
3. Training program.
1. Improvement process (DMAIC); the improvement methodology of Six-
Sigma discussed in chapter two see section (2.2.3).
2. Staff roles; Six-Sigma method is a highly disciplined system. The process
management of Six-Sigma and the strategic implementation procedure is based
on specific roles and a top-down structure. The responsibility and tasks in Six-
Sigma are mainly delivered as follows:
Senior management; is responsible for the success the project through the
provision of the following possibilities:
Providing the resources.
Selecting strong leadership.
Providing sufficient support.
The Chief executive (CEO) is considered the key driver of Six-Sigma project
with the main responsibilities and tasks as follows:
Establish the vision.
Develop the strategy.

Chapter Five: Development and Validating SS-TQM model
128
Drive the changes.
The chief executive delivers the above tasks through the team leaders who may
be champions, master black belts, black belts, green belts and other workers.
Each level has part of the responsibility and tasks, and all of these team leaders
who are part of the chief executive, the tasks of each level are as follows:
Champions may to the person or team who is responsible for Six-Sigma
projects and Six-Sigma efforts (head of major functional organisation).
Master Black belt (MBB) is a teacher and consultant for the Six-Sigma projects,
also working with champions to coordinate project selection and training, and
work with or train coach BB and GB and is the individual who communicates the
overall progress.
Black belt (BB); is a person with high skills and experience responsible for
executing and schedule the Six-Sigma projects. Typically working under MBB
and applying Six-Sigma tools and techniques for controlling the products and
processes.
Green belt (GB); is the process owner lead by a BB. Their main task is to
maintain the successful application of Six-Sigma techniques and lead small-
scale improvement projects in their area.
3. Training Program; Six-Sigma invests heavily in the training the employees,
the training program is designed for the whole Six-Sigma team from CEO,
champion, MBB, BB, GB, YB and extended to all employees, the training covers
team leadership skills, qualitative tools, quantitative tools, planning and
implementation skills.
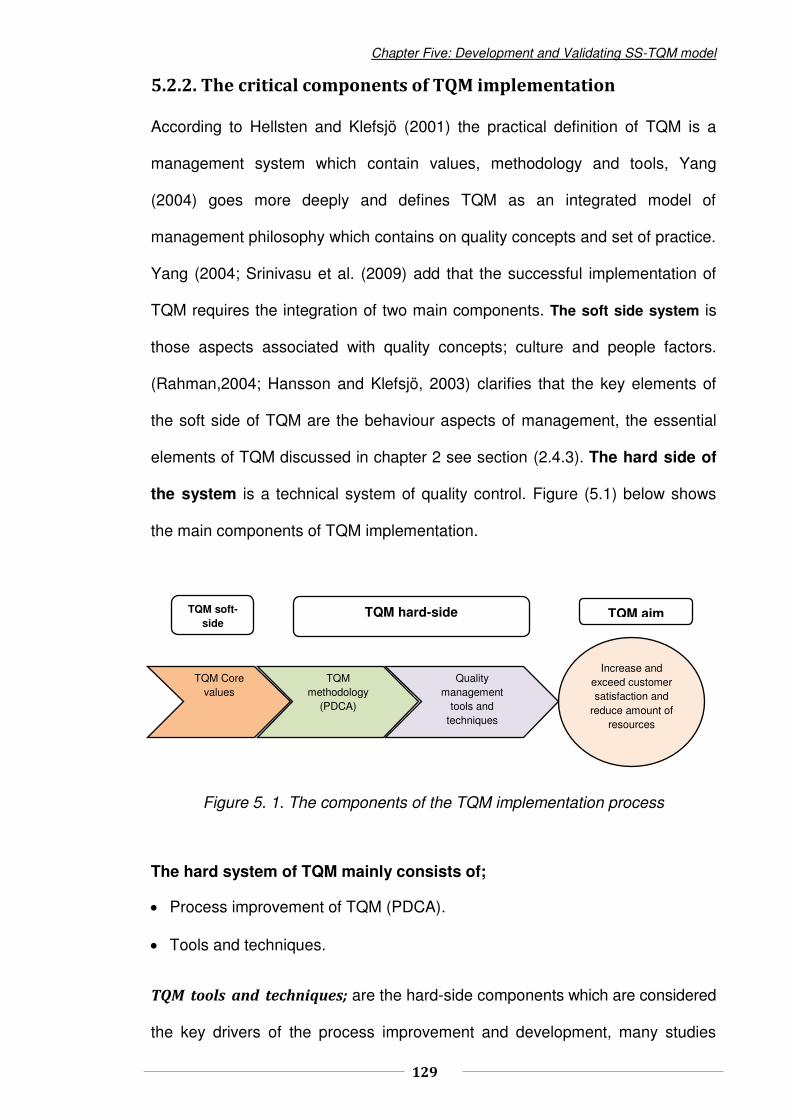
Chapter Five: Development and Validating SS-TQM model
129
5.2.2. The critical components of TQM implementation
According to Hellsten and Klefsjö (2001) the practical definition of TQM is a
management system which contain values, methodology and tools, Yang
(2004) goes more deeply and defines TQM as an integrated model of
management philosophy which contains on quality concepts and set of practice.
Yang (2004; Srinivasu et al. (2009) add that the successful implementation of
TQM requires the integration of two main components. The soft side system is
those aspects associated with quality concepts; culture and people factors.
(Rahman,2004; Hansson and Klefsjö, 2003) clarifies that the key elements of
the soft side of TQM are the behaviour aspects of management, the essential
elements of TQM discussed in chapter 2 see section (2.4.3). The hard side of
the system is a technical system of quality control. Figure (5.1) below shows
the main components of TQM implementation.
Figure 5. 1. The components of the TQM implementation process
The hard system of TQM mainly consists of;
Process improvement of TQM (PDCA).
Tools and techniques.
TQM tools and techniques; are the hard-side components which are considered
the key drivers of the process improvement and development, many studies
Increase and exceed customer satisfaction and
reduce amount of resources
TQM soft-
side TQM hard-side TQM aim
Quality management
tools and techniques
TQM methodology
(PDCA)
TQM Core values

Chapter Five: Development and Validating SS-TQM model
130
agree on the vital role played by the use of quality management tools and
techniques to improve and develop the quality process (Klefsjö et al., 2008).
Jafari and Setak (2010) identified that most tools have a statistical basis to
facilitate and analyse the products and process and are then used to support
the decision. In the implementation of TQM, the strategic technique for process
improvement is the Deming improvement cycle (PDCA) which corresponds with
the seven statistics tools and techniques used to determine quality.
5.3. The CSFs for successful implementation of the SS-TQM integrated
model
Mainly, there are no clear success factors mentioned in the literature regarding
integrating Six-Sigma and TQM; However, the factors that were ranked as an
effective success factor for Six-Sigma and TQM implementation by numerous
studies (Henderson and Evan, 2000; Ho et al.,2000; Antony and Banuelas,
2002; Yang, 2012). The critical success factors for integrating the above
approaches are listed by Antony (2010):
1. Organisation infrastructure.
2. Top management and leadership support.
3. Investment in training.
4. Middle management involvement.
5. Communication.
6. Understanding DMAIC strategy to deal with quality issues.
7. Understanding the usage of Six-Sigma and TQM tools and techniques and
how to use in the right action.
8. Investing the adequate resources.
9. Utilization of IT to support implementation.
10. Use of the best talent.

Chapter Five: Development and Validating SS-TQM model
131
11. Knowledge and competence for the employees.
12. Ability to learn from mistakes and history.
5.4. Business excellence in quality management system
Klefsjo et al. (2008) define excellence as a term describing quality in which
Business Excellence or Performance Excellence is an integrated system
intending to achieve long-term success, high-quality results and improvement.
Vora, (2002) suggested that business excellence can be achieved by
understanding the principle of quality management methods and by
implementing quality management in practice. To obtain business excellence
within manufacturing organisation, the quality management system must be
developed to meet the level of sustainable improvement which provides long-
term success and customer loyalty (ibid). Those two improvement levels are the
critical goals of the business excellence (ibid).
The view supported by Yang (2012) is that business excellence represents a
degree of superiority. It is integrated system between quality management
methods and based on the pursuit of continuous improvement rooted both in
organisation's results and the way of achieving. Moreover, Vora (2002) stated
that three major improving elements can lead to the attainment of business
excellence: the concerted effort to delight customers, the streamlining of
process and the satisfaction of the employees. These components must be
organised in a strategic discipline, working in harmony in order to attain the
operational improvement and high financial results found to lead to business
excellence. Based on the above concept, the author developed a strategic plan
for achieving business excellence model by integrating Six-Sigma and TQM for

Chapter Five: Development and Validating SS-TQM model
132
manufacturing organisations, the strategic plan was designed as a basis for
developing the integrated model, the strategic plan describes how the integrated
model can be implemented to achieve the main goal.
5.5. The strategic plan for developing the SS-TQM integrated model
The strategic plan consists of four stages and each stage includes several
elements; the first stage being the primary stage. Here, the key strategic
improvement of both methods is integrated to set out the required strategic plan
for driving the organisation to meet the final target. The second stage is the
essential stage; when the key activities of both concepts are combined together
to determine the efforts required to satisfy the customer needs and drive the
process to obtain better performance as well as focusing on the employees to
achieve high operational performance. The third stage is the outcome; it is the
attainment of expected results from previous stages, these are continuous
improvement, process improvement and high operational performance. The last
stage is the target of the strategic map; long-term success and customer loyalty
that, in turn, lead to business excellence, the strategic plan is displayed in figure
(5.2) below.
Figure 5. 2. The Strategic Plan for integrating Six-sigma and TQM
Long term
Success
Customer
Loyalty
Bu
sin
es
s E
xcelle
nc
e
Setup
The prime elements of
strategic quality
management
Determine the efforts to delight
customers
Streamline the process
(Simplify the process)
Satisfy the employees
Continuous
improvement
Process
improvement
High
operational
performance
Prime Outcomes Target Principles

Chapter Five: Development and Validating SS-TQM model
133
5.6. The proposed SS-TQM integrated model for achieving business
excellence
Primarily, the study revealed that the origins, principles, techniques, and goals
of Six-Sigma and TQM are similar; however, the way they achieve their
objectives are different. Therefore, the proposed conceptual model seeks to
unify the management system by cultivating a culture of quality and a realisation
of the environment of innovation, the model developed was based on the
improvement methodology of Six-Sigma (DMAIC) and improvement activity of
TQM, which are integrated to unify the management system and facilitate the
implementation process in order to obtain improved performance. Where
DAMAIC is the key strategy of Six-Sigma for achieving process improvement,
the process activity of TQM is represented by the Quality Control Circle and
Quality Improve Team (QCC and QIT). The purpose is to enable manufacturing
organisations to present opportunities for quality improvement by involving
everyone in the organisation, streamline the operation process and hence,
attaining business excellence.
Therefore, the model developed in figure (5.3) consists of three main elements;
Strategic elements, Implementation elements and Performance excellence
elements. Strategic elements are the essential elements of the model to unify
the business process and success the implementation procedures
Implementation elements are the key driver of the model for smoothing the
operation process, driving out quality problems and attaining high quality
operation performance. Performance excellence elements are the key
measures of the model for sustaining continuous improvement and attaining

Chapter Five: Development and Validating SS-TQM model
134
performance excellence. Therefore, the steps towards implementation of the
conceptual model are summarized into seven steps as follows:
Evaluating and assessing the organisation using Six-Sigma strategy
combined with TQM concepts in order to set up the key strategic elements;
recognizing the mission, determine the vision, identifying the main objectives,
provision the required resources and capturing the customer needs which are
the main drivers of the process improvement.
Enhancing the culture of quality by applying Six-Sigma training associated
with TQM concepts and, thereby, realise innovation
Utilising IT system support for digitising the process and enhancing the
implementation procedures.
Emphasizing the involvement of middle management in the system to attain
better coordination between the workers and make the organisation more
integrated.
Integrating Six-Sigma DMAIC with improvement activity of TQM (QCC and
QIT) to enhance the process improvement by realising of employee's
participation and make everyone involved in the organisation.
Learning from mistakes by taking action to achieve high quality and placing
an emphasis on continuous improvement.
Ensuring the deliverables were met or exceeded customer satisfaction by
applying VOC and balanced scored Card in order to fulfil customer delight
and achieve performance excellence
All of the above steps are integrated with two critical drivers. One of which is top
management and leadership support to attain complete participation and team-
work, realise the management empowerment and self-control as well as human

Chapter Five: Development and Validating SS-TQM model
135
resource management (HRM) for managing and developing manpower (see the
right side part of the proposed model).
The other critical driver is customer management, for capturing the customer
requirements through high-quality customer services in order to follow-up the
value of the products and services with respect to the customer perspective
(see the left side part of the proposed model).
YesNo
Organisation strategy and system support
Six-Sigma strategic and TQM Concepts
Investment in Training
IT support for digitising processes
Middle management involvement
Verifying to fulfil customer requirements Balanced scorecard card and customer satisfaction survey
Cu
sto
me
r M
an
ag
em
en
t
To
p m
an
ag
em
en
t a
nd
le
ad
ers
hip
su
pp
ort
Bottom up management
Top down management
Continuous improvement
Learn from mistakes
Take action to high quality
Strategic elements
Realisation the mission
Setup the vision
Identify the objectives
Provision the resources
Capture the customer needs
Customer oriented
Quality concepts
Zero defects
Innovation oriented
Culture change and realisation of innovation
HR
MR
elis
ati
on
of
tea
mw
ork
a
nd
pa
rtic
ipa
tio
nT
ea
m e
mp
ow
erm
en
t
Co
re b
us
ine
ss
d
ev
elo
pm
en
ts
an
aly
se
cu
sto
me
rs
fee
db
ac
kH
igh
qu
ality
c
us
tom
er
se
rvic
e
Performance excellence elements
Implementation elements
TQMQCC &CIT
Six SigmaDMAIC
Performance excellence
Customer loyaltyLong term success
Figure 5. 3. Six-Sigma TQM Integrated conceptual model
Chapter Five: Development and Validating SS-TQM model
136
5.7. Validation of the SS-TQM integrated Model
5.7.1. Research methodology
The method employed in this study for gathering data was a questionnaire
survey; the aim is to investigate the suitability of the proposed integrated SS-
TQM integrated model to achieve business excellence in manufacturing
organisations. The questionnaire was also designed for another purpose, to
collect the required data from professionals and experienced employees in the
available manufacturing organisations and academics related to the topic. The
first section concerns background information, it was intended to present a clear
picture of the respondent’s background and understand the level of awareness
of Six-Sigma and TQM or any other quality program existing in their
organisation in order to determine if the organisation has the right culture for the
proposed model. The second section, investigated the awareness and
usefulness of Six-Sigma TQM tools and techniques to manufacturing
organisations, this part was intended to investigate the extent to which the SS-
TQM integrated approach will be appropriate to the manufacturing organisations,
It will also give an indication of how the proposed approach will be accepted by
top management and other employees in manufacturing organisations.
The third section, validation of the proposed model was intended to evaluate the
proposed model based on eight criteria: the contents of the strategic elements,
the contents of the implementation elements, the contents of the performance
excellence elements, the applicability of the model for manufacturing
organisations, the ability of the model to achieve competitiveness, the ability to
overcome natural Six-Sigma/TQM implementation difficulties, the ability of the
model to help manufacturing organisation to achieve their long-term goals and
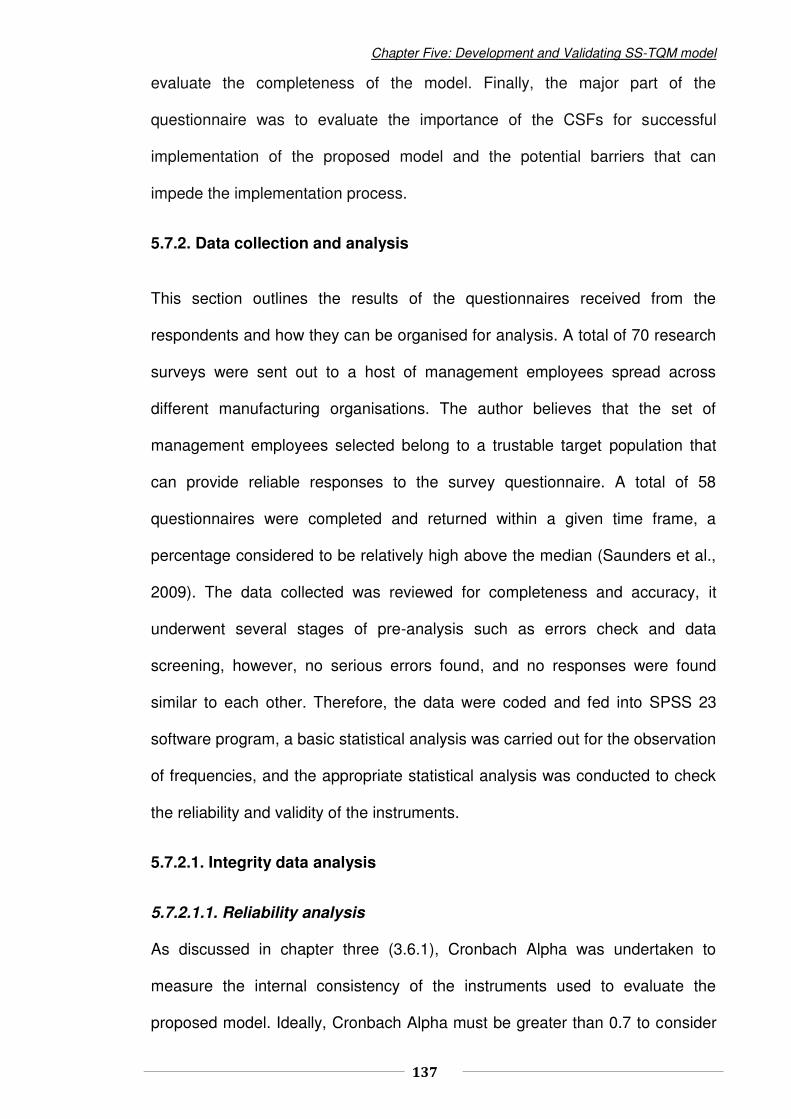
Chapter Five: Development and Validating SS-TQM model
137
evaluate the completeness of the model. Finally, the major part of the
questionnaire was to evaluate the importance of the CSFs for successful
implementation of the proposed model and the potential barriers that can
impede the implementation process.
5.7.2. Data collection and analysis
This section outlines the results of the questionnaires received from the
respondents and how they can be organised for analysis. A total of 70 research
surveys were sent out to a host of management employees spread across
different manufacturing organisations. The author believes that the set of
management employees selected belong to a trustable target population that
can provide reliable responses to the survey questionnaire. A total of 58
questionnaires were completed and returned within a given time frame, a
percentage considered to be relatively high above the median (Saunders et al.,
2009). The data collected was reviewed for completeness and accuracy, it
underwent several stages of pre-analysis such as errors check and data
screening, however, no serious errors found, and no responses were found
similar to each other. Therefore, the data were coded and fed into SPSS 23
software program, a basic statistical analysis was carried out for the observation
of frequencies, and the appropriate statistical analysis was conducted to check
the reliability and validity of the instruments.
5.7.2.1. Integrity data analysis
5.7.2.1.1. Reliability analysis
As discussed in chapter three (3.6.1), Cronbach Alpha was undertaken to
measure the internal consistency of the instruments used to evaluate the
proposed model. Ideally, Cronbach Alpha must be greater than 0.7 to consider

Chapter Five: Development and Validating SS-TQM model
138
the items being measured are consistent and reliable. (Field, 2002). Therefore,
the test was carried out for each of the eight statements used to evaluate the
proposed model, the results in table (5.1) showed that coefficient alpha is 0.91
and the standardized item alpha is 0.88, which is greater than 0.7, accordingly,
that is an indication that all of the items are consistent and reliable.
Table 5. 1. Reliability Statistics
Cronbach's Alpha
Cronbach's Alpha Based on
Standardized Items N of Items
.912 .887 8
However, the results in table (5.2), column three labelled ‘corrected item-total
correlation’, showed that there is a positive correlation between the whole items
except items number eight ‘Evaluating the model in terms of anything missing
and can be added to the proposed model’ which has negative correlation with
value ( -0.37). In addition, in column five labelled ‘Cronbach's Alpha if item
deleted’ the same item has the highest alpha value; 0.93. Therefore, if item
number eight were deleted from the calculation, then the Cronbach Alpha would
be improved.

Chapter Five: Development and Validating SS-TQM model
139
Table 5. 2. Item-Total Statistics
Scale Mean if
Item Deleted
Scale Variance if
Item Deleted
Corrected Item-
Total Correlation
Squared Multiple
Correlation
Cronbach's
Alpha if Item
Deleted
Evaluation the contents of the
strategic elements. 24.579 22.748 .746 .586 .898
Evaluation of the contents of
the implementation elements 24.544 22.145 .880 .795 .885
Evaluation of the contents of
the Performance excellence
elements
24.719 22.884 .780 .684 .895
Evaluation of the capability of
the model for manufacturing
organization 24.702 23.070 .722 .608 .900
Evaluation of the effectiveness
of the model to boost
organization’s competitiveness
and profit
24.737 22.447 .774 .689 .895
Evaluation of the ability of the
model to overcome the
complexity of TQM/Six Sigma
implementation
24.702 22.856 .789 .682 .894
Evaluation of the model in
terms to achieve the
organisation goals
24.579 23.034 .811 .683 .892
Evaluation of the model in
terms of any missing can be
added to the proposed model. 26.509 30.647 -.037 .165 .934
After deleting item eight and running the test again, the results in table (5.3)
demonstrated that Cronbach alpha is 0.93 and the standardized item Alpha is
0.93, also table (D-1) in appendix (D) showed that, in column three, all the items
are correlated with value above 0.3 and, in column five, the value of Cronbach
Alpha, if items were deleted ranged between 0.91 to 0.92, is greater than 0.7
Subsequently, it can be concluded that all the instruments have high internal
consistency and reliability.
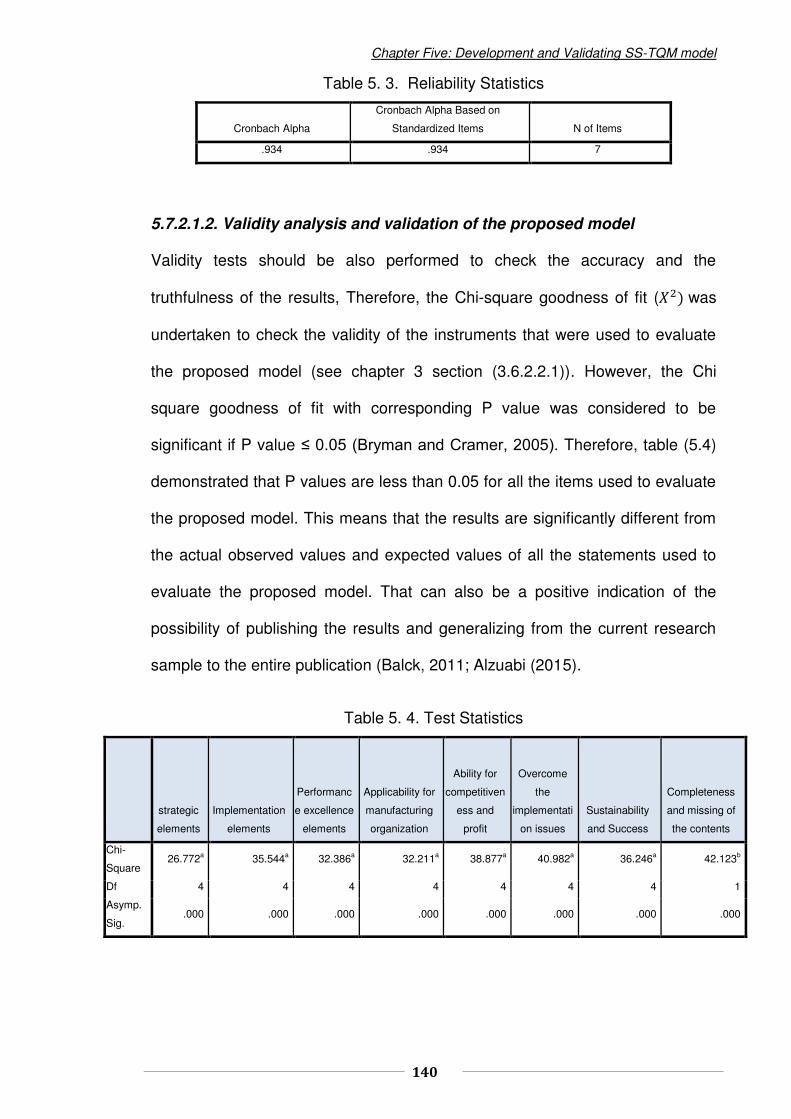
Chapter Five: Development and Validating SS-TQM model
140
Table 5. 3. Reliability Statistics
Cronbach Alpha
Cronbach Alpha Based on
Standardized Items N of Items
.934 .934 7
5.7.2.1.2. Validity analysis and validation of the proposed model
Validity tests should be also performed to check the accuracy and the
truthfulness of the results, Therefore, the Chi-square goodness of fit (� was
undertaken to check the validity of the instruments that were used to evaluate
the proposed model (see chapter 3 section (3.6.2.2.1)). However, the Chi
square goodness of fit with corresponding P value was considered to be
significant if P value ≤ 0.05 (Bryman and Cramer, 2005). Therefore, table (5.4)
demonstrated that P values are less than 0.05 for all the items used to evaluate
the proposed model. This means that the results are significantly different from
the actual observed values and expected values of all the statements used to
evaluate the proposed model. That can also be a positive indication of the
possibility of publishing the results and generalizing from the current research
sample to the entire publication (Balck, 2011; Alzuabi (2015).
Table 5. 4. Test Statistics
strategic
elements
Implementation
elements
Performanc
e excellence
elements
Applicability for
manufacturing
organization
Ability for
competitiven
ess and
profit
Overcome
the
implementati
on issues
Sustainability
and Success
Completeness
and missing of
the contents
Chi-
Square 26.772a 35.544a 32.386a 32.211a 38.877a 40.982a 36.246a 42.123b
Df 4 4 4 4 4 4 4 1
Asymp.
Sig. .000 .000 .000 .000 .000 .000 .000 .000

Chapter Five: Development and Validating SS-TQM model
141
5.7.2.2. Descriptive analysis
The same steps that have been taken for descriptive analysis in chapter 4
(section 4.6.2.2) the results of the data collected are demonstrated in the
following sections in form of tables, charts, graphs using SPSS 23.
5.7.2.2.1. Section A: Background information.
The aim of this part of the survey is to present a clear picture about the
respondent’s background and understand the awareness level of the existing
quality program in manufacturing organisations. This is necessary to determine
if organisations have the right culture for the integrated SS-TQM proposed
model.
1. Respondent's position
The respondents were asked to state their position within their organisation.
The results in the table (5.5) demonstrated that 14% of the respondents are
quality managers, 21.1% are operational managers, 24.6% academics
comprised postgraduate students and research students who are related to
industrial engineering and manufacturing management, 3.5% are directors,
10.5 % quality engineers, 10.5% fulfil belt functions, including the LSS trained
professionals like master Black belt, Black belt, Green belt and Yellow belt.
Working in the same capacity for an organisation, 7.0% including project
leaders and heads of department and, finally, 5.0% are coordinators.
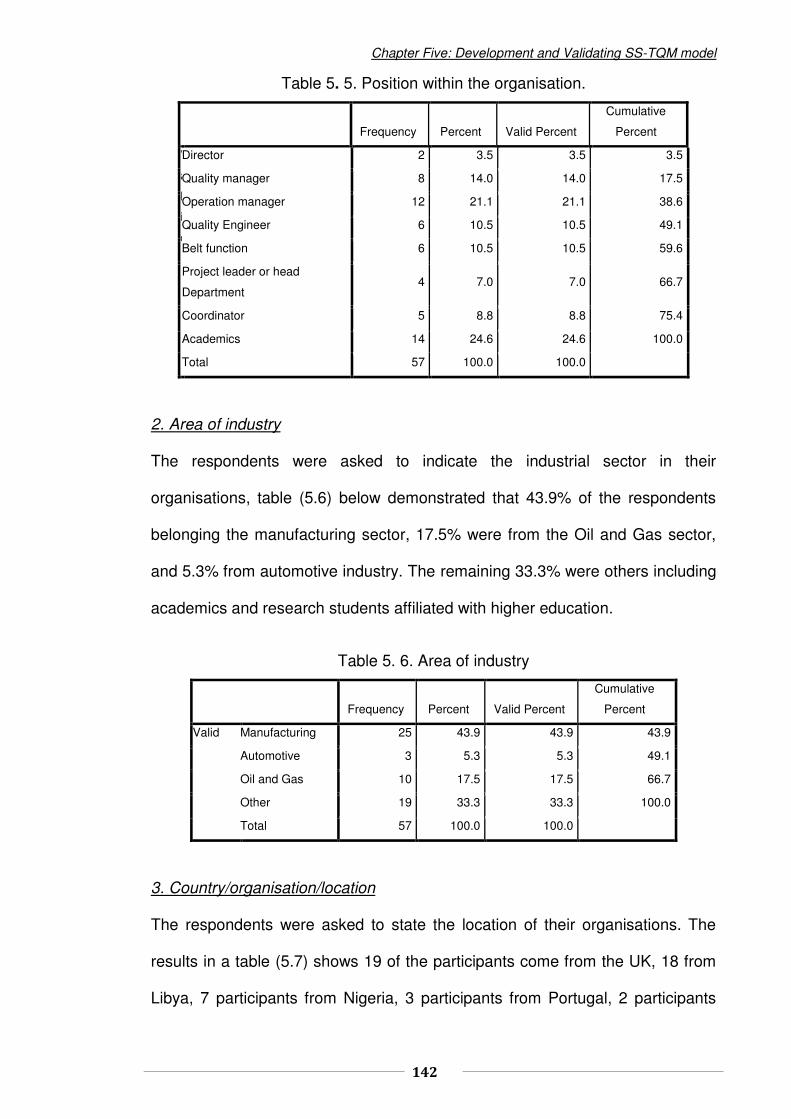
Chapter Five: Development and Validating SS-TQM model
142
Table 5. 5. Position within the organisation.
Frequency Percent Valid Percent
Cumulative
Percent
V
a
l
i
d
Director 2 3.5 3.5 3.5
Quality manager 8 14.0 14.0 17.5
Operation manager 12 21.1 21.1 38.6
Quality Engineer 6 10.5 10.5 49.1
Belt function 6 10.5 10.5 59.6
Project leader or head
Department 4 7.0 7.0 66.7
Coordinator 5 8.8 8.8 75.4
Academics 14 24.6 24.6 100.0
Total 57 100.0 100.0
2. Area of industry
The respondents were asked to indicate the industrial sector in their
organisations, table (5.6) below demonstrated that 43.9% of the respondents
belonging the manufacturing sector, 17.5% were from the Oil and Gas sector,
and 5.3% from automotive industry. The remaining 33.3% were others including
academics and research students affiliated with higher education.
Table 5. 6. Area of industry
Frequency Percent Valid Percent
Cumulative
Percent
Valid Manufacturing 25 43.9 43.9 43.9
Automotive 3 5.3 5.3 49.1
Oil and Gas 10 17.5 17.5 66.7
Other 19 33.3 33.3 100.0
Total 57 100.0 100.0
3. Country/organisation/location
The respondents were asked to state the location of their organisations. The
results in a table (5.7) shows 19 of the participants come from the UK, 18 from
Libya, 7 participants from Nigeria, 3 participants from Portugal, 2 participants

Chapter Five: Development and Validating SS-TQM model
143
from each the following countries: India, Egypt and Iraq. The remaining
participants are from Russia, China, Pakistan and Saudi Arabia each of them
contributing 1 Participant.
Table 5. 7. Country/organisation/location
Frequency Percent Valid Percent
Cumulative
Percent
Valid UK 19 33.3 33.3 33.3
China 1 1.8 1.8 35.1
Russia 1 1.8 1.8 36.8
Portugal 3 5.3 5.3 42.1
Pakistan 1 1.8 1.8 43.9
India 2 3.5 3.5 47.4
Libya 18 31.6 31.6 78.9
Egypt 2 3.5 3.5 82.5
Iraq 2 3.5 3.5 86.0
Nigeria 7 12.3 12.3 98.2
Saudi Arabia 1 1.8 1.8 100.0
Total 57 100.0 100.0
4. Type of quality management system in the respondent's organisation
The respondents were asked to indicate the Current quality system within the
organisation, the results in table (D-2) in appendix (D) showed that used 14.0%
Six-Sigma, 19.33 %TQM, 40.4% ISO series and 26.3% used other quality
systems.
5. The level of awareness of Six-Sigma TQM tools and techniques
Six-Sigma TQM tools and techniques were presented to the respondents and
were asked to indicate if they were aware of any of the tools listed in the survey
questions. The results presented in table (D-3) in appendix (D) showed that the
majority of respondents seems to be familiar with most of the tools and
indicated that the level of the awareness with these tools was above 50%,
regarded as slightly high. However, tools such as; PERT chart and Project

Chapter Five: Development and Validating SS-TQM model
144
charter were ranked below 50% which means that they are not familiar with
these tools in their organisations and that their awareness level with those tools
is slightly low.
6. The major problems facing the quality system of respondents organisations
The respondents were asked to indicate if the quality system in their
organisations corresponded to the list of 19 essential problems shown in table
(D-4) in appendix (D); considered to be the key problems that lead to failures in
any quality system. The major problems summarized from the literature see
(Antony (2008) and Andersson et al., 2006). Table (D-4) in appendix (D)
demonstrated that the majority of the respondents indicated that their
organisations face most of the problems. The results of each element are:
Decision Making; capable with 54.4%
Risk analysis and Uncertainty; capable with 66.7%
Failure to track which quality efforts work in a marketplace; capable with 56.1%
Employee commitment; capable with 57.9%
Follow up on the documentation process; capable with 57.9 %
The right selection of raw material; capable with 77.2%
Defects; capable with 61.4%
Planning and following maintenance programs; capable with 50.9%
Taking action for continuous improvement; capable with 66.7%
Market and sales management; capable with 61.4%
Scheduling and organisation; capable with 50.9%
Utilisation of problem-solving techniques or validating the robustness of the
technical solutions (crucial to advance planning); capable with 55.4%.

Chapter Five: Development and Validating SS-TQM model
145
However, the majority of respondents indicated their organisations are
incapable of dealing with the rest of the problems and the average of results
were below 50%:
Lack of cost-driven and priorities: incapable with 52.6%
Investment in training: incapable with 59.6%
Resources management: incapable with 52.6%
Appropriate organisation of storage space: incapable with 64.9%
Involvement of top management and support: incapable with 50.9%
Middle management involvement and participation: incapable with 52.6%
Machine setup and control: incapable with 64.9%
The respondents also were asked if there are other problems facing their quality
system. The results showed that no other problems were added.
5.7.2.2.2. Results of Section B; the level of awareness and perceived
usefulness of SS-TQM tools and techniques among participants
This section of the survey seeks to provide an understanding of the
respondents’ involvement in SS-TQM tools and the techniques that have been
used in their organisation or used by the respondents themselves and how
useful these tools are to businesses for the purposes of manufacturing
organisation. It aims to provide an understanding of basic Six Sigma and TQM
tools and the procedures for implementation that are suitable for manufacturing
organisations. To identify the possible difficulty in implementing the proposed
model and show the level of accuracy of the contents of the model as they are
applied to business in manufacturing organisations.

Chapter Five: Development and Validating SS-TQM model
146
1. Attendance of any formal training on Six-Sigma or on TQM approaches.
The respondents were asked to state if they have received any formal training
on Six-Sigma or TQM, (figure (D-1) in appendix (D)). 14.0% of the respondents
had formal training on Six-Sigma, 33.3% had formal training on TQM, 22.8% of
them have formal training on both approaches and 29.8% have no formal
training.
2. The duration of using Six-Sigma or/ and TQM approach.
The respondents were asked to state for how long they have been using Six-
Sigma and/or TQM approaches. Figure (D-2) in appendix (D) showed that 21 of
the respondents have never used them, 6 respondents for a period of one year
or less, 21 of the respondents for 2 - 5 years and 8 respondents for 5-10 years
with only one of them has used it for more than 10 years.
3. The role of respondents within Six-Sigma/TQM organisation.
The respondents were asked about their role within Six Sigma and/or TQM
organisation. Figure (D-3) in appendix (D) showed that 18 of the respondents
have no Six Sigma/TQM role, 10 of them are managers and team members, 6
Green Belt, 4 of the respondents are heads of department, 3 of them are
champions (2 of which are trainers and a yellow belt), and 1 respondent is each
master black belt another a black belt.
4. Utilisation of Six Sigma and TQM tools and techniques.
The respondents were asked to indicate whether they have ever used or have
applied SS-TQM tools and techniques in their organisation, the respondents
were also asked to rate the application of these tools in their organisation on a
Likert scale of 1-5, where '1' indicates 'never been used', '2' indicates 'used only

Chapter Five: Development and Validating SS-TQM model
147
once', '3' indicates 'used rarely', '4' indicates 'used frequently' and '5' ‘used very
often’.
The results in table (D-5) in appendix (D) showed the level of familiarity with
tools and techniques is very diverse among respondents, especially within the
group of statistical tools and techniques. In general, the percentage (%) level of
familiarity with the more sophisticated statistical tools and techniques were
rated ‘moderate’. Some advanced statistical tools and techniques like
Regression Analysis, PERT, Force Field Analysis, Taguchi, and SIPOC, QFD,
FMEA are slightly unfamiliar to most of the respondents. While quality tools and
techniques such as SPC, Process Mapping, brainstorming, run chart and
benchmarking are the most familiar with the Six-Sigma and TQM tools and
techniques.
5. The usefulness of LSS tools and techniques to the respondents' organisation.
The respondents were asked to indicate whether Six-Sigma and/or TQM tools
and techniques are considered useful to their organisation, in the Likert scale
used; '1' indicates 'not useful', '2' indicates 'less useful', '3' indicates 'moderate',
'4' indicates 'useful', and '5' indicates 'very useful'.
Table (D-6) in appendix (D) showed that the level of importance with tools and
techniques to the respondents produced a range of answers among the tools
and techniques. In general, the majority of respondents' suggested that causes
and effect chart, benchmarking, DOE, run charts and process flowcharts are
very important tools within their organisations with other tools brainstorming and
PDCA being ranked as the most useful tools. However, the majority of the
Chapter Five: Development and Validating SS-TQM model
148
respondents indicated that the rest of the tools are moderate in terms of their
usefulness within organisations.
5.7.2.2.3. Section (C): Validation of the proposed integrated SS-TQM
model
This section of the survey seeks to validate the proposed model for
manufacturing organisations. It aims to provide an understanding of Six-Sigma
and TQM implementation procedures, identify the difficulties in implementing
the proposed model and reveal the accuracy level within its contents in terms of
helping business to gain competitive advantages in the long run. The model
was presented to the respondents, the respondents were then asked to
evaluate the model in terms of the following criteria; strategic contents of the
model, the applicability of the model to manufacturing organizations, the
effectiveness of the model to achieve competitiveness, the ability of the model
to overcome the nature implementation complexity, the ability of the model to
assist manufacturing organizations in achieving long-term goals and, finally, to
evaluate the completeness and accuracy of the model in terms of respondents
insight. The Likert scale used is 1–Strongly Disagree. 2– Disagree. 3–
Moderate. 4– Agree. 5 –Strongly Agree
1. Evaluation - of the contents of the strategic elements of the proposed model
Table (D-7) in appendix (D) demonstrated that 29.8% of the respondents
strongly agreed with the contents of the strategic elements of the proposed
model, 35.1% agreed, 28.1% were moderate, 5.3% disagreed while 1.8%
strongly disagreed.
2. Evaluation - of the contents of the implementation elements of the proposed
Model.

Chapter Five: Development and Validating SS-TQM model
149
Table (D-8) in appendix (D) showed that 26.3% of the respondents strongly
agreed with the contents of the elements connected with implementation, 45.6%
agreed, 21.1% were moderate, 5.3% disagreed while 1.8% strongly disagreed.
3. Evaluation- of the contents of the elements affecting an excellent
performance in the proposed model
Table (D-9) in appendix (D) displayed that, 22.8% of the respondents strongly
agreed with the contents of the elements which affect the excellence of the
performance, 33.3% agreed, 38.6% were moderate, 3.5% disagreed while1.8%
strongly disagreed.
4. Evaluation - of the proposed model in terms of the suitability for
manufacturing organisations.
Table (D-10) in appendix (D) revealed that 21.1% of the respondents strongly
agreed with the contents of the proposed model in terms of the suitability for
manufacturing organisations, 24.1% agreed, 29.8% were moderate, 3.5%
disagreed while 3.5% strongly disagreed.
5. Evaluation -of- the effectiveness of the proposed model for manufacturing
organisations
Table (D-11) in appendix (D) demonstrated that up to 17.5% of the respondents
strongly agreed with the contents of the proposed model in terms of boosting
the organisation’s competitiveness and profit, 49.1% agreed, 24.6% were
moderate, 3.5% disagreed while 5.3% strongly disagreed
6. Evaluation -of- the ability of the model to overcome the complexities of
implementation to Six Sigma TQM.
Table (D-12) in appendix (D) illustrated that 17.5% of the respondents strongly
agreed with the contents of the proposed model to overcome the complexities

Chapter Five: Development and Validating SS-TQM model
150
of implementation; 49.1% agreed, 26.3% were moderate, 3.5% disagreed while
3.5% strongly disagreed.
7. Evaluation -of- the ability of the proposed model to help the manufacturing
organisations meet organisations goals.
Table (D-13) in appendix (D) demonstrated that 24.6% of the respondents
indicated that they strongly agree with the contents of the proposed model, in
terms of helping manufacturing organisations to achieve organisations goals,
42.1% agree, 29.8% chose moderate, 1.8 disagree and 1.8% strongly disagree.
8. Evaluation -of- the proposed model in terms of anything missing which should
be added to the proposed model.
The Likert scale used in this part was 1-Yes and 2-No
Table (D-14) n appendix (D) revealed that 93.0% of the respondents indicated
that the contents of the model are complete. 7.0% think something is missing
from the model. They suggested that the Lean manufacturing and approach
should be included in the conceptual model.
9. Evaluation -of- the potential motivations for the SS-TQM approach
The essential elements of both approaches are listed as the key motivation
behind the adoption of Six-Sigma TQM approaches. The respondents were
asked to indicate the extent to which the following motives will influence their
decision in adopting the Six-Sigma TQM model.
Table (D-15) in appendix (D) showed that the majority of respondents rated the
highest percentage for the favour of ‘agree’ and ‘strongly agree’ scales which
means that the majority of the respondents are aware that Six-Sigma/TQM
approaches are appropriate for manufacturing organisations.
Chapter Five: Development and Validating SS-TQM model
151
5.7.2.2.4. Section D: Evaluation of the importance of the CSFs for
successful implementation of Six-Sigma TQM in manufacturing
organizations.
This section of the questionnaire was intended to understand the critical factors
necessary for a successful implementation of SS-TQM and, also, the barriers
that can hinder the implementation process in manufacturing organisations.
The Likert scale used in this part: 1-5, where 1 - Not important 2 – Slightly
important 3 – Important 4 – Quite Important 5- Very important.
1. Evaluating-of- the importance of the CSFs of SS-TQM implementation
The aim of this question is to assess the CSFs that are required for the
successful implementation of the SS-TQM model. The respondents were asked
to rate the importance of the 12 CSFs listed in the survey, the CSFs were rated
using the Likert scale of 1-5, with 5 is being very important and 1 is not
important.
Table (D-16) in appendix (D) demonstrated that most of the CSFs are
considered to be important since the majority of the respondents indicated that
the highest percentage level (%) fell between quite important and very important
scale. Therefore, it can be concluded from the responses of the survey that ‘top
management support and communication’ are the most important CSFs for a
successful Six-Sigma TQM implementation in manufacturing organisations.
More than any other factor ranked above 50%
2. Evaluation- of- the factors impeding SS-TQM implementation
In this question, the respondents were asked to rate the extent to which the 11
identified barriers factors impede the successful implementation of Six-Sigma/
TQM in manufacturing organisations. Eleven barriers factors were previously
identified by the literature review (Johannes, 2013; Antony, 2008; Andersson et

Chapter Five: Development and Validating SS-TQM model
152
al., 2006). The Likert scale employed is; 1-5 in which 1- corresponds to very
low, 2- Low, 3- Moderate, 4-High and 5-Very high.
Table (D-17) in appendix(D), demonstrated that all the barriers factors listed in
the survey questionnaire are considered to be quite high since the majority of
the respondents indicated that the greatest percentage level (%) fell on High
Likert and have a rating greater than 35%. However, a change business focus
and change management are considered the greatest barriers to Six-
Sigma/TQM implementation in manufacturing organisations.
5.8. Validation of the critical success factors
As illustrated in chapter 3, factor analysis is the most commonly-used approach
employed to check the construct validity of each critical success factors and to
determine the appropriateness of instruments (Pallant, 2010), the aim is to
measure the validity of the instruments and to understand the structure of the
latent variables (factors). Therefore, an exploratory factor analysis was
undertaken in this model to validate the 12 CSF selected for the successful
implementation of the model. The test was carried out using SPSS 23.
5.8.1. Results of factor analysis test
The first step in this test is the factorability test to check the
appropriateness of the data for factor analysis. As can be seen in table (5.8), all
the requirements are met, where KMO is 0.846 and Sphericity test is significant
(Kaiser, 1981).
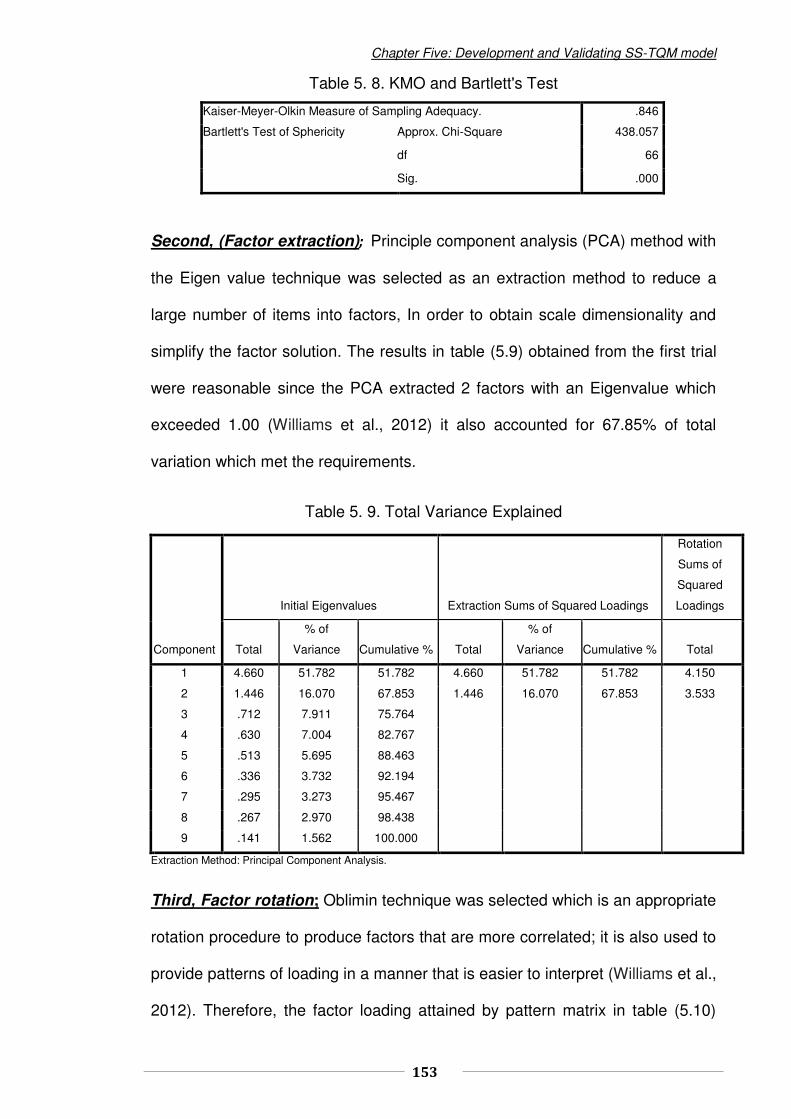
Chapter Five: Development and Validating SS-TQM model
153
Table 5. 8. KMO and Bartlett's Test
Kaiser-Meyer-Olkin Measure of Sampling Adequacy. .846
Bartlett's Test of Sphericity Approx. Chi-Square 438.057
df 66
Sig. .000
Second, (Factor extraction); Principle component analysis (PCA) method with
the Eigen value technique was selected as an extraction method to reduce a
large number of items into factors, In order to obtain scale dimensionality and
simplify the factor solution. The results in table (5.9) obtained from the first trial
were reasonable since the PCA extracted 2 factors with an Eigenvalue which
exceeded 1.00 (Williams et al., 2012) it also accounted for 67.85% of total
variation which met the requirements.
Table 5. 9. Total Variance Explained
Component
Initial Eigenvalues Extraction Sums of Squared Loadings
Rotation
Sums of
Squared
Loadings
Total
% of
Variance Cumulative % Total
% of
Variance Cumulative % Total
1 4.660 51.782 51.782 4.660 51.782 51.782 4.150
2 1.446 16.070 67.853 1.446 16.070 67.853 3.533
3 .712 7.911 75.764
4 .630 7.004 82.767
5 .513 5.695 88.463
6 .336 3.732 92.194
7 .295 3.273 95.467
8 .267 2.970 98.438
9 .141 1.562 100.000
Extraction Method: Principal Component Analysis.
Third, Factor rotation; Oblimin technique was selected which is an appropriate
rotation procedure to produce factors that are more correlated; it is also used to
provide patterns of loading in a manner that is easier to interpret (Williams et al.,
2012). Therefore, the factor loading attained by pattern matrix in table (5.10)
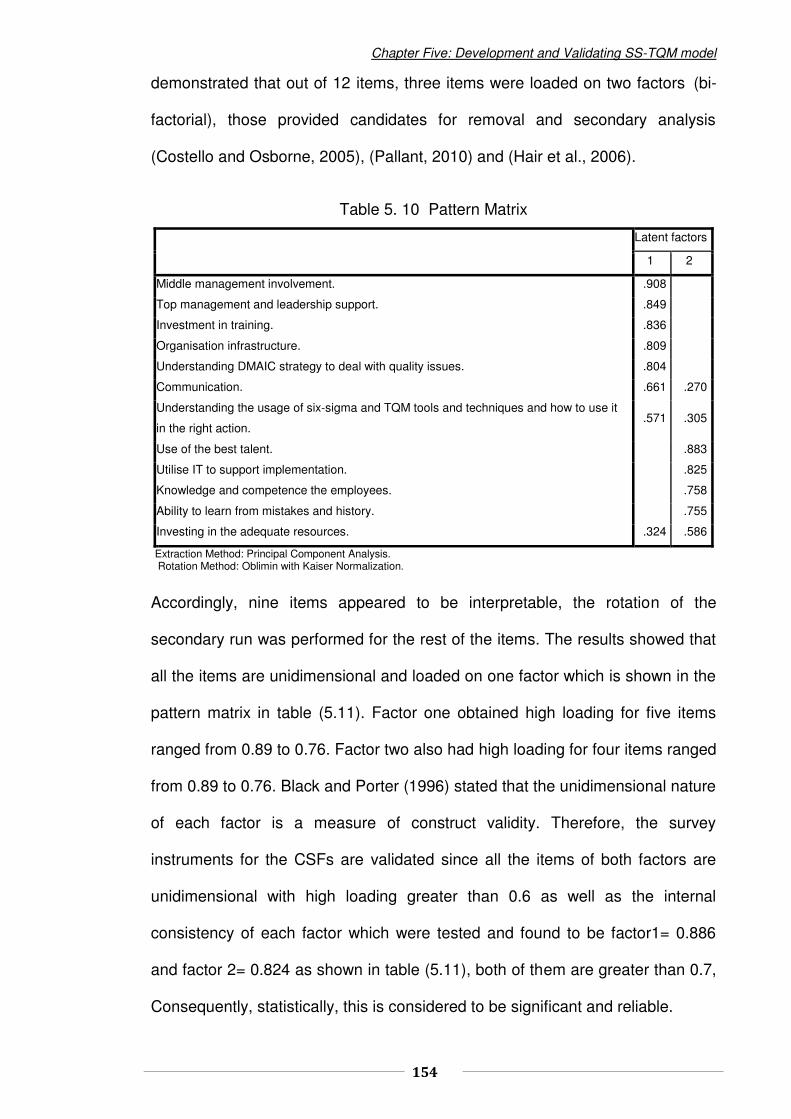
Chapter Five: Development and Validating SS-TQM model
154
demonstrated that out of 12 items, three items were loaded on two factors (bi-
factorial), those provided candidates for removal and secondary analysis
(Costello and Osborne, 2005), (Pallant, 2010) and (Hair et al., 2006).
Table 5. 10 Pattern Matrix
Latent factors
1 2
Middle management involvement. .908
Top management and leadership support. .849
Investment in training. .836
Organisation infrastructure. .809
Understanding DMAIC strategy to deal with quality issues. .804
Communication. .661 .270
Understanding the usage of six-sigma and TQM tools and techniques and how to use it
in the right action. .571 .305
Use of the best talent. .883
Utilise IT to support implementation. .825
Knowledge and competence the employees. .758
Ability to learn from mistakes and history. .755
Investing in the adequate resources. .324 .586
Extraction Method: Principal Component Analysis. Rotation Method: Oblimin with Kaiser Normalization.
Accordingly, nine items appeared to be interpretable, the rotation of the
secondary run was performed for the rest of the items. The results showed that
all the items are unidimensional and loaded on one factor which is shown in the
pattern matrix in table (5.11). Factor one obtained high loading for five items
ranged from 0.89 to 0.76. Factor two also had high loading for four items ranged
from 0.89 to 0.76. Black and Porter (1996) stated that the unidimensional nature
of each factor is a measure of construct validity. Therefore, the survey
instruments for the CSFs are validated since all the items of both factors are
unidimensional with high loading greater than 0.6 as well as the internal
consistency of each factor which were tested and found to be factor1= 0.886
and factor 2= 0.824 as shown in table (5.11), both of them are greater than 0.7,
Consequently, statistically, this is considered to be significant and reliable.

Chapter Five: Development and Validating SS-TQM model
155
Table 5. 11. Pattern Matrix
Finally, naming the extracted latent factors; based on the structure matrix in
the table (5.12) which shows the correlation between the variables and the
factors. The underlying factor can be labelled as follows:
Factor 1: Strategic elements
These elements are highly correlated with latent factor 1 as shown in table
(512), the elements represent 51.782% of the variance (see table (5.9)). The
items are considered the key drivers of strategic factors of SS-TQM model and
have a significant impact on the operation performance, the internal consistency
of this factor is 0.886. as shown in table (5.11) The correlation among the
observed items (CSFs) and the latent factor is shown in table 5.12 and Figure
5.4.
Component
1 2
Cronbach alpha test .886 .824
Middle management involvement. .890
Investment in training. .833
Top management and leadership support. .830
Organisation infrastructure. .826
Understanding DMAIC strategy to deal with quality issues. .762
Use of the best talent. .898
Utilise IT to support implementation. .783
Acknowledge and competence the employees. .773
Ability to learn from mistakes and history. .767
Extraction Method: Principal Component Analysis.
Rotation Method: Oblimin with Kaiser Normalization.
.
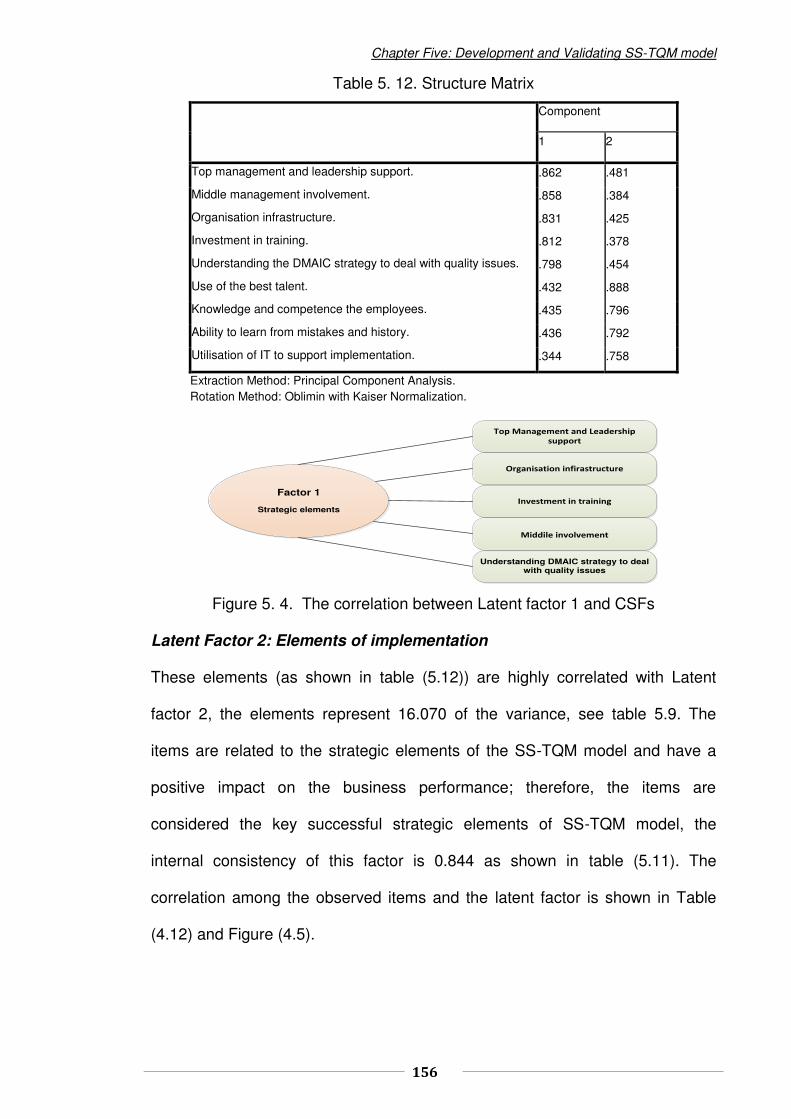
Chapter Five: Development and Validating SS-TQM model
156
Table 5. 12. Structure Matrix
Component
1 2
Top management and leadership support. .862 .481
Middle management involvement. .858 .384
Organisation infrastructure. .831 .425
Investment in training. .812 .378
Understanding the DMAIC strategy to deal with quality issues. .798 .454
Use of the best talent. .432 .888
Knowledge and competence the employees. .435 .796
Ability to learn from mistakes and history. .436 .792
Utilisation of IT to support implementation. .344 .758
Extraction Method: Principal Component Analysis. Rotation Method: Oblimin with Kaiser Normalization.
Top Management and Leadership
support
Organisation infirastructure
Understanding DMAIC strategy to deal with quality issues
Investment in training
Middile involvement
Factor 1
Strategic elements
Figure 5. 4. The correlation between Latent factor 1 and CSFs
Latent Factor 2: Elements of implementation
These elements (as shown in table (5.12)) are highly correlated with Latent
factor 2, the elements represent 16.070 of the variance, see table 5.9. The
items are related to the strategic elements of the SS-TQM model and have a
positive impact on the business performance; therefore, the items are
considered the key successful strategic elements of SS-TQM model, the
internal consistency of this factor is 0.844 as shown in table (5.11). The
correlation among the observed items and the latent factor is shown in Table
(4.12) and Figure (4.5).
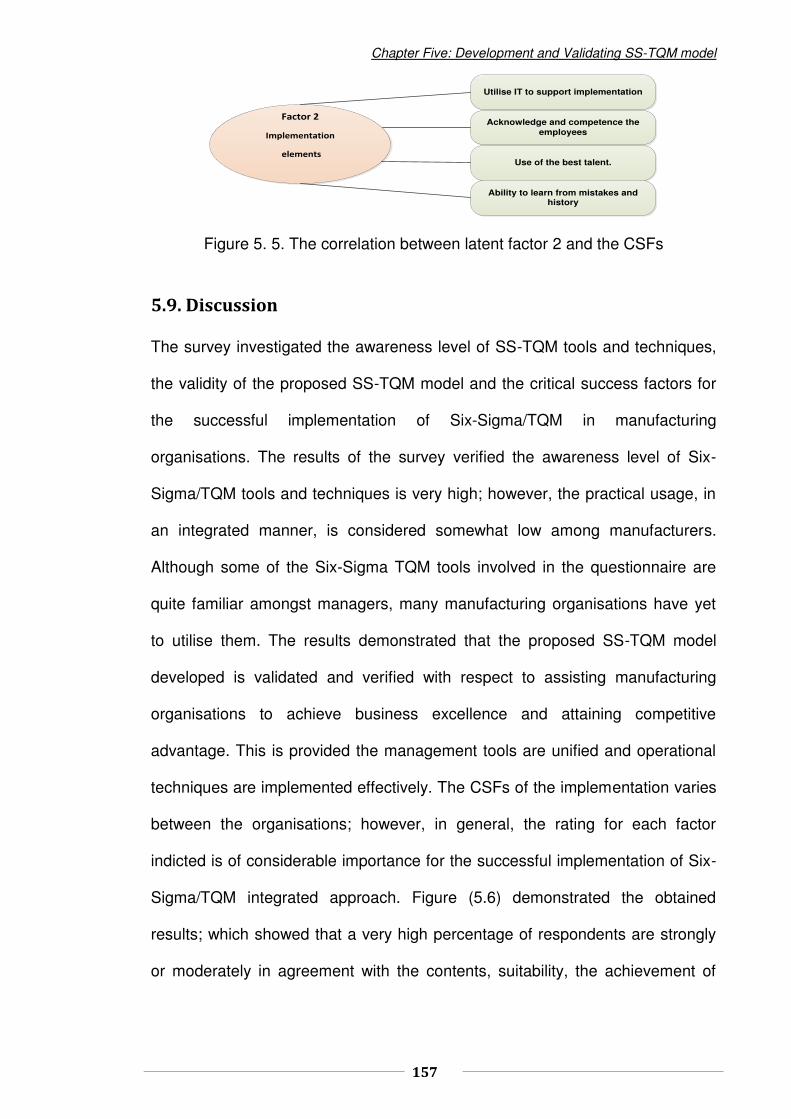
Chapter Five: Development and Validating SS-TQM model
157
Utilise IT to support implementation
Acknowledge and competence the
employees
Use of the best talent.
Ability to learn from mistakes and history
Factor 2
Implementation
elements
Figure 5. 5. The correlation between latent factor 2 and the CSFs
5.9. Discussion
The survey investigated the awareness level of SS-TQM tools and techniques,
the validity of the proposed SS-TQM model and the critical success factors for
the successful implementation of Six-Sigma/TQM in manufacturing
organisations. The results of the survey verified the awareness level of Six-
Sigma/TQM tools and techniques is very high; however, the practical usage, in
an integrated manner, is considered somewhat low among manufacturers.
Although some of the Six-Sigma TQM tools involved in the questionnaire are
quite familiar amongst managers, many manufacturing organisations have yet
to utilise them. The results demonstrated that the proposed SS-TQM model
developed is validated and verified with respect to assisting manufacturing
organisations to achieve business excellence and attaining competitive
advantage. This is provided the management tools are unified and operational
techniques are implemented effectively. The CSFs of the implementation varies
between the organisations; however, in general, the rating for each factor
indicted is of considerable importance for the successful implementation of Six-
Sigma/TQM integrated approach. Figure (5.6) demonstrated the obtained
results; which showed that a very high percentage of respondents are strongly
or moderately in agreement with the contents, suitability, the achievement of
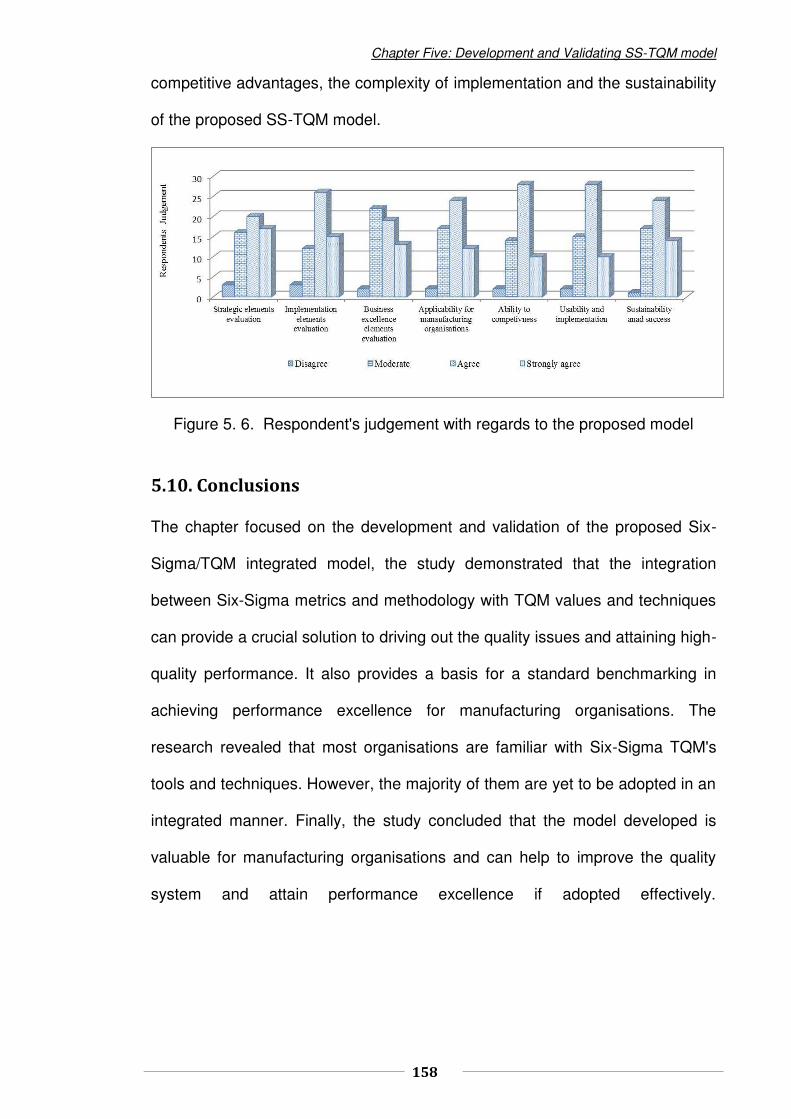
Chapter Five: Development and Validating SS-TQM model
158
competitive advantages, the complexity of implementation and the sustainability
of the proposed SS-TQM model.
Figure 5. 6. Respondent's judgement with regards to the proposed model
5.10. Conclusions
The chapter focused on the development and validation of the proposed Six-
Sigma/TQM integrated model, the study demonstrated that the integration
between Six-Sigma metrics and methodology with TQM values and techniques
can provide a crucial solution to driving out the quality issues and attaining high-
quality performance. It also provides a basis for a standard benchmarking in
achieving performance excellence for manufacturing organisations. The
research revealed that most organisations are familiar with Six-Sigma TQM's
tools and techniques. However, the majority of them are yet to be adopted in an
integrated manner. Finally, the study concluded that the model developed is
valuable for manufacturing organisations and can help to improve the quality
system and attain performance excellence if adopted effectively.

159
Chapter Six
The AHP model for evaluating and prioritizing the key drivers of
the proposed Quality Management Integrated Framework
6.1. Introduction .................................................................................................................................. 159
6.2. Integrating LSS model with SS-TQM model ................................................................................ 160
6.3. Identifying the key driver for developing the proposed management quality framework ............. 162
6.4. Analytical hierarchy process (AHP) ............................................................................................. 164
6.5. Development of the proposed AHP model................................................................................... 166
6.6. Validation of the proposed AHP Model ........................................................................................ 167
6.6.1. Data collection and analysis ..................................................................................................... 169
6.6.1.1 Respondents background results ........................................................................................... 169
6.6.1.2. Results of data generation ..................................................................................................... 170
6.6.2. Generating of the comparison matrix ........................................................................................ 170
6.6.3 Pairwise matrix evaluation ......................................................................................................... 174
6.6.3.1 Problem modelling .................................................................................................................. 174
6.6.3.2. Results of the priority preference of sub-criteria with respect to main criteria ....................... 176
6.6.3.3. Synthesizing the results ......................................................................................................... 177
6.6.3.4. Results of the priority preference of the global weights ......................................................... 177
6.6.4. Sensitivity analysis .................................................................................................................... 178
6.5. Discussion .................................................................................................................................... 183
6.6. Conclusion ................................................................................................................................... 185

Chapter Six: Development and validating AHP model
160
6.1. Introduction
The increasing variety of quality management methods in recent years has
overstrained quality managers to select the effective quality management
methods for their organisations. The integration of quality management
approaches has become an effective methodology for manufacturing and
services organisations (Johannsen, 2013). In this respect, Johannsen (ibid)
stated that integrated quality management models enable organisations to
exceed the improvement rates and achieve sustainable improvement. Therefore,
the study in this chapter is intended to evaluate and prioritise the key drivers of
the proposed quality management framework.
The chapter starts by integrating the LSS model with the SS-TQM model then
discuss how to identify the strategic drivers required to develop the integrated
framework. The way in which the Analytical Hierarchy Process model (AHP)
was developed to evaluate the effectiveness of strategic drivers and how quality
management factors that have been selected to develop the proposed
framework. A questionnaire survey for the purpose of AHP techniques was
designed and applied to validate the proposed AHP model and to prioritise the
key drivers of the framework, the validation procedures carried out were based
on AHP technique and led to the final results.
6.2. Integrating LSS model with SS-TQM model
In order to develop a robust integrated quality management framework for
manufacturing organisations, the key strategic elements of the proposed
framework must be appropriately selected to formulate an effective quality
management system for manufacturing organisations. In this research, the
proposed framework will be developed by integrating the LSS model developed

Chapter Six: Development and validating AHP model
161
in chapter 4 and the SS-TQM model developed in chapter 5. Accordingly, the
strategic drivers of the framework must be identified based on the integrated
approach to quality management. As such, two main factors must be obtained
in order to integrate the proposed models; one to incorporate the synergy
between the models and the other one to identify the procedure model
(Johannsen, 2013).
The synergy between both models can be easily attained since the quality
methodologies of the models are significantly similar to each other, where each
one can complement the other, thereby, identifying the opportunity for quality
improvement and eliminating the poor quality performance (see the critical
relationship between the methods selected in chapter 2 section (2.7))
(Andersson et al,. 2006; Johannsen, 2013).
The procedure model is also available since Six-Sigma DMAIC improvement is
the most appropriate strategy available to guide the framework to achieving
effective quality management performance. Thus, the procedure model for
integrating the above-mentioned models and for developing the proposed
framework in this study is based on Six-Sigma DMAIC. Accordingly, since the
required similarity for integrating the models is available, the synergy does exist
and the procedure model is identified, the process of integrating the
aforementioned models can be summarized in four steps:
The strategic elements of both models are integrated together to establish an
effective platform for the planning process and to facilitating the
implementation procedures of the framework.
The operational elements of the LSS model integrated with both the elements
concerned with implementation and the business excellence elements of the

Chapter Six: Development and validating AHP model
162
SS-TQM model in order to provide impetus and guidance for quality
improvement and for attaining performance excellence for the manufacturing
organisations.
The CSFs of both models are employed and selected based on the literature
review to achieve success during the process of implementation of the
framework.
The DMAIC improvement strategy is the key strategic driver that can guide
the framework toward attaining effective performance and structuring the
strategic elements of the framework.
6.3. Identifying the key driver for developing the proposed management
quality framework
The strategic elements of the proposed framework in this study are considered
the key driver of the proposed framework for identifying the opportunities for
quality improvement, streamlining the operation process and to providing the
impetus to attain better performance. Therefore, the author identified five
strategic elements for the proposed framework that can be adopted, based on
the strategy of DMAIC improvement, to facilitate the procedures for
implementation and streamline the operation processes:
1. Strategic planning.
2. Measurement and evaluation.
3. Analysis and activation.
4. Improvement and mentoring.
5. Verification and continuous improvement.
Strategic planning; concerns the strategic drivers that are required for the
implementation process to succeed and to achieve the organisational objectives
Chapter Six: Development and validating AHP model
163
(Pyzdek, 1996). The aim of these components is to align and coordinate the
processes in order to meet the final vision.
Measurement and Evaluation; concerns the key drivers that are required to
evaluate the current performance and to enhance the work environment. The
main objectives of this stage are to evaluate the current performance of the
quality system and determine the area of improvement. Additionally, collecting
the required data to investigate the causes of the quality problems and to
facilitate the quality system (Six-Sigma Black Belt course, 2015).
Analysis and Activation; concerns the set of statistical tools and techniques
that are required to assess the quality problems and identify potential
improvement. This stage is concerned with analysing the gap between the
current and the desired performance, and also to identify and analyse the root
causes of the problems (Six-Sigma Black Belt course, 2015).
Improvement and monitoring; concerns the key quality tools required to
implement the improvement plan and monitor the operating performance, the
aim is to identify, investigate and confirm the solution to the problems and then
implement the plan of improvement (Six-Sigma Black Belt course, 2015).
Verification and continuous improvement; concerns the quality procedures
required to sustain continuous improvement, control those actions regarding
quality and verify the success of the organisational objectives. The aim is to
verify the gains that have been attained and to ensure that the improvements
are continued and sustained (Six-Sigma Black Belt course, 2015). All of the key
drivers above should correspond with the number of CSFs to ensure that the
proposed framework is able to meet the main objectives successfully. Therefore,
to identify the CSFs needed for successful implementation of the integrated

Chapter Six: Development and validating AHP model
164
quality management performance, a number of relevant papers were reviewed
to select and identify them (Andersson et al, 2006; Johannsen, 2013; Laureani
and Antony, 2012; Dahlgaard and Dahlgaard-Park, 2006). The literature (ibid)
recommends focus on corporate culture, the human factors of TQM and the
success factors related to the Lean Six-Sigma roadmap in order to combine
Lean, Six-Sigma and TQM. Therefore, the CSfs for successful implementation
of LSS as well as the CSFs for usage of TQM (see (2.6.2) and (2.6.3)).
Additionally, the most important factors that have been ranked in this study for
successful implementation of LSS model and SS-TQM model (see (4.4) and
(5.5.3)), those factors identified as the CSFs to achieve the integrated quality
management performance:
1. Organisational structure.
2. Focus on the customer.
3. Links to the supplier.
4. Training and education.
5. Leadership support.
6. Middle management involvement.
7. Quality commitment.
8. Effective communication.
9. Reviews and tracking quality performance.
6.4. Analytical hierarchy process (AHP)
Analytical hierarchy process is a multiple-criteria decision-making technique
used for organising and analysing complex decision-making (Saaty, 1980), AHP
is based on principles drawn from mathematics and psychology to enable the
users to categorise the priorities and make the best decision by minimising the

Chapter Six: Development and validating AHP model
165
number of complex decisions. The technique relies on computing a series of
pairwise comparisons and, then, analysing the results (ibid). Moreover, AHP is
a useful technique for checking the consistency of the decision makers,
reducing the unfairness of the decision-making process (Vargas, 1990). In the
AHP approach, the decision maker creates a pairwise comparison matrix for
every pair item assessed in order to determine the weight of every criterion in
relation to the criterion in the higher level (Mendoza and Ventura, 2008). The
following is a list of the main steps:
Problem modelling: The first step is to structure the problem in a hierarchical
model with different levels, the highest level is the main goal followed by the
main criteria, sub-criteria and alternatives. The preference of each criterion is
evaluating which should be mutually independent (Saaty, 1980).
Conduct the pair-wise comparison: The next step is to conduct the pairwise
compression and to find out the comparative weight among the attributes of
elements, in which each pair-wise comparison must be consistent. The result of
this step is the ranked priorities based on each criterion (Saaty, 1980).
Priorities derivation: Once the comparisons matrix is completed then the
priorities can be calculated. In the AHP Eigen value method, the logarithmic
least squares method is used to calculate the priority of each criterion (Saaty,
1994).
Ranking the sub-criteria (global ranking): The final step is to calculate the
global ranking of the sub-criteria; which means to determine the relative
importance of the sub-criteria within the main goal. This can be obtained by
considering all the local priorities obtained from the previous step with the
application of a simple weighted sum (Saaty, 1980).

Chapter Six: Development and validating AHP model
166
Calculation of the consistency rate: The consistency test must be performed
to ensure the results obtained are valid and reliable. The consistency index
measures the degree of consistency of each criterion (Saaty, 1980) and it does
so by using the following equation:
�� = ℷ − �� − 1
Where the consistency value of CI must be less than 0.1 to be considered
consistent.
ℷ = is maximal eigenvalue
The consistency ratio, the ratio of CI and RI, is given by: CR = CI/RI.
RI is the random index (the average CI of 500 randomly filled matrices). If CR is
less than 10%, then the matrix can be considered as having an acceptable
consistency Saaty (1994).
Sensitivity analysis: The last step of the decision process is the sensitivity
analysis in which the input data is examined in order to observe the impact on
the results. If the rank is not changed, then the results can be considered robust.
This sort of analysis can be performed by Expert Choice software (Bayazit,
2005).
6.5. Development of the proposed AHP model
This section explains the components of AHP proposed model, the model
developed based on a review of the relevant literature, the model is classified
into three levels for pair-wise comparison; the first level is the overall target of
the model which is; integrated quality management performance, the second
level is the main criteria for achieving the overall goal which includes five

Chapter Six: Development and validating AHP model
167
strategic quality elements namely; (strategic planning, measurement and
evaluation, analysis and activation, improvement and monitoring and finally
verification and continues improvement). The third level for sub-criteria toward
the overall goal is illustrated in figure (6.1) below.
Integrated quality management performance
Stra
tegi
c pl
anan
ing
Anal
ysis
and
activ
atio
n
Impr
ovem
ent a
nd
mon
etrin
g
Verif
icatio
n an
d co
ntin
uous
impr
ovem
ent
Mea
sure
men
t and
ev
alua
tion
Trai
ning
and
ed
ucat
ion
Lead
ersh
ip s
uppo
rt
Effe
ctiv
e
com
mun
icat
ion
Mid
dle
man
agem
ent
invo
lvem
ent
Focu
s on
cus
tom
er
Org
anisa
tion
stru
ctur
e
Revie
w an
d tra
ckin
g pe
rform
ance
Qua
lity c
omm
itmen
t
Link
ing
to s
uppl
ier
Figure 6. 1. The proposed multi-criteria decision-making model
In this study, all the elements in each level must be compared in pairs to assess
its relative importance in relation to the higher level. The purpose is to prioritise
and rank every criterion on the second level with the overall target. Next is to
determine the local weight of each sub-criteria in the third level with the relative
element in the main criteria to assess its relative importance and, also, to
establish the global weight of every sub-criteria toward the main goal. This is in
order to show the relative importance of each sub-criteria towards the main goal.
6.6. Validation of the proposed AHP Model
In order to validate the AHP model, a questionnaire survey was designed to
collect the required data from professionals and academics related to the topic,

Chapter Six: Development and validating AHP model
168
the aim was to evaluate and decide upon the strategic quality management
elements that should form the integrated quality-management performance. The
questionnaire was structured into two sections. The first section included one
part about the respondent's information to provide background to the
participants of the research survey, the other part of this section was to discover
which element of the main criteria is most important with respect to the goal of
the model. The second section was related to the third level of the AHP model,
it was designed to compare the elements in the sub-criteria with respect to the
main criteria of the AHP model. The judgement scales used for making the pair-
wise comparison were based on the standard scales of AHP (Saaty, 1980)
which are shown in table (6.1) below;
Table 6. 1. Likert scale of relative importance
Intensity of importance
Definition and Explanation
1 Equal importance: two activities contribute equally to the objective
3 Moderately important: experience and judgment slightly favour one activity over another
5 Strongly important: Experience and judgment strongly favour one activity over another
7 Very strongly important: an activity is strongly favoured and its dominance demonstrated in practice
9 Absolute importance: the evidence favouring one activity over another is of the highest possible order of affirmation
2,4,6,8 Intermediate values between the two adjacent judgments

Chapter Six: Development and validating AHP model
169
6.6.1. Data collection and analysis
This section outlines the results of the questionnaire received from the
participants and how they were organized for AHP analysis. A total of 70
questionnaires were sent to the relative population across different
organisations. The author believes that the set of management employees
belong to a trustable target population that can provide reliable responses to the
survey questionnaire. 53 questionnaires were completed and returned within
the time frame; a percentage considered to be relatively high above the
household median (Saunders et al., 2009). The data collected was reviewed for
completeness and accuracy; however, no serious errors found and no
responses were found to be similar to each other.
6.6.1.1 Respondents background results
Therefore, the results of the first question (respondent's information) figure (6.2)
shows years of experience of the respondents, where 20% of the respondents
have 1 to 5 years' experience, 12% have 5 to 10 years' experience and 20% of
them have more than 10 years' experience.
Figure 6. 2. The experience of respondents
Figure (6.3) shows the type of experience of the participants have. The results
show; 14% of them are from an industrial background, 21% from an academic
20, 39%
12, 23%
20, 38%
1 to 5 years
5 to 10 years
More than 10 Years
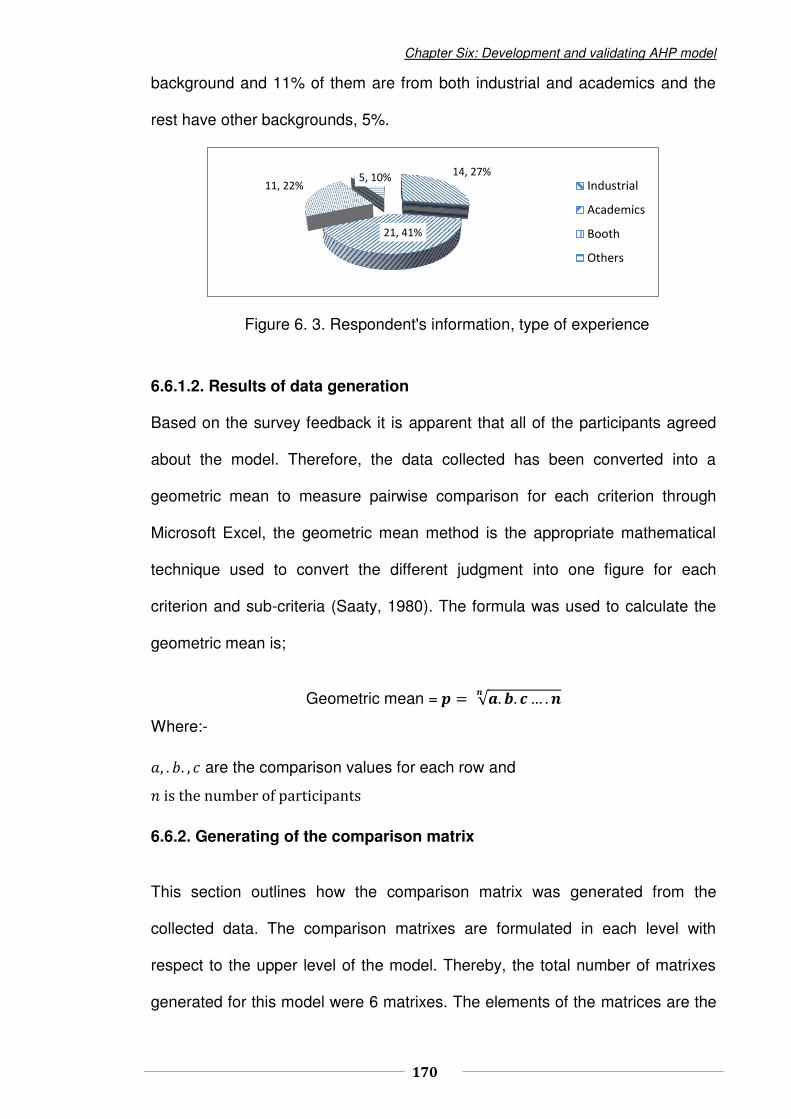
Chapter Six: Development and validating AHP model
170
background and 11% of them are from both industrial and academics and the
rest have other backgrounds, 5%.
Figure 6. 3. Respondent's information, type of experience
6.6.1.2. Results of data generation
Based on the survey feedback it is apparent that all of the participants agreed
about the model. Therefore, the data collected has been converted into a
geometric mean to measure pairwise comparison for each criterion through
Microsoft Excel, the geometric mean method is the appropriate mathematical
technique used to convert the different judgment into one figure for each
criterion and sub-criteria (Saaty, 1980). The formula was used to calculate the
geometric mean is;
Geometric mean = � = √ . . … . ��
Where:- , . . , are the comparison values for each row and � is th� numb�r o� participants
6.6.2. Generating of the comparison matrix
This section outlines how the comparison matrix was generated from the
collected data. The comparison matrixes are formulated in each level with
respect to the upper level of the model. Thereby, the total number of matrixes
generated for this model were 6 matrixes. The elements of the matrices are the
14, 27%
21, 41%
11, 22% 5, 10%
Industrial
Academics
Booth
Others

Chapter Six: Development and validating AHP model
171
values of the geometric mean that were collected by the questionnaire and
calculated with Microsoft Excel. The matrixes generated are stated as follows:
The first matrix in table (6.2) compares the main criteria of the model with
respect to the main goals: Strategic planning, measurement and evaluation,
analysis and activation, improvement and monitoring and verification and
continuous improvement as follows:
Table 6. 2. Comparison Matrix of Main Criteria
The second matrix in table (6.3) compares the sub-criteria covering:
Organisation structure, focus on customer, links to supplier and training and
education with respect to strategic planning;
Table 6. 3. Comparison Matrix of sub-Criteria with respect to strategic planning
The third matrix in table (6.4) is to compare the sub-criteria: leadership support,
the involvement of middle management, effective communication, quality
Strategic planning
measurement and evaluation
analysis and activation
improvement and monitoring
verification and continuous
improvement
Strategic planning 1 4 4 4 4
measurement and evaluation
1/4 1 2 3 3
analysis and activation
1/4 1/2 1 2 3
improvement and monitoring
1/4 1/3 1/2 1 3
verification and continuous
improvement 1/4 1/3 1/3 1/3
1
Organisation
structure focus on customer
linking to the supplier
training and education
Organisation structure
1 3 3 3
focus on customer 1/3 1 3 3
links to supplier 1/3 1/2 1 2
training and education
1/3 1/3 1/2 1
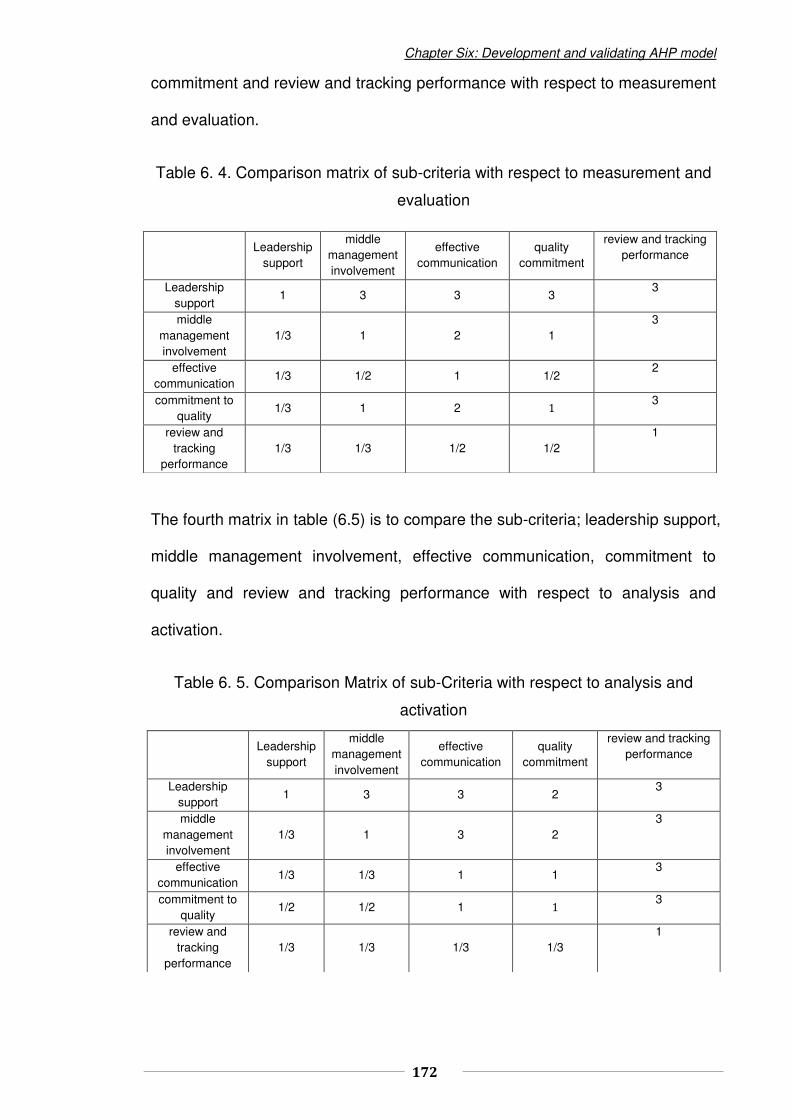
Chapter Six: Development and validating AHP model
172
commitment and review and tracking performance with respect to measurement
and evaluation.
Table 6. 4. Comparison matrix of sub-criteria with respect to measurement and
evaluation
The fourth matrix in table (6.5) is to compare the sub-criteria; leadership support,
middle management involvement, effective communication, commitment to
quality and review and tracking performance with respect to analysis and
activation.
Table 6. 5. Comparison Matrix of sub-Criteria with respect to analysis and
activation
Leadership
support
middle management involvement
effective communication
quality commitment
review and tracking performance
Leadership support
1 3 3 3 3
middle management involvement
1/3 1 2 1 3
effective communication
1/3 1/2 1 1/2 2
commitment to quality
1/3 1 2 1 3
review and tracking
performance 1/3 1/3 1/2 1/2
1
Leadership
support
middle management involvement
effective communication
quality commitment
review and tracking performance
Leadership support
1 3 3 2 3
middle management involvement
1/3 1 3 2 3
effective communication
1/3 1/3 1 1 3
commitment to quality
1/2 1/2 1 1 3
review and tracking
performance 1/3 1/3 1/3 1/3
1
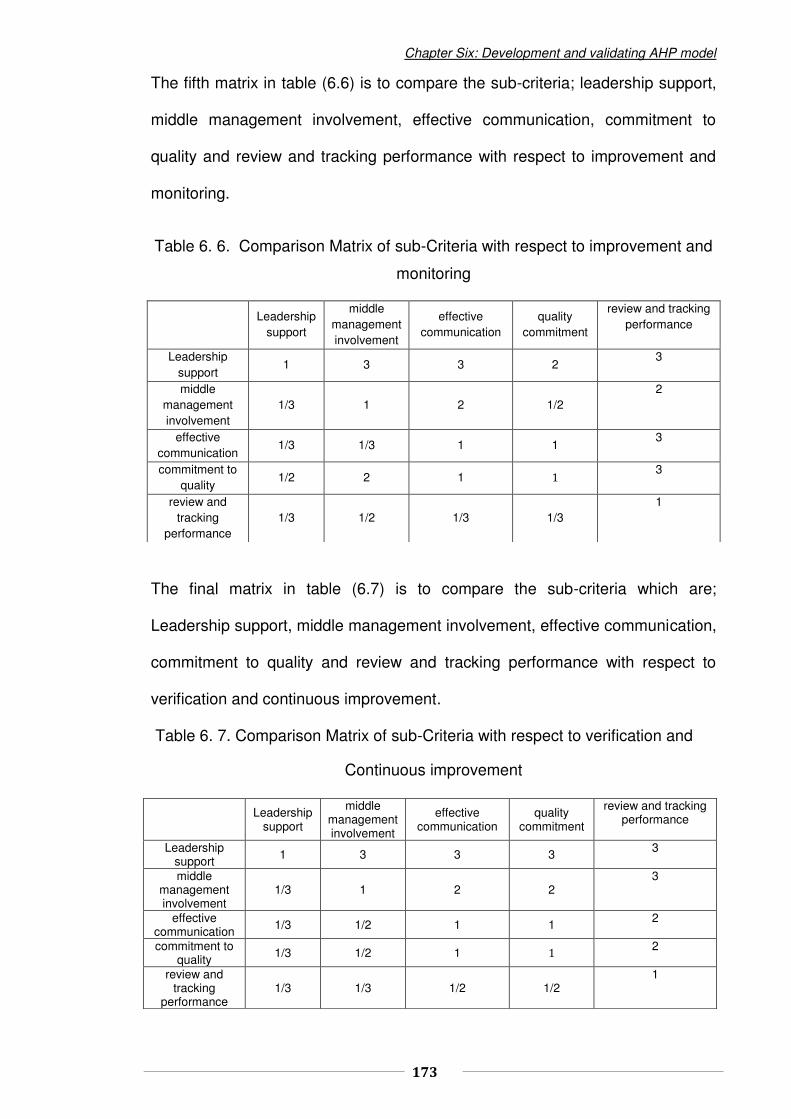
Chapter Six: Development and validating AHP model
173
The fifth matrix in table (6.6) is to compare the sub-criteria; leadership support,
middle management involvement, effective communication, commitment to
quality and review and tracking performance with respect to improvement and
monitoring.
Table 6. 6. Comparison Matrix of sub-Criteria with respect to improvement and
monitoring
The final matrix in table (6.7) is to compare the sub-criteria which are;
Leadership support, middle management involvement, effective communication,
commitment to quality and review and tracking performance with respect to
verification and continuous improvement.
Table 6. 7. Comparison Matrix of sub-Criteria with respect to verification and
Continuous improvement
Leadership
support
middle management involvement
effective communication
quality commitment
review and tracking performance
Leadership support
1 3 3 2 3
middle management involvement
1/3 1 2 1/2 2
effective communication
1/3 1/3 1 1 3
commitment to quality
1/2 2 1 1 3
review and tracking
performance 1/3 1/2 1/3 1/3
1
Leadership
support
middle management involvement
effective communication
quality commitment
review and tracking performance
Leadership support
1 3 3 3 3
middle management involvement
1/3 1 2 2 3
effective communication
1/3 1/2 1 1 2
commitment to quality
1/3 1/2 1 1 2
review and tracking
performance 1/3 1/3 1/2 1/2
1

Chapter Six: Development and validating AHP model
174
6.6.3 Pairwise matrix evaluation
The study employed Expert Choice software to evaluate and deriving the
priorities between the criteria and sub-criteria of the proposed AHP model. The
Expert Choice software applied the Eigenvector method to derive the priorities
from the AHP model, the priorities of the proposed model were derived through
five steps listed as follows;
6.6.3.1 Problem modelling
In this step, the prioritising model is structured using the Expert Choice software
from the goal (Integrated quality management performance) followed by the
main criteria and sub-criteria, figure (6.4) shows the hierarchical view of the
entire structure of the prioritising model as created by Expert Choice.
Figure 6. 4. A hierarchal view of the entire structure of the prioritising model

Chapter Six: Development and validating AHP model
175
6.6.3.2. Conducting the pairwise comparison
Once the problem was structured, the matrixes at each node of the hierarchy
was entered for a pairwise comparison through the use of ratio scale
(Kainulainen et al. 2009). Thereby, the data was entered into each pairwise
comparison as shown in figure (6.5) and the other comparison matrixes
completed in same way.
Figure 6. 5. Pairwise comparison
6.6.3.3. Consistency and weight determination
Once the comparison judgement is entered for each matrix, the consistency is
automatically calculated by the Expert Choice, it is also possible to assess the
highest criteria that contribute to consistency by Expert Choice. Figure (6.6)
demonstrated the consistency of the main criteria with respect to the model goal.
Figure 6. 6. The priority preference of the main criteria
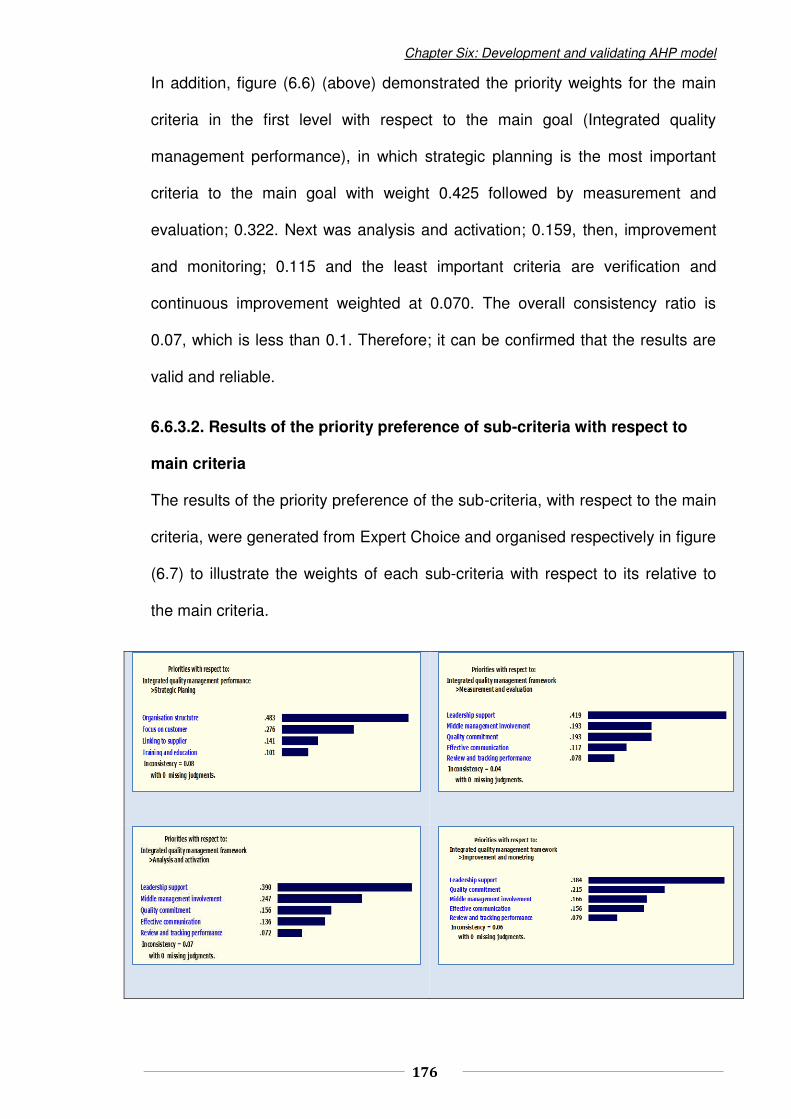
Chapter Six: Development and validating AHP model
176
In addition, figure (6.6) (above) demonstrated the priority weights for the main
criteria in the first level with respect to the main goal (Integrated quality
management performance), in which strategic planning is the most important
criteria to the main goal with weight 0.425 followed by measurement and
evaluation; 0.322. Next was analysis and activation; 0.159, then, improvement
and monitoring; 0.115 and the least important criteria are verification and
continuous improvement weighted at 0.070. The overall consistency ratio is
0.07, which is less than 0.1. Therefore; it can be confirmed that the results are
valid and reliable.
6.6.3.2. Results of the priority preference of sub-criteria with respect to
main criteria
The results of the priority preference of the sub-criteria, with respect to the main
criteria, were generated from Expert Choice and organised respectively in figure
(6.7) to illustrate the weights of each sub-criteria with respect to its relative to
the main criteria.
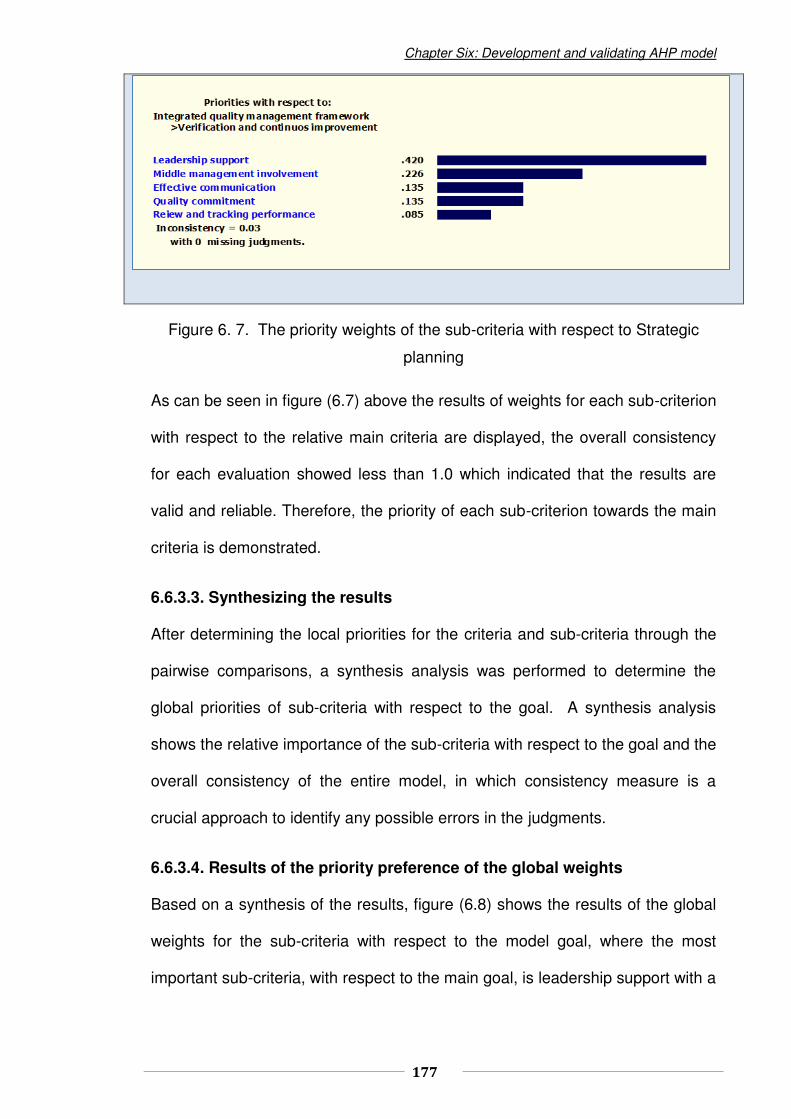
Chapter Six: Development and validating AHP model
177
Figure 6. 7. The priority weights of the sub-criteria with respect to Strategic
planning
As can be seen in figure (6.7) above the results of weights for each sub-criterion
with respect to the relative main criteria are displayed, the overall consistency
for each evaluation showed less than 1.0 which indicated that the results are
valid and reliable. Therefore, the priority of each sub-criterion towards the main
criteria is demonstrated.
6.6.3.3. Synthesizing the results
After determining the local priorities for the criteria and sub-criteria through the
pairwise comparisons, a synthesis analysis was performed to determine the
global priorities of sub-criteria with respect to the goal. A synthesis analysis
shows the relative importance of the sub-criteria with respect to the goal and the
overall consistency of the entire model, in which consistency measure is a
crucial approach to identify any possible errors in the judgments.
6.6.3.4. Results of the priority preference of the global weights
Based on a synthesis of the results, figure (6.8) shows the results of the global
weights for the sub-criteria with respect to the model goal, where the most
important sub-criteria, with respect to the main goal, is leadership support with a

Chapter Six: Development and validating AHP model
178
weight of 0.249 followed by organisational structure, 0.184; next, middle
management involvement at 0.128 with the remainder weighted as follows;
Quality commitment 0.111
Focusing on customer 0.105
Effective communication 0.802
Linking to supplier 0.054
Review and tracking performance 0.048
Finally, training and education weighted at 0.038
Figure 6. 8. The priority global weights of the sub-criteria
6.6.4. Sensitivity analysis
Sensitivity analysis is essential to approaching the decision-making process as
it enables the decision maker to understand the sensitivity of alternatives with
respect to all criteria in the table below. (Expert Choice, 2002). Thereby,
implementing sensitivity analysis is crucial to ensure the reliability of the final
decision through the investigation of different scenarios, and observation of the
impact of changing the priority of the criteria on the alternative ranking system
(Bayazit, 2005). Therefore, to implement sensitivity analysis the input data is

Chapter Six: Development and validating AHP model
179
slightly modified to observe the effect on the outcomes and if the ranking does
not change then the results considered to be robust (Saad and Gindy, 2007).
Expert Choice offers four graphical sensitivity analysis modes; the differences
are shown in various graphical representations. In this study, a dynamic
sensitivity analysis was selected to discover the impact of the different
alternatives.
Figure (6.9) demonstrates the actual results of the sensitivity analysis with
respect to the main goal (integrated quality management performance), where
strategic planning is the most important main criteria with a priority of 42.5%
followed by measurement and evaluation 23% then analysis and activation
15.9%, after that, improvement and monitoring at 11%. The least important
criteria are verification and continuous improvement with a weighting of 7%.
Whereas, the most important quality management factor in the sub-criteria is
leadership support with a priority of 25% followed by organisational structure,
18.4%; then, middle management involvement 12.8%, the rest of factors are
ranked, respectively, as follows:
Quality commitment 11.1%
Focus on customer 10.5%
Effective communication 8.2%
Linking to supplier 5.4%
Review and tracking performance 4.8%
However, training and education were ranked as the least preferred quality
management factors with a preference weight 3.8%.

Chapter Six: Development and validating AHP model
180
Figure 6. 9. The actual results of the sensitivity study with respect to the goal
Five scenarios of sensitivity analyses were carried out to investigate the impact
of changing the priority of the main criteria with the overall results, the results of
the sensitivity analysis were generated from the Expert Choice software and
organised respectively as shown in figure (6.10).
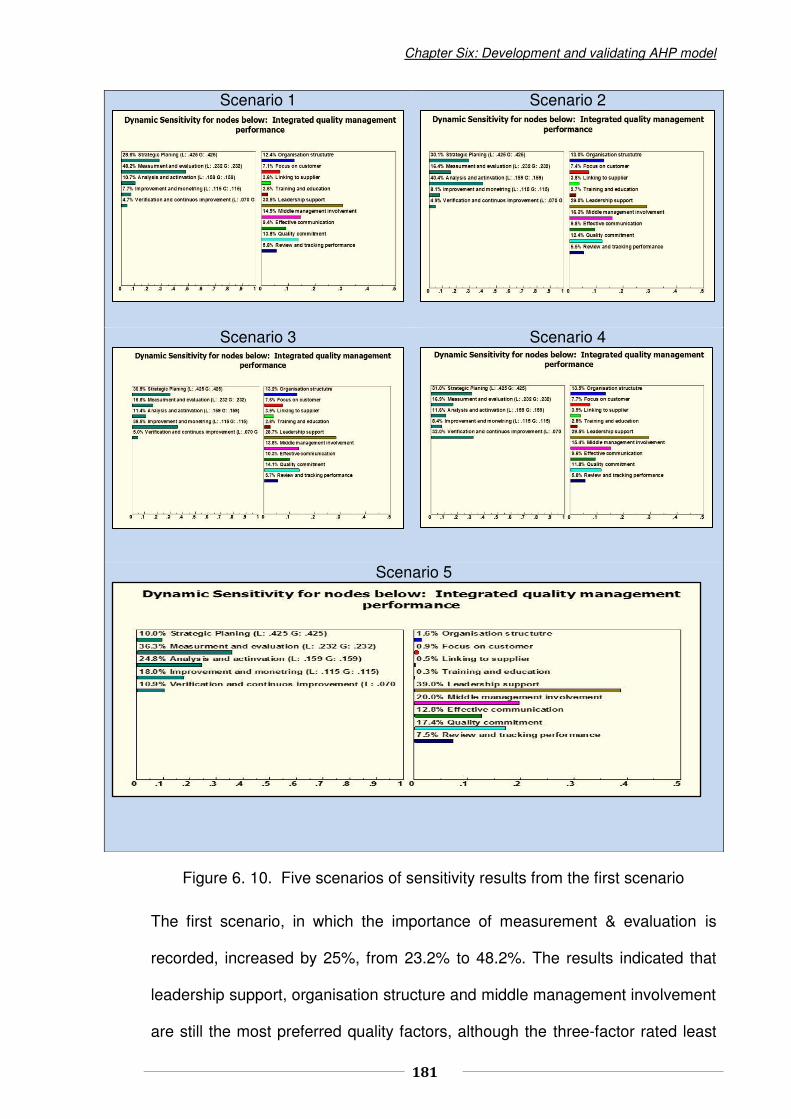
Chapter Six: Development and validating AHP model
181
Figure 6. 10. Five scenarios of sensitivity results from the first scenario
The first scenario, in which the importance of measurement & evaluation is
recorded, increased by 25%, from 23.2% to 48.2%. The results indicated that
leadership support, organisation structure and middle management involvement
are still the most preferred quality factors, although the three-factor rated least
Scenario 1
Scenario 2
Scenario 3
Scenario 4
Scenario 5

Chapter Six: Development and validating AHP model
182
important changed from (Training & education, Review & tracking performance
and Linking to supplier) to (Training & education, Links to supplier and Review
& tracking performance) with preferred weights of 2.6%, 3.6% and 5.8%,
respectively. However, the alternative priority of the other quality factors
remained stable.
The situation in scenarios, 2, 3, and 4, as shown in figure (6.10), was that the
important criteria in each scenario increased by 25%, the results showed that
the alternative ranks are not sensitive to change and the priorities of the quality
factors towards the goal remained the same in all cases, as was the case with
the first scenario. However, in scenario number 5 the importance of strategic
planning is decreased to 10% and become the least important of the objectives
under the main goal. The results in figure (6.10) demonstrated that leadership
support, middle management involvement and quality commitment become the
most important factors with weightings of 39%, 20% and 17.4%, respectively.
While there are other factors related to the importance of strategic planning,
organisational structure, customer focus, links to the supplier and training &
education are more sensitive to change and were returned as the least
important factors with the weights 1.6%, 0.9%, 0.5% and 0.3%, respectively.
In general, the sensitivity analysis indicated that leadership support is prevalent
and the other top three preferred factors, middle management involvement,
organisation structure and quality commitment, remained at the top throughout
the scenarios. As such, they should be selected as the most effective quality
management factors for integrated quality management performance.

Chapter Six: Development and validating AHP model
183
6.5. Discussion
Analytical Hierarchy process methodology was applied to evaluate the
effectiveness of the strategic quality management drivers and the critical quality
factors towards integrated quality management performance. The results of
AHP in the main criteria demonstrated that strategic planning is the most
effective driver towards the integrated quality management performance
followed by measurement and evaluation then analysis and activation and, after
that, improvement and performance, the least important driver is verification and
continuous improvement. The results in this part are considered to be sensible
and logical since the elements of the main criteria were built, based on DMAIC
strategy of Six-Sigma, in which each phase relies on the previous phase in
terms of assessing the process performance and achieving the tasks relating to
quality. In addition, the AHP results demonstrated that the most important
critical quality factor in sub-criteria, with respect to the main goal, is Leadership
support followed by the organisational structure. While the least important factor
is training and education. However, the importance of priority weighted for each
quality factor, with respect to the relative criteria, can be seen in figure (6.11).
Here it is shown that organisational structure is the most important factor with
training & education is the least important factor. Whereas, the most important
factor for the other criteria is leadership support followed by middle
management involvement and quality commitment. In most cases of the
analysis, the least important quality factor, with respect to all strategic drivers, is
review and tracking performance.

Chapter Six: Development and validating AHP model
184
Figure 6. 11. The priority weights of the strategic drivers with respect to the
goal
Based on the above results, the AHP demonstrated that the strategic planning
driver is more important than the implementation and operation drivers with
respect to integrated quality management performance; it revealed that
leadership support, organisational structure and middle management
involvement are the most important critical quality factors in terms of successful
implementation of the strategic drivers and attaining integrated quality
management performance. Through sensitivity analysis, a decision maker can
observe the best scenario when the importance of the main criteria is changed
up and down to arrive at the best combination which suits, or is most effective,
to the integrated quality management performance.
0
10
20
30
40
50
Org
anis
atio
nal s
truc
ture
Foc
us o
n cu
stom
er
Lin
king
to s
uppl
ier
Tra
inin
g an
d ed
ucat
ion
Lea
ders
hip
supp
ort
Mid
dle
man
agem
ent
invo
lvem
ent
Qua
lity
com
mit
men
t
Eff
ecti
ve c
omm
unic
atio
n
Rev
iew
s and
trac
king
qua
lity…
Lea
ders
hip
supp
ort
Mid
dle
man
agem
ent
invo
lvem
ent
Qua
lity
com
mit
men
t
Eff
ecti
ve c
omm
unic
atio
n
Rev
iew
s and
trac
king
qua
lity…
Lea
ders
hip
supp
ort
Mid
dle
man
agem
ent
invo
lvem
ent
Qua
lity
com
mit
men
t
Eff
ecti
ve c
omm
unic
atio
n
Rev
iew
s and
trac
king
qua
lity…
Lea
ders
hip
supp
ort
Mid
dle
man
agem
ent
invo
lvem
ent
Qua
lity
com
mit
men
t
Eff
ecti
ve c
omm
unic
atio
n
Rev
iew
s and
trac
king
qua
lity…
strategicplanning
measurement andevaluation
analysis andactivation
improvement andperformance
verification andcontinues
improvement
48.3
27.6
14.1
10.1
41.9
19.3 19.3
11.7
7.8
39
24.7
15.6 13.6
7.2
38.4
16.6
21.5
15.6
7.9
42
22.6
13.5 13.5
8.5 P
refe
renc
es i
n (%
)
Chapter Six: Development and validating AHP model
185
6.6. Conclusion
Integrated quality management performance is one of the crucial approaches in
today's competitive quality management system. It is reasonable to evaluate the
reliable and effective strategy that can lead to the creation of sustainable
improvement and achieve a competitive advantage. In this study, the strategic
drivers for achieving an effective integrated quality management performance
have been selected and evaluated based on the AHP methodology. The
proposed model highlighted the relative importance of each criterion with
respect to the upper level, through the data collection stage, quality
professionals, industrialist and academics who were involved with the model
devolved based on their opinion collectively. The local and the global ranking
was performed and the validation carried out by the consistency check with
AHP.
The study concluded that the strategic planning drivers are more important than
the implementation and operating drivers. Additionally, there are critical quality
factors which should attract considerable attention for the successful
implementation of the strategic drivers and attain integrated quality
management; leadership support and organisation structure. The sensitivity
study gave a picture about how the changing of priority in one criterion affects
the other. Finally, this information is also significant to the decision maker who
desires to improve the operation performance and identify quality management.

186
Chapter Seven
Development of an integrated quality management framework
for manufacturing organisations (IQM-FW)
7.1. Introduction .................................................................................................................................. 187
7.2. The proposed integrated quality management framework .......................................................... 187
7.2.1. The main body of the framework .............................................................................................. 188
7.2.2. The main elements of the framework ........................................................................................ 188
7.2.3. The operational mechanism of the framework .......................................................................... 188
7.3. The implementation procedures of IQM framework ..................................................................... 190
7.3.1. Phase1: Strategic Planning. ...................................................................................................... 190
7.3.1.1. Strategic soft factors .............................................................................................................. 190
7.3.1.2. Strategic planning steps ......................................................................................................... 192
7.3.2. Phase 2; Measurement and evaluation .................................................................................... 195
7.3.2.1. Data collection to evaluate the current process performance ............................................... 195
7.3.2.2. Evaluating the current process by studying the current VSM ................................................ 195
7.3.2.3. Evaluating the measurements to establish the performance capability ................................. 196
7.3.3. Phase 3; Analysis and activation .............................................................................................. 196
7.3.3.1. Evaluating the quality system and identifying the significant problems ................................. 196
7.3.3.2. Undertaken RCA to analyze the causes of the problems ...................................................... 196
7.3.3.3. Applying SPC to analyse the potential causes of the problems and detect the variation ...... 197
7.3.3.4. Identifying the gap between the current and the desired performance ................................. 198
7.3.4. Phase 4; Improvement and monitoring ..................................................................................... 198
7.3.4.1. Identification of the objectives needed to conduct DOE ........................................................ 199
7.3.4.2. Conducting DOE .................................................................................................................... 200
7.3.4.3. Analyse the results of DOE to obtain statistics significance .................................................. 201
7.3.4.4. Evaluate the possible solutions .............................................................................................. 202
7.3.4.5. Identify the solution and analyse the risk ............................................................................... 202
7.3.4.6. Standardising the work and implementing the solution ......................................................... 202
7.3.4.7. Monitoring and enhancing the operation performance .......................................................... 203
7.3.5. Phase 5; Verifying and continuous improvement ..................................................................... 204
7.3.5.1. Creating and implementing a control plan ............................................................................. 204
7.3.5.2. Update the actions aimed at improvement to achieve high quality ....................................... 204
7.3.5.3. Document the quality issues .................................................................................................. 204
7.3.5.4. Evaluating the operating performance and verifying the quality system ............................... 205
7.4. The CSFs for successful implementation of the proposed framework ........................................ 207
7.5. Conclusion ................................................................................................................................... 208

Chapter Seven: Development of the IQM-FW
187
7.1. Introduction
Based on the literature review, the research study was developed and the two
models were validated (the LSS integrated model for improving the
manufacturing process within manufacturing organisations profoundly
discussed in chapter four and SS-TQM integrated model for unifying the
management system and achieving business excellence within manufacturing
organisations deeply discussed in chapter five). In this chapter, the study
presents the development of the proposed framework and provides the main
procedures that are necessary for successful implementation the proposed
framework.
7.2. The proposed integrated quality management framework
Scheer and Nüttgens (2000) advised that quality management framework
should be simple, logical and, yet, comprehensive enough to be successful in
the implementation process and attain improvement in the level of performance.
Aalbregtse et al. (1991) defined the framework as a conceptual structure
intended to guide and supports the practitioners to overcome managerial and
operational problems and achieve the desired results. Therefore, the proposed
framework will be described as follows. The process of developing the proposed
framework is a result of integrating LSS model and SS-TQM model (discussed
in chapter 6), in which the strategic element of both models is integrated to
formulate an effective platform for planning the operation system and facilitating
the implementation procedures of the framework. The operation elements of the
LSS model is integrated with both the implementation elements and the
business excellence elements of SS-TQM model in order to provide impetus
and guidance for quality improvement and for attaining performance excellence

Chapter Seven: Development of the IQM-FW
188
in the manufacturing organisations. However, Six-Sigma DMAIC improvement
is adopted as the key strategy of the framework for identifying opportunities for
improvement and for obtaining the operation performance. Accordingly, the
framework consists of three main components which are:
7.2.1. The main body of the framework
The structure of the framework is represented by flowchart diagram in figure
(7.1) which displays the framework activities and the integrated functions. The
development of the flowchart is mainly based on the literature review and the
findings of the AHP model in which the components of the framework were
evaluated and prioritised.
7.2.2. The main elements of the framework
The set of quality tools, statistical tools and global tools employed to formulate
the stages of the framework are also prioritised and organised based on DMAIC
strategy to deliver the tasks step-by-step in order to provide the opportunity for
quality improvement and to overcome quality problems. The development of
these elements is based on the literature review and according to the strategy
of the black belt and green belt of ASQ (Pysdek and Keller, P., 2003).
7.2.3. The operational mechanism of the framework
The work activities and the functions of the framework are organised based on
the trend of DMAIC methodology, where the stages, processes and steps of the
framework are integrated to gather and to simplify the operation process and to
attain an effective quality of performance. This mechanism is designed as an
integrated and unified system to operate the framework, the development of

Chapter Seven: Development of the IQM-FW
189
these integrated functions and mechanism is based on the literature review and
the application of black belt and green belt of ASQ (Pysdek and Keller 2003).
Middle
Management
Involvement
Review and tracking
performance
Organisation structure
Focus on customer
Linking to supplier
Phase 1. Strategic planning
Quality
commitment
Effective communication
Excellence performance
Focus on training and employees
development
To
p m
an
ag
em
en
t a
nd
le
ad
ers
hip
su
pp
ort
Cu
sto
me
r m
an
ag
em
en
t a
nd
ma
rke
t a
na
lysi
s
Capture customer needs
Set up KPICTCCTQCTS
Assess the current system to define the
quality problems
Set up the objectives
Form the functional
team
Phase 3Analyse and activation
Assess the quality problem using Prato analysis
Apply Six-sigma measures to identify the gap between the Current and the
target performance using: δ measure, CP, CPK, Yield and analyse VSM
Undertaken RCA using Fishbone ,
brainstorming& 5 why techniques to determine the key cause of the
problem
Assess the potential causes to detect the variation using SPC
List the factors need to be improved
Phase 2Measurement and evaluation
Collect data to evaluate potential performance
Evaluate measurements to establish performance capability
Evaluating the current performance by Apply VSM
Phase 4Improvement and monitoring
YES
No
Is the
results
significant
Identify the objectives to
conduct DOEConduct DOE
Analyse results of DOE to obtain statistics
significance
Standardise the work and implement the
solution
Identify the solution and analyse the risk
Evaluate the possible solutions
Apply TPM for monitoring the process performance. Use OEE to evaluate the effectiveness of the operations
Document the quality issues
Verifying the quality system by evaluating the operating performance using Balanced scored card ands KPI
Update the improvement actions for high quality
Apply SPC and PDCA to Create and implement A control plan
Phase 5 Verifying and continues improvement
Is the planning clear
and the problems
defined
Identify the process capability ( CP, CPK, Yield , DPMO)
Figure 7. 1. An integrated quality management framework for
manufacturing organisations

Chapter Seven: Development of the IQM-FW
190
7.3. The implementation procedures of IQM framework
The components of the IQM framework were developed gradually and were
based on the literature review and on what was learned from integrating LSS
model and SS-TQM model. It also evaluated and prioritised using AHP in the
previous chapter. Accordingly, the implementation processes of the IQM
framework have been designed, sequentially, to be implemented in five phases,
each phase concerned with the completion of its tasks through a number of
stages. The development of the implementation procedures of IQM framework
was adopted based on the sequences of DMAIC procedures; in which Phase1 -
Strategic planning, Phase 2 - Measurement and evaluation and Phase 3 -
Analysis and activation and Phase 4 - Verification and continuous improvement.
7.3.1. Phase1: Strategic Planning.
Strategic Planning is an organisational management process for defining its
strategy and making decisions in order to allocate its resources, assess the
current organisational performance and set up the organisational objectives in
which to achieve success in the implementation process and attain the desired
goals.
Strategic planning is the first phase of the integrated framework to coordinate
and align the ongoing process by determining the mission and identifying the
final vision. The strategic planning phase comprises two main elements;
strategic soft factors and strategic planning steps:
7.3.1.1. Strategic soft factors
Strategic soft factors are the key factors that are a positively affect on the
strategic planning process; therefore, the soft strategic factors must be paid
considerable attention before starting in the planning process, soft strategic

Chapter Seven: Development of the IQM-FW
191
factors are complemented with the strategic steps to implement effective
strategic planning which enable the organisation to succeed with the
implementation process and achieve the desired performance. The strategic
soft factors cover the key elements including the four main factors;
organisational structure, focusing on the customer, linking to the supplier and
focuses on training and education.
7.3.1.1.1. Organisation structure; is the pattern of the organisation's activities
that are divided, organised and coordinated in which supervision is directed
toward the achievement of the organisational goals (Antony,2002).
Organisations can be structured in a different way depending on its objectives;
however, the organisation should start to focus on these factors before starting
the planning process.
7.3.1.1.2. Customer focus; Hellsten and Klefsjö (2000) stated customer focus is
the driving force of the process improvement and quality development, as such,
in the planning process, customer focus should give prior attention to
understanding its requirements proactively and, hence, take action to consider
its ongoing process.
7.3.1.1.3. Linking to supplier; suppliers are the first stage of delivering quality
improvement in which the task of the supplier is to fulfil the requirements of the
organisations in terms of delivering quality input (Demirbag et al., 2006), the
importance of establishing links to the supplier is to create and sustain a
superior relationship with reliable suppliers in order to provide a high-quality
input such as providing raw materials and other required services.
7.3.1.1.4. Training and education; Ishikawa (1989) stated that training and
education are vital in determining the success of any quality management
framework. Oakland (2000) and Porter and Parker (1985) stated that training is
Chapter Seven: Development of the IQM-FW
192
a critical factor for the success any quality management programme. Therefore,
training and education are the other significant soft strategic factors that must
be considered in order to create successful strategic planning.
7.3.1.2. Strategic planning steps
Strategic planning steps are the key steps to formulating quality management
planning and defining the current quality problems. This phase including five
steps to complete the strategic planning listed below.
7.3.1.2.1. Capture customer needs;
In this step, the customer requirements are determined to obtain the baseline
measurement of customer satisfaction, hence, to determine the value of the
customer. Voice Of Customer (VOC) is the appropriate tool to employ, where
VOC has four steps; identify the customers based on customer segmentation
process and SIPOC technique, gather customer information by applying
customer information sources, analyse customer information using the two main
quality tools; the Affinity diagram and Kano analysis. Finally, determine
customer needs using CTQ or QFD techniques to translate customer needs to
specific requirements.
7.3.1.2.2. Set up KPIs (Key Performance Indicators)
Based on the information derived from VOC, and according to the products and
services specification, the role of KPIs is to establish the milestone of the
business performance, which includes; product performance metrics, the
performance of the business process and the performance of quality
improvement. Therefore, KPIs can be defined as the process of establishing the
standards and metrics to ensure the strategic planning is being followed.
Chapter Seven: Development of the IQM-FW
193
However, KPIs, in general, are divided into; CTQ (critical to quality), CTC
(critical to cost) and CTS (critical to schedule).
CTC; Critical-To-Cost is a metric including the typical cost of tasks and
estimation of hidden cost such as are incurred in the cost of poor quality.
CTQ; Critical-To-Quality is the attributes of parts, assembly, sub-assembly and
the process which has a direct impact on actual or perceived quality. CTQ
enables organisations to identify a valid metrics that are required to be
generated from the processes in order to assist the organisation to meet
customer satisfaction.
CTS; Critical-To-Schedule is the metrics related to the cycle time and the
scheduling of the operation process.
7.3.1.2.3. Assess the current system and define quality problems
In order to set out effective goals for improvement, the whole business and
operation process should be evaluated to identify the current quality problems.
This step can be obtained by defining the voice of the process (VOP), in which
VOP is a quality management term used to describe the ability of the process
performance with respect to customer expectation. Evaluating the current
performance is mainly taken place in a further phase. However, quality
problems must be assessed with respect to the customer requirements to
establish effective improvement objectives. The typical quality tools and
techniques that can be employed to diagnosis the quality problems in this phase
is the ‘5 Why’ tool, where, in most cases, the quality problem is caused by
human factors or process variation (Pyzdek, 2014).
7.3.1.2.4. Set up the objectives
The organisational objectives in quality management are the steps which
progress towards the achieving of the organisation’s goals. As such, the

Chapter Seven: Development of the IQM-FW
194
organisation objectives should be identified, prioritised and organised in order to
address the quality problems and achieve the final goals. This task is a team
brainstorming session aimed to build up the sequential steps in order to achieve
the desired results.
7.3.1.2.5. Formulate a functional team
After the quality management plan is developed, reviewed and approved based
on the previous steps, then the leadership, in communication with the chief
executive, have to specify the functions and the responsibility of each team
based on the organisational objectives. In addition, they have to establish a
training program to enable the employees to improve their ability and
understanding how to lead their tasks effectively. The team functions in this
framework must be planned based on the roles of the LSS and TQM
approaches, where the tasks being delivered are based on top-down
management. These tasks are integrated with the management activity of TQM
(QCC and QIT) to enable the system to establish the opportunity for continuous
improvement. They also simplify the implementation process by involving
everyone in the organisation under the supervision of middle management and
leadership support.
By the end of the strategic planning stage, the planning team should ensure that
the strategic planning is clear and that the quality problems are identified. If
there is something missing, or not clear, the strategic plan must be reviewed
again. If the strategic plan is confirmed, then the tasks of the next phase should
be started.
Chapter Seven: Development of the IQM-FW
195
7.3.2. Phase 2; Measurement and evaluation
The main objectives of this phase are to evaluate the current quality system, via
collecting the required data in order to assess the process behaviour, determine
the bottleneck and the area of waste by studying the current VSM. Then,
evaluate the performance of the process using PCA, finally evaluating the
measurement system. This phase consists of the following stages:
7.3.2.1. Data collection to evaluate the current process performance
The main objectives of this stage are to evaluate the process behaviour, this
can be carried out by collecting data to assess the behaviour of the process and,
in doing so, identify the current performance. A set of statistical tools are mainly
employed to carry out these tasks; SPC tools including control charts, Proses
capability analysis (Cp and Cpk), DPMO and process Sigma level (σ). In which
control charts give an indication of the process behaviour, process capability
analysis Cp, Cpk work to predict and identify the process performance.
However, the desired performance can be identified based on analysing the
sigma level or/and DPMO based on CP/Cpk results in next phase.
7.3.2.2. Evaluating the current process by studying the current VSM
The purpose of this process is to evaluate the operation processes by applying
the Value Stream Mapping technique. VSM reveals both the flow of product,
materials and information from the supplier to the customer. VSM is a technique
used to illustrate the flow of the operational processes to identify how the
process is working and determine the bottlenecks that are hindering the stream
of the process, thereby, identifying the areas that need be improved
(Drohomeretski et al., 2013). Therefore, in this phase, VSM is used to identify
the bottlenecks, wastage and assess the potential improvements of the quality
Chapter Seven: Development of the IQM-FW
196
system. Using the results of VSM, the analysis will be undertaken to study the
causes of the poor performance in next step.
7.3.2.3. Evaluating the measurements system to establish the
performance capability
The purpose of this step is to evaluate the measurement system in order to
ensure its accuracy at all time. This can be achieved by employing Gage R+R
(repeatability and reproducibility) which is an effective tool that can standardize
and control the variations within the measurement system.
7.3.3. Phase 3; Analysis and activation
This phase is concerned with analyzing the gap between the current and the
desired performance, the main role of this phase is to identify and analyze the
root causes of the problems. In this phase, the set of statistical tools and
techniques is used to identify and analyze the causes of the problems and,
finally, to determine a list of factors based on root cause analysis to proceed to
the Design of Experiment (DOE) in a further phase. This phase including four
main stages as follows.
7.3.3.1. Evaluating the quality system and identifying the significant
problems
The aim of this stage is to identify quality problems which would be analyzed
step-by-step in later stages. Therefore, Prato chart is a crucial tool for
identifying the most significant problems affecting the quality system.
7.3.3.2. Undertaken RCA to analyse the causes of the problems
A set of quality tools is organised sequentially in this stage to quantify, identify
and analyse the causes of the problems. This is typically initiated with a cause
Chapter Seven: Development of the IQM-FW
197
and effect diagram to classify and quantify the causes overall and define the
problems based on brainstorming session by the quality team. The causes and
effect matrix is a method which ranks the causes of the problems. FMEA is a
vital technique used to rate the causes of the problem based on the severity,
likelihood and detecting the possibility of potential causes of problems occurring
in the process, determining the risk priority number (RPN) of the potential
causes of the problem. Through these steps, the main causes of the problems
are qualitatively and quantitatively analysed, in the next stage the key causes
will be statistically analysed (Six-Sigma Black Belt Course, 2015; Pyzdek and
Keller, 2014).
7.3.3.3. Applying SPC to analyse the potential causes of the problems and
detect the variation
Once the behaviour of the process is revealed, then the quality team must be
focused on analysing the sources of variation of the problems, this requires the
use of sophisticated statistical tools in order to obtain a variation reduction.
Therefore, Six-Sigma Black Belt course (2015) recommend the following three
steps; one is to develop a graphical representation of data to detect pattern,
then, to apply hypothesis testing to detect the sources of the causes and
subsequently to reduce the variation. Finally, the lists of factors that need to be
improved are identified. This can be achieved successfully using statistical
software, such as Minitab, which offers simple ways to conduct this kind of
analysis. However, a set of advanced statistical analysis can be used in this
stage dependent on the situation and the type of data, in practice, the
hypothesis statistical analysis assists by avoiding the high cost of experimental
efforts through the use of existing data. It also establishes a degree of
confidence that can support team decisions.

Chapter Seven: Development of the IQM-FW
198
7.3.3.4. Identifying the gap between the current and the desired
performance
The purpose of this stage is to determine opportunities for the improvements by
assessing the value that will be added. This is determined by the causes of the
problems that have been identified in the previous stage and, also, based on
the results of the data evaluation in the previous phase, the behavior of the
process was identified, the variation of the process determined and the
defectives and the waste quantified. Subsequently, the gap between the current
and the desired performance can be statistically identified. This is based on the
Sigma process, where the current sigma level is calculated based on PCA
results. The desired sigma level is statistically calculated based on the Six-
Sigma target causing the potential improvement to be identified. Finally, the
setting up of the actual process capability is based on the variation reduction
and value added. In this phase, the most common tools to use are; VSM - to
analyse the waste and bottlenecks then redesign the process activities, Rolled
Throughput Yield (RTY) - to determine the corrected and non-corrected
activities and to find the final process capability PCA.
7.3.4. Phase 4; Improvement and monitoring
The aim of this phase is to identify, investigate and confirm the solution to the
problems and, then, implement the improvement plan. The role of this phase is
to evaluate the causes of the problems in order to predict its effects on the
process output. This phase is based on design of experiment method (DOE)
The experiment focuses on assessing the process input (causes of the
problems) in order to predict the effects on the output and then optimise that
input. However, the input factors are often selected based on statistical analysis
obtained in the last phase. DOE is considered an experiment within
Chapter Seven: Development of the IQM-FW
199
investigations into those factors. Therefore, the mechanism of DOE is used to
set up the required objectives and the conditions to conduct experimentation,
then there is an investigation into the relationship between the proposed factors
and an effort to identify the type of interaction. Subsequently, this will pinpoint
the effects of the proposed factors on the response, ultimately, consolidating
and confirming the process of improvement. This phase comprises seven steps
which follow:
7.3.4.1. Identification of the objectives needed to conduct DOE
The key objectives of DOE are identified based on causes of the process or
product problems and by determining an effective way to eliminate those
causes, thereby, solving the problems. Identifying the objectives of DOE is a
team brainstorming decision which relies on circumstances of the process;
however, the team should identify the requirements preceding the experiment
before they set up the objectives. The main requirements of proceeding DOE
are:
Identify the factors; in which the factors comprise controllable and
uncontrollable factors, where the controlled factors are those factors that can be
modified. The uncontrolled factors are those parameters that cannot be
modified or which cover ‘noise’ factors such as temperature and humidity.
Identify the Levels; the levels correspond to each factor, the level is the setting
of the factor representing the attribute of the factor. Mathematically, the level is
termed factor values, wherein each experimental run involves the combination
of the levels of investigated factors.
Identify the responses or output measures; In this framework, the overall
factors must be identified in the previous phase and classifying in the planning
process of DOE in next step. Subsequently, the objectives of DOE can be

Chapter Seven: Development of the IQM-FW
200
identified based on the requirements of DOE, the overall objectives of DOE, in
process improvement, are intended to achieve the following steps;
to determine the relationships between cause and effect,
to understand of interactions among causative factors,
to determine the levels at which to set the controllable factors (product
dimension, alternative material, alternative designs, etc.) in order to
optimize reliability,
to minimize experimental error (noise),
To improve the robustness of the design or process to variation.
7.3.4.2. Conducting DOE
Design of experiment (DOE) is a systematic procedure which, primarily, carries
out in several, particularly in process improvement, to discover the unknown
effect on the outcomes (Pochampally and Gupta, 2014). The aim of this
technique is to manage the process input in order to optimise the process
output. DOE is considered the core value of the process improvement in this
framework. As such, it represents reengineering process based on statistical
thinking and experimental design intended to achieve dramatic improvement in
the business process. DOE is usually carried out in five steps; Planning,
Screening, Optimisation, Robustness and verification (Pyzdek and Keller, 2014).
7.3.4.2.1. Planning
The planning step of conducting DOE in this framework is to identify the main
objectives based on the requirements of DOE, to prioritise the objectives, to
assess the required resources and to determine the time required to complete
the experiment. In addition, the factors should be classified in this step, finally
identifying the possible factors and the most appropriate response.

Chapter Seven: Development of the IQM-FW
201
7.3.4.2.2. Screening
In this step, the team identifies the most important factors that affect the
process from the list of factors, in other words, minimising a number of
experimental runs where the greater the number of factors the more time
required for the experiment.
7.3.4.2.3. Optimisation
The aim of this step is to determine the setting of the factors needed to achieve
the desired objective, which is dependent on the investigation of the process or
the product. The goal could increase the yield or reduce the variation or both of
them.
7.3.4.2.4. Robustness Testing
Once the optimal factors are determined and the setting is complete, then the
robustness test should be carried out to ensure the experiment is working
appropriately. Robustness is defined as the degree to which the system is
working correctly (De Smith, 2015).
7.3.4.2.5. Verifying
The final step is to validate the experimental and to ensure the process
functions and the objectives are met; this can be attained through the following
experimental runs.
7.3.4.3. Analyse the results of DOE to obtain statistics significance
In this step, analysis of variation (ANOV) is used to analyse the results of DOE.
If the statistical analysis confirmed that the results are statistically significant,
then the quality team should generate innovative solutions for those causes of
the problems and develop the plan for improvement. If the results of ANOVA

Chapter Seven: Development of the IQM-FW
202
are not significant, then the team should repeat the cycle and go back to the
previous phase investigating the root causes of the problems again.
7.3.4.4. Evaluate the possible solutions
Once results of DOE are confirmed and the root causes of the problems are
clear, then the team has to generate possible solutions for eliminating the root
causes needed for prevention of problems, the process of generating solutions
is based on a team brainstorming session. The result of which is that a list of
solutions is generated, then, the available solutions must be assessed and
evaluated. The appropriate techniques used for evaluating the possible
solutions are PDCA technique and 3Cs.
7.3.4.5. Identify the solution and analyse the risk
Based on the results of PDCA, the team have to focus on the easiest and
simplest solutions. In this stage, the FMEA technique is an effective tool that
can help the quality team to select the efficient solution based on lists and
ranking the solutions by risk priority number (RPN) and, then, focus on the most
crucial one.
7.3.4.6. Standardising the work and implementing the solution
Once the solution is selected, the next step is applying a pilot experiment to trial
the solution or run simulations. If this is possible, this step provides the results
of the real-world application of the proposed solution. If the results are
confirmed, then, the solution is proven. At that point, the operation and
management process should be standardised, organised and sometimes
redesigned based on the improvement plan. Basically, in the most cases, the
improvement plan includes; eliminating waste, decreasing the number of
defectives and cycle time reduction. Thereby, the first tool to apply is
formulating the future VSM, after which comes the preparation and

Chapter Seven: Development of the IQM-FW
203
standardisation of the work area using 5S and Standardised tools, implementing
the improvement plan.
7.3.4.7. Monitoring and enhancing the operation performance
At this stage, total productive maintenance (TPM) is implemented to enhance
the effectiveness of the operational performance of machines and equipment.
The aim is to increase the efficiency of the system of operation and improve the
quality system. A number of tools can be employed to support this
methodology; however, Overall Evaluation Effectiveness (OEE) is an effective
tool for evaluating and determining the effectiveness of the machines and
equipment (see below)
OEE = Availability (A) x Performance efficiency (P) x Rate of Quality (Q) (Ahuja
et al., 2008)
Where: Rate of Quality (R)= − *100
Performance efficiency (P)= � � � / ℎ � � *100
Availability= (A )� � − �� � *100
Based on Six-Sigma black belt course (2015), and in accordance with Nakajima
(1988), TPM is a philosophy and a set of tools aimed to eliminate three types of
losses; availability loss, performance loss and quality loss. OEE is the key driver
which indicates to inefficiencies caused by those losses. Where availability
losses may include; breakdown losses and setup/adjustment losses.
Performance losses include idling and stoppage losses and speed losses.
Quality losses include scrap and rework losses and start-up losses.
Chapter Seven: Development of the IQM-FW
204
7.3.5. Phase 5; Verifying and continuous improvement
The aim of this phase is to verify the gains that have been attained and to
ensure that the improvements are continuous and sustained, the main
objectives are to confirm that the control plan is created and updated. The
documentation process is preceded, and the goals of the quality system are met.
This phase comprises four main stages listed below.
7.3.5.1. Creating and implementing a control plan
The variation can be inherited in every process and, hence, the waste and
defectives that can occur. Accordingly, an appropriate control plan is required to
provide the setup in order to monitor the activities and control the quality system.
Thereby, the control plan comprises; SPC which should be applied to track and
assess the operating performance and, also, problem-solving techniques such
as 3Cs or 8Ds which must be employed to deal with the common problems,
moreover the PDCA technique with Kaizen should be used proactively to
maintain and control the quality actions.
7.3.5.2. Update the actions aimed at improvement to achieve high quality
The purpose of this stage is to place emphasis on continuous improvement by
outlining the lessons learned and updating the recommendation. Another
purpose is to support the quality system with facts related to the data analysis,
expenditures and cost-saving in the previous performance in order to take
action to achieve a high-quality performance. These tasks should be achieved
by middle management and a quality team under the supervision of top
management.
7.3.5.3. Document the quality issues
This stage is concerned with updating the documentation process including the
errors and wrong procedures that have been taking place in the system.

Chapter Seven: Development of the IQM-FW
205
Additionally, the benefits that have been obtained through quality
implementation are determined, with ROI analysis used as a tool to outline the
benefits. The purpose of the documentation is intended to provide a summary
of the framework for the operation and management process, moreover, it
provides evidence about organisational capability.
7.3.5.4. Evaluating the operating performance and verifying the quality
system
The final stage is the stage of verifying the quality performance and measuring
the organisation’s level of success, thereby there are different global tools
employed at this stage, namely, the KPIs and balanced scrod card. These are
used to check whether the organisation has met the desired objectives
effectively, KPIs have been already established and set it in the strategic
planning phase as standards of quality metrics, However, the role of this stage
is to assess the extent to which the quality system is committed to those metrics,
in other words, KPIs measure the operation’s performance and a Balanced
Scorecard is to measure and monitor the success of the organisation strategy.
The evaluation of KPIs can be broken down into;
7.3.5.4.1. KPIs
Product performance metrics; concerned with the features and functions of the
product, where the evaluation is based on measurement system of the
organisation.
Performance of Business process metrics; concerned with standards for cycle
time, errors, process efficiency and process capability.
Performance of Quality improvement; the quality metric concerned with an
aspect of product performance and customer satisfaction which includes speed
of transaction and accuracy.
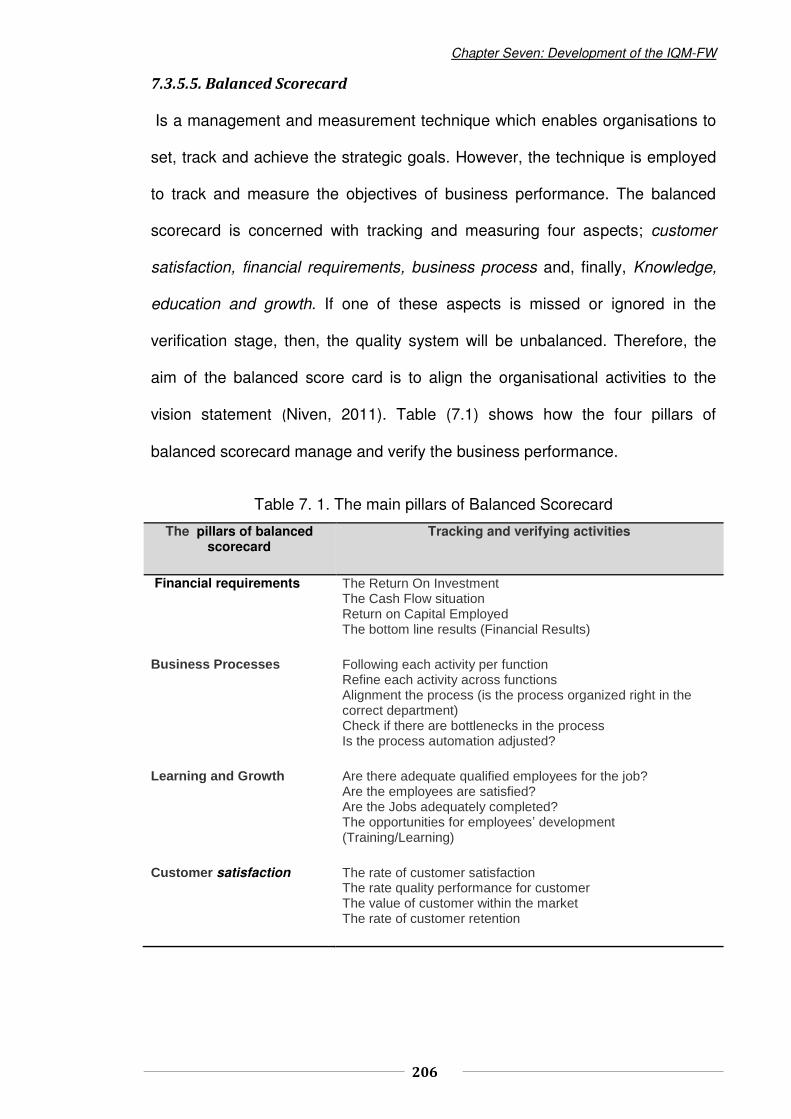
Chapter Seven: Development of the IQM-FW
206
7.3.5.5. Balanced Scorecard
Is a management and measurement technique which enables organisations to
set, track and achieve the strategic goals. However, the technique is employed
to track and measure the objectives of business performance. The balanced
scorecard is concerned with tracking and measuring four aspects; customer
satisfaction, financial requirements, business process and, finally, Knowledge,
education and growth. If one of these aspects is missed or ignored in the
verification stage, then, the quality system will be unbalanced. Therefore, the
aim of the balanced score card is to align the organisational activities to the
vision statement (Niven, 2011). Table (7.1) shows how the four pillars of
balanced scorecard manage and verify the business performance.
Table 7. 1. The main pillars of Balanced Scorecard
The pillars of balanced scorecard
Tracking and verifying activities
Financial requirements The Return On Investment The Cash Flow situation Return on Capital Employed The bottom line results (Financial Results)
Business Processes Following each activity per function Refine each activity across functions Alignment the process (is the process organized right in the correct department) Check if there are bottlenecks in the process Is the process automation adjusted?
Learning and Growth Are there adequate qualified employees for the job? Are the employees are satisfied? Are the Jobs adequately completed? The opportunities for employees’ development (Training/Learning)
Customer satisfaction The rate of customer satisfaction The rate quality performance for customer The value of customer within the market The rate of customer retention

Chapter Seven: Development of the IQM-FW
207
7.4. The CSFs for successful implementation of the proposed
framework
As it has been discussed in the literature review there are no clear success
factors mentioned for successful implementation of integrated quality
management framework; however, apparently the factors that were ranked as
an effective success factor for Six-Sigma, Lean and TQM implementation by
many studies such as (Schoen, 2006; Henderson and Evan, 2000; Antony and
Banuelas, 2002) and others. Some of those factors ranked in the study as soft
factors for the success of the strategic phase, others ranked as soft factors for
success the implementation phase's as it appeared in the framework, the rest of
them are ranked as success factors for an overall of the framework. However,
the critical success factors for the successful implementation of the IQM
framework overall are;
1. Organisational structure
2. Focus on customer
3. Linking to Suppliers
4. training and education
5. leadership support
6. Effective communication
7. Quality commitment
8. middle management involvement
9. reviews and tracking of performance
Chapter Seven: Development of the IQM-FW
208
7.5. Conclusions
The chapter focused on the development of an integrated quality management
framework for manufacturing organizations, the study showed how the
framework is developed and how the synergy between the methods of the
framework derived. The main components of the framework and its
implementation procedures stated and explained in deep details. Finally, by
developing the framework, the study demonstrated that the integration of Six-
Sigma, Lean manufacturing and TQM is formulating a platform to manage the
quality strategy and vision and how to apply the operational mechanism to
attain excellence performance. The next chapter will discuss the validation of
the proposed framework and its implementation procedures.
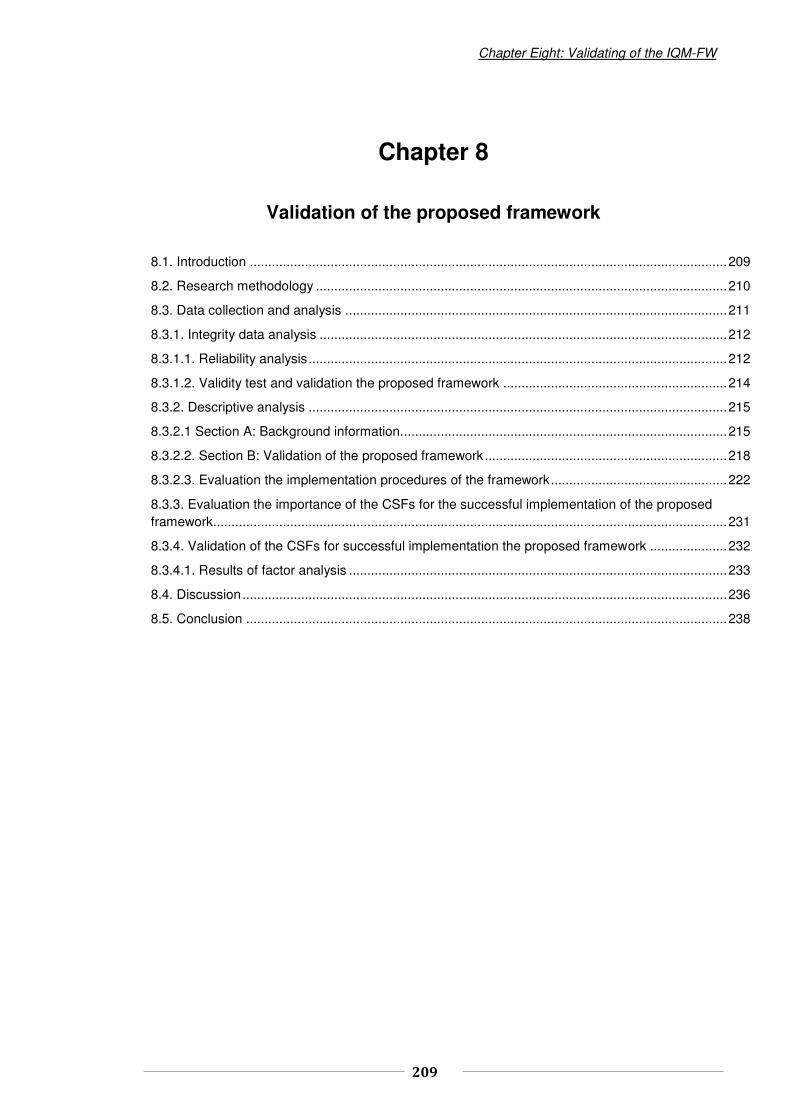
Chapter Eight: Validating of the IQM-FW
209
Chapter 8
Validation of the proposed framework
8.1. Introduction .................................................................................................................................. 209
8.2. Research methodology ................................................................................................................ 210
8.3. Data collection and analysis ........................................................................................................ 211
8.3.1. Integrity data analysis ............................................................................................................... 212
8.3.1.1. Reliability analysis .................................................................................................................. 212
8.3.1.2. Validity test and validation the proposed framework ............................................................. 214
8.3.2. Descriptive analysis .................................................................................................................. 215
8.3.2.1 Section A: Background information......................................................................................... 215
8.3.2.2. Section B: Validation of the proposed framework .................................................................. 218
8.3.2.3. Evaluation the implementation procedures of the framework ................................................ 222
8.3.3. Evaluation the importance of the CSFs for the successful implementation of the proposed framework............................................................................................................................................ 231
8.3.4. Validation of the CSFs for successful implementation the proposed framework ..................... 232
8.3.4.1. Results of factor analysis ....................................................................................................... 233
8.4. Discussion .................................................................................................................................... 236
8.5. Conclusion ................................................................................................................................... 238
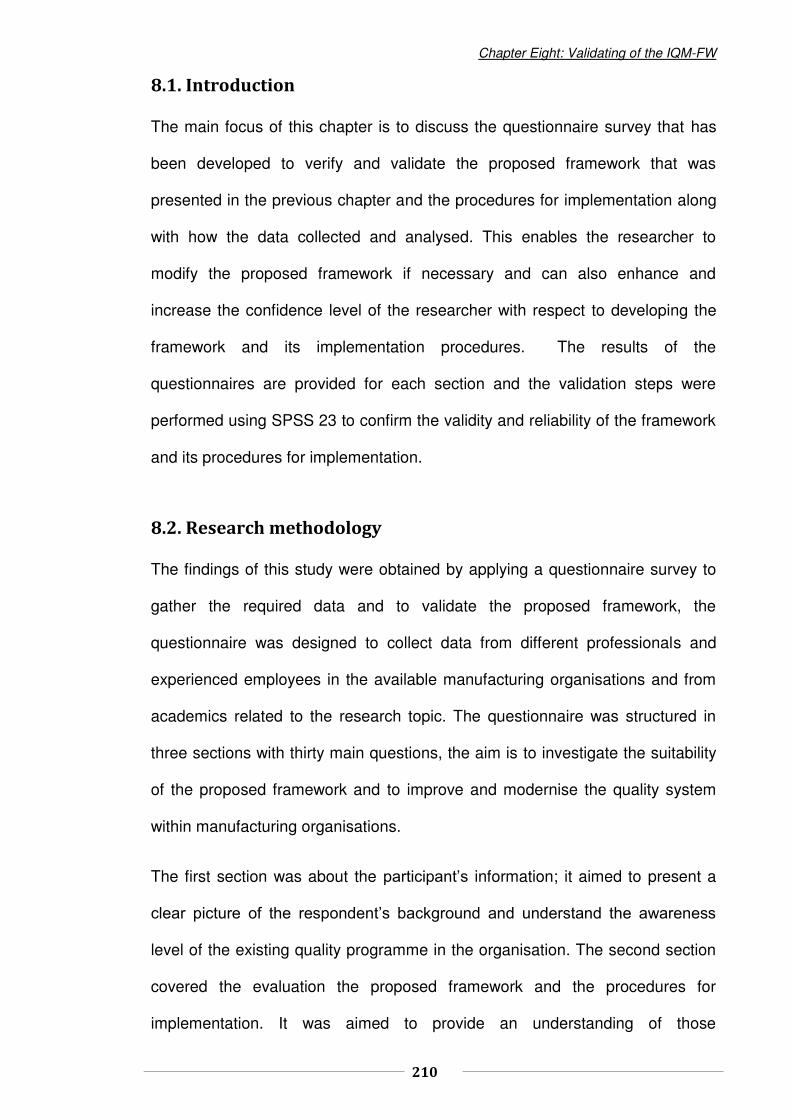
Chapter Eight: Validating of the IQM-FW
210
8.1. Introduction
The main focus of this chapter is to discuss the questionnaire survey that has
been developed to verify and validate the proposed framework that was
presented in the previous chapter and the procedures for implementation along
with how the data collected and analysed. This enables the researcher to
modify the proposed framework if necessary and can also enhance and
increase the confidence level of the researcher with respect to developing the
framework and its implementation procedures. The results of the
questionnaires are provided for each section and the validation steps were
performed using SPSS 23 to confirm the validity and reliability of the framework
and its procedures for implementation.
8.2. Research methodology
The findings of this study were obtained by applying a questionnaire survey to
gather the required data and to validate the proposed framework, the
questionnaire was designed to collect data from different professionals and
experienced employees in the available manufacturing organisations and from
academics related to the research topic. The questionnaire was structured in
three sections with thirty main questions, the aim is to investigate the suitability
of the proposed framework and to improve and modernise the quality system
within manufacturing organisations.
The first section was about the participant’s information; it aimed to present a
clear picture of the respondent’s background and understand the awareness
level of the existing quality programme in the organisation. The second section
covered the evaluation the proposed framework and the procedures for
implementation. It was aimed to provide an understanding of those

Chapter Eight: Validating of the IQM-FW
211
implementation procedures suitable for manufacturing organisations, to identify
the difficulties in implementing the proposed framework and to reveal the level
of accuracy within its contents with regards to helping business to gain a
competitive advantage in the long run. The final section was to evaluate the
importance of the CSFs for achieving successful implementation the proposed
framework and the potential barriers that can impede the implementation
process.
8.3. Data collection and analysis
This section outlines the results of the questionnaires received from the
respondents and how being organised for analysis. A total of 70 research
surveys were sent out to a host of management employees spread across
different manufacturing organisations around the global, 62 questionnaires were
completed and returned within a given time frame, a percentage considered to
be relatively high above average (Saunders et al., 2009). The statistical
software package was used to analyse the data collected which is an
appropriate method to provide robust and structured analysis (Bryman and
Cramer 2005). Statistical Package for Social Science is the most appropriate
Statistical software used for social science and engineering research (ibid).
Therefore, SPSS 23 was used to analyse the data collected in this study, 62
useable questionnaires were coded and entered to (SPSS 23) software
program, basic statistical analysis were carried out for the observation of
frequencies, percentage, mean and standard deviation to assess the data.

Chapter Eight: Validating of the IQM-FW
212
8.3.1. Integrity data analysis
8.3.1.1. Reliability analysis
A Reliability test is a crucial measure to assess the quality of the instruments
used in the questionnaire and to check the reliability of data collected, Cronbach
Alpha was also undertaken in this section to measure the internal consistency
of the instruments used to evaluate the proposed model. Ideally, Cronbach
alpha must be greater than 0.7 to consider the items being measured are
consistant and reliable (Field, 2013). Therefore, the test was carried out for
each of the six statements used to evaluate the proposed framework, the
results (in table (8.1) demonstrated that coefficient alpha is 0.81 and the
standardized item alpha is 0.78 which is greater than 0.70, accordingly that is
an indication that all of the items are consistent and reliable.
Table 8. 1. Reliability Statistics
Cronbach's Alpha Cronbach's Alpha Based on Standardized Items N of Items
.819 .763 6
However, the results in table (8.2), column three labelled ‘corrected item-total
correlation’ showed that there is positive correlation between the whole items
except item number six ‘Evaluating the FW in terms of anything missing and
should be added to the proposed FW’ which has negative correlation with value
( -0.098). In addition, in column five labelled ‘Cronbach's alpha if item deleted’
the same item has the highest alpha value, 0.865. Accordingly, if item number
six were deleted from the calculation, then Cronbach alpha would be improved.
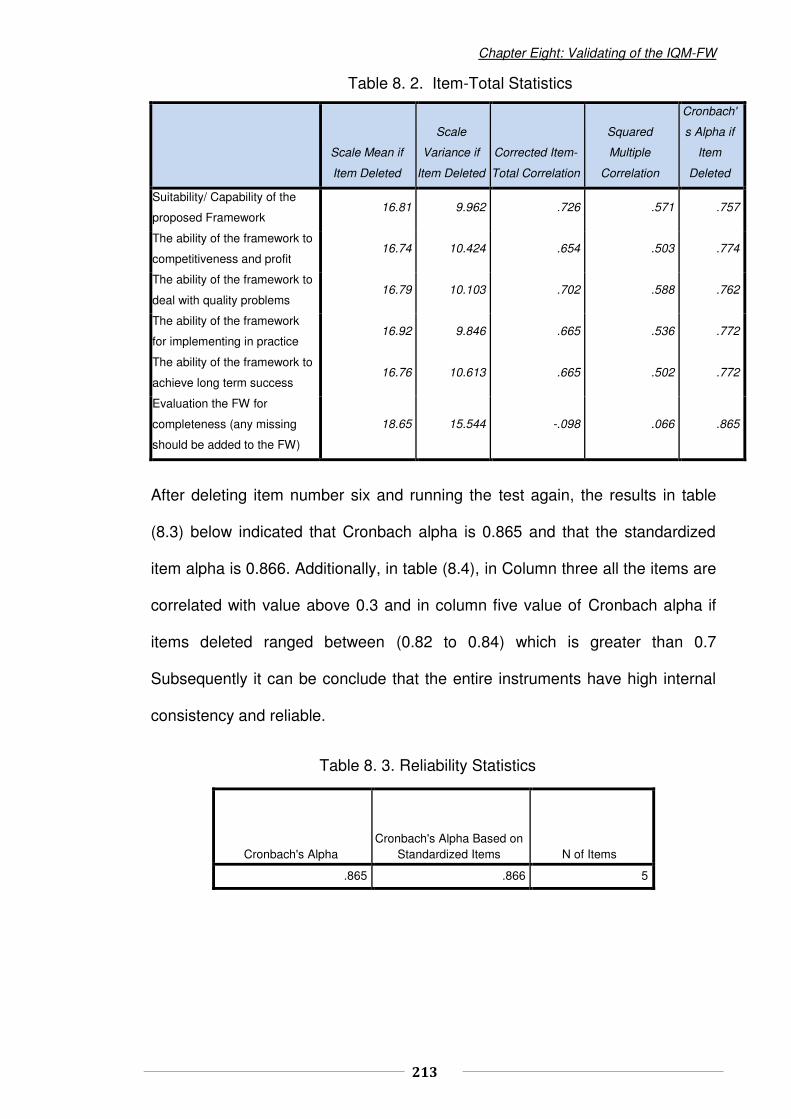
Chapter Eight: Validating of the IQM-FW
213
Table 8. 2. Item-Total Statistics
Scale Mean if
Item Deleted
Scale
Variance if
Item Deleted
Corrected Item-
Total Correlation
Squared
Multiple
Correlation
Cronbach'
s Alpha if
Item
Deleted
Suitability/ Capability of the
proposed Framework 16.81 9.962 .726 .571 .757
The ability of the framework to
competitiveness and profit 16.74 10.424 .654 .503 .774
The ability of the framework to
deal with quality problems 16.79 10.103 .702 .588 .762
The ability of the framework
for implementing in practice 16.92 9.846 .665 .536 .772
The ability of the framework to
achieve long term success 16.76 10.613 .665 .502 .772
Evaluation the FW for
completeness (any missing
should be added to the FW)
18.65 15.544 -.098 .066 .865
After deleting item number six and running the test again, the results in table
(8.3) below indicated that Cronbach alpha is 0.865 and that the standardized
item alpha is 0.866. Additionally, in table (8.4), in Column three all the items are
correlated with value above 0.3 and in column five value of Cronbach alpha if
items deleted ranged between (0.82 to 0.84) which is greater than 0.7
Subsequently it can be conclude that the entire instruments have high internal
consistency and reliable.
Table 8. 3. Reliability Statistics
Cronbach's Alpha Cronbach's Alpha Based on
Standardized Items N of Items
.865 .866 5

Chapter Eight: Validating of the IQM-FW
214
Table 8. 4. Item-Total Statistics
8.3.1.2. Validity test and validation the proposed framework
Validity tests confirm the degree to which the measures used in the study are
truthfully measuring what is intended to be measured (Valmohammadi, 2010).
As they should be performed to check the accuracy and truthfulness of the
results, Chi-square goodness of fit � ) was applied to check the validity of the
instruments that were used to evaluate the proposed framework. Chi-square
goodness of fit is used to find out whether an observed value is statistically,
significantly different from the expected value (Field, 2013) (see chapter 3
sections (3.6.2.2.1)). The Chi-square goodness of fit with corresponding P value
is considered to be significant if P value ≤ 0.05 (Bryman and Cramer, 2005).
As can be seen in table (8.5), the results of � demonstrated that the P values
are less than 0.05, which means that the results are significantly different from
the actual observed values and the expected values of all the statements used
to evaluate the proposed model. That also can be an indication for the
possibility of publishing the results and generalizing from the current research
sample to the entire publication Balck (2011) and Alzuabi (2014).
Scale Mean if
Item Deleted
Scale
Variance if
Item Deleted
Corrected Item-
Total Correlation
Squared
Multiple
Correlation
Cronbach's
Alpha if Item
Deleted
Suitability/ Capability of the
proposed Framework 14.92 10.108 .720 .566 .828
The ability of the framework
to competitiveness and profit 14.85 10.454 .671 .484 .840
The ability of the framework
to deal with quality problems 14.90 10.220 .703 .588 .833
The ability of the framework
for implementing in practice 15.03 9.901 .676 .529 .840
The ability of the framework
to achieve long-term success 14.87 10.737 .664 .499 .842

Chapter Eight: Validating of the IQM-FW
215
Table 8. 5. Test Statistics
Suitability/
Capability of the
proposed
Framework
The ability of the
framework to
competitiveness
and profit
The ability of the
framework to
deal with quality
problems
The ability of the
framework for
implementing in
practice
The ability of the
framework to
achieve long-
term success
Any missing in
the contents of
the proposed
framework
Chi-Square 31.387a 33.323a 41.387a 31.710a 34.129a 37.161b
df 4 4 4 4 4 1
Asymp. Sig. .000 .000 .000 .000 .000 .000
a. 0 cells (0.0%) have expected frequencies less than 5. The minimum expected cell frequency is 12.4.
b. 0 cells (0.0%) have expected frequencies less than 5. The minimum expected cell frequency is 31.0.
8.3.2. Descriptive analysis
This section provides the descriptive analysis of the data collected using SPSS
23. Various descriptive measures were used to measure the central tendency
(mean, mode, median), allowing the results of data analysis to be provided in
the following sections in forms of tables, charts and different statistics and
figures.
8.3.2.1 Section A: Background information.
The section provides the results of the questionnaires received from the
respondents. The aim of this part of the survey is to present a clear picture of
the respondent’s background and to understand the awareness level of the
existing quality program in the organisation.
1. Respondent's position
The respondents were asked to state their position within their organisation.
The results listed in the table (8.6) showed that 50% of the respondents are
academics, 9.7% are quality managers, 8.1% are directors, 6.5% operational
managers and belt function. Finally, 3.2% including project leaders and heads
of department and coordinators.

Chapter Eight: Validating of the IQM-FW
216
Table 8. 6. Position within the organisation
Frequency Percent Valid Percent Cumulative
Percent
Valid Director 5 8.1 8.1 8.1
Quality manager 8 12.9 12.9 21.0
Operation manager 4 6.5 6.5 27.4
Quality Engineer 6 9.7 9.7 37.1
Belt function 4 6.5 6.5 43.5
Project leader or Department head
2 3.2 3.2 46.8
Coordinator 2 3.2 3.2 50.0
Academics 31 50.0 50.0 100.0
Total 62 100.0 100.0
2. Area of industry
The respondents were asked to indicate the industrial sector in which their
organisations functioned, the results were shown in a table (8.7). 29% of the
respondents belong to the manufacturing sector, 17.7% belong to the Oil and
Gas sector, and 6.5% are from automotive industry. The remaining 46.8%
others include academics and research students who belong to the higher
education.
Table 8. 7. Area of Industry
Frequency Percent Valid Percent Cumulative
Percent
Valid Manufacturing 18 29.0 29.0 29.0
Automotive 11 17.7 17.7 46.8
Oil and Gas 4 6.5 6.5 53.2
Other 29 46.8 46.8 100.0
Total 62 100.0 100.0

Chapter Eight: Validating of the IQM-FW
217
3. The global location of the organisation
The respondents were asked to state the location of their organisations. The
results in table (8.8) showed 23 of the participants were from UK, 22 from Libya,
4 from Russia, 3 each from Portugal and Egypt, 2 each from Nigeria and China,
with the remaining participants from the USA, Canada and Morocco with1
participant each.
Table 8. 8. Organisations Location
Frequency Percent Valid Percent Cumulative
Percent
Valid Libya 22 35.5 35.5 35.5
UK 23 37.1 37.1 72.6
Russia 4 6.5 6.5 79.0
Portugal 3 4.8 4.8 83.9
Nigeria 2 3.2 3.2 87.1
China 2 3.2 3.2 90.3
Egypt 3 4.8 4.8 95.2
Canada 1 1.6 1.6 96.8
USA 1 1.6 1.6 98.4
Morocco 1 1.6 1.6 100.0
Total 62 100.0 100.0
4. The type of the quality system currently employed of respondent's
organisations
The respondents were asked to indicate the quality system currently used within
the organisation, the results in table (E-1) in appendix (E) demonstrated as
follows; 4.8% Six-Sigma, 6.5% Lean manufacturing, 8.1 %TQM and 80.6 other
quality systems.
5. The level of awareness with Six-Sigma, Lean and TQM tools/ techniques
Six-Sigma, Lean and TQM tools were presented to the respondents and they
were asked to indicate if they were aware of any of the tools listed in the survey
questions. The results presented in table (E-2) in appendix (E) showed that the

Chapter Eight: Validating of the IQM-FW
218
majority of respondents seems to be familiar with most of the tools and
indicated that the level of the awareness with these tools were above 50%
which are slightly above average. However, the only tool ranked below 50% is
the PERT chart.
8.3.2.2. Section B: Validation of the proposed framework
This section of the survey seeks to validate the proposed framework for
manufacturing organisations, it aims to provide an understanding of the
implementation procedures suitable for manufacturing organisations, identify
the difficulties in implementing the proposed framework and reveal the accuracy
level in its contents in terms of helping manufacturing organisations to gain a
competitive advantage in the long run. The framework was presented to the
respondents and were asked to evaluate the framework in terms of the
suitability for manufacturing organisation and their applicability to achieve
competitive advantages, additionally, evaluation the implementation procedures
of the framework for manufacturing organisations was based on the ranking
below;
1–Strongly Disagree. 2– Disagree. 3– Moderate. 4– Agree. 5 –Strongly Agree.
The results of the evaluation of the proposed framework were as follows;
1. Evaluation -of- The suitability and capability of the framework for
manufacturing organisations.
The results in table (8.9) demonstrated that 35% of the respondents answered
that the suitability capability of the framework for manufacturing organisations is
moderate, 33.9% agree, 24.2% strongly agreed and 3.2% of the respondents
either disagree and strongly disagree, respectively. However, the suitability of
the proposed framework is fully supported at 58.1%.
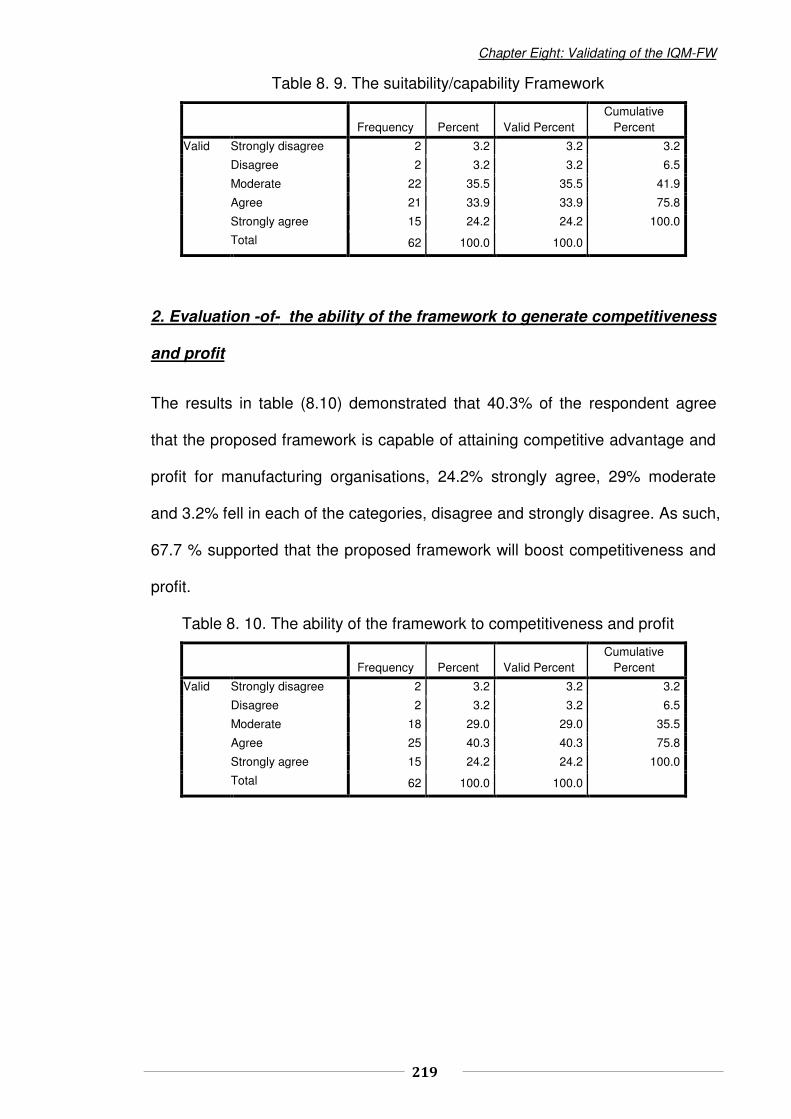
Chapter Eight: Validating of the IQM-FW
219
Table 8. 9. The suitability/capability Framework
Frequency Percent Valid Percent Cumulative
Percent
Valid Strongly disagree 2 3.2 3.2 3.2
Disagree 2 3.2 3.2 6.5
Moderate 22 35.5 35.5 41.9
Agree 21 33.9 33.9 75.8
Strongly agree 15 24.2 24.2 100.0
Total 62 100.0 100.0
2. Evaluation -of- the ability of the framework to generate competitiveness
and profit
The results in table (8.10) demonstrated that 40.3% of the respondent agree
that the proposed framework is capable of attaining competitive advantage and
profit for manufacturing organisations, 24.2% strongly agree, 29% moderate
and 3.2% fell in each of the categories, disagree and strongly disagree. As such,
67.7 % supported that the proposed framework will boost competitiveness and
profit.
Table 8. 10. The ability of the framework to competitiveness and profit
Frequency Percent Valid Percent Cumulative
Percent
Valid Strongly disagree 2 3.2 3.2 3.2
Disagree 2 3.2 3.2 6.5
Moderate 18 29.0 29.0 35.5
Agree 25 40.3 40.3 75.8
Strongly agree 15 24.2 24.2 100.0
Total 62 100.0 100.0

Chapter Eight: Validating of the IQM-FW
220
3. Evaluation -of- the ability of the framework to deal with and to overcome
quality problems
The results in table (8.11) demonstrated that 48.4% of the respondents agree
that the proposed framework can deal and overcome quality problems, 24.2%
moderate, 29.4% strongly agree, 4.8% strongly disagree and 3.2% disagree.
Therefore, 77.8% were entirely in the agreement that the proposed framework
would be able to deal with and to overcome quality problems.
Table 8. 11. The Ability of the framework to deal and overcome quality problems
Frequency Percent Valid Percent
Cumulative Percent
Valid Strongly disagree 3 4.8 4.8 4.8
Disagree 2 3.2 3.2 8.1
Moderate 15 24.2 24.2 32.3
Agree 30 48.4 48.4 80.6
Strongly agree 12 19.4 19.4 100.0
Total 62 100.0 100.0
4. Evaluation -of- The ability of the framework to be implemented in
practice
The results in table (8.12) demonstrated that 45.2% of the respondents agree
that the proposed framework is capable of overcoming the complex nature of
quality management implementation. 24.2% moderate, 17.7% strongly agree
and 6.5% fell into each category; disagree and strongly disagree on the Likert
scale. Overall, 62.9% were entirely in agreement with ability of the framework to
deal with implementation complexity.

Chapter Eight: Validating of the IQM-FW
221
Table 8. 12. The ability of the framework to be implemented in practice
Frequency Percent Valid Percent Cumulative
Percent
Valid Strongly disagree 4 6.5 6.5 6.5
Disagree 4 6.5 6.5 12.9
Moderate 15 24.2 24.2 37.1
Agree 28 45.2 45.2 82.3
Strongly agree 11 17.7 17.7 100.0
Total 62 100.0 100.0
5. Evaluation -of- The ability of the framework to achieve long-term
success
Table (8.13) demonstrated that 40.3% agreed that the proposed framework can
lead the manufacturing organisation achieving its long-term goals. 30.6%
moderate, 22.6% strongly agree, 4.3% disagree and 1.6% strongly disagree.
The results, overall, supported that 62.9% were in agreement with the ability of
the framework to achieve long-term success.
Table 8. 13. The ability of the framework to achieve long-term success
Frequency Percent Valid Percent Cumulative
Percent
Valid Strongly disagree 1 1.6 1.6 1.6
Disagree 3 4.8 4.8 6.5
Moderate 19 30.6 30.6 37.1
Agree 25 40.3 40.3 77.4
Strongly agree 14 22.6 22.6 100.0
Total 62 100.0 100.0
6. Evaluation -of- The level of completeness in the contents of the
proposed framework
According to the results in table (8.14) 88.7% of the respondents indicated that
the contents proposed framework is complete whereas 11.3% are not confident
about the completeness of the model.

Chapter Eight: Validating of the IQM-FW
222
Table 8. 14. The completeness of the contents of the proposed framework
Frequency Percent Valid Percent Cumulative
Percent
Valid Yes 7 11.3 11.3 11.3
No 55 88.7 88.7 100.0
Total 62 100.0 100.0
8.3.2.3. Evaluation the implementation procedures of the framework
This part of the research seeks to evaluate the procedures concerning
implementation of the proposed framework. For the five main implementation
procedures (5 phases) designed for implementing the framework see chapter
(7) section (7.3). The procedures designed for implementation were presented
to the respondents in the framework. The respondents were asked to indicate
how the statements related to each phase based on the following ranking;
1–Strongly Disagree 2– Disagree 3– Moderate 4– Agree 5 –Strongly Agree
8.3.2.3.1. Evaluating the strategic planning phase
The strategic planning phase including two main components:
Strategic soft factors
Strategic steps
Evaluation - The strategic soft factors
1. Evaluating the contents of strategic soft factors
The results in table (8.15) demonstrated that 51.6 of the respondents agree with
the contents of the soft factors in phase one, 43.5% strongly agree and only
4.8% moderate. Overall, 95.1% of the respondents are in agreement with the
soft factors in phase one.

Chapter Eight: Validating of the IQM-FW
223
Table 8. 15. Evaluating the contents of strategic soft factors
Frequency Percent Valid Percent Cumulative
Percent
Valid Moderate 3 4.8 4.8 4.8
Agree 32 51.6 51.6 56.5
Strongly agree 27 43.5 43.5 100.0
Total 62 100.0 100.0
2. Evaluation the applicability of the soft factors for success in the strategic
planning within phase1
The results in table (8.16) demonstrated that 72% of the respondents agree,
12.9%, strongly agree and 14.5% moderate. The results, overall, were that
84.9% of the respondents in agreement with this statement.
Table 8. 16. Evaluation The applicability of the soft factors of the strategic
planning in phase one
Frequency Percent Valid Percent Cumulative
Percent
Valid Moderate 9 14.5 14.5 14.5
Agree 45 72.6 72.6 87.1
Strongly agree 8 12.9 12.9 100.0
Total 62 100.0 100.0
.
3. Evaluation the soft factors in terms of anything that might be missing and
should be added
The results in table (8.17) demonstrated that 98.4% of the respondents agree
with the contents of the soft factors.
Table 8. 17. Evaluation of any soft factors missing which should be added to the
strategic planning phase
Frequency Percent Valid Percent Cumulative
Percent
Valid Yes 1 1.6 1.6 1.6
NO 61 98.4 98.4 100.0 Total 62 100.0

Chapter Eight: Validating of the IQM-FW
224
Evaluation the strategic steps
1. Evaluation the contents of the strategic planning steps
The results in table (8.18) demonstrated that 64.5% agreed with the contents of
the strategic steps in preceding the planning process while 17.7% of the
participants fell in each strongly agree and moderate of the Likert scale.
Table 8. 18. Evaluation of the contents of the strategic steps for preceding the
planning process in phase one
Frequency Percent Valid Percent Cumulative
Percent
Valid Moderate 11 17.7 17.7 17.7
Agree 40 64.5 64.5 82.3
Strongly agree 11 17.7 17.7 100.0
Total 62 100.0 100.0
2. Evaluation the strategic steps in terms of anything missing which should be
added.
The results in table (8.19) indicated that 98.4% or the respondents agreed
about the completeness of the strategic steps.
Table 8. 19. Evaluation of anything missing in the strategic steps which should
be added to the strategic planning phase
Frequenc
y Percent Valid Percent Cumulative
Percent
Valid Yes 1 1.6 1.6 1.6
No 61 98.4 98.4 100.0
Total 62 100.0 100.0
8.3.2.3.2. Evaluation of the measurement and evaluation phase
1. Evaluation the contents of measurement and evaluation in phase 2
The results in table (8.20) shows that 74.2% of the respondents agreed with the
contents of phase two, 17.7% moderate and 8.1% strongly agree
Table 8. 20. Evaluation the contents of phase two (Measurement and evaluation)
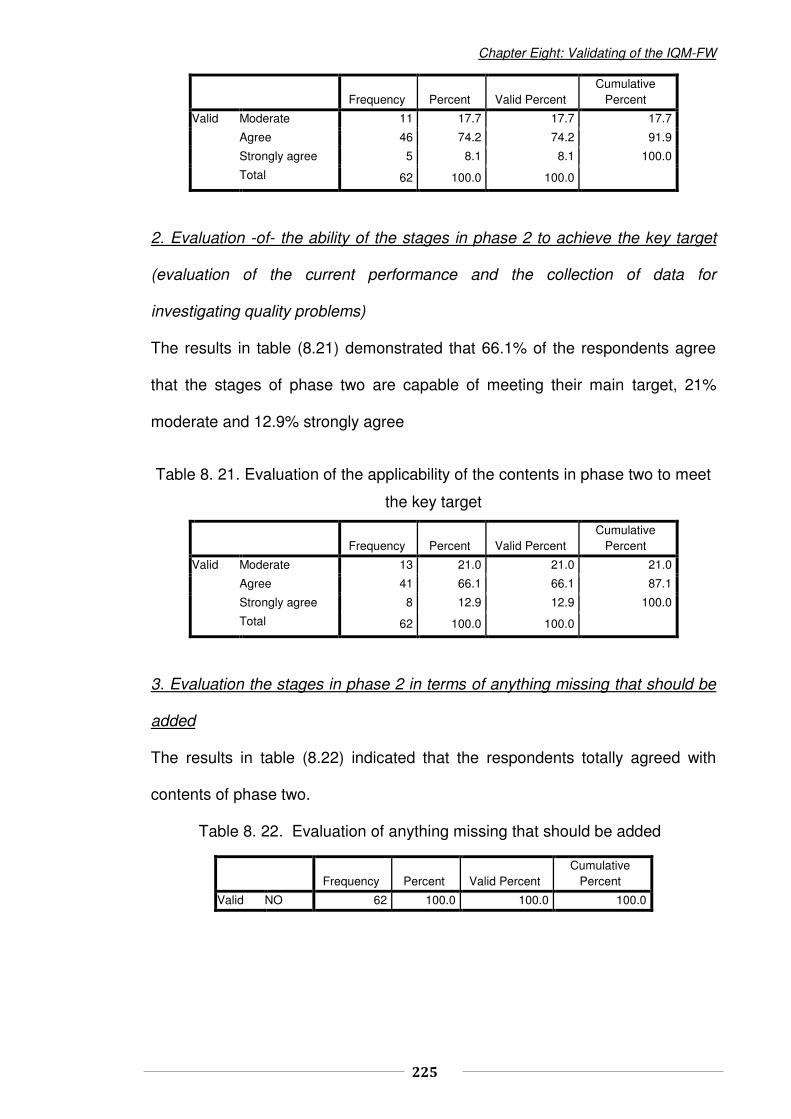
Chapter Eight: Validating of the IQM-FW
225
Frequency Percent Valid Percent Cumulative
Percent
Valid Moderate 11 17.7 17.7 17.7
Agree 46 74.2 74.2 91.9
Strongly agree 5 8.1 8.1 100.0
Total 62 100.0 100.0
2. Evaluation -of- the ability of the stages in phase 2 to achieve the key target
(evaluation of the current performance and the collection of data for
investigating quality problems)
The results in table (8.21) demonstrated that 66.1% of the respondents agree
that the stages of phase two are capable of meeting their main target, 21%
moderate and 12.9% strongly agree
Table 8. 21. Evaluation of the applicability of the contents in phase two to meet
the key target
Frequency Percent Valid Percent Cumulative
Percent
Valid Moderate 13 21.0 21.0 21.0
Agree 41 66.1 66.1 87.1
Strongly agree 8 12.9 12.9 100.0
Total 62 100.0 100.0
3. Evaluation the stages in phase 2 in terms of anything missing that should be
added
The results in table (8.22) indicated that the respondents totally agreed with
contents of phase two.
Table 8. 22. Evaluation of anything missing that should be added
Frequency Percent Valid Percent Cumulative
Percent
Valid NO 62 100.0 100.0 100.0
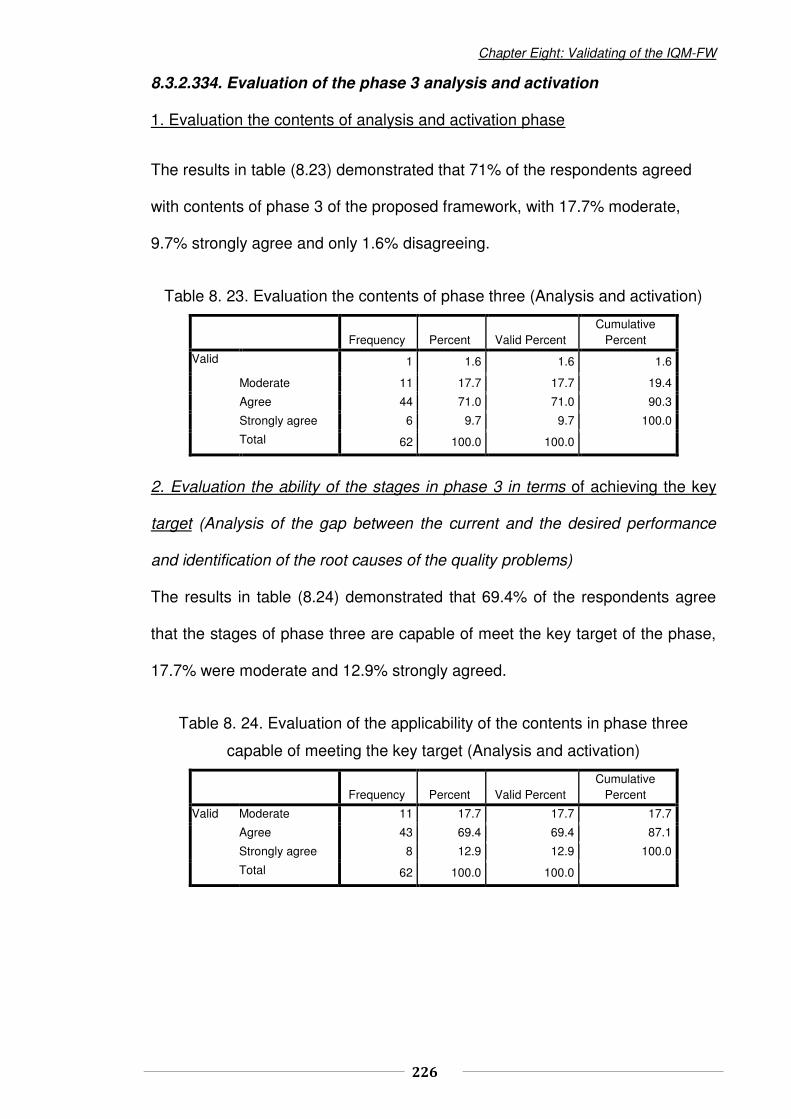
Chapter Eight: Validating of the IQM-FW
226
8.3.2.334. Evaluation of the phase 3 analysis and activation
1. Evaluation the contents of analysis and activation phase
The results in table (8.23) demonstrated that 71% of the respondents agreed
with contents of phase 3 of the proposed framework, with 17.7% moderate,
9.7% strongly agree and only 1.6% disagreeing.
Table 8. 23. Evaluation the contents of phase three (Analysis and activation)
Frequency Percent Valid Percent Cumulative
Percent
Valid 1 1.6 1.6 1.6
Moderate 11 17.7 17.7 19.4
Agree 44 71.0 71.0 90.3
Strongly agree 6 9.7 9.7 100.0
Total 62 100.0 100.0
2. Evaluation the ability of the stages in phase 3 in terms of achieving the key
target (Analysis of the gap between the current and the desired performance
and identification of the root causes of the quality problems)
The results in table (8.24) demonstrated that 69.4% of the respondents agree
that the stages of phase three are capable of meet the key target of the phase,
17.7% were moderate and 12.9% strongly agreed.
Table 8. 24. Evaluation of the applicability of the contents in phase three
capable of meeting the key target (Analysis and activation)
Frequency Percent Valid Percent Cumulative
Percent
Valid Moderate 11 17.7 17.7 17.7
Agree 43 69.4 69.4 87.1
Strongly agree 8 12.9 12.9 100.0
Total 62 100.0 100.0

Chapter Eight: Validating of the IQM-FW
227
3. Evaluation of the stages in phase 3 in terms of anything missing which should
be added
The results in table (2.25) indicated that the respondents agreed with the
contents of this phase.
Table 8. 25. Evaluation of anything missing in the contents of phase four of the
proposed framework
Frequency Percent Valid Percent Cumulative
Percent
Valid NO 62 100.0 100.0 100.0
8.3.2.3.4. Evaluation of phase 4 improvement and monitoring
1. Evaluation the contents of improvement and monitoring phase
The results in table (8.26) demonstrated that 66.1 % of the respondents agreed
that the stages of phase four are capable of meeting the key target of the phase.
21.0% were moderate and 12.9 strongly agreed.
Table 8. 26. Evaluation the contents of phase four of the proposed framework
(Improvement and monitoring)
Frequency Percent Valid Percent Cumulative
Percent
Valid Moderate 13 21.0 21.0 21.0
Agree 41 66.1 66.1 87.1
Strongly agree 8 12.9 12.9 100.0
Total 62 100.0 100.0
2. Evaluation -of- the ability of the stages in phase 4 in terms of achieving the
key target (developing, implementing and monitoring the improvement plan)
The results in table (8.27.) indicated that 62.9% of the respondents agreed that
the stages of phase four are capable of meeting the phase target, 22.6%
moderate and 14.5% strongly agreed.
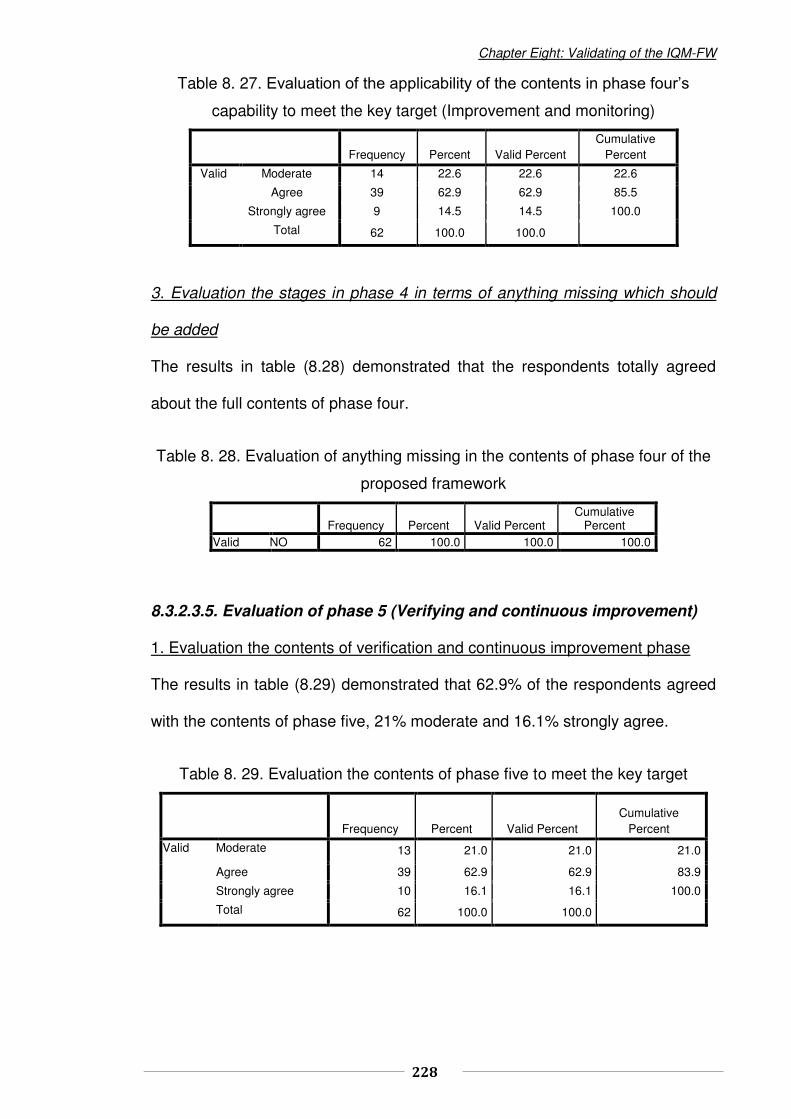
Chapter Eight: Validating of the IQM-FW
228
Table 8. 27. Evaluation of the applicability of the contents in phase four’s
capability to meet the key target (Improvement and monitoring)
Frequency Percent Valid Percent Cumulative
Percent
Valid Moderate 14 22.6 22.6 22.6
Agree 39 62.9 62.9 85.5
Strongly agree 9 14.5 14.5 100.0
Total 62 100.0 100.0
3. Evaluation the stages in phase 4 in terms of anything missing which should
be added
The results in table (8.28) demonstrated that the respondents totally agreed
about the full contents of phase four.
Table 8. 28. Evaluation of anything missing in the contents of phase four of the
proposed framework
8.3.2.3.5. Evaluation of phase 5 (Verifying and continuous improvement)
1. Evaluation the contents of verification and continuous improvement phase
The results in table (8.29) demonstrated that 62.9% of the respondents agreed
with the contents of phase five, 21% moderate and 16.1% strongly agree.
Table 8. 29. Evaluation the contents of phase five to meet the key target
Frequency Percent Valid Percent Cumulative
Percent
Valid Moderate 13 21.0 21.0 21.0
Agree 39 62.9 62.9 83.9
Strongly agree 10 16.1 16.1 100.0
Total 62 100.0 100.0
Frequency Percent Valid Percent Cumulative
Percent Valid NO 62 100.0 100.0 100.0

Chapter Eight: Validating of the IQM-FW
229
2. Evaluation the ability of the stages in phase five to achieve the key target (to
maintain the improvement plan and confirm the organization’s success)
The results in table (8.30) demonstrated that 67.7% of the respondents agreed
that the stages of phase five was capable of meeting the key target, 21%
moderate and 11.3% strongly agree.
Table 8. 30. Evaluation the applicability of the contents in phase five and their
capability to meet the key target (verification and continuous improvement)
Frequency Percent Valid Percent Cumulative
Percent
Valid Moderate 13 21.0 21.0 21.0
Agree 42 67.7 67.7 88.7
Strongly agree 7 11.3 11.3 100.0
Total 62 100.0 100.0
3. Evaluation the stages in phase 5 in terms of any missing elements which
should be added
The results in table (8.31) indicated that the respondents fully agreed that there
are no elements missing from the phase.
Table 8. 31. Evaluation of missing elements in the contents of phase five of the
proposed framework
Frequency Percent Valid Percent Cumulative Percent
Valid No 62 100.0 100.0 100.0
Evaluation the soft implementation factors of the proposed framework.
The soft implementation factors were presented to the respondents via the
questionnaire, the participants were asked about the soft implementation factors
in terms of helping the implementation of the proposed framework based on the
same Likert scale used in the previous sections.

Chapter Eight: Validating of the IQM-FW
230
1. Evaluation - The contents of the soft implementation factors
The results in table (8.32) showed that 64.5% of the respondents agreed with
the contents of the soft implementation factors of the proposed framework,
19.4% strongly agreed and 16.1% were moderate.
Table 8. 32. Evaluation - The soft implementation factors of the proposed
framework
Frequency Percent Valid Percent Cumulative
Percent
Valid Moderate 10 16.1 16.1 16.1
Agree 40 64.5 64.5 80.6
Strongly agree 12 19.4 19.4 100.0
Total 62 100.0 100.0
2. Evaluation of the soft implementation factors in terms of any missing
elements which should be added
The results in table (8.33) showed that the respondents were in complete
agreement that there was nothing missing with regards to the soft
implementation factors.
Table 8. 33. The soft implementation factors in terms of any missing elements
which should be added
Evaluation of the potential motivations within the integrated quality
management approach
The essential elements of Six-Sigma, TQM and Lean are listed as the key
motivation for adopting an integrated quality management approach. The
respondents were asked to indicate the extent to which the following motives
would influence their decision to adopt the proposed framework.
Frequency Percent Valid Percent Cumulative
Percent Valid No 62 100.0 100.0 100.0

Chapter Eight: Validating of the IQM-FW
231
The results in table (E-3), appendix (E) indicated that almost the highest
percentage of the respondents judgment fell in the favor of ‘agree’ and ‘strongly
agree’ on the Likert scale, which means that the majority of the participants
agreed that integrated quality management approach were applicable to
manufacturing organisations.
8.3.3. Evaluation the importance of the CSFs for the successful
implementation of the proposed framework
This part of the survey was aimed at understanding the critical factors
necessary for the successful implementation of the proposed framework in
manufacturing organisations and the potential barriers that can impede the
implementation process.
1. Evaluation -of- The CSFs required for successful implementation of the
proposed framework
Nine CSFs were selected and presented to the participants via questionnaires
(see appendix A, section C), the respondents were asked to indicate the
importance of the CSFs for successful implementation the proposed framework,
the Likert scale used was:
1- Not important at all 2- Slightly important 3-Moderate 4- Important 5- very-
important
The results in table (E-4) in the appendix (E) demonstrated that the highest
percentage of the respondent's judgement fell in the favour of important on the
Likert scale for all of the CSFs. Therefore, it can be concluded that the CSFs
listed in the survey are the most important factors for successful implementation
of proposed framework within manufacturing organisations. However, effective

Chapter Eight: Validating of the IQM-FW
232
communication is rated as the most important factor for the successful
implementation the proposed framework.
2. Evaluation of the impeding factors for the proposed framework.
The respondents were asked to rate the extent to which the 11 barriers factors
impede the implementation of the integrated quality management approach in
manufacturing organisations, the eleven barriers factors were identified by the
review of the literature (Johannes,2013; Antony, 2008; Andersson et al., 2006).
These barriers factors were rated using the Likert scale of 1-5;
1- Corresponds to very low 2- Low, 3- Moderate, 4-High and 5-Very high.
The result in table (E-5) in the appendix (E) showed that almost all of the
barriers factors listed in the questionnaire were considered high. Where the
majority of the respondents indicated that the greatest percentage of the
judgement fell in the favour of high importance on the Likert scale with rate of
more than 48%. However, ‘lack of leadership’ and ‘unmanaged expectation’ has
been rated as the most impeding factors of the proposed framework with rate
more than 90% respectively.
8.3.4. Validation of the CSFs for successful implementation the proposed
framework
Factor analysis was undertaken to validate the CSFs of the proposed
framework, the purpose was to identify the latent factors behind the CSFs and
to measure the validity of the instruments used in the questionnaire (Pallant,
20010). The exploratory factor analysis method was also selected to perform
the test and to check the construct validity of CSFs of the proposed framework.
The test was carried out using SPSS.

Chapter Eight: Validating of the IQM-FW
233
8.3.4.1. Results of factor analysis
Factorability test
To check the suitability of the data for conducting factor analysis, a factorability
test was performed to check the appropriateness of data for factor analysis.
Table 8. 34. KMO and Bartlett's Test
The results in table (8.34) demonstrated that KMO is 0.83 which is greater than
0.6 and that the Sphericity test is significant. Therefore, all the requirements are
met and the data is valid to perform the factor analysis test.
Factor extraction: Principle component analysis (PCA) with the Eigen value
technique has been selected to extract the latent factors and to identify the
dimensionality scales.
Table 8. 35. Total Variance Explained
Kaiser-Meyer-Olkin Measure of Sampling Adequacy. .838
Bartlett's Test of Sphericity Approx. Chi-Square 283.545
df 36
Sig. .000
Component
Initial Eigenvalues Extraction Sums of Squared Loadings
Rotation Sums of
Squared Loadingsa
Total % of Variance Cumulative % Total % of Variance Cumulative % Total
1 4.765 52.949 52.949 4.765 52.949 52.949 4.075
2 1.206 13.402 66.351 1.206 13.402 66.351 3.674
3 .839 9.321 75.672
4 .631 7.014 82.687
5 .483 5.366 88.052
6 .331 3.682 91.734
7 .303 3.362 95.097
8 .254 2.822 97.919
9 .187 2.081 100.000
Extraction Method: Principal Component Analysis.

Chapter Eight: Validating of the IQM-FW
234
The results obtained from the first trial was satisfactory, thus, the results in table
(8.35) demonstrated that PCA extracted 2 latent factors with Eigen value
greater than 1.00 which is sufficient to meet the requirements (Williams et al.,
2012). Latent factor one accounts for 52.9% of the total variation and latent
factor two accounts for 13.4 of the total variation.
Factor rotation: The direct Oblimin method was used to obtain factor loading
and to understand the cluster of each latent factor. Williams et al. (2012) stated
that factor loading Direct Oblimin provides pattern loading with factors that are
more correlated and that are easy to interpret.
Table 8. 36. Pattern Matrix
Latent factors
1 2
Cronbach alpha test 0.88 0.80
Focus on customer .932
Training and education .869
Organisation infrastructure. .735
Linking to supplier .658
Top management and leadership support. .636
Middle management involvement .856
Quality commitment .785
Review and tracking performance .748
Effective communication .675
Extraction Method: Principal Component Analysis.
Rotation Method: Oblimin with Kaiser Normalization.
Table (8.36) demonstrated that the results of factor loading attained with the
pattern matrix appeared to be reasonable. Out of 9 items, 5 items were loaded
on Latent factor one and 4 items were loaded on Latent factor two, as can be
seen all items loaded are unidimensional and loaded onto one factor with a
value of more than 0.5 (Costello and Osborne, 2011), (Pallant, 2007), and (Hair
et al., 2006). Latent factor one was obtained with high loading for five items
ranged from 0.93 to 0.63 and Latent factor two obtained with high loading for
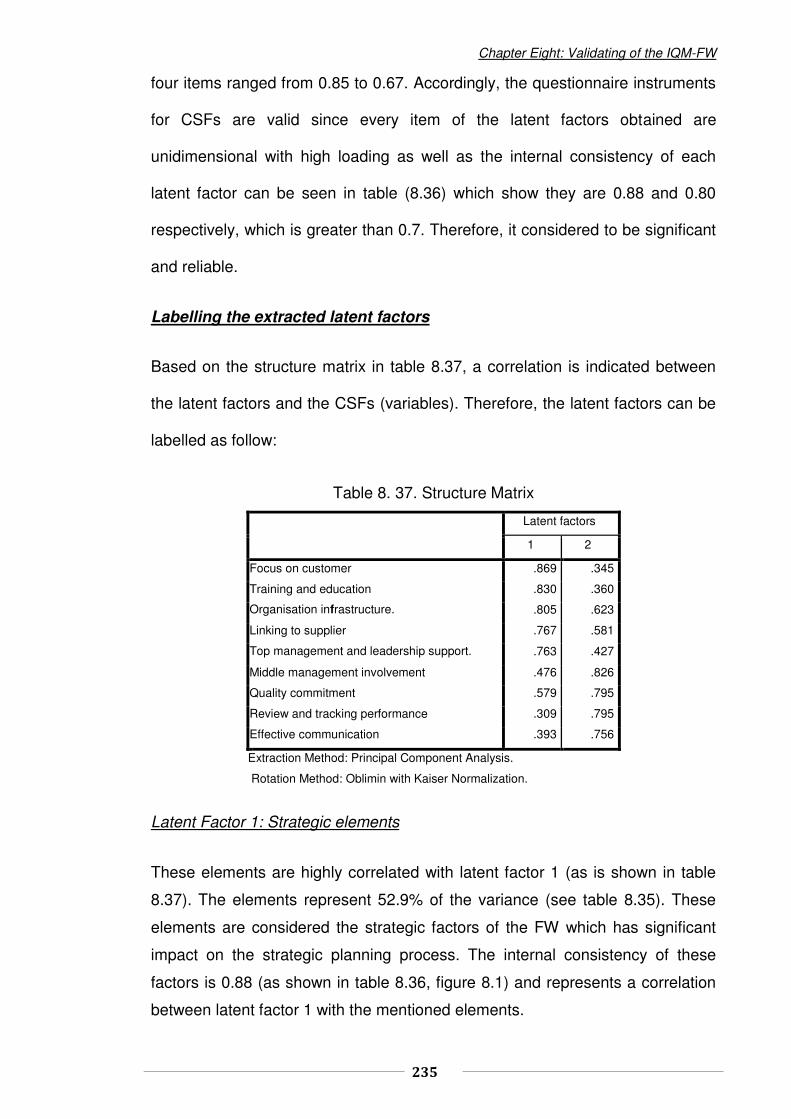
Chapter Eight: Validating of the IQM-FW
235
four items ranged from 0.85 to 0.67. Accordingly, the questionnaire instruments
for CSFs are valid since every item of the latent factors obtained are
unidimensional with high loading as well as the internal consistency of each
latent factor can be seen in table (8.36) which show they are 0.88 and 0.80
respectively, which is greater than 0.7. Therefore, it considered to be significant
and reliable.
Labelling the extracted latent factors
Based on the structure matrix in table 8.37, a correlation is indicated between
the latent factors and the CSFs (variables). Therefore, the latent factors can be
labelled as follow:
Table 8. 37. Structure Matrix
Latent factors
1 2
Focus on customer .869 .345
Training and education .830 .360
Organisation infrastructure. .805 .623
Linking to supplier .767 .581
Top management and leadership support. .763 .427
Middle management involvement .476 .826
Quality commitment .579 .795
Review and tracking performance .309 .795
Effective communication .393 .756
Extraction Method: Principal Component Analysis.
Rotation Method: Oblimin with Kaiser Normalization.
Latent Factor 1: Strategic elements
These elements are highly correlated with latent factor 1 (as is shown in table
8.37). The elements represent 52.9% of the variance (see table 8.35). These
elements are considered the strategic factors of the FW which has significant
impact on the strategic planning process. The internal consistency of these
factors is 0.88 (as shown in table 8.36, figure 8.1) and represents a correlation
between latent factor 1 with the mentioned elements.

Chapter Eight: Validating of the IQM-FW
236
Focus on Customer
Training and education
Top management and leadership support
Organisation stucture
Linking to supplier
Factor 1
Strategic elements
Figure 8. 1. Latent Factor 1; strategic elements
Latent Factor 1: Operational elements
These elements are highly correlated with latent factor 2 (as shown in table
8.38), the elements represent 13.4% of the variance (see table 8.35). These
elements are considered the operational factors of the FW which has significant
impact on the implementation process. The internal consistency of this factor is
0.88 (as shown in table 8.36), figure 8.2 represents the correlation between
latent factor 2 with the previously mentioned element.
Middle management involvement
Quality commitment
Review and tracking performance
Effective communication
Factor 2
Operation elements
Figure 8. 2. Latent Factor 2; Operational elements
8.4. Discussion
The research study investigated two main issues; one is evaluating and
validating the proposed framework and its implementation procedures, the
second is evaluation and validating the critical success factors for the
successful implementation of the framework in manufacturing organisations.
The validation process is undertaken using the quantitative approach

Chapter Eight: Validating of the IQM-FW
237
represented by the questionnaire survey. It was carried out after the
development of the framework; the questionnaire survey involved 62 employees
in the industrial sector and academics. It sought to obtain the opinions and
ideas of experts in terms of the suitability of the FW for manufacturing
organisations. The framework was assessed in terms of; the appropriateness
and applicability, the usability and effectiveness, the importance of CSFs for the
successful implementation of the FW and the barriers impeding the
implementation process.
Figure 8. 3. Respondents judgment about the evaluation of the framework
The results confirmed that the proposed framework developed is applicable for
manufacturing organisations and can assist in achieving competitive
advantages if adopted or applied correctly, figure 8.3 provided evidence from
the research outcomes in which it is clearly demonstrated that a very high
percentage of respondents agreement with contents, Suitability, competitive
advantages, effectiveness and completeness of the framework. Finally, the
results demonstrated that the CSFs are very important for implementing the
framework. Therefore, considerable attention should be paid if the framework is
implemented.
0
10
20
30
40
50
Suitability/Capabilityfor manufacturing
organisations
Ability of the FW toboots competivness
The ability of the FWto deal with quality
problems
Capability of theimplementation in
practce
Strongly disagree Disagree Moderate Agree Strongly agree
Res
pond
ents
judj
men
t in
%

Chapter Eight: Validating of the IQM-FW
238
8.5. Conclusion
The chapter focused on validation of the framework and its implementation
procedures. The chapter also discussed how the questionnaire survey was
designed and how it was conducted, it showed that the questionnaire contains
three sections; one provided respondents background, the second for
evaluation of the framework and its implementation procedures. The final
section covered the evaluation of the CSFs and the impeding factors
concerning implementation of the FW. The results of the data analysis were
presented and the procedures for validating the FW and CSFs provided using
statistics analysis. The study concluded that the proposed framework developed
is applicable for manufacturing organisations and can assist in achieving
competitive advantages if adopted or applied correctly and also provides
guidance towards a successful implementation, the proposed framework in this
thesis can be considered a major contribution to both academia and to the
industrial sector.

239
Chapter 9
Conclusions, recommendations, contributions to knowledge,
research limitations and future work
9.1. Introduction .................................................................................................................................. 240
9.2. Conclusions .................................................................................................................................. 240
9.2.1 Literature review ......................................................................................................................... 240
9.2.2. The proposed integrated LSS model ........................................................................................ 241
9.2.3 The proposed integrated SS-TQM model .................................................................................. 242
9.2.4. Analytical hierarchy process model .......................................................................................... 244
9.2.5 The proposed integrated framework .......................................................................................... 245
9.3. Contributions to knowledge .......................................................................................................... 247
9.4. Research limitation ....................................................................................................................... 248
9.5. Recommendations for further research ....................................................................................... 248
Chapter Nine: conclusion, recommendation, contribution to knowledge, research limitation and future work
240
9.1. Introduction
This chapter provides the key conclusion drawn from the research; it includes a
discussion of the research findings and implications, it also presents the
contribution to knowledge in the field of quality management within
manufacturing organisations. The chapter concludes with the research limitation,
recommendations and suggestions for future work.
9.2. Conclusions
The aim of this research was to develop a quality management framework for
manufacturing organisation through the integration of the effectiveness of the
quality management initiative. The purpose for conducting the research is that
manufacturing organisations are presently required to operate at low cost with
great speed and reliability in order to achieve a competitive advantage. To
achieve this target and to create the framework, the study involved four main
tasks to address the research objectives, the finding and the implications of the
research tasks are summarised below.
9.2.1 Literature review
A comprehensive literature review has been carried out to establish the required
knowledge for addressing the research objectives in chapter 2. The key
methods reviewed comprehensively in chapter 2 are Six-Sigma, Lean
manufacturing and TQM. Additionally, a review of the integrated approach in
quality management was carried out to identify what methods are typically being
integrated and how they are integrated. The purpose of this chapter was to
address two main objectives; one, to identify the key drivers that are required
for integrating Six-Sigma and Lean to develop the LSS Model, the other one is

Chapter Nine: conclusion, recommendation, contribution to knowledge, research limitation and future work
241
to identify the key drivers that are required to integrate Six-Sigma and TQM in
order to develop the SS-TQM model. The key findings of the literature review
showed that there was some consensuses among the majority of the quality
authors that the quality methods selected are the most effective quality
management methods implemented in practice and led organisations to achieve
high quality results. Additionally, due to the similarity between these methods
many authors agreed that the synergy does exist and that the potential
integration between these approaches can lead to high quality performance.
The review of the integrated approach in quality management highlighted the
importance of that approach and showed the way of integrating those methods.
In addition, it has been demonstrated that Six-Sigma DMAIC is the most
effective improvement strategy and can be used as a key driver for integrating
the selected methods. The review of the literature outlines that the key project
motivation for integrating Six-Sigma and Lean for improving the operational
performance and Six-Sigma with TQM for unifying the management system and
achieving performance excellence. Finally, the CSFs for successful
implementation of LSS as an integrated model and SS-TQM as integration
fashion were identified to ensure the success of the implementation process.
Therefore, this part of the study covered and addressed the first two objectives
of the research which are objectives number 1 and 2.
9.2.2. The proposed integrated LSS model
The development of the proposed LSS model was based on the findings of the
literature review, many LSS models were developed and implemented in
practice for different purpose, these models make it easier for the author to
select the appropriate components of the proposed model, the key drivers for
Chapter Nine: conclusion, recommendation, contribution to knowledge, research limitation and future work
242
developing the model include the DMAIC improvement strategy for facilitating
the implementation process and identifying opportunities for quality
improvement. DMAIC is integrated with set of LSS tools and techniques which
is organised sequentially to smooth the implementation process and to achieve
an improved performance. The elements of the model are involved in two main
components; strategic elements and implementation elements. These are
structured in five steps based on DMAIC. The author believes that the model
can shape the management strategies and vision to which the managers have
to be committed and also guide employees to achieve improved processes,
reduce variations, reduce waste and meet or exceed customers’ expectations
(more details presented in chapter 4).
The model was developed and designed, then attached to the questionnaire
survey which was designed for the purpose of developing and validating the
proposed model. 70 questionnaires were sent to quality professionals, and the
senior management of the available manufacturing and academic organisations,
56 questionnaires were returned within the time frame. The key findings of the
survey demonstrated that the model is applicable for manufacturing
organisations if embedded in long-term strategic thinking. It is also revealed that
LSS implementation is still in the early stage; however, most manufacturing
organisations involved in the survey have the required culture for adopting LSS
and almost all are aware of the common LSS tools and techniques. The task in
this stage adequately addressed the third objective of the research, related to
the development and validation of the proposed LSS model.
9.2.3 The proposed integrated SS-TQM model
Chapter 5 covered the development and validating of the SS-TQM integrated
model, the model was also developed based on the findings of the literature
Chapter Nine: conclusion, recommendation, contribution to knowledge, research limitation and future work
243
review in which the main components of Six-Sigma and TQM implementation
and the project motivation of Six-Sigma and TQM assisted in shaping the
strategic and the implementation elements of the proposed model. Additional,
the key finding of the literature review, with respect to business excellence in
quality management, led to developing a strategic plan to employ the proposed
model. Furthermore, The CSFs for successful implementation of the model
facilitated the implementation process and empowered the key components of
the model in terms of orientation to the culture and the streamlining of the
operating process. The aim of the model was to unify the management system
by utilising the core value of TQM and the improvement strategy of Six-Sigma in
order to realise the orientation toward innovation and to achieve performance
excellence for manufacturing organisations.
The model was developed, designed and reviewed, then, was attached to
questionnaire survey for validation and for final development. As with the
previous model, 70 questionnaire surveys sent to available quality professionals,
practitioners and academics in different manufacturing and academic
organisations with 58 questionnaires returned with in time frame. The findings of
the questionnaire concluded that the model is valuable for manufacturing
organisations and can enable manufacturing organisations to achieve business
excellence if the management tools are unified and operational techniques are
implemented effectively. This stage of the research is involved with addressed
objective number 4 of the research and with developing and validating the
SS_TQM mode.

Chapter Nine: conclusion, recommendation, contribution to knowledge, research limitation and future work
244
9.2.4. Analytical hierarchy process model
The strategic drivers for developing the integrated framework were identified.
Based on the integration of the LSS model with the SS-TQM model, the
integration process was conducted based on the integrated approach of quality
management, in which DMAIC improvement strategy was adopted as the
procedure model for integrating the models. The similarities and the significant
commonalities among the quality approaches of the mentioned models enabled
the models to complete the integration process. In addition, the strategic drivers
were evaluated and prioritised using Multi-criteria decision-making technique,
the modelling of the problem using Multi-criteria decision-making was, then,
applied through (AHP). It was designed and structured with the criteria and sub-
criteria to evaluate and prioritise the strategic drivers of the proposed framework.
The proposed AHP model was created including the main criteria and
comprises of the five strategic drivers selected; the sub-criteria comprise the
nine CSFs identified for the successful implementation of the framework (more
details presented in chapter 6). The questionnaire survey was designed based
on the purpose of the AHP method and sent to the available quality
professionals, industry professionals and academics in different manufacturing
and academic organisations with 53 questionnaires completed and returned
within the time frame. The key findings of the AHP method demonstrated that
strategic drivers are more important than the implementation drivers. The critical
quality factors in the sub-criteria were ranked and found that Leadership support
and organisational structure are the most important factors for implementing the
strategic drivers and success in the framework. Additionally, sensitivity analysis

Chapter Nine: conclusion, recommendation, contribution to knowledge, research limitation and future work
245
confirmed that the changing of the priority does not considerably affect the
results obtained.
Since the AHP model, considered the strategic element, affected the quality
management performance, these findings are also significant for decision
makers who are interested in improving the quality performance and determine
the critical quality factors with respect to integrated quality management. The
task in this part sufficiently achieved objective number 5 of the research (to
identify the key drivers that can lead to the development of the framework).
9.2.5 The proposed integrated framework
Chapter 7 covered the development of the proposed IQM framework, the aim of
the framework is to provide a guide and impetus for manufacturing
organisations with respect to improving the operation’s performance and
facilitating the quality system in order to achieve excellence performance and
competitive advantages. The development of the framework was the result of
integrating the LSS model and the SS-TQM model and based on the findings of
the literature review. The integration of those models provided four key
impetuses to create the framework; Unifying the management system,
cultivating the quality culture, realisation the innovative environment and,
finally, smoothing and facilitating the operation process. These motivations
are considered the crucial drivers of the framework to enable manufacturing
organisations to attain excellence in their performance.
The main components of the framework include; 1) the main body, represented
by the flowchart diagram. The flowchart shows all the integrating functions and
the work activities involved in the framework. 2) The main elements of the
framework, including the sets of different tools and techniques are organised
sequentially and based on the DMAIC improvement strategy to guide the

Chapter Nine: conclusion, recommendation, contribution to knowledge, research limitation and future work
246
framework for identifying opportunities for improvement. 3) The operational
mechanism of the framework comprises a number of interrelated steps, stages
and process which are integrated and involved in the phases of the framework.
These steps formulated the operation system and facilitate the implementation
process of the framework. The implementation procedures of the framework
were adopted based on DMIAC improvement strategy including the five phases
presented in chapter 7. These procedures are considered the key drivers for the
organisation and implementation of the framework.
Chapter 8 covered validation and verifying the framework and its
implementation procedures. A questionnaire survey was designed for the
purpose of validation and verifying the framework. The questionnaire
investigated the validity of the framework it was based on; the suitability for
manufacturing organisation and evaluation the accuracy level in its contents in
terms of helping industry to gain competitive advantage in the long run.
Additionally, there was an evaluation and the possible implementation
difficulties of the proposed framework. The findings that were derived from the
data collected belonged to the 63 responses out of the 70 sent. The findings
demonstrated that the framework is valuable if adopted and implemented
correctly.
In general, the feedback obtained from the survey confirmed the applicability of
the framework to the improvement of the quality system within manufacturing
organisations. It also concludes that the framework would be very useful, in
practice, due to the functionality of evaluating the operational performance and
the ability to achieve an excellence performance. It is the authors belief that the

Chapter Nine: conclusion, recommendation, contribution to knowledge, research limitation and future work
247
framework can provide the manufacturing mangers impetus for management
strategies and vision in which to reform and modernise the quality system within
manufacturing organisations, it also can guide the employees attempting to
understand the process orientation and to achieve improved processes.
Therefore, the study can be considered framework to be a key contribution to
both academia and industrialist. In summary, the study in this part addressed
and completely achieved the last three objectives of the research which are
objectives number 5, 7 and 8.
9.3. Contributions to knowledge
The main contributions of this research study centers around four substantive
areas, each provided a foundation for guides and the enhancement of the
quality management system in practice within manufacturing industry. The key
contribution to the knowledge in this research can be summarized in the
following developments:
An integrated quality management framework; to establish a unique quality
management strategy and to simplify the implementation process in
practice with aim of achieving excellence in performance and competitive
advantage within the manufacturing organization.
The Lean Six-Sigma integrated model; provided effective strategic planning
and crucial operation features to smooth the manufacturing process and
attain sustainable improvement.
The Six-Sigma TQM integrated model; focusing on unifying the
management system by integrating the strategic quality values with the key
improvement drivers for orientation towards innovation and business
excellence within manufacturing organizations.

Chapter Nine: conclusion, recommendation, contribution to knowledge, research limitation and future work
248
Analytical hierarchy process model; provided a unique means for
selecting and evaluating the strategic drivers with respect to integrating
quality management performance.
9.4. Research limitation
The main limitations of the research are as follows:
Due to the lack of related resources and references, the data collected used
for validating the models and the framework came from a small number of
manufacturing organisations. However, the samples of the data collected
were relatively high and involved a trustable target population provided
reliable data for validating the research.
Due to the limitations of time and a lack of the available references, the
research study did not manage to collect qualitative data from the required
practitioners and experts. This was needed to support the research findings
and to examine the impact of the proposed framework on the quality
management system within manufacturing organisations.
9.5. Recommendations for further research
The study undertaken the integrated approach in quality management to
improve the quality system of manufacturing organisations in practice. Although
there were many new features and strategies developed in the framework and
the models, there are several recommendations worthwhile which can be
suggested for further research within the scope of this thesis:
Further improvements can be made to the functions and stages of the
framework particularly in terms of controlling and sustaining the potential
improvements achieved.

Chapter Nine: conclusion, recommendation, contribution to knowledge, research limitation and future work
249
It is important to apply a simulation program alongside a pilot study on
the improvement plan to identify the impact of the improvement plan on
the quality system.
Further qualitative investigation is required on the framework involving
several manufacturing organisations and an adequate sample size to
check the impact of the framework on the quality management system
within manufacturing organisations. This could enhance and improve the
contents and structure of the framework.
Further study can be conducted by applying the framework and the
integrated models in practice in order to test the effectiveness of its
performance within manufacturing organisations.

250
References
Aalbregtse, R. J., Hejka, J. A., & McNeley, P. K. (1991). TQM: How do you
do it. Automation, August, 32, 30-32.
Aera, A. P. A. (1999). NCME (American Educational Research Association,
American Psychological Association, & National Council on Measurement in
Education).(1999). Standards for educational and psychological testing.
Afifi, A. A., & Azen, S. P. (2014). Statistical analysis: A computer oriented
approach Academic press.
Ahuja, I. P. S., & Khamba, J. S. (2008). Total productive maintenance:
Literature review and directions. International Journal of Quality & Reliability
Management, 25(7), 709-756.
Alzohbi. M. Gasim (2015). A Framework for Evaluating Materials
Management Performance in Jordanian Concrete Building, PhD Thesis.
Sheffield Hallam University.
Andersson, R., Eriksson, H., & Torstensson, H. (2006). Similarities and
differences between TQM, six sigma and lean. The TQM Magazine, 18(3),
282-296.
Anton, H., & Rorres, C. (2011). Elementary linear algebra: With
supplemental applications Wiley.
Antony, J. (2011). Six Sigma vs Lean: Some Perspectives from Leading
Academics and Practitioners. International Journal of Productivity and
Performance Management, 60 (2), 185-190.
Antony, J. (2009). Six sigma vs TQM: Some perspectives from leading
practitioners and academics. International Journal of Productivity and
Performance Management, 58(3), 274-279.

251
Antony, J., & Banuelas, R. (2002). Key ingredients for the effective
implementation of six sigma program. Measuring Business Excellence, 6(4),
20-27.
Arbnor, I., & Bjerke, B. (2008). Methodology for creating business
knowledge Sage Publications Ltd.
Arnheiter, E. D., & Maleyeff, J. (2005). The integration of lean management
and six sigma. The TQM Magazine, 17(1), 5-18.
Bayazit, O. (2005). Use of AHP in decision-making for flexible manufacturing
systems. Journal of Manufacturing Technology Management, 16(7), 808-819.
Bendell, T. (2006). A review and comparison of six sigma and the lean
organisations. The TQM Magazine, 18(3), 255-262.
Bhuiyan, N. and Baghel, A. (2005). An Overview of Continuous
Improvement: From the Past to the Present. Management Decision, 43 (5),
761-771.
Binti kasim, N. (2008). Improving Materials Management on Construction
Projects. PhD Thesis, Loughborough University, Loughborough.
Black, K. (2011). Business statistics: For contemporary decision making
John Wiley & Sons.
Black, S. A., & Porter, L. J. (1996). Identification of the critical factors of
TQM. Decision Sciences, 27(1), 1-21.
Blumberg, B., Cooper, D. R. and Schindler, P. S. (2005) Business Research
Methods. McGraw Hill Education, Berkshire.
Boaden, Ruth J. (1997). What is total quality management…and does it
matter? Total quality management, 8 (4), 153-171.
252
Bon, A. T., & Mustafa, E. M. (2013). Impact of total quality management on
innovation in service organizations: Literature review and new conceptual
framework. Procedia Engineering, 53, 516-529.
Brett, C. and Queen, P. (2005). Streamlining enterprise records
managements with Lean Six Sigma. Information Management Journal, 39,
58-62.
Brinkkemper, S. (1996). Method engineering: Engineering of information
systems development methods and tools. Information and Software
Technology, 38(4), 275-280.
Bryman, A. and Bell. E. (2003). Business Research Methods. 2nd ed.,
Oxford, Oxford University Press.
Bryman, A., & Cramer, D. (2005). Quantitative data analysis with SPSS 12
and 13: A guide for social scientists. Psychology Press.
Chen, J., C., LI, Y. and Shady, B., D, (2010). From Value Stream Mapping
Toward a Lean/Sigma Continuous Improvement Process: An Industrial Case
Study. International Journal of Production Research, 48 (4), 1069–1086.
Clegg, B., Pepper, M., & Spedding, T. (2010). The evolution of lean six
sigma. International Journal of Quality & Reliability Management, 27(2), 138-
155.
COED (2004), Concise Oxford English Dictionary. Oxford University Press,
Oxford, UK.
Collis, Jill and Hussey, Roger (2013). Business research: A practical guide
for undergraduate and postgraduate students. Palgrave macmillan.
Coronado, R. B., & Antony, J. (2002). Critical success factors for the
successful implementation of six sigma projects in organisations. The TQM
Magazine, 14(2), 92-99.

253
Costello, A., & Osborne, J. (2011). Best practices in exploratory factor
analysis: Four recommendations for getting the most from your analysis.
pract assess res eval 2005; 10. URL Http://pareonline.net/getvn.Asp, 10(7)
Creswell, J. W. (2013). Research design: Qualitative, Quantitative and
Mixed Methods Approaches. 4th ed., London, Sage Publications
Cronemyr, P. (2007). Six Sigma Management. Action research with some
contributions to theories and methods (Doctoral dissertation, Chalmers).
Crosby, P. B. (1992). Completeness: Quality for the 21st century Penguin.
Crosby, P. B. (1996). Quality is still free: Making quality certain in uncertain
times McGraw-Hill.
Dahlgaard, J. J., & Dahlgaard-Park, S. M. (2006). Lean production, six
sigma quality, TQM and company culture. The TQM Magazine, 18(3), 263-
281.
Datta, P., P. and ROY, R. (2011). Operations Strategy for the Effective
Delivery of Integrated Industrial Product-service Offerings: Two Exploratory
Defence Industry Case Studies. International Journal of Operations and
Production Management, 31 (5), 579-603.
De Mast, J. (2004). A methodological comparison of three strategies for
quality improvement. International Journal of Quality & Reliability
Management, 21(2), 198-213.
Deming, W. E. (1994). The new economics for industry, government,
education, Cambridge M, IT.
Deming, W. E. (. E. (2000). Out of the crisis MIT Press.
Demirbag, M., Tatoglu, E., Tekinkus, M., & Zaim, S. (2006). An analysis of
the Relationship between TQM implementation and organizational

254
performance: Evidence from Turkish SMEs. Journal of manufacturing
technology management, 17(6), 829-847.
De Smith, M. (2015). STATSREF: Statistical analysis handbook-a web-
based statistics.
Drohomeretski, E., et al. (2013). Lean, Six Sigma and Lean Six Sigma: an
analysis based on operations strategy. International Journal of Production
Research, 52 (3), 804 - 824.
Ehie, I., & Sheu, C. (2005). Integrating six sigma and theory of constraints
for continuous improvement: A case study. Journal of Manufacturing
Technology Management, 16(5), 542-553.
Henderson, K. M., & Evans, J. R. (2000). Successful implementation of Six
Sigma: benchmarking general electric company. Benchmarking: An
International Journal, 7(4), 260-282.
Expert Choice (2002). Advanced Decision Support Software for the
Millenium, Expert Choice, Inc, Pitsburgh PA.
Farrell, P. (2011). Writing a built environment dissertation: practical guidance
and examples. John Wiley & Sons.
Feld, W. M. (2002). Lean manufacturing: Tools, techniques, and how to use
them CRC Press.
Field, A. (2009). Discovering statistics using SPSS Sage publications.
Flick, U. (2009). An introduction to qualitative research Sage.
Flowers, P. (2009). Research Philosophies Importance and Relevance.
MSC Research Leading Learning and Change, Cranfield School of
Management, 1-5.
255
Flynn, B. B., & Saladin, B. (2006). Relevance of baldrige constructs in an
international context: A study of national culture. Journal of Operations
Management, 24(5), 583-603.
Furlan, A., Vinelli, A., & Dal Pont, G. (2011). Complementarity and lean
manufacturing bundles: An empirical analysis. International Journal of
Operations & Production Management, 31(8), 835-850.
Gijo, E., & Rao, T. S. (2005). Six sigma implementation–hurdles and more
hurdles. Total Quality Management & Business Excellence, 16(6), 721-725.
Goldstein, M.D. (2001). ‘Six Sigma programme success factors’, Six Sigma
Forum Magazine, Vol. 1, pp.36–45.
Greenfield, T. (1996). Research methods: guidance for postgraduates.
Research methods: guidance for postgraduates. London; Toronto: Arnold;
Wiley, 1996. Q 180.55 M4 R47 1996. DA.
Habibah Abdul Talib, H., Anuar Mohd Ali, K., & Idris, F. (2014). Critical
success factors of quality management practices among SMEs in the food
processing industry in Malaysia. Journal of Small Business and Enterprise
Development, 21(1), 152-176.
Hair, J.J.F., Black, W.C., Babin, B.J., Anderson, R.E. and Tatham, R.L.
(2006), Multivariate Data Analysis, 6th ed., Pearson Prentice Hall,
Englewood Cliffs, NJ.
Hammer, M. (2002). Process management and the future of six sigma. MIT
Sloan Management Review, 43(2), 26.
Hansson, J., & Klefsjö, B. (2003). A core value model for implementing total
quality management in small organisations. The TQM Magazine, 15(2), 71-
81.

256
Harmon, P. (2010). Business process change: A guide for business
managers and BPM and six sigma professionals Morgan Kaufmann.
Harry, M. J. (1998). Six sigma: A breakthrough strategy for profitability.
Quality Progress, 31(5), 60.
Hellsten, U., & Klefsjö, B. (2000). TQM as a management system consisting
of values, techniques and tools. The TQM Magazine, 12(4), 238-244.
Henderson, K. M., & Evans, J. R. (2000). Successful implementation of six
sigma: Benchmarking general electric company. Benchmarking: An
International Journal, 7(4), 260-282.
Ho, D. C., Cheng, E. W., & Fong, P. S. (2000). Integration of value analysis
and total quality management: the way ahead in the next millennium. Total
Quality Management, 11(2), 179-186.
Jafari, S. M., & Setak, M. (2010). Total quality management tools and
techniques: The quest for an implementation roadmap. Proceedings of the
AGBA 7th World Congress, 1-12.
Johannsen, F. (2011, October). State of the art concerning the integration of
methods and techniques in quality management-literature review and an
agenda for research. In ECIS (p. 41).
Johannsen, F. (2013). A holistic approach for integrating methods in quality
management. In Wirtschaftsinformatik (p. 63).
Juran, J. M. , & De Feo, J. A. (1995). Juran's quality handbook: The
complete guide to performance excellence McGraw Hill.
Juran, J. M., & Gryna, F. M. (1988). Juran's quality control handbook
McGraw-Hill.
Juran, J. M., & Godfrey, A. B. (1999). Juran's quality handbook McGraw Hill.

257
Kainulainen, T., Leskinen, P., Korhonen, P., Haara, A., & Hujala, T. (2009).
A statistical approach to assessing interval scale preferences in discrete
choice problems. Journal of the Operational Research Society, 60(2), 252-
258.
Kagioglou, M., Cooper, R., Aouad, G., & Sexton, M. (2000). Rethinking
construction: the generic design and construction process protocol.
Engineering, Construction and Architectural Management, 7(2), 141-153.
Kaiser, H. F. (1981). A revised measure of sampling adequacy for factor-
analytic data matrices. Educational and Psychological Measurement,
Keller, P. (2011). Six sigma demystified, 2nd Edition, McGraw-Hill.
Klefsjö, B., Bergquist, B., & Garvare, R. (2008). Quality management and
business excellence, customers and stakeholders: Do we agree on what we
are talking about, and does it matter? The TQM Journal, 20(2), 120-129.
Klefsjö, B., Wiklund, H., & Edgeman, R. L. (2001). Six sigma seen as a
methodology for total quality management. Measuring Business Excellence,
5(1), 31-35.
Kumar, M., & Antony, J. (2008). Comparing the quality management
practices in UK SMEs. Industrial Management & Data Systems, 108(9),
1153-1166.
Kumar, S., & Sosnoski, M. (2009). Using DMAIC Six Sigma to systematically
improve shopfloor production quality and costs. International Journal of
Productivity and Performance Management, 58(3), 254-273.
Lean Six-Sigma Green Belt Course (2015), The Knowledge-academy,
Workbook Version 8.6 (Jan 2015), Sheffield, UK
258
Lewis, J., & Ritchie, J. (2003). Generalising from qualitative research.
Qualitative Research Practice: A Guide for Social Science Students and
Researchers, 263-286.
Lewis, R. G., & Smith, D. H. (1994). Total Quality in Higher Education. Total
Quality Series. St. Lucie Press, 100 E. Linton Blvd., Suite 403B, Delray
Beach, FL 33483.
Love, P. E., Holt, G. D., & Li, H. (2002). Triangulation in construction
management research. Engineering Construction and Architectural
Management, 9(4), 294-303.
Mallak, L. A., Bringelson, L. S., & Lyth, D. M. (1997). A cultural study of ISO
9000 certification. International journal of quality & reliability management,
14(4), 328-348.
Manville, G., Greatbanks, R., Krishnasamy, R., & Parker, D. W. (2012).
Critical success factors for Lean Six Sigma programmes: a view from middle
management. International Journal of Quality & Reliability Management,
29(1), 7-20.
Markarian, J. (2004). What is six sigma? Reinforced Plastics, 48(7), 46-49.
McNeill, P., & Chapman, S. (2005). Research methods Psychology Press.
McQuater, R., Scurr, C., Dale, B., & Hillman, P. (1995). Using quality tools
and techniques successfully. The TQM Magazine, 7(6), 37-42.
Meadows, K. A. (2003). So you want to do research? 5: Questionnaire
design. British Journal of Community Nursing, 8, 562-570.
Mehra, S., Hoffman, J. M., & Sirias, D. (2001). TQM as a management
strategy for the next millennia. International Journal of Operations &
Production Management, 21(5/6), 855-876.
259
Mehrjerdi, Y. Z. (2011). Six-sigma: Methodology, tools and its future.
Assembly Automation, 31(1), 79-88.
Nakajima, S. (1988). Introduction to TPM: Total productive maintenance.
(translation). Productivity Press, Inc., 1988, 129.
Neuman, W. L (2006). Social Research Methods: Qualitative and
Quantitative Approaches. 4th ed., Boston, Pearson Education.
Niven, P. R. (2011). Balanced scorecard: Step-by-step for government and
nonprofit agencies John Wiley & Sons.
Pallant, J. (2010). SPSS survival manual 4th edition-A step by step guide to
data analysis using the SPSS program. Österrike: Allen & Unwin Book
Publisher.
Pande, P.S., Neuman, R.P. and Cavanagh, R.R. (2000) The Six Sigma
Way: How GE, Motorola and Other Top Companies are Honing their
Performance, New York, NY: McGraw-Hill Professional.
Papadopoulou, T. C., & Özbayrak, M. (2005). Leanness: experiences from
the journey to date. Journal of Manufacturing Technology Management,
16(7), 784-807.
Patton, M. Q. (2005). Qualitative research, Wiley Online Library.
Pfeifer, T., Reissiger, W., & Canales, C. (2004). Integrating six sigma with
quality management systems. The TQM Magazine, 16(4), 241-249
Pochampally, K. K., & Gupta, S. M. (2014). Six sigma case studies with
minitab® CRC Press.
Porter, L. J., & Parker, A. J. (1985). Total quality management—the critical
success factors. Total Quality Management, 4(1), 13-22.

260
Powell, T. C. (1995). Total quality management as competitive advantage: A
review and empirical study. Strategic Management Journal, 16(1), 15-37.
Prajogo, D. I., & Sohal, A. S. (2006). The relationship between organization
strategy, total quality management (TQM), and organization performance––
the mediating role of TQM. European Journal of Operational Research,
168(1), 35-50.
Pyzdek, T., & Keller, P. A. (2014). The six sigma handbook McGraw-Hill
Education.
Rahman, S. U. (2004). The future of TQM is past. Can TQM be
resurrected? Total Quality Management & Business Excellence, 15(4), 411-
422.
Reichhart, A., & Holweg, M. (2007). Lean distribution: concepts,
contributions, conflicts. International journal of production research, 45(16),
3699-3722.
Remenyi, D., & Williams, B. (1998). Doing research in business and
management: an introduction to process and method. Sage.
Revere, L., Black, K., & Huq, A. (2004). Integrating Six Sigma and CQI for
improving patient care. The TQM Magazine, 16(2), 105-113.
Robson, C., & McCartan, K. (2016). Real world research John Wiley & Sons.
Rockart, J. F. (1979). Chief executives define their own data needs. Harvard
Business Review, 57(2), 81-93.
Saad, S. M., & Gindy, N. N. (2007). Future shape of the responsive
manufacturing enterprise. Benchmarking: An International Journal, 14(1),
140-152.
Saaty, T. (1980). The Analytic Hierarchy Process. New York, McGraw.

261
Saaty, T. L. (1994). Highlights and critical points in the theory and
application of the analytic hierarchy process. European Journal of
Operational Research, 74(3), 426-447.
Salah, S., Rahim, A., & Carretero, J. A. (2010). The integration of six sigma
and lean management. International Journal of Lean Six Sigma, 1(3), 249-
274.
Shahin, A. (2004). Integration of FMEA and the Kano model: An exploratory
examination. International Journal of Quality & Reliability
Management, 21(7), 731-746.
Sandholm, L. and Sörqvist, L. (2002). ‘12 requirements for Six Sigma
success’. Six Sigma Forum Magazine, (2), 17–22.
Sarantakos, S. (2012). Social research Palgrave Macmillan.
Saunders, M., Lewis, P., Thornhill, A., & Wang, C. (2009). Analysing
qualitative data. Research methods for business students. 5th edn. Harlow,
Essex, UK: Pearson Education Ltd, 480-525.
Saunders, M. N., & Lewis, P. (2012). Doing research in business &
management: An essential guide to planning your project Pearson.
Schon, K. (2006). Implementing six sigma in a non-american culture.
International Journal of Six Sigma and Competitive Advantage, 2(4), 404-
428.
Seow, C., & Antony, J. (2004). Some pros and cons of six sigma: An
academic perspective. The TQM Magazine, 16(4), 303-306.
Sharma, U. (2003). Implementing lean principles with the Six Sigma
advantage: how a battery company realized significant improvements.
Global Business and Organizational Excellence, 22(3), 43-52.

262
Six-Sigma Black Belt Course (2015) American Socity for Quality.
Snee, R. D. (2004). Six–Sigma: The evolution of 100 years of business
improvement methodology. International Journal of Six Sigma and
Competitive Advantage, 1(1), 4-20.
Snee, R. D. (2010). Lean six Sigma–getting better all the time. International
Journal of Lean Six Sigma, 1(1), 9-29.
Snee, R. D., & Hoerl, R. W. (2005). Six sigma beyond the factory floor:
Deployment strategies for financial services, health care, and the rest of the
real economy. Upper Saddle River, NJ; London: Prentice Hall Business.
Srinidhi, B. (1998). Strategic quality management. International Journal of
Quality Science, 3(1), 38-70.
Srinivasu, R., Reddy, G. S., Sreenivasarao, V., & Rikkula, S. R. (2009). The
contributions of TQM and six SIgma in the organizations to achieve the
success in terms of quality. International Journal of Reviews in Computing,
2010
Staats, B. R., Brunner, D. J., & Upton, D. M. (2011). Lean principles,
learning, and knowledge work: Evidence from a software services
provider. Journal of operations management, 29(5), 376-390.
Thomas, A., Barton, R., & Chuke-Okafor, C. (2008). Applying lean six sigma
in a small engineering company–a model for change. Journal of
Manufacturing Technology Management, 20(1), 113-129.
Thompson, B., & Daniel, L. G. (1996). Factor analytic evidence for the
construct validity of scores: A historical overview and some guidelines.
Educational and Psychological Measurement, 56(2), 197-208.
Timans, W., Antony, J., Ahaus, K., & van Solingen, R. (2012).
Implementation of Lean Six Sigma in small-and medium-sized

263
manufacturing enterprises in the Netherlands. Journal of the Operational
Research Society, 63(3), 339-353.
Valmohammadi, C. (2010). Identification and prioritization of critical success
factors of knowledge management in Iranian SMEs: An experts' view.
African Journal of Business Management, 4(6), 915.
Vaidya, O. S., & Kumar, S. (2006). Analytic hierarchy process: An overview
of applications. European Journal of Operational Research, 169(1), 1-29.
Vargas, L. G. (1990). An overview of the analytic hierarchy process and its
applications. European Journal of Operational Research, 48(1), 2-8.
Vive, N (2005) Quality management system handbook for product
development companies. CRC Press.
Vora, M. K. (2002). Business excellence through quality management. Total
Quality Management, 13(8), 1151-1159.
Williams, B., Brown, T., & Onsman, A. (2012). Exploratory factor analysis: A
five-step guide for novices. Australasian Journal of Paramedicine, 8(3), 1.
Wilson, L. (2009). How to implement lean manufacturing McGraw Hill
Professional.
Womack, J. P., Jones, D. T., & Roos, D. (1990). Machine that changed the
world Simon and Schuster.
Yang, C. (2004). An integrated model of TQM and GE-six-sigma.
International Journal of Six Sigma and Competitive Advantage, 1(1), 97-111.
Yang, C. (2012). The integration of TQM and six-sigma INTECH Open
Access Publisher.

264
Yang, C., & Yang, K. (2011). An integrated model of value creation based on
the refined kano's model and the blue ocean strategy. Total Quality
Management & Business Excellence, 22(9), 925-940.
Yang, C., & Yeh, T. (2007). An integrated model of hoshin management and
six sigma in high-tech firms. Total Quality Management, 18(6), 653-665.
Yusof, S. M., & Aspinwall, E. M. (2000). Critical success factors in small and
medium enterprises: Survey results. Total Quality Management, 11(4-6),
448-462.

265
Appendixes
Appendix A
Questionnaires for validating the research study
A-1. Questionnaire1; Evaluation the proposed LSS integrated model
Research Survey on investigation the suitability of the proposed conceptual Lean-Six Sigma implementation model for manufacturing organisations
This survey aims to investigate the suitability of the proposed conceptual lean-
Six Sigma implementation model for manufacturing organisations. The author’s
purpose is to analyse the current trend in Lean-Six Sigma implementation in
manufacturing organisation, its methodologies, perceived benefits, critical
success factors and barriers for success implementation by conducting a survey
questionnaire on the senior management of the available manufacturing
organisations. The survey is structured in four sections and it is to be filled by
managers or management employees.
SECTION A
Background information
The aim of this part of the survey is to present a clear picture of the
respondent’s background and understand the level of LSS awareness or other
quality program existing in the organisation to determine if the organisation has
the right culture for LSS implementation.
1) What is your position within your organisation? [ ] Director [ ] Quality Manager [ ] Operational Manager [ ] Belt functions [ ] Project Lead [ ] Other 2) Area of Industry [ ] Manufacturing [ ] Automotive [ ] Oil and gas [ ] Other 3) Country organisation Location?
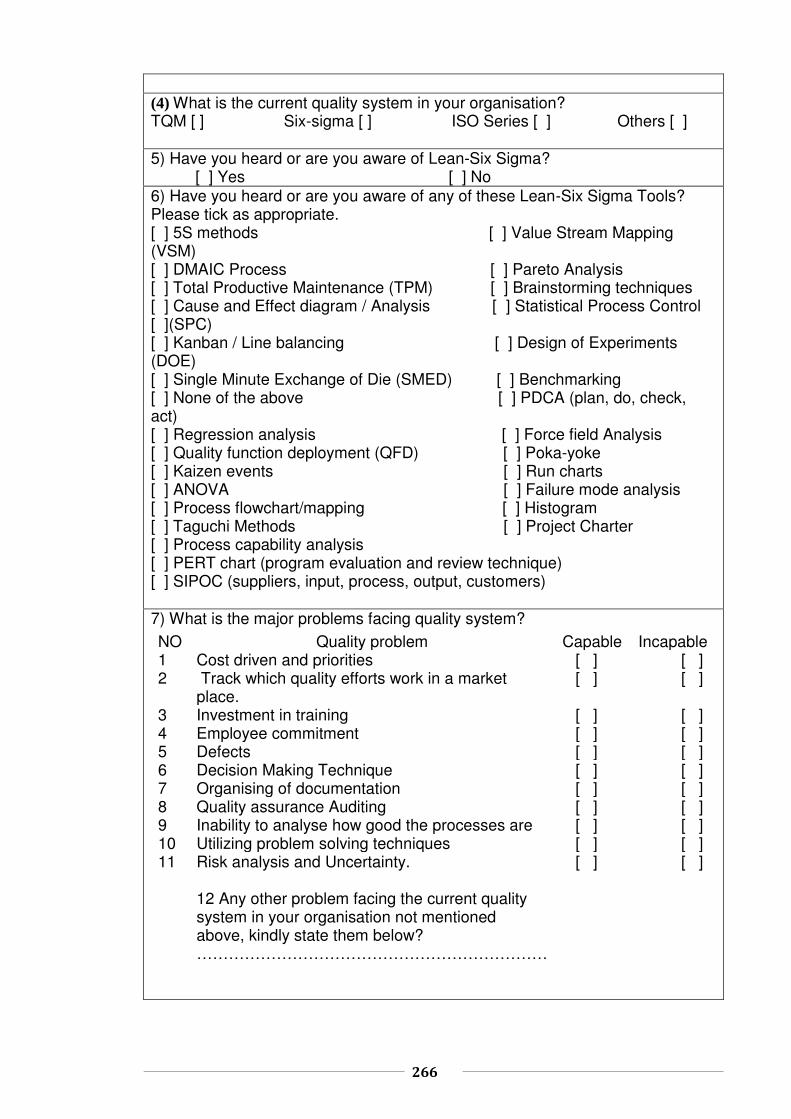
266
(4) What is the current quality system in your organisation? TQM [ ] Six-sigma [ ] ISO Series [ ] Others [ ] 5) Have you heard or are you aware of Lean-Six Sigma? [ ] Yes [ ] No 6) Have you heard or are you aware of any of these Lean-Six Sigma Tools? Please tick as appropriate. [ ] 5S methods [ ] Value Stream Mapping (VSM) [ ] DMAIC Process [ ] Pareto Analysis [ ] Total Productive Maintenance (TPM) [ ] Brainstorming techniques [ ] Cause and Effect diagram / Analysis [ ] Statistical Process Control [ ](SPC) [ ] Kanban / Line balancing [ ] Design of Experiments (DOE) [ ] Single Minute Exchange of Die (SMED) [ ] Benchmarking [ ] None of the above [ ] PDCA (plan, do, check, act) [ ] Regression analysis [ ] Force field Analysis [ ] Quality function deployment (QFD) [ ] Poka-yoke [ ] Kaizen events [ ] Run charts [ ] ANOVA [ ] Failure mode analysis [ ] Process flowchart/mapping [ ] Histogram [ ] Taguchi Methods [ ] Project Charter [ ] Process capability analysis [ ] PERT chart (program evaluation and review technique) [ ] SIPOC (suppliers, input, process, output, customers) 7) What is the major problems facing quality system?
NO Quality problem Capable Incapable 1 Cost driven and priorities [ ] [ ] 2 Track which quality efforts work in a market
place. [ ] [ ]
3 Investment in training [ ] [ ] 4 Employee commitment [ ] [ ] 5 Defects [ ] [ ] 6 Decision Making Technique [ ] [ ] 7 Organising of documentation [ ] [ ] 8 Quality assurance Auditing [ ] [ ] 9 Inability to analyse how good the processes are [ ] [ ] 10 Utilizing problem solving techniques [ ] [ ] 11 Risk analysis and Uncertainty.
12 Any other problem facing the current quality system in your organisation not mentioned above, kindly state them below? …………………………………………………………
[ ] [ ]

267
SECTION B
How suitable is the Lean-Six Sigma to your organisation and potential
benefits that can be achieved through its implementation.
This section of the questionnaire attempts to investigate the extent to which
Lean-Six Sigma will be appropriate to your organisation in terms of long term
strategic thinking. It will also give an indication of how the approaches to Lean-
Six Sigma implementation will be accepted by top management and other
employee in your organisation.
(1) Have you had any formal training in Lean and/or Six Sigma? [ ] Lean [ ] Six-Sigma [ ] Both [ ] None 2) How long have you been using the Lean and/or Six-Sigma approaches? [ ] Never used Lean and/or Six-Sigma [ ] 6 months or less [ ] 7-12 months [ ] 1-2 years [ ] 2-5 years [ ] 5-10 years [ ] 10 years + (3) What is your Lean and or Six-Sigma role? [ ] Team Member [ ] Trainer [ ] Practitioner [ ] Yellow Belt [ ] Green Belt [ ] Black Belt [ ] Master Black Belt [ ] Champion [ ] No Role
(7) Please indicate the extent to which the following motives will influence your decision in adopting the Six Sigma TQM integrated quality management model. (Rate as you think is appropriate) Rating scales: 1 - Strongly Disagree 2 – Disagree 3 – Neutral 4 – Agree 5 – Strongly Agree No. Factors affecting the organisation’s success Rating
Scales (1-5) To meet the customer’s requirement and needs. To improve the organisation’s productivity and overall
efficiency.
To improve Organisation’s profitability To achieve the organisation’s objectives To reduce production cost / services cost To follow industrial trends To gain competitive advantage To improve product quality / quality of service To expand to overseas market

268
To gain and improve customer’s confidence in your product or services
To exceed customer satisfaction and fitful customer delight
To enhance and support the organisation’s reputation To attract more customers To develop the organisation management techniques To achieve sustainable improvement
Others, please specify:
(8) Please indicate the extent of the benefits your organisation could gain by adopting Six Sigma TQM as integrated quality management model (Tick as you consider appropriate) Rating scales: 1 – Very less 2 – Less 3 – Moderate 4 – Much 5 – Very much No Perceived benefits of Lean-Six Sigma to Nigerian
Industries Rating Scales (1-5)
1 Cultivate the quality concepts and awareness of speed and innovation by investment in training
2 Improved delivery (e.g. reduced customer lead time) 3 Cultural benefits (e.g. motivated workforce) 4 Focusing on exceed customer satisfaction and fulfil
customer delight
5 Reducing quality problems (defects and rework) 6 High awareness of quality among employees 7 Utilise the IT system support for enhancing the implement
process and perform high improvement performance
8 Improved productivity 9 Realisation of the employees participation and make
everyone involved in the organisation
10 Learn from mistakes by taking action for high quality (emphasising on continuous improvement)
11 Increasing profits and reducing the cost of production 12 Enhancing the organisation’s competitive position 13 Increasing the customers confidence and relations 14 Reduced warranty claim cost 16 Improved sales 17 Organised working environment 18 Generate new business opportunities Others, please specify:

269
Section C: Evaluating the awareness and usefulness of the LSS tools and
techniques to Manufacturing organisations
This section of the survey seeks to provide an understanding of your involvement in Six- Sigma and Lean tools and techniques that have been used in your organization or used by you and how useful these tools to business for manufacturing organisation. It aims to provide an understanding of basic Six-Sigma and Lean tools and implementation procedure that are suitable for manufacturing organizations, identify possible difficulty in implementing the proposed model and show the level of accuracy of the contents of the model as applied to business in manufacturing organizations.
(9) Which Lean and/ or Six-Sigma tools and techniques have you used or have been applied in your organisation? (Tick as you consider appropriate) Rating scales: 1 – Never been used 2 – Used only once 3 – Used rarely 4 – Used frequently 5 – Used continuously No. Lean-Six Sigma Tools and Techniques Rating scale
(1-5) 5 S Methods Kanban / Line balancing Pareto Analysis Brainstorming techniques Value Stream Mapping (VSM) PDCA (plan, do, check, act) Cause and effect diagram / analysis Statistical process control chats (SPC) Quick change over, SMED (single minute exchange of
die)
Benchmarking Regression analysis Design of experiments (DOE) PERT chart (program evaluation and review technique) Quality function deployment (QFD) Force field Analysis Poka-yoke Kaizen events Run charts ANOVA Failure mode analysis SIPOC (suppliers, input, process, output, customers) Process flowchart/mapping Histogram Taguchi Methods Project Charter Process capability analysis

270
(5) Which Lean and/ or Six-Sigma tools and techniques do you consider useful and to your organisation or other M O? (Tick as you consider appropriate) Rating scales: 1 – Not useful 2 – Less useful 3 – Moderate 4 – Useful 5 – Very Useful
No. Lean-Six Sigma Tools and techniques Rate Scale (1-5)
5 S Methods Kanban / Line balancing Pareto Analysis Brainstorming techniques Value Stream Mapping (VSM) PDCA (plan, do, check, act) Cause and effect diagram / analysis Statistical process control chats (SPC) Quick change over, SMED (single minute exchange of
die)
Benchmarking Regression analysis Design of experiments (DOE) PERT chart (program evaluation and review technique) Quality function deployment (QFD) Force field Analysis Poka-yoke Kaizen events Run charts ANOVA Failure mode analysis SIPOC (suppliers, input, process, output, customers) Process flowchart/mapping Histogram Taguchi Methods Project Charter Process capability analysis

271
SECTION D
Evaluation the proposed Lean-Six Sigma integrated Model to your Organization and other manufacturing organization.
This section of the survey seeks to evaluate the proposed Lean-Six Sigma
integrated model for manufacturing organizations. It aims to provide an
understanding of basic Lean-Six Sigma tools and implementation procedure
that are suitable for manufacturing organisations, identify possible difficulty in
implementing the proposed model and show the level of accuracy of the
contents of the model as applied to business in manufacturing organisations.
Establish the key measures (CTQ, CTC and CTS)
Undertake Six-Sigma approach to evaluate the measurement system using Gauge R & R
Start
Recognise the need for change by analysing (Market , Customer and Process)
Form a high level functional Team and setup the vision
Identifying the activities of the current process by establishing SIPOC
Carryout VSM to identify the area of west and the bottle neck
Apply RCA to assess the quality problem using 5 way and
brainstorming
Use Pareto analysis to identify issues critical to quality
Use brainstorming to conduct Cause & effect diagram to identify root
causes of problems
Assess the potential causes to detect the variation using SPC
List the factors need to be improved
Identify the process capability ( CP, CPK, Yield , DPMO)
Specify the objectives and target result of the
experiment
Analyse the DOE results by ANOVA to obtain statistical
significantApply Six-sigma measures to identify the gap between the Current and the target performance using: δ measure, CP, CPK, Yield and analyse
VSM
Apply TPM for mentoring the performance of the process, use OEE to evaluate the
effectiveness of the quality system
YESNO
Do values provide match
the actual performance
required
Do values provide match
the actual performance
required
Str
ate
gic
Ele
me
nts
Op
era
tio
n E
lem
en
ts
Collecting the required data to evaluate the process performance
Carryout the DOE
Solution foundapply control measures for
evaluating using SPC
Implement solution update the procedures and
documented
Mentoring the action and evaluating the performance of the process using SPC, balanced scorecard, 3C and Kaizen
Verifying the system by measuring the success of the business objectives using KIP
Stage 4Process improvement and verification
Evaluate and standardise the solution by; FMEA, Brainstorming and 5S
Stage 1Process planning and organisation
Stage 2Process enhancement and stimulation
Stage 3Process evaluation and activation
The proposed conceptual LSS integrated model for manufacturing organisation

272
(6) Please indicate the extent of which you agree to the following statements. (Tick as you consider appropriate) Rating scales: 1 – Strongly disagree 2 – Disagree 3 – Moderate 4 – Agree 5 – Strongly agree No. Statements relating to Lean-Six Sigma Implementation
Model Rating Scales (1-5)
1 To what extent do you agree with the contents of the proposed Lean-Six Sigma implementation Model for M O?
2 To what extent do you agree that this model is suitable and applicable in your Organization?
3 Do you agree that the contents of this model will boost your Organization’s competitiveness and profit?
4 Do you agree that the proposed Lean-Six Sigma implementation Model will help your organization overcome the complex nature of Lean-Six Sigma implementation?
5 Do you agree that Lean-Six Sigma will help your organization in reaching its long term goals and business expectations?
(6) Do you foresee any difficulty in adopting Lean-Six Sigma in your organization using the proposed model? [ ] No [ ] Yes If Yes kindly state it below. (7) In your own judgment, do think anything is missing in the content of the model? [ ] No [ ] Yes If yes, kindly state them below?
SECTION E
Critical Success factors for Lean-Six Sigma Implementation in MO
This part of the survey is aimed at understanding the critical factors necessary
for successful implementation of Lean-Six Sigma in manufacturing
organisations and potential barriers that can impede the implementation
process.

273
(1) Please rate the importance of these critical factors to the successful implementation of Lean-Six Sigma in M O. (please tick as you consider appropriate) Rating Scale: 1 – Not important at all 2 – Slightly important 3 – important 4 – quite important 5- very important No Critical success factor for Lean-Six Sigma
implementation in M O Rating Scales (1-5)
1 Organisational structure; 2 Business plan and Vision; 3 Liking LSS to customer; 4 Change management and organisation culture 5 Education and training; 6 Top management involvement and participation; 7 Effective communication; 8 Linking LSS to organisation's business strategy; 9 Project selection, prioritisation, reviews and
tracking
10 Linking to Suppliers; 11 Project management and 12 Monitoring and evaluation of performance
Other, please specify and rate:
(2) Please indicate to what extent these factors will impede the implementation of Lean-Six Sigma in M O. (please tick as you consider appropriate) Rating Scale: 1 – Very Low 2 – Low 3 – Moderate 4 – High 5- Very High Barriers to successful implementation of Lean-Six Sigma in M O Rating scales (1-5) Internal resistance Poor project selection Lack of Leadership Lack of Tangible results Availability of Resources Change management Changing business focus Competing projects Unmanaged expectations Poor training and coaching Low employee retention Others, please specify and rate:

274
A-2: Questionnaire 2; Evaluation of the proposed SS_TQM Integrated
model
Research Survey on the investigation of the suitability of the proposed
integrated Si x-sigma TQM conceptual model for manufacturing
organisation
This survey aims to investigate the suitability of the proposed integrated Six-
sigma TQM conceptual model for achieving business excellence in
manufacturing organisations. The author’s purpose is to analyse the current
trend in quality management implementation particular Six-sigma and TQM in
manufacturing organisation, its methodologies, perceived benefits, critical
success factors and barriers for success implementation by conducting a survey
questionnaire on the senior management of the available manufacturing
organisations. The survey is structured in four sections and it is to be filled by
Academics, managers or management employees.
SECTION A
Background information
The aim of this part of the survey is to present a clear picture of the
respondent’s background and understand the awareness level of the existing
quality program in the organisation to determine if the organisation has the right
culture for the integrated Six-sigma and TQM proposed model.
What is your position within your organisation? [ ] Director [ ] Quality Manager [ ] Operational Manager [ ] Quality engineer [ ] Belt functions [ ] Project Lead or departmental head [ ] Coordinator [ ] Academics [ ] Others Area of Industry [ ] Manufacturing [ ] Automotive [ ] Oil and Gas [ ] Other (3) Country Organisations Location? (4) What is the current quality system in your organisation? TQM [ ] Six-sigma [ ] ISO Series [ ] Others [ ] (5) Have you heard or are you aware of the following Quality management approach? Six-Sigma [ ] Yes [ ] No TQM [ ] Yes [ ] No

275
(6) Have you heard or are you aware of any of these Six-sigma and TQM Tools? Please tick as appropriate. [ ] PDCA (plan, do, check, act) [ ] DMAIC Process [ ] Pareto Analysis [ ] Total Productive Maintenance (TPM) [ ] Brainstorming techniques [ ] Cause and Effect diagram / Analysis [ ] Statistical Process Control [ ](SPC) [ ] (DOE) [ ] Benchmarking [ ] Regression analysis [ ] Force field Analysis [ ] Quality function deployment (QFD) [ ] Run charts [ ] ANOVA [ ] Failure mode analysis [ ] Process flowchart/mapping [ ] Histogram [ ] Taguchi Methods [ ] Project Charter [ ] Process capability analysis [ ] PERT chart (program evaluation and review technique) [ ] SIPOC (suppliers, input, process, output, customers) (7) What are the main problems facing the current quality system in your organisation? Yes No 1 Decision Making [ ] [ ] 2 Risk analysis and uncertainty [ ] [ ] 3 Lacks cost driven priorities [ ] [ ] 4 investment in training [ ] [ ] 5 Fails to track which quality efforts work in a market place [ ] [ ] 6 Employees commitment [ ] [ ] 7 Resources Management [ ] [ ] 8 Follow up the documentation process [ ] [ ] 9 Rescheduling organisation [ ] [ ] 10 The right organisation of storage space [ ] [ ] 11 The right selection of raw material [ ] [ ] 12 Involvement of the top management and support [ ] [ ] 13 middle management Involvement and realisation of teamwork [ ] [ ] 14 Defects rate [ ] [ ] 15 Machine setup control [ ] [ ] 16 Planning and following the maintenance program [ ] [ ] 17 Taking action for continuous improvement [ ] [ ] 18 Marketing and sales management [ ] [ ] (8) Any other problem facing the current quality system in your organisation not mentioned above, kindly state them below? ……………………………………………………………………………………………………………………………………………………………………………………………………

276
SECTION B
The awareness and usefulness of the Six Sigma and TQM tools and
techniques to manufacturing organization
This section of the survey seeks to provide an understanding of your
involvement in Six- Sigma and TQM tools and techeques that have been used
in your organization or used by you and how useful these tools to business for
manufacturing organization. It aims to provide an understanding of basic Six
Sigma and TQM tools and implementation procedure that are suitable for
manufacturing organizations, identify possible difficulty in implementing the
proposed model and show the level of accuracy of the contents of the model as
applied to business in manufacturing organizations.
Have you had any formal training in Six Sigma or/and TQM concepts? [ ] TQM [ ] Six-Sigma [ ] Both [ ] None How long have you been using the Six-Sigma or TQM approaches? [ ] Never used TQM or Six-Sigma [ ] One year or less [ ] 2-5 years [ ] 5-10 years [ ] 10 years + What is your TQM and/or Six-Sigma role? [ ] Team Member [ ] Trainer [ ] Practitioner [ ] Yellow Belt [ ] Green Belt [ ] Black Belt [ ] Master Black Belt [ ] Champion [ ] Manager [ ] Head of department [ ] No Role (4) Which TQM and/ or Six-Sigma tools and techniques have you used or have been applied in your organisation? (Tick as you consider appropriate) Rating scales: 1 – Never been used 2 – Used only once 3 – Used rarely 4 – Used frequently 5 – Used continuously No. Lean-Six Sigma Tools and Techniques Rating scale
(1-5) 1 Pareto Analysis 2 Brainstorming techniques 3 PDCA (plan, do, check, act) 4 Cause and effect diagram / analysis 5 Statistical process control chats (SPC) 6 Benchmarking
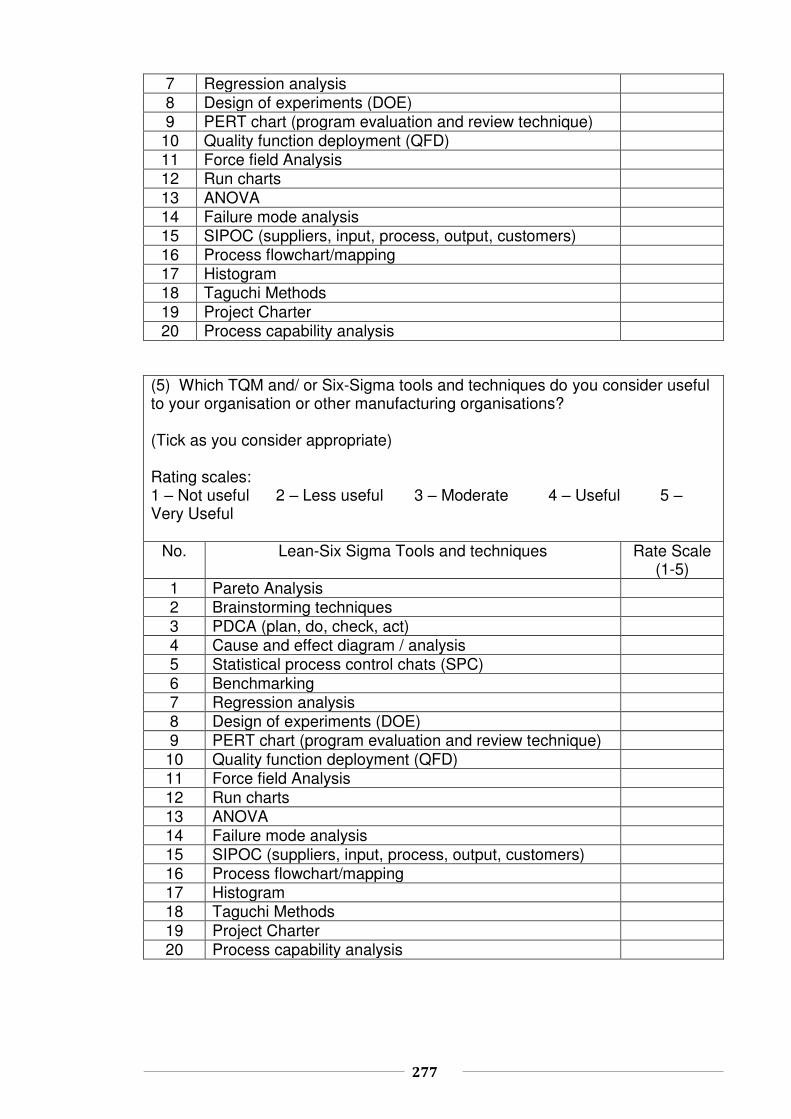
277
7 Regression analysis 8 Design of experiments (DOE) 9 PERT chart (program evaluation and review technique)
10 Quality function deployment (QFD) 11 Force field Analysis 12 Run charts 13 ANOVA 14 Failure mode analysis 15 SIPOC (suppliers, input, process, output, customers) 16 Process flowchart/mapping 17 Histogram 18 Taguchi Methods 19 Project Charter 20 Process capability analysis
(5) Which TQM and/ or Six-Sigma tools and techniques do you consider useful to your organisation or other manufacturing organisations? (Tick as you consider appropriate) Rating scales: 1 – Not useful 2 – Less useful 3 – Moderate 4 – Useful 5 – Very Useful
No. Lean-Six Sigma Tools and techniques Rate Scale (1-5)
1 Pareto Analysis 2 Brainstorming techniques 3 PDCA (plan, do, check, act) 4 Cause and effect diagram / analysis 5 Statistical process control chats (SPC) 6 Benchmarking 7 Regression analysis 8 Design of experiments (DOE) 9 PERT chart (program evaluation and review technique) 10 Quality function deployment (QFD) 11 Force field Analysis 12 Run charts 13 ANOVA 14 Failure mode analysis 15 SIPOC (suppliers, input, process, output, customers) 16 Process flowchart/mapping 17 Histogram 18 Taguchi Methods 19 Project Charter 20 Process capability analysis

278
Section C - Validation of the Proposed integrated Six-sigma TQM
Conceptual model for manufacturing organizations
This section of the survey seeks to validate the proposed model for
manufacturing organizations shown below, it aims to provide an understanding
of Six-sigma and TQM implementation procedures suitable for manufacturing
organizations, identify the difficulties in implementing the proposed model and
reveal the accuracy level in its contents in terms of helping business to gain
competitive advantage on the long run, a shown below the model consisting of
three main elements which are; Strategic elements including the key elements
that can guide the organizations to achieve the main goals. Implementation
elements, contains the main drivers that can simplify the operation process and
obtain better performance. Performance excellence elements, including the key
measures that can attain sustainable improvement and excellence performance.
I would like you to consider these elements and indicate to which extent you are
agree to the following statements.
YesNo
Organisation strategy and system support
Six-Sigma strategic and TQM Concepts
Investment in Training
IT support for digitising processes
Middle management involvement
Verifying to fulfil customer requirements Balanced scorecard card and customer satisfaction survey
Cus
tom
er M
anag
emen
t
Top
man
agem
ent a
nd le
ader
ship
sup
port
Bottom up management
Top down management
Continuous improvement
Learn from mistakes
Take action to high quality
Strategic elements
Realisation the mission
Setup the vision
Identify the objectives
Provision the resources
Capture the customer needs
Customer oriented
Quality concepts
Zero defects
Innovation oriented
Culture change and realisation of innovation
HR
MR
elis
atio
n of
team
wor
k an
d pa
rtic
ipat
ion
Team
em
pow
erm
ent
Cor
e bu
sine
ss
deve
lopm
ents
anal
yse
cust
omer
s fe
edba
ckH
igh
qual
ity
cust
omer
ser
vice
Performance excellence elements
Implementation elements
TQMQCC &CIT
Six SigmaDMAIC
Performance excellence
Customer loyaltyLong term success
The proposed conceptual Six-Sigma TQM integrated model for manufacturing organisations

279
(6) Please indicate the extent which you agree to the following statements? (Tick as you consider appropriate) Rating scales: 1 – Strongly disagree 2 – Disagree 3 – Moderate 4 – Agree 5 – Strongly agree
1 Statement relating to the strategic elements of the proposed model.
Rating Scales (1-5)
To what extent do you agree with the contents of the strategic elements of the proposed Six- Sigma and TQM integrated Model for Manufacturing Organization?
2 Statement relating to the implementation elements
of the proposed model. Rating Scales (1-5)
To what extent do you agree with the contents of the implementation elements of the proposed Six- Sigma and TQM integrated Model for Manufacturing Organization?
3 Statement relating to the performance excellence
elements of the proposed model. Rating Scales (1-5)
To what extent do you agree with the contents of the strategic elements of the proposed Six- Sigma and TQM integrated Model for Manufacturing Organization?
Statements relating to Six-Sigma and TQM integrated Model
Rating Scales (1-5)
4 To what extent do you agree that this model is suitable and applicable in your Organization?
5 Do you agree that the contents of this model will boost your Organization’s competitiveness and profit?
6 Do you agree that the proposed Six Sigma TQM integrated Model will help your organization to overcome the complex nature of TQM-Six Sigma implementation?
7 Do you agree that the proposed model will help your organization in reaching its long term goals and business expectations?
8 In your own judgment, do you have anything missing and should be added to the proposed model? [ ] No [ ] Yes If yes, kindly state them below? …………………………………………………………………………………………………………………………………………………………………………

280
Statements relating to Six-Sigma and TQM integrated Model in terms of the extent to which the following motives will influence your decision in adopting the Six Sigma and TQM integrated quality management model.
Rating Scales (1-5)
1 To meet the customer’s requirement and needs. 2 To improve the organisation’s productivity and
overall efficiency.
4 To improve Organisation’s profitability 5 To achieve the organisation’s objectives 6 To reduce production cost / services cost 7 To follow industrial trends 8 To gain competitive advantage 9 To improve product quality / quality of service 10 To expand to overseas market 11 To gain and improve customer’s confidence in
your product or services
12 To exceed customer satisfaction and fitful customer delight
13 To enhance and support the organisation’s reputation
14 To attract more customers 15 To develop the organisation management
techniques
16 To achieve sustainable improvement Others, please specify:

281
Section D- Critical Success factors for Six-Sigma TQM integrated model in
manufacturing organizations
This part of the survey is aimed to understanding the critical factors necessary for successful implementation of Six-Sigma TQM integrated mode in manufacturing organizations and potential barriers that can impede the implementation process.
1) Please rate the importance of these critical factors to the successful implementation of Six Sigma in manufacturing organizations?
(please tick as you consider appropriate) Rating Scale: 1 – Not important at all 2 – Slightly important 3 – important 4 – quite important 5- very important No Critical success factor for Lean-Six Sigma
implementation in manufacturing organizations Rating
Scales (1-5) 1 Organisation infrastructure 2 Top management and leadership support 3 Investment in training 4 Middle management involvement 5 Communication 6 Understanding DMAIC strategy to deal with quality
issues
7 Understanding the usage of six-sigma and TQM tools and techniques and how to use in the right action
8 Investing in the adequate resources 9 Utilise IT to support implementation
10 Use of the best talent 11 Knowledge and competence the employees 12 Ability to learn from mistakes and history
Other, please specify and rate:

282
(2) Please indicate to what extent these factors will impede the implementation of Lean-Six Sigma in manufacturing organizations? (please tick as you consider appropriate) Rating Scale: 1 – Very Low 2 – Low 3 – Moderate 4 – High 5- Very High No Barriers to successful implementation of Lean-Six Sigma in
manufacturing organizations Rating scales (1-5)
1 Internal resistance 2 Poor project selection 3 Lack of Leadership 4 Lack of Tangible results 5 Availability of Resources 6 Change management 7 Changing business focus 8 Competing projects 9 Unmanaged expectations 10 Poor training and coaching 11 Low employee retention

283
A-3: Questionnaire 3; Evaluation the proposed integrated quality
management framework
Research Survey on the investigation of the suitability of a proposed integrated quality management framework for manufacturing organisation
This survey aims to investigate the suitability of the proposed integrated quality management framework to improve and modernise the quality system within manufacturing organisations. The proposed framework developed by integrating three powerful methodology which are; Six-Sigma, Lean operation and TQM, the aim is to eliminate the quality critical issues within manufacturing organisation and make the quality system in place more effective. The author’s purpose is to analyse the current trend in quality management implementation in particular Six-sigma, Lean operation and TQM in manufacturing organisation, its methodologies, perceived benefits, critical success factors and barriers for successful implementation by conducting this survey questionnaire. The survey is structured in three sections for Academics, managers or management employees to fill in.
SECTION A
Background information
The aim of this part of the survey is to present a clear picture of the respondent’s background and understand the awareness level of the existing quality programme in the organisation.
What is your position within your organisation? [ ] Director [ ] Quality Manager [ ] Operational Manager [ ] Quality engineer [ ] Belt functions [ ] Project Lead or departmental head [ ] Coordinator [ ] Academics [ ] Others Area of Industry [ ] Manufacturing [ ] Automotive [ ] Oil and Gas [ ] Other (3) Country Organisations Location? (4) What is the current quality system in your organisation? TQM [ ] Six-sigma [ ] ISO Series [ ] Others [ ] (5) Have you heard or are you aware of the following Quality management approach? Six-Sigma [ ] Yes [ ] No Lean operation [ ] Yes [ ] No TQM [ ] Yes [ ] No (6) Have you heard or are you aware of any of these Six-sigma, Lean and TQM Tools? Please tick as appropriate.
284
[ ] PDCA (plan, do, check, act) [ ] DMAIC Process [ ] 5S methods [ ] Value Stream Mapping (VSM) [ ] Pareto Analysis [ ] Root causes analysis [ ] Total Productive Maintenance (TPM) [ ] Brainstorming techniques [ ] Cause and Effect diagram / Analysis [ ] Statistical Process Control (SPC) [ ] Design of Experiments (DOE) [ ] Kaizen events [ ] Kanban / Line balancing [ ] Poka-yoke [ ] Single Minute Exchange of Die (SMED) [ ] Benchmarking [ ] Regression analysis [ ] Force field Analysis [ ] Quality function deployment (QFD) [ ] Run charts [ ] ANOVA [ ] Failure mode analysis [ ] Process flowchart/mapping [ ] Histogram [ ] Taguchi Methods [ ] Project Charter [ ] Process capability analysis [ ] Cost of Poor quality COPQ [ ] PERT chart (program evaluation and review technique) [ ] SIPOC (suppliers, input, process, output, customers)
Section B - Validation of the Proposed integrated Quality Management
framework for manufacturing organizations
This section of the survey seeks to validate the proposed framework for manufacturing organisations shown below; it aims to provide an understanding of the implementation procedures suitable for manufacturing organisations, identify the difficulties in implementing the proposed framework and reveal the accuracy level in its contents in terms of helping business to gain competitive advantage on the long run. As shown below the framework consists of five main stages consolidated with soft factors for successful implementation procedures and achieving the main desired goals, the stages of the framework are;
Phase1 Strategic planning: including the soft factors for successful planning process and strategic planning steps to formulate the quality management planning and facilitate the implementation phases.
Phase 2 Measurement and evaluation: comprises four stages, each stage equipped with set of tools and techniques to evaluate the current system and to collect the required data for the purpose of inspecting the current performance and investigating the quality problems.
Phase 3 Analysis and activation; consists of four stages each stage employed different quality control tools and techniques to analyse the gap between the current and desired performance and identify the causes of quality problems.
Phase 4 Improvement and monitoring; this phase is concerned with process of developing, implementing and monitoring the improvement plan, Design of Experiments (DOE) technique employed to identify the solution of quality issues and quality control tools used to implement and monitor the improvement plan, this phase includes seven stages.

285
Phase 5 Verifying and continues improvement; comprise seven stages, set of quality tools used to control and sustain the improvement performance and other global tools employed to evaluate and verify the organisation success.
The whole phases of the framework consolidated by six soft factors to enhance and guarantee the successful implementation process and guide the organisations to achieve the main goals. These factors are: Top management and leadership support, Customer management and market analysis, Effective communication, Quality commitment, middle management involvement, , and review and tracking performance.
Middle
Management
Involvement
Review and tracking
performance
Organisation structure
Focus on customer
Linking to supplier
Phase 1. Strategic planning
Quality
commitment
Effective communication
Excellence performance
Focus on training and employees
development
Top
man
age
me
nt
and
lead
ers
hip
su
pp
ort
Cu
sto
me
r m
anag
em
en
t an
d m
arke
t an
alys
is
Capture customer needs
Set up KPICTCCTQCTS
Assess the current system to define the
quality problems
Set up the objectives
Form the functional
team
Phase 3Analyse and activation
Assess the quality problem using Prato analysis
Apply Six-sigma measures to identify the gap between the Current and the
target performance using: δ measure, CP, CPK, Yield and analyse VSM
Undertaken RCA using Fishbone ,
brainstorming& 5 why techniques to determine the key cause of the
problem
Assess the potential causes to detect the variation using SPC
List the factors need to be improved
Phase 2Measurement and evaluation
Collect data to evaluate potential performance
Evaluate the measurements system to establish performance
capability
Evaluating the current performance by studying the
current VSM
Phase 4Improvement and monitoring
YES
No
Is the
results
significant
Identify the objectives to
conduct DOEConduct DOE
Analyse results of DOE to obtain statistics
significance
Standardise the work and implement the
solution
Identify the solution and analyse the risk
Evaluate the possible solutions
Apply TPM for monitoring the process performance. Use OEE to evaluate the effectiveness of the operations
Document the quality issues
Verifying the quality system by evaluating the operating performance using Balanced scored card ands KPI
Update the improvement actions for high quality
Apply SPC and PDCA to Create and implement A control plan
Phase 5 Verifying and continues improvement
Is the planning clear
and the problems
defined
Identify the process capability ( CP, CPK, Yield , DPMO)
The proposed integrated quality management framework

286
I would be grateful if you could consider these components and indicate to what extent you are in agreement with the following statements.
(1) Statements relating to the proposed integrated quality management framework. Please indicate the extent to which you agree about the following statements? (Tick as you consider appropriate) Rating scales: 1 – Strongly disagree 2 – Disagree 3 – Moderate 4 – Agree 5 – Strongly agree
Statements relating to the proposed integrated quality management framework.
Rating Scales (1-5)
1 To what extent do you agree that the integrated framework is suitable and applicable in your Organisation?
2 Do you agree that the contents of this framework will boost your Organisation’s competitiveness and profit?
3 To what extent do you agree that the integrated framework applicable to deal and overcome the quality problems?
4 Do you agree that the proposed integrated quality management framework will help your organisation to overcome the complex nature of quality management implementation?
5 Do you agree that the proposed framework will help your organisation in reaching its long term goals and business expectations?
6 In your own judgment, do you have anything missing and should be added to the proposed framework? [ ] No [ ] Yes If yes, kindly state them below? …………………………………………………………………………………… ……………………………………………………………………………………

287
(2) Statements relating to the implementation procedures of the proposed integrated quality management framework. Please indicate the extent to which you agree about the following statements? (Tick as you consider appropriate) Rating scales: 1 – Strongly disagree 2 – Disagree 3 – Moderate 4 – Agree 5 – Strongly agree
Statement relating to phase one of the proposed framework; strategic planning.
Rating Scales (1-5)
1 To what extent do you agree with the soft factors of the strategic planning in phase one?
2 To what extent do you agree that the soft factors of the strategic planning in phase one will assist and success the planning process.
3 In your own judgment, do you have any soft factors missing and should be added to the strategic planning phase of the proposed framework?
If yes, kindly state them below? ………………………………………………………………………
[ ] Yes [ ] No
4 To what extent do you agree with the contents of the strategic steps for preceding the planning process in phase one?
In your own judgment, do you have any strategic steps missing and should be added to the strategic planning phase of the proposed framework? If yes, kindly state them below? ………………………………………………………………………
[ ] Yes [ ] No
Statement relating to phase two of the proposed framework; Measurement and evaluation.
Rating Scales (1-5)
1 To what extent do you agree with the contents of phase two of the proposed framework (Measurement and evaluation)?
2 To what extent do you agree that the stages of phase two capable to meet the key target (evaluation the current performance and collecting data for investigating the quality problems)?
3 In your own judgment, do you have any stages or elements missing and should be added to measurement and evaluation phase of the proposed framework?
If yes, kindly state them below? ……………………………………………………………………
[ ] Yes [ ] No

288
3 Statement relating to phase three of the proposed framework; Analysis and activation.
Rating Scales (1-5)
1 To what extent do you agree with the contents of phase three of the proposed framework (Analysis and activation)?
2 To what extent do you agree that the stages of phase three capable to meet the key target (Analyse the gap between the current and the desired performance and identify the root causes of the quality problems)?
3 In your own judgment, do you have any stages or elements missing and should be added to Analysis and activation phase of the proposed framework?
If yes, kindly state them below? ………………………………………………………………………
[ ] Yes [ ] No
2 Statement relating to the phase four of the proposed framework;
Improvement and monitoring. Rating Scales (1-5)
1 To what extent do you agree with the contents of phase four of the proposed framework (Improvement and monitoring)?
2 To what extent do you agree that the stages of phase four capable to meet the key target (Developing, implementing and monitoring the improvement plan)?
3 In your own judgment, do you have any stages or elements missing and should be added to Improvement and monitoring phase of the proposed framework?
If yes, kindly state them below? ………………………………………………………………………
[ ] Yes [ ] No
Statement relating to the phase five of the proposed framework;
Verifying and continuous improvement. Rating Scales (1-5)
1 To what extent do you agree with the contents of phase five of the proposed framework (Verifying and continuous improvement)?
2 To what extent do you agree that the stages of phase five capable to meet the key target (To maintain the control plan and confirm the organization success)?
3 In your own judgment, do you have any stages or elements missing and should be added to Verifying and continuous improvement phase of the proposed framework?
If yes, kindly state them below? ………………………………………………………………………
[ ] Yes [ ] No

289
Statement relating to the soft factors of the implementation process of the proposed framework.
Rating Scales (1-5)
1 To what extent do you agree with the soft implementation factors of the proposed framework?
2 To what extent do you agree that the soft implementation factors will assist and success of the implementation process of the proposed framework?
3 In your own judgment, do you have any soft implementation factors missing and should be added to the strategic planning phase of the proposed framework?
If yes, kindly state them below? ………………………………………………………………………
[ ] Yes [ ] No
(3) Statements relating to proposed framework in terms of the extent to which the following motives will influence your decision in adopting the integrated quality management framework.
Rating Scales (1-5)
1 To meet the customer’s requirement and needs. 2 To improve the organisation’s productivity and overall
efficiency.
4 To improve Organisation’s profitability 5 To achieve the organisation’s objectives 6 To reduce production cost / services cost 7 To follow industrial trends 8 To gain competitive advantage 9 To improve product quality / quality of service 10 To expand to overseas market 11 To gain and improve customer’s confidence in your product
or services
12 To exceed customer satisfaction and fitful customer delight 13 To enhance and support the organisation’s reputation 14 To attract more customers 15 To develop the organisation management techniques 16 To achieve sustainable improvement Others, please specify:

290
Section C- The critical Success factors for the proposed framework in
manufacturing organizations
This part of the survey is aimed to understanding the critical factors necessary for successful implementation of proposed integrated quality management framework in manufacturing organisations and potential barriers that can impede the implementation process.
(1) Please rate the importance of these critical factors to the successful implementation of the integrated quality management framework? (please tick as you consider appropriate) Rating Scale: 1 – Not important at all 2 – Slightly important 3 – important 4 – quite important 5- very important No Critical success factor for the integrated quality
management framework in manufacturing organizations
Rating Scales (1-5)
1 Organisation infrastructure 2 Focus on customer
3 Linking to supplier 4 Training and education 5 Top management and leadership support 6 Effective communication 7 Middle management involvement 8 Quality commitment 9 Review and tracking performance 10 Project management
Other, please specify and rate:
(2) Please indicate to what extent these factors will impede the implementation of the proposed framework in manufacturing organisations?
(please tick as you consider appropriate)
Rating Scale:

291
1 – Very Low 2 – Low 3 – Moderate 4 – High 5- Very High
No Barriers to successful implementation of the proposed framework. Rating scales (1-5)
1 Internal resistance
2 Poor project selection
3 Lack of Leadership
4 Lack of Tangible results
5 Availability of Resources
6 Change management
7 Changing business focus
8 Competing projects
9 Unmanaged expectations
10 Poor training and coaching
11 Low employee retention

292
Appendix B
Evaluating and prioritisation the main components of the framework
Development of an integrated quality management performance framework
This research focusses on the development of an integrated quality management performance framework in order to evaluate and decide upon the strategic quality management elements that should form this framework. As can be seen in the following proposed strategic elements framework, its criteria and sub-criteria that may have influences are listed and structured in a hierarchy format, this will enable us to formalise the contents of the framework as well as prioritising these elements. Therefore, the aim of this questionnaire is to gather the opinion of the practitioners, researchers and industrialists by carry out a pairwise comparison between these criteria and criteria sub-criteria within the proposed framework. In addition, there is an opportunity at the end to explore your opinion and whether we have missed other criteria which should be added.
Your contribution and partition are highly appreciated and we would like to thank you in advance for your time and answers.
* Required
Top of Form
Figure (1) Proposed hierarchy structure model contains the target, main criteria and sub-criteria

293
Years of experience
Mark only one oval.
1 to 5 years
5 to 10 years
More than 10 Years
Sector of experience
Mark only one oval.
Academics
Industrial
Booth
Others
Comparison between the main criteria
Pairwise comparison between the attributes of the main criteria with respect of effective quality management performance
Compare the relative importance between Strategic planning and (measurement & evaluation) with respect to the main target "integrated quality management performance" Strategic planning means; Is the strategic drivers that are required to success the implementation process and to achieve the organisation objectives. *
Mark only one oval.
. 9 Strategic planning is extremely more important than Measurement and evaluation
7 Strategic planning is very strongly more important than Measurement and evaluation
5 Strategic planning is strongly more important than Measurement and evaluation
3 Strategic planning is moderately more important than Measurement and evaluation
1 Strategic planning and (Measurement & evaluation) are equal important
3 Measurement and evaluation is moderately more important than Strategic planning
5 Measurement and evaluation is strongly more important than Strategic planning
7 Measurement and evaluation is very strongly more important than Strategic planning

294
9 Measurement and evaluation is extremely more important than strategic planning
Compare the relative importance between Strategic planning and (Analysis & activation) with respect to the main target "integrated quality management performance" *
Mark only one oval.
9 Strategic planning is extremely more important than Analysis and activation
7 Strategic planning is very strongly more important than Analysis and activation
5 Strategic planning is strongly more important than Analysis and activation
3 Strategic planning is moderately more important than Analysis and activation
1 Strategic planning and (Analysis & activation) are equal important
3 Analysis and activation is moderately more important than Strategic planning
5 Analysis and activation is strongly more important than Strategic planning
7 Analysis and activation is very strongly more important than Strategic planning
9 Analysis and activation is extremely more important than Strategic planning
Compare the relative importance between Strategic planning and (Improvement & monitoring) with respect to the main target "integrated quality management performance" *
Mark only one oval.
9 Strategic planning is extremely more important than Improvement and monitoring
7 Strategic planning is very strongly more important than Improvement and monitoring
5 Strategic planning is strongly more important than Improvement and monitoring
3 Strategic planning is moderately more important than Improvement and monitoring
1 Strategic planning and (Improvement & monitoring) are equal important
3 Improvement and monitoring are moderately more important than Strategic planning
5 Improvement and monitoring are strongly more important than Strategic planning

295
7 Improvement and monitoring are very strongly more important than Strategic planning
9 Improvement and Monitoring are extremely more important than Strategic planning
Compare the relative importance between Strategic planning and (Verification & continuous improvement) with respect to the main target "integrated quality management performance" *
Mark only one oval.
9 Strategic planning is extremely more important than Verification and continuous
improvement
7 Strategic planning is very strongly more important than Verification and continuous
improvement
5 Strategic planning is strongly important than verification and continuous improvement
3 Strategic planning is moderately more important than Verification and continuous
improvement
1 Strategic planning and (Verification & continuous improvement) are equal important
3 Verification and continuous improvement is moderately more important than Strategic
planning
5 Verification and continuous improvement is Strongly more important than Strategic
planning
7 Verification and continuous improvement is very strongly more important than
Strategic planning
9 Verification and continuous improvement is extremely more important than Strategic
planning
Compare the relative importance between the (Measurement & evaluation) and (Analysis & activation) with respect to the main target "integrated quality management performance" Measurement and Evaluation means; is the key measures that are required to evaluate the current performance and to enhance the work environment *
Mark only one oval.
9 (Measurement & evaluation) is extremely more important than (Analysis and
activation)
7 (Measurement & evaluation) is very strongly more important than (Analysis &
activation)

296
5 (Measurement & evaluation) is strongly more important than (Analysis & activation)
3 (Measurement & evaluation) is moderately more important than ( Analysis &
activation)
1 (Measurement & evaluation) and (Analysis & activation) are equal important
3 (Analysis & evaluation) is moderately more important the ( Measurement & activation)
5 (Analysis & evaluation) is strongly more important than (Measurement & activation)
7 (Analysis & evaluation) is very strongly more important than (Measurement &
activation)
9 (Analysis & evaluation) is extremely more important than (Measurement &activation)
Compare the relative importance between (Measurement & evaluation) and (Improvement & monitoring) with respect to the main target "integrated quality management performance" *
Mark only one oval.
9 (Measurement &evaluation) is extremely more important than the (Improvement &
monitoring)
7 ( Measurement & evaluation) is very strongly more important than (Improvement &
monitoring)
5 ( Measurement& evaluation) is strongly more important than (Improvement &
monitoring)
3 (Measurement & evaluation) is moderately more important than (improvement
&monitoring)
1 (Measurement & evaluation) and (Improvement &monitoring ) are equal important
3 (Improvement & monitoring) is moderately more important than ( Measurement &
evaluation)
5 (Improvement & monitoring) is strongly more important than (Measurement
&evaluation)
7 (Improvement & monitoring) is very strongly more important than (Measurement
&evaluation)
9 (Improvement & monitoring) is extremely more important than (Measurement
&evaluation)
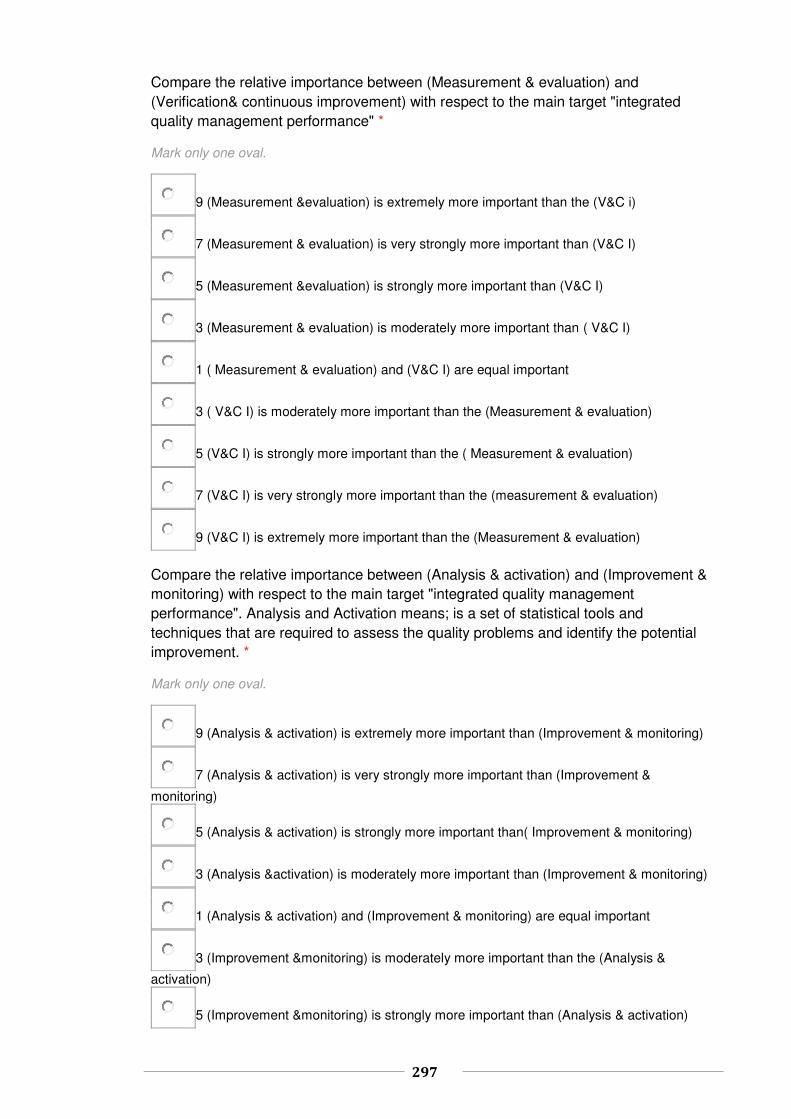
297
Compare the relative importance between (Measurement & evaluation) and (Verification& continuous improvement) with respect to the main target "integrated quality management performance" *
Mark only one oval.
9 (Measurement &evaluation) is extremely more important than the (V&C i)
7 (Measurement & evaluation) is very strongly more important than (V&C I)
5 (Measurement &evaluation) is strongly more important than (V&C I)
3 (Measurement & evaluation) is moderately more important than ( V&C I)
1 ( Measurement & evaluation) and (V&C I) are equal important
3 ( V&C I) is moderately more important than the (Measurement & evaluation)
5 (V&C I) is strongly more important than the ( Measurement & evaluation)
7 (V&C I) is very strongly more important than the (measurement & evaluation)
9 (V&C I) is extremely more important than the (Measurement & evaluation)
Compare the relative importance between (Analysis & activation) and (Improvement & monitoring) with respect to the main target "integrated quality management performance". Analysis and Activation means; is a set of statistical tools and techniques that are required to assess the quality problems and identify the potential improvement. *
Mark only one oval.
9 (Analysis & activation) is extremely more important than (Improvement & monitoring)
7 (Analysis & activation) is very strongly more important than (Improvement &
monitoring)
5 (Analysis & activation) is strongly more important than( Improvement & monitoring)
3 (Analysis &activation) is moderately more important than (Improvement & monitoring)
1 (Analysis & activation) and (Improvement & monitoring) are equal important
3 (Improvement &monitoring) is moderately more important than the (Analysis &
activation)
5 (Improvement &monitoring) is strongly more important than (Analysis & activation)

298
7 (Improvement & monitoring) is very strongly more important than the (Analysis &
activation)
9 (Improvement & monitoring) is extremely more important than the (Analysis &
activation)
Compare the relative importance between (Analysis & activation) and
(Verification& continuous improvement) with respect to the main target "integrated quality management performance" *
Mark only one oval.
9 (Analysis & activation) is extremely more important than the (V&C I)
7 (Analysis & activation) is very strongly more important than the (V&C I)
5 (Analysis & activation) is strongly more important than the (V&C I)
3 (Analysis & activation) is moderately more important than the (V&C I)
1 (Analysis & activation) and (V&C I) are equal important
3 (V&C I) is moderately more important than the (Analysis & activation)
5 (V&C I) is strongly more important than the (Analysis & activation)
7 ((V&C I) is very strongly more important than the (Analysis & activation)
9(V&C I) is extremely more important than the (Analysis & activation
Compare the relative importance between (Improvement & monitoring) and (Verification& continuous improvement) with respect to achieve the main target "integrated quality management" performance. Improvement and monitoring mean; is the key quality tools that are required to implement the improvement plan and monitoring the operating performance. *
Mark only one oval.
9 (Improvement & monitoring) is extremely more important than (V&C I)
7 (Improvement & monitoring) is very strongly more important than (V&C I)
5 (Improvement & monitoring) is strongly more important than the (V&C I)
3 (Improvement & monitoring) is moderately more important than (V&C I)

299
1(improvement& monitoring ) and (V&C I) are equal important
3 (V&C I) is moderately more important than (Improvement & monitoring)
5 (V&C I) is strongly more important than (Improvement & monitoring)
7 (V&C I) is very strongly more important than the (Improvement & monitoring)
9 (V&C I) is extremely more important than the (Improvement & monitoring)
Skip to question 13. 1. Comparison between the associated sub criteria of strategic planning with respect to Strategic Planning Sub-criteria are the critical success factors that are enable the main criteria to achieve the model goal.
The associated criteria with Strategic planning are; (Organisational structure, Focus on customer, linking to supplier and Training and education)
Compare the relative importance between Organisation structure and focusing on customer with respect to Strategic planning *
Mark only one oval.
9 Organisation structure is extremely more important than focusing on customer
7 Organisation structure is very strongly more important than focusing on customer
5 Organisation structure is strong more important than focusing on customer
3 Organisation structure is moderately more important than focusing on customer
1Organisation structure and focusing on customer are equal important
3 Focusing on customer is moderately more important than organisation structure
5 Focusing on customer is strongly more important than organisation structure
7 Focusing on customer is very strongly more important than organisation structure
9 Focusing on customer is extremely more important than organisation structure
Compare the relative importance between Organisation structure and Linking to supplier with respect to Strategic planning *
Mark only one oval.
9 Organisation structure is extremely more important than Linking to supplier

300
7 Organisation structure is very strongly more important than linking to supplier
5 Organisation structure is strongly more important than linking to supplier
3 Organisation structure is moderately more important than linking to supplier
1 Organisation structure and linking to supplier are equal important
3 Linking to supplier is moderately more important than Organisation structure
5 Linking to supplier is strongly more important than organisation structure
7 Linking to supplier is very strongly important than organisation structure
9 Linking to supplier is extremely more important than organisation structure
Compare the relative importance between Organisation structure and Training and education with respect to Strategic planning * Mark only one oval.
9 Organisation structure is extremely more important than training and education
7 Organisation structure is very strongly more important than training and education
5 Organisation structure is strongly more important than training and education
3 Organisation structure is moderately more important than training and education
1 organisation structure and (training & education) are equal important
3 Training and education are moderately more important than organisation structure
5 Training and education are strongly more important than organisation structure
7 Training and education are very strongly more important than organisation structure
9 Training and education are extremely more important than organisation structure
Compare the relative importance between focusing on customer and Linking to supplier with respect to Strategic planning * Mark only one oval.
9 Focusing on customer is extremely more important than linking to supplier
7 Focusing on customer is very strongly more important than linking to supplier

301
5 Focusing on customer is strongly more important than linking to supplier
3 Focusing on customer is moderately more important than linking to supplier
1 Focusing on customer and linking to supplier are equal important
3 Linking to supplier is moderately more important than focusing on customer
5 Linking to supplier is strongly more important than focusing on customer
7 Linking to supplier is very strongly more important than focusing on customer
9 Linking to supplier is extremely more important than focusing on customer
Compare the relative importance between Focusing on customer and Training and education with respect to Strategic planning * Mark only one oval.
9 Focusing on customer is extremely more important than training and education
7 Focusing on customer is very strongly more important than training and education
5 Focusing on customer is strongly more important than training and education
3 Focusing on customer is moderately more important than training and education
1 Focusing on customer and (Training & education) are equal important
3 Training and education are moderately more important than focusing on customer
5 Training and education are strongly more important than focusing on customer
7 Training and education are very strongly more important than focusing on customer
9 Training and education are extremely more important than focusing on customer
Compare the relative importance between Linking to supplier and Training and education with respect to Strategic planning * Mark only one oval.
9 Linking to supplier is extremely more important than training and education
7 Linking to supplier is very strongly more important than training and education
5 Linking to supplier is strongly more important than training and education

302
3 Linking to supplier is moderately more important than training and education
1 Linking to supplier and (training & education) are equal important
3 Training and education are moderately more important than linking to supplier
5 Training and education are strongly more important than linking to supplier
7 Training and education are very strongly more important than linking to supplier
9 Training and education are extremely more important than linking to supplier
2. Comparison between the associated sub-criteria of Measurement and evaluation with respect to Measurement and evaluation. Compare the relative importance between Leadership support and middle management involvement with respect to Measurement and evaluation. * Mark only one oval.
9Leadrership support is extremely more important than Middle management
involvement
7 Leadership support is very strongly more important than middle management
involvement
5 Leadership support is strongly more important than middle management involvement
3 Leadership support is moderately more important than middle management
involvement
1 Leadership support and middle management involvement ar equal important
3 Middle management involvement is moderately more important than leadership
support
5 Middle management involvement is strongly more important than leadership support
7 Middle management involvement is very strongly more important than
9 Middle management involvement is extremely more important than leadership support
Compare the relative importance between Leadership support and effective communication with respect to measurement and evaluation. * Mark only one oval.
9 Leadership is extremely more important than effective communication
7 Leadership is very strongly more important than effective communication

303
5 Leadership is strongly more important than effective communication
3 Leadership is moderately more important than effective communication
1 Leadership and effective communication are equal important
3 Effective communication is moderately more important than leadership
5 Effective communication is strongly more important than leadership
7 Effective communication is very strongly more important than leadership
9 Effective communication is extremely more important than leadership
Compare the relative importance between Leadership support and quality commitment with respect to measurement and evaluation. * Mark only one oval.
9 Leadership support is extremely more important than quality commitment
7 Leadership support is very strongly more important than quality commitment
5 Leadership support is strongly more important than quality commitment
3 Leadership support is moderately more important than quality commitment
1 Leadership support and Quality commitment are equal important
3 Quality commitment is moderately more important than leadership support
5 Quality commitment is strongly more important than leadership support
7 Quality commitment is very strongly more important than leadership support
9 Quality commitment is extremely more important than Leadership support
Compare the relative importance between Leadership support and Reviewing & tracking performance (R & T P) with respect to measurement and evaluation. * Mark only one oval.
9 Leadership support is extremely more important than (R & T P)
7 Leadership support is very strongly more important than (R & T P)
5 Leadership support is strongly more important than (R & T P)
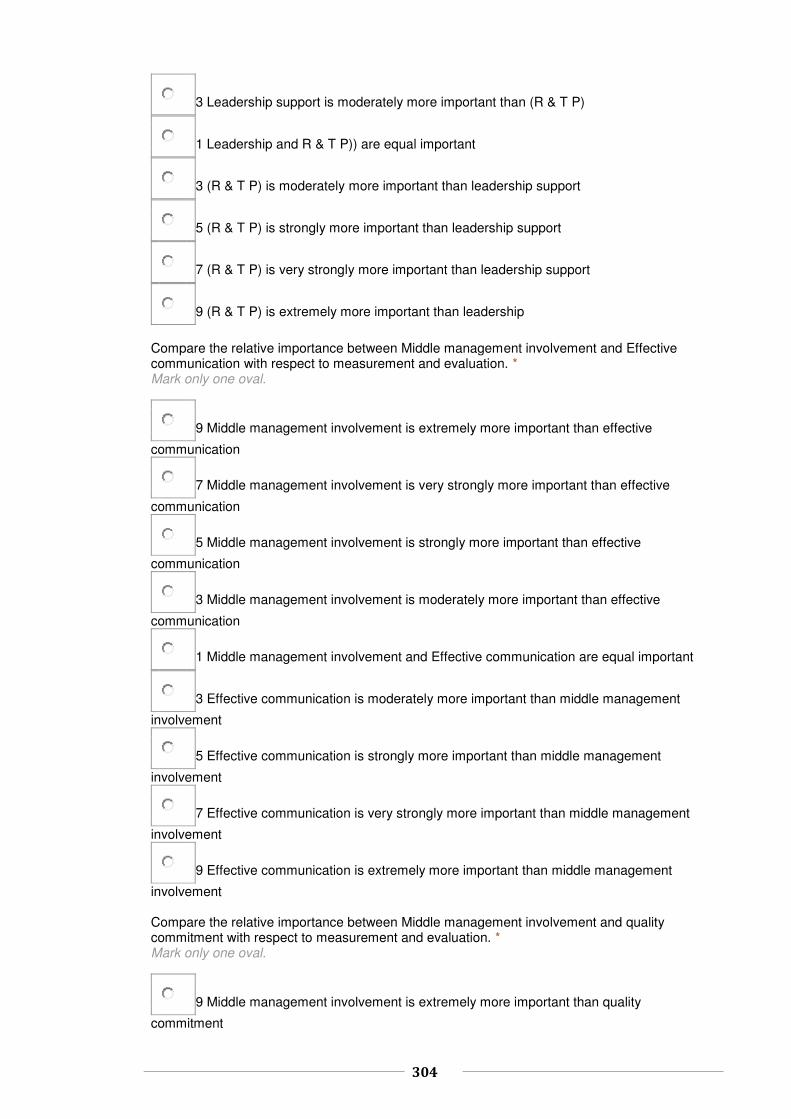
304
3 Leadership support is moderately more important than (R & T P)
1 Leadership and R & T P)) are equal important
3 (R & T P) is moderately more important than leadership support
5 (R & T P) is strongly more important than leadership support
7 (R & T P) is very strongly more important than leadership support
9 (R & T P) is extremely more important than leadership
Compare the relative importance between Middle management involvement and Effective communication with respect to measurement and evaluation. * Mark only one oval.
9 Middle management involvement is extremely more important than effective
communication
7 Middle management involvement is very strongly more important than effective
communication
5 Middle management involvement is strongly more important than effective
communication
3 Middle management involvement is moderately more important than effective
communication
1 Middle management involvement and Effective communication are equal important
3 Effective communication is moderately more important than middle management
involvement
5 Effective communication is strongly more important than middle management
involvement
7 Effective communication is very strongly more important than middle management
involvement
9 Effective communication is extremely more important than middle management
involvement Compare the relative importance between Middle management involvement and quality commitment with respect to measurement and evaluation. * Mark only one oval.
9 Middle management involvement is extremely more important than quality
commitment

305
7 middle management involvement is very strongly more important than quality
commitment
5 Middle management involvement is strongly more important than quality commitment
3 Middle management involvements is moderately more important than quality
commitment
1 Middle management involvement and quality commitment are equal important
3 Quality commitments is moderately more important than middle management
involvement
5 Quality commitments is strongly more important than middle management involvement
7 Quality commitments is very strongly more important than middle management
involvement
9 Quality commitments is extremely more important than middle management
involvement Compare the relative importance between Middle management involvement and Review & Tracking Performance (R & T P) with respect to measurement and evaluation. * Mark only one oval.
9 Middle management involvements is extremely more important than (R &T P)
7 Middle management involvements is very strongly more important than (R &T P)
5 Middle management involvements is strongly more important than (R & T P)
3 Middle management involvements is moderately more important than (R & T P)
1 Middle management involvement and (R & T P) are equal important
3 (R & T P) is moderately more important than Middle management involvement
5 (R & T P) is strongly more important than middle management involvement
7 (R & T P) is very strongly more important than middle management involvement
9 (R &T P) is extremely more important than middle management involvement
Compare the relative importance between Effective communication and quality commitment with respect to measurement and evaluation. * Mark only one oval.

306
9 Effective communications is extremely more important than quality commitment
7 Effective communications is very strongly more important than quality commitment
5 effective communications is strongly more important than quality commitment
3 Effective communications is strongly more important than quality commitment
1 Effective communication and quality commitment are equal important
3 Quality commitments is moderately more important than effective communication
5 Quality commitments is strongly more important than effective communication
7 Quality commitments is very strongly more important than effective communication
9 Quality commitments is extremely more important than effective communication
Compare the relative importance between Effective communication and Review & Tracking Performance (R & T P) with respect to measurement and evaluation. * Mark only one oval.
9 Effective communications is extremely more important than (R & T P)
7 Effective communications is very strongly more important than (R & T P)
5 Effective communications is strongly more important than (R & T P)
3 Effective communications is moderately more important than (R & T P)
1 Effective communication and (R & T P) are equal important
3 (R & T P) is moderately more important than effective communication
5 (R & T P) is strongly more important than effective communication
7 (R & T P) is very strongly more important than effective communication
9 (R & T P) is extremely more important than effective communication
Compare the relative importance between Quality commitment and Review & Tracking Performance (R & T P) with respect to measurement and evaluation. * Mark only one oval.
9 Quality commitment is extremely more important than (R & T P)
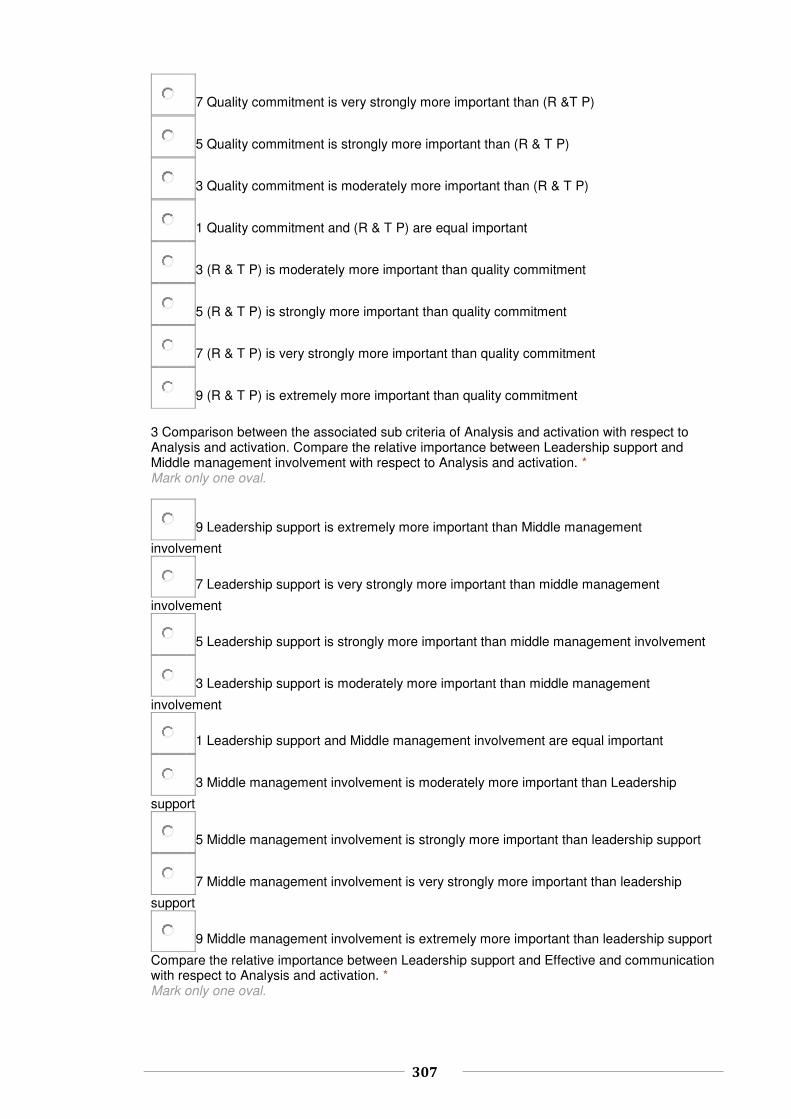
307
7 Quality commitment is very strongly more important than (R &T P)
5 Quality commitment is strongly more important than (R & T P)
3 Quality commitment is moderately more important than (R & T P)
1 Quality commitment and (R & T P) are equal important
3 (R & T P) is moderately more important than quality commitment
5 (R & T P) is strongly more important than quality commitment
7 (R & T P) is very strongly more important than quality commitment
9 (R & T P) is extremely more important than quality commitment
3 Comparison between the associated sub criteria of Analysis and activation with respect to Analysis and activation. Compare the relative importance between Leadership support and Middle management involvement with respect to Analysis and activation. * Mark only one oval.
9 Leadership support is extremely more important than Middle management
involvement
7 Leadership support is very strongly more important than middle management
involvement
5 Leadership support is strongly more important than middle management involvement
3 Leadership support is moderately more important than middle management
involvement
1 Leadership support and Middle management involvement are equal important
3 Middle management involvement is moderately more important than Leadership
support
5 Middle management involvement is strongly more important than leadership support
7 Middle management involvement is very strongly more important than leadership
support
9 Middle management involvement is extremely more important than leadership support
Compare the relative importance between Leadership support and Effective and communication with respect to Analysis and activation. * Mark only one oval.

308
9 Leadership support is extremely more important than effective communication
7 Leadership support is very strongly more important than effective communication
5 Leadership support is strongly more important than effective communication
3 Leadership support is moderately more important than effective communication
1 Leadership support and effective and communication are equal important
3 Effective communication is moderately more important than leadership support
5 Effective communication is strongly more important than leadership support
7 Effective communication is very strongly more important than leadership support
9 Effective communication is extremely more important than leadership support
Compare the relative importance between Leadership support and Quality commitment with respect to Analysis and activation. * Mark only one oval.
9 Leadership support is extremely more important than quality commitment
7 Leadership support is very strongly more important than quality commitment
5 Leadership support is strongly more important than quality commitment
3 Leadership support is moderately more important than quality commitment
1 Leadership support and quality commitment are equal important
3 Quality commitment is moderately more important than leadership support
5 Quality commitment is strongly more important than leadership support
7 Quality commitment is very strongly more important than leadership support
9 Quality commitment is extremely more important than leadership support
Compare the relative importance between Leadership support and Review & Tracking Performance (R & T P) with respect to Analysis and activation. * Mark only one oval.
9 Leadership support is extremely more important than (R & T P)

309
7 Leadership support is very strongly more important than (R & T P)
5 Leadership support is strongly more important than (R & T P)
3 Leadership support is moderately more important than (R & T P)
1 Leadership support and (R & T P) are equal important
3 (R & T P) is moderately more important than Leadership support
5 (R & T P) is strongly more important than leadership support
7 (R & T P) is very strongly more important than leadership support
9 (R & T P) is extremely more important than leadership support
Compare the relative importance between Middle management involvement and Effective communication with respect to Analysis and activation. * Mark only one oval.
9 Middle management involvement is extremely more important than effective
communication
7 Middle management involvement is very strongly more important than effective
communication
5 Middle management involvement is strongly more important than effective
communication
3 Middle management involvement is moderately more important than effective
communication
1 Middle management involvement and effective communication are equal important
3 Effective communication is moderately more important than middle management
involvement
5 Effective communication is strongly more important than middle management
involvement
7 Effective communication is very strongly more important than middle management
involvement
9 Effective communication is extremely more important than middle management
involvement Compare the relative importance between Middle management involvement and Quality commitment with respect to Analysis and activation. *

310
Mark only one oval.
9 Middle management involvement is extremely more important than quality
commitment
7 Middle management involvement is very strongly more important than quality
commitment
5 Middle management involvement is strongly more important than quality commitment
3 Middle management involvement is moderately more important than quality
commitment
1 Middle management involvement and quality commitment are equal important
3 Quality commitment is moderately more important than middle management
involvement
5 Quality commitment is strongly more important than middle management involvement
7 Quality commitment is very strongly more important than middle management
involvement
9 Quality commitment is extremely more important than middle management
involvement
Compare the relative importance between Middle management involvement and Review & Tracking Performance (R & T P) with respect to Analysis and activation. * Mark only one oval.
9 Middle management involvement is extremely more important than (R & T P)
7 Middle management involvement is very strongly important than (R & T P)
5 Middle management involvement is strongly more important than (R & T P)
3 Middle management involvement is moderately more important than (R & T P)
1 Middle management involvement and (R & T P) are equal important
3 (R & T P) is moderately more important than Middle management involvement
5 (R & T P) is strongly more important than Middle management involvement
7 (R & T P) is very strongly more important than middle management involvement
9 (R & T P) is extremely more important than middle management involvement
311
Compare the relative importance between Effective communication and Quality commitment with respect to Analysis and activation. * Mark only one oval.
9 Effective communication is extremely more important than quality commitment
7 Effective communication is very strongly more important than quality commitment
5 Effective communication is strongly more important than quality commitment
3 Effective communication is moderately more important than quality commitment
1 Effective communication and quality commitment are equal important
3 Quality commitment is moderately more important than effective communication
5 Quality commitment is strongly more important than effective communication
7 Quality commitment is very strongly more important than effective communication
9 Quality commitment is extremely more important than effective communication
Compare the relative importance between Effective communication and Review & Tracking Performance (R & T P) with respect to Analysis and activation. * Mark only one oval.
9 Effective communication is extremely more important than (R & T P)
7 Effective communication is very strongly more important than (R & T P)
5 Effective communication is strongly more important than (R & T P)
3 Effective communication is moderately more important than (R & T P)
1 Effective communication and (R & T P) are equal important
3 (R & T P) is moderately more important than effective communication
5 ( R & T P) is strongly more important than effective communication
7 (R & T P) is very strongly more important than effective communication
9 (R & T P) is extremely more important than effective communication
Compare the relative importance between Quality commitment and Review & Tracking Performance (R & T P) with respect to Analysis and activation. * Mark only one oval.

312
9 Quality commitment is extremely more important than (R & T P)
7 Quality commitment is very strongly more important than (R & T P)
5 Quality commitment is strongly more important than (R & T P)
3 Quality commitment is moderately more important than (R & T P)
1 Quality commitment and (R & T P) are equal important
3 (R & T P) is moderately more important than quality commitment
5 (R & T P) is strongly more important than quality commitment
7 (R & T P) is very strongly more important than quality commitment
9 (R & T P) is extremely more important than quality commitment
4 Comparison between the associated sub criteria of Improvement and monitoring with respect to Improvement and monitoring. Compare the relative importance between Leadership support and Middle management involvement with respect to Improvement and monitoring. * Mark only one oval.
9 Leader ship support is extremely more important than Middle management
involvement
7 Leadership support is very strongly more important than middle management
involvement
5 Leadership support is strongly more important than middle management involvement
3 leadership support id moderately more important than middle management
involvement
1 Leadership support and middle management involvement are equal important
3 Middle management involvement is moderately more important than Leadership
support
5 Middle management involvement is strongly more important than leadership support
7 Middle management involvement is very strongly more important than leadership
support
9 Middle management involvement is extremely more important than leadership support
Compare the relative importance between Leadership support and Effective communication with respect to Improvement and monitoring. *
313
Mark only one oval.
9 Leadership support is extremely more important than effective communication
7 Leadership support is very strongly more important than effective communication
5 Leadership support is strongly more important than effective communication
3 Leadership support is moderately more important than effective communication
1 Leadership support and effective communication are equal important
3 Effective communication is moderately more important than leadership support
5 Effective communication is strongly more important than leadership support
7 Effective communication is very strongly more important than leadership support
9 Effective communication is extremely more important than leadership support
Compare the relative importance between Leadership support and Quality commitment with respect to Improvement and monitoring. * Mark only one oval.
9 Leadership support is extremely more important than quality commitment
7 Leadership support is very strongly more important than quality commitment
5 Leadership support is strongly more important than quality commitment
3 Leadership support is moderately more important than quality commitment
1 Leadership support and quality commitment are equal important
3 Quality commitment is moderately more important than leadership support
5 Quality commitment is strongly more important than leadership support
7 Quality commitment is very strongly more important than leadership support
9 Quality commitment is extremely more important than leadership support
Compare the relative importance between Leadership support and Review & Tracking Performance (R & T P) with respect to Improvement and monitoring * Mark only one oval.

314
9 Leadership support is extremely more important than (R & T P)
7 Leadership support is very strongly more important than (R & T P)
5 Leadership support is strongly more important than (R & T P)
3 Leadership support is moderately more important than (R & T P)
1 Leadership support and (R & T P) are equal important
3 (R & T P) is moderately more important than leadership support
5 (R & T P) is strongly more important than leadership support
7 (R & T P) is very strongly more important than leadership support
9 (R & T P) is extremely more important than leadership support
Compare the relative importance between Middle management involvement and effective communication with respect to Improvement and monitoring. * Mark only one oval.
9 Middle management involvement is extremely more important than effective
communication
7 Middle management involvement is very strongly more important than effective
communication
5 Middle management involvement is strongly more important than effective
communication
3 Middle management involvement is moderately more important than effective
communication
1 Middle management involvement and effective communication are equal important
3 Effective communication is moderately more important than middle management
involvement
5 Effective communication is strongly more important than middle management
involvement
7 Effective communication is very strongly more important than middle management
involvement
9 Effective communication is extremely more important than middle management
involvement
315
Compare the relative importance between Middle management involvement and Quality commitment with respect to Improvement and monitoring. * Mark only one oval.
9 Middle management involvement is extremely more important than quality
commitment
7 Middle management involvement is very strongly more important than quality
commitment
5 Middle management involvement is strongly more important than quality commitment
3 Middle management involvement is moderately more important than quality
commitment
1 Middle management involvement and quality commitment are equal important
3 Quality commitment is moderately more important than middle management
involvement
5 Quality commitment is strongly more important than middle management involvement
7 Quality commitment is very strongly more important than middle management
involvement
9 Quality commitment is extremely more important than middle management
involvement Compare the relative importance between Middle management involvement and Review & Tracking Performance (R & T P) with respect to Improvement and monitoring. * Mark only one oval.
9 Middle management involvement is extremely more important than (R & T P)
7 Middle management involvement is very strongly more important than (R & T P)
5 Middle management involvement is strongly more important than (R & T P)
3 Middle management involvement is moderately more important than (R & T P)
1 Middle management involvement and (R & T P) are equal important
3 (R & T P) is moderately more important than middle management involvement
5 (R & T P) is strongly more important than middle management involvement
7 (R& T P) is very strongly more important than middle management involvement

316
9 (R & T P) is extremely more important than middle management involvement
Compare the relative importance between Effective communication and Quality Commitment with respect to Improvement and monitoring. * Mark only one oval.
9 Effective communication is extremely more important than quality commitment
7 Effective communication is very strongly more important than quality commitment
5 Effective communication is strongly more important than quality commitment
3 Effective communication is moderately more important than quality commitment
1 Effective communication and quality commitment are equal important
3 Quality commitment is moderately more important than effective communication
5 Quality commitment is strongly more important than effective communication
7 Quality commitment is very strongly more important than effective communication
9 Quality commitment is extremely more important than effective communication
Compare the relative importance between Effective communication and Review & Tracking Performance (R & T P) with respect to Improvement and monitoring. * Mark only one oval.
9 Effective communication is extremely more important than (R & T P)
7 Effective communication is very strongly more important than (R & T P)
5 Effective communication is strongly more important than (R & T P)
3 Effective communication is moderately more important than (R & T P)
1 Effective communication and (R & T P) are equal important
3 (R & T P) is moderately more important than effective communication
5 (R &T P) is very strongly more important than effective communication
7 (R & T P) is very strongly more important than effective communication
9 (R & T P) is extremely more important than effective communication

317
Compare the relative importance between Quality commitment and Review & Tracking Performance (R & T P) with respect to Improvement and monitoring. * Mark only one oval.
9 Quality commitment is extremely more important than (R & T P)
7 Quality commitment is very strongly more important than (R & T P)
5 Quality commitment is strongly more important than (R & T P)
3 Quality commitment is moderately more important than ( R & T P)
1 Quality commitment and (R & T P) are equal important
3 (R & T P) is moderately more important than quality commitment
5 (R & T P) is strongly more important than quality commitment
7 (R & T P) is very strongly more important than quality commitment
9 (R & T P) is extremely more important than quality commitment
5 Comparison between the associated-sub criteria of Verification and continues improvement with respect to Verification and continues improvement. Compare the relative importance between Leadership support and Middle management involvement with respect to Verification and continues improvement. * Mark only one oval.
9 Leadership support is extremely more important than middle management
involvement
7 Leadership support is very strongly more important than middle management
involvement
5 Leadership support is strongly more important than middle management involvement
3 Leadership support is moderately more important than middle management
involvement
1 Leadership support and middle management involvement are equal important
3 Middle management involvement is moderately more important than Leadership
support
5 Middle management involvement is strongly more important than leadership support
7 Middle management involvement is very strongly more important than leadership
support

318
9 Middle management involvement is extremely more important than leadership support
Compare the relative importance between Leadership support and Effective communication with respect to Verification and continues improvement. * Mark only one oval.
9 Leadership support is extremely more important than effective communication
7 Leadership support is very strongly more important than effective communication
5 Leadership support is strongly more important than effective communication
3 Leadership support is moderately more important than effective communication
1 Leadership support and effective communication are equal important
3 Effective communication is moderately more important than leadership support
5 Effective communication is strongly more important than leadership support
7 Effective communication is very strongly more important than leadership support
9 Effective communication is extremely more important than leadership support
Compare the relative importance between Leadership support and quality commitment with respect to Verification and continues improvement . * Mark only one oval.
9 Leadership support is extremely more important than quality commitment
7 Leadership support is very strongly more important than quality commitment
5 Leadership support is strongly more important than quality commitment
3 Leadership support is moderately more important than quality commitment
1 Leadership support and quality commitment are equal important
3 Quality commitment is moderately more important than leadership support
5 Quality commitment is strongly more important than leadership support
7 Quality commitment is very strongly more important than leadership support
9 Quality commitment is extremely more important than leadership support

319
Compare the relative importance between Leadership support and Review & Tracking Performance (R & T P) with respect to Verification and continues improvement. * Mark only one oval.
9 Leadership support is extremely more important than (R & T P)
7 Leadership support is very strongly more important than (R & T P)
5 Leadership support is strongly more important than (R & T P)
3 Leadership support is moderately more important than (R & T P)
1 Leadership support and (R & T P) are equal important
3 (R & T P) is moderately more important than leadership support
5 (R & T P) is strongly more important than leadership support
7 (R & T P) is very strongly more important than leadership support
9 (R & T P) is extremely more important than leadership support
Compare the relative importance between Middle management involvement and effective communication with respect to Verifications and continuous improvement. * Mark only one oval.
9 Middle management involvement is extremely more important than effective
communication
7 Middle management involvement is very strongly more important than effective
communication
5 Middle management involvement is strongly more important than effective
communication
3 Middle management involvement is moderately more important than effective
communication
1 Middle management involvement and effective communication are equal important
3 Effective communication is moderately more important than middle management
involvement
5 Effective communication is strongly more important than middle management
involvement
7 Effective communication is very strongly more important than middle management
involvement

320
9 Effective communication is extremely more important than middle management
involvement Compare the relative importance between Middle management involvement and quality commitment with respect to Verification and continues improvement. *Mark only one oval.
9 Middle management involvement is extremely more important than quality
commitment
7 Middle management involvement is very strongly more important than quality
commitment
5 Middle management involvement is strongly more important than quality commitment
3 Middle management involvement is moderately more important than quality
commitment
1 Middle management involvement and quality commitment are equal important
3 Quality commitment is moderately more important than middle management
involvement
5 Quality commitment is strongly more important than middle management involvement
7 Quality commitment is very strongly more important than middle management
involvement
9 Quality commitment is extremely more important than middle management
involvement Compare the relative importance between Middle management involvement and Review & Tracking Performance (R & T P) with respect to Verification and continues improvement. * Mark only one oval.
9 Middle management involvement is extremely more important than (R & T P)
7 Middle management involvement is very strongly more important than (R & T P)
5 Middle management involvement is strongly more important than (R & T P)
3 Middle management involvement is moderately more important than (R & T P)
1 Middle management involvement and (R & T P) are equal important
3 (R & T P) is moderately more important than middle management involvement
5 (R & T P) is strongly more important than middle management involvement

321
7 (R & T P) is very strongly more important than middle management involvement
9 (R & T P) is extremely more important than middle management involvement
Compare the relative importance between Effective communication and Quality commitment with respect to Verification and continues improvement. * Mark only one oval.
9 Effective communication is extremely more important than quality commitment
7 Effective communication is very strongly more important than quality commitment
5 Effective communication is strongly more important than quality commitment
3 Effective communication is moderately more important than quality commitment
1 Effective communication and quality commitment are equal important
3 Quality commitment is moderately more important than effective communication
5 Quality commitment is strongly more important than effective communication
7 Quality commitment is very strongly more important than effective communication
9 Quality commitment is extremely more important than effective communication
Compare the relative importance between Effective communication and Review & Tracking Performance (R & T P) with respect to Verification and continues improvement. * Mark only one oval.
9 Effective communication is extremely more important than (R & T P)
7 Effective communication is very strongly more important than (R & T P)
5 Effective communication strongly more important than (R & T P)
3Effective communication is moderately more important than (R & T P)
1 Effective communication and (R & T P) are equal important
3 (R & T P) is moderately more important than effective communication
5 (R & T P) is strongly more important than effective communication
7 (R & T P) is very strongly more important than effective communication

322
9 (R & T P) is extremely more important than effective communication
Compare the relative importance between Quality commitment and Review & Tracking Performance (R & T P) with respect to Verification and continues improvement. * Mark only one oval.
9 Quality commitment is extremely more important than (R & T P)
7 Quality commitment is very strongly more important than (R & T P)
5 Quality commitment is Strongly more important than (R & T P)
3 Quality commitment is moderately more important than (R & T P)
1 Quality commitment and (R & T P) are equal important
3 (R & T P) is moderately more important than quality commitment
5 (R & T P) is strongly more important than quality commitment
7 (R & T P) is very strongly more important than quality commitment
9 (R & T P) is extremely more important than quality commitment
Respondent's comments Are there any more criteria and sub-criteria should have been considered and needed to included, please provide details? Are there any criteria or sub-criteria should have no value added and need to be deleted, please provide details?
Submit
Never submit passwords through Google Forms. Powered by

323
Appendix C
The rest of descriptive analysis of LSS integrated model
Figure. C-1. Type of quality management system of respondents organisations
Figure. C-2. Level of the awareness with LSS approach
Figure C-3. Attendance of Formal training in Lean or Six-Sigma
33.9%
5.4% 39.3%
21.4% TQM
Six-Sigma
ISO series
other
83.9%
16.1%
Yes No
14.3%
19.6%
33.9%
32.1%
Lean
Six-Sigma
Both
Non

324
Figure C-4. Duration of the formal training
Figure C-5. Role of respondents within lean or six-sigma organisation
Table C-1. Level of awareness with LSS Tools and techniques
NO Tool name Frequency Percentage (%)
Yes NO Yes No
1 5S 40 16 71.4 28.6 2 DMAIC 29 27 51.8 48.2 3 TPM 37 19 66.1 33.9 4 Causes and effect cart 37 19 66.1 33.9 5 Kanban. 29 27 51.8 48.2 6 SMED 18 38 32.1 67.9 7 VSM 27 29 48.2 51.8 8 Pareto Analysis 41 15 73.2 26.8 9 Brainstorming 44 12 78.6 21.4 10 SPC 35 21 62.5 37.5 11 DOE 29 27 51.8 48.2 12 Benchmarking 40 16 71.4 28.6 13 PDCA 40 16 71.4 28.6 14 Regression analysis 33 23 58.9 41.1 15 QFD 31 25 55.4 44.6 16 Kaizen events 25 31 44.6 55.4 17 ANOVA 23 33 41.1 58.9 18 Process Flowchart / Mapping 44 12 78.6 21.4 19 Process capability analysis Cp &;Cpk 29 27 51.8 48.2 20 PERT Chart 32 24 57.1 42.9 21 SIPOC 23 33 41.1 58.9 22 Force Field Analysis 14 42 25 75 23 Poka-Yoke 19 37 33.9 66.1 24 Run Charts 18 38 32.1 67.9 25 FMEA 28 28 50 50 26 Histogram 48 8 85.7 14.3 27 Project Charter 32 24 57.1 42.9
30.4%
16.1%
3.6% 3.6%
46.4%
≤ Years
3-5 Years
5-10 Years
› Years
Have no training
19.6%
5.4%
7.1% 7.1%
3.6% 3.6%
7.1% 5.4%
41.1%
Team member
Trainer
Practitioner
Yellow belt

325
Table C-2. The major problems facing quality system of Respondents
organisations
NO Quality problem Frequency Percent (%)
Capable Incapable Capable Incapable
1 Lack Cost driven and priorities 29 27 51.8 48.2 2 Track which quality efforts work
in a market place 31 25 55.4 44.6
3 Investment in training 23 33 41.1 58.9 4 Employee commitment 30 26 53.6 46.4 5 Defects 30 26 53.6 46.4 6 Decision Making Technique 29 27 51.8 48.2 7 Organising of documentation 30 26 53.6 46.6 8 Quality assurance Auditing 27 29 48.2 51.8 9 Inability to analyse how good the
processes are 24 32 42.9 57.1
10 Utilizing problem solving techniques
31 25 55.4 44.6
11 Risk analysis and Uncertainty 31 25 55.4 44.6
Table C-3. The potential motivations of adopting LSS approaches
NO LSS motivation Results of respondents in percentage %
Strongly disagree
Disagree Moderate Agree Strongly Agree
1 To meet the customer's requirements and needs.
8.9 1.8 5.4 35.7 42.2
2 To improve the organisation's productivity and overall efficiency.
7.1 3.6 1.8 33.9 53.6
3 To improve Organisation's profitability.
5.4 3.6 3.6 39.3 48.2
4 To achieved the organisation's objectives.
5.4 5.4 19.6 37.1 32.1
5 To follow industrial trends
7.1 12.5 25.0 37.5 17.9
6 To reduce production cost / service cost.
5.4 3.6 8.9 50.0 32.1
7 . To gain competitive advantage
5.4 10.7 3.6 37.5 42.9
8 To improve product quality and service.
7.1 5.4 3.6 28.6 55.4
9 To expand market share. 7.1 17.9 25.0 19.6 30.4 10 To gain and improve
customer's confidence in your product / service.
10.7 1.8 12.5 37.5 37.5
11 Enhance organisation's reputation
7.1 3.6 14.3 35.7 39.3
12 To attract more customers.
7.1 3.6 25.0 28.6 35.7
13 Develop management techniques.
7.1 3.6 13.1 42.9 30.4
14 To improve the organisation's productivity and overall efficiency.
7.1 3.6 1.8 33.9 53.6

326
Table C-4. The potential benefits that could be gunned by adopting LSS
NO Importance of LSS tools and techniques
Results in percent %
Very Less
Less Moderate Much Very much
1 Cultural Change 3.6 14.3 26.8 35.7 19.6 2 Improved customer satisfaction 3.6 3.6 19.6 33.9 39.3 3 Reducing defects and Rework. 1.8 3.6 7.1 46.4 41.1 4 Aware of quality among employees 1.8 5.4 10.7 46.4 35.7 5 Improved productivity 7.1 1.8 7.1 35.7 48.2 6 Enhancing competitive position 1.8 1.8 16.1 44.1 36.7 7 Increasing customer's confidence
and relations. 3.6 7.1 16.1 35.7 37.5
8 Reduced warranty claim cost. 8.9 3.6 28.6 42.9 16.1 9 Reduce Inventory 5.4 8.9 23.2 42.9 19.6 10 Improved sales. 1.8 7.1 16.1 58.9 16.1 11 Organised working environment. 3.6 1.8 16.1 41.1 37.5 12 Generate new business
opportunities 7.1 8.9 23.2 30.4 30.4
Table C-5.. Utilisation of LSS tools and applications
NO Tool name Results in percentage (%)
Never been used
Used only once
Moderate Used frequently
Used continuously
1 5S 46.4 1.8 12.5 30.4 8.9
2 Kanban 57.1 8.9 16.1 12.5 5.4
3 Pareto Analysis 37.5 7.1 17.9 17.9 19.6
4 Brainstorming. 25.0 7.1 10.7 32.1 25.0
5 VSM 46.4 8.9 16.1 19.6 8.9
6 PDCA 28.6 7.1 10.7 33.9 19.9
7 Cause and effect diagram
20.0 5.4 21.4 26.8 21.4
8 SPC 33.9 8.9 10.7 39.3 7.1
9 SMED 66.1 10.7 10.7 8.9 3.6
10 Benchmarking 30.4 8.9 21.4 32.1 7.1
11 Regression analysis 46.4 10.7 23.2 17.9 1.8
12 DOE 51.1 14.3 14.3 17.9 1.8
13 PERT 37.5 8.9 14.3 26.8 12.5
14 QFD 50.0 8.9 10.7 19.6 10.7
15 Force field Analysis 62.5 10.7 14.3 5.4 7.1
16 Poka-yoke 67.9 16.1 7.1 7.1 1.8
17 Kaizen events 66.1 8.9 12.5 7.1 5.4
18 Run charts 55.4 10.7 14.3 12.5 7.1
19 ANOV 62.5 7.1 19.6 7.1 3.6
20 FMEA 55.4 5.4 17.9 12.5 8.9
21 SIPOC 57.1 10.7 14.3 10.7 7.1
22 Process Flowchart / Mapping
28.6 7.1 19.6 30.4 14.3
23 Histogram 37.5 12.5 10.7 28.6 10.7
24 Project Charter 53.6 10.7 14.3 10.7 10.7
25 Process capability analysis Cp/ Cpk
44.6 7.1 19.6 17.6 10.7

327
Table C-6. Usefulness of LSS tools to respondents organisations
NO Tool name Results in percentage (%)
Not useful
Less useful
Moderate
Useful Very useful
1 5S 8.9 3.6 14.3 28.6 44.6 2 Kanban 14.3 7.1 25.0 26.8 26.8 3 Pareto Analysis 3.6 3.6 21.4 37.5 33.9 4 Brainstorming. 3.6 3.6 17.9 28.6 46.4 5 VSM 7.1 5.4 23.2 41.1 23.2 6 PDCA 7.1 5.4 19.6 28.6 39.3 7 Cause and effect diagram 3.6 5.4 23.2 21.4 46.4 8 SPC 3.6 8.9 25.2 37.5 28.6 9 SMED 7.1 8.9 42.9 19.6 21.4 10 Benchmarking 7.1 5.4 21.4 25.0 41.1 11 Regression analysis 5.4 7.1 35.7 30.4 21.4 12 DOE 7.1 14.3 32.1 32.2 23.2 13 PERT 7.1 7.1 35.7 30.4 19.6 14 QFD 7.1 10.7 28.6 30.4 23.2 15 Force field Analysis 8.9 8.9 41.1 21.4 19.6 16 Poka-yoke 16.1 8.9 35.7 23.2 16.1 17 Kaizen events 8.9 16.1 25.0 30.4 19.6 18 Run charts 5.4 10.7 33.9 25.0 25.0 19 ANOV 12.5 10.7 39.3 23.2 14.3 20 FMEA 5.4 10.7 17.9 33.9 25.0 21 SIPOC 8.9 12.5 25.0 28.6 25.0 22 Process Flowchart / Mapping 5.5 3.6 23.6 32.7 34.5 23 Histogram 5.5 14.5 16.4 32.7 30.9 24 Project Charter 5.4 17.9 21.4 30.4 25.0
Table C-7. Evaluation the contents of the proposed model
Frequency Percent Valid Percent Cumulative
Percent
Valid Strongly disagree 1 1.8 1.8 1.8
Disagree 1 1.8 1.8 3.6
Moderate 13 23.2 23.6 27.3
Agree 28 50.0 50.9 78.2
Strongly agree 12 21.4 21.8 100.0
Total 55 98.2 100.0 Missing System 1 1.8 Total 56 100.0

328
Table C-8. Evaluation The suitability of the proposed LSS model for
manufacturing organisations
Table C-9. Evaluation Ability of the proposed model to boost
competitiveness and profit
Frequency Percent Valid Percent Cumulative
Percent
Valid Strongly Disagree 1 1.8 1.8 1.8
Disagree 2 3.6 3.6 5.4
Moderate 11 19.6 19.6 25.0
agree 28 50.0 50.0 75.0
Strongly Agree 14 25.0 25.0 100.0
Total 56 100.0 100.0
Frequency Percent Valid Percent Cumulative
Percent
Valid Strongly Disagree 1 1.8 1.8 1.8
Disagree 2 3.6 3.6 5.4
Moderate 14 25.0 25.0 30.4
agree 17 30.4 30.4 60.7
Strongly Agree 22 39.3 39.3 100.0
Total 56 100.0 100.0
Table C-10. Evaluation the ability of the model to overcome the
complexity of LSS implementation
Frequency Percent Valid Percent Cumulative
Percent
Valid Strongly Disagree 1 1.8 1.8 1.8
Disagree 2 3.6 3.6 5.4
Moderate 11 19.6 19.6 25.0
agree 28 50.0 50.0 75.0
Strongly Agree 14 25.0 25.0 100.0
Total 56 100.0 100.0
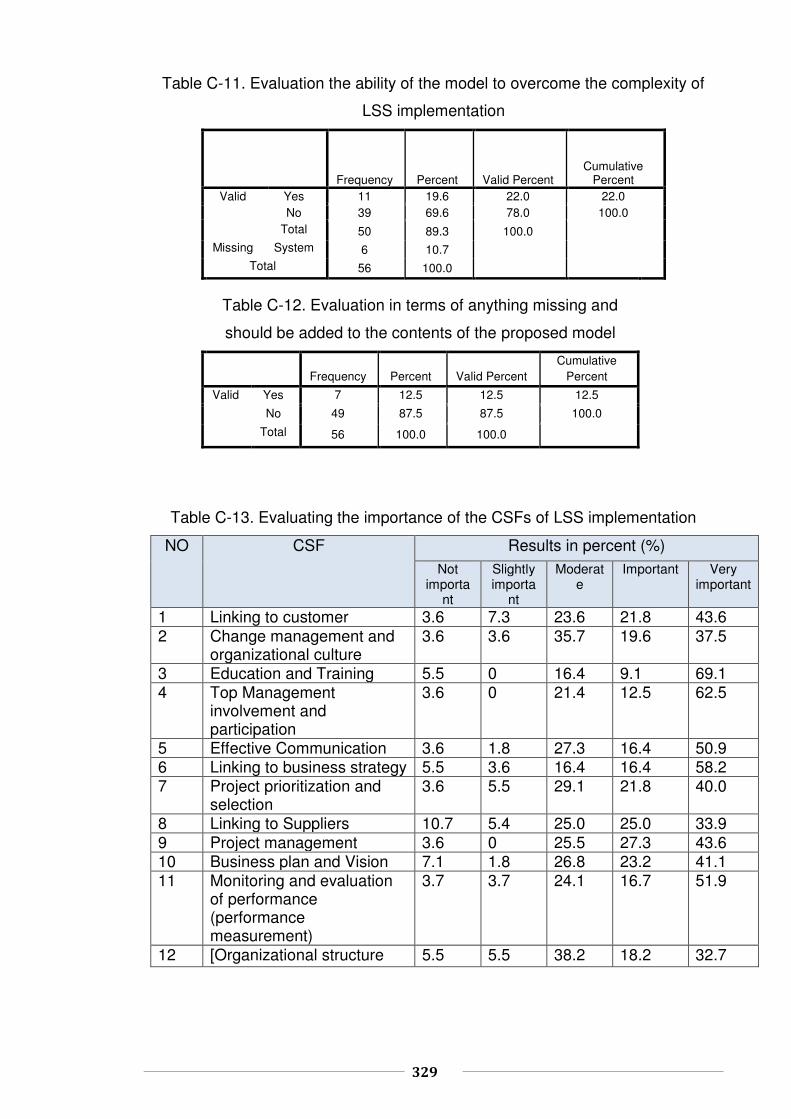
329
Table C-11. Evaluation the ability of the model to overcome the complexity of
LSS implementation
Frequency Percent Valid Percent
Cumulative Percent
Valid Yes 11 19.6 22.0 22.0 No 39 69.6 78.0 100.0
Total 50 89.3 100.0 Missing System 6 10.7
Total 56 100.0
Table C-12. Evaluation in terms of anything missing and
should be added to the contents of the proposed model
Frequency Percent Valid Percent Cumulative
Percent
Valid Yes 7 12.5 12.5 12.5
No 49 87.5 87.5 100.0
Total 56 100.0 100.0
Table C-13. Evaluating the importance of the CSFs of LSS implementation
NO CSF Results in percent (%)
Not importa
nt
Slightly importa
nt
Moderate
Important Very important
1 Linking to customer 3.6 7.3 23.6 21.8 43.6 2 Change management and
organizational culture 3.6 3.6 35.7 19.6 37.5
3 Education and Training 5.5 0 16.4 9.1 69.1 4 Top Management
involvement and participation
3.6 0 21.4 12.5 62.5
5 Effective Communication 3.6 1.8 27.3 16.4 50.9 6 Linking to business strategy 5.5 3.6 16.4 16.4 58.2 7 Project prioritization and
selection 3.6 5.5 29.1 21.8 40.0
8 Linking to Suppliers 10.7 5.4 25.0 25.0 33.9 9 Project management 3.6 0 25.5 27.3 43.6 10 Business plan and Vision 7.1 1.8 26.8 23.2 41.1 11 Monitoring and evaluation
of performance (performance measurement)
3.7 3.7 24.1 16.7 51.9
12 [Organizational structure 5.5 5.5 38.2 18.2 32.7

330
Table C-14. Impede factors for LSS implementation
NO CSF Results in percent (%)
Very low Low Moderate
high Very high
1 Internal resistance 7.1 8.9 28.6 30.4 25.0
2 Poor project selection 5.4 19.6 28.6 35.7 10.7
3 Lack of Leadership 5.4 8.9 26.8 21.4 37.5
4 Lack of Tangible results 5.4 8.9 23.2 44.6 17.9
5 Availability of process 7.1 10.7 26.8 32.1 23.2
6 Change management 3.6 5.4 32.1 37.5 21.4
7 Changing business focus 3.6 18.2 30.9 41.1 5.4
8 Competing projects 10.7 8.9 33.9 35.7 10.7
9 Unmanaged expectations 7.1 14.3 25.0 37.5 16.1
10 Poor training and coaching 7.1 7.1 19.6 23.2 42.9
11 Low employee retention 10.7 16.1 21.4 25.0 26.8
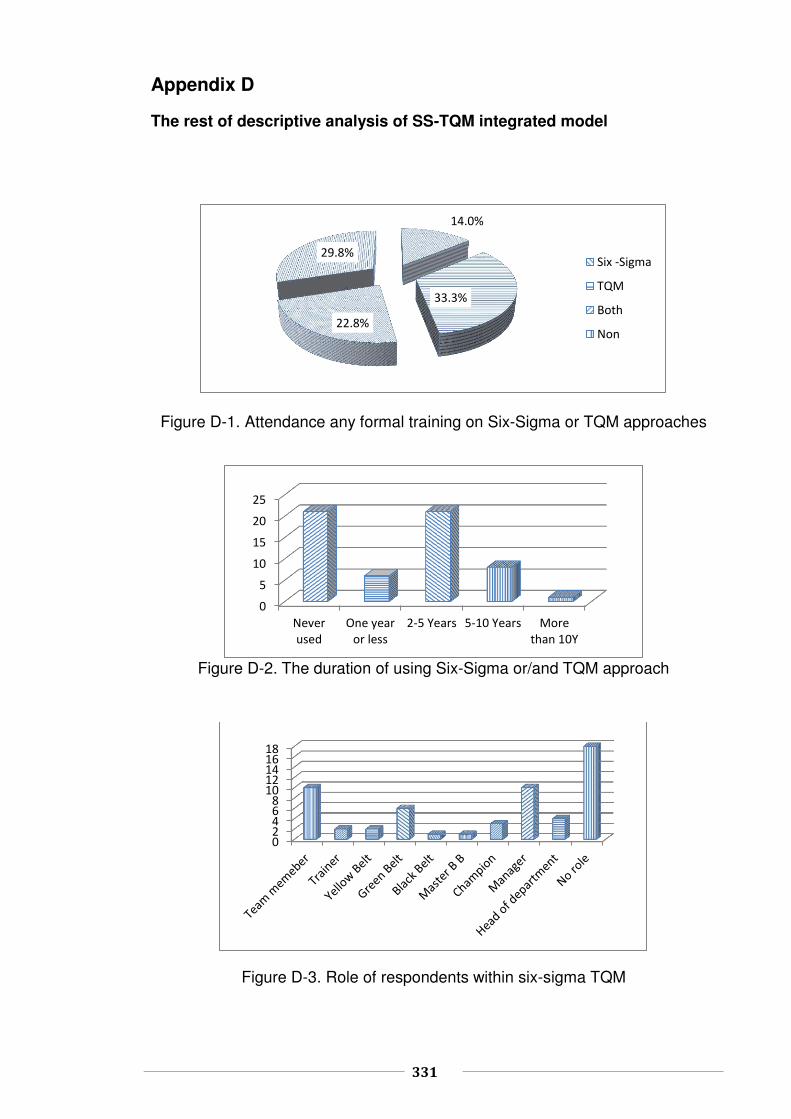
331
Appendix D
The rest of descriptive analysis of SS-TQM integrated model
Figure D-1. Attendance any formal training on Six-Sigma or TQM approaches
Figure D-2. The duration of using Six-Sigma or/and TQM approach
Figure D-3. Role of respondents within six-sigma TQM
14.0%
33.3%
22.8%
29.8% Six -Sigma
TQM
Both
Non
0
5
10
15
20
25
Never
used
One year
or less
2-5 Years 5-10 Years More
than 10Y
02468
1012141618

332
Table D-1. Item-Total Statistics
Scale Mean
if Item
Deleted
Scale
Variance if
Item Deleted
Corrected
Item-Total
Correlation
Squared
Multiple
Correlation
Cronbach's
Alpha if Item
Deleted
Evaluation the contents of
the strategic elements. 22.649 22.768 .748 .586 .927
Evaluation the contents of
the implementation
elements
22.614 22.170 .881 .795 .915
Evaluation the contents of
the Performance
excellence elements
22.789 22.991 .771 .657 .925
Evaluation the capability of
the model for
manufacturing
organization
22.772 23.036 .731 .600 .929
Evaluation the
effectiveness of the model
to boost Organization’s
competitiveness and profit
22.807 22.409 .783 .666 .924
Evaluation the ability of
the model to overcome the
complexity of TQM-Six
Sigma implementation
22.772 22.893 .788 .682 .923
Evaluation the model in
terms to achieve the
organisation goals
22.649 23.089 .808 .682 .922
Table D-2. Type of quality management system of respondent's organisation
Frequency Percent Valid Percent
Cumulative
Percent
Valid Six-sigma 8 14.0 14.0 14.0
TQM 11 19.3 19.3 33.3
ISO Series 23 40.4 40.4 73.7
Other 15 26.3 26.3 100.0
Total 57 100.0 100.0

333
Table D-3. Level of awareness with Six-Sigma TQM tools and techniques
NO Tool name Frequency Percentage (%) Yes NO Yes No
1 PDCA 42 15 73.7 26.3 2 DMAIC 51 5 89.5 8.8 3 Pareto Analysis 32 25 56.1 43.9 4 TPM 50 7 87.7 12.3 5 Brainstorming 50 7 87.7 12.3 6 Causes and effect cart 40 17 70.2 29.8 7 SPC 39 18 68.4 31.6 8 DOE 29 28 50.9 49.1 9 Benchmarking 42 15 73.7 26.3 10 Regression analysis 29 28 50.9 49.1 11 Force Field Analysis 30 27 52.6 47.4 12 QFD 42 15 73.7 26.3 13 Run Charts 35 65 61.4 38.6 14 ANOVA 42 86 73.7 26.3 15 FMEA 38 19 66.7 33.3 16 Process Flowchart / Mapping 35 22 61.4 38.6 18 Histogram 41 16 71.9 28.1 19 Taguchi methods 33 24 57.9 42.1 20 Project Charter 27 30 47.4 52.6 21 Cp Cpk 32 25 56.1 43.9 22 PERT Chart 25 32 43.9 56.1 24 SIPOC 30 27 52.6 47.4
Table D-4. The major problems facing quality system of Respondents organisations
NO Quality problem Frequency Percent (%)
Yes No Yes No
1 Decision Making Technique 31 26 54.4 45.6 2 Risk analysis and Uncertainty 38 19 66.7 33.3 3 Lack of cost driven and priorities 27 30 47.4 52.6 4 Investment in training 34 23 40.4 59.6 5 Fail to track which quality efforts work
in a market place 32 25
56.1 43.9
6 Employee commitment 33 24 57.9 42.1 7 Resources management 27 30 47.4 52.6 8 Follow up the documentation process 33 24 57.9 42.1 9 The right organisation of storage
space 20 37
35.1 64.9
10 The right selection of raw material 13 44 77.2 22.8 11 Involvement of top management and
support 28 29
49.1 50.9
12 Middle management involvement and realisation of teamwork
27 30 47.4 52.6
13 Defects 35 22 61.4 38.6 14 Machine setup and control 20 37 35.1 64.9 15 The right planning and following
maintenance program 29 28
50.9 49.1
16 Taking action for continuous improvement
38 19 66.7 33.3
17 Market and sales management 22 35 61.4 38.6 18 Rescheduling organisation 29 28 50.9 49.1 19 Utilisation problem solving technique 31 26 54.3 45.7

334
Table D-5. Utilisation of Six Sigma and TQM tools and techniques
NO Tool name Results in percentage (%)
Never been used
Used only once
Used rarely
Used frequently
Used continuously
1 Pareto analysis 40.6 5.3 20.0 28.1 7.0 2 Brainstorming techniques 12.8 8.8 13.8 36.6 28.1
3 PDCA 28.1 12.3 12.3 28.1 19.3
4 Cause and effect diagram 28.1 14.0 15.8 33.3 8.8
5 SPC 19.3 15.8 12.3 29.3 23.3
6 Benchmarking technique 18.1 8.8 17.5 36.3 19.3
7 Regression analysis 47.4 14.0 21.1 12.3 5.3
8 Design of experiments (DOE) 42.1 15.8 17.5 15.8 8.8
9 PERT chart (program evaluation and review technique)
43.9 19.3 15.8 19.3 1.8
10 Quality function deployment (QFD) 54.4
24.6 7.0 14.0 0.0
11 Force field Analysis 56.1 19.3 12.3 12.3 0.0
12 Run charts 30.4 8.8 12.3 24.0 26.6
13 ANOVA 45.6 12.3 15.8 21.1 5.3
14 Failure mode effect analysis (FMEA) 38.6
10.5 22.8 21.1 7.0
15 SIPOC (suppliers, input, process, output, customers) 45.6
10.5 15.8 21.1 7.0
16 Process flowchart/mapping 11.1 10.5 22.8 25.8 29.8
17 Histogram 33.3 15.8 22.8 14.0 14.0
18 Taguchi Methods 61.4 14.0 12.3 12.3 0.0
19 . Process capability analysis 43.9 8.8 19.3 24.6 3.5
20 Project Charter 40.4 17.5 19.3 17.5 5.3

335
Table D-6. Usefulness of Six Sigma and TQM tools and techniques to
respondents' organisation
Table D7. Evaluation the proposed model in terms of contents of the
strategic elements.
Frequency Percent Valid Percent
Cumulative
Percent
Valid Strongly disagree 1 1.8 1.8 1.8
Disagree 3 5.3 5.3 7.0
Moderate 16 28.1 28.1 35.1
Agree 20 35.1 35.1 70.2
Strongly agree 17 29.8 29.8 100.0
Total 57 100.0 100.0
NO Tool name Results in percentage (%)
Not useful Less useful
Moderate
Useful Very useful
1 Pareto analysis 24.6 17.5 15.8 19.3 22.8
2 Brainstorming techniques 3.5
15.8 8.8 19.3 52.6
3 PDCA 3.5 12.3 17.5 19.3 47.4
4 Cause and effect diagram 8.8
10.5 17.5 28.1 35.1
5 SPC 10.6 14.0 15.8 22.8 26.8
6 Benchmarking technique 10.5
12.3 21.1 24.6 31.6
7 Regression analysis 21.1 22.8 14.0 31.6 10.5
8 Design of experiments (DOE) 19.3
7.3 12.3 40.4 21.1
9 PERT chart (program evaluation and review technique)
15.8 12.3 31.6 29.8 10.5
10 Quality function deployment (QFD) 37.3
10.1 10.3 31.6 10.7
11 Force field Analysis 28.1 22.8 24.6 21.1 3.5
12 Run charts 15.8 15.8 19.3 26.3 22.8
13 ANOVA 31.6 8.8 10.5 29.8 19.3
14 Failure mode effect analysis (FMEA) 19.3
7.0 17.5 35.1 21.1
15 SIPOC (suppliers, input, process, output, customers)
24.6 10.5 14.0 35.1 15.8
16 Process flowchart/mapping 10.5
7.0 14.0 36.8 31.6
17 Histogram 7.0 24.6 15.8 28.1 24.6 18 Taguchi Methods 38.6 14.0 22.8 19.3 5.3 19 Process capability
analysis 19.3 14.0 24.6 26.3 15.8
20 Project Charter 12.3 19.3 22.8 33.3 12.3

336
Table D-8. Evaluation the proposed model in terms of contents of the
implementation elements
Frequency Percent Valid Percent
Cumulative
Percent
Valid Strongly disagree 1 1.8 1.8 1.8
Disagree 3 5.3 5.3 7.0
Moderate 12 21.1 21.1 28.1
Agree 26 45.6 45.6 73.7
Strongly agree 15 26.3 26.3 100.0
Total 57 100.0 100.0
Table D-9. Evaluation the proposed model in terms of contents of the
Performance excellence elements
Frequency Percent Valid Percent
Cumulative
Percent
Valid
Strongly disagree 1 1.8 1.8 1.8
Disagree 2 3.5 3.5 5.3
Moderate 22 38.6 38.6 43.9
Agree 19 33.3 33.3 77.2
Strongly agree 13 22.8 22.8 100.0
Total 57 100.0 100.0
Table D-10. Evaluation the proposed model in terms of suitable and applicable for manufacturing organization
Frequency Percent Valid Percent
Cumulative
Percent
Valid Strongly disagree 2 3.5 3.5 3.5
Disagree 2 3.5 3.5 7.0
Moderate 17 29.8 29.8 36.8
Agree 24 42.1 42.1 78.9
Strongly agree 12 21.1 21.1 100.0
Total 57 100.0 100.0

337
Table D-11. Evaluation the proposed model in terms of boost
Organization’s competitiveness and profit
Frequency Percent Valid Percent
Cumulative
Percent
Valid Strongly disagree 3 5.3 5.3 5.3
Disagree 2 3.5 3.5 8.8
Moderate 14 24.6 24.6 33.3
Agree 28 49.1 49.1 82.5
Strongly agree 10 17.5 17.5 100.0
Total 57 100.0 100.0
Table D-12. Evaluation the proposed model in terms of overcome the
implementation complexity of Six Sigma TQM
Frequency Percent Valid Percent
Cumulative
Percent
Valid Strongly disagree 2 3.5 3.5 3.5
Disagree 2 3.5 3.5 7.0
Moderate 15 26.3 26.3 33.3
Agree 28 49.1 49.1 82.5
Strongly agree 10 17.5 17.5 100.0
Total 57 100.0 100.0
Table D-13. Evaluation the proposed model in terms of attainment its
long term goals and business expectations
Frequency Percent Valid Percent
Cumulative
Percent
Valid Strongly disagree 1 1.8 1.8 1.8
Disagree 1 1.8 1.8 3.5
Moderate 17 29.8 29.8 33.3
Agree 24 42.1 42.1 75.4
Strongly agree 14 24.6 24.6 100.0
Total 57 100.0 100.0
Table D-14. Evaluation the proposed model in terms of anything
missing which should be added to the proposed model
Frequency Percent Valid Percent Cumulative Percent
4 7.0 7.0 7.0
53 93.0 93.0 100.0
57 100.0 100.0
Table D-15. The potential motivations of Six-Sigma TQM approach

338
NO Six-Sigma TQM motivation Results of respondents in percentage %
Strongly
disagree
Disagre
e
Moderate Agree Strongly
Agree
1 To meet the customer’s
requirement and needs 0.0
0.0 19.3 38.6 41.7
2 To improve the organization’s
productivity and overall efficiency 0.0
0.0 14.0 43.9 42.1
3 To improve Organization’s
profitability 0.0
0.0 24.6 40.4 35.1
4 To achieve the organization’s
objectives 0.0 3.5
26.3 38.6 31.6
5 To reduce production cost /
services cost 0.0
7.0 15.8 42.1 35.1
6 To reduce production cost /
services cost 0.0 1.8
17.5 42.1 38.6
7 To follow industrial trends .00 1.8 31.6 44.1 25.5
8 To gain competitive advantage 0.0 1.8 22.8 42.1 33.3
9 To improve product quality /
quality of service 0.0 7.0
12.3 38.6 42.1
10 To expand to overseas market 1.8 8.8 38.6 42.1 8.8
11 To gain and improve customer’s
confidence in your product or
services
1.8 1.8
28.1 54.4 14.0
12 To exceed customer satisfaction
and fitful customer delight 0.0 8.8
24.6 50.9 15.8
13 To enhance and support the
organization’s reputation 1.8 5.3
21.1 56.1 15.8
14 To attract more customers 1.8 3.5 31.6 42.1 21.1
15 To develop the organization
management techniques. 0.0 8.8
22.8 47.4 21.1
16 To achieve sustainable
improvement 0.0 3.5
24.6 35.1 36.8
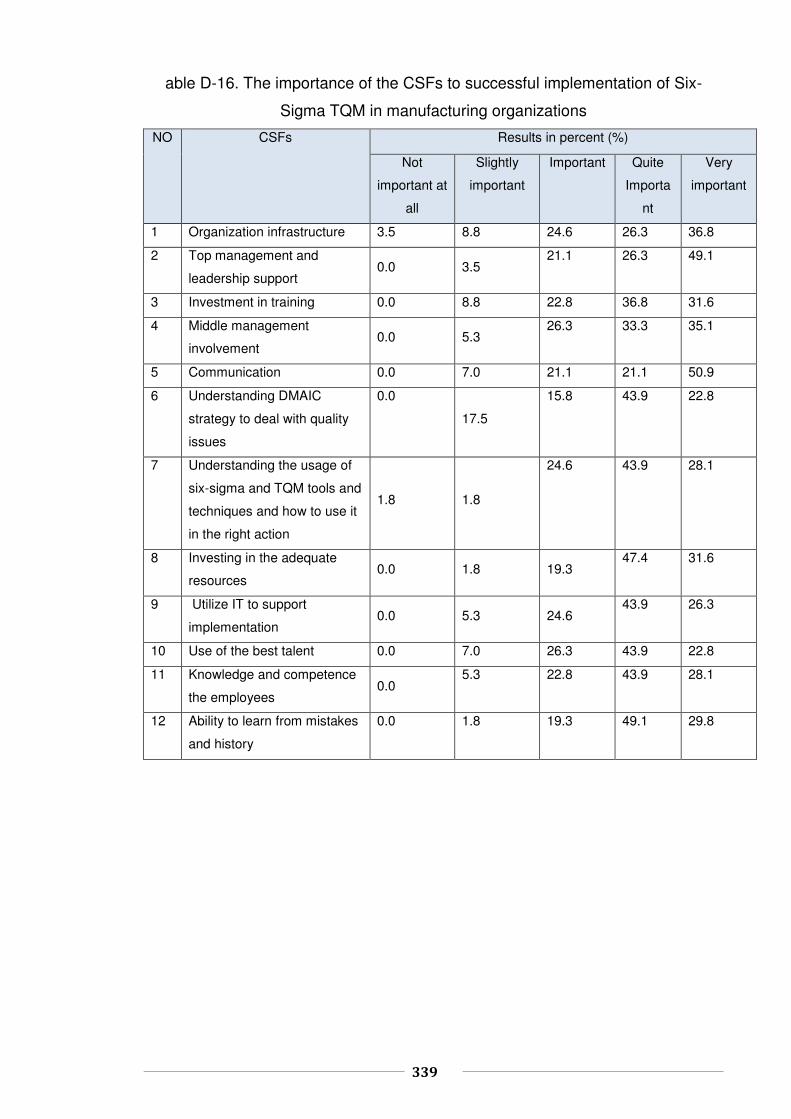
339
able D-16. The importance of the CSFs to successful implementation of Six-
Sigma TQM in manufacturing organizations
NO CSFs Results in percent (%)
Not
important at
all
Slightly
important
Important Quite
Importa
nt
Very
important
1 Organization infrastructure 3.5 8.8 24.6 26.3 36.8
2 Top management and
leadership support 0.0 3.5
21.1 26.3 49.1
3 Investment in training 0.0 8.8 22.8 36.8 31.6
4 Middle management
involvement 0.0 5.3
26.3 33.3 35.1
5 Communication 0.0 7.0 21.1 21.1 50.9
6 Understanding DMAIC
strategy to deal with quality
issues
0.0
17.5
15.8 43.9 22.8
7 Understanding the usage of
six-sigma and TQM tools and
techniques and how to use it
in the right action
1.8 1.8
24.6 43.9 28.1
8 Investing in the adequate
resources 0.0 1.8 19.3
47.4 31.6
9 Utilize IT to support
implementation 0.0 5.3 24.6
43.9 26.3
10 Use of the best talent 0.0 7.0 26.3 43.9 22.8
11 Knowledge and competence
the employees 0.0
5.3 22.8 43.9 28.1
12 Ability to learn from mistakes
and history
0.0 1.8 19.3 49.1 29.8
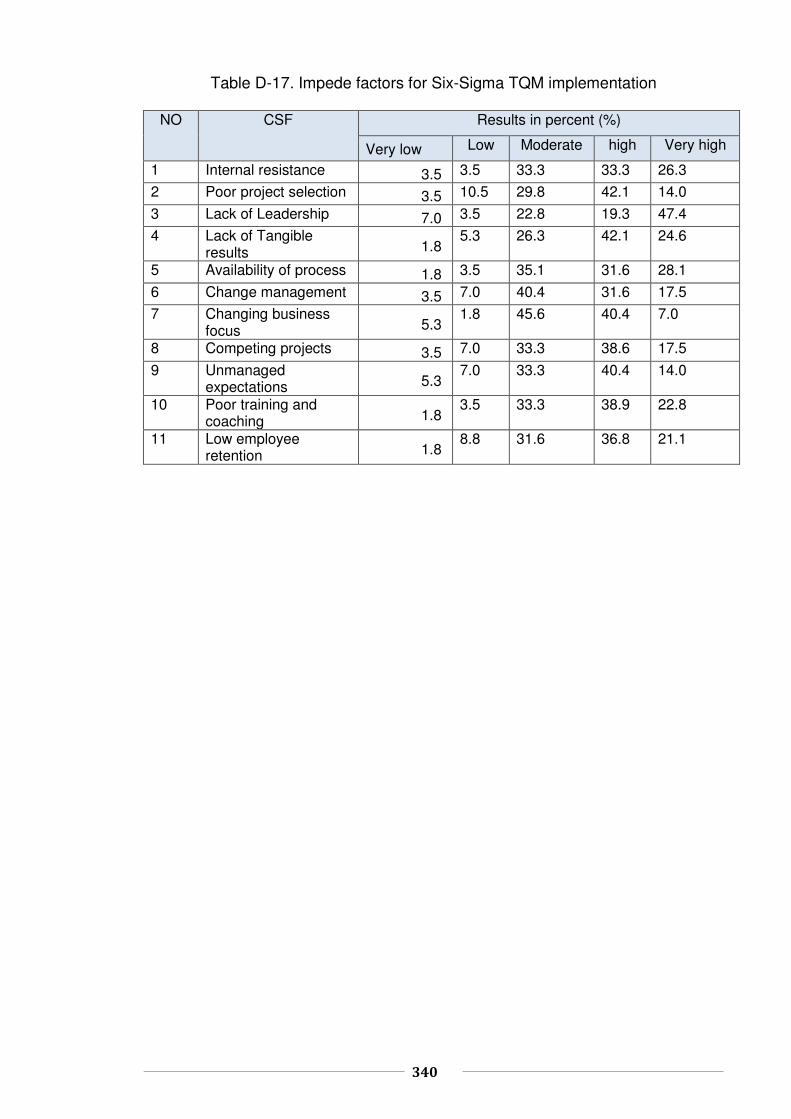
340
Table D-17. Impede factors for Six-Sigma TQM implementation
NO CSF Results in percent (%)
Very low Low Moderate high Very high
1 Internal resistance 3.5 3.5 33.3 33.3 26.3
2 Poor project selection 3.5 10.5 29.8 42.1 14.0
3 Lack of Leadership 7.0 3.5 22.8 19.3 47.4
4 Lack of Tangible results 1.8
5.3 26.3 42.1 24.6
5 Availability of process 1.8 3.5 35.1 31.6 28.1
6 Change management 3.5 7.0 40.4 31.6 17.5
7 Changing business focus 5.3
1.8 45.6 40.4 7.0
8 Competing projects 3.5 7.0 33.3 38.6 17.5
9 Unmanaged expectations 5.3
7.0 33.3 40.4 14.0
10 Poor training and coaching 1.8
3.5 33.3 38.9 22.8
11 Low employee retention 1.8
8.8 31.6 36.8 21.1

341
Appendix E
The rest of the descriptive analysis of the proposed framework
Table E-1. The current quality system of the respondents organisation
Frequency Percent Valid Percent Cumulative Percent
Valid Six-sigma 3 4.8 4.8 4.8
Lean operation 4 6.5 6.5 11.3
TQM 5 8.1 8.1 19.4
Other 50 80.6 80.6 100.0
Total 62 100.0 100.0

342
Table. E-2. The awareness level with Six-Sigma, Lean and TQM
tools/techniques
NO Tool name Frequency
percentage
yes no yes no
1 DMAIC process 55 7 88.7 11.3
2 PDCA 54 8 87.1 12.9
3 VSM 51 11 82.3 17.7
4 5S 49 13 79 21
5 Prato analysis 54 8 87.1 12.9
6 Root causes analysis 55 7 88.7 11.3
7 Total Productive Maintenance (TPM) 56 6 90.3 9.7
8 Brainstorming techniques 61 1 98.4 1.6
9 Cause and Effect diagram / Analysis 57 5 91.9 8.1
10 Statistical Process Control (SPC) 58 3 93.5 6.5
11 Design of Experiments (DOE) 53 9 85.5 41.5
12 Kaizen events 41 21 66.1 33.9
13 Kanban/ Line balancing 27 23 59.7 40.3
14 Poka-yoke 37 23 59.7 37.1
15 Single Minute Exchange of Die (SMED) 37 25 59.7 40.3
16 Benchmarking 50 10 80.6 16.1
17 Regression analysis 47 15 75.8 42.2
18 Force field Analysis 34 28 54.8 45.2
19 Quality function deployment (QFD) 54 7 66.1 33.9
20 Run charts 47 15 75.8 42.2
21 ANOVA 48 14 77.4 22.6
22 Failure mode analysis 49 12 79 19.4
23 Process flowchart/mapping 54 7 87.1 11.5
24 Histogram 51 11 82.3 17.7
25 Taguchi Methods 44 18 71 29
26 FMEA 49 12 79 19.4
27 Project Charter 39 21 62.9 33.9
28 Process capability analysis 49 10 79 16.1
29 Cost of poor quality 49 13 79 21
30 PERT chart (program evaluation and review
technique)
27 35 43.5 56.5

343
Table E-3. The potential motivations of the integrated quality management approach
NO Integrated quality management motivation
Results of respondents in percentage %
Strongly disagree
Disagree Moderate Agree Strongly Agree
1 To meet the customer’s requirement and needs
0 0 14.5 50 35.5
2 To improve the organization’s productivity and overall efficiency
0 0 6.5 50 43.5
3 To improve Organization’s profitability
0 0 8.1 48.4 43.5
4 To achieve the organization’s objectives
0 0 12.9 46.8 40.3
5 To reduce production cost / services cost
0 1.6 16.1 30.6 51.6
6 To follow industrial trends 0 0 33.9 58.1 8.1 7 To gain competitive advantage 0 0 22.6 62.9 14.5
9 To improve product quality / quality of service
0 0 4.8 46.8 48.4
9 To expand to overseas market 1.6 3.2 29 54.8 11.3
10 To gain and improve customer’s confidence in your product or services
0 0 9.7 71 19.4
11 To exceed customer satisfaction and fitful customer delight
0 0 19.4 67.7 12.9
12 To enhance and support the organization’s reputation
0 0 19.4 66.1 14.5
13 To attract more customers 0 0 19.4 64.5 16.1
14 To develop the organization management techniques.
0 1.6 14.5 72.6 11.3
15 To achieve sustainable improvement
0 0 8.1 61.3 30.6
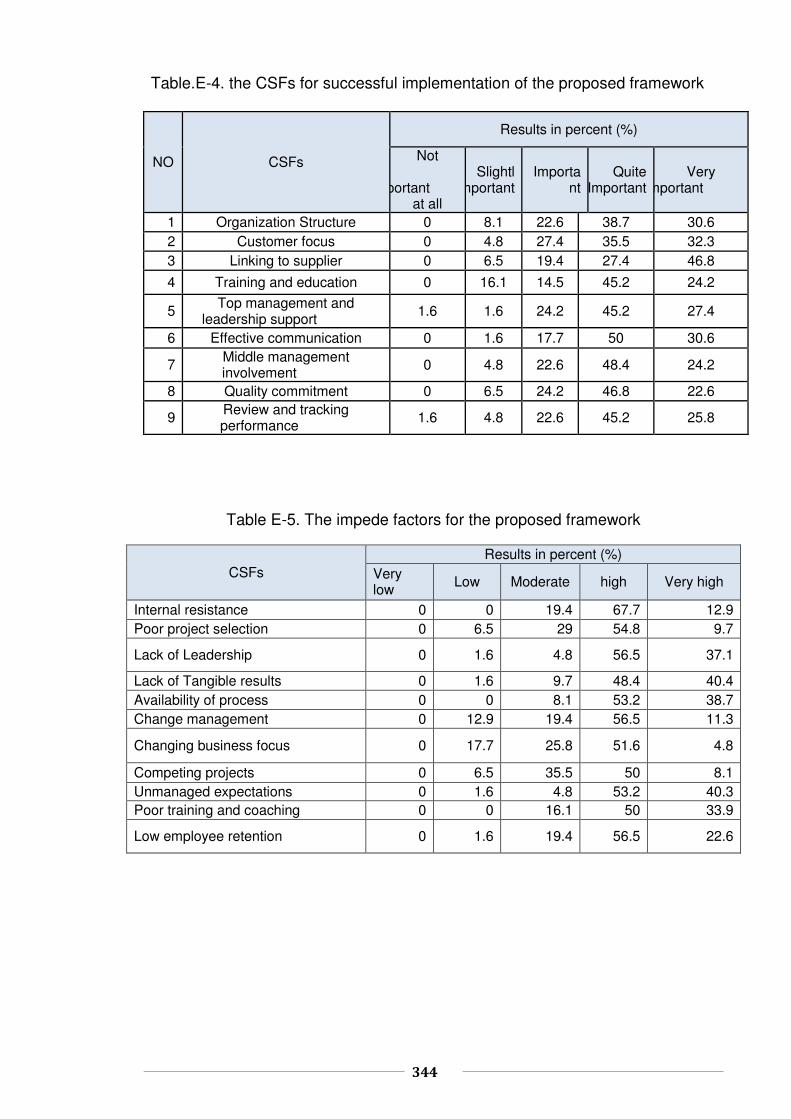
344
Table.E-4. the CSFs for successful implementation of the proposed framework
Table E-5. The impede factors for the proposed framework
CSFs Results in percent (%)
Very low
Low Moderate high Very high
Internal resistance 0 0 19.4 67.7 12.9 Poor project selection 0 6.5 29 54.8 9.7
Lack of Leadership 0 1.6 4.8 56.5 37.1
Lack of Tangible results 0 1.6 9.7 48.4 40.4 Availability of process 0 0 8.1 53.2 38.7 Change management 0 12.9 19.4 56.5 11.3
Changing business focus 0 17.7 25.8 51.6 4.8
Competing projects 0 6.5 35.5 50 8.1 Unmanaged expectations 0 1.6 4.8 53.2 40.3 Poor training and coaching 0 0 16.1 50 33.9
Low employee retention 0 1.6 19.4 56.5 22.6
NO CSFs
Results in percent (%)
Not
portant at all
Slightl important
Important
Quite Important
Very important
1 Organization Structure 0 8.1 22.6 38.7 30.6 2 Customer focus 0 4.8 27.4 35.5 32.3 3 Linking to supplier 0 6.5 19.4 27.4 46.8
4 Training and education 0 16.1 14.5 45.2 24.2
5 Top management and
leadership support 1.6 1.6 24.2 45.2 27.4
6 Effective communication 0 1.6 17.7 50 30.6
7 Middle management involvement
0 4.8 22.6 48.4 24.2
8 Quality commitment 0 6.5 24.2 46.8 22.6
9 Review and tracking performance
1.6 4.8 22.6 45.2 25.8