Embed Size (px)
Citation preview

i
Development of an Electrical Substation Equipment Performance Database for Evaluation of Equipment Fragilities
Final Report
April 1, 1999
Prepared for Pacific Gas and Electric and the Pacific Earthquake Engineering Center
by
Thalia Anagnos
Department of Civil and Environmental Engineering San Jose Sate University San Jose, CA 95192-0083

i
Acknowledgments I would like to thank Anshel Schiff for all of his help in transferring and explaining the initial equipment damage database and in providing additional support documentation for several of published articles on substation equipment damage. Dennis Ostrom’s insight into damage and inventory of Southern California substations was invaluable. Ed Matsuda, Eric Fujisaki, Robert White, Norm Abrahamson and Woody Savage of PG&E provided valuable guidance and data on equipment inventories, use, priorities, function and damage. Paul Somerville and Nancy Smith of Woodward Clyde were very helpful in creating spectra for inclusion in the database. Ron Tognazzini and Rulon Fronk of Los Angeles Department of Water and Power provided valuable information on LADWP substations. Nitin Christopher, a graduate student at San Jose State, performed some of the preliminary plots of fragility curves and damage data.

ii
Executive Summary
A database has been developed that documents performance of substation equipment in twelve California earthquakes. Equipment in the database is owned by Pacific Gas & Electric, Los Angeles Department of Water and Power, Southern California Edison and the California Department of Water Resources. The majority of data relates to equipment operating at 220/230 kV and 500 kV. The database is organized into an EXCEL 5.0 spreadsheet with 68 data fields describing earthquake location, ground motion, site location and conditions, equipment characteristics, performance of equipment, failure mode, and restoration time. Each record represents a single piece of damaged equipment or several pieces of similar undamaged equipment. Ground motions in the database are based on recordings if the site was instrumented. In other cases, ground motions are based on event specific attenuation relationships developed by Somerville and Smith (1999). The purpose of the database is to provide a basis for developing or improving equipment vulnerability functions. Data have been summarized by earthquake, site, and equipment type. Probabilities of failure are calculated by dividing number of damaged items by the total number of items of that type at the site. Using peak ground acceleration as the ground motion parameter, failure probabilities are compared with opinion-based fragility curves for a few selected equipment classes. Comparisons are somewhat crude in that the calculated failure probabilities do not include information about the mode of failure. The comparisons indicate that some of the existing fragility curves provide reasonable matches to the data and others should be modified to better reflect the data.
iii
Table of Contents
page
List of Figures v
List of Tables ............................................................................................................ xi
1. Introduction ............................................................................................................. 1
2. Summary of Database Contents ............................................................................... 2
2.1 Format of Substation Equipment Database ...................................................... 2
2.2 Sources of Substation Equipment Damage Data .............................................. 2
2.3 Summary of Data .............................................................................................. 3
2.4 Limitations of Damage Data ........................................................................... 18
3. Essential Parameters for Defining Equipment Fragilities ...................................... 20
4. Utilities Working Group Equipment Classes ......................................................... 28
5. Comparison of Database Statistics with Utilities Working Group Fragilities ....... 30
5.1 Failure Modes ................................................................................................. 30
5.2 Data Comparisons ........................................................................................... 32
6. Future Database Development ............................................................................... 43
7. References .............................................................................................................. 44
(Note: All appendices and the database are available on the project web site, which can be accessed from the PEER web site)
Appendix A -- Description of Substation Damage Database Structure
A.1 General Description of Database .................................................................. A-1
A.2 Format of Database ....................................................................................... A-1
A.3 Earthquake Data Fields (columns A through 0) ........................................... A-2
A.4 Substation Data Fields (columns P through AJ) ........................................... A-4
A.5 Equipment Data Fields (columns AK through BN) ...................................... A-8
A.5.1 Notes ....................................................................................................... A-8
Appendix B -- Ground Motion Spectra for Selected Substations and Earthquakes
B.1 Development of Ground Motion Spectra ...................................................... B-1
B.2 Plots of Ground Motion Spectra ................................................................... B-5
Appendix C -- Fragility Curves Developed by Utilities Working Group
C.1 General Description of Fragility Curves ....................................................... C-1
C.2 Parameters and Plots of Fragility Curves ...................................................... C-1

iv
Figures
page
Figure 3.1 Key parameters for defining seismic damage to a disconnect switch ..................... 21
Figure 3.2 Key parameters for defining seismic damage to a transformer ............................... 22
Figure 3.3 Key parameters for defining seismic damage to a circuit breaker .......................... 23
Figure 3.4 Key parameters for defining seismic damage to a circuit switcher ......................... 23
Figure 3.5 Key parameters for defining seismic damage to a
coupling current voltage transformer ...................................................................... 24
Figure 3.6 Key parameters for defining seismic damage to a lightning arrester ...................... 25
Figure 3.7 Key parameters for defining seismic damage to a current transformer .................. 26
Figure 3.8 Key parameters for defining seismic damage to a wave trap .................................. 27
Figure 5.1 Comparison of UWG fragility curves with damage data for 230 kV
live tank General Electric ATB4-ATB6 circuit breakers (CB9). Data plotted for
each site. ................................................................................................................... 33
Figure 5.2 Comparison of UWG fragility curves with damage data for 230 kV
live tank General Electric ATB4-ATB6 circuit breakers (CB9). Data for sites
with same PGA are combined. ................................................................................. 34
Figure 5.3 Damage data for 230 kV live tank General Electric ATB4 - ATB6 circuit
breakers (CB9) for individual sites plotted against 0.2-second spectral acceleration 37
Figure 5.4 Comparison of UWG fragility curves with damage data for 500 kV
Westinghouse live tank SF6 circuit breakers (CB72) ............................................. 37
Figure 5.5 Comparison of UWG fragility curves with damage data for 230 kV and 500 kV
Lightning arresters with low seismic design (LA1 and LA5) ................................. 38
Figure 5.6 Comparison of UWG fragility curves with damage data for 230 kV
horizontal disconnect switches (DS3) ...................................................................... 39
Figure 5.7 Comparison of UWG fragility curves with damage data for 500 kV disconnect switches (DS1) ......................................................................................................... 41
Figure 5.8 Comparison of UWG fragility curves with damage data for single-phase 230 kV transformers (TR1) .................................................................................................. 42
Appendix B
SS#12 – Coalinga 1983 - 5% Damped Spectra ................................................................................
SS#5 – Landers 1992 - 5% Damped Spectra ..................................................................................

v
SS#24 – Loma Prieta 1989 - 5% Damped Spectra ...........................................................................
SS#25 – Loma Prieta 1989 - 5% Damped Spectra ...........................................................................
SS#26 – Loma Prieta 1989 - 5% Damped Spectra ...........................................................................
SS#28 – Loma Prieta 1989 - 5% Damped Spectra ...........................................................................
SS#39 – Loma Prieta 1989 - 5% Damped Spectra ...........................................................................
SS#21 – Morgan Hill 1984 - 5% Damped Spectra ..........................................................................
SS#24 – Morgan Hill 1984 - 5% Damped Spectra ..........................................................................
SS#7 – North Palm Springs 1986 - 5% Damped Spectra ................................................................
SS#3 – Northridge 1994 - 5% Damped Spectra ...............................................................................
SS#31 – Northridge 1994 - 5% Damped Spectra .............................................................................
SS#34A – Northridge 1994 - 5% Damped Spectra ..........................................................................
SS#34 – Northridge 1994 - 5% Damped Spectra .............................................................................
SS#36 – Northridge 1994 - 5% Damped Spectra .............................................................................
SS#38 – Northridge 1994 - 5% Damped Spectra .............................................................................
SS#41 – Northridge 1994 - 5% Damped Spectra .............................................................................
SS#47 – Northridge 1994 - 5% Damped Spectra .............................................................................
SS#44 – Northridge 1994 - 5% Damped Spectra .............................................................................
SS#45 – Northridge 1994 - 5% Damped Spectra .............................................................................
SS#40 – Point Mugu 1973 - 5% Damped Spectra ...........................................................................
SS#1 – San Fernando 1971 - 5% Damped Spectra ..........................................................................
SS#8 – San Fernando 1971 - 5% Damped Spectra ..........................................................................
SS#18 – San Fernando 1971 - 5% Damped Spectra ........................................................................
SS#19 – San Fernando 1971 - 5% Damped Spectra ........................................................................
SS#23 – San Fernando 1971 - 5% Damped Spectra ........................................................................
SS#41 – San Fernando 1971 - 5% Damped Spectra ........................................................................
SS#45 – San Fernando 1971 - 5% Damped Spectra ........................................................................
SS#13 – Santa Barbara 1978 - 5% Damped Spectra ........................................................................
SS#14 – Sierra Madre 1991 - 5% Damped Spectra .........................................................................
SS#1 – Whittier Narrows 1987 - 5% Damped Spectra ....................................................................
SS#4 – Whittier Narrows 1987 - 5% Damped Spectra ....................................................................
SS#6 – Whittier Narrows 1987 - 5% Damped Spectra ....................................................................
SS#8 – Whittier Narrows 1987 - 5% Damped Spectra ....................................................................

vi
SS#10 – Whittier Narrows 1987 - 5% Damped Spectra ..................................................................
SS#15 – Whittier Narrows 1987 - 5% Damped Spectra ..................................................................
SS#16 – Whittier Narrows 1987 - 5% Damped Spectra ..................................................................
SS#17 – Whittier Narrows 1987 - 5% Damped Spectra ..................................................................
SS#19 – Whittier Narrows 1987 - 5% Damped Spectra ..................................................................
SS#22 – Whittier Narrows 1987 - 5% Damped Spectra ..................................................................
SS#23 – Whittier Narrows 1987 - 5% Damped Spectra ..................................................................
SS#27 – Whittier Narrows 1987 - 5% Damped Spectra ..................................................................
SS#29 – Whittier Narrows 1987 - 5% Damped Spectra ..................................................................
SS#30 – Whittier Narrows 1987 - 5% Damped Spectra ..................................................................
SS#32 – Whittier Narrows 1987 - 5% Damped Spectra ..................................................................
SS#42 – Whittier Narrows 1987 - 5% Damped Spectra ..................................................................
SS#43 – Whittier Narrows 1987 - 5% Damped Spectra ..................................................................
SS#46 – Whittier Narrows 1987 - 5% Damped Spectra ..................................................................
SS#1 – Whittier Narrows Aftershock 1987 – 5% Damped Spectra .................................................
SS#2 – Whittier Narrows Aftershock 1987 – 5% Damped Spectra .................................................
SS#4 – Whittier Narrows Aftershock 1987 – 5% Damped Spectra .................................................
SS#6 – Whittier Narrows Aftershock 1987 – 5% Damped Spectra..................................................
SS#8 – Whittier Narrows Aftershock 1987 – 5% Damped Spectra .................................................
SS#11 – Whittier Narrows Aftershock 1987 – 5% Damped Spectra ...............................................
SS#15 – Whittier Narrows Aftershock 1987 - 5% Damped Spectra ...............................................
SS#23 – Whittier Narrows Aftershock 1987 – 5% Damped Spectra ...............................................
SS#33– Whittier Narrows Aftershock 1987 – 5% Damped Spectra ................................................
Appendix C
Figure C.1 Utilities Working Group Fragilities for Single Phase 230 kV Transformers (TR1) C-2
Figure C.2 Utilities Working Group Fragilities for Three Phase 230 kV Transformers (TR2) . C-3
Figure C.3 Utilities Working Group Fragilities for Single Phase 500 kV Transformers (TR3) C-4
Figure C.4 Utilities Working Group Fragilities for Three Phase 500 kV Transformers (TR4) . C-5
Figure C.5 Utilities Working Group Fragilities for 500 kV
Old Cogenel Circuit Breakers (CB5) ....................................................................... C-7
Figure C.6 Utilities Working Group Fragilities for 230 kV Live Tank General Electric
ATB4, ATB5, ATB6 Circuit Breakers (CB9) .......................................................... C-8

vii
Figure C.7 Utilities Working Group Fragilities for 230 kV Live Tank General Electric
ATB7 Circuit Breakers (CB14) ................................................................................ C-9
Figure C.8 Utilities Working Group Fragilities for 500 kV Live Tank General Electric
ATB (CB15) and Other 500 kV live Tank (CB15a) Circuit Breakers ................... C-10
Figure C.9 Utilities Working Group Fragilities for 230 kV Dead Tank SF6
Circuit Breakers (CB20).......................................................................................... C-11
Figure C.10 Utilities Working Group Fragilities for 230 kV Dead Tank Oil C-12
Circuit Breakers (CB20a) .................................................................................... C-12
Figure C.11 Utilities Working Group Fragilities for 230 kV Modern Live Tank
Circuit Breakers (CB57) ...................................................................................... C-13
Figure C.12 Utilities Working Group Fragilities for 500 kV Live Tank Westinghouse SF6
Circuit Breakers (CB72) ...................................................................................... C-14
Figure C.13 Utilities Working Group Fragilities for 500 kV Live Tank Puffer
Circuit Breakers (CB73) ...................................................................................... C-15
Figure C.14 Utilities Working Group Fragilities for 500 kV Dead Tank SF6
Circuit Breakers (CB77) ...................................................................................... C-16
Figure C.15 Utilities Working Group Fragilities for 500 kV Vertical
Disconnect Switches (DS1) ................................................................................. C-18
Figure C.16 Utilities Working Group Fragilities for 230 kV Vertical
Disconnect Switches (DS2) ................................................................................. C-19
Figure C.17 Utilities Working Group Fragilities for 230 kV Horizontal
Disconnect Switches (DS3) ................................................................................. C-20
Figure C.18 Utilities Working Group Fragilities for 230 kV Lightning Arresters
( LA1, LA2, LA3, LA4) ...................................................................................... C-22
Figure C.19 Utilities Working Group Fragilities for 500 kV Lightning Arresters
( LA5, LA6, LA7, LA8) ...................................................................................... C-23
Figure C.20 Utilities Working Group Fragilities for 230 kV Current Transformers
( CT1, CT2, CT3, CT4) ....................................................................................... C-25
Figure C.21 Utilities Working Group Fragilities for 500 kV Current TransformersC-26
( CT5, CT6, CT7, CT8) ....................................................................................... C-26
Figure C.22 Utilities Working Group Fragilities for 230 kV Coupling Capacitor Voltage
Transformers ( CC1, CC2, CC3, CC4) ............................................................... C-28

viii
Figure C.23 Utilities Working Group Fragilities for 500 kV Coupling Capacitor Voltage
Transformers ( CC5, CC6, CC7, CC8) ............................................................... C-29
Figure C.24 Utilities Working Group Fragilities for 230 kV Potential Transformers
( PT1, PT2, PT3, PT4) ........................................................................................ C-31
Figure C.25 Utilities Working Group Fragilities for 500 kV Potential Transformers
( PT5, PT6, PT7, PT8) ........................................................................................ C-32

ix
Tables page
Table 2.1 Earthquakes and Substations Represented in Substation Equipment Database .......... 5
Table 2.2 Summary of Substation Sites and Ground Motions .................................................... 6
Table 2.3 Summary of 230 kV and 500 kV Substation Equipment in Database ...................... 11
Table 4.1 Utilities Working Group Substation Equipment Classes .......................................... 28
Table 5.1 Failure Modes for Substation Equipment Classes .................................................... 31
Table B.1 List of Ground Motion Spectra in Appendix B ...............................................................
Table C.1 Fragility Parameters for Transformers .................................................................... C-1
Table C.2 Fragility Parameters for Circuit Breakers ............................................................... C-6
Table C.3 Fragility Parameters for Disconnect Switches ...................................................... C-17
Table C.4 Fragility Parameters for Lightning Arresters ........................................................ C-21
Table C.5 Fragility Parameters for Current Transformers .................................................... C-24
Table C.6 Fragility Parameters for Coupling Capacitor Voltage Transformers .................... C-27
Table C.7 Fragility Parameters for Potential Transformers .................................................. C-30

page 1
1. Introduction The high voltage components of electrical power substations are critical elements in the reliable operation of the power grid. These components must continue to function after an earthquake in order for the power grid to be capable of reliably delivering power to a region immediately after an earthquake. The 1994 Northridge Earthquake demonstrated that damage to electrical substation components in California can have far reaching consequences to communities in British Columbia, Montana, Wyoming, Idaho, Oregon and Washington. These communities experienced outages as a result of damage to electrical substation components in the Los Angeles area (Schiff, 1995). Customers in the Los Angeles area experienced outages lasting anywhere from a few seconds to several days. Power was restored to all major substations and to about 95% of the customers within 24 hours (Schiff, 1995). However, during the next few months extensive repair and replacement of equipment were required to restore the system to its pre-earthquake redundancy and capacity. As repaired, the systems are assumed to be more reliable than prior to the earthquake. The power transmission and distribution systems in California have been built over many decades and utilize equipment that was designed and installed under varying seismic criteria. Substation equipment is very expensive and unfortunately many of the equipment components such as porcelain insulators and bushings are vulnerable to seismic damage. Some of the older equipment that was designed to much lower seismic standards is particularly vulnerable to seismic loading. Repair of the substation damage caused by earthquakes can be a significant expenditure for utilities. Furthermore, loss of power immediately after an earthquake can disrupt emergency response and recovery operations for the affected region. Thus utilities are interested in ways to minimize or eliminate earthquake damage and disruption to their systems. PG&E and other utilities have aggressive plans to replace vulnerable older equipment with more rugged components. Other mitigation strategies include retrofitting existing equipment, modifying design and installation practices, and developing improved standards for qualifying new equipment. A key element of the mitigation plans is the establishment of priorities based on, at minimum, equipment function, importance, and vulnerability. Analysis of substation equipment damage in past earthquakes is an important step in establishing levels of acceleration that cause failure in equipment, modes of failure and component weaknesses that lead to failure. Data can be used to develop or update fragility curves for use in system reliability models that can help in the establishment of mitigation priorities. The substation network evaluation performed by PG&E (Matsuda et al., 1991) represents one type of study that has been used to establish priorities for mitigation. In that study, scenario earthquakes were developed and damage was estimated at key substations. Substations were ranked and then selected for analysis based on their exposure and on their importance to the continued operation of the system. The damage to key pieces of equipment was determined by considering damage to similar equipment in past earthquakes. The impact on customer service was assessed by considering the damage at each substation and the redundancy of transmission lines.

page 2
The purpose of this project was to compile equipment performance data from past earthquakes and organize the data into a database that would be useful in the analysis of equipment vulnerabilities. Anshel Schiff had collected extensive damage data for selected earthquakes and organized the information into a Filemaker Pro database. This database was used as the starting point for this study. Supplementary data related to ground motions and undamaged equipment were collected for substations in the database. The database was then augmented with performance data that was developed from additional substations and earthquakes. Finally, for selected equipment classes the data were compared with existing fragility curves developed using expert opinion. Specific project tasks were to: • evaluate the existing database for content and quality; • add ground motion data either from site recordings or from simulated ground motion based
on earthquake specific attenuation relations; • add data from additional substations and earthquakes; • review existing equipment classification system developed by the Utilities Working Group; • document the database; and • compare the data with existing fragility curves for selected classes of equipment.
2. Summary of Database and Contents
2.1. Format of Substation Equipment Database The database described in this report is maintained in an EXCEL 97 spreadsheet containing 68 columns of information. The content of each column is described in detail in Appendix A. The Substation Equipment Database is a modified and augmented version of a database initially developed by Anshel Schiff. The original database was in Filemaker Pro and contained graphic representations of some pieces of equipment in addition to the written descriptions of equipment and damage. Early in the project, to better conform to software that is maintained at PG&E, a decision was made to convert the substation equipment database to EXCEL. While converting the database made it more accessible to researchers at PEER and PG&E, it introduced several limitations. Firstly, all of the graphical representations of equipment were lost in the conversion. Secondly, EXCEL has a limit on the number of characters that can be typed in a cell. In a few cases, data were truncated during conversion. Every attempt has been made to retrieve and include the truncated data. Thirdly, EXCEL is not a dedicated database manager, thus it is not designed for performing queries. However, with a little caution to prevent truncating data, the EXCEL file can be saved in a dBASE format and then the Microsoft Add-in Query or any other database manager can be used to perform queries.
2.2. Sources of Substation Equipment Damage Data Data contained in the Substation Equipment Database were compiled from the following sources:
• original database developed by Anshel Schiff; • Earthquake Spectra articles; • Electric Power Research Institute (EPRI) reports; • American Society of Civil Engineers (ASCE) Technical Council on Lifeline Earthquake
Engineering (TCLEE) Monograph No. 8;

page 3
• internal PG&E reports; • internal Los Angeles Department of Water and Power (LADWP) report; • internal Southern California Edison reports; • PG&E RCMS database of transformers and circuit breakers; • single line drawings of specific substations; and • discussions with individuals who performed post-earthquake reconnaissance at specific sites. The quality and completeness of the data vary considerably for different earthquakes and substations. Data collected for more recent earthquakes, particularly Whittier Narrows, Loma Prieta and Northridge, are much more detailed and complete than those for earlier events.
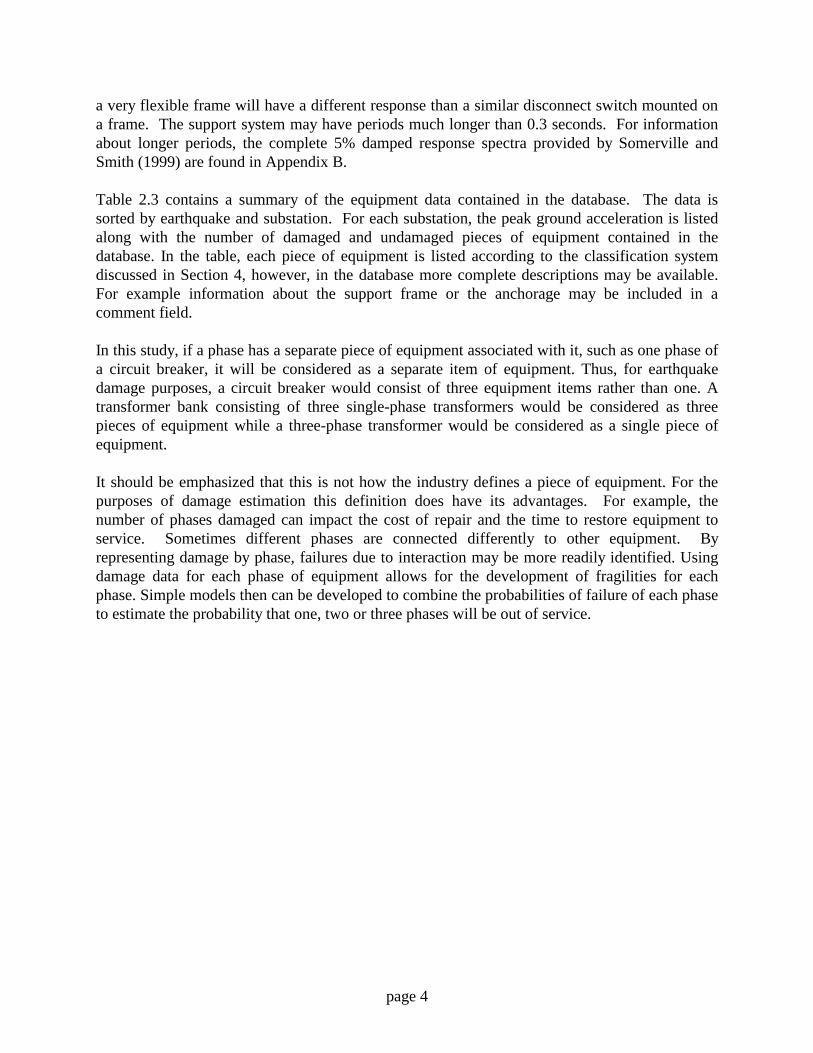
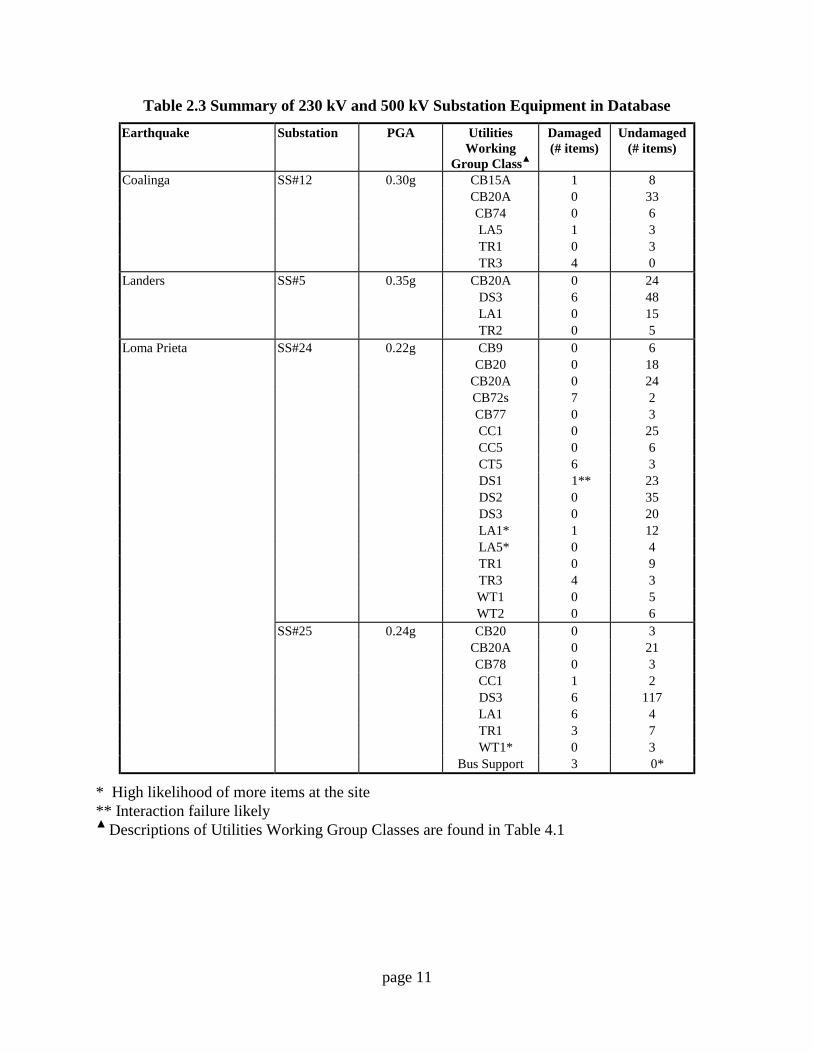
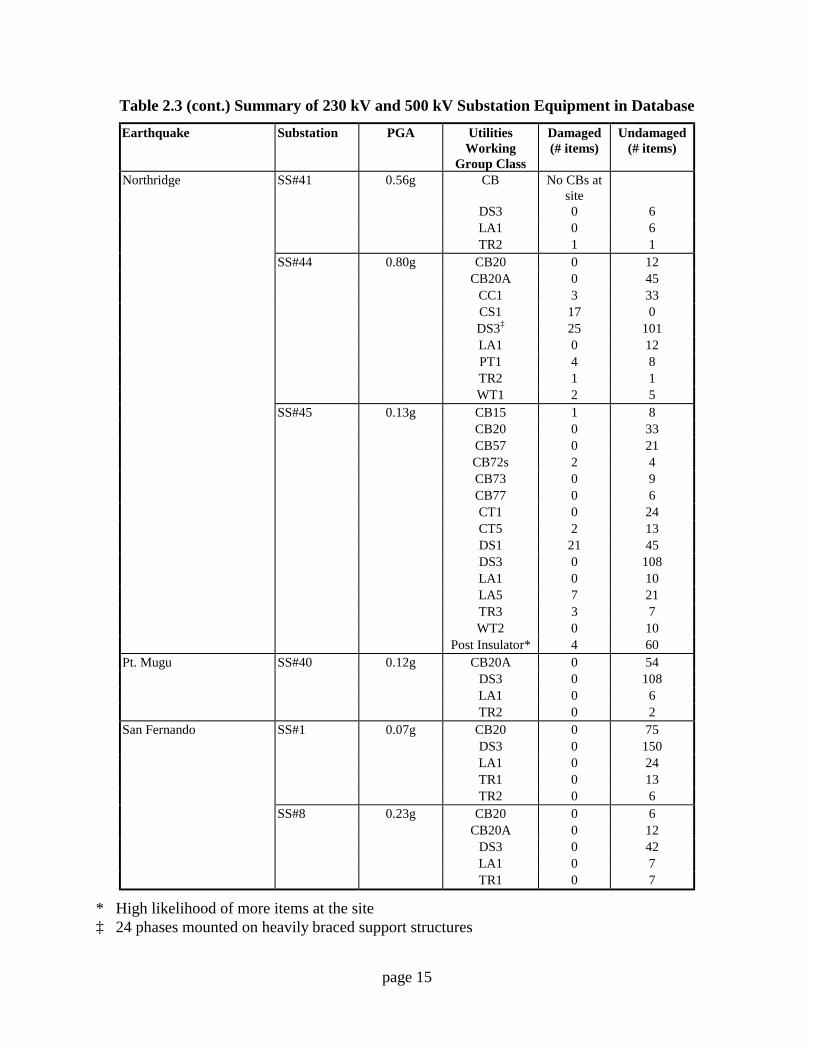
2.3. Summary of Data The database contains information about damaged and undamaged substation equipment from twelve earthquakes as detailed in Table 2.1. Pacific Gas & Electric, Los Angeles Department of Water and Power, Southern California Edison and the California Department of Water Resources own equipment in the database. The majority of data relates to equipment operating at 220/230 kV and 500 kV. In a very small number of cases, damage to 60 kV equipment is documented. The quality of the data varies considerably. For substations in the Loma Prieta and Northridge earthquakes, detailed reports were available that identified the locations and types of damage for key types of equipment. These reports also provided good statistics on the undamaged equipment. For most other earthquakes, undamaged equipment statistics were developed through discussions with key personnel, examination of single line drawings and review of the PG&E RCMS database. As a result, some types of equipment such as wave traps, potential transformers, coupling current voltage transformers, lightning arresters and disconnect switches are not well represented at many sites. For each earthquake and substation, ground motion data were added. The database contains actual values for instrumented substations with site recordings. At other sites, ground motions are based on event specific attenuation relations modified with residuals from recordings at nearby sites (Somerville and Smith, 1999). The ground motion values listed in Table 2.2 vary depending on their source. For the ground motions generated from event specific attenuation relations, two horizontal components, fault normal and fault parallel, were available and the largest value was chosen. Only one horizontal ground motion spectrum was available for ground motions generated from the attenuation relationship developed by Abrahamson and Silva (1997). In the case of site recordings, the two components are determined by the orientation of the instrument. The soil types listed in Table 2.2 are rough descriptions of the soil at the site and do not take into account local variations at the site. Since substations cover many acres, soil conditions can vary dramatically over the site. As summarized in Table 2.2, the peak ground acceleration, 0.1-second spectral acceleration, 0.2-second spectral acceleration and 0.3 second acceleration ground motions are included in the database. These values were chosen because they are in the range of the fundamental period of most pieces of equipment. It should be noted that the response of equipment may be substantially altered by the support system. For example, a disconnect switch that is mounted on
page 4
a very flexible frame will have a different response than a similar disconnect switch mounted on a frame. The support system may have periods much longer than 0.3 seconds. For information about longer periods, the complete 5% damped response spectra provided by Somerville and Smith (1999) are found in Appendix B. Table 2.3 contains a summary of the equipment data contained in the database. The data is sorted by earthquake and substation. For each substation, the peak ground acceleration is listed along with the number of damaged and undamaged pieces of equipment contained in the database. In the table, each piece of equipment is listed according to the classification system discussed in Section 4, however, in the database more complete descriptions may be available. For example information about the support frame or the anchorage may be included in a comment field. In this study, if a phase has a separate piece of equipment associated with it, such as one phase of a circuit breaker, it will be considered as a separate item of equipment. Thus, for earthquake damage purposes, a circuit breaker would consist of three equipment items rather than one. A transformer bank consisting of three single-phase transformers would be considered as three pieces of equipment while a three-phase transformer would be considered as a single piece of equipment. It should be emphasized that this is not how the industry defines a piece of equipment. For the purposes of damage estimation this definition does have its advantages. For example, the number of phases damaged can impact the cost of repair and the time to restore equipment to service. Sometimes different phases are connected differently to other equipment. By representing damage by phase, failures due to interaction may be more readily identified. Using damage data for each phase of equipment allows for the development of fragilities for each phase. Simple models then can be developed to combine the probabilities of failure of each phase to estimate the probability that one, two or three phases will be out of service.

page 5
Table 2.1 Earthquakes and Substations Represented in Substation Equipment Database
Earthquake Substations San Fernando (2/9/71, Mw = 6.6) SS#1
SS#8 SS#18 SS#19
SS#23 SS#41 SS#45 SS#44
Point Mugu (2/21/73, Mw = 5.3) SS#40 Santa Barbara (8/13/78, Mw = 6.0) SS#13 Coalinga (5/2/83, Mw = 6.4) SS#12 Morgan Hill (4/24/84, Mw = 6.2) SS#20
SS#21 SS#24
North Palm Springs (7/8/86, Mw = 6.0) SS#7 Whittier Narrows (10/1/87, Mw = 6.0) SS#1
SS#4 SS#6 SS#8 SS#10 SS#15 SS#16 SS#17 SS#19
SS#22 SS#23 SS#27 SS#29 SS#30 SS#32 SS#42 SS#43 SS#46
Whittier Narrows Aftershock (10/4/87, Mw = 5.3)
SS#1 SS#2 SS#4 SS#6
SS#8 SS#11 SS#15 SS#33
Tejon Ranch (6/10/88, ML = 5.2) SS#9 Sierra Madre (6/28/91, Mw = 5.8) SS#14 Loma Prieta (10/17/89, Mw = 7.0) SS#24
SS#25 SS#26 SS#28 SS#39
Landers (6/28/92, Mw = 7.3) SS#5 Northridge (1/17/94, Mw = 6.7) SS#3
SS#31 SS#34 SS#35 SS#36 SS#37
SS#38 SS#41 SS#44 SS#45

page 6
Table 2.2 Summary of Substation Sites and Ground Motions
Substation Owner Soil Type Peak Acc. 0.1 Second Spectral
Acc.
0.2 Second Spectral
Acc.
0.3 Second Spectral
Acc.
Strong Motion
Record at Site
Source of Spectrum
Coalinga
SS#12 PG&E (UBC S1), < 200 ft alluvium overlying sedimentary rock.
0.30g 0.57g 0.66g 0.53g No Abrahamson and Silva, 1997 attenuation
Landers
SS#5 SCE Quaternary formation - soil 0.35g 0.49g 0.81g 1.29g Yes recording
Loma Prieta
SS#24 PG&E (UBC S1), < 30 ft alluvium overlying sedimentary rock, (NEHRP D - stiff soil 180m/s<Vs<=360 m/s)
0.22g 0.33g 0.43g 0.54g No event specific attenuation
SS#25 PG&E (UBC S1), < 20 ft alluvium overlying sedimentary rock, (NEHRP C - very dense soil and soft rock 360 m/s<Vs<=760 m/s)
0.24g 0.35g 0.47g 0.58g No event specific attenuation
SS#26 PG&E (UBC S2), >2000 ft alluvium with some <20 ft soft clay layers overlying sedimentary rock, (NEHRP D - stiff soil 180m/s<Vs<=360 m/s)
0.22g 0.32g 0.43g 0.54g No event specific attenuation
SS#28 PG&E (UBC S3), >500 ft alluvium/estuarine with some >20 ft bay mud layers overlying metavolcanic rock, (NEHRP D - stiff soil 180m/s<Vs<=360 m/s)
0.13g 0.21g 0.29g 0.36g No event specific attenuation
SS#39 PG&E (UBC S2), <20 ft bay mud overlying >200 ft alluvium/estuarine overlying metavolcanic rock, (NEHRP E - soft clay Vs<=180 m/s)
0.10g 0.20g 0.30g 0.40g No event specific attenuation

page 7
Table 2.2 (cont.) Summary of Substation Sites and Ground Motions
Substation Owner Soil Type Peak Acc. 0.1 Second Spectral
Acc.
0.2 Second Spectral
Acc.
0.3 Second Spectral
Acc.
Strong Motion
Record at Site
Source of Spectrum
Morgan Hill
SS#20 PG&E SS#21 PG&E less than 200 ft alluvium overlying
metavolcanic rock: UBC S1 NEHRP D: stiff soil (180m/s<Vs<=360 m/s)
0.043g
0.081g
0.10g
0.10g
No
Abrahamson and Silva, 1997 attenuation
SS#24 PG&E less than 30 ft alluvium overlying sedimentary rock: UBC S1 NEHRP D: stiff soil (180m/s<Vs<=360 m/s)
0.24g
0.42g
0.53g
0.51g
No
Abrahamson and Silva, 1997 attenuation
North Palm Springs
SS#7 SCE Quaternary formation - alluvial fan deposits 1.14g 1.99g 1.71g 1.27g Yes recording
Northridge
SS#3 LADWP Quaternary formation - soil 0.29g 0.46g 0.73g 0.66g No event specific attenuation
SS#31 SCE Quaternary formation - soil 0.54g 0.65g 0.68g 0.66g Yes recording SS#34 LADWP Tertiary formation - soft rock 0.90g 1.00g 1.45g 1.82g Yes recording SS#35 LADWP Quaternary formation - soil 0.45g 0.88g 0.86g 1.29g Yes recording SS#36 LADWP Tertiary formation - soft rock 0.45g 0.72g 1.04g 1.03g No event specific
attenuation SS#37 LADWP unknown No SS#38 LADWP Quaternary formation - soil 0.38g 0.64g 0.95g 0.90g No event specific
attenuation SS#41 SCE Quaternary formation - soil 0.56g 0.83g 1.12g 1.37g No event specific
attenuation SS#44 LADWP Quaternary formation - soil 0.80g 0.99g 1.18g 1.25g Yes** recording SS#45 SCE Mesozoic formation - hard rock 0.13g 0.23g 0.33g 0.32g Yes event specific
attenuation
** Recording was at nearby SS#47
Table 2.2 (cont.) Summary of Substation Sites and Ground Motions

page 8
Substation Owner Soil Type Peak Acc. 0.1 Second Spectral
Acc.
0.2 Second Spectral
Acc.
0.3 Second Spectral
Acc.
Strong Motion
Record at Site
Source of Spectrum
Point Mugu
SS#40 SCE Quaternary formation - soil 0.12g 0.22g 0.25g 0.24g Yes* Abrahamson and Silva, 1997 attenuation
San Fernando
SS#1 SCE Quaternary formation - soil 0.07g 0.12g 0.20g 0.18g No event specific attenuation
SS#8 SCE Mesozoic formation - hard rock 0.23g 0.36g 0.59g 0.49g No event specific attenuation
SS#18 SCE Quaternary formation - soil 0.14g 0.24g 0.41g 0.36g No event specific attenuation
SS#19 SCE Quaternary formation - soil 0.10g 0.18g 0.31g 0.27g No event specific attenuation
SS#23 SCE Quaternary formation - soil 0.15g 0.25g 0.44g 0.39g No event specific attenuation
SS#41 SCE Quaternary formation - soil 0.56g 0.92g 1.65g 1.57g No event specific attenuation
SS#45 SCE Mesozoic formation - hard rock 0.19g 0.30g 0.52g 0.39g No event specific attenuation
Santa Barbara
SS#13 SCE Tertiary formation - soft rock 0.25g 0.52g 0.86g 0.54g Yes recording
Sierra Madre
SS#14 SCE Quaternary formation - soil 0.21g 0.39g 0.45g 0.42g No Abrahamson and Silva, 1997 attenuation
* recording was not used due to high noise level

page 9
Table 2.2 (cont.) Summary of Substation Sites and Ground Motions
Substation Owner Soil Type Peak Acc. 0.1 Second Spectral
Acc.
0.2 Second Spectral
Acc.
0.3 Second Spectral
Acc.
Strong Motion
Record at Site
Source of Spectrum
Tejon Ranch
SS#9 CDWR Firm 0.10g Yes recording
Whittier Narrows
SS#1 SCE Quaternary formation - soil 0.09g 0.18g 0.22g 0.18g No event specific attenuation
SS#4 SCE Quaternary formation - soft alluvium 0.22g 0.41g 0.51g 0.43g No event specific attenuation
SS#6 SCE Quaternary formation - soil 0.15g 0.28g 0.36g 0.30g No event specific attenuation
SS#8 SCE Mesozoic formation - hard rock 0.23g 0.41g 0.56g 0.41g No event specific attenuation
SS#10 SCE Quaternary formation - soil 0.12g 0.26g 0.31g 0.24g No event specific attenuation
SS#15 SCE Mesozoic formation - hard rock 0.19g 0.34g 0.45g 0.36g No event specific attenuation
SS#16 SCE Quaternary formation - soil 0.13g 0.24g 0.30g 0.26g No event specific attenuation
SS#17 SCE Quaternary formation - soil 0.11g 0.25g 0.30g 0.23g No event specific attenuation
SS#19 SCE Quaternary formation - soft alluvium 0.18g 0.33g 0.43g 0.38g Yes event specific attenuation
SS#22 SCE Quaternary formation - soil 0.12g 0.24g 0.29g 0.22g No event specific attenuation
SS#23 SCE Quaternary formation - firm soil 0.23g 0.53g 0.57g 0.44g No event specific attenuation
SS#27 SCE Quaternary formation - soil 0.25g 0.49g 0.57g 0.48g No event specific attenuation
SS#29 SCE Tertiary formation - soft rock 0.45g 0.67g 1.02g 0.99g No event specific attenuation

page 10
Table 2.2 (cont.) Summary of Substation Sites and Ground Motions
Substation Owner Soil Type Peak Acc. 0.1 Second Spectral
Acc.
0.2 Second Spectral
Acc.
0.3 Second Spectral
Acc.
Strong Motion
Record at Site
Source of Spectrum
Whittier Narrows (cont.)
SS#30 SCE Quaternary formation - soil 0.51g 0.82g 0.90g 0.62g Yes recording SS#32 SCE Quaternary formation - soil 0.24g 0.43g 0.51g 0.42g No event specific
attenuation SS#42 SCE Quaternary formation - soil 0.25g 0.53g 0.62g 0.49g No event specific
attenuation SS#43 SCE Quaternary formation - soil 0.24g 0.44g 0.56g 0.47g No event specific
attenuation SS#46 SCE Quaternary formation - soil 0.24g 0.50g 0.59g 0.50g No event specific
attenuation
Whittier Narrows - Aftershock
SS#1 SCE Quaternary formation - soil 0.06g 0.11g 0.13g 0.12g No event specific attenuation
SS#2 SCE Quaternary formation - soil 0.20g 0.33g 0.40g 0.41g No event specific attenuation
SS#4 SCE Quaternary formation - soil 0.11g 0.22g 0.23g 0.21g No event specific attenuation
SS#6 SCE Quaternary formation - soil 0.08g 0.16g 0.17g 0.15g No event specific attenuation
SS#8 SCE Mesozoic formation - hard rock 0.11g 0.23g 0.31g 0.15g No event specific attenuation
SS#11 SCE Quaternary formation - soil 0.11g 0.17g 0.19g 0.21g No event specific attenuation
SS#15 SCE Mesozoic formation - hard rock 0.08g 0.16g 0.22g 0.10g No event specific attenuation
SS#23 SCE Quaternary formation - firm soil 0.22g 0.38g 0.43g 0.38g No event specific attenuation
SS#33 SCE Tertiary formation - soft rock 0.18g 0.33g 0.42g 0.32g No event specific attenuation
page 11
Table 2.3 Summary of 230 kV and 500 kV Substation Equipment in Database
Earthquake Substation PGA Utilities Working
Group Class▲
Damaged (# items)
Undamaged (# items)
Coalinga SS#12 0.30g CB15A 1 8 CB20A 0 33 CB74 0 6 LA5 1 3 TR1 0 3 TR3 4 0 Landers SS#5 0.35g CB20A 0 24 DS3 6 48 LA1 0 15 TR2 0 5 Loma Prieta SS#24 0.22g CB9 0 6 CB20 0 18 CB20A 0 24 CB72s 7 2 CB77 0 3 CC1 0 25 CC5 0 6 CT5 6 3 DS1 1** 23 DS2 0 35 DS3 0 20 LA1* 1 12 LA5* 0 4 TR1 0 9 TR3 4 3 WT1 0 5 WT2 0 6 SS#25 0.24g CB20 0 3 CB20A 0 21 CB78 0 3 CC1 1 2 DS3 6 117 LA1 6 4 TR1 3 7 WT1* 0 3 Bus Support 3 0*
* High likelihood of more items at the site ** Interaction failure likely ▲ Descriptions of Utilities Working Group Classes are found in Table 4.1

page 12
Table 2.3 (cont.) Summary of 230 kV and 500 kV Substation Equipment in Database
Earthquake Substation PGA Utilities Working
Group Class
Damaged (# items)
Undamaged (# items)
Loma Prieta SS#26 0.22g CB20A 2** 34 CB72s 12 0 CB77 0 3 CC1 0 4 CC5 6 3 CT5 10 2 DS1 25 17 DS2 12** 0 DS2* 1 2 DS3* 1 115 LA1* 0 8 LA5* 0 4 TR1 0† 16 TR3 0† 4 TR4 0† 1 WT1 0 4 WT2 2 4 500kV Rigid
Bus* 2 4
SS#28 0.13g CB9 2 7 CB20A 0 32 TR1 0 9 SS#39 0.10g CB9 3 0 CB14 7 2 CB20A 0 24 CC1 2 1 DS3 7 2* LA1 0 10 TR1 4 6 Bus Support 6 0* Morgan Hill SS#20 CS (115 kV) 1 0 SS#21 0.043g CB15 0 6 CB15A 1 2 CB20 0 6 CB20A 0 3 CB72 7 11 CB74 0 18 TR1 0 3 TR3 0 3
* High likelihood of more items at the site ** Interaction failure likely † Minor oil leaks with no impact on service

page 13
Table 2.3 (cont.) Summary of 230 kV and 500 kV Substation Equipment in Database
Earthquake Substation PGA Utilities Working
Group Class
Damaged (# items)
Undamaged (# items)
Morgan Hill SS#24 0.24g CB9 0 6 CB20 0 15 CB20A 0 12 CB72s 1 11 CB74 0 15 CC1* 0 1 CC5 0 5 CT5 0 12 DS1 0 24 DS2* 0 6 LA1* 1 13 LA5 0 7 TR1 0 9 TR3 0 7 WT2 0 4 North Palm Springs SS#7 1.14g CB5 6 0 CB9 6 0 CB20 0 9 CB20A 0 24 CB73 0 3 CC5 4 2 CT5 8 1 DS1 9 18 DS3 6 84 LA1 7 2 LA5 9 1 PT1 6 0 PT5 10 0 TR2 0 4 TR3 4 0 WT2 2 2 MODS 6 3 Post Insulator* 70 8 Shunt Reactor 4 2 Northridge SS#3 0.29g LA1 1 20 TR2 3 4 SS#31 0.54g CB9 7 2 CB14 15 0 CB20 0 45 CC1 19 26 DS3 138†† 0 PT1 0 6 WT1 0 13
* High likelihood of more items at the site †† 75 phases only required readjustment

page 14
Table 2.3 (cont.) Summary of 230 kV and 500 kV Substation Equipment in Database
Earthquake Substation PGA Utilities Working
Group Class
Damaged (# items)
Undamaged (# items)
Northridge SS#34 0.90g CB20 0 87 CC1 14 40 CC5 3 3 DS1 6 0 DS3 18 156 LA5 2 6 PT1 0 6 TR1 12 0 TR3 9 0 WT1 11 4 WT2 3 3 SS#35 0.45g CB20A 0 114 CC1 0 27 CS2 3 3 DS2 1 119 DS1 2 4 LA1 3 18 LA5 3 0 PT1 1 1 PT5 0 3 TR2 2 5 TR3 0 6 WT1 1 4 WT2 0 3 Pothead 0 9 SS#36 0.45g CB20A 0 72 CC1 0 24 PT1 0 6 DS2 18 54 LA1 9 3 TR2 3 1 WT1 1 7 SS#37 unknown CB no CBs at site LA1 6 3 TR2 2 1 SS#38 0.38g CB20A 0 54 CC1 0 18 DS3 90 27 LA1 11 10 PT1 2 0* TR1 2 2 WT1 3 1 Pothead 0 9
page 15
Table 2.3 (cont.) Summary of 230 kV and 500 kV Substation Equipment in Database
Earthquake Substation PGA Utilities Working
Group Class
Damaged (# items)
Undamaged (# items)
Northridge SS#41 0.56g CB No CBs at site
DS3 0 6 LA1 0 6 TR2 1 1 SS#44 0.80g CB20 0 12 CB20A 0 45 CC1 3 33 CS1 17 0 DS3‡ 25 101 LA1 0 12 PT1 4 8 TR2 1 1 WT1 2 5 SS#45 0.13g CB15 1 8 CB20 0 33 CB57 0 21 CB72s 2 4 CB73 0 9 CB77 0 6 CT1 0 24 CT5 2 13 DS1 21 45 DS3 0 108 LA1 0 10 LA5 7 21 TR3 3 7 WT2 0 10 Post Insulator* 4 60 Pt. Mugu SS#40 0.12g CB20A 0 54 DS3 0 108 LA1 0 6 TR2 0 2 San Fernando SS#1 0.07g CB20 0 75 DS3 0 150 LA1 0 24 TR1 0 13 TR2 0 6 SS#8 0.23g CB20 0 6 CB20A 0 12 DS3 0 42 LA1 0 7 TR1 0 7
* High likelihood of more items at the site ‡ 24 phases mounted on heavily braced support structures

page 16
Table 2.3 (cont.) Summary of 230 kV and 500 kV Substation Equipment in Database
Earthquake Substation PGA Utilities Working
Group Class
Damaged (# items)
Undamaged (# items)
San Fernando SS#18 0.14g CB20 0 54 DS3 0 108 LA1 0 15 TR2 0 5 SS#19 0.10g CB9 1 5 CB20 0 39 CB20A 0 3 DS3 0 102 LA1 0 6 TR1 0 6 SS#41 0.56g DS3 4 2* LA1 1 6 TR1 1 6 SS#44 CB9 33 0 PT1 10 2 SS#45 0.19g CB15 0 12 CB20 0 48 CB72 9 9 DS1* 1 17 DS3 0 96 LA1 0 10 LA5 1 24 TR3 2 8 Post Insulator 2 106 Santa Barbara SS#13 0.25g CB20A 0 12 DS3 0 36 LA1 0 12 PT1 0 6 TR1 7 5 Sierra Madre SS#14 0.21g CB14 5 7 DS3 0 30 TR2 0 2 Tejon Ranch SS#9 0.10g CB14 10† 8 DS2 1 77 LA1 0 24 TR2 1 7 Whittier Narrows SS#1 0.09g CB9 2 10 CB20 0 63 DS3 0 150 LA1 0 24 TR1 1 12 TR2 0 6
* High likelihood of more items at the site † Includes one phase on base isolators

page 17
Table 2.3 (cont.) Summary of 230 kV and 500 kV Substation Equipment in Database
Earthquake Substation PGA Utilities Working
Group Class
Damaged (# items)
Undamaged (# items)
Whittier Narrows SS#4 0.22g CB9 6 0 CB20 1 17 CB20A 0 18 DS3 0 84 LA1 0 12 TR1 0 6 TR2 1 2 SS#6 0.15g CB9 9 21 DS3 0 66 LA1 0 9 TR2 0 3 SS#8 0.23g CB20 0 6 CB20A 0 12 DS3 0 42 LA1 0 7 TR1 0 7 SS#10 0.12g CB9 0 6 CB14 0 6 CB20 0 12 CB20A 0 6 DS3 0 66 LA1 0 6 TR2 0 2 SS#15 0.19g CB20 0 12 DS3 0 30 LA1 0 6 TR1 0 6 SS#16 0.13g CB14 5 10 CB20 0 12 CB20A 0 12 DS3 0 78 LA1 0 6 TR2 0 2 SS#17 0.11g CB9 1 23 CB20 0 36 DS3 0 120 LA1 0 9 TR2 0 3 SS#19 0.18g CB9 3 3 CB20 0 39 CB20A 0 3 DS3 0 102 LA1 0 6 TR1 0 6 TR2 0 1

page 18
Table 2.3 (cont.) Summary of 230 kV and 500 kV Substation Equipment in Database
Earthquake Substation PGA Utilities Working
Group Class
Damaged (# items)
Undamaged (# items)
Whittier Narrows SS#23 0.23g CB9 24‡ 0 CB20 0 36 DS3 0 120 LA1 1 5 TR2 0 2 SS#30 0.51g CB20A 0 21 DS3 0 48 LA1 0 10 TR1 5 5 SS#46 0.24g CB20A 1 23 DS3 0 57 LA1 0 9 TR2 1 2 Whittier Narrows SS#4 0.11g CB9 1 2* Aftershock TR2 2 1 SS#6 0.08g CB9 3 27
* High likelihood of more items at the site ‡ 17 CB9 functional immediately after earthquake, but eventually developed leaks
2.4. Limitations of Damage Data While the data in summarized in Section 2.3 can be used to perform statistical analyses on substation equipment, the data should be used with caution. There are a number of limitations that may make it difficult to draw specific conclusions or to make comparisons with fragility curves. Some of these limitations are detailed below. Undamaged equipment may be missing from database - Particularly for older earthquakes, reconnaissance teams only documented damaged equipment. Estimates of undamaged equipment were developed from looking at single line drawings of substations or the PG&E RCMS database. In some cases, available single lines indicate the current situation, which may differ from the configuration at the time of the earthquake. Similarly, the RCMS database includes transformers and circuit breakers that are currently at the substation. Individuals familiar with the substation helped to identify when and what types of changes in equipment may have occurred at the substation. Damaged equipment is not always visibly damaged - It is not always clear from walking through a site if equipment has been damaged. Slightly damaged equipment may not malfunction until later. For example, due to a gasket leak, a circuit breaker may experience a slow loss of sulfur-hexafluoride (SF-6) gas, and only start to malfunction after most of the gas has been released. Someone visiting the site immediately after an earthquake may not identify this as a piece of damaged equipment. Similarly, a disconnect switch may be out of alignment, but because it is open or high overhead, the problem may be overlooked by someone walking through the site. A

page 19
complete reconnaissance report requires several visits to the substation after an earthquake to talk with operators for the purpose of validating damage data. For more recent earthquakes this has been done. For older earthquakes, it is possible some damaged equipment may have been overlooked. Equipment may be damaged but functional - For the purposes of evaluating performance of the power grid immediately after an earthquake, the analyst is most interested in equipment that will not be functional. A transformer with sheared anchorage bolts that has slid several inches, is technically damaged. It, however, may still function properly and will be taken off-line at some later date to repair the anchorage details. Another example of a difficulty in analyzing damage data, is disconnect switches that are out of alignment. Disconnect switches that are out of alignment, sometimes may be manually closed or tied shut to maintain the integrity of the network. These can be realigned or replaced at a later date. The database does not always indicate whether damaged equipment was functional or not. The type of damage may be unclear - Depending on the quality of the reconnaissance report, the type and severity of equipment damage may not be specified. For example, one or all of the support columns on a disconnect switch may be damaged. If only one column is damaged, it is possible the switch can be repaired rapidly by replacing it with spares on the site. If all of the columns are damaged and the switch is lying on the ground, the switch may have to be replaced and the repair time will be longer. Since failure modes are not always included in the database, it may be difficult to compare damage data with specific fragility curves. Damage due to interaction may not be identified - Damage to equipment may be caused by one piece of equipment pulling or pushing on another piece. It is possible that the same piece of equipment would not have been damaged if it had not been attached to anything else or if the conductor had more slack. Unfortunately, damage due to interaction is not always easy to identify after an earthquake. Except in a few cases, damage caused by interaction is not identified in the database. The period of equipment motion may be altered by the support system - Similar types of equipment may be mounted on very different types of support systems. Support frames can be very stiff or very flexible. Some of the 230 kV equipment is mounted on tall bus structures, 60 feet above the ground. Using peak ground acceleration for developing fragility data does not account for the filtering of ground motion by the support structure. Similarly, the use of response spectra developed from ground motion records does not account for filtering of motion by the support structure. Synthetic ground motions may not account for site specific ground conditions - Substation ground motions and spectra developed from event specific attenuation relations are based on geologic conditions at the site. They do not take into account surface soils conditions, or variations in soil types and depths at the site. Thus, at best, they are only an approximation of the ground motion that may have actually occurred at the site.
page 20
Seismic design of equipment may not be identified – Greatly varying seismic requirements are used for some types of equipment. The database may lump all equipment into a single category , although some of the equipment may be seismically qualified. For example, older disconnect switches had no seismic design requirements or were designed for a low static coefficient, whereas new disconnect switches are shake table tested. Therefore the expected performance of newer switches can be greatly different than that of older switches.
3. Essential Parameters for Defining Equipment Fragilities Figures 3.1 through 3.8 summarize the key parameters needed to define equipment fragilities from earthquake damage data. It is recommended that these data be collected for all equipment on future earthquake reconnaissance visits. The items in solid boxes are essential for a complete definition of the fragilities. The items in dashed boxes are less critical. Each figure has two branches. The left branch describes attributes, specific to a particular type of equipment, which can be collected and cataloged before an earthquake. These attributes impact how the equipment will respond to a certain level of ground motion. For example, a composite insulator will be more rugged than a porcelain insulator; a well-braced radiator will have better performance than one with no bracing. To some extent these parameters were used to develop the equipment classification system described in Section 4. The right branch describes the seismic input and the type of damage. These data can only be collected after the earthquake has occurred.

page 21
Figure 3.1 Key parameters for defining seismic damage to a disconnect switch.
Vendor and Model
Type of Seismic Qualification none
dynamic analysis shake table tested
Support Configuration ground mounted or elevated
flexible or rigid seismic design?
support used in equipment qualification?
Type of Post Insulator porcelain composite
cantilever strength BIL
Type vertical break
horizontal break V-switch
Ground Motion PGA
spectral acceleration
Description of Damage type
severity functionality of equipment
Damage Caused by Interaction? description of interaction
Defined Failure Mode misaligned - functional
misaligned - nonfunctional one column failed two columns failed
other mode
Disconnect Switch
Slack and Conductor Type
Voltage kV

page 22
Figure 3.2 Key parameters for defining seismic damage to a transformer.
Transformer
Voltage kV high kV low
Ground Motion PGA
spectral acceleration
Description of Damage type
severity functionality of equipment
Defined Failure Mode bushing damage -gasket
bushing damage - porcelain radiator damage
anchorage failure - sliding anchorage failure - toppling
foundation failure
Damage Caused by Interaction? description of interaction
Anchorage Type and Quality welded to embedment
rail mounted anchor bolts
Type of Seismic Qualification
Vendor and Model MVA Rating
Operating Weight Number of Phases
Bushing Vendor, Model and Type porcelain composite
Type of Bushing Seismic Qualification
Radiator Configuration two manifolds
many manifolds
Radiator Seismic Qualification and Bracing
none well braced
Transformer Foundation Type
Lightning Arrester mount design
slack and fail path
Type of Conductor

page 23
Figure 3.3 Key parameters for defining seismic damage to a circuit breaker.
Figure 3.4 Key parameters for defining seismic damage to a circuit switcher.
Type dead tank live tank bulk oil
Vendor and Model
Bushing Type porcelain composite
BIL
Type of Seismic Qualification none
dynamic analysis shake table tested
Voltage kV
Ground Motion PGA
spectral acceleration
Description of Damage type
severity functionality of equipment
Defined Failure Mode gasket leak
one column failed two columns failed
Circuit Breaker
Damage Caused by Interaction? description of interaction
Slack and Conductor Type
Vendor and Model
Type of Seismic Qualification none
dynamic analysis shake table tested
Type of Post Insulator porcelain composite
cantilever strength BIL
Voltage kV
Ground Motion PGA
spectral acceleration
Description of Damage type
severity functionality of equipment
Defined Failure Mode misaligned - functional
misaligned - nonfunctional one column failed two columns failed
Circuit Switcher
Damage Caused by Interaction? description of interaction Slack and Conductor Type

page 24
Figure 3.5 Key parameters for defining seismic damage to a coupling capacitor voltage transformer.
Vendor and Model
Slack and Conductor Type
Support Structure hanging or ground mounted
flexible or rigid seismic design?
type of seismic qualification
Voltage kV
Type of Seismic Qualification none
dynamic analysis shake table tested
Ground Motion PGA
spectral acceleration
Description of Damage type
severity functionality of equipment
Defined Failure Mode porcelain damage
support structure damage
Coupling Capacitor Voltage
Damage Caused by Interaction? description of interaction
Coupling Capacitor Type porcelain composite
BIL

page 25
Figure 3.6 Key parameters for defining seismic damage to a lightning arrester.
Vendor and Model
Support Structure transformer mounted
transformer boom mounted independent support - rigid
independent support – flexible type of seismic qualification
Voltage kV
Type of Arrester porcelain composite
BIL
Ground Motion PGA
spectral acceleration
Description of Damage type
severity functionality of equipment
Defined Failure Mode porcelain damage
Lightning Arrester
Damage Caused by Interaction? description of interaction
Slack and Conductor Type
Type of Seismic Qualification none
dynamic analysis shake table tested

page 26
Figure 3.7 Key parameters for defining seismic damage to a current transformer
Vendor and Model
Slack and Conductor Type
Support Structure flexible or rigid seismic design?
type of seismic qualification
Voltage kV
Type of Seismic Qualification none
dynamic analysis shake table tested
Ground Motion PGA
spectral acceleration
Description of Damage type
severity functionality of equipment
Defined Failure Mode porcelain damage
support structure damage
Current Transformer
Damage Caused by Interaction? description of interaction
Current Transformer Type porcelain composite
BIL

page 27
Figure 3.8 Key parameters for defining seismic damage to a wave trap.
Vendor and Model
Voltage kV
Support Structure hanging or ground mounted
flexible or rigid seismic design?
type of seismic qualification
Type of Seismic Qualification none
dynamic analysis shake table tested
Ground Motion PGA
spectral acceleration
Description of Damage type
severity functionality of equipment
Defined Failure Mode damage to restraints
internal damage to wave trap support structure damage
Wave Trap
Damage Caused by Interaction? description of interaction
Slack and Conductor Type

page 28
4. Utilities Working Group Equipment Classes In September 1993, a group of experts from several California utilities convened to evaluate the quality of earthquake damage data available for developing equipment damage relationships. This Utilities Working Group (UWG) developed a standardized classification system for referring to substation equipment. The classification system referred only to equipment with voltage of 220 kV and higher and was organized so that equipment with similar performance characteristics would be grouped together. For example, live tank circuit breakers have large tanks mounted on top of porcelain insulators, whereas dead tank breakers have the tank at the base. As a result, live tank circuit breakers tend to be more vulnerable to seismic motion than dead tank circuit breakers. The classification system has been modified somewhat in this report to simplify some categories. The classification system used in this study is summarized in Table 4.1. For each of the UWG classes, the experts defined failure modes and developed opinion-based fragility curves. The fragility curves are described in more detail in Section 5 and Appendix D.
Table 4.1: Utilities Working Group Substation Equipment Classes
Transformer TR1 1-phase 230 kV transformer TR2 3-phase 230 kV transformer TR3 1-phase 500 kV transformer TR4 3-phase 500 kV transformer Circuit Breaker CB5 500 kV Cogenel old CB9 230 kV live tank GE ATB4-6 CB14 230 kV live tank GE ATB7 CB15 500 kV live tank GE ATB CB15a 500 kV live tank other CB20 230 kV dead tank SF6 CB20a 230 kV dead tank oil CB57 230 kV live tank modern CB72 500 kV live tank WES-SF6 CB72s 500 kV live tank WES-SF6, seismically modified CB73 500 kV live tank puffer CB74 220 kV or 500 kV CB unknown CB77 500 kV dead tank SF6 CB78 230 kV modern Brown Boveri dead tank SF6 (3 phase) Disconnect Switch DS1 500 kV vertical switch DS2 230 kV vertical switch DS3 MODS
230 kV horizontal switch 230 kV Motorized Disconnect Switch
(continued)

page 29
Table 4.1 (cont.): Utilities Working Group Substation Equipment Classes
Lightning Arrester LA1 230 kV low seismic design LA2 230 kV medium seismic design LA3 230 kV high seismic design LA4 230 kV composite column LA5 500 kV low seismic design LA6 500 kV medium seismic design LA7 500 kV high seismic design LA8 500 kV composite column Current Transformer CT1 230 kV low seismic design CT2 230 kV medium seismic design CT3 230 kV high seismic design CT4 230 kV composite CT5 500 kV low seismic design CT6 500 kV medium seismic design CT7 500 kV high seismic design CT8 500 kV composite Coupling Capacitor Voltage Transformer CC1 230 kV low seismic design CC2 230 kV medium seismic design CC3 230 kV high seismic design CC4 230 kV composite CC5 500 kV low seismic design CC6 500 kV medium seismic design CC7 500 kV high seismic design CC8 500 kV composite Potential Transformer PT1 230 kV low seismic design PT2 230 kV medium seismic design PT3 230 kV high seismic design PT4 230 kV composite PT5 500 kV low seismic design PT6 500 kV medium seismic design PT7 500 kV high seismic design PT8 500 kV composite Wave Trap WT1 230 kV wave trap WT2 500 kV wave trap Circuit Switcher CS1 230 kV circuit switcher

page 30
5. Comparison of Database Statistics with Utilities Working Group Fragilities Developing new fragility curves based solely on the available equipment damage data was beyond the scope of this project. In many cases, the damage data are insufficient to adequately define a fragility curve. Two key reasons for this are lack of data (too few points) or incomplete data (missing failure modes). To overcome these difficulties, Der Kiureghian (1999) is developing a methodology that uses Bayesian techniques to update the existing opinion-based fragility curves with the damage data. For selected equipment, damage data is compared with opinion-based curves to provide a rough determination of whether the opinion-based curves are reasonable. Note that peak ground acceleration is used for the comparison, not because it is the best indicator of potential damage, but because the opinion-based fragility curves are defined using PGA. Parameters and plots of UWG fragilities for all equipment types are found in Appendix C.
5.1. Failure Modes Comparison of equipment damage data with fragilities requires a standardized approach for reporting damage. As indicated in Figures 3.1 through 3.8, well-defined standardized failure modes are an essential element of the fragility curve definition. Failure modes that have been defined by the UWG are summarized in Table 5.1. In all cases where a number is used it should be read “at least”. For example, for TR2 or TR4, the third failure mode should read “At least 3 Main Porcelain Gasket Leaks”. These failure modes could be further refined by indicating if the damaged equipment is functional or non-functional immediately after the earthquake. For each type of equipment in the table, as one moves down the list, the failure modes are progressively more disruptive and expensive to repair. Some of the failure modes in Table 5.1 are mutually exclusive. In this case the relationship between the fragility curves is relatively simple and probability of a failure mode can be determined by addition or subtraction. For example, for a three-phase transformer, at least one main bushing leak (L1) is an exclusive event from at least two main bushings leaking (L2) or at least three main bushings leaking (L3). Then the probability of exactly one column leaking is P(L2) - P(L1) and the probability of exactly two columns leaking is P(L3) - P(L2). In other cases the failure modes may occur simultaneously and may or may not be independent of one another. For example, it is possible to have anchorage failure (FM1) with or without a major break (FM2) in the radiator. In cases like this, probability of damage defined as the occurrence of FM1 or FM2 or both may be determined using a fault tree. An example of such an approach is found in NIBS (1997).

page 31
Table 5.1: Failure Modes for Substation Equipment Classes
Equipment Failure Modes Single Phase Transformers (TR1, TR3) 1 Main Porcelain Gasket Leak
1 Main Porcelain Break Major Break in Radiator Anchorage Failure Transformer Overturn
Three Phase Transformers (TR2, TR4) 1 Main Porcelain Gasket Leak 2 Main Porcelain Gasket Leaks 3 Main Porcelain Gasket Leaks 1 Main Porcelain Break 2 Main Porcelain Breaks 3 Main Porcelain Breaks Major Break in Radiator Anchorage Failure Transformer Overturn
Live Tank Circuit Breakers (CB9, CB15, CB15A)
Column Base Gasket Leak 1 Porcelain Column Fails 2 Porcelain Columns Fail
Live Tank Circuit Breakers (CB72)
Head Porcelain Damage 1 Porcelain Column Fails 2 Porcelain Columns Fail 3 Porcelain Columns Fail
Live Tank Circuit Breakers (CB14, CB57, CB73)
1 Porcelain Column Fails 2 Porcelain Columns Fail
Dead Tank Circuit Breakers (CB20, CB77)
1 Porcelain Column Fails 2 Porcelain Columns Fail
Dead Tank Circuit Breakers (CB20A)
Anchorage Fails 1 Porcelain Column Fails 2 Porcelain Columns Fail
500 kV Cogenel Circuit Breaker (old) Collapse of All Columns
500 kV Vertical Disconnect Switch Misaligned Contacts Porcelain Column Fails
230 kV Disconnect Switch Misaligned Contacts Broken Porcelain
Lightning Arrester Failure of Porcelain Column
Current Transformer Failure of Porcelain Column
Coupling Capacitor Voltage Transformer Failure of Porcelain Column
Potential Transformer Failure of Porcelain Column

page 32
5.2. Data Comparisons Figure 5.1 shows the damage data for General Electric 230 kV live tank ATB4, ATB5 and ATB6 (CB9) plotted for each site along with the UWG fragility curves. The damage probabilities, plotted as solid triangles and an open square, are determined by dividing the number of damaged items by total number of items at a site. The plotted data do not include information about failure modes. In this figure, data from each site was plotted separately even though in some cases different sites experienced nearly identical peak ground accelerations. Data for sites with similar ground motion are combined in Figure 5.2. Plotting data for each site is useful for identifying data that deviate significantly from the trend. These deviations may be due to site-specific factors such as soil conditions, ground motion duration or installation procedures that can affect the amount of damage at a particular site. For example, it is possible that the soft soil at the SS#39 substation may have resulted in longer duration of shaking, or there may have been some other effect such as interaction that caused the circuit breakers to fail at a lower PGA than would be expected. Another factor that may result in the high failure probability for SS#39 is that there was only one CB9 circuit breaker (three phases) at the site. A larger sample may have yielded a failure probability that was in better agreement with the data trend. In another case, the circuit breakers at SS#24 in both the Loma Prieta and Morgan Hill earthquakes seemed to have performed better than would be expected at that level of ground motion. It would be worth investigating why these circuit breakers performed so well. Also, it should be noted that ground motion is only reported for one location at a substation. Often this is at the control house. The site conditions at the control house may not be representative of the entire site. In particular, it is possible that the equipment under investigation is founded on a particularly good or bad soil. Two different points represent the damage data for the SS#23 substation during the Whittier Narrows earthquake. This is because the performance of the circuit breakers immediately after the earthquake differs dramatically from the longer-term performance. The square shows that about 30% of the CB9’s were functional immediately after the earthquake. Ultimately all the CB9’s failed due to leaking gas (shown by the triangle). Figures 5.1 and 5.2 suggest that the UWG fragility curves underestimate damage probabilities for ATB4, ATB5 and ATB6 circuit breakers. There are a number of limitation to this analysis, including the fact that a large number of the peak ground accelerations used to plot the data are based on attenuation relationships rather than actual recordings. In addition, PGA is most likely not the best indicator of equipment performance. The fundamental period of this type of circuit breaker is about 0.2 seconds and spectral acceleration may be a better predictor of performance. As stated earlier, spectral acceleration also has limitations in predicting performance, in that the support structure may significantly alter the period of the circuit breaker assembly. For comparison, the same damage data for ATB breakers are plotted versus 0.2-second spectral acceleration in Figure 5.3. Clearly, in Figures 5.1 through 5.3, there are data that deviate significantly from the trend and from the expert-based curves. However additional data would be needed to provide recommendations as to how the curves should be altered.

page 33
Figure 5.1 Comparison of UWG fragility curves with damage data for 230 kV live tank General Electric ATB4 - ATB6 circuit breakers (CB9). Damage data are plotted for each site.
0
0.1
0.2
0.3
0.4
0.5
0.6
0.7
0.8
0.9
1
0 0.2 0.4 0.6 0.8 1 1.2
Peak Horizontal Acceleration (g)
Pro
bab
lity
of
Fai
lure
2 Porcelain Columns Fail Performance Immediately After Eq1 Porcelain Column Fails Damage DataColumn Base Gasket Leak for Individual Sites
Whittier Narrows - SS#23
Loma-Prieta - SS#39Whittier Narrows - SS#4
Morgan Hill - SS#24
Loma Prieta - SS#24

page 34
Figure 5.2 Comparison of UWG fragility curves with damage data for 230 kV live tank General Electric ATB4 - ATB6 circuit breakers (CB9). Data for sites with the same PGA are combined and plotted as a single point.
0
0.1
0.2
0.3
0.4
0.5
0.6
0.7
0.8
0.9
1
0 0.2 0.4 0.6 0.8 1 1.2Peak Horizontal Acceleration (g)
Pro
bab
ility
of
Fai
lure
2 Porcelain Columns Fail Performance Immediately After Eq1 Porcelain Column Fails Damage DataColumn Base Gasket Leak
Whittier Narrows - SS#23

page 35
Figure 5.3 Damage data for 230 kV live tank General Electric ATB4 - ATB6 circuit breakers (CB9) for individual sites plotted against 0.2-second spectral acceleration.
0
0.1
0.2
0.3
0.4
0.5
0.6
0.7
0.8
0.9
1
0 0.25 0.5 0.75 1 1.25 1.5 1.75 20.2 Second Spectral Acceleration (g)
Pro
bab
ility
of
Fai
lure

page 36
Figure 5.4 compares damage data and UWG fragility curves for Westinghouse 500 kV live tank SF6 circuit breakers (CB72). These types of circuit breakers proved to be very vulnerable in the San Fernando earthquake. In an effort to improve performance, CB72 breakers at certain sites were seismically retrofitted using internal prestressing tendons. As can be seen in Figure 5.4, the seismic retrofitting did not always improve the quality of the performance. In general, the damage data indicate that the UWG fragility curves underestimate the failure rate for this type of equipment. The UWG fragility curves should be adjusted upward to reflect the poor performance of this circuit breaker. In addition, the parameters of the curves should be modified so that the curve representing at least one column failing does not cross over the curves for at least two columns failing. Figure 5.5 compares damage data with UWG fragility curves for 230 kV and 500 kV lightning arresters. The damage data does not show a clear trend of increased damage probability with increasing PGA. Lightning arresters can be mounted the top of a transformer, on a boom that is attached to a transformer or on a stand-alone post. Each of these mounts would filter the ground motion differently. The amount of slack on bus drops also affects performance. It is possible that the scatter of the data is a result of not accounting for different mount types and slack. Figure 5.5 does suggest that the minimum level of ground motion needed to trigger damage to a 230 kV lightning arrester is 0.2g rather than the 0.15g defined by the UWG. Figure 5.6 compares damage data with UWG fragility curves for 230 kV horizontal disconnect switches (DS3). Disconnect switches are difficult to compare because they can be mounted on different types of frames and different types of post insulators, which can have a significant affect on performance. Several data points on this figure that deviate significantly from the UWG fragility curves deserve additional explanation. While all of the disconnect switches at SS#31 were damaged (solid triangle), 75 phases required realignment only. A second data point plotted for SS#31 (square), represents the damage probability if only those disconnect switch phases that were severely damaged are counted. The damage probability calculated from SS#39 data is based on incomplete information, since there were an unknown number of disconnect switches at the site. This damage probability is unrealistically high since it does not include the all of the undamaged disconnect switches in the ratio of damaged to total switches. Aside from these few anomalous points, the data indicate that for accelerations less than 0.25g this type of equipment has performed well. Disconnect switches at several substations in the Northridge earthquake, as well as at SS#7 in the North Palm Springs and SS#30 in the Whittier Narrows earthquakes performed particularly well. At SS#44, 24 phases were mounted on heavily braced frames. These had been sine beat tested indicating that they were more modern switches. On average, these performed less well (6 damaged, 18 undamaged) than the phases on less stiff support structures (12 damaged, 120 undamaged). At SS#34, the database indicates that some of the units were seismically qualified. The database provides little insight for the other substations.

page 37
Figure 5.4 Comparison of UWG fragility curves with damage data for 500 kV Westinghouse live tank SF6 circuit breakers (CB72).
��������������������������������������������������������������������������������������������������������������������������������������������������������������
����������������������
���������������������������
������������������������������
�������������������������
��������������������������������
��������������
����������
������������
������
��������
������������������
����
������
����������
����������
�������������������������������������������
������������
�������������������������
��������
������������
������
����������������������
����������������������������
�����������������
������������
��������
����������������������
�������������������
����������������������������
�����������������������
������������������������������������
�����������������������������������������������������������
������������
��������������������
��������������������������������������������������������������������������������������������������������������������������������������������������������
0
0.1
0.2
0.3
0.4
0.5
0.6
0.7
0.8
0.9
1
0 0.2 0.4 0.6 0.8 1
Peak Horizontal Acceleration (g)
Pro
bab
ilty
of
Fai
lure
3 Porcelain Columns Fail
������������������Head Porcelain Damage
2 Porcelain Columns Fail Damage Data - Non-Seismic1 Porcelain Column Fails Damage Data - Seismically Retrofitted

page 38
Figure 5.5 Comparison of UWG fragility curves with damage data for 230 kV and 500 kV lightning arresters with low seismic design (LA1 and LA5).
0
0.1
0.2
0.3
0.4
0.5
0.6
0.7
0.8
0.9
1
0 0.2 0.4 0.6 0.8 1 1.2
Peak Horizontal Acceleration (g)
Pro
bab
lity
of
Fai
lure
LA1 - 230 kV Low Seismic Design LA5 - 500 kV Low Seismic Design
Damage Data (LA1) Damage Data (LA5)
Damage Data (LA1) Series6

page 39
Figure 5.6 Comparison of UWG fragility curves with damage data for 230 kV horizontal disconnect switches (DS3).
0
0.1
0.2
0.3
0.4
0.5
0.6
0.7
0.8
0.9
1
0 0.2 0.4 0.6 0.8 1 1.2
Peak Horizontal Acceleration (g)
Pro
bab
lity
of
Fai
lure
Misaligned Contacts Broken PorcelainMisaligned Contacts - New Broken Porcelain - NewDamage Data (DS3) Damage Excluding Misaligned ContactsDamage
SS#31 - Northridge
SS#39 - Loma Prieta
SS#38 -Northridge
SS#7 - N. Palm Springs
SS#34 - Northridge
SS#44 - Northridge
SS#30 -Whittier Narrows
SS#41 - Northridge

page 40
Figure 5.7 compares UWG fragility curves with damage data for 500 kV disconnect switches (DS1). There are very few data for this equipment class and no clear trends are evident. At SS#26, the database indicates one of the failures may have been due to equipment interaction. Another failure appears to have been a misalignment in which it is not clear if the equipment remained functional. If both of these failures are removed, the failure probability at SS#26 reduces from 0.60 to 0.55. It remains high with respect to the UWG fragility curves. Figure 5.8 compares UWG fragility curves with damage data for single-phase 230 kV transformers (TR1). Transformers can have many different configurations and the data in Figure 5.8 do not discriminate between different configurations. Most of the damaged transformers experienced oil leaks due to gasket damage. The data indicate that gasket leaks are occurring at lower PGA’s than would be predicted by the UWG fragility curves.

page 41
Figure 5.7 Comparison of UWG fragility curves with damage data for 500 kV disconnect switches (DS1).
0
0.1
0.2
0.3
0.4
0.5
0.6
0.7
0.8
0.9
1
0 0.2 0.4 0.6 0.8 1 1.2
Peak Horizontal Acceleration (g)
Pro
bab
lity
of
Fai
lure
Misaligned Contacts Porcelain Column Fails Damage Data (DS1)
SS#26 - Loma Prieta
SS#7 - N. Palm Springs
SS#45 - Northridge SS#35 - Northridge

page 42
Figure 5.8 Comparison of UWG fragility curves with damage data for single-phase 230 kV transformers (TR1).
0
0.1
0.2
0.3
0.4
0.5
0.6
0.7
0.8
0.9
1
0 0.25 0.5 0.75 1 1.25 1.5 1.75 2
Peak Horizontal Acceleration (g)
Cu
mu
lati
ve P
rob
ablit
y o
f F
ailu
re
Transformer Overturn 1 Main Porcelain BreakAnchorage Failure 1 Main Porcelain Gasket LeakMajor Break in Radiator Damage Data (TR1)Series7

page 43
6. Future Database Development The database in its current form provides a useful tool for evaluating damage data from California earthquakes. Several recommendations could be made for improving the database and augmenting its usefulness. First, a more systematic approach to collecting inventory data would be helpful in performing the analysis. This would minimize some of the uncertainty regarding site conditions and equipment types, models, ages, and quantities. Much of the needed information could be collected prior to the earthquake. It seems that a GIS system would be ideal for storing this type of information. The following would be useful: • site maps that include soil conditions for the entire site using a standardized classification
system, • single line drawings of substation yards • electronic databases of equipment that include key information outlined in Section 3 Until recently, little to no information regarding undamaged equipment was included in the database. A concerted effort was made to collect this information for the Loma Prieta and Northridge earthquakes. It seems that the inability to quickly access inventory information made this a difficult task requiring multiple visits to a site and lengthy conversations with site personnel. If single line drawings were easily available, electronically if possible, reconnaissance teams could include damage information directly on the drawings. Unique features of the equipment such as unusual support structures, flexible or rigid buses, or retrofits could be easily identified with specific pieces of equipment using equipment designations from the drawings. Similarly, if electronic databases of equipment were easily assessable, the inaccuracies related to equipment make, model and year could be minimized. It would be helpful if databases included key features such as types of bushings for transformers or seismic qualification information. A second recommendation involves the re-evaluation of equipment classes. The current UWG classes provide a good foundation for a more refined but systematic classification system. For example, bushing type could be included by using a designation of p for porcelain or c for composite. The resulting classes for 230 kV single-phase transformers would be TR1p or TR1s. This type of refinement was used for 500 kV Westinghouse live tank SF6 circuit breakers, where the seismically retrofitted circuit breakers were identified as CB72s. The advantage of this type of system is that all equipment of one type (e.g. TR1) can be evaluated together or they can be subdivided according to specific characteristics. It would be interesting to include data on equipment failure extracted from seismic qualification tests. This would be particularly useful for bushings because damage data includes almost no information with respect to bushings. While the database has a field to include the failure mode, this field is often blank. A more systematic approach to defining and recording the failure modes is needed if realistic comparisons with the UWG fragility curves are to be made.

page 44
The current format of the database with 68 columns of data makes it somewhat awkward to use. Since Excel is not a dedicated database manager, performing queries is difficult. It may be worthwhile to consider converting the Excel file to a database system that is supported by Pacific Gas and Electric. When doing this it may be useful to rethink the organization of the database somewhat.
7. References Abrahamson and Silva (1997). Empirical Response Spectral Attenuation Relations for Shallow Crustal Earthquakes, Seismological Research Letters, 68, pp 94-127. Department of Water and Power of the City of Los Angeles (1971). San Fernando Earthquake of February 9, 1971: Effects on Power System Operation and Electrical Equipment, Internal report of the Power System Design and Construction Division of LADWP. Der Kiureghian, A. (1999). Fragility Estimates for Electrical Substation Equipment, Final Report to Pacific Gas and Electric, in progress. Electric Power Research Institute (1998). The 1986 North Palm Springs Earthquakes: Effects on Power Facilities, EPRI NP-5607, EPRI, Palo Alto, CA. Electric Power Research Institute (1990). The October 1, 1987, Whittier Earthquake: Effects on Selected Power, Industrial, and Commercial Facilities, EPRI NP-7126, EPRI, Palo Alto, CA. Electric Power Research Institute (1991). The October 17, 1989, Loma Prieta Earthquake: Effects on Selected Power and Industrial Facilities, EPRI NP-7500-SL, EPRI, Palo Alto, CA. Electric Power Research Institute (1993). The June 28, 1992, Landers and Big Bear Earthquakes: Effects on Power and Industrial Facilities, EPRI TR-103454, EPRI, Palo Alto, CA. Electric Power Research Institute (1997). The January 17, 1994 Northridge Earthquake: Effects on Electric Power and Selected Industrial Facilities, EPRI TR-106635, EPRI, Palo Alto, CA. Benuska, L. ed. (1990). Loma Prieta Earthquake Reconnaissance Report, Supplement to Vol. 6 of Earthquake Spectra, Earthquake Engineering Research Institute, Oakland, CA. Hall, J. F. ed. (1995). Northridge Earthquake of January 17, 1994 Reconnaissance Report, Supplement C to Vol. 11 of Earthquake Spectra, Earthquake Engineering Research Institute, Oakland, CA. Matsuda, E., Savage, W. U., Williams, K. K., and G. C. Laguens (1991). Earthquake Evaluation of a Substation Network, Lifeline Earthquake Engineering, Technical Council on Lifeline Earthquake Engineering, Monograph No. 4, ASCE, New York, NY.

page 45
Matsuda, E., Abrahamson, N., and Y. B. Tsai (1996). Effects of Strong Ground Motion on Substations in the January 17, 1994 Northridge California Earthquake, PG&E Research and Development Report 005-96.23. NIBS (1997). HAZUS Technical Manual, Volume II, National Institute of Building Sciences, Document Number 5202, Washington, D.C. Schiff, A. J. ed. (1995). Northridge Earthquake: Lifeline Performance and Post-Earthquake Response, Technical Council on Lifeline Earthquake Engineering, Monograph No. 8, ASCE, New York, NY. Schiff, A. J. (1985). The Morgan Hill, California Earthquake of April 24, 1984 - Investigation of Lifelines, Earthquake Spectra, V1, 615-632, Earthquake Engineering Research Institute, Oakland, CA. Schiff, A. J. (1988). The Whittier Narrows, California Earthquake of October 1, 1987 - Response of Lifelines and Their Effect on Emergency Response, Earthquake Spectra, V4, 339-366, Earthquake Engineering Research Institute, Oakland, CA. Schiff, A. J. (1989). Lifeline Response to the Tejon Ranch Earthquake, Earthquake Spectra, V5, 791-812, Earthquake Engineering Research Institute, Oakland, CA. Somerville, P. and N. Smith (1999). Estimates of Ground Motions at Substations from Past Earthquakes, PEER/PGE Final Report, URS Greiner Woodward Clyde Federal Services, Pasadena, CA. Tsai, Y. B. (1993). Impact of Earthquake Strong Ground Motion on Substations, PG&E Research and Development Report 009.3-93.1.

![Wind Farm Electrical Systems.pptx [Read-Only] Farm Electrical Systems.pdf · This adds to equipment and engineering costs and increases the substation footprint. Another ... Wind](https://img.dokumen.tips/doc/110x75/5a8a24657f8b9adb648bd06a/wind-farm-electrical-read-only-farm-electrical-systemspdfthis-adds-to-equipment.jpg)