Embed Size (px)
Citation preview
The author(s) shown below used Federal funds provided by the U.S. Department of Justice and prepared the following final report: Document Title: Development of Advanced Raman Spectroscopy
Methods and Databases For The Evaluation of Trace Evidence and The Examination of Questioned Documents (Phase I)
Author: John R. Lombardi, Marco Leona, Tuan Vo-Dinh,
Philip Antoci Document No.: 227843
Date Received: August 2009 Award Number: 2006-DN-BX-K034 This report has not been published by the U.S. Department of Justice. To provide better customer service, NCJRS has made this Federally-funded grant final report available electronically in addition to traditional paper copies.
Opinions or points of view expressed are those
of the author(s) and do not necessarily reflect the official position or policies of the U.S.
Department of Justice.

Report Title: Development of Advanced Raman Spectroscopy Methods and Databases For The Evaluation of Trace Evidence and The Examination of Questioned Documents (Phase I) Authors: John R. Lombardi, Center for Analysis of Structures and Interfaces, City College of New York (CCNY); Graduate Faculty, Forensic Sciences, John Jay College of Criminal Justice
Marco Leona, The Metropolitan Museum of Art (MMA), New York
Tuan Vo-Dinh, Director of the Fitzpatrick Institute for Photonics and Professor of Biomedical Engineering, Duke University
Philip Antoci, NYPD Crime Laboratory and John Jay College of Criminal Justice
Award Number: 2006-DN-BX-K034
Award Number 2006-DN-BX-K034 1 of 146
This document is a research report submitted to the U.S. Department of Justice. This report has not been published by the Department. Opinions or points of view expressed are those of the author(s)
and do not necessarily reflect the official position or policies of the U.S. Department of Justice.
(blank)
Award Number 2006-DN-BX-K034 2 of 146
This document is a research report submitted to the U.S. Department of Justice. This report has not been published by the Department. Opinions or points of view expressed are those of the author(s)
and do not necessarily reflect the official position or policies of the U.S. Department of Justice.
Abstract:
Researchers from the City University of New York, Fitzpatrick Institute of
Photonics at Duke University, the New York Police Department Crime Lab, and
The Metropolitan Museum of Art formed a multidisciplinary collaborative to
further the application of Raman spectroscopy and non-destructive surface
enhanced Raman scattering (SERS) analysis techniques as applied to the
evaluation of trace evidence and the examination of questioned documents.
Through the sharing of instrumentation (e.g. the only multiwavelength open
architecture Raman/FT-Raman microscope currently available), reference
materials (e.g. a collection of natural and synthetic pigments and inks dating to
the first half of the century), and their respective research expertise the team
developed a much needed reference database of spectra for forensic applications
and cross-validated newly developed techniques for non-destructive SERS
analysis.
Raman spectroscopy is an established and increasingly utilized technique
for the rapid and non-destructive analysis of paints, inks, fibers, mineral residues,
pharmaceuticals, and controlled substances. The technique is applicable to a
variety of substances, but analytes of great forensic interest such as some natural
and synthetic dyes found in textiles, inks, and paints display an excessive
fluorescent background, which limits Raman efficiency in most situations, leading
to poor analytical results.
The team's goal is to further explore the application of Raman
spectroscopy to the evaluation of trace evidence and the examination of
questioned documents, with the aim of solving the problems that have so far
limited the applicability of this technique to the identification of organic colorants
and other materials in trace amounts. This project is divided into two phases.
Phase I methods and results are covered in this report. Based on the success of
Phase, funding for Phase II is currently being requested.
The work in Phase I of the project successfully demonstrated that surface
enhanced Raman scattering (SERS) can be applied to the identification of organic
colorants present in inks, paints, and textile fibers. The techniques we developed
Award Number 2006-DN-BX-K034 3 of 146
This document is a research report submitted to the U.S. Department of Justice. This report has not been published by the Department. Opinions or points of view expressed are those of the author(s)
and do not necessarily reflect the official position or policies of the U.S. Department of Justice.
are especially suited for handling microscopic samples: textile dyes were
successfully identified from samples as small as a one-millimeter section of a
single silk fibril of fifty-micrometer diameter and even from textiles severely
degraded by burial.
The research conducted in Phase I also demonstrated that SERS is a
valuable technique for the identification of organic colorants used in inks and for
the dyeing of textile fibers, as well as for trace analysis of pharmaceuticals and of
drugs of abuse. Analytical procedures for SERS of a number of representative
dyes were developed, the core of a high quality spectral database was assembled
as a proof of concept experiment, and innovative non-destructive approaches were
investigated. To date our colorants database includes approximately 50 natural
and synthetic dyes, and it is, to our knowledge, the first SERS spectral database
ever assembled (in the course of the work, a normal Raman database of
approximately 100 spectra of organic colorants was also assembled). The
database is both chemically inclusive (as dyes belonging to the principal classes
are represented) and spectrally comprehensive, since both SERS spectra obtained
at different wavelengths (488, 633, 785 nm) and normal dispersive Raman (488,
633, 785 nm), and FT-Raman (1064 nm) are included. Scientific articles
describing this first phase of the work were accepted for publication in the Journal
of Forensic Sciences.
Award Number 2006-DN-BX-K034 4 of 146
This document is a research report submitted to the U.S. Department of Justice. This report has not been published by the Department. Opinions or points of view expressed are those of the author(s)
and do not necessarily reflect the official position or policies of the U.S. Department of Justice.
Table of Contents TABLE OF CONTENTS ..................................................................................... 5
EXECUTIVE SUMMARY .................................................................................. 6
I. INTRODUCTION.......................................................................................... 10 1. STATEMENT OF THE PROBLEM ................................................................... 10
1.1 Surface Enhanced RAMAN Spectroscopy (SERS) .............................. 10 1.2 SERS and RAMAN Spectroscopy in Forensic Science ....................... 11
2. STATEMENT OF HYPOTHESIS OR RATIONALE FOR THE RESEARCH ............. 14 2.1 Objectives............................................................................................ 14 2.2 Development of Analytical Protocols and Creation of a SERS Database ................................................................................................... 14 2.3 Non-Destructive Analysis with SERS Nanoprobes ............................. 15 2.4 Non-Destructive Analysis with Matrix Tranfer SERS......................... 16 2.5 Sensitivity Enhancement with Immobilized Colloids .......................... 16
II. METHODS..................................................................................................... 17 1. PREPARATION OF AG COLLOIDS ................................................................ 17 2. RAMAN SPECTRA ....................................................................................... 17 3. MATRIX TRANSFER SERS ......................................................................... 18 4. IMMOBILIZED COLLOIDS ............................................................................ 19
III. RESULTS..................................................................................................... 20 1. STATEMENT OF RESULTS ........................................................................... 20
1.1 Results from the Metropolitan Museum of New York Site-................. 20 1.2 Results from the Duke University site................................................. 23
2. TABLES AND FIGURES ................................................................................ 26
IV. CONCLUSION.......................................................................................... 133 1. DISCUSSIONS OF FINDINGS....................................................................... 133 2. IMPLICATIONS FOR POLICY AND PRACTICE .............................................. 136 3. IMPLICATIONS FOR FURTHER RESEARCH ................................................. 137
V. REFERENCES............................................................................................ 141
VI. DISSEMINATION OF RESEARCH FINDINGS.................................. 143 1. PRESENTATIONS AND INFORMATION EXCHANGE ..................................... 143 2. PUBLICATIONS RESULTING FROM THIS AWARD ........................................ 144
Award Number 2006-DN-BX-K034 5 of 146
This document is a research report submitted to the U.S. Department of Justice. This report has not been published by the Department. Opinions or points of view expressed are those of the author(s)
and do not necessarily reflect the official position or policies of the U.S. Department of Justice.
Executive Summary
Raman spectroscopy is a well-established technique in the forensic
laboratory. It is an ideal tool for its ability to rapidly identify organic and
inorganic compounds in small samples without any need for cumbersome
preparations. Conventional Raman spectroscopy is however plagued by poor
sensitivity and interference from background luminescence and it is not easily
applied to the analysis of some pharmaceuticals and of most organic colorants.
Raman spectroscopy provides a technique for the rapid and non-
destructive analysis of paints, inks, fibers, mineral residues, pharmaceuticals, and
controlled substances. While advances in commercial instrumentation have
rendered the technique routinely accessible and reliable to use, development of
reference databases has not kept pace with the increased use of the technique.
There is a special need for high quality, and comprehensive databases of
pigments, dyes, and inks, which are not available commercially. Moreover, while
the technique is applicable to a variety of substances, some analytes of forensic
interest, such as some natural and synthetic dyes found in textiles, inks, and paints
produce a large fluorescent background obscuring the Raman signal, often leading
to poor analytical results. We have investigated the application of a new ultra-
sensitive technique, surface enhanced Raman scattering (SERS), to the evaluation
of trace evidence and questioned documents.
Raman spectroscopy is characterized by very high spectral resolution,
leading to effective discrimination among various species, and it has the added
advantage of allowing non-destructive, in-situ detection. It is also preferable to
infrared (IR) spectroscopy in that Raman spectra may readily be obtained in
aqueous solution, while the large IR absorption of water precludes use of IR for
many practical applications. However, the low intensity of normal Raman
scattering has prevented its wide application as a sensitive spectroscopic probe.
Furthermore, interference from fluorescence often obscures the much weaker
Raman signal. Surface enhanced Raman scattering (SERS) has been found useful
to overcome these restrictions. The SERS effect is characterized by an enormous
Award Number 2006-DN-BX-K034 6 of 146
This document is a research report submitted to the U.S. Department of Justice. This report has not been published by the Department. Opinions or points of view expressed are those of the author(s)
and do not necessarily reflect the official position or policies of the U.S. Department of Justice.
increase in the Raman intensity (>108) for species adsorbed on rough metal
surfaces compared to that obtained from the same number of molecules in
solution or the gas phase. At the same time, proximity to the surface provides a
non-radiative pathway for relaxation from the excited state, which successfully
quenches fluorescence.
Organic molecules that perform most strongly under SERS conditions are
generally characterized by extensive aromatic systems carrying nitrogen and
oxygen substituents with lone electron pairs. This is often the case for several
molecules of forensic interest such as alkaloids and basic dyes (textile dyes and
inks). It is now generally accepted that there are two major contributions to SERS.
One is due to enrichment of the electric field (EM enhancement) caused by
surface plasmon resonances, while the second involves charge transfer.
Both SERS theories predict that the SERS enhancement requires
nanoscale surface roughness. This may be achieved by several techniques,
including mechanical roughening, chemical etching, vapour deposition of silver
islands, electrochemical roughening and use of metallic colloids in aqueous
solution. The first three techniques are especially useful for the construction of
portable probes for utilization in fieldwork. Colloids, on the other hand, are quite
easy to make, and provide a large surface area, for convenient Raman studies in
the laboratory. Under certain circumstances they may also be useful for portable
probes or in-situ studies. In addition the effects of pH and electrolyte can be
precisely measured.
The potential of SERS in forensic science and in particular in the trace
evidence, controlled substances, and questioned documents fields has been
recently pointed out in a review of analytical tools for forensic science. Research
so far conducted mostly in Europe has shown that SERS can be effectively
applied to problems such as the discrimination of jet printer inks in situ, the fast
identification of synthetic dyes on fiber samples, and the sensitive determination
of narcotics. Recent work conducted at the Department of Scientific Research of
the Metropolitan Museum of Art, in collaboration with CCNY on the somewhat
Award Number 2006-DN-BX-K034 7 of 146
This document is a research report submitted to the U.S. Department of Justice. This report has not been published by the Department. Opinions or points of view expressed are those of the author(s)
and do not necessarily reflect the official position or policies of the U.S. Department of Justice.

germane topic of dye and ink identification on ancient and modern works of art
shows great promise for forensic applications.
We conducted an in depth experimental review of the applicability of an
innovative Raman technique, surface enhanced Raman scattering (SERS) to the
rapid and ultrasensitive detection of analytes of forensic interest in trace evidence.
Focusing on organic colorants typically found in inks or dyed textile fibers and on
a selected group of controlled pharmaceutical substances, we demonstrated that
surface enhanced Raman scattering can be reliably used to identify these analytes
in samples of microscopic dimensions.
As SERS is a relatively new technique, analytical protocols and reference
databases are not easily available. In order to foster its application as an
investigative tool we developed specific sample handling and treatment protocols,
and we assembled a demonstrative SERS spectral database of organic colorants.
The reference database includes approximately 50 natural and synthetic dyes, and
it is, to our knowledge, the first SERS spectral database ever created (in the
course of the work, a normal Raman database of approximately 100 spectra of
organic colorants was also assembled). The SERS database is both chemically
inclusive (as dyes belonging to the principal classes are represented) and
spectrally comprehensive, since both SERS spectra obtained at different
wavelengths (488, 633, 785 nm) and normal dispersive Raman (488, 633, 785
nm), and FT-Raman (1064 nm) are included.
To enhance the reproducibility of SERS analysis, in addition to
using solution reduced silver colloids, we will continue to investigate methods
developed in phase I to produce nanostructures to permit enhanced field detection
of model compounds relevant to trace evidence analysis, questioned document
examination and controlled substances identification. The methods investigated
in this task will produce plasmonic materials that can provide suitable Raman
enhancement for ultra-sensitive detection (part-per billion and sub-part-per
billion), and also be readily produced on an array platform. Several different
methods will be investigated and evaluated: (i) deposition of metal-island films on
smooth surfaces, (ii) photoreduction of silver solutions to produce nanoparticles
Award Number 2006-DN-BX-K034 8 of 146
This document is a research report submitted to the U.S. Department of Justice. This report has not been published by the Department. Opinions or points of view expressed are those of the author(s)
and do not necessarily reflect the official position or policies of the U.S. Department of Justice.

with controlled geometries. The objective of both approaches is the production of
metallic nanostructures with protrusions of specific nanoscale size and shape for
optimal plasmon enhancement.
Using the methods developed in the course of this project we obtained
three significant proof-of-concept results:
i) We were able to demonstrate that spectra of organic dyes can be
obtained from microscopic samples, by identifying the natural dye
alizarin in a single wool fiber measuring 50 micrometer by 2
millimeter;
ii) We were able to demonstrate that the technique is not affected by
chemical contamination or colorant degradation due to burial, by
identifying the colorant present in a textile that had been buried for the
past 1,000 years;
iii) We were able to obtain high quality spectra of the main natural and
synthetic opiates, notoriously poor Raman scatterers.
Furthermore, we demonstrated that SERS is a technique is of easy
applicability and does not require specialized instrumentation over what a normal
Raman laboratory may possess. We successfully reproduced the results obtained
using three different experimental setups (a research grade optical bench and two
compact commercial systems), and we feel that the great sensitivity of SERS
would even allow the use of economic portable devices. Sample handling and
preparation is considerably less complex than for chromatographic techniques,
and the procedures developed can be quickly taught to laboratory personnel.
Finally, the project had a significant educational and dissemination
component. Two Master Theses were completed as a result of our collaboration
with faculty of John Jay College of Criminal Justice; two articles were accepted
for publication in the Journal of Forensic Science; and several presentations at
conferences were made. A workshop on SERS was also held at the 2008
conference of the International Association of Forensic Science in New Orleans.
We are currently in the process of preparing a searchable digital version of our
SERS spectral library for free distribution.
Award Number 2006-DN-BX-K034 9 of 146
This document is a research report submitted to the U.S. Department of Justice. This report has not been published by the Department. Opinions or points of view expressed are those of the author(s)
and do not necessarily reflect the official position or policies of the U.S. Department of Justice.
I. Introduction
1. Statement of the Problem
1.1 Surface Enhanced RAMAN Spectroscopy (SERS) Raman spectroscopy provides a technique for the rapid and non-
destructive analysis of paints, inks, fibers, mineral residues, pharmaceuticals, and
controlled substances1. While the technique is applicable to a variety of
substances, some analytes of forensic interest, such as some natural and synthetic
dyes found in textiles, inks, and paints produce a large fluorescent background
obscuring the Raman signal, often leading to poor analytical results. We propose
here to investigate the application of a new ultra-sensitive technique, surface
enhanced Raman scattering (SERS), to the evaluation of trace evidence and
questioned documents, and to develop high quality, and comprehensive databases
of pigments, dyes, and inks, which are not available commercially.
Raman spectroscopy is characterized by very high spectral resolution,
leading to effective discrimination among various species, and it has the added
advantage of allowing non-destructive, in-situ detection. It is also preferable to
infrared (IR) spectroscopy in that Raman spectra may readily be obtained in
aqueous solution, while the large IR absorption of water precludes use of IR for
many practical applications. However, the low intensity of normal Raman
scattering has prevented its wide application as a sensitive spectroscopic probe.
Furthermore, interference from fluorescence often obscures the much weaker
Raman signal. Surface enhanced Raman scattering (SERS) has been found useful
to overcome these restrictions. The SERS effect is characterized by an enormous
increase in the Raman intensity by many orders of magnitude for species adsorbed
on rough metal (usually silver) surfaces compared to that obtained from the same
number of molecules in solution or the gas phase2, , ,3 4 5. At the same time,
proximity to the surface provides a non-radiative pathway for relaxation from the
excited state, which successfully quenches fluorescence.
Organic molecules that perform most strongly under SERS conditions are
generally characterized by extensive aromatic systems carrying nitrogen and
Award Number 2006-DN-BX-K034 10 of 146
This document is a research report submitted to the U.S. Department of Justice. This report has not been published by the Department. Opinions or points of view expressed are those of the author(s)
and do not necessarily reflect the official position or policies of the U.S. Department of Justice.
oxygen substituents with lone electron pairs6. This is often the case for several
molecules of forensic interest such as alkaloids (drugs of abuse) and dyes (textile
dyes and inks). Although the enhancement process is not yet understood in full
detail, it is now generally accepted that there are two major contributions to
SERS. One is due to enrichment of the electric field (EM enhancement) caused by
surface plasmon resonances induced by the laser light in nano-sized metal clusters
on the surface7. The second factor is associated with chemisorption, and involves
either molecule-metal or metal-molecule charge transfer8.
Both electromagnetic and chemical SERS theories predict that the SERS
enhancement requires nanoscale surface roughness. This may be achieved by
several techniques, including mechanical roughening, chemical etching, vapor-
deposition of silver islands, electrochemical roughening and use of metallic
colloids in aqueous solution. The first three techniques are especially useful for
the construction of portable probes for utilization in fieldwork. Colloids, on the
other hand, are quite easy to make, and provide a large surface area, for
convenient Raman studies in the laboratory. Under certain circumstances they
may also be useful for portable probes or in-situ studies. Electrochemical studies
in SERS are more difficult for practical applications due to the bulk and electronic
equipment needed, but since the electrochemical potential can be controlled they
are quite useful for basic scientific studies, such as determining the effect of
oxidation state on the Raman spectrum. In addition the effects of pH and
electrolyte can be precisely measured. Electrochemical studies are especially
sensitive to the charge-transfer contributions to SERS, and since this is associated
with chemisorbed molecules, they can elucidate the mode of adsorption on the
surface as well as the molecular orientation with respect to the surface plane.
1.2 SERS and RAMAN Spectroscopy in Forensic Science
Raman spectroscopy has a long history of use in forensic science,
originally as a complement to infrared (IR) spectra, which is used to identify, at
least qualitatively, the specific chemical components in a sample of interest. Both
techniques are highly specific for identification since the IR or Raman spectra are
Award Number 2006-DN-BX-K034 11 of 146
This document is a research report submitted to the U.S. Department of Justice. This report has not been published by the Department. Opinions or points of view expressed are those of the author(s)
and do not necessarily reflect the official position or policies of the U.S. Department of Justice.

of fairly high resolution and no two substances have the same vibrational
signature. For example, the analyses and detection of explosives is of utmost
importance in today’s world. Even more important is a positive association of a
suspect to the explosive. In 1995, Cheng, et al.9 reported the in-situ detection of
the high explosive SEMTEX-H. Using Raman instrumentation, they were able to
identify both components of SEMTEX-H (RDX and PETN) from latent
fingerprints produced by individuals who had handled SEMTEX-H. Remote
analysis of the high explosive SEMTEX-H has been demonstrated. RDX and
PETN, the two components of SEMTEX-H, were identified in fingerprints. The
analysis was conducted using a fiber optic probe at a range of four meters from
the instrument10.
In 1999, Ryder11 reported the identification and characterization of solid
mixtures of the controlled substances cocaine, heroin, and MDMA using Near-IR
and Raman spectroscopy. Quantitative results were obtained from these narcotics
mixed with various amounts of diluents.
The main advantages of Raman spectroscopy over IR are that light sources
(especially lasers) are more intense and detectors are more sensitive in the visible
range of the spectrum than in the IR, but most importantly water, which has a
weak Raman signal but strong IR signal, can be used as a solvent. However,
Raman spectroscopy suffers in that it is inherently weak, and even worse, suffers
from fluorescence interference for many compounds of interest to the forensic
community. The application of surface enhanced Raman spectroscopy (SERS)
overcomes these two problems. The proximity of a metal surface has been shown
to increase the Raman signal by more than six orders of magnitude, while at the
same time suppressing the fluorescence signal.
The potential of SERS in forensic science, and in particular in the trace
evidence, controlled substances, and questioned documents fields has been
recently highlighted in a review of analytical tools for forensic science12.
Research so far conducted mostly in Europe has shown that SERS can be
effectively applied to problems such as the discrimination of jet printer inks in
situ13, the fast identification of synthetic dyes on fiber samples14,15, and the
Award Number 2006-DN-BX-K034 12 of 146
This document is a research report submitted to the U.S. Department of Justice. This report has not been published by the Department. Opinions or points of view expressed are those of the author(s)
and do not necessarily reflect the official position or policies of the U.S. Department of Justice.

sensitive determination of narcotics16,17. Further work has involved SERS as
applied to inks18,19, as well as in an in-situ analysis of lipstick stains20. SERS was
needed in this latter study due to strong fluorescence of the sample. Recent work
conducted at the Department of Scientific Research of the Metropolitan Museum
of Art, in collaboration with CUNY-CCNY and ORNL on the somewhat germane
topic of dye and ink identification on ancient and modern works of art shows
great promise for forensic applications.
As for forensic scientists, preserving the integrity of the object, to analyze,
is paramount when working in art authenticity testing. SERS has been
successfully applied to the study of ancient textiles and documents at the
Metropolitan Museum of Art, and analytical protocols and references databases
have been developed for organic dyes and inks. Moreover, a relatively non-
destructive technique for examining textile fibers and documents has been
developed. An example of the potential of the work so far conducted is given by
the successful identification of the dye contained in a silk textile unearthed in an
archaeological expedition: the textile, a silk fragment measuring less than one cm2
was severely degraded after ten centuries of burial. The color of the textile was
dark brown and the silk was extremely brittle. UV-Vis Spectroscopy or ordinary
Raman spectroscopy could not detect any colored compound. Analysis of a
fragment of the textile measuring less than 2 mm in length following the SERS
protocol developed at the museum proved that the textile had originally been dyed
with the natural dye madder21. A further development of the SERS protocol in use
at the museum allows preservation of the integrity of the object examined, by
means of non-sampling analysis. Dyes and inks present in a textile sample or a
questioned document can be extracted from the object using a specially designed
hydroxygel polymer, which is then subsequently analyzed by SERS. The matrix
transfer procedure does not require that a fragment be detached from the object,
nor does it affect the appearance or integrity of the object. The amount of dye
transferred to the gel is so small that no fading or adverse colorimetric effect can
be perceived; yet due to the extreme sensitivity of SERS, dye identification is still
possible22.
Award Number 2006-DN-BX-K034 13 of 146
This document is a research report submitted to the U.S. Department of Justice. This report has not been published by the Department. Opinions or points of view expressed are those of the author(s)
and do not necessarily reflect the official position or policies of the U.S. Department of Justice.

Work conducted in collaboration with ORNL shows that the sensitivity of
SERS for the analysis of dyes is in the femtogram range, and that excellent
reproducibility can be obtained with the proper nanosupports23. The possibility of
using SERS with a variety of textile dyes and organic colorants has been likewise
demonstrated24.
We are aware that if this technique is to be successfully applied in a
forensic setting, it must be properly validated for use in actual crime laboratories,
as opposed to the academic laboratories in which much of the basic research has
been conducted. To this end, in Phase II we intend to put greater emphasis on
“real world” applicability. In addition to the expert help of Phil Antoci of the
NYPD Crime laboratory, we have recruited Patrick Buzzini of the University of
West Virginia, who is an expert on Forensic applications of Raman spectroscopy,
to assist in this effort.
2. Statement of Hypothesis or Rationale for the Research
2.1 Objectives 2.1.1 To show the validity of SERS in a forensic context, and to show the
conditions under which Raman spectroscopy and especially SERS contribute to
the value of forensic science.
2.1.2. To compare the results obtained from SERS with the results
obtained with normal Raman spectroscopy, and to explore the conditions in which
each may be of value.
2.1.3 To validate certain specialized SERS techniques (see below).
2.1.4 To provide useful protocols for use of field workers.
2.1.5 To provide a searchable database for rapid and reliable field use.
2.2 Development of Analytical Protocols and Creation of a SERS Database
Drawing from our experience in the analysis of natural dyes on textiles,
we plan to test the efficiency of silver colloids, silver nanoisland films, silver-
over-alumina supports with a variety of dyes found in inks. Initially, we will work
on a limited number of dyes of the arylmethane, azo, azine, anthraquinone,
Award Number 2006-DN-BX-K034 14 of 146
This document is a research report submitted to the U.S. Department of Justice. This report has not been published by the Department. Opinions or points of view expressed are those of the author(s)
and do not necessarily reflect the official position or policies of the U.S. Department of Justice.

phthalocyanine, and flavone classes. We will expand our work to include pigment
dyes and lake dyes. This part of our work will entail determining the correct
hydrolysis and/or extraction conditions for these colorants, to ensure maximum
efficiency in SERS detection. The database of SERS spectra will be established as
we proceed with this phase of the work, and it will be enhanced by systematic
inclusion of new dyes, and by testing of pen, printer ink, and dyed textile spectra.
Experiments with artificially aged written and printed samples will also be
conducted (an Atlas Fade-o-meter is available at The Metropolitan Museum of
Art for accelerated aging experiments). The database will contain dye spectra
together with information on the source, state (neat, extracted, type of support,
etc), and on the SERS methodology and eventual extraction conditions.
Experiments on controlled substances are conducted at the NYPD Crime Lab
using the same materials and techniques investigated for dye analysis
applications.
2.3 Non-Destructive Analysis with SERS Nanoprobes A new tool for SERS analysis recently developed at ORNL, the SERS
nanoprobe, will be tested and further developed for forensic analysis of inks and
trace evidence. The probe is an optical fiber tapered to a tip measuring 100
nanometers with an extremely thin coating of nanoparticles of silver, which
induces the SERS effect. The ORNL nanoprobe combines in one tool the
functions of delivering and collecting laser light and providing a SERS support.
The significance of this work is that the nanoprobe could potentially be
used to perform direct analysis of samples (even dry samples) with no preparation
of the surface. The small scale of the nanoprobe demonstrates the potential for
detection at the microscopic scale, thus facilitating the analysis of very small
details and samples.
The applicability of the nanoprobe approach to the analysis of inks and of
textile dyes will be verified in parallel with the work conducted to build the SERS
database using silver colloids; we expect that the nanoprobes will be very useful
for a variety of inks, and in particular for those using pigment dyes. In the case of
lake pigments (which require hydrolysis prior to analysis), we will experiment
Award Number 2006-DN-BX-K034 15 of 146
This document is a research report submitted to the U.S. Department of Justice. This report has not been published by the Department. Opinions or points of view expressed are those of the author(s)
and do not necessarily reflect the official position or policies of the U.S. Department of Justice.

with gel-coated nanoprobes, combining the nanoprobe approach with the matrix
transfer technique described below.
2.4 Non-Destructive Analysis with Matrix Tranfer SERS We will expand our previous work on the use of solvent hydroxygels in
the analysis of textiles to include inks on documents. The application of this
method to works of art has demonstrated that it is a reliable technique for the non-
destructive identification on dyes on irreplaceable objects.
2.5 Sensitivity Enhancement with Immobilized Colloids Preliminary experiments in our laboratory have demonstrated that an
increment in sensitivity of up to 3 orders of magnitude can be obtained by
immobilizing, on the tip of a glass fiber, or on a glass microscope slide, a small
amount of colloid (a dot about 0.5 mm in diameter). The active surface thus
obtained is left in contact with a large amount of diluted dye solution (10-9 M
concentration) for a relatively long time. The silver nanoparticles act as an
extraction and concentration device, removing from the solution the dye
molecules. The advantage of using a small amount of colloid concentrated in a
small space is that colloid saturation can be achieved even at very low analyte
concentrations, leading to a situation in which a large number of silver
nanoparticles carrying adsorbed dye molecules are concentrated within the
instrument’s excitation beam. We plan to develop this procedure so that it can be
used for the analysis of microsamples extracted from specimens on ink writing, or
other evidence.
Award Number 2006-DN-BX-K034 16 of 146
This document is a research report submitted to the U.S. Department of Justice. This report has not been published by the Department. Opinions or points of view expressed are those of the author(s)
and do not necessarily reflect the official position or policies of the U.S. Department of Justice.

II. Methods
1. Preparation of Ag Colloids Ag colloid is prepared following the method of Lee and Meisel [16] by
reduction of silver nitrate (Aldrich 209139 Silver Nitrate 99.9%) with sodium
citrate (Aldrich W302600 Sodium Citrate Dihydrate). The colloid thus prepared
shows an absorption maximum at 406 nm and FWHM of 106 nm, as measured
with a Cary 50 UV-Vis Spectrophotometer (after a 1:4 dilution with ultrapure
water to keep maximum absorbance within the instrumental range). To further
concentrate the colloid for use, a volume of 10 ml of the original colloid was
centrifuged at 5000 rpm for 2 minutes. The supernatant was discarded and the
settled portion was resuspended in 1 ml of ultrapure water. All glassware was
cleaned with Pierce PC54 cleaning solution, rinsed with ultrapure water and
finally in acetone and methanol. This method proved to be as effective as the use
of aggressive cleaning agents such as aqua regia or piranha solution, and was
preferred for health and safety reasons. Only ultrapure water was used for the
preparation of the various solutions. SERS measurement were made simply by
adding 1 μl of dye solution to a 2 μl drop of colloid deposited on a gold coated
microscope slide, followed by addition of 2 μl of a 0.2 M KNO3 solution. Raman
measurements were taken directly from the drop using a 50 or 100x microscope
objective and focusing on the microscope slide surface. SERS spectra could be
obtained two or three minutes after addition of the KNO3 and remained constant
in quality until evaporation of the liquid.
2. Raman Spectra The NR spectra of solids are obtained in the region of 100 to 4000 cm-1
directly from pure powder samples. Since the fluorescence of the dyes prevented
the acquisition of a Raman spectrum, FT-Raman spectroscopy are carried out
using a Bruker Ram II FT-Raman-Vertex 70 FTIR Micro spectrometer. The 1064
nm line of an Nd:YAG laser is used as the excitation line. The resolution was set
to 4 cm-1 in back scattering mode. A liquid nitrogen cooled Ge detector was used
Award Number 2006-DN-BX-K034 17 of 146
This document is a research report submitted to the U.S. Department of Justice. This report has not been published by the Department. Opinions or points of view expressed are those of the author(s)
and do not necessarily reflect the official position or policies of the U.S. Department of Justice.

to collect 100 scans for a good Raman spectrum. The laser output was kept at 150
mW for the SERS spectra and 50 mW for the solid samples.
Additional SERS work on Ag colloids is carried out using a Bruker
Senterra Raman microscope using 785 nm excitation, a 1200 rulings/mm
holographic grating, a CCD detector and power at the sample ranging from 8 to
80 mW.
3. Matrix Transfer SERS Using a gel as a medium for the solvent mixture confines its action only to
the areas of the substrate covered by the gel bead. The extraction is carried out for
2-8 hours at room temperature. The gel bead is then removed, transferred to a
microscope slide, covered with a drop of Ag colloid, and examined with the
Raman microscope. Transfer of the dye from the substrate to the gel does not
require removing a fragment from the object; the amount of dye removed is so
small that no appreciable fading is detected by the eye, and; the size of the
polymer bead can be reduced to a fraction of a millimeter in order to minimize
any impact on the substrate, without detriment on the effectiveness of the method.
The one-step procedure combining extraction and hydrolysis is extremely
efficient and time saving. Additionally, problems previously encountered in
obtaining SERS spectra from alizarin25 and due to its difficult adsorption on silver
nanoparticles do not appear to affect its analysis by MT-SERS. In an alternative
procedure, instead of using a silver colloid to obtain the SERS effect, the gel
fragment is coated with silver nanoislands by thermal evaporation of silver in a
high vacuum evaporator (Edwards E306A). The method has been found to yield
the same results as the use of a colloid.
Different hydrogels can be used for the MT procedure. We have so far
worked with either a 1:1 random copolymer of 2,3-dihydroxypropyl methacrylate
with 2-hydroxyethyl methacrylate (Benz 5X, also known as GMA) or 2-
hydroxyethyl methacrylate (known as p(2-HEMA) or Benz 38 or HEMA). The
gel is prepared for use by soaking for 10 minutes in a solution of
dimethylformamide (DMF) and water with EDTA (1% w/w), with water and
DMF in a 1:1 ratio. This solution is known as a solvent for extraction of dyes
Award Number 2006-DN-BX-K034 18 of 146
This document is a research report submitted to the U.S. Department of Justice. This report has not been published by the Department. Opinions or points of view expressed are those of the author(s)
and do not necessarily reflect the official position or policies of the U.S. Department of Justice.

from fibers. Different solvents however could be used: the possibility of using
pure DMF for the extraction of vat dyes has been demonstrated in our tests.
The procedure described above is the first example of the use of a solvent
gel to hydrolyze/extract insoluble dyes from an object for the purpose of non-
invasive identification by SERS techniques. The current standard procedure for
dye extraction when HPLC is used is a destructive procedure based on the
removal of a sample and its treatment with an appropriate reagent capable of
dissolving the dye-aluminum complex and removing the dye from the textile fiber
or other support. This reagent can be an acidic solution, or the same
H2O/EDTA/DMF mixture used here, with the difference that the procedure of
reference is carried out at boiling.
Gel supports for SERS analysis have been described before26 and are
commercially available27. The bulk of the published literature however deals with
gels containing silver particles, and having the specific functions of stabilizing the
silver particles to increase their efficiency for SERS analysis. The innovative
aspect of the MT-SERS procedure is that it is the first method ever proven
effective for the non-invasive analysis of insoluble dyes contained in textiles,
paintings, documents, etc. We expect this technique to be especially useful in the
analysis of writing and printing inks containing lake pigments and pigment dyes,
because of the unique ability of the solvent gel system to hydrolyze and solubilize
such materials.
4. Immobilized Colloids In a typical application, a microscopic fragment, such as a paper fiber with
ink traces, or a textile fiber is pre-treated with HF vapor to facilitate the
solubilization of the dye, and then deposited on a microscope slide (or other
appropriate surface) and covered with a drop of water (or other appropriate
development solvent). The immobilized silver colloid (on the tip of a glass fiber,
or on a microscope coverslip) is then placed in contact with the solvent and left
there for a suitable time. We eventually plan to develop this technique into a
microfluidic system able to handle microsamples pretreated with HF vapor.
Award Number 2006-DN-BX-K034 19 of 146
This document is a research report submitted to the U.S. Department of Justice. This report has not been published by the Department. Opinions or points of view expressed are those of the author(s)
and do not necessarily reflect the official position or policies of the U.S. Department of Justice.
III. Results
1. Statement of Results
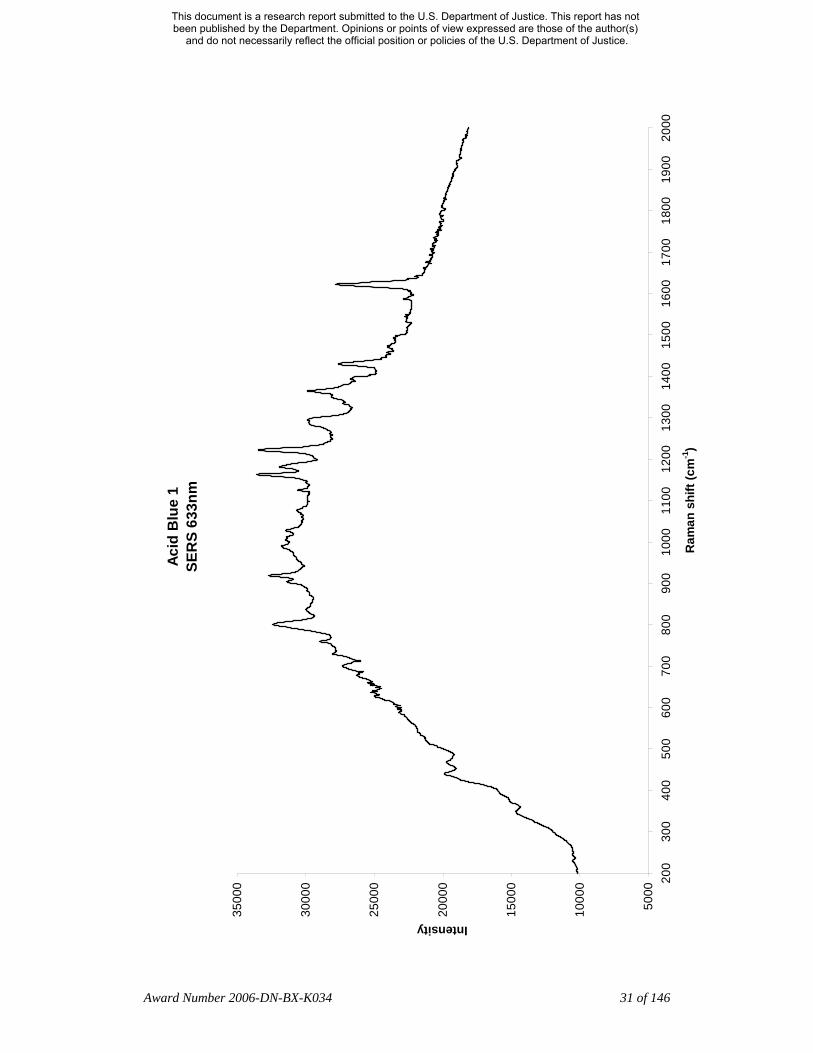
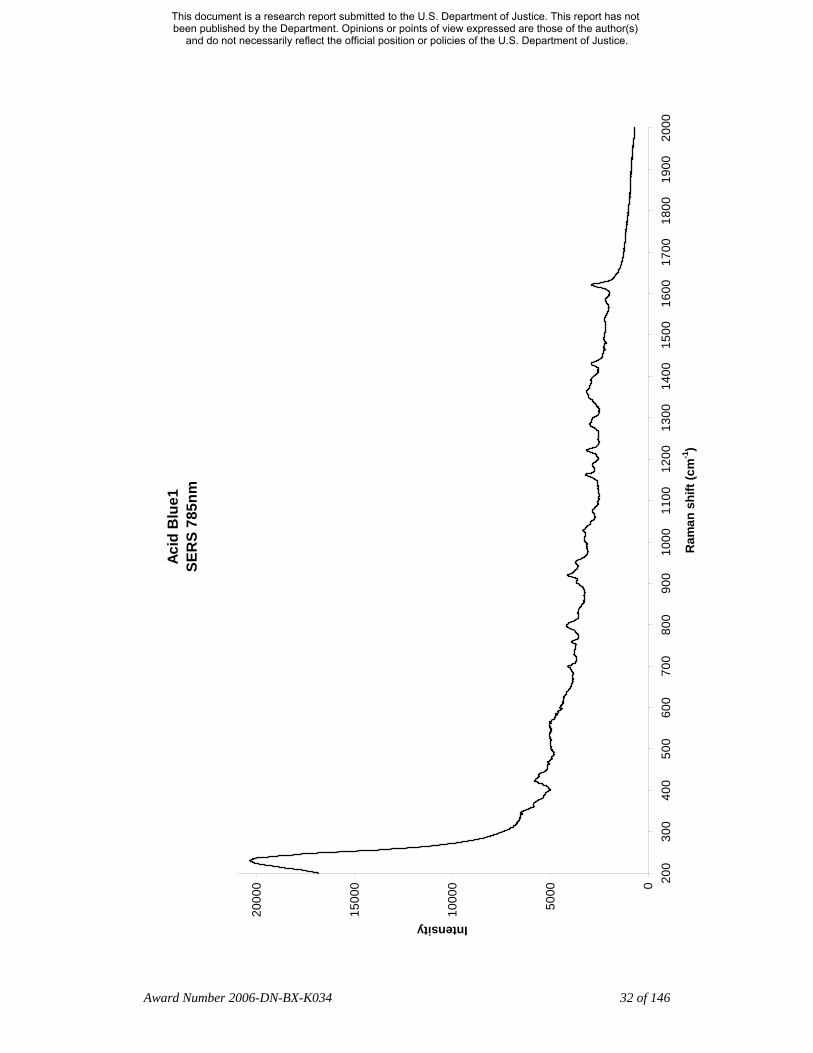
1.1 RESULTS FROM THE METROPOLITAN MUSEUM OF NEW YORK SITE- Normal Raman spectroscopy and surface-enhanced Raman scattering were
used to collect spectra of ten synthetic dyes commonly found in ballpoint pen ink.
The dyes included Acid blue 1, Acid Orange 10, Acid Red 52, Aniline Blue,
Crystal Violet, Methyl Violet, Pararosaniline, Rhodamine B, Sudan Black B, and
Victoria Blue. The normal Raman spectra were collected using 633 nm, 785 nm,
and 1064 nm lasers. The SERS spectra were obtained with 633 nm and 785 nm
lasers on a silver colloid substrate aggregated with 0.5 M potassium nitrate
solution. The surface-enhanced Raman spectra and the majority of the normal
Raman spectra were found to be of excellent quality with highly resolved and
intense peaks.
Additionally, the above dye standards and ink extracted from a readily
available ballpoint pen were developed on a thin-layer chromatography plate
following the procedure described in the ASTM Guide E 1422-05 (standard guide
for test methods for forensic writing ink comparison). The SERS spectra were
collected directly from the plate with a 785 nm laser after the colloid and the
aggregate were added to the dye spots. The ink dyes spectra were found to
correspond to the spectra of the standards on the plate and the dyes spectra
collected earlier on the colloid drop. The collected spectra were of high quality
and the technique was found applicable for the in situ analysis of ink dyes
separated on a thin-layer chromatography plate.
Other synthetic dyes that the NY site has studied using SERS (at 633 and
785 nm) are: Eosin Y Na salt, Eosin, Erythrosin, Flourescein, Fisihin, Rhodamine
6G, Rosaniline, Mauve, Nile blue A, and Safranin. The studies have been
performed using citrate reduced Ag colloids, and different aggregating agents
(KNO3, HCI, NaOH and HNO3). Several different conditions (wavelength and
Award Number 2006-DN-BX-K034 20 of 146
This document is a research report submitted to the U.S. Department of Justice. This report has not been published by the Department. Opinions or points of view expressed are those of the author(s)
and do not necessarily reflect the official position or policies of the U.S. Department of Justice.
aggregation agents) were used in order to determine the best conditions to detect
the dyes by SERS.
SERS analysis was used to identify opiates, which are commonly
submitted to forensic laboratories. The research has focused primarily on three
opiates – Morphine & codeine, which are both natural opiates, and hydrocodone a
semi-synthetic opiate. The plan is to continue the research using SERS to identify
opiates by relating it to “real-world” situations through the use of these techniques
on actual samples received by the NYPD Crime Laboratory.
In comparing the results obtained on organic colorants by normal Raman
(both with the dispersive spectrometer and with the Fourier Transform
spectrometer) and by SERS we have found that fluorescence and low Raman
signal intensity are major drawbacks in dye analysis. The conclusion could be
drawn from our initial results that FT-Raman is the preferred option for
identification of dyes in inks, paint and fiber evidence, as it significantly reduces
fluorescence. The FT-Raman data presented in our study however was obtained
with a macro-sampling configuration, from pure dye or pigment samples mounted
in 2mm diameter cells. When attempting to analyze microscopic samples, such as
paint chips or single textile fibers using an FT-Raman microscope we encountered
significant problems due to reduced throughput. FT-Raman spectrometers
perform best as apertureless detectors, and suffer from extremely low throughput
when a small aperture – such as a microscope- is used. In addition, the use of high
magnification optics carries a higher risk of thermal degradation of the sample
due to the concentration of the beam energy on a smaller spot (this is somewhat of
a lesser problem in dispersive Raman spectroscopy as lower intensity lasers can
be used). Finally, FT-Raman is generally less sensitive than dispersive Raman
with visible light laser excitation, as the intensity of Raman scattered light
increases with the 4th power of the exciting laser frequency. This would be a
significant factor when going from the pure reference dyes and pigments in the
survey to real samples and trace evidence.
SERS presents the advantage of extremely high sensitivity, complete
fluorescence rejection, and specificity towards organic colorants (inorganic
Award Number 2006-DN-BX-K034 21 of 146
This document is a research report submitted to the U.S. Department of Justice. This report has not been published by the Department. Opinions or points of view expressed are those of the author(s)
and do not necessarily reflect the official position or policies of the U.S. Department of Justice.
pigments and extenders are not enhanced, nor are paint and ink binding media). It
does generally require an additional step, either an extraction or the pretreatment
of the sample with acidic vapors, but the procedure is straightforward and the
analysis can be carried out on sample as small as 50 micrometer as a matter of
routine. The HF pretreatment procedure used in this study is a gas-solid reaction
specifically developed to hydrolyze lake pigments. As no liquid phase is involved,
there is no risk of losing analyte due to dilution, transfer losses, or adhesion to
container walls. The procedure is carried out directly on a microsample in a small
sample holder (obtained from the cap of a Beem size 3 embedding microvial).
The sample holder is then inserted in a micro-chamber obtained from a Beem size
0 embedding microvial, previously loaded with a 10 μL drop of HF. We found
this to be a convenient and safe experimental setup. The HF drop is retained in the
pyramidal bottom of the micro-chamber and the sample in its holder is exposed to
an HF saturated atmosphere without coming in contact with the liquid phase.
Retrieving the sample holder is easily achieved and there is no risk of operator
exposure to HF. In our experience we noticed that the micro-chamber needs to be
refilled only every two weeks, further diminishing the dangers associated with HF
use. We are currently experimenting with other acids, but HF is an ideal reagent
for a number of reasons: it does not have any oxidizing action, as HNO3 would
have, and it forms insoluble or non-hygroscopic salts with the metal ions used as
lake bases, unlike HCl, thus diminishing any interference due to those metals. In
any case, the sample treatment is no more complex than what necessary for
traditional analysis of inks by thin layer chromatography.
We have also found that although the production of colloid is not exactly
reproducible from batch-to-batch, the spectra are reproducible. There are no
variations in either measured Raman wavenumbers, or the relative intensities.
Therefore there is no doubt as to the identification of the species. Furthermore, the
limits of detection do not vary from colloid samples.
We are currently working on alternative methods for colloid preparation
(including use of microwave ovens, both scientific grade and standard domestic
Award Number 2006-DN-BX-K034 22 of 146
This document is a research report submitted to the U.S. Department of Justice. This report has not been published by the Department. Opinions or points of view expressed are those of the author(s)
and do not necessarily reflect the official position or policies of the U.S. Department of Justice.
ones), and we have increasing evidence for additional sensitivity enhancements
with properly tailored colloids.
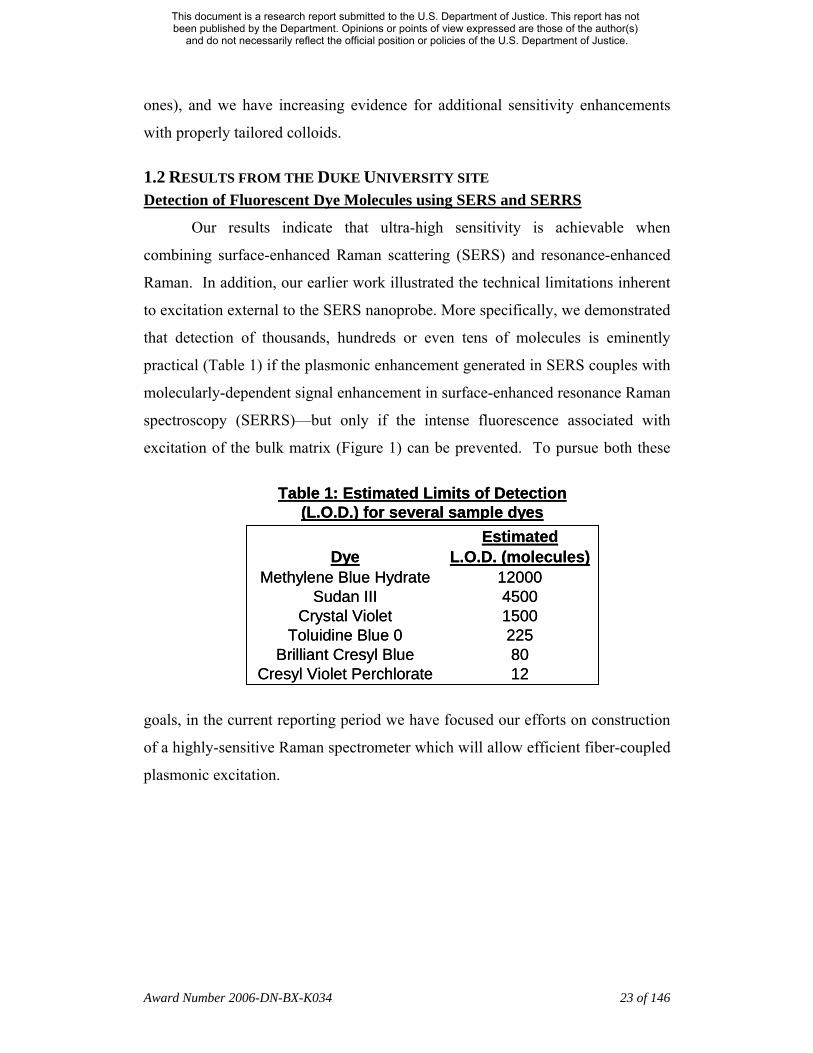
1.2 RESULTS FROM THE DUKE UNIVERSITY SITE Detection of Fluorescent Dye Molecules using SERS and SERRS
Our results indicate that ultra-high sensitivity is achievable when
combining surface-enhanced Raman scattering (SERS) and resonance-enhanced
Raman. In addition, our earlier work illustrated the technical limitations inherent
to excitation external to the SERS nanoprobe. More specifically, we demonstrated
that detection of thousands, hundreds or even tens of molecules is eminently
practical (Table 1) if the plasmonic enhancement generated in SERS couples with
molecularly-dependent signal enhancement in surface-enhanced resonance Raman
spectroscopy (SERRS)—but only if the intense fluorescence associated with
excitation of the bulk matrix (Figure 1) can be prevented. To pursue both these
goals, in the current reporting period we have focused our efforts on construction
of a highly-sensitive Raman spectrometer which will allow efficient fiber-coupled
plasmonic excitation.
EstimatedDye L.O.D. (molecules)
Methylene Blue Hydrate 12000Sudan III 4500
Crystal Violet 1500Toluidine Blue 0 225
Brilliant Cresyl Blue 80Cresyl Violet Perchlorate 12
Table 1: Estimated Limits of Detection (L.O.D.) for several sample dyes
EstimatedDye L.O.D. (molecules)
Methylene Blue Hydrate 12000Sudan III 4500
Crystal Violet 1500Toluidine Blue 0 225
Brilliant Cresyl Blue 80Cresyl Violet Perchlorate 12
Table 1: Estimated Limits of Detection (L.O.D.) for several sample dyes
Award Number 2006-DN-BX-K034 23 of 146
This document is a research report submitted to the U.S. Department of Justice. This report has not been published by the Department. Opinions or points of view expressed are those of the author(s)
and do not necessarily reflect the official position or policies of the U.S. Department of Justice.

Our initial attempts to use our
laboratory’s existing intensified charge-coupled
detectors (ICCDs) were thwarted by the use of
continuous wave (CW) excitation and the high
noise levels inherent to the use of an ICCD in
CW mode. To circumvent these fundamental
limitations, we have purchased an electron-
multiplying charge-coupled detector (EMCCD,
~$30k) and spectrograph (~$10k) which are
able to provide the high signal enhancement
typically associated with an ICCD—but with the
near-single-photon noise limits typically
associated with non-intensified CCDs,
photomultiplier tubes (PMTs) or avalanche
photodiodes (APDs). Figure 2 shows the
current instrumental setup for our proof-of-
concept EMCCD-based Raman spectrometer.
Note that the lack of optics to focus the HeNe
laser on the sample is intentional: The reduced
laser fluence, the limited field of view of the
fiber-based signal collection optics and a
properly-chosen slit width can conveniently
mimic the laser attenuation which occurs if
laser light is coupled into a fiber-optic
nanoprobe with a sub-wavelength tip diameter.
1.0
0.8
0.6
0.4
0.2
0.0
Inte
nsit
y (a
u)
200016001200800Raman Shift (cm
-1)
Figure 1. Normalized fluorescence spectra of Acid Blue 1 (black), Victoria Blue (blue) and Aniline Blue (red) deposited on filter paper and excited at 633 nm, along with the normal (non-SERS) Raman spectrum of filter paper.
Sample Stand
HeNe Laser
LF
LPF
SpectrometerFC
Figure 2: EMCCD-based SERS / SERRS spectrometer. LF: laser line filter. LPF: long-pass Raman filter. FC: Fiber-optic coupler.
Figure 3 shows normalized SERRS
spectra for several resonance Raman-active
dyes physisorbed to SERS-active silver island
films. After correction for the lack of laser
focusing, the limited field of view associated
with fiber-optic signal collection and the
Inte
nsi
ty (
au)
200016001200800400Raman Shift (cm
-1)
Award Number 2006-DN-BX-K034 24 of 146
Figure 3: Normalized SERRS spectra of Toluidine Blue 0 (red), Brilliant Cresyl Blue (green), Methylene Blue Hydrate (blue), Cresyl Fast Violet (black) and Crystal Violet (orange). Raman shift is with respect to excitation at 633 nm.
This document is a research report submitted to the U.S. Department of Justice. This report has not been published by the Department. Opinions or points of view expressed are those of the author(s)
and do not necessarily reflect the official position or policies of the U.S. Department of Justice.
narrow slit width of the spectrograph (10 μm, in this case), the spectra in Figure 3
are similar to those which can be generated with a few hundred nanowatts of 633-
nm laser light and an acquisition time of less than 60 seconds. We expect that
optimization of this Raman spectrometer and incorporation of through-fiber
excitation will allow efficient probe-enhanced SERS and SERRS of real-world
samples.
Award Number 2006-DN-BX-K034 25 of 146
This document is a research report submitted to the U.S. Department of Justice. This report has not been published by the Department. Opinions or points of view expressed are those of the author(s)
and do not necessarily reflect the official position or policies of the U.S. Department of Justice.

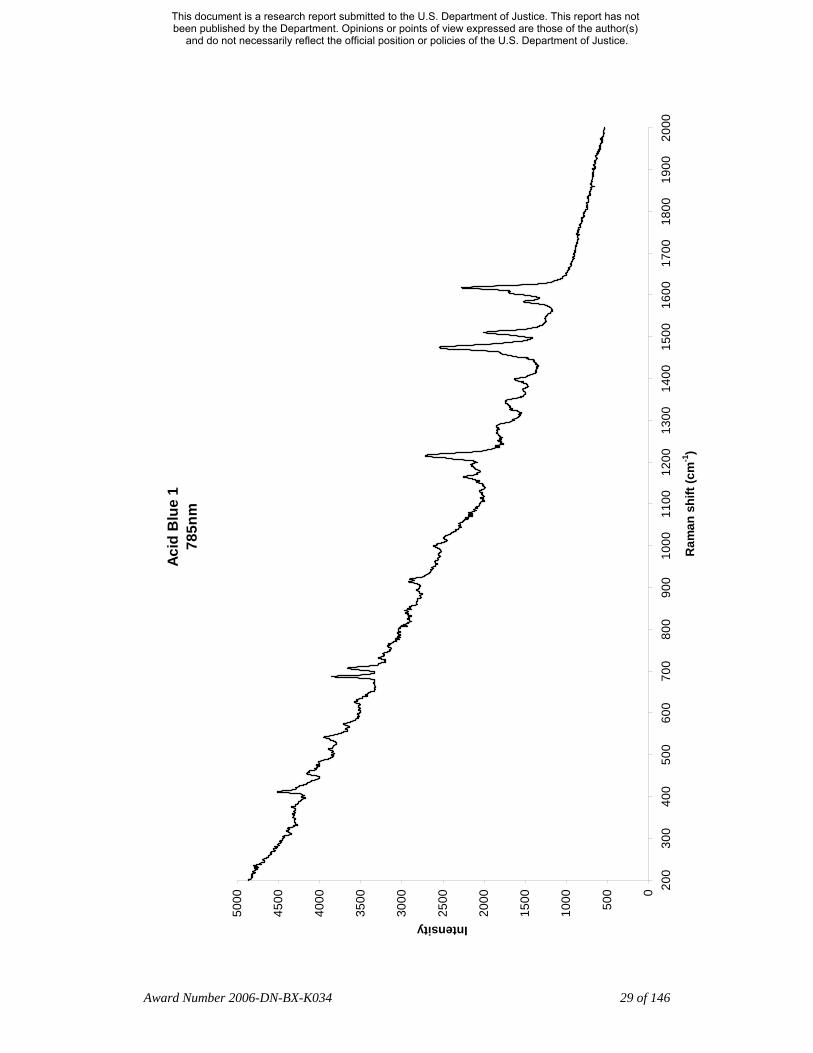
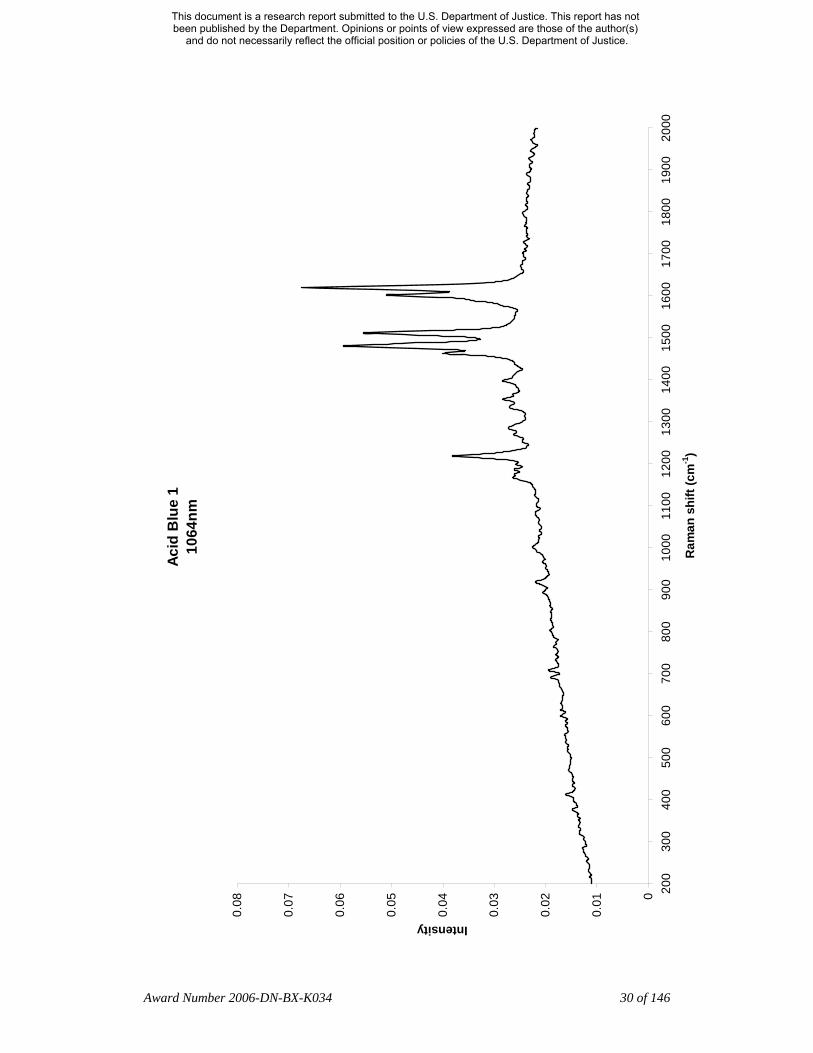
2. Tables and Figures Acid Blue 1
CAS 129-17-9; CI 42045
Alternate name: Patent Blue VF
Table 1. Acid Blue 1 Raman peaks (cm-1)
NR 633nm NR 785nm NR 1064nm SERS 633nm SERS 785nm 231 230.5 349.5 346.5 375.3 411.5 411.9 423 440.5 455 461 468 468 513.5 535.5 541.5 559.5 573.5 599.0 599.5 632 636.5 646 659.5 678 687 691.6 700.5 700 707 708.9 730.5 729.5 728 764.9 759.5 759 801 798.5 836.5 845.5 894 894.1 904 904.5 914 919.1 919 920 950
Award Number 2006-DN-BX-K034 26 of 146
This document is a research report submitted to the U.S. Department of Justice. This report has not been published by the Department. Opinions or points of view expressed are those of the author(s)
and do not necessarily reflect the official position or policies of the U.S. Department of Justice.

NR 633nm NR 785nm NR 1064nm SERS 633nm SERS 785nm 989.5 999.5 1000.1 1005 1027.5 1028 1076.5 1074.5
1126 1130 1124.5 1165 1174.0 1162.5 1161.5
1189.5 1194.5 1187.2 1181.5 1191 1215 1218.1 1222 1221.5
1302 1293 1285.6 1294 1284.5 1335.7 1347.5 1353.1 1365 1364 1399 1397.4 1397 1397 1430.5 1429.5 1463.0 1474.5 1480.3 1473.5 1474 1492 1491
1518 1510.5 1511.2 1582.5 1584.5 1609.5 1601.8
1621 1617 1619.2 1622 1620
Award Number 2006-DN-BX-K034 27 of 146
This document is a research report submitted to the U.S. Department of Justice. This report has not been published by the Department. Opinions or points of view expressed are those of the author(s)
and do not necessarily reflect the official position or policies of the U.S. Department of Justice.

Acid
Blu
e 1
633n
m
0
2000
0
4000
0
6000
0
8000
0
1000
00
1200
00
200
300
400
500
600
700
800
900
1000
1100
1200
1300
1400
1500
1600
1700
1800
1900
2000
Ram
an s
hift
(cm
-1)
Intensity
Award Number 2006-DN-BX-K034 28 of 146
This document is a research report submitted to the U.S. Department of Justice. This report has not been published by the Department. Opinions or points of view expressed are those of the author(s)
and do not necessarily reflect the official position or policies of the U.S. Department of Justice.
Acid
Blu
e 1
785n
m
0
500
1000
1500
2000
2500
3000
3500
4000
4500
5000
200
300
400
500
600
700
800
900
1000
1100
1200
1300
1400
1500
1600
1700
1800
1900
2000
Ram
an s
hift
(cm
-1)
Intensity
Award Number 2006-DN-BX-K034 29 of 146
This document is a research report submitted to the U.S. Department of Justice. This report has not been published by the Department. Opinions or points of view expressed are those of the author(s)
and do not necessarily reflect the official position or policies of the U.S. Department of Justice.
Acid
Blu
e 1
1064
nm
0
0.01
0.02
0.03
0.04
0.05
0.06
0.07
0.08
200
300
400
500
600
700
800
900
1000
1100
1200
1300
1400
1500
1600
1700
1800
1900
2000
Ram
an s
hift
(cm
-1)
Intensity
Award Number 2006-DN-BX-K034 30 of 146
This document is a research report submitted to the U.S. Department of Justice. This report has not been published by the Department. Opinions or points of view expressed are those of the author(s)
and do not necessarily reflect the official position or policies of the U.S. Department of Justice.
Acid
Blu
e 1
SER
S 63
3nm
5000
1000
0
1500
0
2000
0
2500
0
3000
0
3500
0 200
300
400
500
600
700
800
900
1000
1100
1200
1300
1400
1500
1600
1700
1800
1900
2000
Ram
an s
hift
(cm
-1)
Intensity
Award Number 2006-DN-BX-K034 31 of 146
This document is a research report submitted to the U.S. Department of Justice. This report has not been published by the Department. Opinions or points of view expressed are those of the author(s)
and do not necessarily reflect the official position or policies of the U.S. Department of Justice.
Acid
Blu
e1
SER
S 78
5nm
0
5000
1000
0
1500
0
2000
0 200
300
400
500
600
700
800
900
1000
1100
1200
1300
1400
1500
1600
1700
1800
1900
2000
Ram
an s
hift
(cm
-1)
Intensity
Award Number 2006-DN-BX-K034 32 of 146
This document is a research report submitted to the U.S. Department of Justice. This report has not been published by the Department. Opinions or points of view expressed are those of the author(s)
and do not necessarily reflect the official position or policies of the U.S. Department of Justice.

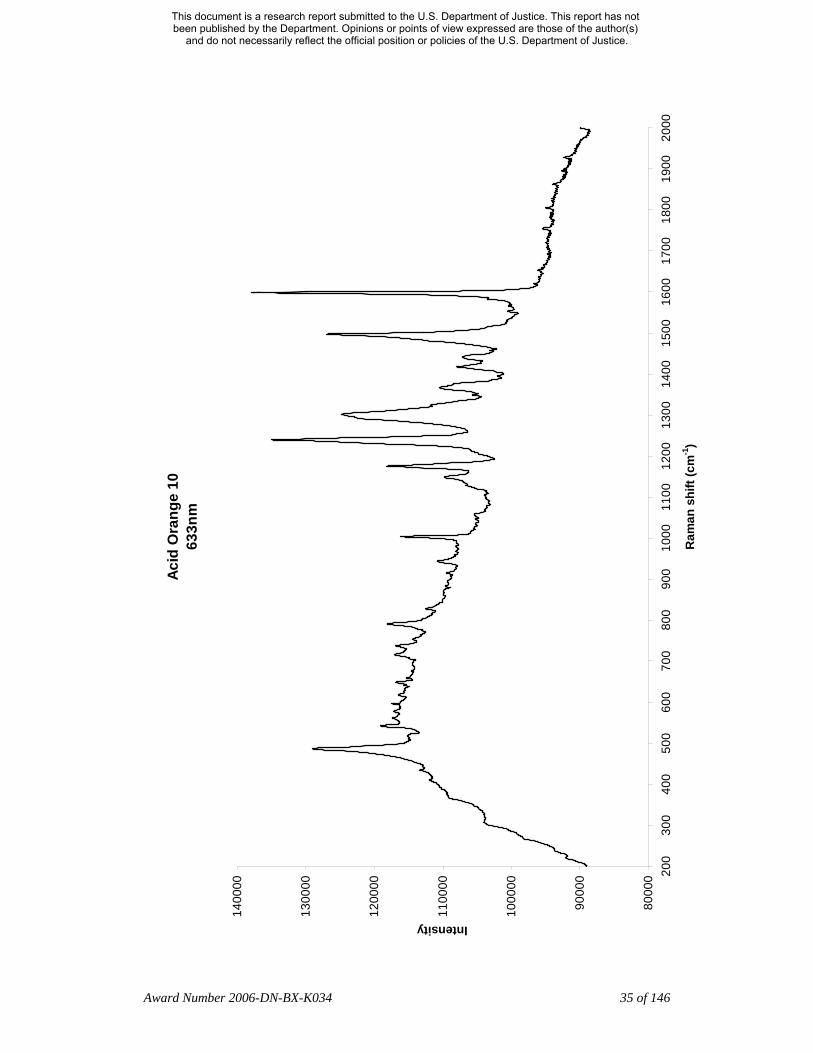
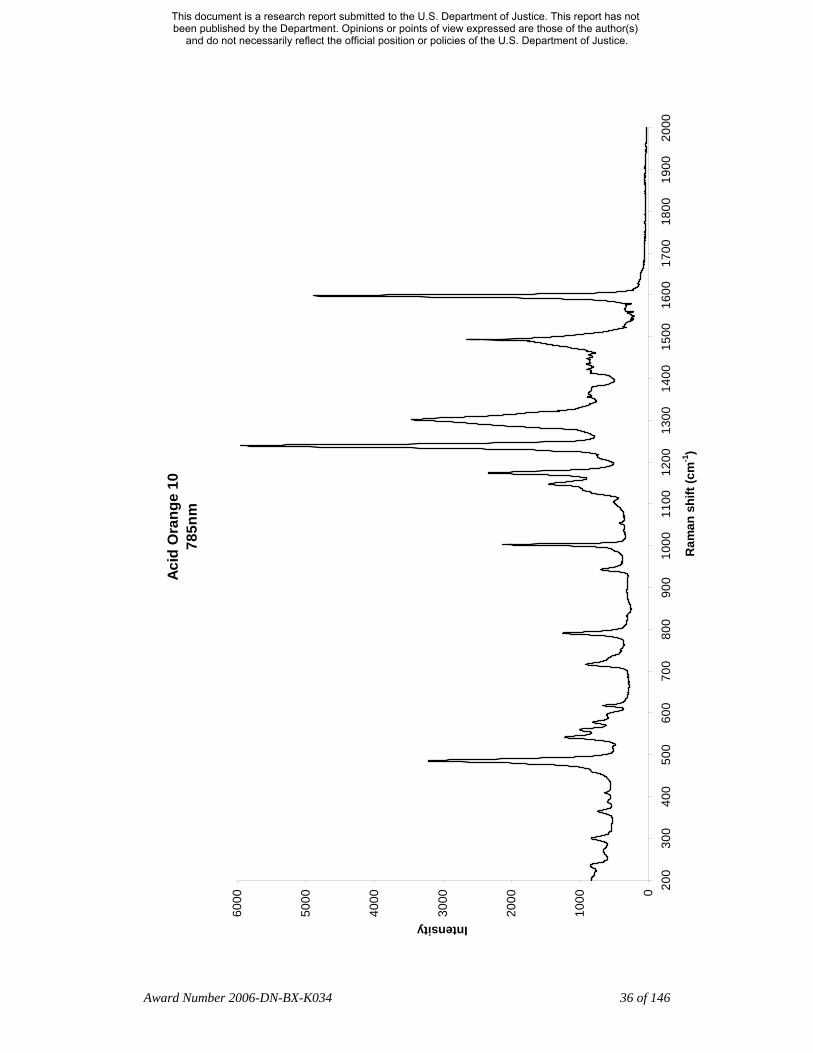
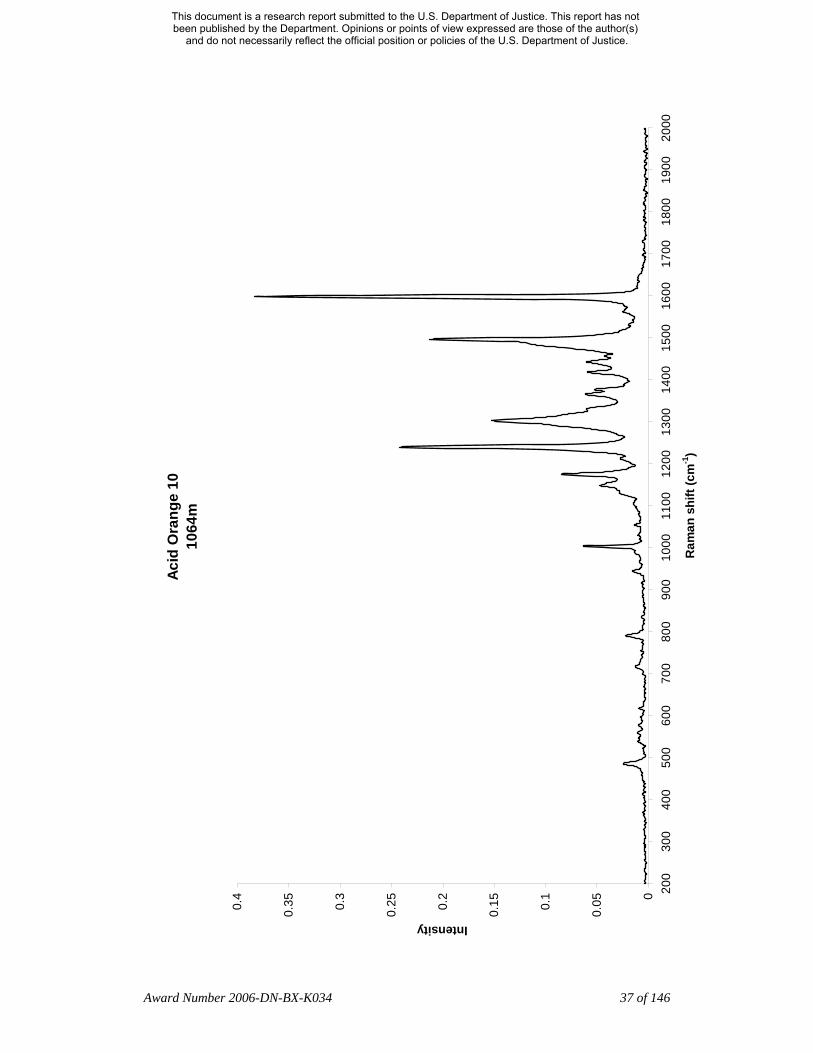
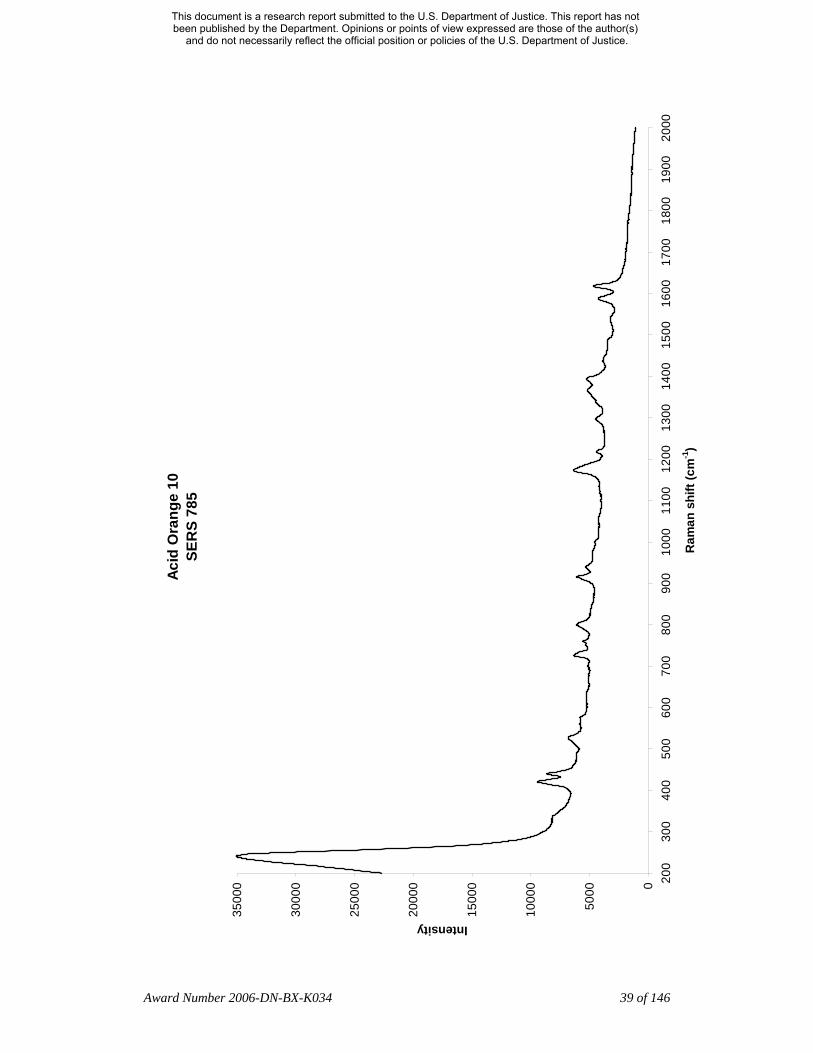
Acid Orange 10
CAS 1936-15-8; CI 16230
Alternate name: Orange G certified
Table 2. Acid Orange 10 Raman peaks (cm-1)
NR 633nm NR 785nm NR 1064nm SERS 633nm SERS 785nm 234.5 240.5 299.5 364 421 439.5 440
486.5 485.5 485.2 529 527
542.5 541.5 561 560
577.5 578 596 618 617.5 616.4
648.5 671.5
715.5 716 716.6 737 735 731
761 760 791 790.5 789.9
799.5 800 828.5
915 916.5 915.5 943.5 942.5 944.2 940 1003 1003 1004.0 1000 1058 1054.5 1054.1 1148 1147.5 1148.6 1175 1174.5 1173.7 1173.5 1172.5
1219.5 1218 1239.5 1239.5 1239.3
1302 1301.5 1302.9 1294 1297.5 1367 1366.6 1370.5 1365.5
1394.5
Award Number 2006-DN-BX-K034 33 of 146
This document is a research report submitted to the U.S. Department of Justice. This report has not been published by the Department. Opinions or points of view expressed are those of the author(s)
and do not necessarily reflect the official position or policies of the U.S. Department of Justice.
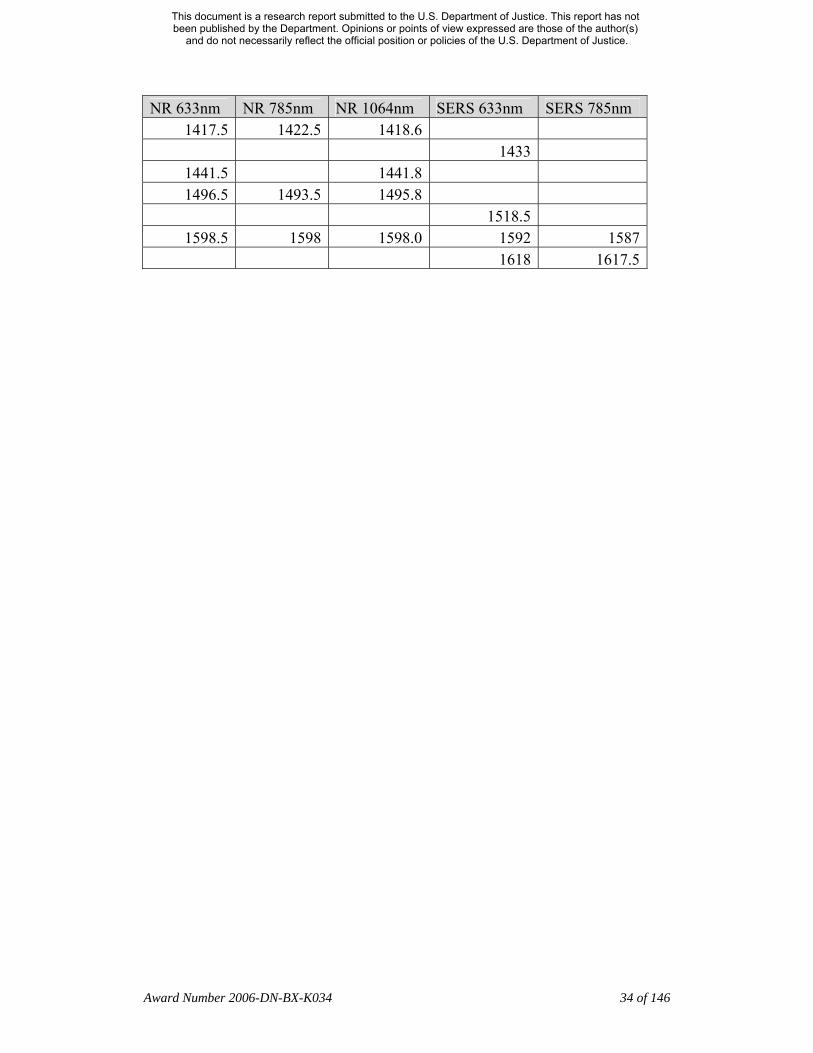
NR 633nm NR 785nm NR 1064nm SERS 633nm SERS 785nm 1417.5 1422.5 1418.6
1433 1441.5 1441.8 1496.5 1493.5 1495.8
1518.5 1598.5 1598 1598.0 1592 1587
1618 1617.5
Award Number 2006-DN-BX-K034 34 of 146
This document is a research report submitted to the U.S. Department of Justice. This report has not been published by the Department. Opinions or points of view expressed are those of the author(s)
and do not necessarily reflect the official position or policies of the U.S. Department of Justice.
Acid
Ora
nge
10
633n
m
8000
0
9000
0
1000
00
1100
00
1200
00
1300
00
1400
00
200
300
400
500
600
700
800
900
1000
1100
1200
1300
1400
1500
1600
1700
1800
1900
2000
Ram
an s
hift
(cm
-1)
Intensity
Award Number 2006-DN-BX-K034 35 of 146
This document is a research report submitted to the U.S. Department of Justice. This report has not been published by the Department. Opinions or points of view expressed are those of the author(s)
and do not necessarily reflect the official position or policies of the U.S. Department of Justice.
Acid
Ora
nge
10
785n
m
0
1000
2000
3000
4000
5000
6000
200
300
400
500
600
700
800
900
1000
1100
1200
1300
1400
1500
1600
1700
1800
1900
2000
Ram
an s
hift
(cm
-1)
Intensity
Award Number 2006-DN-BX-K034 36 of 146
This document is a research report submitted to the U.S. Department of Justice. This report has not been published by the Department. Opinions or points of view expressed are those of the author(s)
and do not necessarily reflect the official position or policies of the U.S. Department of Justice.
Acid
Ora
nge
10
1064
m
0
0.050.
1
0.150.
2
0.250.
3
0.350.
4 200
300
400
500
600
700
800
900
1000
1100
1200
1300
1400
1500
1600
1700
1800
1900
2000
Ram
an s
hift
(cm
-1)
Intensity
Award Number 2006-DN-BX-K034 37 of 146
This document is a research report submitted to the U.S. Department of Justice. This report has not been published by the Department. Opinions or points of view expressed are those of the author(s)
and do not necessarily reflect the official position or policies of the U.S. Department of Justice.

Acid
Ora
nge
10
SER
S 63
3
2000
0
4000
0
6000
0
8000
0
1000
00
1200
00
1400
00
1600
00
200
300
400
500
600
700
800
900
1000
1100
1200
1300
1400
1500
1600
1700
1800
1900
2000
Ram
an s
hift
(cm
-1)
Intensity
Award Number 2006-DN-BX-K034 38 of 146
This document is a research report submitted to the U.S. Department of Justice. This report has not been published by the Department. Opinions or points of view expressed are those of the author(s)
and do not necessarily reflect the official position or policies of the U.S. Department of Justice.
Acid
Ora
nge
10
SER
S 78
5
0
5000
1000
0
1500
0
2000
0
2500
0
3000
0
3500
0 200
300
400
500
600
700
800
900
1000
1100
1200
1300
1400
1500
1600
1700
1800
1900
2000
Ram
an s
hift
(cm
-1)
Intensity
Award Number 2006-DN-BX-K034 39 of 146
This document is a research report submitted to the U.S. Department of Justice. This report has not been published by the Department. Opinions or points of view expressed are those of the author(s)
and do not necessarily reflect the official position or policies of the U.S. Department of Justice.
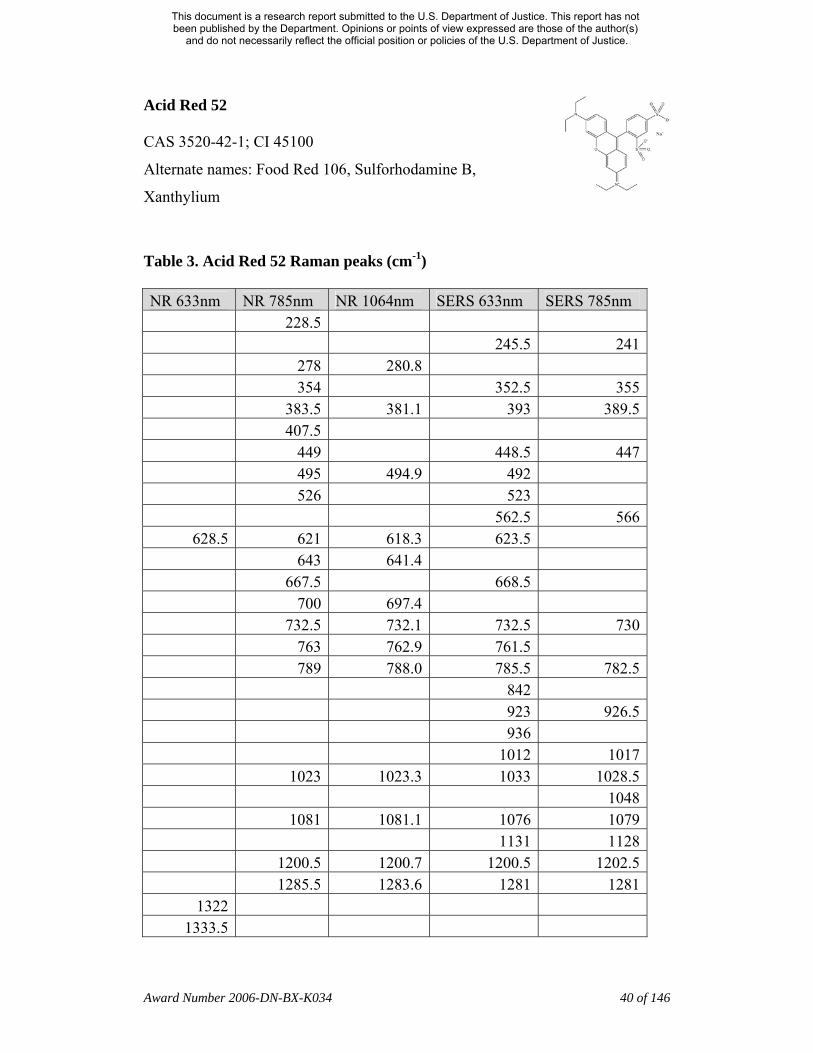
Acid Red 52
CAS 3520-42-1; CI 45100
Alternate names: Food Red 106, Sulforhodamine B,
Xanthylium
Table 3. Acid Red 52 Raman peaks (cm-1)
NR 633nm NR 785nm NR 1064nm SERS 633nm SERS 785nm 228.5 245.5 241 278 280.8 354 352.5 355 383.5 381.1 393 389.5 407.5 449 448.5 447 495 494.9 492 526 523 562.5 566
628.5 621 618.3 623.5 643 641.4 667.5 668.5 700 697.4 732.5 732.1 732.5 730 763 762.9 761.5 789 788.0 785.5 782.5 842 923 926.5 936 1012 1017 1023 1023.3 1033 1028.5 1048 1081 1081.1 1076 1079 1131 1128 1200.5 1200.7 1200.5 1202.5 1285.5 1283.6 1281 1281
1322 1333.5
Award Number 2006-DN-BX-K034 40 of 146
This document is a research report submitted to the U.S. Department of Justice. This report has not been published by the Department. Opinions or points of view expressed are those of the author(s)
and do not necessarily reflect the official position or policies of the U.S. Department of Justice.
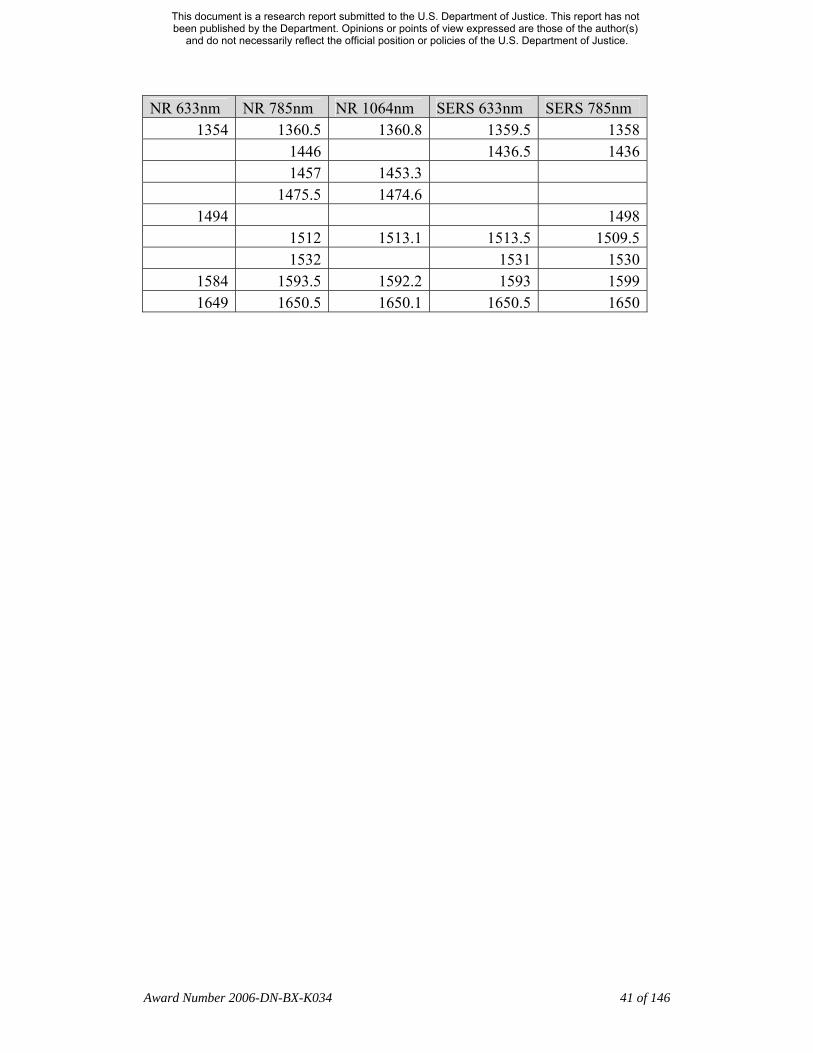
NR 633nm NR 785nm NR 1064nm SERS 633nm SERS 785nm 1354 1360.5 1360.8 1359.5 1358
1446 1436.5 1436 1457 1453.3 1475.5 1474.6
1494 1498 1512 1513.1 1513.5 1509.5 1532 1531 1530
1584 1593.5 1592.2 1593 1599 1649 1650.5 1650.1 1650.5 1650
Award Number 2006-DN-BX-K034 41 of 146
This document is a research report submitted to the U.S. Department of Justice. This report has not been published by the Department. Opinions or points of view expressed are those of the author(s)
and do not necessarily reflect the official position or policies of the U.S. Department of Justice.
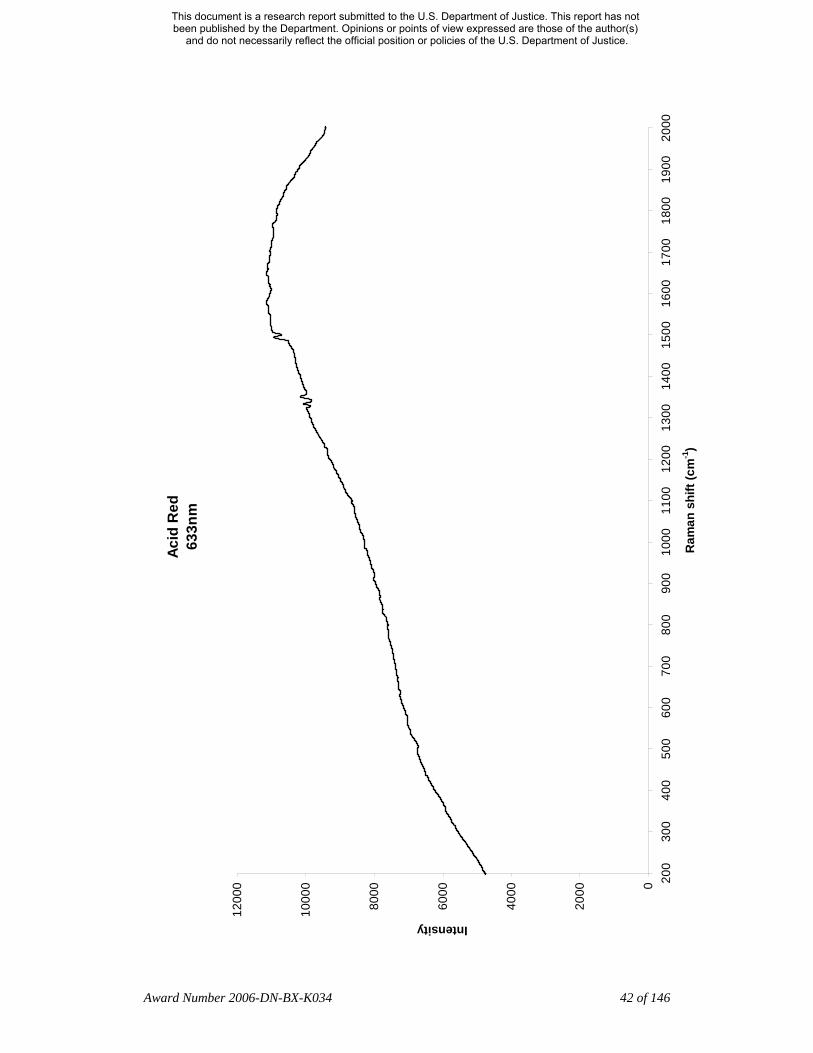
Acid
Red
63
3nm
0
2000
4000
6000
8000
1000
0
1200
0 200
300
400
500
600
700
800
900
1000
1100
1200
1300
1400
1500
1600
1700
1800
1900
2000
Ram
an s
hift
(cm
-1)
Intensity
Award Number 2006-DN-BX-K034 42 of 146
This document is a research report submitted to the U.S. Department of Justice. This report has not been published by the Department. Opinions or points of view expressed are those of the author(s)
and do not necessarily reflect the official position or policies of the U.S. Department of Justice.

Acid
Red
78
5nm
0
1000
2000
3000
4000
5000
6000
200
300
400
500
600
700
800
900
1000
1100
1200
1300
1400
1500
1600
1700
1800
1900
2000
Ram
an s
hift
(cm
-1)
Intensity
Award Number 2006-DN-BX-K034 43 of 146
This document is a research report submitted to the U.S. Department of Justice. This report has not been published by the Department. Opinions or points of view expressed are those of the author(s)
and do not necessarily reflect the official position or policies of the U.S. Department of Justice.
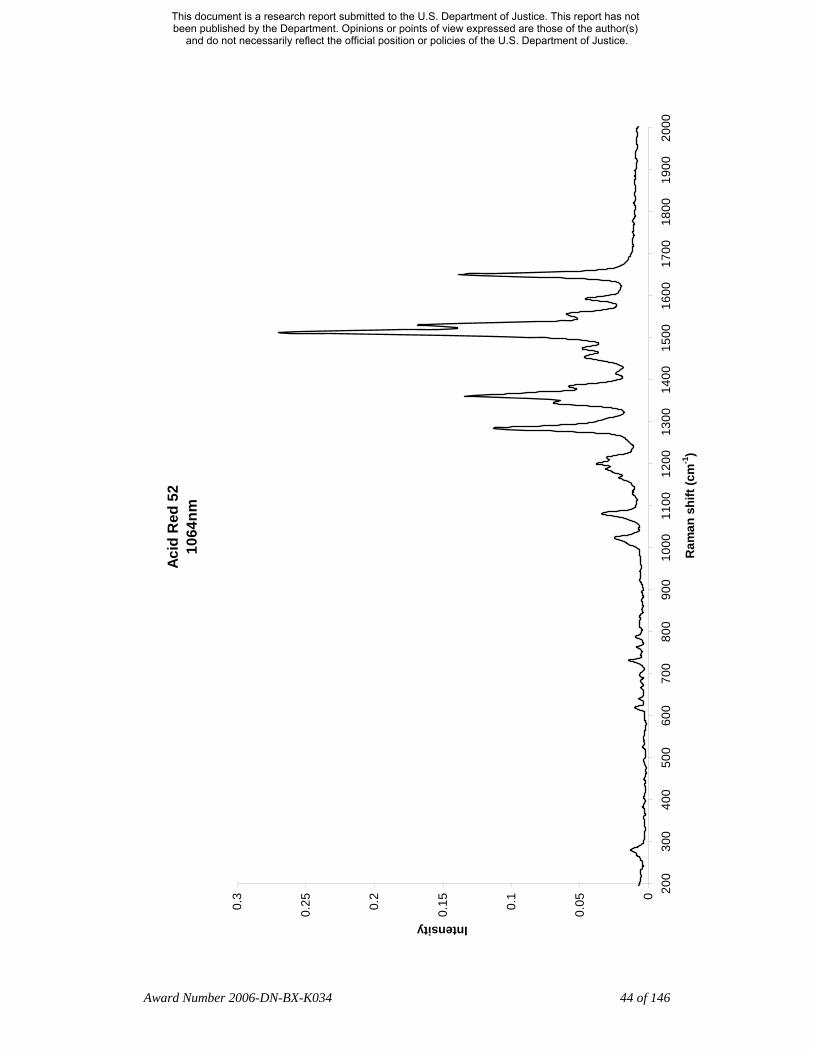
Acid
Red
52
1064
nm
0
0.050.
1
0.150.
2
0.250.
3 200
300
400
500
600
700
800
900
1000
1100
1200
1300
1400
1500
1600
1700
1800
1900
2000
Ram
an s
hift
(cm
-1)
Intensity
Award Number 2006-DN-BX-K034 44 of 146
This document is a research report submitted to the U.S. Department of Justice. This report has not been published by the Department. Opinions or points of view expressed are those of the author(s)
and do not necessarily reflect the official position or policies of the U.S. Department of Justice.

Acid
Red
52
SER
S 63
3nm
0
1000
0
2000
0
3000
0
4000
0
5000
0
6000
0
7000
0 200
300
400
500
600
700
800
900
1000
1100
1200
1300
1400
1500
1600
1700
1800
1900
2000
Ram
an s
hift
(cm
-1)
Intensity
Award Number 2006-DN-BX-K034 45 of 146
This document is a research report submitted to the U.S. Department of Justice. This report has not been published by the Department. Opinions or points of view expressed are those of the author(s)
and do not necessarily reflect the official position or policies of the U.S. Department of Justice.
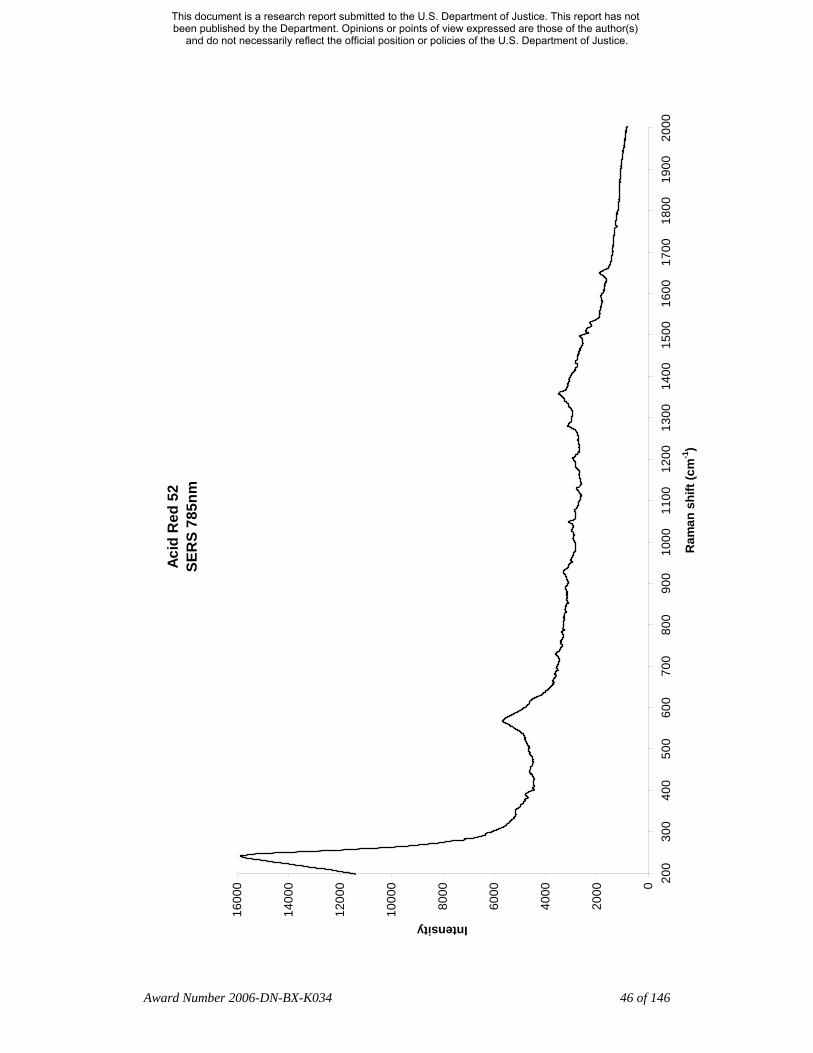
Acid
Red
52
SER
S 78
5nm
0
2000
4000
6000
8000
1000
0
1200
0
1400
0
1600
0 200
300
400
500
600
700
800
900
1000
1100
1200
1300
1400
1500
1600
1700
1800
1900
2000
Ram
an s
hift
(cm
-1)
Intensity
Award Number 2006-DN-BX-K034 46 of 146
This document is a research report submitted to the U.S. Department of Justice. This report has not been published by the Department. Opinions or points of view expressed are those of the author(s)
and do not necessarily reflect the official position or policies of the U.S. Department of Justice.

Aniline Blue
CAS 28631-66-5; CI 42755
Alternate names: Acid Blue 22, Methyl Blue
Table 4. Aniline Blue Raman peaks (cm-1)
NR 633nm NR 785nm NR 1064nm SERS 633nm SERS 785nm 222 219 267 342 336.5
416 412.5 413.9 421.5 411.5 436.5 445 448.6 445 445.5
521.5 522.5 529.5 526 533.4
572 566.2 571 568.5 587.5
619 612.5 613.5 636 637.5 625 646 645 664.5 677.5 672.5
691.5 687.5 693.5 706 702
730.5 730.1 729 730 756.5 759.1 762 760.5
799 805.5 826 832.0 822 832.5
842.5 856.5 866 878.6 885.5
916 917.2 916 915 964.5 959.0 951 951.5 982.5
1005 1001 1005.9 1006 1006 1027.1 1033 1023 1075.4 1073 1125.5 1124 1129
Award Number 2006-DN-BX-K034 47 of 146
This document is a research report submitted to the U.S. Department of Justice. This report has not been published by the Department. Opinions or points of view expressed are those of the author(s)
and do not necessarily reflect the official position or policies of the U.S. Department of Justice.
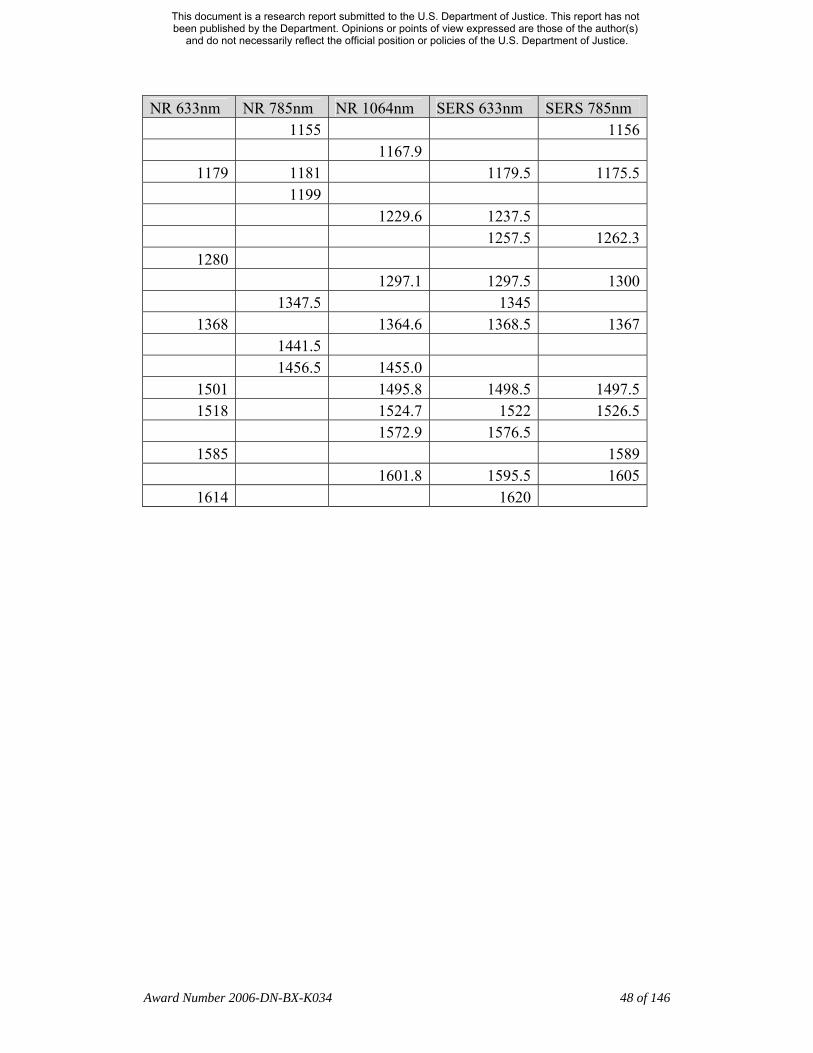
NR 633nm NR 785nm NR 1064nm SERS 633nm SERS 785nm 1155 1156 1167.9
1179 1181 1179.5 1175.5 1199 1229.6 1237.5 1257.5 1262.3
1280 1297.1 1297.5 1300 1347.5 1345
1368 1364.6 1368.5 1367 1441.5 1456.5 1455.0
1501 1495.8 1498.5 1497.5 1518 1524.7 1522 1526.5
1572.9 1576.5 1585 1589
1601.8 1595.5 1605 1614 1620
Award Number 2006-DN-BX-K034 48 of 146
This document is a research report submitted to the U.S. Department of Justice. This report has not been published by the Department. Opinions or points of view expressed are those of the author(s)
and do not necessarily reflect the official position or policies of the U.S. Department of Justice.
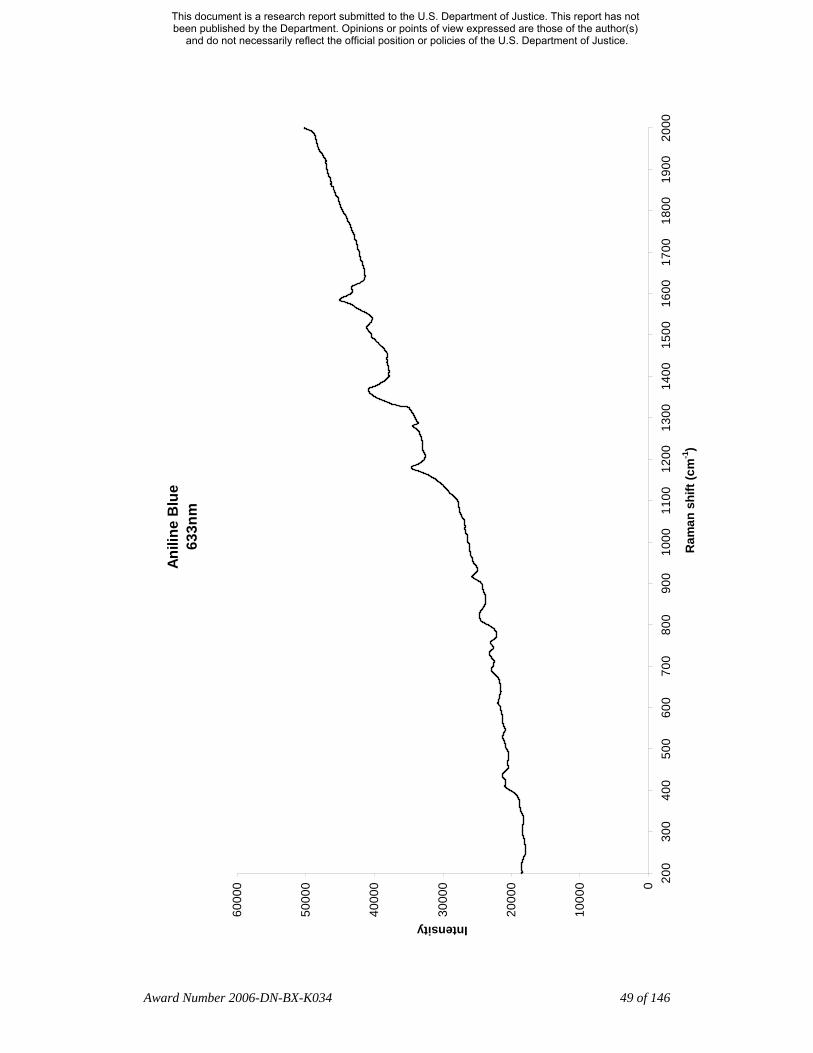
Anili
ne B
lue
633n
m
0
1000
0
2000
0
3000
0
4000
0
5000
0
6000
0 200
300
400
500
600
700
800
900
1000
1100
1200
1300
1400
1500
1600
1700
1800
1900
2000
Ram
an s
hift
(cm
-1)
Intensity
Award Number 2006-DN-BX-K034 49 of 146
This document is a research report submitted to the U.S. Department of Justice. This report has not been published by the Department. Opinions or points of view expressed are those of the author(s)
and do not necessarily reflect the official position or policies of the U.S. Department of Justice.

Anili
ne B
lue
785n
m
0
2000
0
4000
0
6000
0
8000
0
1000
00
1200
00
200
300
400
500
600
700
800
900
1000
1100
1200
1300
1400
1500
1600
1700
1800
1900
2000
Ram
an s
hift
(cm
-1)
Intensity
Award Number 2006-DN-BX-K034 50 of 146
This document is a research report submitted to the U.S. Department of Justice. This report has not been published by the Department. Opinions or points of view expressed are those of the author(s)
and do not necessarily reflect the official position or policies of the U.S. Department of Justice.

Anili
ne B
lue
1064
nm
0
0.02
0.04
0.06
0.080.
1
0.12
0.14
200
300
400
500
600
700
800
900
1000
1100
1200
1300
1400
1500
1600
1700
1800
1900
2000
Ram
an s
hift
(cm
-1)
Intensity
Award Number 2006-DN-BX-K034 51 of 146
This document is a research report submitted to the U.S. Department of Justice. This report has not been published by the Department. Opinions or points of view expressed are those of the author(s)
and do not necessarily reflect the official position or policies of the U.S. Department of Justice.
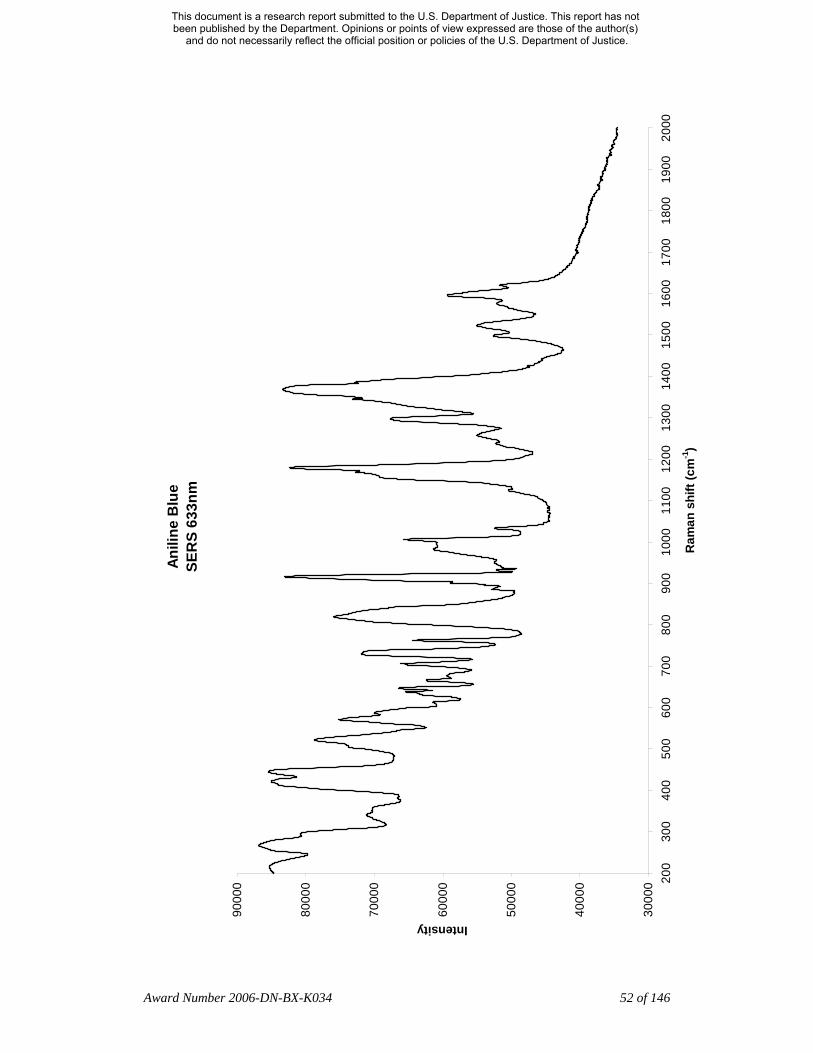
Anili
ne B
lue
SER
S 63
3nm
3000
0
4000
0
5000
0
6000
0
7000
0
8000
0
9000
0 200
300
400
500
600
700
800
900
1000
1100
1200
1300
1400
1500
1600
1700
1800
1900
2000
Ram
an s
hift
(cm
-1)
Intensity
Award Number 2006-DN-BX-K034 52 of 146
This document is a research report submitted to the U.S. Department of Justice. This report has not been published by the Department. Opinions or points of view expressed are those of the author(s)
and do not necessarily reflect the official position or policies of the U.S. Department of Justice.

Anili
ne B
lue
SER
S 78
5nm
0
1000
0
2000
0
3000
0
4000
0
5000
0
6000
0
7000
0
8000
0 200
300
400
500
600
700
800
900
1000
1100
1200
1300
1400
1500
1600
1700
1800
1900
2000
Ram
an s
hift
(cm
-1)
Intensity
Award Number 2006-DN-BX-K034 53 of 146
This document is a research report submitted to the U.S. Department of Justice. This report has not been published by the Department. Opinions or points of view expressed are those of the author(s)
and do not necessarily reflect the official position or policies of the U.S. Department of Justice.
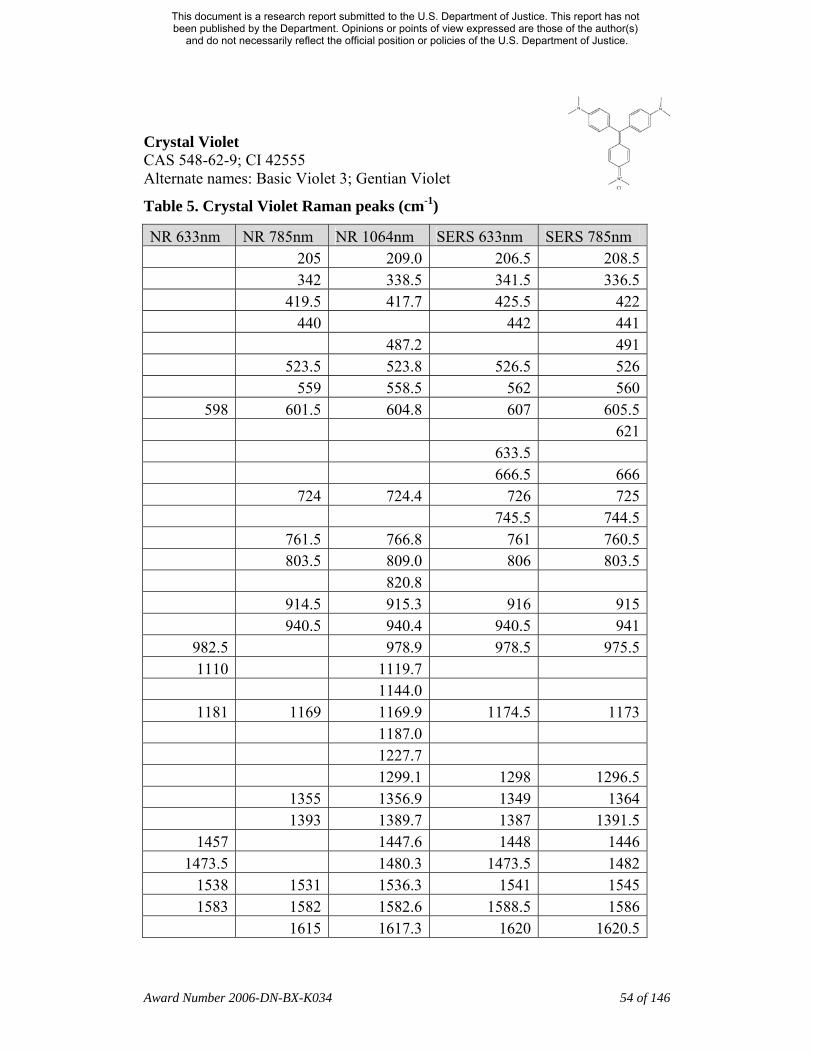
Crystal Violet CAS 548-62-9; CI 42555 Alternate names: Basic Violet 3; Gentian Violet
Table 5. Crystal Violet Raman peaks (cm-1)
NR 633nm NR 785nm NR 1064nm SERS 633nm SERS 785nm 205 209.0 206.5 208.5 342 338.5 341.5 336.5 419.5 417.7 425.5 422 440 442 441 487.2 491 523.5 523.8 526.5 526 559 558.5 562 560
598 601.5 604.8 607 605.5 621
633.5 666.5 666 724 724.4 726 725 745.5 744.5 761.5 766.8 761 760.5 803.5 809.0 806 803.5 820.8 914.5 915.3 916 915 940.5 940.4 940.5 941
982.5 978.9 978.5 975.5 1110 1119.7
1144.0 1181 1169 1169.9 1174.5 1173
1187.0 1227.7 1299.1 1298 1296.5 1355 1356.9 1349 1364 1393 1389.7 1387 1391.5
1457 1447.6 1448 1446 1473.5 1480.3 1473.5 1482
1538 1531 1536.3 1541 1545 1583 1582 1582.6 1588.5 1586
1615 1617.3 1620 1620.5
Award Number 2006-DN-BX-K034 54 of 146
This document is a research report submitted to the U.S. Department of Justice. This report has not been published by the Department. Opinions or points of view expressed are those of the author(s)
and do not necessarily reflect the official position or policies of the U.S. Department of Justice.
Award Number 2006-DN-BX-K034 55 of 146
This document is a research report submitted to the U.S. Department of Justice. This report has not been published by the Department. Opinions or points of view expressed are those of the author(s)
and do not necessarily reflect the official position or policies of the U.S. Department of Justice.

Cry
stal
Vio
let
633n
m
2000
0
3000
0
4000
0
5000
0
6000
0
7000
0
8000
0
9000
0
1000
00
1100
00
1200
00
200
300
400
500
600
700
800
900
1000
1100
1200
1300
1400
1500
1600
1700
1800
1900
2000
Ram
an s
hift
(cm
-1)
Intensity
Award Number 2006-DN-BX-K034 56 of 146
This document is a research report submitted to the U.S. Department of Justice. This report has not been published by the Department. Opinions or points of view expressed are those of the author(s)
and do not necessarily reflect the official position or policies of the U.S. Department of Justice.
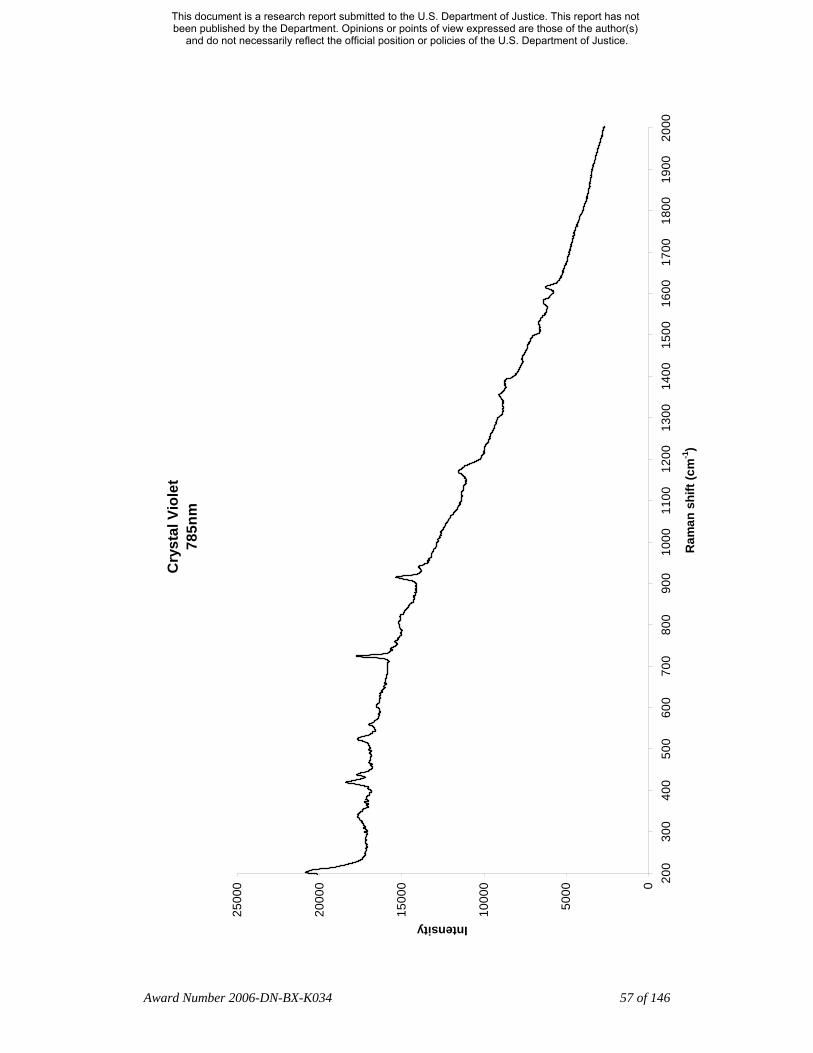
Cry
stal
Vio
let
785n
m
0
5000
1000
0
1500
0
2000
0
2500
0 200
300
400
500
600
700
800
900
1000
1100
1200
1300
1400
1500
1600
1700
1800
1900
2000
Ram
an s
hift
(cm
-1)
Intensity
Award Number 2006-DN-BX-K034 57 of 146
This document is a research report submitted to the U.S. Department of Justice. This report has not been published by the Department. Opinions or points of view expressed are those of the author(s)
and do not necessarily reflect the official position or policies of the U.S. Department of Justice.

Cry
stal
Vio
let
1064
nm
0
0.1
0.2
0.3
0.4
0.5
0.6
0.7 20
030
040
050
060
070
080
090
010
0011
0012
0013
0014
0015
0016
0017
0018
0019
0020
00
Ram
an s
hift
(cm
-1)
Intensity
Award Number 2006-DN-BX-K034 58 of 146
This document is a research report submitted to the U.S. Department of Justice. This report has not been published by the Department. Opinions or points of view expressed are those of the author(s)
and do not necessarily reflect the official position or policies of the U.S. Department of Justice.

Cry
stal
Vio
let
SER
S 63
3nm
3000
0
3500
0
4000
0
4500
0
5000
0
5500
0
6000
0
6500
0
7000
0 200
300
400
500
600
700
800
900
1000
1100
1200
1300
1400
1500
1600
1700
1800
1900
2000
Ram
an s
hift
(cm
-1)
Intensity
Award Number 2006-DN-BX-K034 59 of 146
This document is a research report submitted to the U.S. Department of Justice. This report has not been published by the Department. Opinions or points of view expressed are those of the author(s)
and do not necessarily reflect the official position or policies of the U.S. Department of Justice.
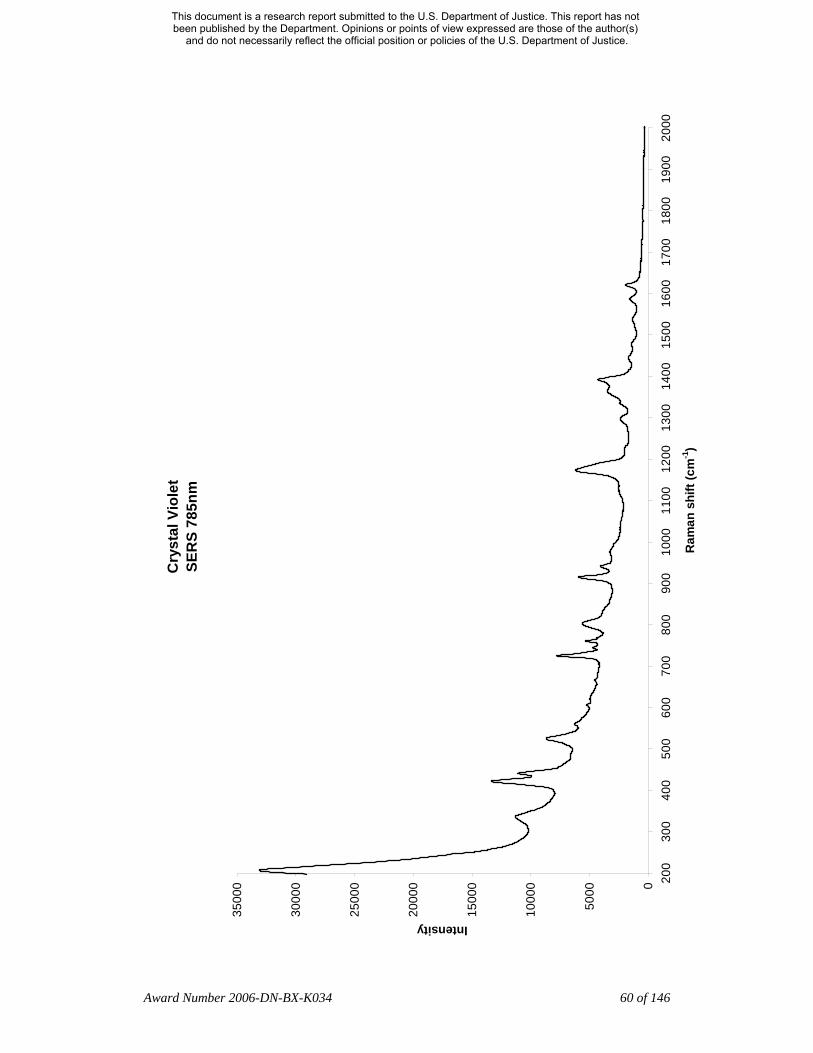
Cry
stal
Vio
let
SER
S 78
5nm
0
5000
1000
0
1500
0
2000
0
2500
0
3000
0
3500
0 200
300
400
500
600
700
800
900
1000
1100
1200
1300
1400
1500
1600
1700
1800
1900
2000
Ram
an s
hift
(cm
-1)
Intensity
Award Number 2006-DN-BX-K034 60 of 146
This document is a research report submitted to the U.S. Department of Justice. This report has not been published by the Department. Opinions or points of view expressed are those of the author(s)
and do not necessarily reflect the official position or policies of the U.S. Department of Justice.

Methyl Violet
CAS 8004-87-3; CI 42535
Alternate name: Methyl Violet 2B
Table 6. Methyl Violet Raman peaks (cm-1)
NR 633nm NR 785nm NR 1064nm SERS 633nm SERS 785nm 207.0 221.5 222 334.8 339.5 335.5
402 401 420 419.7 423.5 416 443 441.5 438.5 526 523.8 527.5 525.5 561 560.4 561.5
624 624 666.5 666.5
678 676 725 724.4 733 731 759.1 761 760
786 787.5 801.5 806.5 800.5
833 830.5 856 853.5
914 913.4 916.5 914 942.3 939.5 938.5
954 952.5 965.5
985 989 983 996 1141 1143 1144.0 1174 1170.5 1169.9 1176 1172.5
1185.5 1227.7 1297.1 1296 1295.5
1336 1335.5 1356.9
1378 1384
Award Number 2006-DN-BX-K034 61 of 146
This document is a research report submitted to the U.S. Department of Justice. This report has not been published by the Department. Opinions or points of view expressed are those of the author(s)
and do not necessarily reflect the official position or policies of the U.S. Department of Justice.
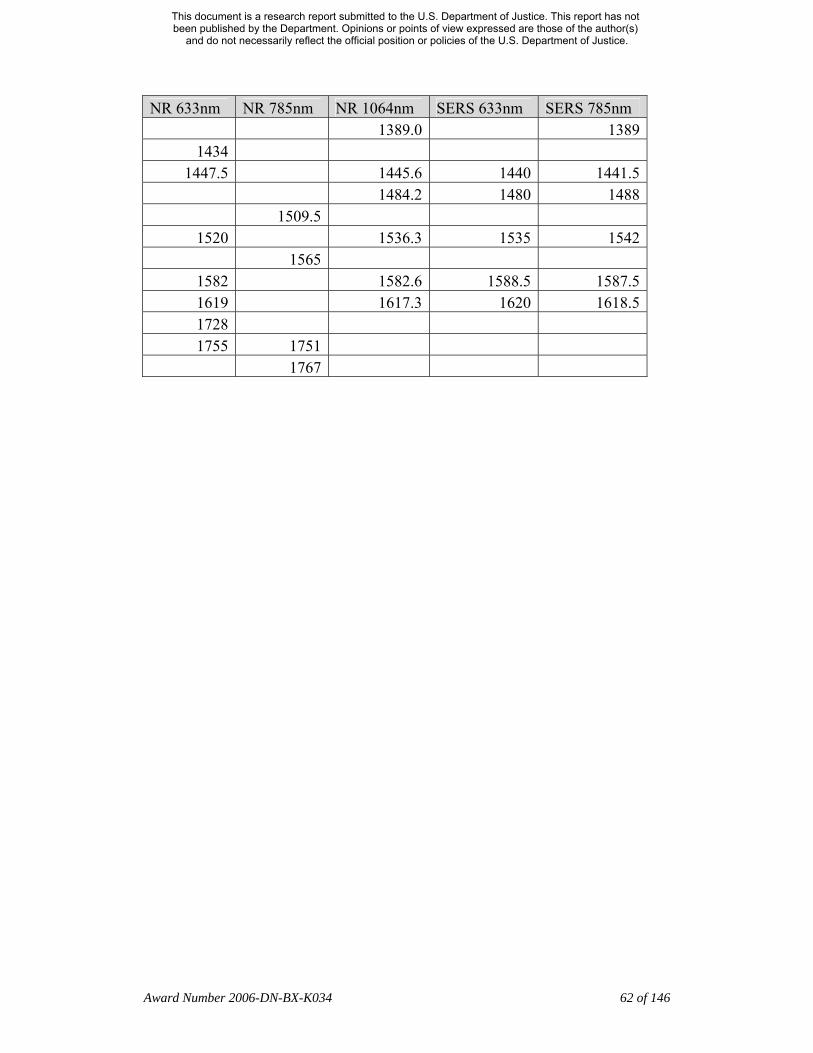
NR 633nm NR 785nm NR 1064nm SERS 633nm SERS 785nm 1389.0 1389
1434 1447.5 1445.6 1440 1441.5
1484.2 1480 1488 1509.5
1520 1536.3 1535 1542 1565
1582 1582.6 1588.5 1587.5 1619 1617.3 1620 1618.5 1728 1755 1751
1767
Award Number 2006-DN-BX-K034 62 of 146
This document is a research report submitted to the U.S. Department of Justice. This report has not been published by the Department. Opinions or points of view expressed are those of the author(s)
and do not necessarily reflect the official position or policies of the U.S. Department of Justice.
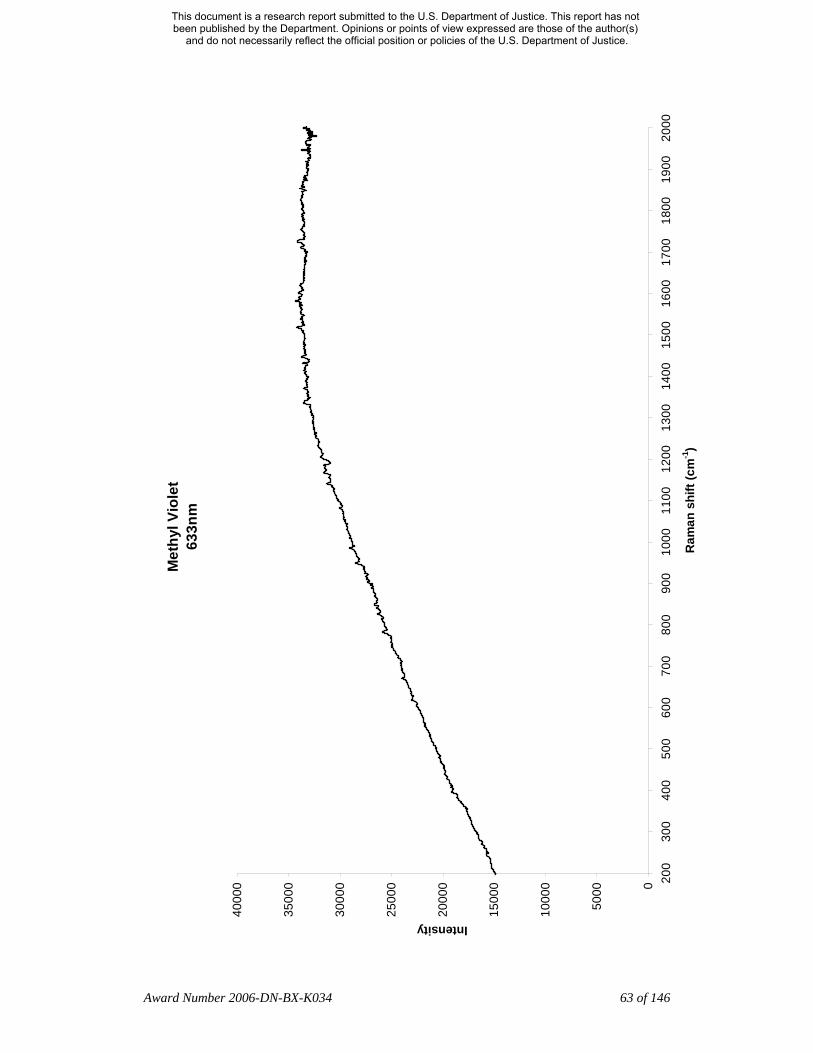
Met
hyl V
iole
t 63
3nm
0
5000
1000
0
1500
0
2000
0
2500
0
3000
0
3500
0
4000
0 200
300
400
500
600
700
800
900
1000
1100
1200
1300
1400
1500
1600
1700
1800
1900
2000
Ram
an s
hift
(cm
-1)
Intensity
Award Number 2006-DN-BX-K034 63 of 146
This document is a research report submitted to the U.S. Department of Justice. This report has not been published by the Department. Opinions or points of view expressed are those of the author(s)
and do not necessarily reflect the official position or policies of the U.S. Department of Justice.
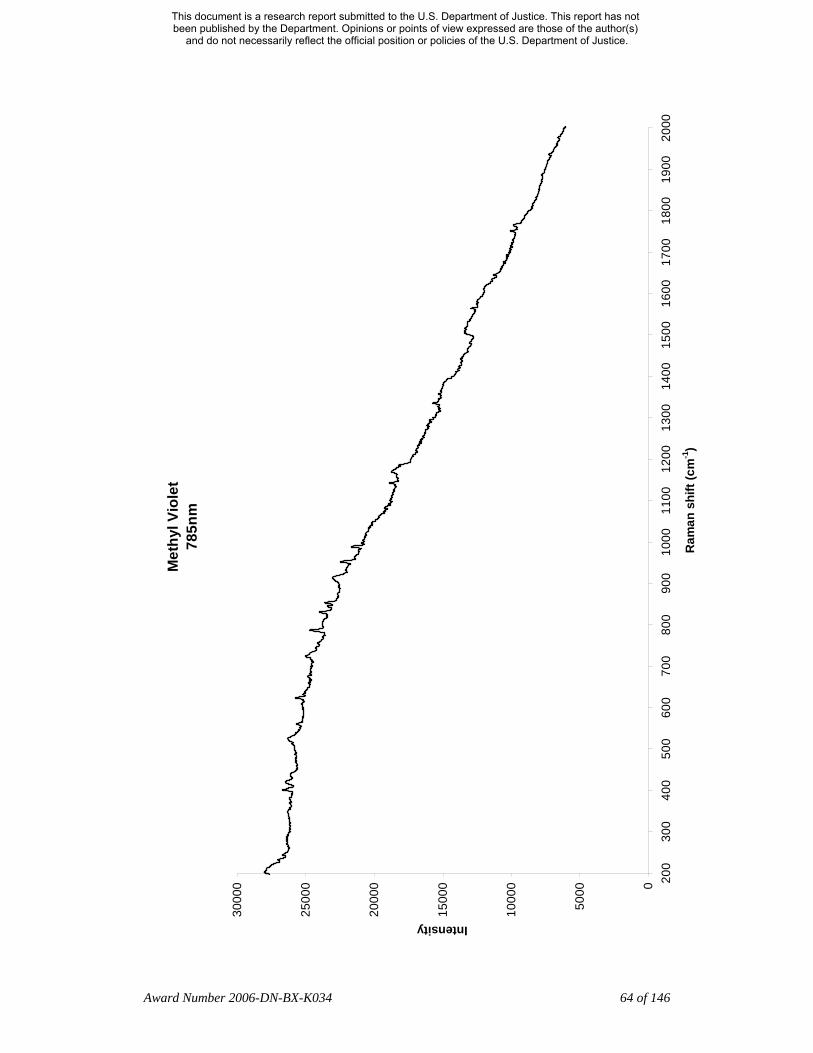
Met
hyl V
iole
t 78
5nm
0
5000
1000
0
1500
0
2000
0
2500
0
3000
0 200
300
400
500
600
700
800
900
1000
1100
1200
1300
1400
1500
1600
1700
1800
1900
2000
Ram
an s
hift
(cm
-1)
Intensity
Award Number 2006-DN-BX-K034 64 of 146
This document is a research report submitted to the U.S. Department of Justice. This report has not been published by the Department. Opinions or points of view expressed are those of the author(s)
and do not necessarily reflect the official position or policies of the U.S. Department of Justice.

Met
hyl V
iole
t 10
64nm
0
0.050.
1
0.150.
2
0.250.
3
0.350.
4
0.45
200
300
400
500
600
700
800
900
1000
1100
1200
1300
1400
1500
1600
1700
1800
1900
2000
Ram
an s
hift
(cm
-1)
Intensity
Award Number 2006-DN-BX-K034 65 of 146
This document is a research report submitted to the U.S. Department of Justice. This report has not been published by the Department. Opinions or points of view expressed are those of the author(s)
and do not necessarily reflect the official position or policies of the U.S. Department of Justice.

Met
hyl V
iole
t SE
RS
633n
m
8000
0
9000
0
1000
00
1100
00
1200
00
1300
00
1400
00
1500
00
1600
00
1700
00
1800
00
200
300
400
500
600
700
800
900
1000
1100
1200
1300
1400
1500
1600
1700
1800
1900
2000
Ram
an s
hift
(cm
-1)
Intensity
Award Number 2006-DN-BX-K034 66 of 146
This document is a research report submitted to the U.S. Department of Justice. This report has not been published by the Department. Opinions or points of view expressed are those of the author(s)
and do not necessarily reflect the official position or policies of the U.S. Department of Justice.
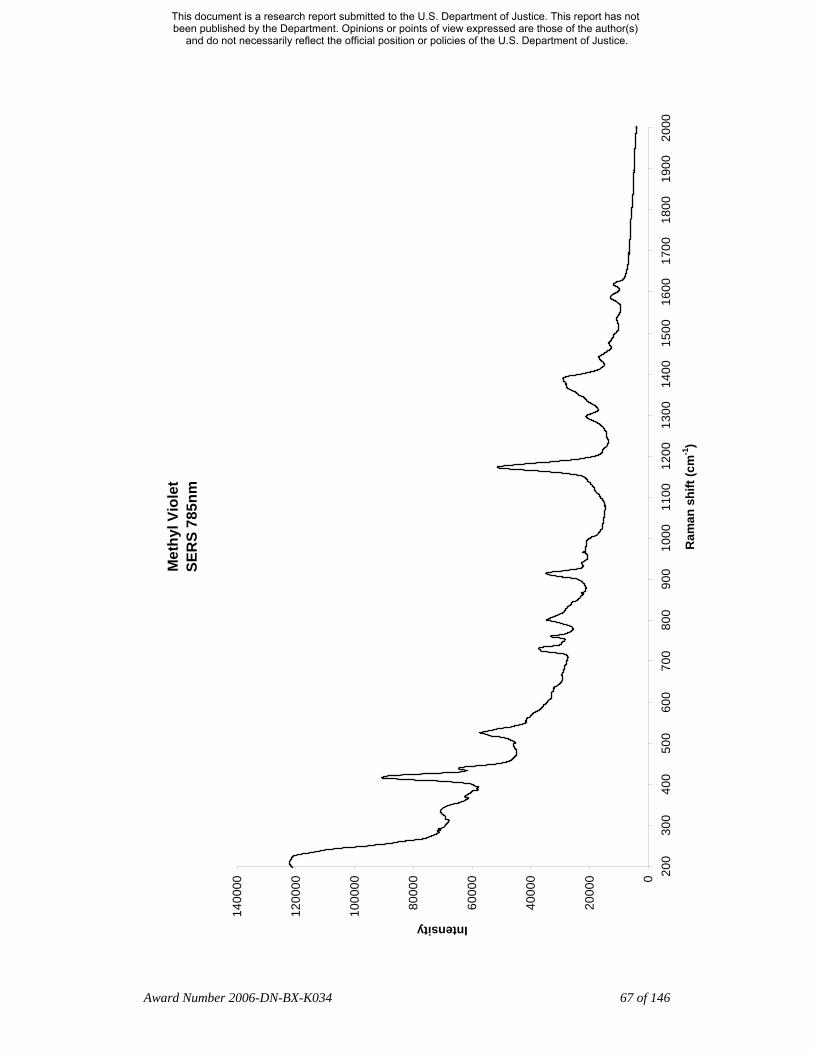
Met
hyl V
iole
t SE
RS
785n
m
0
2000
0
4000
0
6000
0
8000
0
1000
00
1200
00
1400
00
200
300
400
500
600
700
800
900
1000
1100
1200
1300
1400
1500
1600
1700
1800
1900
2000
Ram
an s
hift
(cm
-1)
Intensity
Award Number 2006-DN-BX-K034 67 of 146
This document is a research report submitted to the U.S. Department of Justice. This report has not been published by the Department. Opinions or points of view expressed are those of the author(s)
and do not necessarily reflect the official position or policies of the U.S. Department of Justice.

Pararosaniline
CAS 569-61-9; CI 42500 Alternate name: Basic Red 9
Table 7. Pararosaniline Raman peaks (cm-1)
NR 633nm NR 785nm NR 1064nm SERS 633nm SERS 785nm 254.5 253.5 253.8 255.5 255.5
268 335 336.7 337.5 338.5 405 408.1
414 413 422.5
439.5 441 440.5 463.5
518 516.5 518.0 517.5 520 566 564.3 567.5 567.5
641.5 642 641.2 643.5 642.5 673 668
696 733 734.5 734.0 734.5 734.5 760 761.5 762.9 762.5 762
823 820.8 830 833.5 833.5
848.5 917 911 911.4 914.5 906
970 979.5 977.0 980.5 977
1009 1164.5 1167.9 1167
1174.5 1178 1171.5 1225
1290 1290 1291.3 1295 1295 1341.5 1343 1349 1364 1366.6
1377.5 1373.5 1379.5 1448 1449.5 1451 1463.5 1463.0 1517.0 1525 1521
Award Number 2006-DN-BX-K034 68 of 146
This document is a research report submitted to the U.S. Department of Justice. This report has not been published by the Department. Opinions or points of view expressed are those of the author(s)
and do not necessarily reflect the official position or policies of the U.S. Department of Justice.
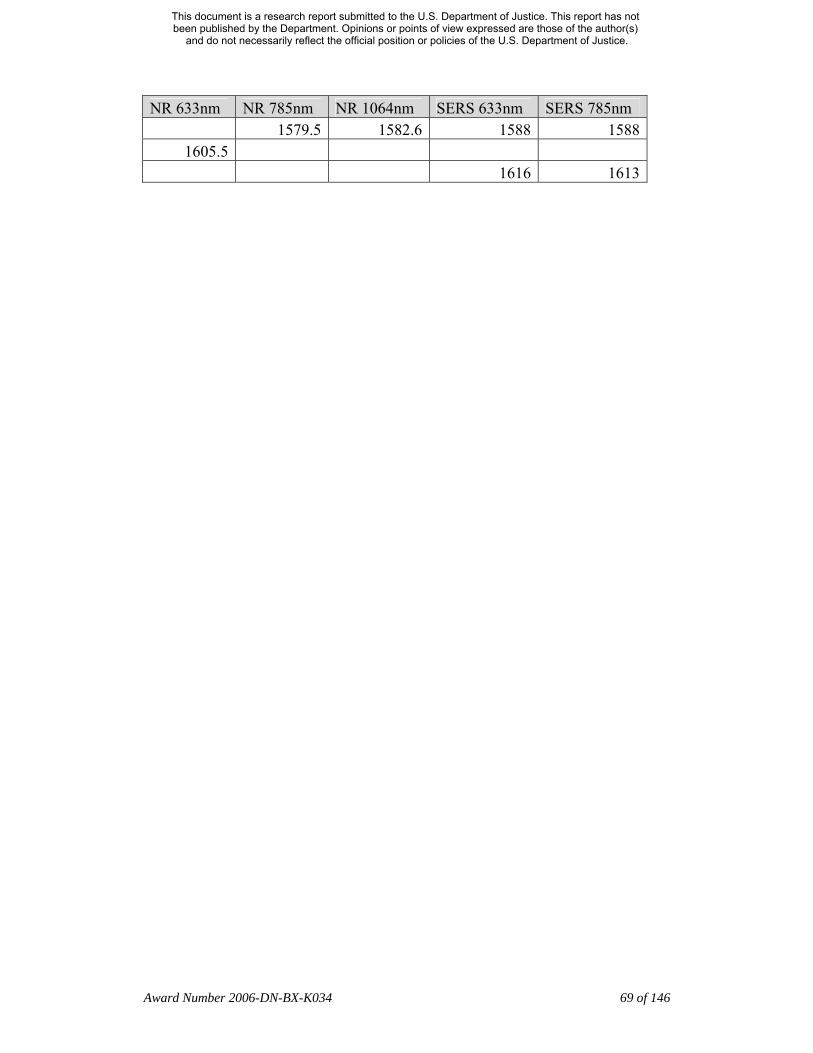
NR 633nm NR 785nm NR 1064nm SERS 633nm SERS 785nm 1579.5 1582.6 1588 1588
1605.5 1616 1613
Award Number 2006-DN-BX-K034 69 of 146
This document is a research report submitted to the U.S. Department of Justice. This report has not been published by the Department. Opinions or points of view expressed are those of the author(s)
and do not necessarily reflect the official position or policies of the U.S. Department of Justice.
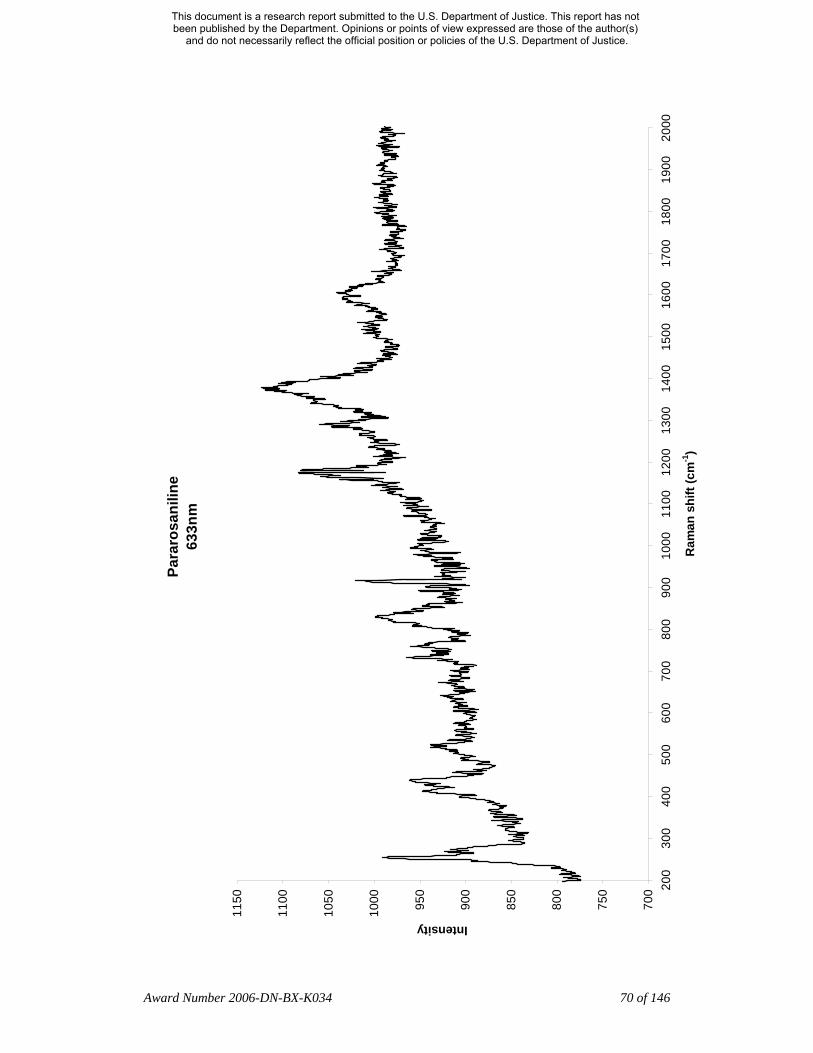
Para
rosa
nilin
e 63
3nm
700
750
800
850
900
950
1000
1050
1100
1150
200
300
400
500
600
700
800
900
1000
1100
1200
1300
1400
1500
1600
1700
1800
1900
2000
Ram
an s
hift
(cm
-1)
Intensity
Award Number 2006-DN-BX-K034 70 of 146
This document is a research report submitted to the U.S. Department of Justice. This report has not been published by the Department. Opinions or points of view expressed are those of the author(s)
and do not necessarily reflect the official position or policies of the U.S. Department of Justice.
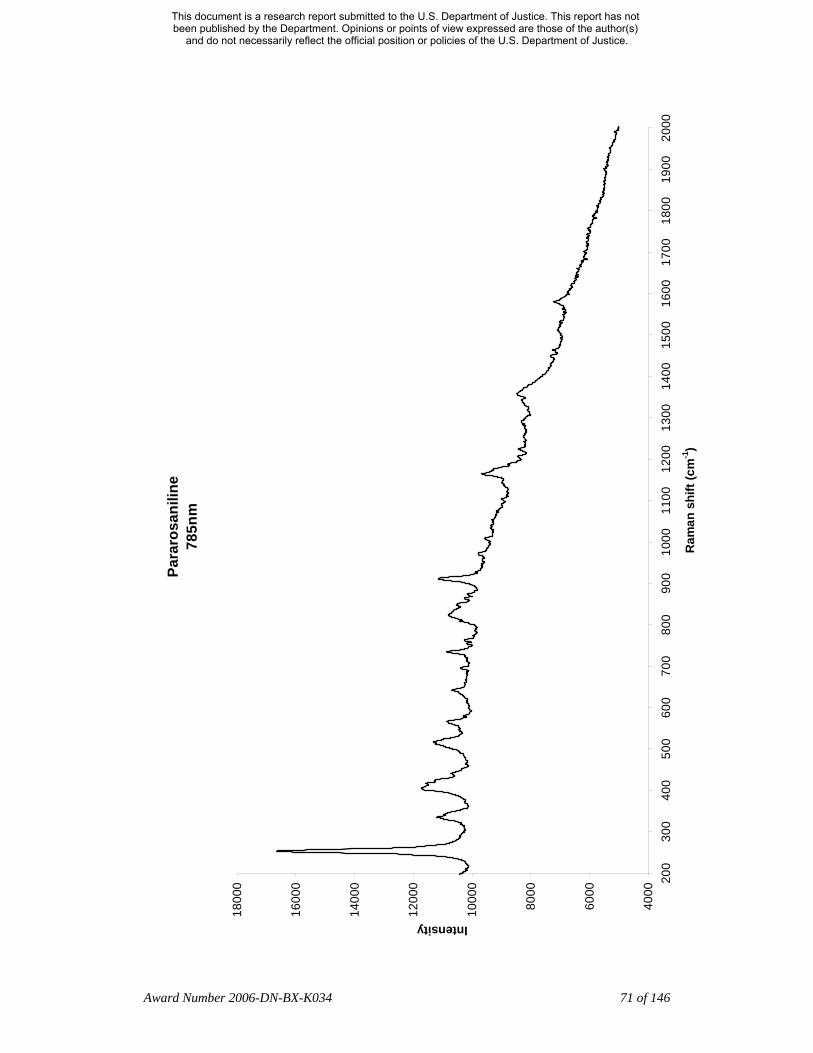
Para
rosa
nilin
e 78
5nm
4000
6000
8000
1000
0
1200
0
1400
0
1600
0
1800
0 200
300
400
500
600
700
800
900
1000
1100
1200
1300
1400
1500
1600
1700
1800
1900
2000
Ram
an s
hift
(cm
-1)
Intensity
Award Number 2006-DN-BX-K034 71 of 146
This document is a research report submitted to the U.S. Department of Justice. This report has not been published by the Department. Opinions or points of view expressed are those of the author(s)
and do not necessarily reflect the official position or policies of the U.S. Department of Justice.

Para
rosa
nilin
e 10
64nm
0
0.050.
1
0.150.
2
0.250.
3
0.350.
4
0.45
200
300
400
500
600
700
800
900
1000
1100
1200
1300
1400
1500
1600
1700
1800
1900
2000
Ram
an s
hift
(cm
-1)
Intensity
Award Number 2006-DN-BX-K034 72 of 146
This document is a research report submitted to the U.S. Department of Justice. This report has not been published by the Department. Opinions or points of view expressed are those of the author(s)
and do not necessarily reflect the official position or policies of the U.S. Department of Justice.
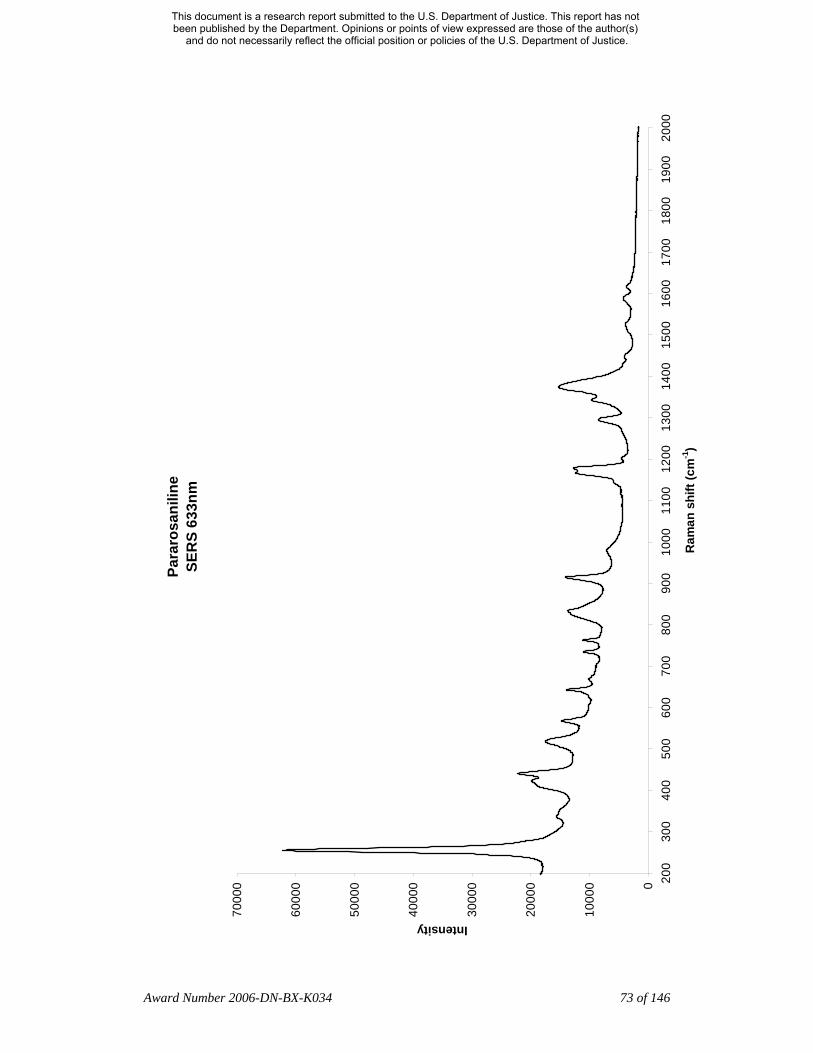
Para
rosa
nilin
e SE
RS
633n
m
0
1000
0
2000
0
3000
0
4000
0
5000
0
6000
0
7000
0 200
300
400
500
600
700
800
900
1000
1100
1200
1300
1400
1500
1600
1700
1800
1900
2000
Ram
an s
hift
(cm
-1)
Intensity
Award Number 2006-DN-BX-K034 73 of 146
This document is a research report submitted to the U.S. Department of Justice. This report has not been published by the Department. Opinions or points of view expressed are those of the author(s)
and do not necessarily reflect the official position or policies of the U.S. Department of Justice.
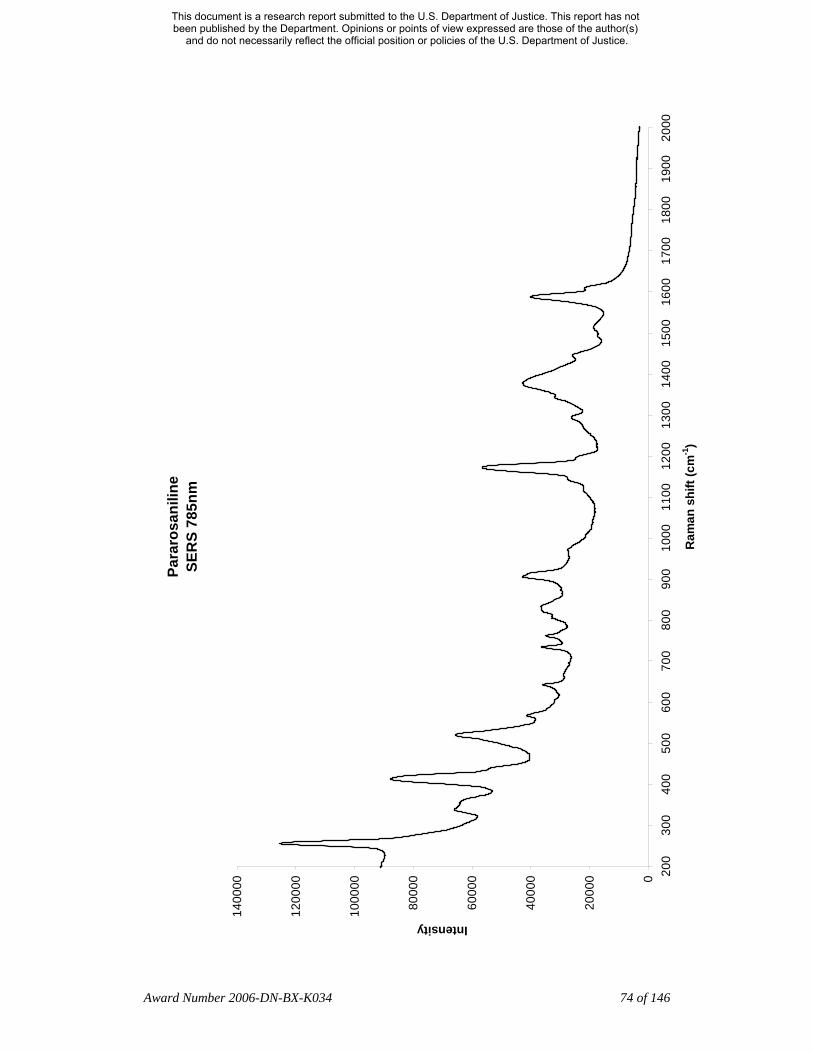
Para
rosa
nilin
e SE
RS
785n
m
0
2000
0
4000
0
6000
0
8000
0
1000
00
1200
00
1400
00
200
300
400
500
600
700
800
900
1000
1100
1200
1300
1400
1500
1600
1700
1800
1900
2000
Ram
an s
hift
(cm
-1)
Intensity
Award Number 2006-DN-BX-K034 74 of 146
This document is a research report submitted to the U.S. Department of Justice. This report has not been published by the Department. Opinions or points of view expressed are those of the author(s)
and do not necessarily reflect the official position or policies of the U.S. Department of Justice.
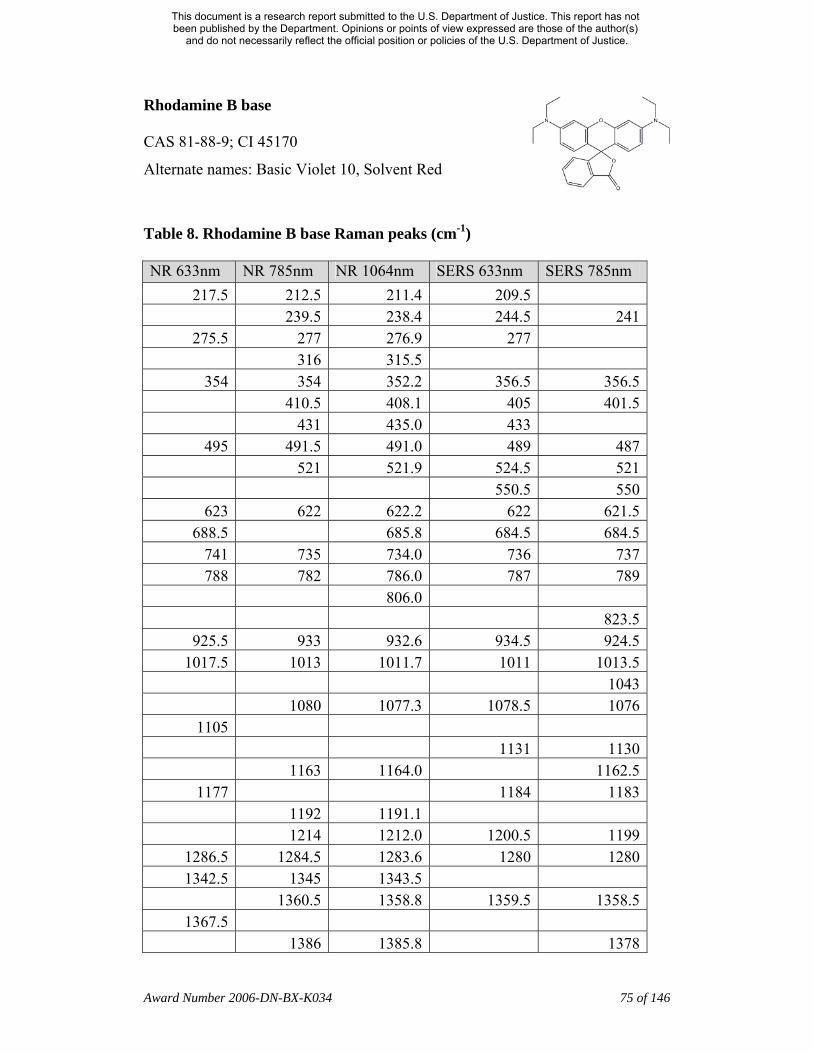
Rhodamine B base
CAS 81-88-9; CI 45170
Alternate names: Basic Violet 10, Solvent Red
Table 8. Rhodamine B base Raman peaks (cm-1)
NR 633nm NR 785nm NR 1064nm SERS 633nm SERS 785nm 217.5 212.5 211.4 209.5
239.5 238.4 244.5 241 275.5 277 276.9 277
316 315.5 354 354 352.2 356.5 356.5
410.5 408.1 405 401.5 431 435.0 433
495 491.5 491.0 489 487 521 521.9 524.5 521 550.5 550
623 622 622.2 622 621.5 688.5 685.8 684.5 684.5
741 735 734.0 736 737 788 782 786.0 787 789
806.0 823.5
925.5 933 932.6 934.5 924.5 1017.5 1013 1011.7 1011 1013.5
1043 1080 1077.3 1078.5 1076
1105 1131 1130 1163 1164.0 1162.5
1177 1184 1183 1192 1191.1 1214 1212.0 1200.5 1199
1286.5 1284.5 1283.6 1280 1280 1342.5 1345 1343.5
1360.5 1358.8 1359.5 1358.5 1367.5
1386 1385.8 1378
Award Number 2006-DN-BX-K034 75 of 146
This document is a research report submitted to the U.S. Department of Justice. This report has not been published by the Department. Opinions or points of view expressed are those of the author(s)
and do not necessarily reflect the official position or policies of the U.S. Department of Justice.
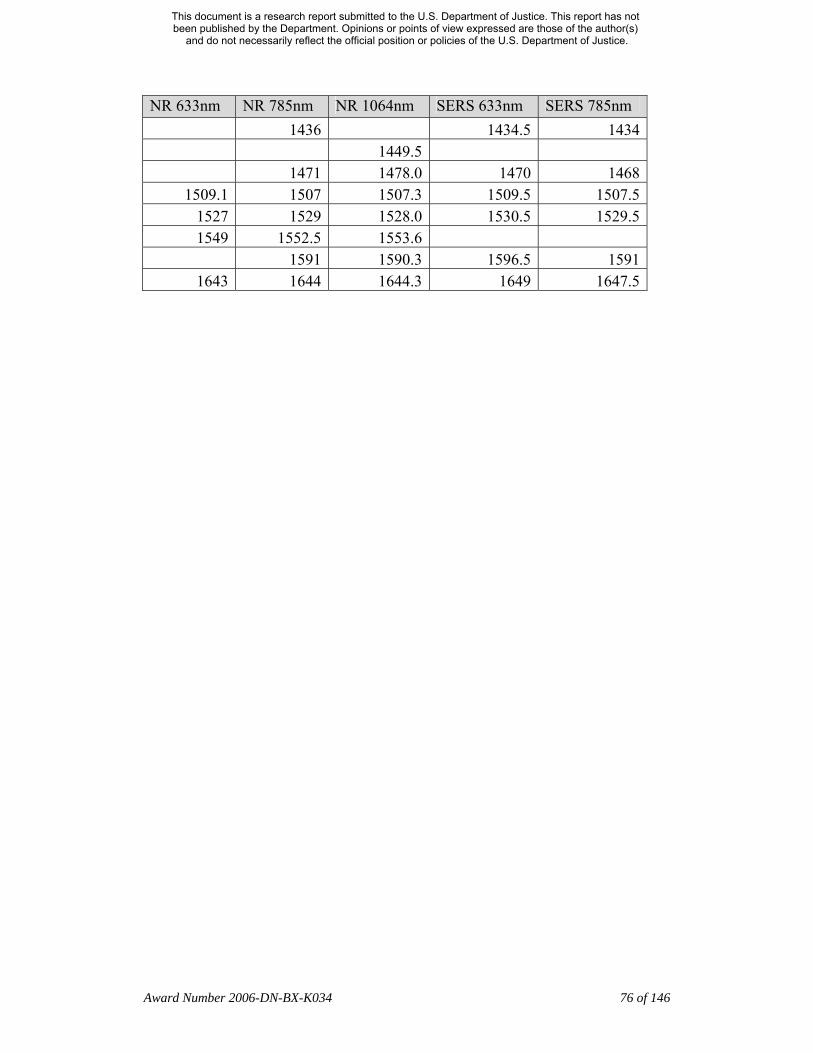
NR 633nm NR 785nm NR 1064nm SERS 633nm SERS 785nm 1436 1434.5 1434 1449.5 1471 1478.0 1470 1468
1509.1 1507 1507.3 1509.5 1507.5 1527 1529 1528.0 1530.5 1529.5 1549 1552.5 1553.6
1591 1590.3 1596.5 1591 1643 1644 1644.3 1649 1647.5
Award Number 2006-DN-BX-K034 76 of 146
This document is a research report submitted to the U.S. Department of Justice. This report has not been published by the Department. Opinions or points of view expressed are those of the author(s)
and do not necessarily reflect the official position or policies of the U.S. Department of Justice.
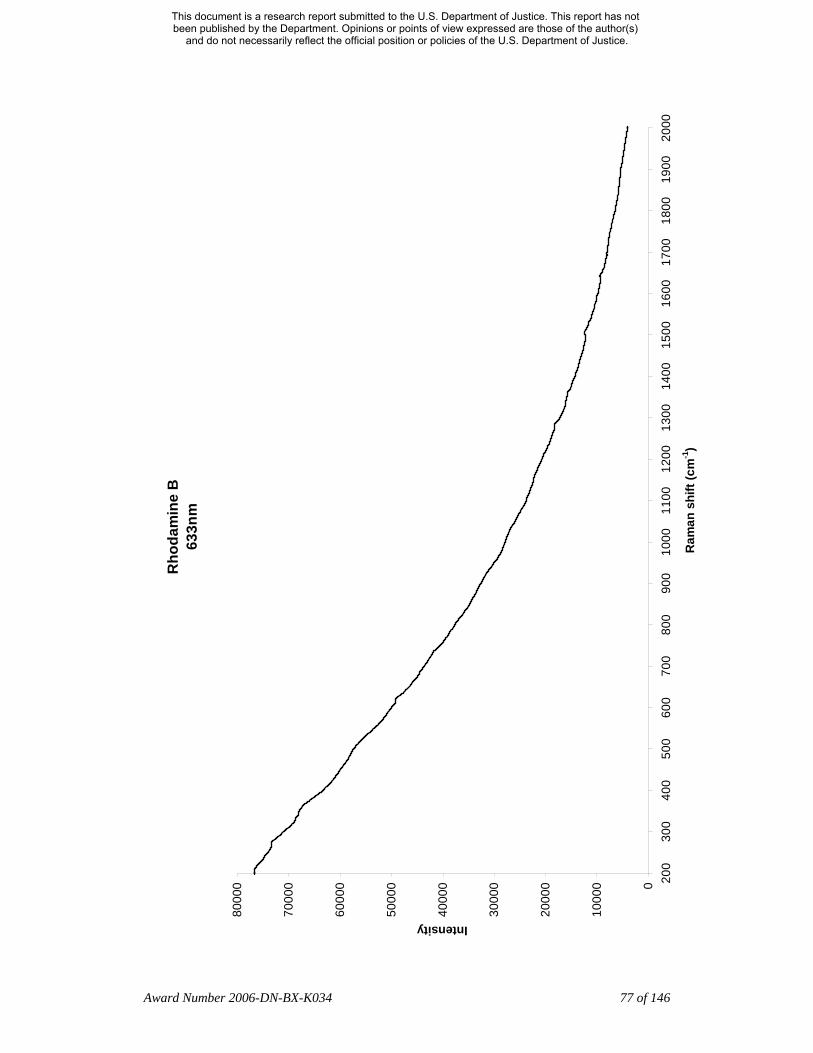
Rho
dam
ine
B
633n
m
0
1000
0
2000
0
3000
0
4000
0
5000
0
6000
0
7000
0
8000
0 200
300
400
500
600
700
800
900
1000
1100
1200
1300
1400
1500
1600
1700
1800
1900
2000
Ram
an s
hift
(cm
-1)
Intensity
Award Number 2006-DN-BX-K034 77 of 146
This document is a research report submitted to the U.S. Department of Justice. This report has not been published by the Department. Opinions or points of view expressed are those of the author(s)
and do not necessarily reflect the official position or policies of the U.S. Department of Justice.

Rho
dam
ine
B
785n
m
1000
0
1500
0
2000
0
2500
0
3000
0
3500
0
4000
0
4500
0 200
300
400
500
600
700
800
900
1000
1100
1200
1300
1400
1500
1600
1700
1800
1900
2000
Ram
an s
hift
(cm
-1)
Intensity
Award Number 2006-DN-BX-K034 78 of 146
This document is a research report submitted to the U.S. Department of Justice. This report has not been published by the Department. Opinions or points of view expressed are those of the author(s)
and do not necessarily reflect the official position or policies of the U.S. Department of Justice.
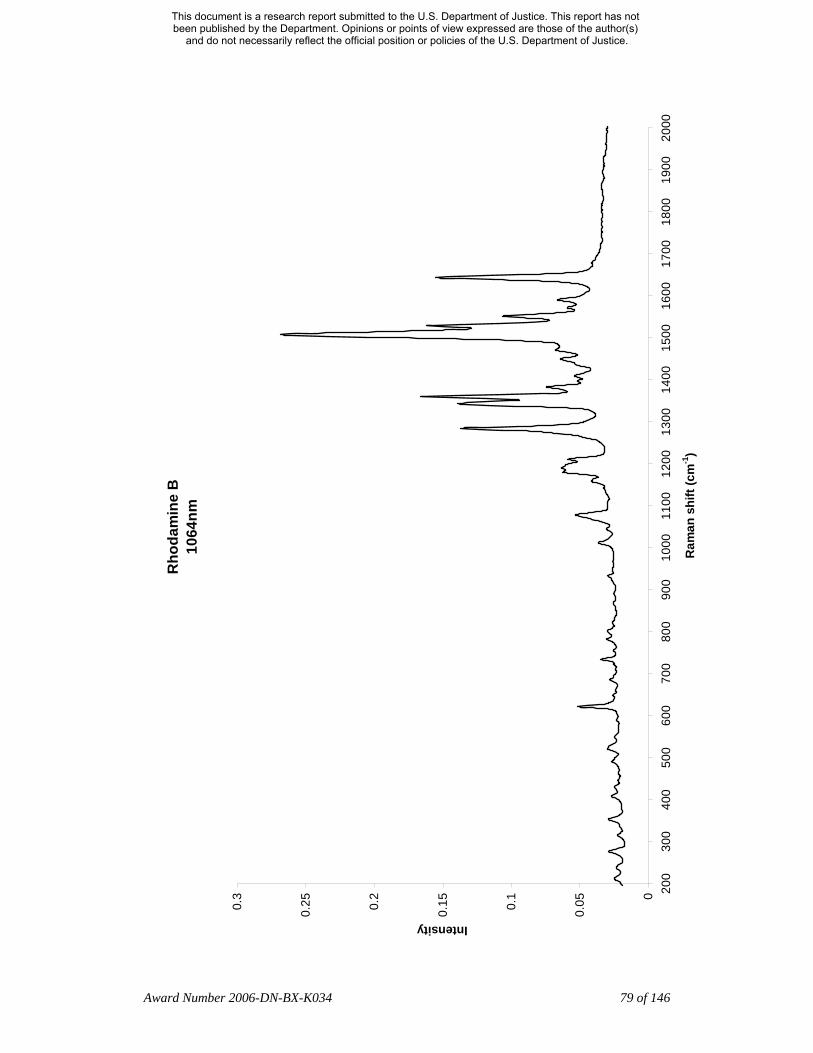
Rho
dam
ine
B
1064
nm
0
0.050.
1
0.150.
2
0.250.
3 200
300
400
500
600
700
800
900
1000
1100
1200
1300
1400
1500
1600
1700
1800
1900
2000
Ram
an s
hift
(cm
-1)
Intensity
Award Number 2006-DN-BX-K034 79 of 146
This document is a research report submitted to the U.S. Department of Justice. This report has not been published by the Department. Opinions or points of view expressed are those of the author(s)
and do not necessarily reflect the official position or policies of the U.S. Department of Justice.

Rho
dam
ine
B
SER
S 63
3nm
0
1000
0
2000
0
3000
0
4000
0
5000
0
6000
0
7000
0 200
300
400
500
600
700
800
900
1000
1100
1200
1300
1400
1500
1600
1700
1800
1900
2000
Ram
an s
hift
(cm
-1)
Intensity
Award Number 2006-DN-BX-K034 80 of 146
This document is a research report submitted to the U.S. Department of Justice. This report has not been published by the Department. Opinions or points of view expressed are those of the author(s)
and do not necessarily reflect the official position or policies of the U.S. Department of Justice.
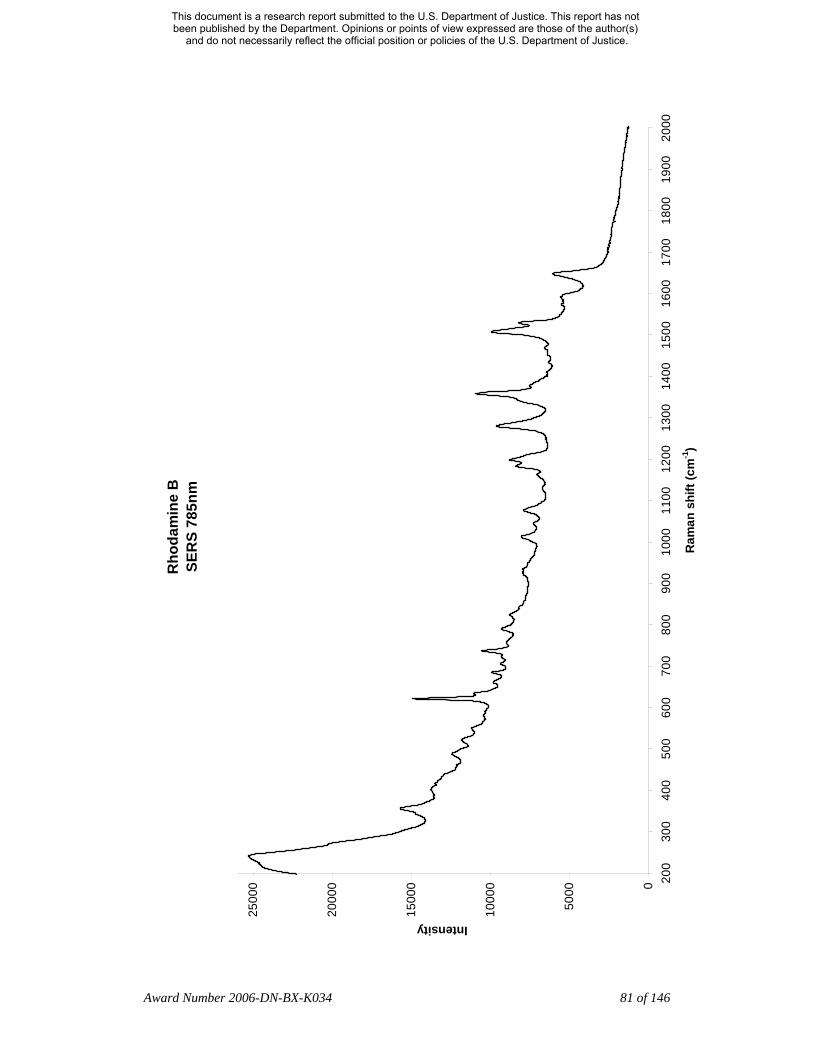
Rho
dam
ine
B
SER
S 78
5nm
0
5000
1000
0
1500
0
2000
0
2500
0 200
300
400
500
600
700
800
900
1000
1100
1200
1300
1400
1500
1600
1700
1800
1900
2000
Ram
an s
hift
(cm
-1)
Intensity
Award Number 2006-DN-BX-K034 81 of 146
This document is a research report submitted to the U.S. Department of Justice. This report has not been published by the Department. Opinions or points of view expressed are those of the author(s)
and do not necessarily reflect the official position or policies of the U.S. Department of Justice.
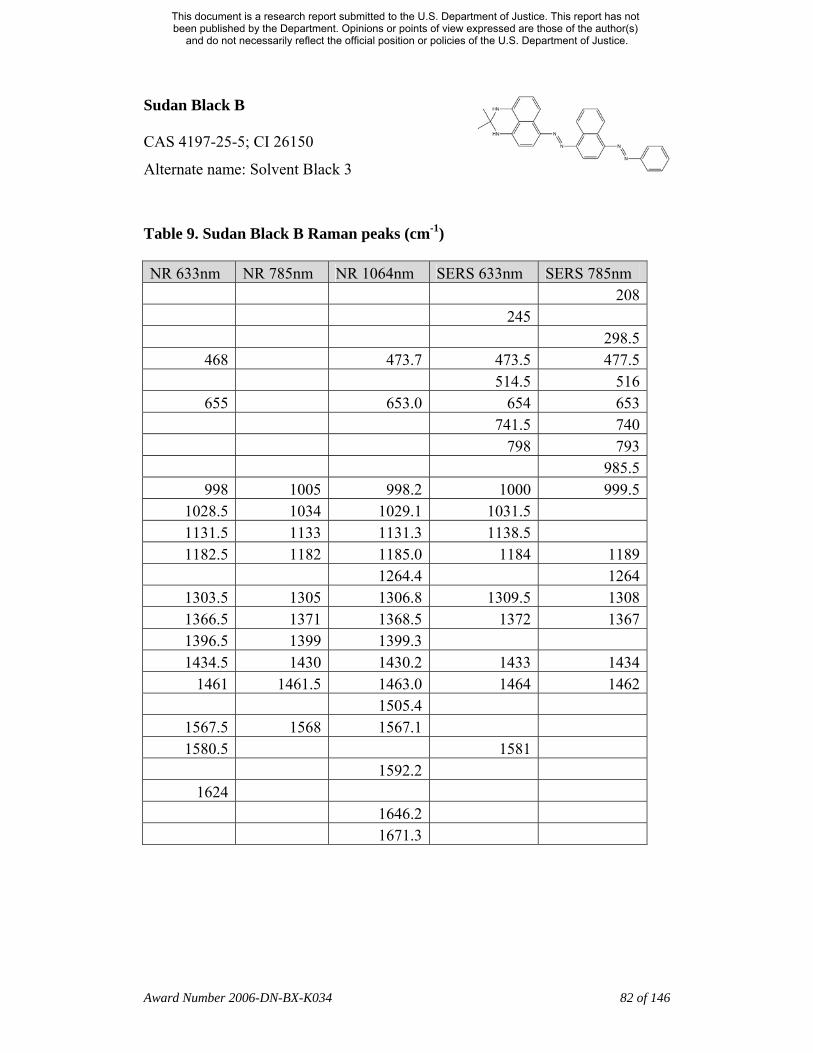
Sudan Black B
CAS 4197-25-5; CI 26150
Alternate name: Solvent Black 3
Table 9. Sudan Black B Raman peaks (cm-1)
NR 633nm NR 785nm NR 1064nm SERS 633nm SERS 785nm 208 245 298.5
468 473.7 473.5 477.5 514.5 516
655 653.0 654 653 741.5 740 798 793 985.5
998 1005 998.2 1000 999.5 1028.5 1034 1029.1 1031.5 1131.5 1133 1131.3 1138.5 1182.5 1182 1185.0 1184 1189
1264.4 1264 1303.5 1305 1306.8 1309.5 1308 1366.5 1371 1368.5 1372 1367 1396.5 1399 1399.3 1434.5 1430 1430.2 1433 1434
1461 1461.5 1463.0 1464 1462 1505.4
1567.5 1568 1567.1 1580.5 1581
1592.2 1624
1646.2 1671.3
Award Number 2006-DN-BX-K034 82 of 146
This document is a research report submitted to the U.S. Department of Justice. This report has not been published by the Department. Opinions or points of view expressed are those of the author(s)
and do not necessarily reflect the official position or policies of the U.S. Department of Justice.
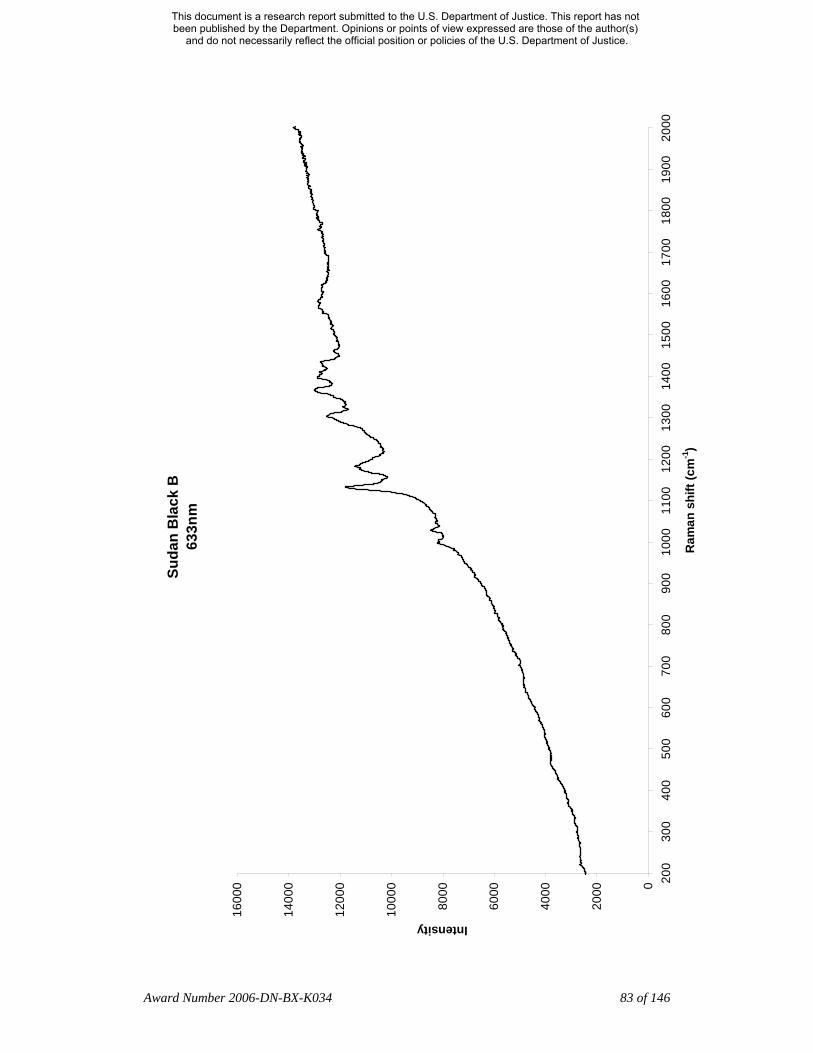
Suda
n B
lack
B
633n
m
0
2000
4000
6000
8000
1000
0
1200
0
1400
0
1600
0 200
300
400
500
600
700
800
900
1000
1100
1200
1300
1400
1500
1600
1700
1800
1900
2000
Ram
an s
hift
(cm
-1)
Intensity
Award Number 2006-DN-BX-K034 83 of 146
This document is a research report submitted to the U.S. Department of Justice. This report has not been published by the Department. Opinions or points of view expressed are those of the author(s)
and do not necessarily reflect the official position or policies of the U.S. Department of Justice.

Suda
n B
lack
B
785n
m
1000
1200
1400
1600
1800
2000
2200
2400
2600
200
300
400
500
600
700
800
900
1000
1100
1200
1300
1400
1500
1600
1700
1800
1900
2000
Ram
an s
hift
(cm
-1)
Intensity
Award Number 2006-DN-BX-K034 84 of 146
This document is a research report submitted to the U.S. Department of Justice. This report has not been published by the Department. Opinions or points of view expressed are those of the author(s)
and do not necessarily reflect the official position or policies of the U.S. Department of Justice.
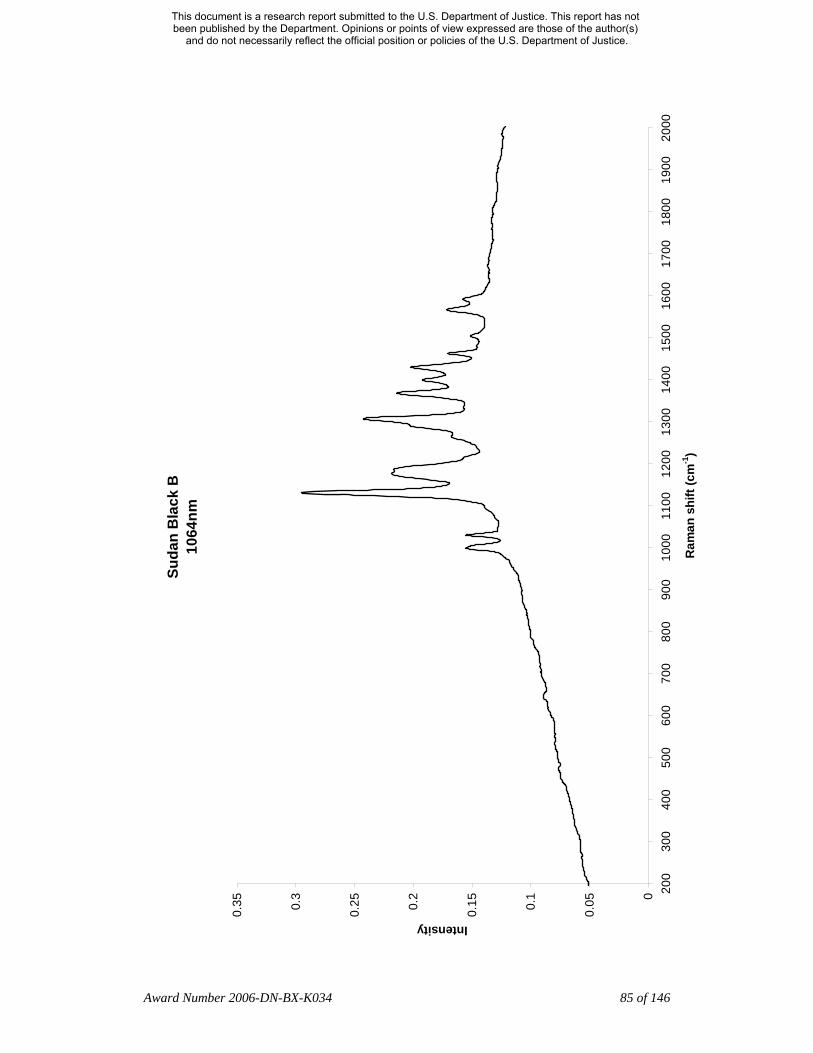
Suda
n B
lack
B
1064
nm
0
0.050.
1
0.150.
2
0.250.
3
0.35
200
300
400
500
600
700
800
900
1000
1100
1200
1300
1400
1500
1600
1700
1800
1900
2000
Ram
an s
hift
(cm
-1)
Intensity
Award Number 2006-DN-BX-K034 85 of 146
This document is a research report submitted to the U.S. Department of Justice. This report has not been published by the Department. Opinions or points of view expressed are those of the author(s)
and do not necessarily reflect the official position or policies of the U.S. Department of Justice.
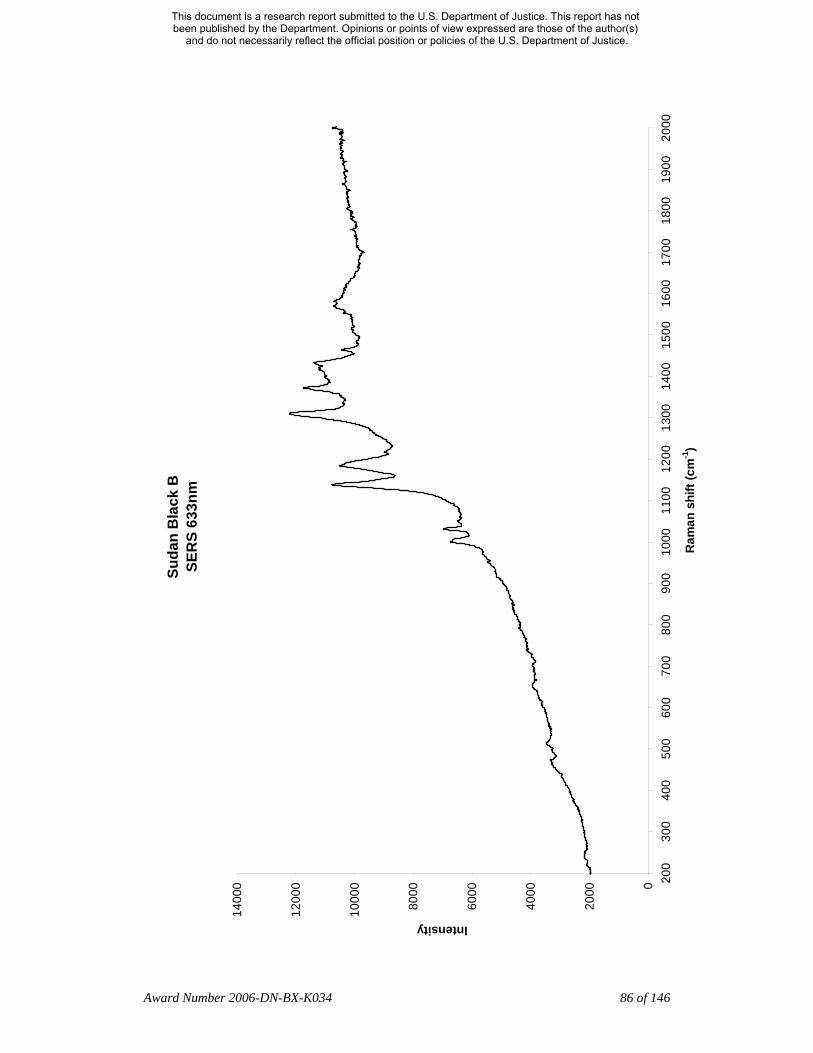
Suda
n B
lack
B
SER
S 63
3nm
0
2000
4000
6000
8000
1000
0
1200
0
1400
0 200
300
400
500
600
700
800
900
1000
1100
1200
1300
1400
1500
1600
1700
1800
1900
2000
Ram
an s
hift
(cm
-1)
Intensity
Award Number 2006-DN-BX-K034 86 of 146
This document is a research report submitted to the U.S. Department of Justice. This report has not been published by the Department. Opinions or points of view expressed are those of the author(s)
and do not necessarily reflect the official position or policies of the U.S. Department of Justice.
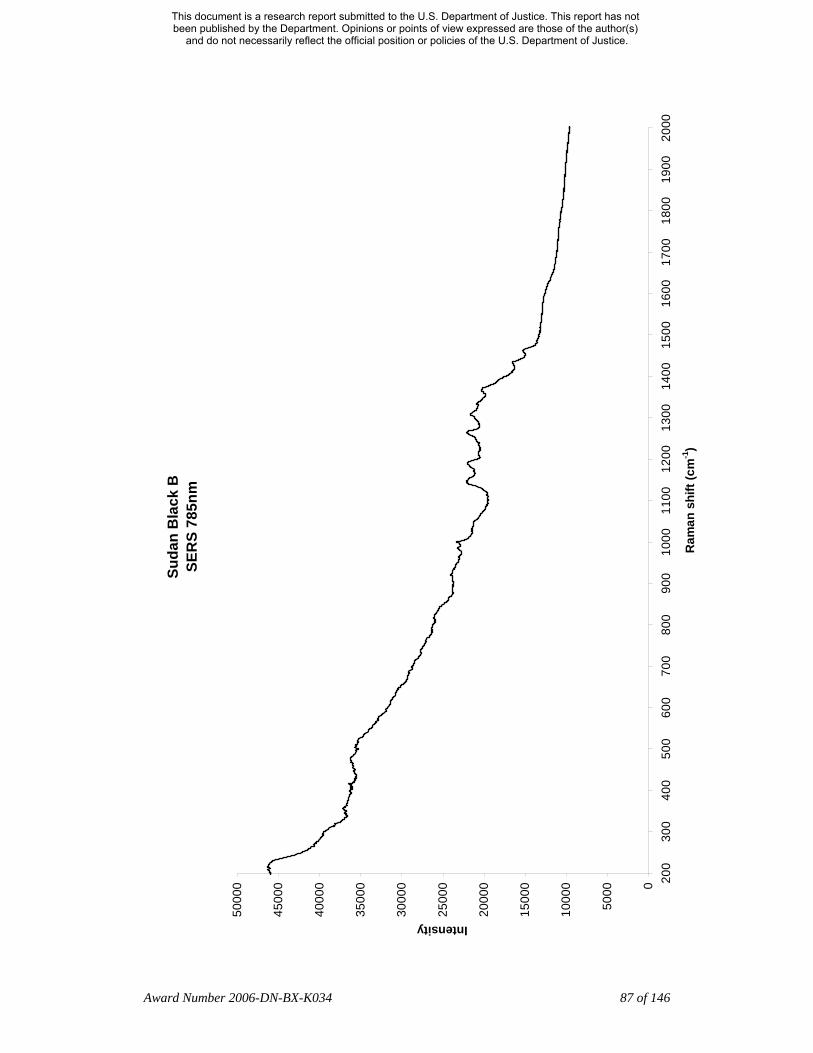
Suda
n B
lack
B
SER
S 78
5nm
0
5000
1000
0
1500
0
2000
0
2500
0
3000
0
3500
0
4000
0
4500
0
5000
0 200
300
400
500
600
700
800
900
1000
1100
1200
1300
1400
1500
1600
1700
1800
1900
2000
Ram
an s
hift
(cm
-1)
Intensity
Award Number 2006-DN-BX-K034 87 of 146
This document is a research report submitted to the U.S. Department of Justice. This report has not been published by the Department. Opinions or points of view expressed are those of the author(s)
and do not necessarily reflect the official position or policies of the U.S. Department of Justice.

Victoria Blue
CAS 2580-56-5; CI 44045
Alternate name: Victoria Blue B
Table 10. Victoria Blue Raman peaks (cm-1)
NR 633nm NR 785nm NR 1064nm SERS 633nm SERS 785nm 205.0 213 206
342 338.7 343 336.5 407 415.0 415
433.5 435 433.2 433.5 435 474 473.7 473 475 524 516.1 521.5 517 545 549 541.2
620.2 619 616.5 648 641.4 648.5
682.5 681.9 682.5 682 737 730.1 733 730.5
755.2 760.5 757.5 786 782.2 781 807 811.5 806 796.5
829 880.5 878.5 880.6 880.5 880 915.5 915.3 914 913.5
938.4 941 935.5 980.5 976.5
996 1000.1 992 1005 1012.5
1032.5 1027.1 1032.5 1034 1071 1067.5 1065.7 1067 1065.5
1173.5 1166.5 1167.9 1172 1175.5 1193
1202 1202 1210 1218.1 1214.5 1228.5
1270 1265.5 1301 1289.4 1293 1290.5
1328.0 1338
Award Number 2006-DN-BX-K034 88 of 146
This document is a research report submitted to the U.S. Department of Justice. This report has not been published by the Department. Opinions or points of view expressed are those of the author(s)
and do not necessarily reflect the official position or policies of the U.S. Department of Justice.

NR 633nm NR 785nm NR 1064nm SERS 633nm SERS 785nm 1364 1359 1353.1
1372 1370 1390 1389.7 1396.5 1390
1453 1455.3 1459.5 1468 1505.4
1564 1559.4 1565 1614.5 1613.4 1617.5 1613.5
Award Number 2006-DN-BX-K034 89 of 146
This document is a research report submitted to the U.S. Department of Justice. This report has not been published by the Department. Opinions or points of view expressed are those of the author(s)
and do not necessarily reflect the official position or policies of the U.S. Department of Justice.
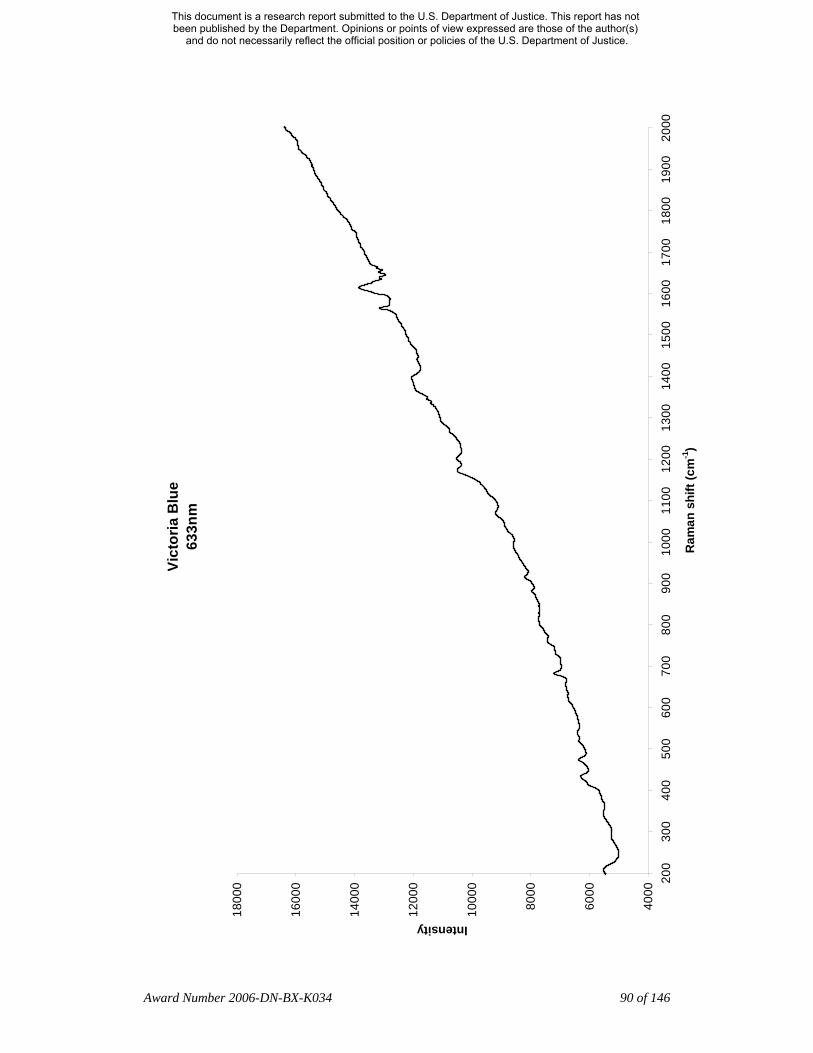
Vict
oria
Blu
e 63
3nm
4000
6000
8000
1000
0
1200
0
1400
0
1600
0
1800
0 200
300
400
500
600
700
800
900
1000
1100
1200
1300
1400
1500
1600
1700
1800
1900
2000
Ram
an s
hift
(cm
-1)
Intensity
Award Number 2006-DN-BX-K034 90 of 146
This document is a research report submitted to the U.S. Department of Justice. This report has not been published by the Department. Opinions or points of view expressed are those of the author(s)
and do not necessarily reflect the official position or policies of the U.S. Department of Justice.
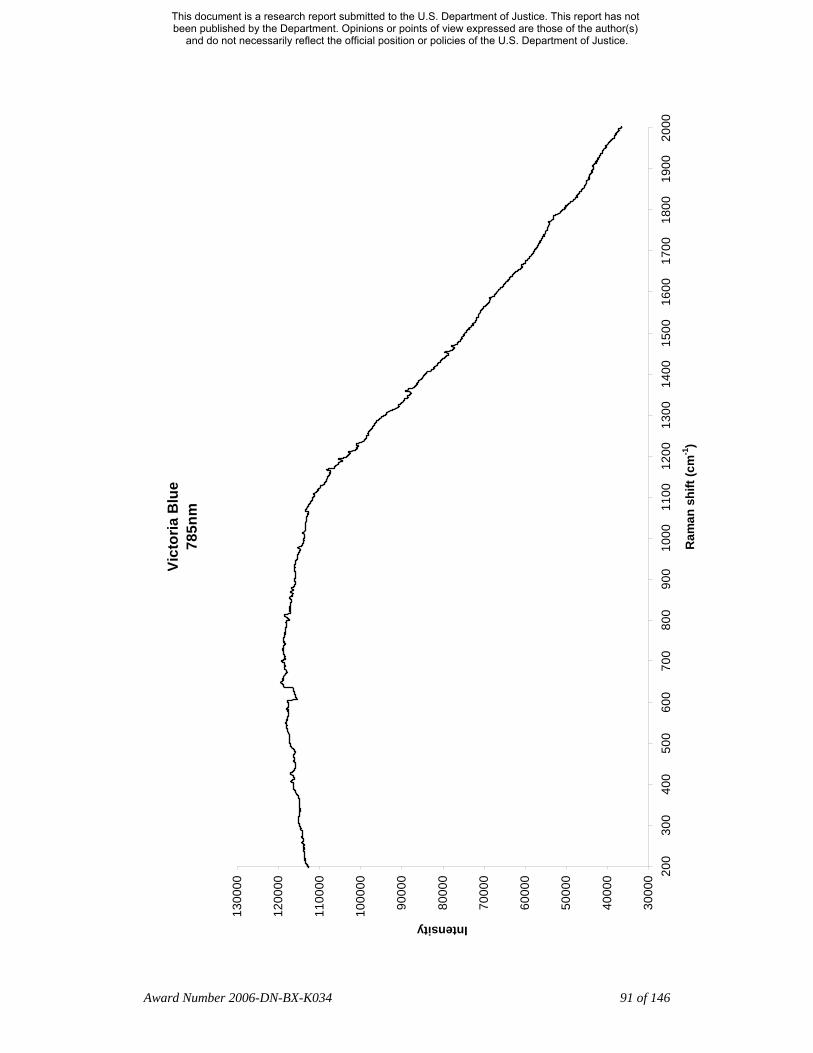
Vict
oria
Blu
e 78
5nm
3000
0
4000
0
5000
0
6000
0
7000
0
8000
0
9000
0
1000
00
1100
00
1200
00
1300
00
200
300
400
500
600
700
800
900
1000
1100
1200
1300
1400
1500
1600
1700
1800
1900
2000
Ram
an s
hift
(cm
-1)
Intensity
Award Number 2006-DN-BX-K034 91 of 146
This document is a research report submitted to the U.S. Department of Justice. This report has not been published by the Department. Opinions or points of view expressed are those of the author(s)
and do not necessarily reflect the official position or policies of the U.S. Department of Justice.

Vict
oria
Blu
e 10
64nm
0
0.050.
1
0.150.
2
0.250.
3
0.350.
4 200
300
400
500
600
700
800
900
1000
1100
1200
1300
1400
1500
1600
1700
1800
1900
2000
Ram
an s
hift
(cm
-1)
Intensity
Award Number 2006-DN-BX-K034 92 of 146
This document is a research report submitted to the U.S. Department of Justice. This report has not been published by the Department. Opinions or points of view expressed are those of the author(s)
and do not necessarily reflect the official position or policies of the U.S. Department of Justice.
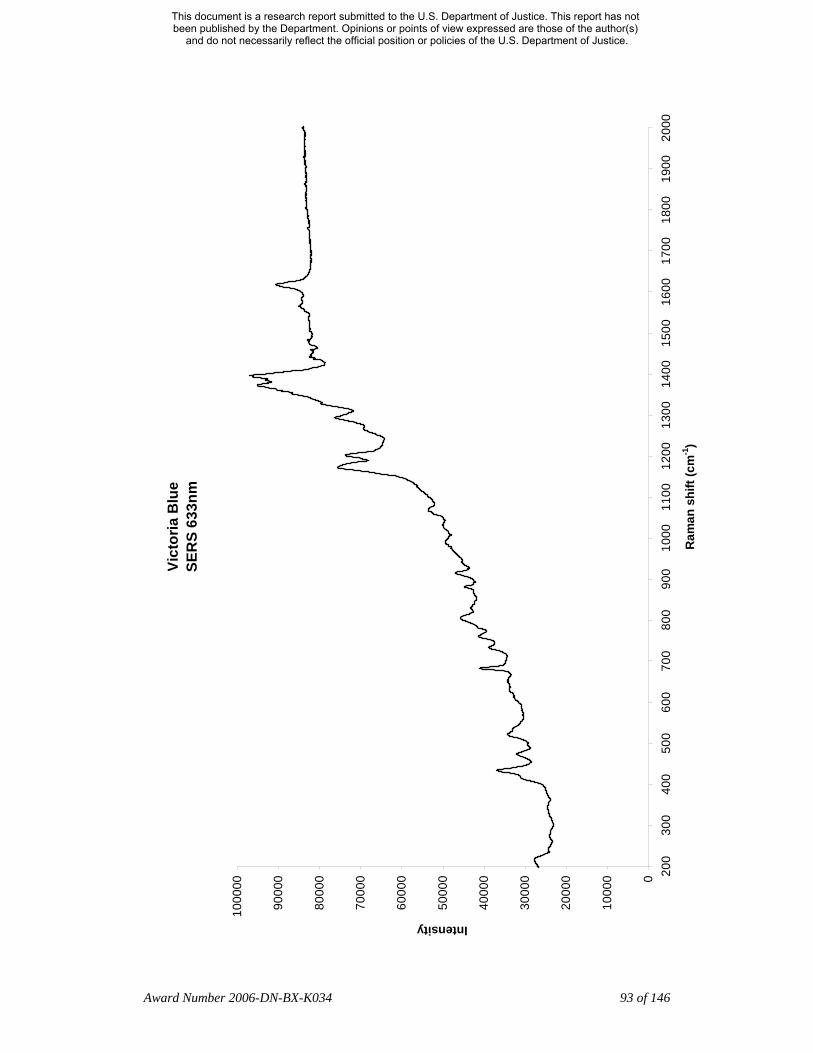
Vict
oria
Blu
e SE
RS
633n
m
0
1000
0
2000
0
3000
0
4000
0
5000
0
6000
0
7000
0
8000
0
9000
0
1000
00
200
300
400
500
600
700
800
900
1000
1100
1200
1300
1400
1500
1600
1700
1800
1900
2000
Ram
an s
hift
(cm
-1)
Intensity
Award Number 2006-DN-BX-K034 93 of 146
This document is a research report submitted to the U.S. Department of Justice. This report has not been published by the Department. Opinions or points of view expressed are those of the author(s)
and do not necessarily reflect the official position or policies of the U.S. Department of Justice.

Vict
oria
Blu
e SE
RS
785n
m
0
1000
0
2000
0
3000
0
4000
0
5000
0
6000
0 200
300
400
500
600
700
800
900
1000
1100
1200
1300
1400
1500
1600
1700
1800
1900
2000
Ram
an s
hift
(cm
-1)
Intensity
Award Number 2006-DN-BX-K034 94 of 146
This document is a research report submitted to the U.S. Department of Justice. This report has not been published by the Department. Opinions or points of view expressed are those of the author(s)
and do not necessarily reflect the official position or policies of the U.S. Department of Justice.

Ag colloid/KNO3 mixture
Table 11. Ag colloid/KNO3 Raman peaks (cm-1)
633nm 785nm 231.5 235 586.5
622 617.5 672 665 808 801 936 930 956 954
1039.5 1031.5 1048.5
1130 1127 1172 1170 1346
1369.5 1372.5 1437 1442.5
Award Number 2006-DN-BX-K034 95 of 146
This document is a research report submitted to the U.S. Department of Justice. This report has not been published by the Department. Opinions or points of view expressed are those of the author(s)
and do not necessarily reflect the official position or policies of the U.S. Department of Justice.
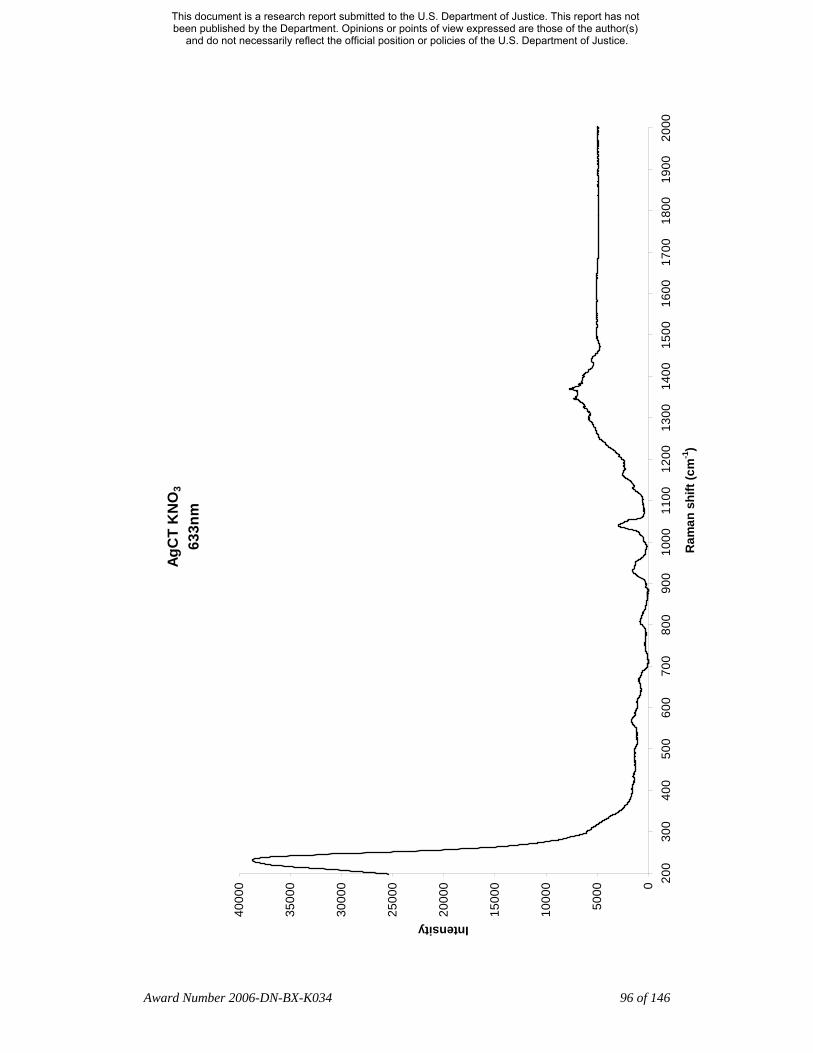
AgC
T K
NO
3
633n
m
0
5000
1000
0
1500
0
2000
0
2500
0
3000
0
3500
0
4000
0 200
300
400
500
600
700
800
900
1000
1100
1200
1300
1400
1500
1600
1700
1800
1900
2000
Ram
an s
hift
(cm
-1)
Intensity
Award Number 2006-DN-BX-K034 96 of 146
This document is a research report submitted to the U.S. Department of Justice. This report has not been published by the Department. Opinions or points of view expressed are those of the author(s)
and do not necessarily reflect the official position or policies of the U.S. Department of Justice.
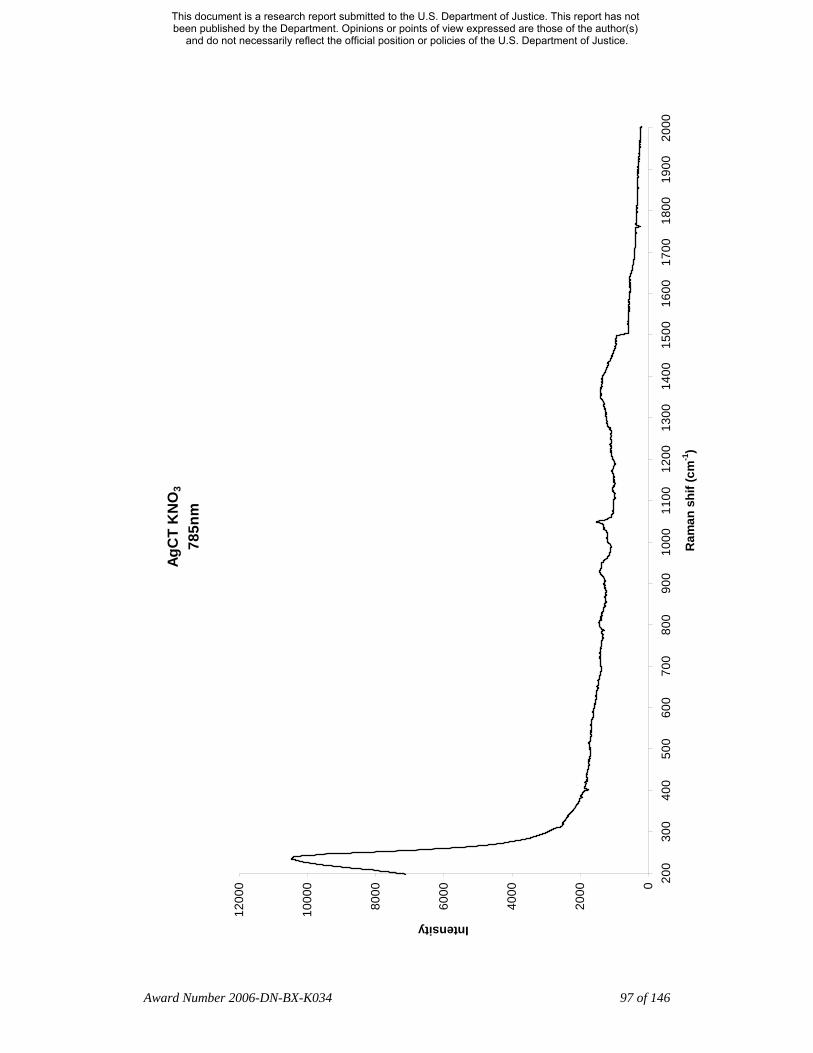
AgC
T K
NO
3
785n
m
0
2000
4000
6000
8000
1000
0
1200
0 200
300
400
500
600
700
800
900
1000
1100
1200
1300
1400
1500
1600
1700
1800
1900
2000
Ram
an s
hif (
cm-1
)
Intensity
Award Number 2006-DN-BX-K034 97 of 146
This document is a research report submitted to the U.S. Department of Justice. This report has not been published by the Department. Opinions or points of view expressed are those of the author(s)
and do not necessarily reflect the official position or policies of the U.S. Department of Justice.
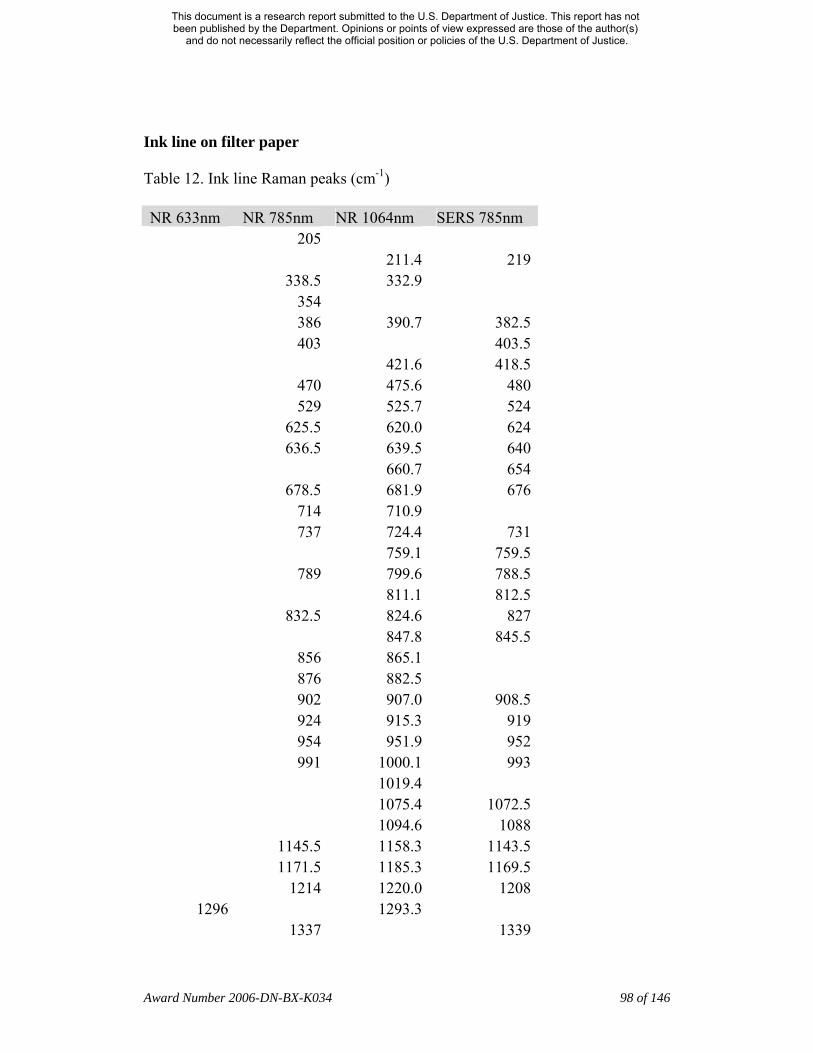
Ink line on filter paper
Table 12. Ink line Raman peaks (cm-1)
NR 633nm NR 785nm NR 1064nm SERS 785nm 205 211.4 219 338.5 332.9 354 386 390.7 382.5 403 403.5 421.6 418.5 470 475.6 480 529 525.7 524 625.5 620.0 624 636.5 639.5 640 660.7 654 678.5 681.9 676 714 710.9 737 724.4 731 759.1 759.5 789 799.6 788.5 811.1 812.5 832.5 824.6 827 847.8 845.5 856 865.1 876 882.5 902 907.0 908.5 924 915.3 919 954 951.9 952 991 1000.1 993 1019.4 1075.4 1072.5 1094.6 1088 1145.5 1158.3 1143.5 1171.5 1185.3 1169.5 1214 1220.0 1208
1296 1293.3 1337 1339
Award Number 2006-DN-BX-K034 98 of 146
This document is a research report submitted to the U.S. Department of Justice. This report has not been published by the Department. Opinions or points of view expressed are those of the author(s)
and do not necessarily reflect the official position or policies of the U.S. Department of Justice.

NR 633nm NR 785nm NR 1064nm SERS 785nm 1360.8 1380.1 1385 1410.9 1431.5 1429.5 1445 1445 1453.3 1462.5 1474.6 1475 1503.5
1531.5 1536.3 1563
1580.5 1582.6 1596 1612 1615.3 1624
Award Number 2006-DN-BX-K034 99 of 146
This document is a research report submitted to the U.S. Department of Justice. This report has not been published by the Department. Opinions or points of view expressed are those of the author(s)
and do not necessarily reflect the official position or policies of the U.S. Department of Justice.
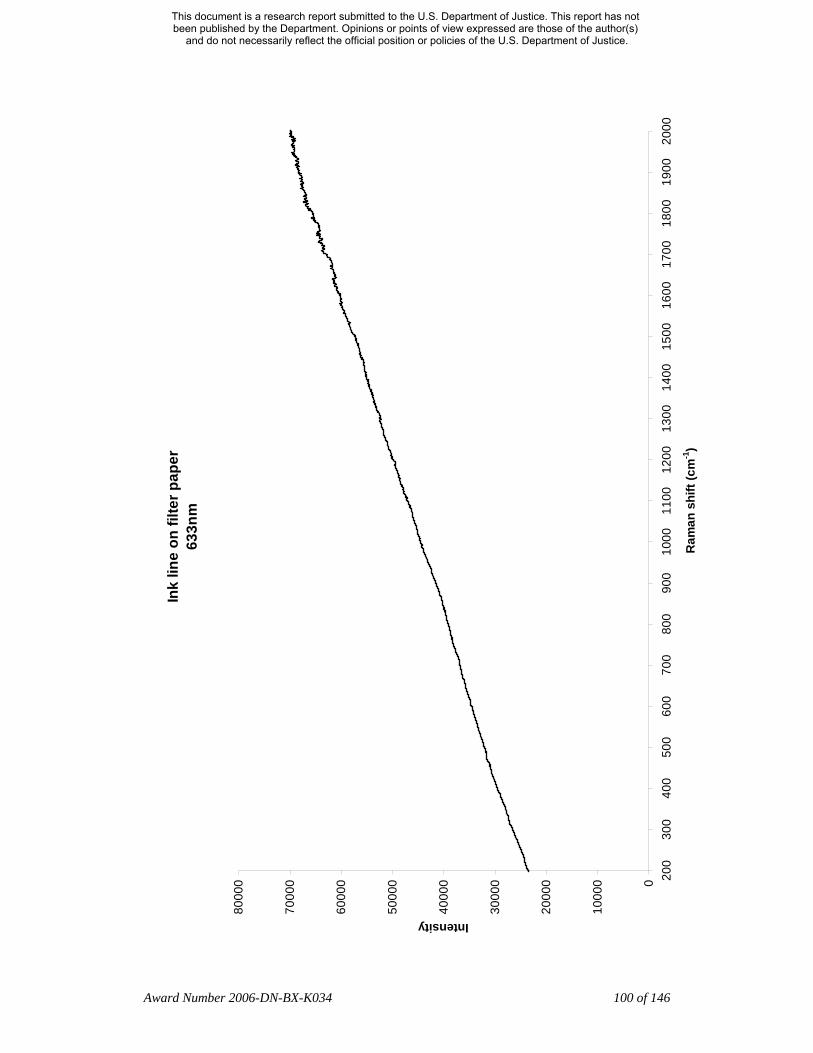
Ink
line
on fi
lter p
aper
63
3nm
0
1000
0
2000
0
3000
0
4000
0
5000
0
6000
0
7000
0
8000
0 200
300
400
500
600
700
800
900
1000
1100
1200
1300
1400
1500
1600
1700
1800
1900
2000
Ram
an s
hift
(cm
-1)
Intensity
Award Number 2006-DN-BX-K034 100 of 146
This document is a research report submitted to the U.S. Department of Justice. This report has not been published by the Department. Opinions or points of view expressed are those of the author(s)
and do not necessarily reflect the official position or policies of the U.S. Department of Justice.
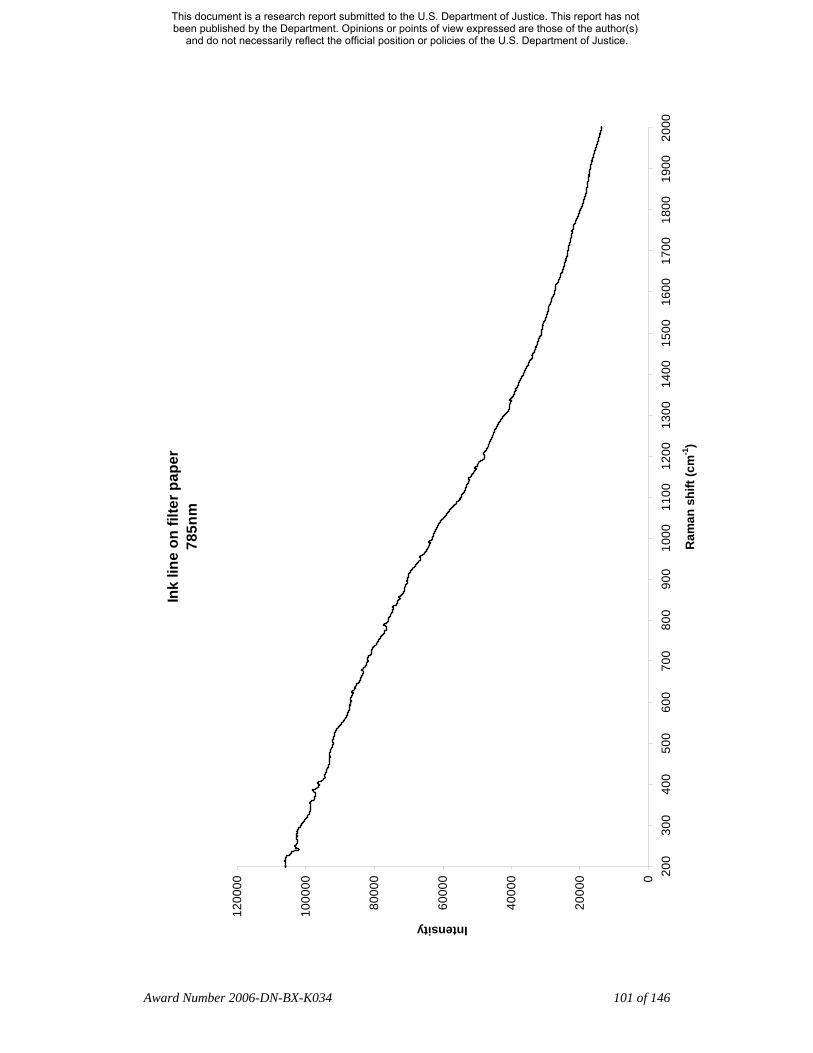
Ink
line
on fi
lter p
aper
78
5nm
0
2000
0
4000
0
6000
0
8000
0
1000
00
1200
00
200
300
400
500
600
700
800
900
1000
1100
1200
1300
1400
1500
1600
1700
1800
1900
2000
Ram
an s
hift
(cm
-1)
Intensity
Award Number 2006-DN-BX-K034 101 of 146
This document is a research report submitted to the U.S. Department of Justice. This report has not been published by the Department. Opinions or points of view expressed are those of the author(s)
and do not necessarily reflect the official position or policies of the U.S. Department of Justice.

Ink
line
on fi
lter p
aper
10
64nm
0
0.00
5
0.01
0.01
5
0.02
0.02
5
0.03
0.03
5 200
300
400
500
600
700
800
900
1000
1100
1200
1300
1400
1500
1600
1700
1800
1900
2000
Ram
an s
hit (
cm-1
)
Intensity
Award Number 2006-DN-BX-K034 102 of 146
This document is a research report submitted to the U.S. Department of Justice. This report has not been published by the Department. Opinions or points of view expressed are those of the author(s)
and do not necessarily reflect the official position or policies of the U.S. Department of Justice.

Ink
line
on fi
lter p
aper
SE
RS
785
nm
0
2000
4000
6000
8000
1000
0
1200
0 200
300
400
500
600
700
800
900
1000
1100
1200
1300
1400
1500
1600
1700
1800
1900
2000
Ram
an s
hift
(cm
-1)
Intensity
Award Number 2006-DN-BX-K034 103 of 146
This document is a research report submitted to the U.S. Department of Justice. This report has not been published by the Department. Opinions or points of view expressed are those of the author(s)
and do not necessarily reflect the official position or policies of the U.S. Department of Justice.

Filter paper
Table 13. Filter paper Raman peaks (cm-1)
NR 633nm NR 785nm NR 1064nm SERS 785nm 380.5 379 439 437 460 521 1097.5 1096.5 1122.5 1121.6 1157.5 1152.5 1343.5 1324.1 1381 1380 1478
Award Number 2006-DN-BX-K034 104 of 146
This document is a research report submitted to the U.S. Department of Justice. This report has not been published by the Department. Opinions or points of view expressed are those of the author(s)
and do not necessarily reflect the official position or policies of the U.S. Department of Justice.
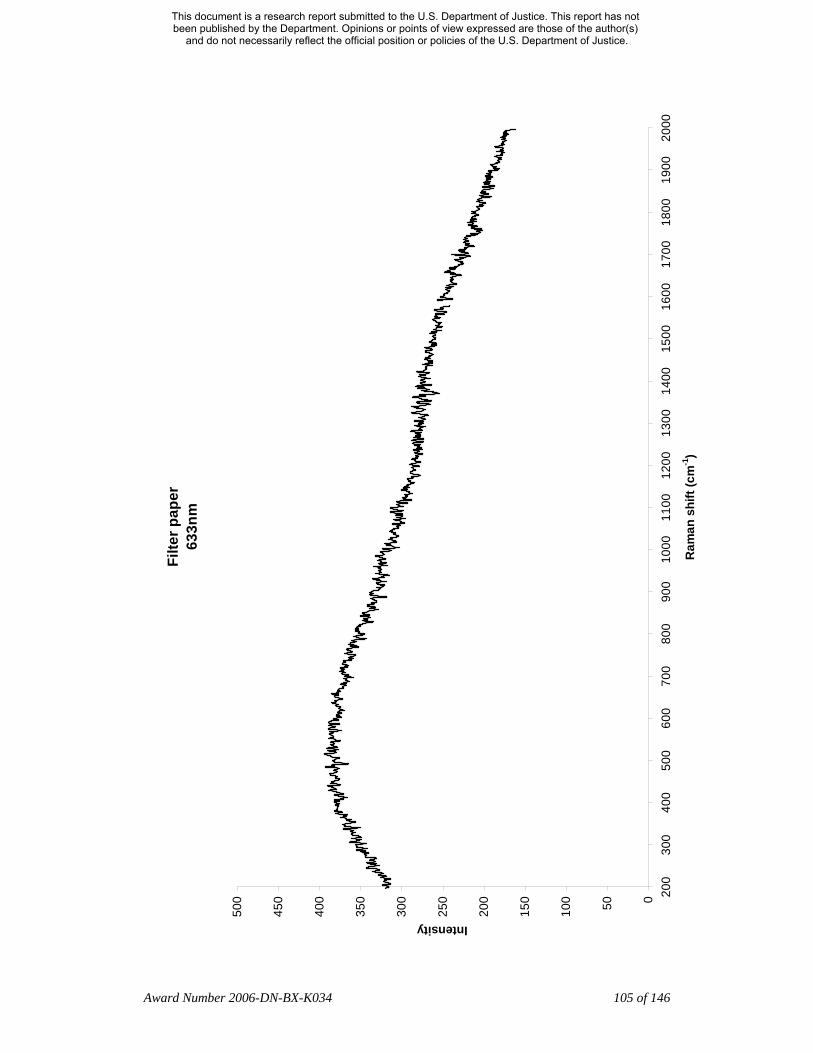
Filte
r pap
er
633n
m
050100
150
200
250
300
350
400
450
500 20
030
040
050
060
070
080
090
010
0011
0012
0013
0014
0015
0016
0017
0018
0019
0020
00
Ram
an s
hift
(cm
-1)
Intensity
Award Number 2006-DN-BX-K034 105 of 146
This document is a research report submitted to the U.S. Department of Justice. This report has not been published by the Department. Opinions or points of view expressed are those of the author(s)
and do not necessarily reflect the official position or policies of the U.S. Department of Justice.
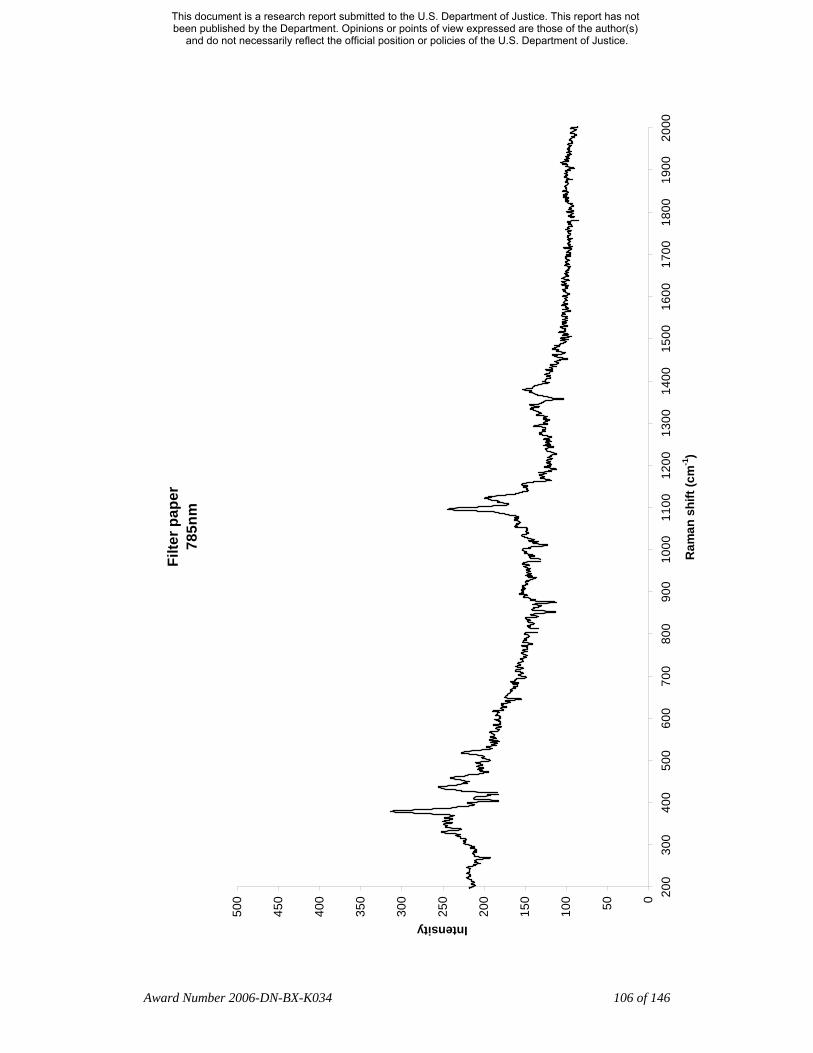
Filte
r pap
er
785n
m
050100
150
200
250
300
350
400
450
500 20
030
040
050
060
070
080
090
010
0011
0012
0013
0014
0015
0016
0017
0018
0019
0020
00
Ram
an s
hift
(cm
-1)
Intensity
Award Number 2006-DN-BX-K034 106 of 146
This document is a research report submitted to the U.S. Department of Justice. This report has not been published by the Department. Opinions or points of view expressed are those of the author(s)
and do not necessarily reflect the official position or policies of the U.S. Department of Justice.

Filte
r pap
er
1064
nm
0
0.00
05
0.00
1
0.00
15
0.00
2
0.00
25
0.00
3
0.00
35
0.00
4
0.00
45
0.00
5 200
300
400
500
600
700
800
900
1000
1100
1200
1300
1400
1500
1600
1700
1800
1900
2000
Ram
an s
hift
(cm
-1)
Intensity
Award Number 2006-DN-BX-K034 107 of 146
This document is a research report submitted to the U.S. Department of Justice. This report has not been published by the Department. Opinions or points of view expressed are those of the author(s)
and do not necessarily reflect the official position or policies of the U.S. Department of Justice.

Filte
r pap
er
SER
S 78
5nm
050100
150
200
250
300
350
400
450
500 20
030
040
050
060
070
080
090
010
0011
0012
0013
0014
0015
0016
0017
0018
0019
0020
00
Ram
an s
hfit
(cm
-1)
Intensity
Award Number 2006-DN-BX-K034 108 of 146
This document is a research report submitted to the U.S. Department of Justice. This report has not been published by the Department. Opinions or points of view expressed are those of the author(s)
and do not necessarily reflect the official position or policies of the U.S. Department of Justice.
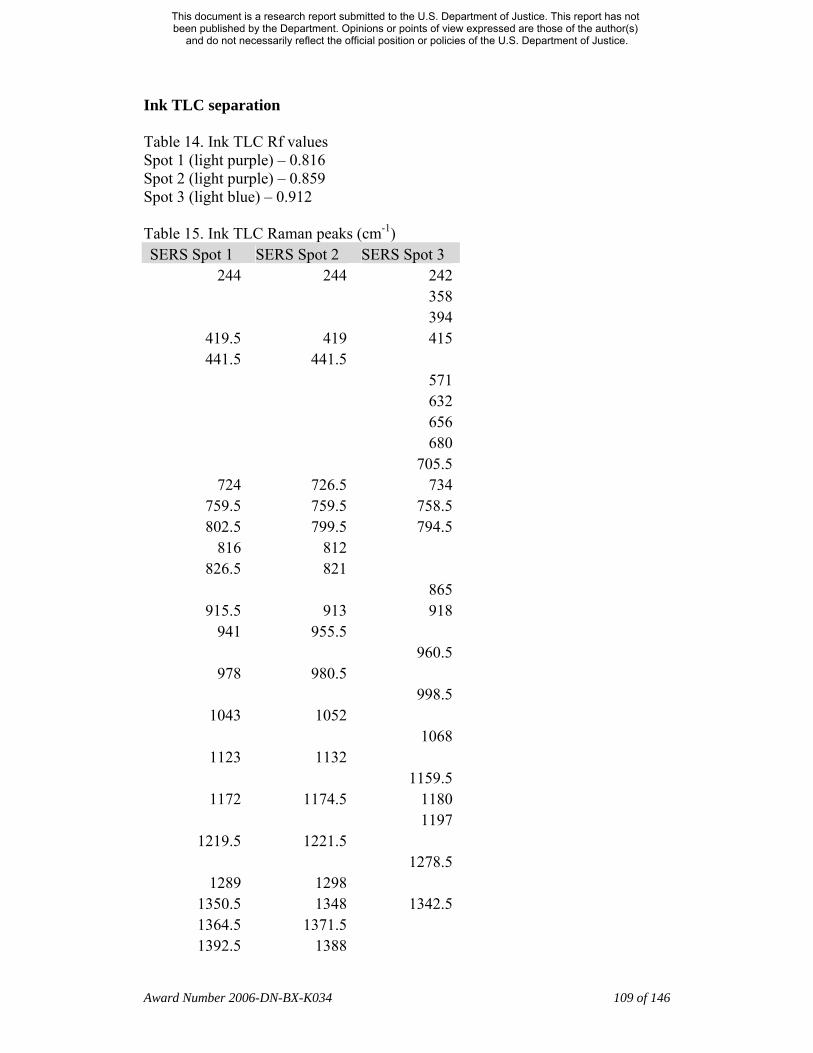
Ink TLC separation
Table 14. Ink TLC Rf values Spot 1 (light purple) – 0.816 Spot 2 (light purple) – 0.859 Spot 3 (light blue) – 0.912 Table 15. Ink TLC Raman peaks (cm-1) SERS Spot 1 SERS Spot 2 SERS Spot 3
244 244 242 358 394
419.5 419 415441.5 441.5
571 632 656 680 705.5
724 726.5 734759.5 759.5 758.5802.5 799.5 794.5
816 812 826.5 821
865915.5 913 918
941 955.5 960.5
978 980.5 998.5
1043 1052 1068
1123 1132 1159.5
1172 1174.5 1180 1197
1219.5 1221.5 1278.5
1289 1298 1350.5 1348 1342.51364.5 1371.5 1392.5 1388
Award Number 2006-DN-BX-K034 109 of 146
This document is a research report submitted to the U.S. Department of Justice. This report has not been published by the Department. Opinions or points of view expressed are those of the author(s)
and do not necessarily reflect the official position or policies of the U.S. Department of Justice.
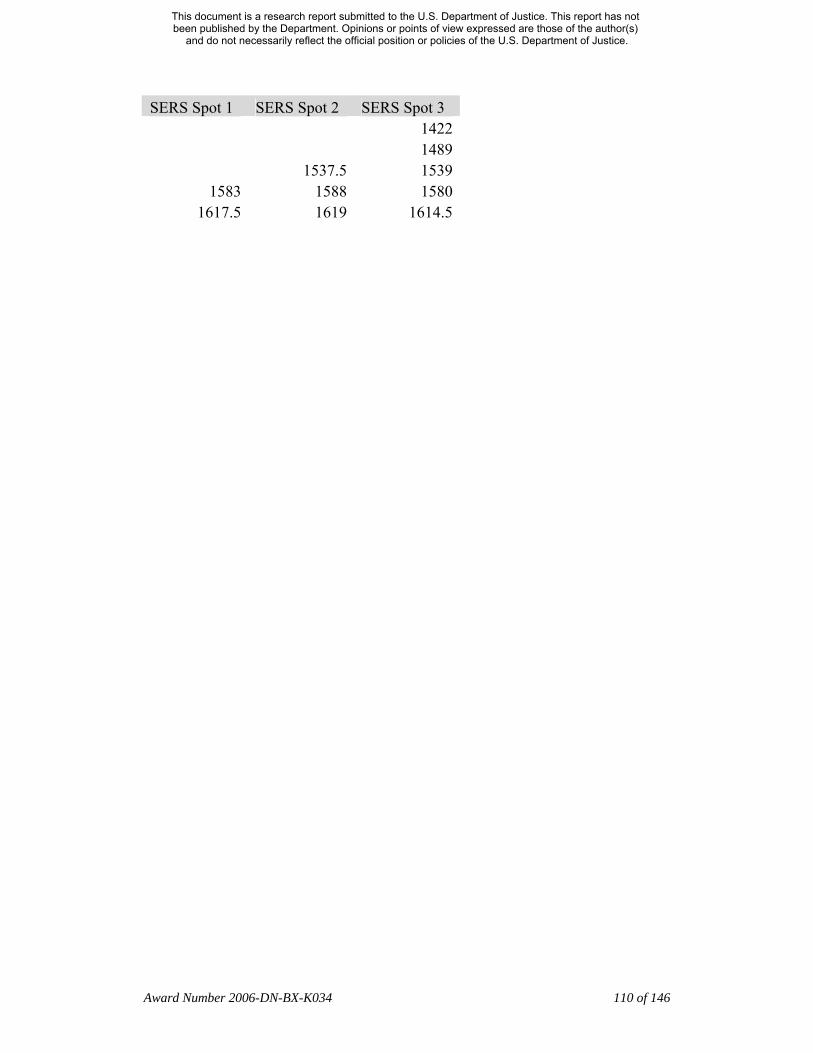
SERS Spot 1 SERS Spot 2 SERS Spot 3 1422 1489 1537.5 1539
1583 1588 15801617.5 1619 1614.5
Award Number 2006-DN-BX-K034 110 of 146
This document is a research report submitted to the U.S. Department of Justice. This report has not been published by the Department. Opinions or points of view expressed are those of the author(s)
and do not necessarily reflect the official position or policies of the U.S. Department of Justice.
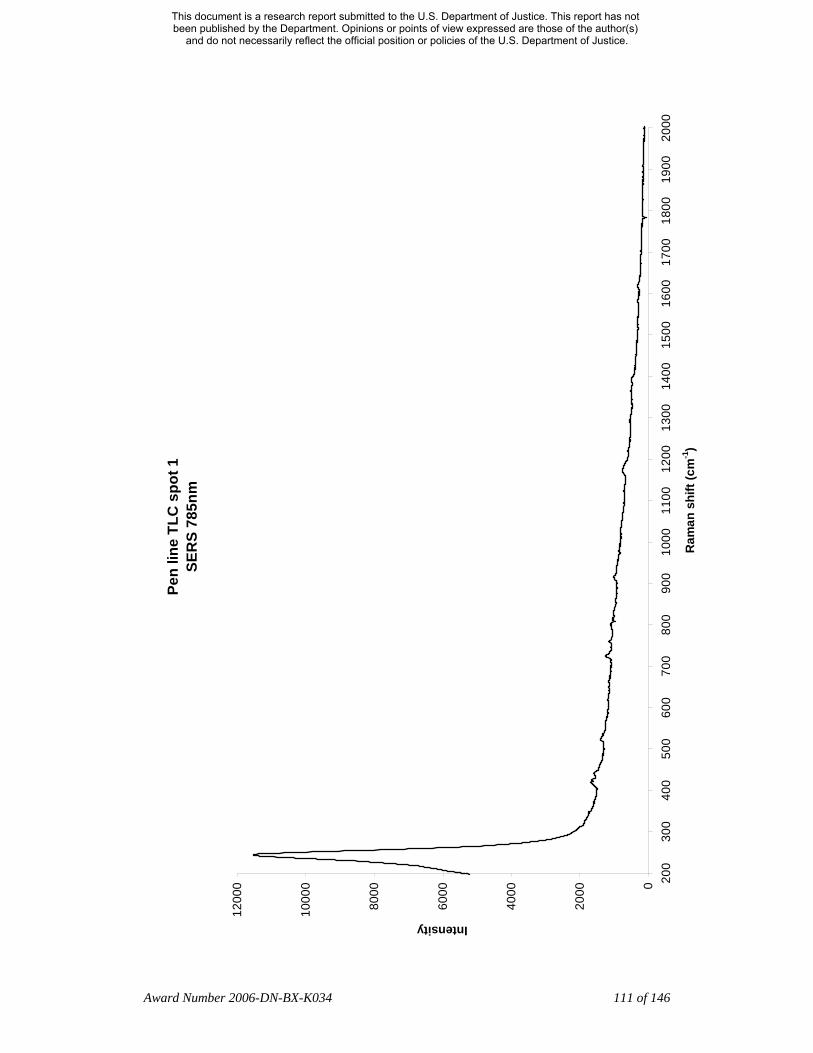
Pen
line
TLC
spo
t 1
SER
S 78
5nm
0
2000
4000
6000
8000
1000
0
1200
0 200
300
400
500
600
700
800
900
1000
1100
1200
1300
1400
1500
1600
1700
1800
1900
2000
Ram
an s
hift
(cm
-1)
Intensity
Award Number 2006-DN-BX-K034 111 of 146
This document is a research report submitted to the U.S. Department of Justice. This report has not been published by the Department. Opinions or points of view expressed are those of the author(s)
and do not necessarily reflect the official position or policies of the U.S. Department of Justice.
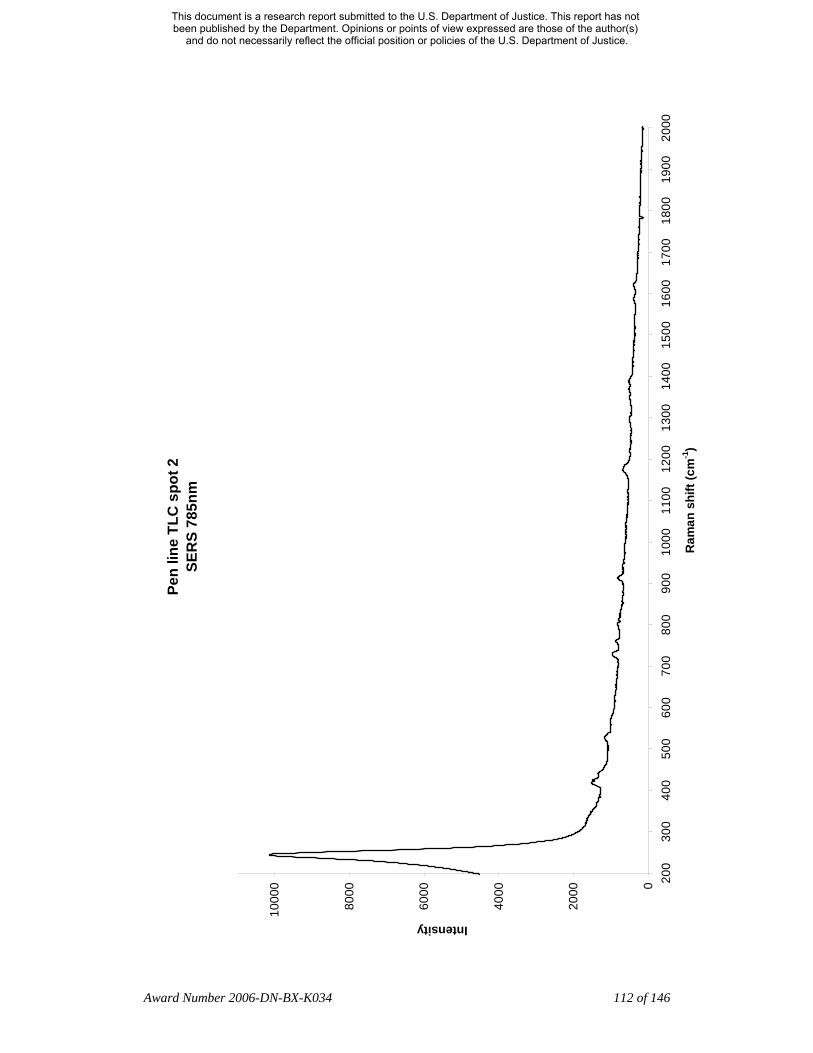
Pen
line
TLC
spo
t 2
SER
S 78
5nm
0
2000
4000
6000
8000
1000
0 200
300
400
500
600
700
800
900
1000
1100
1200
1300
1400
1500
1600
1700
1800
1900
2000
Ram
an s
hift
(cm
-1)
Intensity
Award Number 2006-DN-BX-K034 112 of 146
This document is a research report submitted to the U.S. Department of Justice. This report has not been published by the Department. Opinions or points of view expressed are those of the author(s)
and do not necessarily reflect the official position or policies of the U.S. Department of Justice.
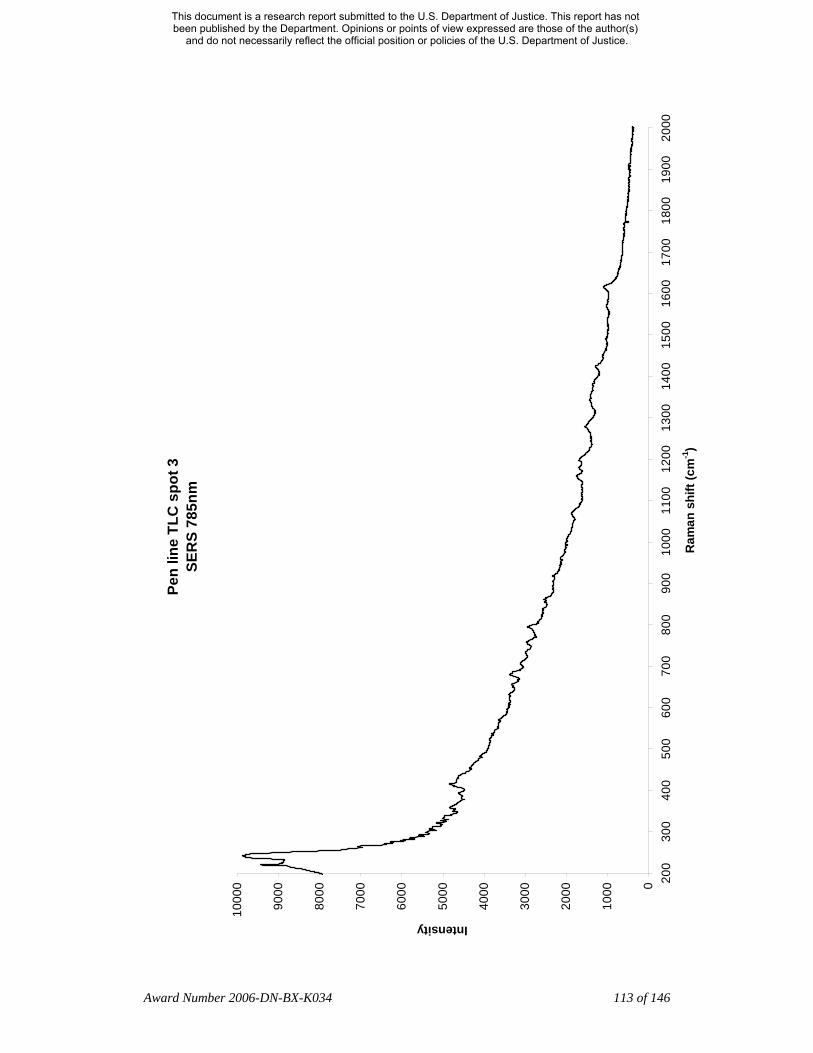
Pen
line
TLC
spo
t 3
SER
S 78
5nm
0
1000
2000
3000
4000
5000
6000
7000
8000
9000
1000
0 200
300
400
500
600
700
800
900
1000
1100
1200
1300
1400
1500
1600
1700
1800
1900
2000
Ram
an s
hift
(cm
-1)
Intensity
Award Number 2006-DN-BX-K034 113 of 146
This document is a research report submitted to the U.S. Department of Justice. This report has not been published by the Department. Opinions or points of view expressed are those of the author(s)
and do not necessarily reflect the official position or policies of the U.S. Department of Justice.
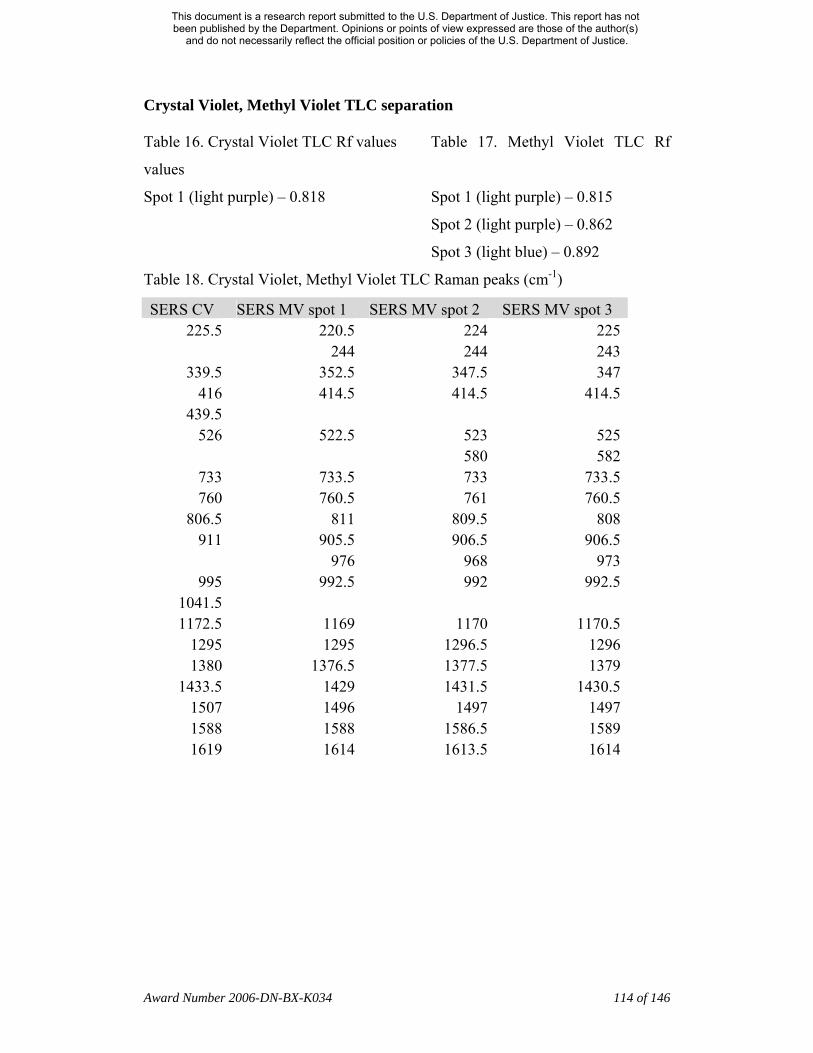
Crystal Violet, Methyl Violet TLC separation
Table 16. Crystal Violet TLC Rf values Table 17. Methyl Violet TLC Rf
values
Spot 1 (light purple) – 0.818 Spot 1 (light purple) – 0.815
Spot 2 (light purple) – 0.862
Spot 3 (light blue) – 0.892
Table 18. Crystal Violet, Methyl Violet TLC Raman peaks (cm-1)
SERS CV SERS MV spot 1 SERS MV spot 2 SERS MV spot 3 225.5 220.5 224 225
244 244 243 339.5 352.5 347.5 347
416 414.5 414.5 414.5 439.5
526 522.5 523 525 580 582
733 733.5 733 733.5 760 760.5 761 760.5
806.5 811 809.5 808 911 905.5 906.5 906.5
976 968 973 995 992.5 992 992.5
1041.5 1172.5 1169 1170 1170.5
1295 1295 1296.5 1296 1380 1376.5 1377.5 1379
1433.5 1429 1431.5 1430.5 1507 1496 1497 1497 1588 1588 1586.5 1589 1619 1614 1613.5 1614
Award Number 2006-DN-BX-K034 114 of 146
This document is a research report submitted to the U.S. Department of Justice. This report has not been published by the Department. Opinions or points of view expressed are those of the author(s)
and do not necessarily reflect the official position or policies of the U.S. Department of Justice.
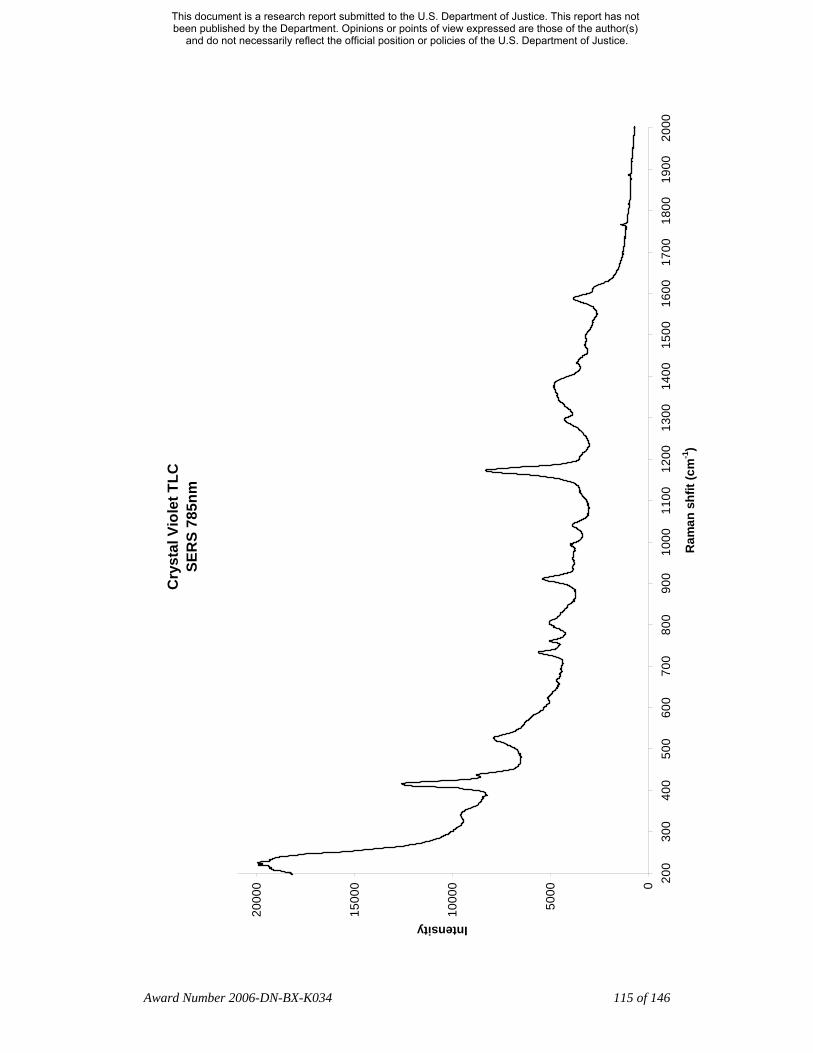
Cry
stal
Vio
let T
LC
SER
S 78
5nm
0
5000
1000
0
1500
0
2000
0 200
300
400
500
600
700
800
900
1000
1100
1200
1300
1400
1500
1600
1700
1800
1900
2000
Ram
an s
hfit
(cm
-1)
Intensity
Award Number 2006-DN-BX-K034 115 of 146
This document is a research report submitted to the U.S. Department of Justice. This report has not been published by the Department. Opinions or points of view expressed are those of the author(s)
and do not necessarily reflect the official position or policies of the U.S. Department of Justice.
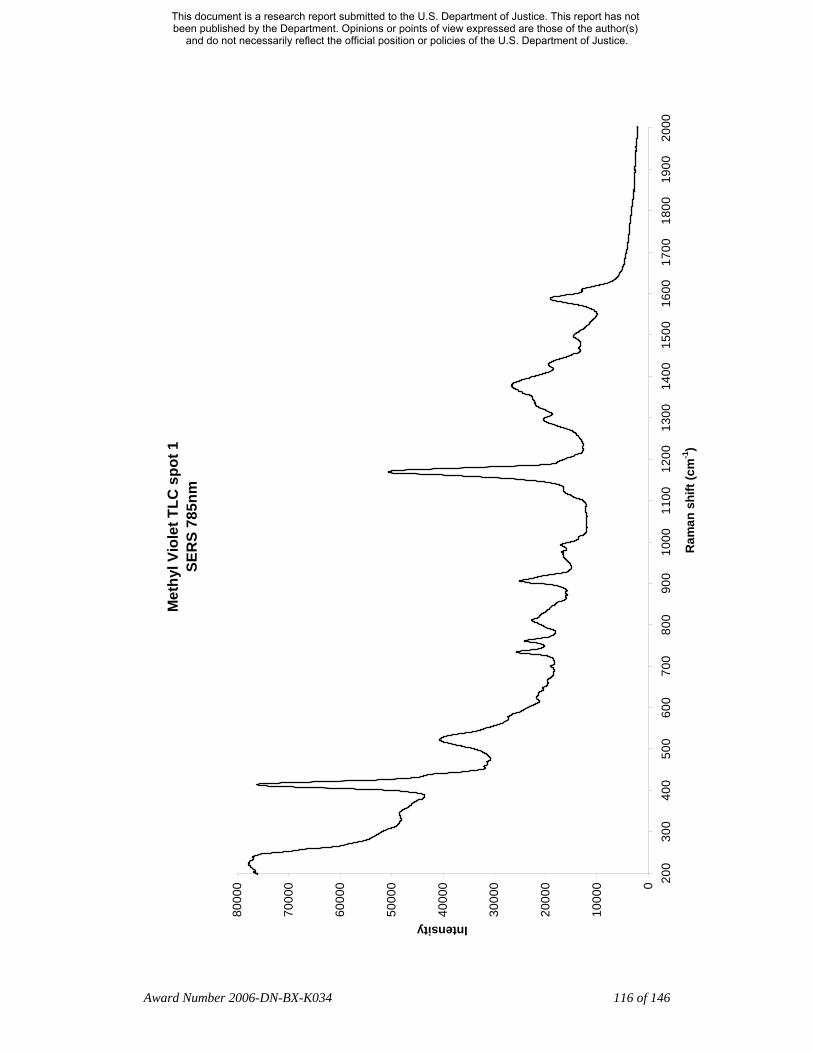
Met
hyl V
iole
t TLC
spo
t 1
SER
S 78
5nm
0
1000
0
2000
0
3000
0
4000
0
5000
0
6000
0
7000
0
8000
0 200
300
400
500
600
700
800
900
1000
1100
1200
1300
1400
1500
1600
1700
1800
1900
2000
Ram
an s
hift
(cm
-1)
Intensity
Award Number 2006-DN-BX-K034 116 of 146
This document is a research report submitted to the U.S. Department of Justice. This report has not been published by the Department. Opinions or points of view expressed are those of the author(s)
and do not necessarily reflect the official position or policies of the U.S. Department of Justice.

Met
hyl V
iole
t TLV
spo
t 2
SER
S 78
5nm
0
5000
1000
0
1500
0
2000
0
2500
0
3000
0
3500
0 200
300
400
500
600
700
800
900
1000
1100
1200
1300
1400
1500
1600
1700
1800
1900
2000
Ram
an s
hift
(cm
-1)
Intensity
Award Number 2006-DN-BX-K034 117 of 146
This document is a research report submitted to the U.S. Department of Justice. This report has not been published by the Department. Opinions or points of view expressed are those of the author(s)
and do not necessarily reflect the official position or policies of the U.S. Department of Justice.
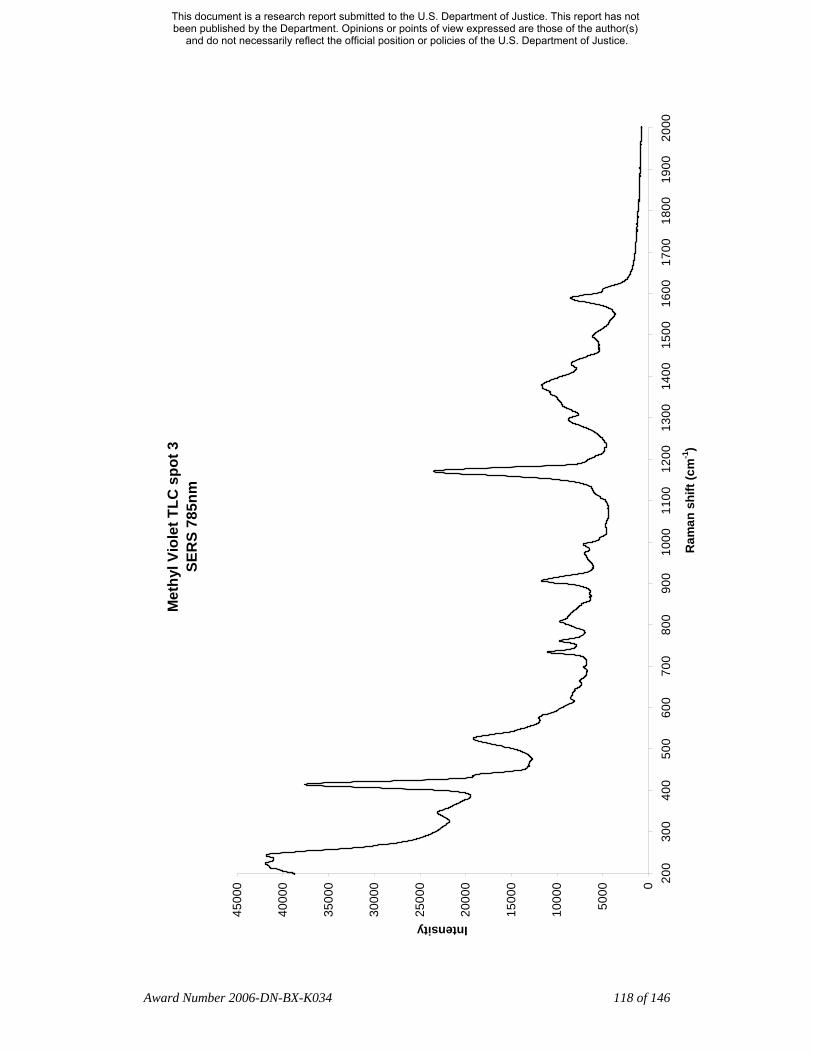
Met
hyl V
iole
t TLC
spo
t 3
SER
S 78
5nm
0
5000
1000
0
1500
0
2000
0
2500
0
3000
0
3500
0
4000
0
4500
0 200
300
400
500
600
700
800
900
1000
1100
1200
1300
1400
1500
1600
1700
1800
1900
2000
Ram
an s
hift
(cm
-1)
Intensity
Award Number 2006-DN-BX-K034 118 of 146
This document is a research report submitted to the U.S. Department of Justice. This report has not been published by the Department. Opinions or points of view expressed are those of the author(s)
and do not necessarily reflect the official position or policies of the U.S. Department of Justice.

TLC
pla
te
785n
m
050100
150
200
250
300
350
400
450
500 20
030
040
050
060
070
080
090
010
0011
0012
0013
0014
0015
0016
0017
0018
0019
0020
00
Ram
an s
hift
(cm
-1)
Intensity
Award Number 2006-DN-BX-K034 119 of 146
This document is a research report submitted to the U.S. Department of Justice. This report has not been published by the Department. Opinions or points of view expressed are those of the author(s)
and do not necessarily reflect the official position or policies of the U.S. Department of Justice.

TLC
pla
te
SER
S 78
5nm
0
2000
4000
6000
8000
1000
0
1200
0
1400
0
1600
0
1800
0 200
300
400
500
600
700
800
900
1000
1100
1200
1300
1400
1500
1600
1700
1800
1900
2000
Ram
an s
hift
(cm
-1)
Intensity
Award Number 2006-DN-BX-K034 120 of 146
This document is a research report submitted to the U.S. Department of Justice. This report has not been published by the Department. Opinions or points of view expressed are those of the author(s)
and do not necessarily reflect the official position or policies of the U.S. Department of Justice.

Table 1 – Frequencies and assignments of the Raman and SERS spectrum of
Morphine
Morphine Intensity Bond Stretch DFT Regular SERS
m C-O-H bend on ring A; C-N-C bend 309 330 w C-O-H bend on ring C; C-H rock in ring B 343 353 w CH3-N rock; O-H bend on ring A 405 401 w CH3-N rock and wag 462 441 443 w C-H rock throughout molecule 542 528 531 s C-C-O bend in ring C; C-H rock on ring C 609 607 607 vs ring bend (cage); no N movement 625 630 628 m C=C rock in ring A 667 676 672 w C-H rock on ring C & ring B 777 788 781 vw C-H rock on ring B 882 m all C-Hs rock 1031 1048 1035 s C-H around N rock and wag 1068 1089 1089 s O-H bend on ring A; H-C=C-H rock 1113 s C-H rock on ring A 1121 1121 1111 m O-H rock on ring C; C-H on ring B; C=C-H 1177 1178 1155 s C-C bend; C-H & O-H rock on ring C 1230 1246 1227 m C-H rock on ring B 1263 1279 1296 w C-H rock on ring A 1293 vs C-H stretch on ring C; C-H stretch on ring B 1350 1327 1321 vs More C-O-C and C-H stretch on ring C 1378 s O-H & C-H rock on ring A 1416 s C-H scissor on ring B 1469 1476 1444 s ring C deformation; O-H bend on ring C 1654 1634 1627 vs ring C quinoidal stretch 1684 vs Ca=Cb symmetric; H-Ca=Cb-H rock on ring A 1699
vs: very strong s: strong m: medium w: weak vw: very weak
Award Number 2006-DN-BX-K034 121 of 146
This document is a research report submitted to the U.S. Department of Justice. This report has not been published by the Department. Opinions or points of view expressed are those of the author(s)
and do not necessarily reflect the official position or policies of the U.S. Department of Justice.
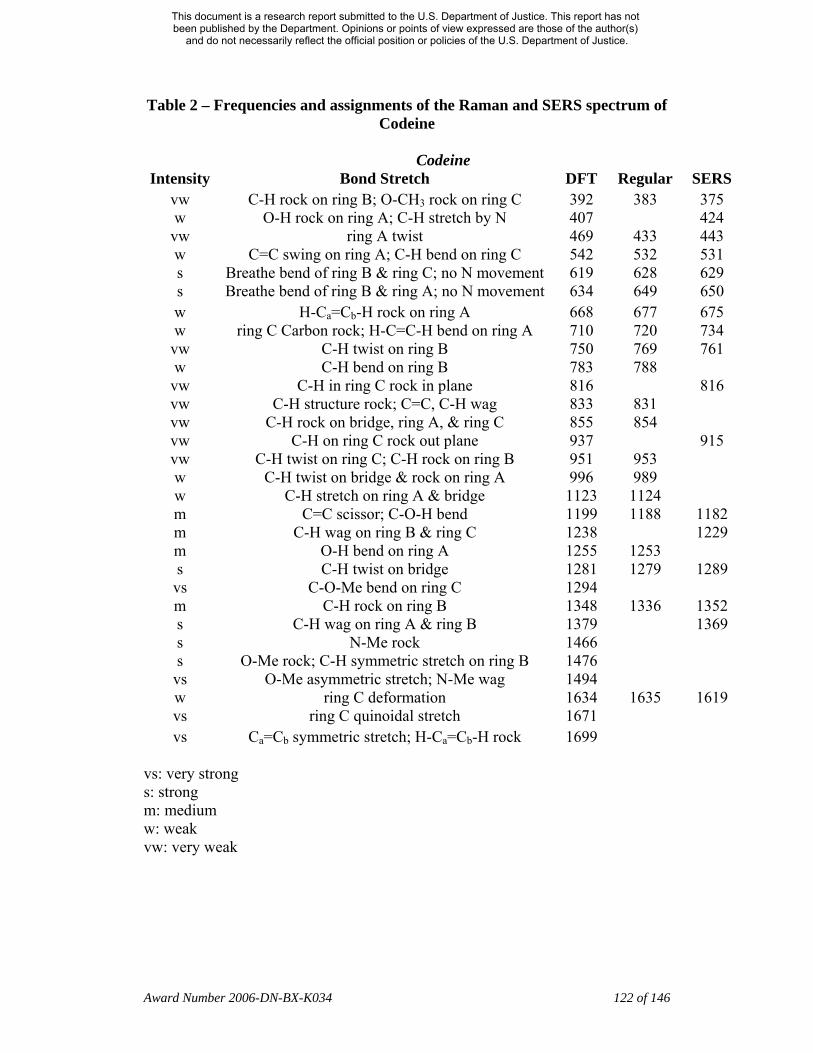
Table 2 – Frequencies and assignments of the Raman and SERS spectrum of Codeine
Codeine
Intensity Bond Stretch DFT Regular SERS vw C-H rock on ring B; O-CH3 rock on ring C 392 383 375 w O-H rock on ring A; C-H stretch by N 407 424 vw ring A twist 469 433 443 w C=C swing on ring A; C-H bend on ring C 542 532 531 s Breathe bend of ring B & ring C; no N movement 619 628 629 s Breathe bend of ring B & ring A; no N movement 634 649 650 w H-Ca=Cb-H rock on ring A 668 677 675 w ring C Carbon rock; H-C=C-H bend on ring A 710 720 734 vw C-H twist on ring B 750 769 761 w C-H bend on ring B 783 788 vw C-H in ring C rock in plane 816 816 vw C-H structure rock; C=C, C-H wag 833 831 vw C-H rock on bridge, ring A, & ring C 855 854 vw C-H on ring C rock out plane 937 915 vw C-H twist on ring C; C-H rock on ring B 951 953 w C-H twist on bridge & rock on ring A 996 989 w C-H stretch on ring A & bridge 1123 1124 m C=C scissor; C-O-H bend 1199 1188 1182 m C-H wag on ring B & ring C 1238 1229 m O-H bend on ring A 1255 1253 s C-H twist on bridge 1281 1279 1289 vs C-O-Me bend on ring C 1294 m C-H rock on ring B 1348 1336 1352 s C-H wag on ring A & ring B 1379 1369 s N-Me rock 1466 s O-Me rock; C-H symmetric stretch on ring B 1476 vs O-Me asymmetric stretch; N-Me wag 1494 w ring C deformation 1634 1635 1619 vs ring C quinoidal stretch 1671 vs Ca=Cb symmetric stretch; H-Ca=Cb-H rock 1699
vs: very strong s: strong m: medium w: weak vw: very weak
Award Number 2006-DN-BX-K034 122 of 146
This document is a research report submitted to the U.S. Department of Justice. This report has not been published by the Department. Opinions or points of view expressed are those of the author(s)
and do not necessarily reflect the official position or policies of the U.S. Department of Justice.

Table 3 – Frequencies of the Raman and SERS spectrum of Hydrocodone
Hydrocodone Regular Raman SERS
312 308 348 377 378 416 417 440 440 513 514 567 568 594 595 639 640 693 695 766 762 901 904 961 964 1037 1108 1110 1227 1228 1269 1278 1361 1350 1437 1449 1567 1539 1613 1638
Award Number 2006-DN-BX-K034 123 of 146
This document is a research report submitted to the U.S. Department of Justice. This report has not been published by the Department. Opinions or points of view expressed are those of the author(s)
and do not necessarily reflect the official position or policies of the U.S. Department of Justice.

Table 4 – Frequencies of the SERS spectrum of Codeine, Morphine and Hydrocodone
Codeine Morphine HydrocodoneSERS SERS SERS
308
375 378 424 417 443 443 440 531 531 514
568 595 607
629 628 640 675 672 695 734 761 781 762 816
904 915 964
1035 1089 1111 1110 1155
1182 1229 1227 1228
1289 1296 1278
1369 1321 1350
1444 1449 1539
1619 1627
Award Number 2006-DN-BX-K034 124 of 146
This document is a research report submitted to the U.S. Department of Justice. This report has not been published by the Department. Opinions or points of view expressed are those of the author(s)
and do not necessarily reflect the official position or policies of the U.S. Department of Justice.

O
OH
MeO
H
NMe
A
C
B
Ca
Cb
Figure 1. Structure of Codeine molecule
O
OH
OH
H
NMe
A
C
B
Ca
Cb
Figure 2. Structure of Morphine molecule
O
O
MeO
H
NMe
A
C
B
Ca
Cb
Figure 3. Structure of Hydrocodone molecule
Award Number 2006-DN-BX-K034 125 of 146
This document is a research report submitted to the U.S. Department of Justice. This report has not been published by the Department. Opinions or points of view expressed are those of the author(s)
and do not necessarily reflect the official position or policies of the U.S. Department of Justice.
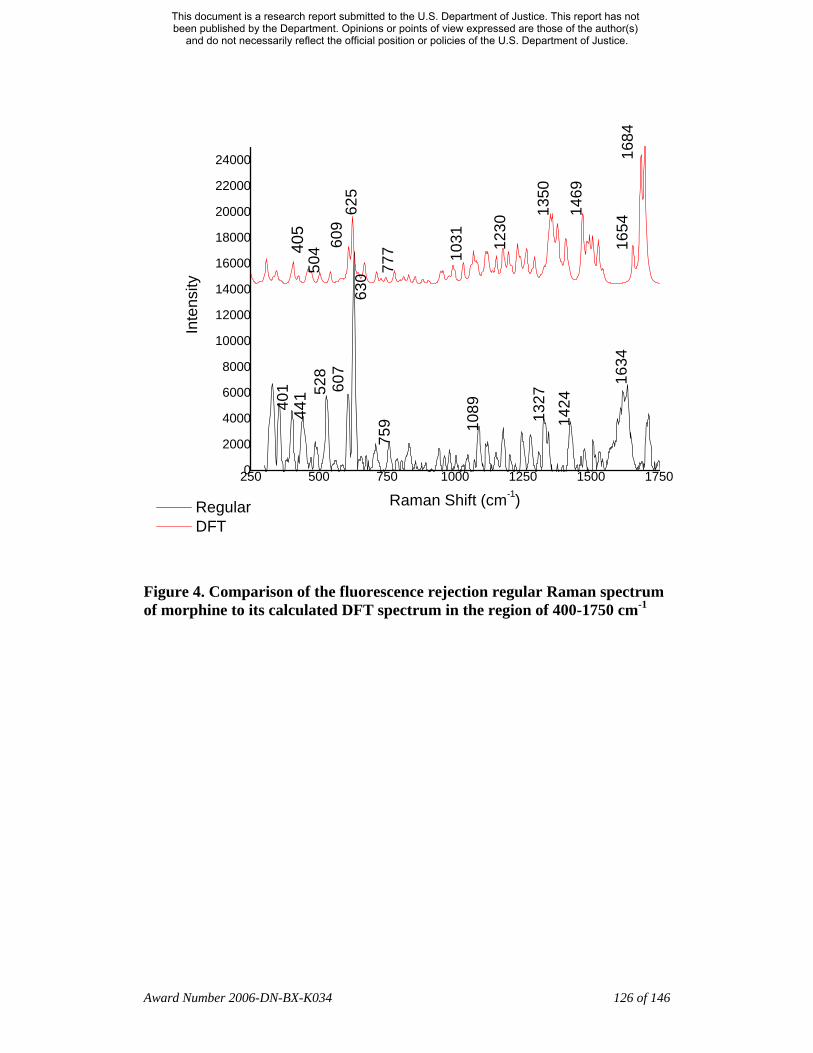
250 500 750 1000 1250 1500 17500
2000
4000
6000
8000
10000
12000
14000
16000
18000
20000
22000
24000
Regular DFT
Inte
nsity
Raman Shift (cm-1)
405
504 60
962
5
777 10
31
1350
1469
1654
401
441 52
860
763
075
9 1089 13
2714
24
1634
1230
1684
Figure 4. Comparison of the fluorescence rejection regular Raman spectrum of morphine to its calculated DFT spectrum in the region of 400-1750 cm-1
Award Number 2006-DN-BX-K034 126 of 146
This document is a research report submitted to the U.S. Department of Justice. This report has not been published by the Department. Opinions or points of view expressed are those of the author(s)
and do not necessarily reflect the official position or policies of the U.S. Department of Justice.

250 500 750 1000 1250 1500 17500
2000
4000
6000
8000
10000
12000
14000
16000
18000
Regular SERS
Inte
nsity
Raman Shift (cm-1)
443
531
607 62
8
894
1035
1348
1444
1627
401
441
528
607
630
759 10
89 1327
1424
1634
Figure 5. Comparison of the SERS spectrum of morphine to the fluorescence rejection regular Raman spectrum of morphine in the region of 400-1750 cm-
1
Award Number 2006-DN-BX-K034 127 of 146
This document is a research report submitted to the U.S. Department of Justice. This report has not been published by the Department. Opinions or points of view expressed are those of the author(s)
and do not necessarily reflect the official position or policies of the U.S. Department of Justice.

400 600 800 1000 1200 1400 16000
2000
4000
6000
8000
10000
Regular DFT
Inte
nsity
Raman Shift (cm-1)
619
668
996
1294
1494
1634
532
628
677
788
953
1124 13
3614
29 1635
542 11
23
1379
1699
Figure 6. Comparison of the fluorescence rejection regular Raman spectrum of codeine to its calculated DFT spectrum in the region of 400-1750 cm-1
Award Number 2006-DN-BX-K034 128 of 146
This document is a research report submitted to the U.S. Department of Justice. This report has not been published by the Department. Opinions or points of view expressed are those of the author(s)
and do not necessarily reflect the official position or policies of the U.S. Department of Justice.
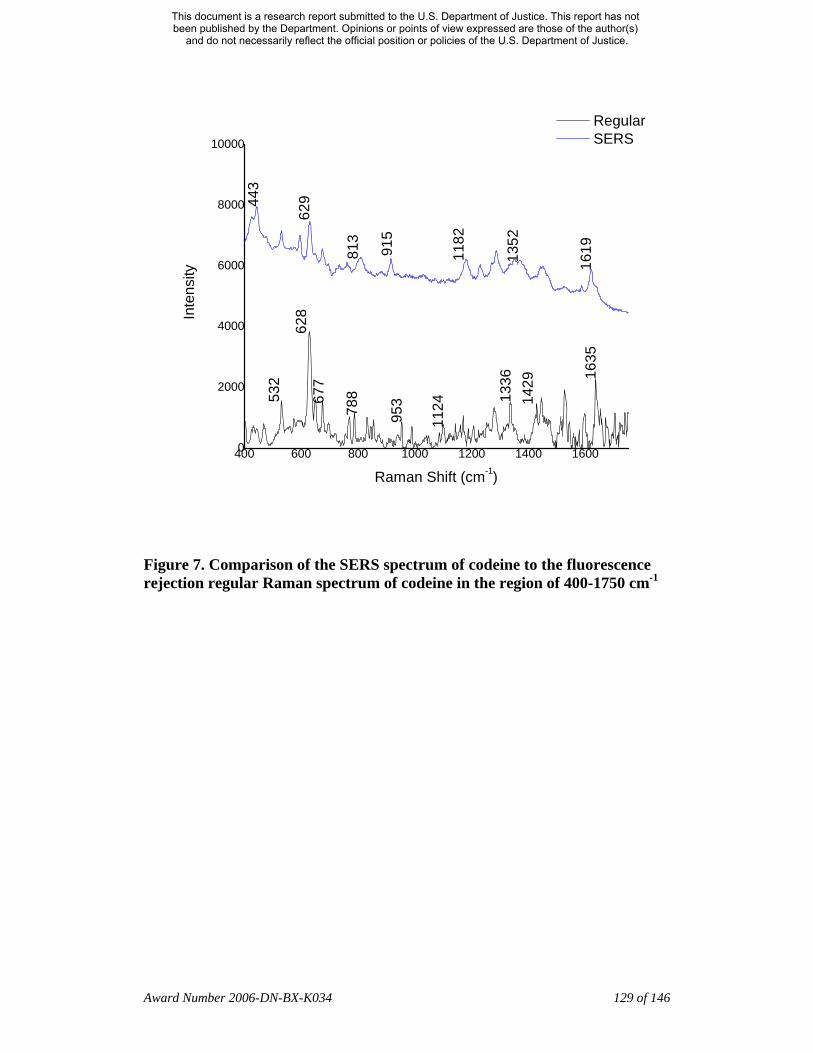
400 600 800 1000 1200 1400 16000
2000
4000
6000
8000
10000
Regular SERS
Inte
nsity
Raman Shift (cm-1)
629
813
915
1182
1352
1619
443
532
628
677
788
953
1124 13
3614
29 1635
Figure 7. Comparison of the SERS spectrum of codeine to the fluorescence rejection regular Raman spectrum of codeine in the region of 400-1750 cm-1
Award Number 2006-DN-BX-K034 129 of 146
This document is a research report submitted to the U.S. Department of Justice. This report has not been published by the Department. Opinions or points of view expressed are those of the author(s)
and do not necessarily reflect the official position or policies of the U.S. Department of Justice.

200 400 600 800 1000 1200 1400 16000
2500
5000
7500
10000
12500
15000
17500
20000
22500
25000
27500
30000
Regular SERS
Inte
nsity
Raman Shift (cm-1)
378
514
595
640
762
964
1110
1278
1449
377
513 59
463
976
6
961
1108 12
69
1437
Figure 8. Comparison of the SERS spectrum of hydrocodone to the regular Raman spectrum of hydrocodone in the region of 400-1750 cm-1
Award Number 2006-DN-BX-K034 130 of 146
This document is a research report submitted to the U.S. Department of Justice. This report has not been published by the Department. Opinions or points of view expressed are those of the author(s)
and do not necessarily reflect the official position or policies of the U.S. Department of Justice.
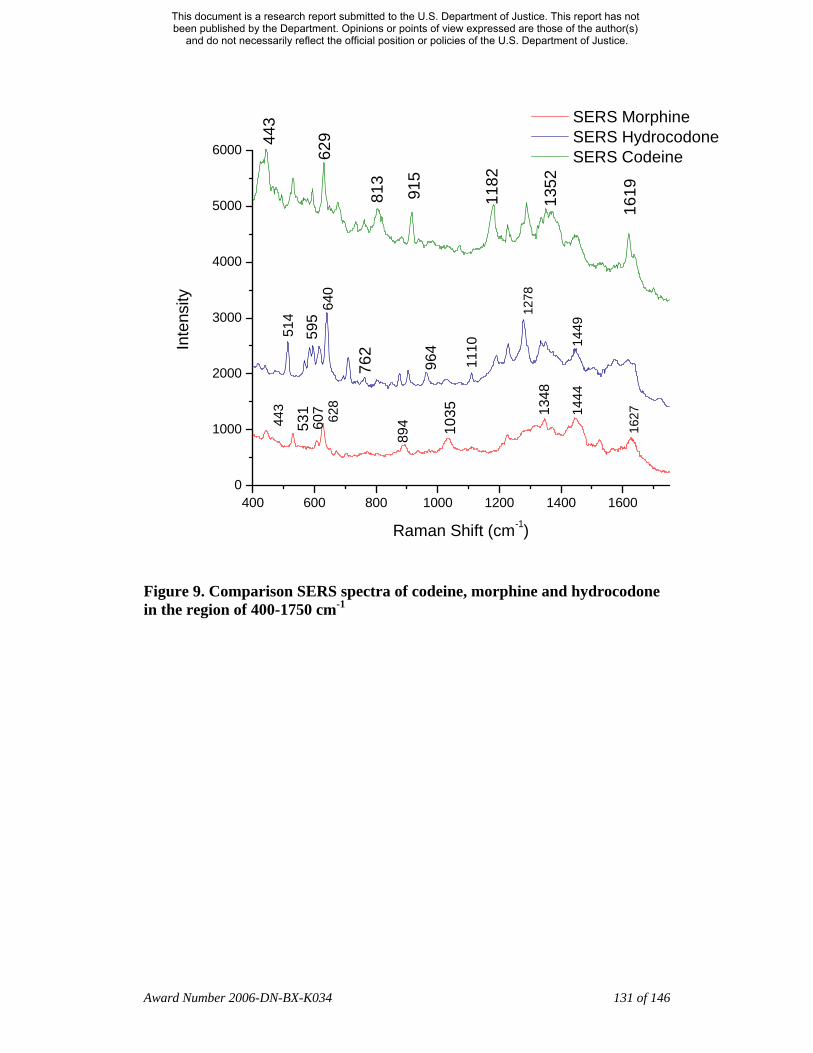
400 600 800 1000 1200 1400 16000
1000
2000
3000
4000
5000
6000
SERS Morphine SERS Hydrocodone SERS Codeine
Inte
nsity
Raman Shift (cm-1)
514
595
640
762
964
1110
1278
1449
443
531 628
894 10
35 1348
1444
1627
607
443
629
813
915
1182
1352
1619
Figure 9. Comparison SERS spectra of codeine, morphine and hydrocodone in the region of 400-1750 cm-1
Award Number 2006-DN-BX-K034 131 of 146
This document is a research report submitted to the U.S. Department of Justice. This report has not been published by the Department. Opinions or points of view expressed are those of the author(s)
and do not necessarily reflect the official position or policies of the U.S. Department of Justice.

400 600 800 1000 1200 1400 16000
1000
2000
3000
4000
5000
6000
7000
Inte
nsity
Raman Shift (cm-1)
Codeine------- Morphine
Figure 10. Comparison DFT calculated spectrum of codeine and morphine in the region of 400-1750 cm-1
Award Number 2006-DN-BX-K034 132 of 146
This document is a research report submitted to the U.S. Department of Justice. This report has not been published by the Department. Opinions or points of view expressed are those of the author(s)
and do not necessarily reflect the official position or policies of the U.S. Department of Justice.
IV. Conclusion
1. Discussions of Findings Although normal Raman spectra were obtained for all the dyes, the study
showed that only the FT system with the 1064 nm Nd/YAG laser performed
consistently. All the 1064 nm spectra had excellent signal intensity and signal to
noise ratios. At the same time, the spectra determined with the 633 nm and 785
nm lasers differed in their signal clarity for each of the dyes. Only acid orange 10
responded well to both laser wavelengths. The 633 nm laser exceeded in its
performance over the 785 nm wavelength for aniline blue, victoria blue, and
sudan black b. These results can be explained by resonance Raman as the three
dyes are similar in their deep blue color. Additionally, high levels of fluorescence
were observed in all the 633 nm spectra. The 785 nm laser provided clear spectra
for the rest of analytes including both red and blue colored dyes. Overall, the
results contained enough individualizing peaks to easily differentiate the dyes.
The exceptions were the spectra of crystal violet and methyl violet which are
extremely similar, but so are the molecular structures of the compounds which
differ only in the number of methyl groups. It should be noted that the analyte
spectra obtained at different laser wavelengths did not correspond exactly. Such
results may be due to low quality of many of the normal Raman spectra,
differences in spectral resolutions used, and variations in peak identification by
Origin® data analysis software. Noise may also account for some of the peak
outliers observed in the spectra.
Excellent surface-enhanced Raman spectra were obtained for all the dyes
with both 633 nm and 785 nm lasers. Approximately 4x increase in signal
intensity was observed with the use of the 633 nm wavelength, although
pararosaniline and sudan black b presented higher intensity spectra with the 785
nm laser. Differences between NR and SERS spectra were noted in the change of
intensity of individual peaks, and the appearance of certain peaks in one type of
the spectrum, but not the other. Occasional peak shifts (within 10 cm-1) were also
observed. These peak variations are explained by selection rules that dictate
Award Number 2006-DN-BX-K034 133 of 146
This document is a research report submitted to the U.S. Department of Justice. This report has not been published by the Department. Opinions or points of view expressed are those of the author(s)
and do not necessarily reflect the official position or policies of the U.S. Department of Justice.

which molecular bonds are Raman and SERS active. Adsorption of the analyte to
the surface of the colloid and its orientation there changes the molecular
symmetry altering the activity of the bonds. Peak shifts are also not uncommon
and a bathochromic shift is particularly apparent with the adsorbed aromatic
compounds such as dyes. (Smith & Dent, 2005).
The normal Raman and surface-enhanced Raman spectra obtained directly
from the ink line were of poor quality; although the 1064 nm spectrum presented
a recognizable peak pattern. As only the 785 nm wavelength was utilized for
SERS in this part of the study, perhaps cleaner, higher signal/noise spectra could
have been determined with other lasers. The TLC analysis showed that the methyl
violet standard separated into three spots on the plate while the ink extraction
presented only two spots corresponding to methyl violet in color, Rf values, and
SERS spectra. Such results were probably due to different combinations of the
demethylated pentamethyl pararosaniline found in both the standard and the ink.
The surface-enhanced Raman spectra of the ink dyes obtained from the thin-layer
chromatography plate contained high intensity peaks and were consistent with the
SERS spectra of crystal and methyl violet standards determined from both drop
on a microscope slide and TLC substrates. The spectrum of the third ink dye spot
did not correspond to any of the dyes in this study.
As only one surface-enhanced Raman scattering condition was explored,
other colloids and/or aggregants may provide higher quality spectra and should be
considered for future studies. FT-Raman SERS research may also be beneficial in
evaluating applicability of the 1064 nm laser. Additionally, surface-enhanced
Raman evaluation of TLC ink separations with various laser wavelengths may
provide higher quality spectra. A quantitative study with both NR and SERS of
the dyes would be valuable in establishing limits of detection. Density functional
theory calculations should also be conducted to properly assign peaks in both
normal Raman and surface-enhanced Raman spectra.
DFT Comparison of Codeine and Morphine
Award Number 2006-DN-BX-K034 134 of 146
This document is a research report submitted to the U.S. Department of Justice. This report has not been published by the Department. Opinions or points of view expressed are those of the author(s)
and do not necessarily reflect the official position or policies of the U.S. Department of Justice.

A comparison DFT spectrum was constructed to show how the two drugs
shared some peaks and differentiated in others. (Figure 10) The peaks in
morphine and codeine found in the 600 cm-1 and 1600 cm-1 range are similar
because the same vibrations are present. The 600 cm-1 vibration were associated
with breathing of the whole structure, hence a strong intense peak was seen. On
the other hand, the early vibrations in the 1600 - 1700 cm-1 range correspond to a
deformation of ring C in both morphine and codeine, while the higher frequency
vibrations in this region corresponded to a vibration of the double bond found in
ring A. The bands that differentiate these two opiates correlated to the C-H rock
and the C-H twist throughout the structure. In the morphine, these vibrations were
observed around 1000 cm-1, while in codeine, they are around 900 cm-1. Also, the
intense peak at 1294 cm-1 in codeine was a distinguishing characteristic to that
drug because the morphine spectrum did not have an intense peak there.
SERS Comparison
A comparison of SERS spectra showed that these three compounds can be
readily distinguished from each other see Figure 9. Codeine had intense bands at
629 cm-1, 915 cm-1, 1182 cm-1, and 1619 cm-1, while morphine had intense bands
at 628 cm-1, 1035 cm-1, 1348 cm-1, and 1627 cm-1. For hydrocodone, the intense
bands are 514 cm-1, 640 cm-1, 964 cm-1, and 1278 cm-1. These intense bands alone
distinguish between these three drugs, and can be employed to indicate the
presence of them. The region that helped in discrimination was around 600 cm-1,
where the most intense band was found in all three opiates. In hydrocodone, an
intense peak was seen at 640 cm-1 but it was complemented with additional peaks
in the high 500 cm-1 range, which was not seen in either of the other two drugs. In
this same region, codeine was indicated because its 629 cm-1 peak had a small
shoulder peak at 650 cm-1. While in morphine, its 628 cm-1 peak had a smaller
shoulder peak at 607 cm-1, which was different from both codeine and
hydrocodone. Therefore, using this region first and then looking at the rest of the
spectrum, one should be able to distinguish between these three drugs.
Award Number 2006-DN-BX-K034 135 of 146
This document is a research report submitted to the U.S. Department of Justice. This report has not been published by the Department. Opinions or points of view expressed are those of the author(s)
and do not necessarily reflect the official position or policies of the U.S. Department of Justice.
2. Implications for Policy and Practice With over 2,600 articles published on SERS since its discovery in 1974, it
is clear that SERS is a generally accepted scientific technique. Thus, we believe
that the basic criteria of Court Admissibility as put forth in Frye28 are met by this
technique. However, as indicated by the number of cases in which attempts at
questioning techniques with a much longer track record than SERS were made29,
careful validation will be needed for the technique to be of use in forensic science.
The validation of SERS should be based upon the data obtained by
CCNY, ORNL, NYPD, and MMA. Validation should include documentation to
demonstrate that the application of SERS to forensic samples is a reliable,
reproducible, and powerful technique. Also useful is the methodology delineated
in the American Society of Crime Laboratory Directors Manual30 and the ISO
(the International Organization for Standardization) and IEC (the International
Electrotechnical Commission) Manual31. A series of round robin samples should
further support the use of SERS in the analysis of forensic samples. The initial
data obtained must show that the methodology provides quality analytical data.
Validation of the database will also be required. This research will result in
providing greater discrimination between questioned and known forensic samples.
The ability to provide greater discrimination between similar materials will result
in a reduction of false inclusions, and an analysis that shows consistency between
samples will result in a stronger association. The result of this research will
provide the qualification and validation necessary for Raman spectroscopy to
meet the standards delineated in Frye and Daubert. Calibration of the instruments
should be performed prior to use by following individual instrument
manufacturers recommendations and by following the American Society of
Testing and Materials (ASTM) standard guide for calibrating Raman
spectrometers, ASTM E1840 (1996)32. Quality Raman spectra depend on
optimum instrumental parameters. Two Raman spectrometers have been used in
this study, a Renishaw Dispesive Micro-Raman spectrometer (750nm laser, CCD
detector) and a Nicolet FT-Raman system (1064nm laser, InGaS and Ge
detectors). Both spectrometers are be adjusted to obtain high quality spectra. The
Award Number 2006-DN-BX-K034 136 of 146
This document is a research report submitted to the U.S. Department of Justice. This report has not been published by the Department. Opinions or points of view expressed are those of the author(s)
and do not necessarily reflect the official position or policies of the U.S. Department of Justice.
parameters for the Renishaw Raman instrument that can be adjusted include: the
use of neutral density filters, the number of scans, exposure times, changing the
laser spot size, and using different microscope objectives. The parameters for the
Nicolet Raman instrument that can be adjusted include: the number of scans, the
use of a neutral density filter, and the laser power. A reliable database will
facilitate the identification of individual components present in complex matrices.
The qualification and validation SERS and the data base(s) developed will be
modeled to meet the standards delineated in Frye and Daubert33.
This study provides analytical data on forensic samples that does not
appear in the literature: in fact, no systematic library of SERS spectra is currently
available. This research will result in providing greater discrimination between
questioned and known samples. The ability to provide greater discrimination
between similar samples will result in a reduction of false inclusions, and an
analysis that shows consistency between samples will result in a stronger
association.
3. Implications for Further Research The work carried out in Phase I of the research project demonstrated that
SERS is a valuable technique for the identification of organic colorants used in
inks and for the dyeing of textile fibers, as well as for trace analysis of
pharmaceuticals and of drugs of abuse. Analytical procedures for SERS of a
number of representative dyes were developed, the core of a high quality spectral
database was assembled as a proof of concept experiment, and innovative non-
destructive approaches were investigated. To date our colorants database includes
approximately 50 natural and synthetic dyes, and it is, to our knowledge, the first
SERS spectral database ever assembled (in the course of the work, a normal
Raman database of approximately 100 spectra of organic colorants was also
assembled). The database is both chemically inclusive (as dyes belonging to the
principal classes are represented) and spectrally comprehensive, since both SERS
spectra obtained at different wavelengths (488, 633, 785 nm) and normal
dispersive Raman (488, 633, 785 nm), and FT-Raman (1064 nm) are included.
Award Number 2006-DN-BX-K034 137 of 146
This document is a research report submitted to the U.S. Department of Justice. This report has not been published by the Department. Opinions or points of view expressed are those of the author(s)
and do not necessarily reflect the official position or policies of the U.S. Department of Justice.

For SERS to become a routine technique, the database must be expanded
significantly, preferably by including well characterized ink compositions.
Sample handling techniques must also be improved, with the goal of
matching the non-destructive approach of conventional Raman spectroscopy. Two
promising methods have been developed, hydroxygel transfer SERS (HT-SERS)
and inkjet nanoparticle delivery SERS (IND-SERS), and their use in the analysis
of written and printed documents should be carefully explored.
Finally, further attention should be given to the analysis of problematic ink
systems, such as gel pen inks and black inks. We have received a set of 45 black
gel pen ink samples, and we plan to develop extraction techniques for gel inks
suitable for SERS analysis, and in particular we will refine the hydroxygel
transfer method to improve its applicability to non-destructive sampling of gel
inks.
The rapid identification of drugs of abuse is another area in which SERS
can be of significant interest. We see here two directions for development:
detection of drugs of abuse in presence of extenders and cutting agents (which can
be fluorescent and therefore obscure the conventional Raman spectrum of the
illicit components), and, in a complementary fashion to gas-chromatographic
analysis, identification of closely related precursors of designer drugs. Because of
its high sensitivity SERS can be used with low cost portable devices; these
devices generally suffer from poor fluorescence rejection and inadequate
sensitivity. Using SERS and normal Raman on samples of unknown substances, it
is feasible to detect both SERS-inactive inorganic and organic extenders, as well
as SERS active ingredients. An example is the analysis of Vicodin. Besides a
variety of inactive ingredients, the drug has two main components, acetaminophen
and hydrocodone. The concentration of acetaminophen, a strong Raman scatterer
is 100 times higher than that of hydrocodone, a weak scatterer. Acetaminophen
does not adsorb on silver nanoparticles efficiently, leading to poor SERs activity.
Therefore, analyzing a suspect tablet in normal Raman and in SERS conditions
(for instance by simply dropping some silver colloid on the tablet) would reveal
the presence of the opiate. The situation is probably a good model for that of any
Award Number 2006-DN-BX-K034 138 of 146
This document is a research report submitted to the U.S. Department of Justice. This report has not been published by the Department. Opinions or points of view expressed are those of the author(s)
and do not necessarily reflect the official position or policies of the U.S. Department of Justice.

suspect composition, where the illicit ingredient could be masked by several
extenders.
The second area of development for SERS in the analysis of drugs of
abuse is as a specific probe for molecular structure. We demonstrated in our work
on berberine alkaloids (insert reference) that small variations in molecular
structure can result in significant changes in the SERS spectrum. The example of
the berberine alkaloids is actually quite interesting in a forensic context. These
compounds can be seen as model compounds for metamphetamines, as they have
methylenedioxy groups in their structure. Thus SERS could be used to distinguish
precursor for methamphetamine drugs if a suitable spectral library was developed.
During phase II we will work to place SERS in an analytic flow of
evidentiary chain, and to complete the Raman library. We also plan to test the
validation techniques and the library data base. In order to carry out phase II more
effectively Patrick Buzzini at West Virginia University has agreed to join our
effort. His focus is on research and development of methods for the exploitation
of the evidence, with primary interest in the comprehension of the contribution of
the evidence in a legal context. We believe this additional expertise is needed for
the satisfactory continuation of this project. Dr. Buzzini has experience in Raman
spectroscopy on the analysis of fiber dyes and has also applied the Raman
technique to his caseworks in paint evidence involving the detection of pigments.
In phase II, he will participate in acquiring ordinary Raman spectra of reference
dyes. Students and a post-doctoral fellow will be recruited to work on this project
from CCNY, John Jay and VWU. With the aid of funding from the City
University of New York, we have already begun work on expansion of the data
base to produce a searchable library of SERS spectra needed for positive
identification of trace samples and test limits of detection to ensure clear positive
or negative determinations. The work on controlled substances will be expanded
to include controlled substances commonly encountered in a crime laboratory,
pharmaceutical preparations, counterfeit or clandestine substances, precursors,
and degradation products. We will also examine real samples obtained from crime
scenes provided by Philip Antoci at the NYPD, these methods and techniques will
Award Number 2006-DN-BX-K034 139 of 146
This document is a research report submitted to the U.S. Department of Justice. This report has not been published by the Department. Opinions or points of view expressed are those of the author(s)
and do not necessarily reflect the official position or policies of the U.S. Department of Justice.

be applied, when feasible, to the examination of related casework samples
submitted to the NYPD crime laboratory. We will carry out further validation
studies using 45 black gel pen ink samples kindly supplied to us by the Secret
Service.
Award Number 2006-DN-BX-K034 140 of 146
This document is a research report submitted to the U.S. Department of Justice. This report has not been published by the Department. Opinions or points of view expressed are those of the author(s)
and do not necessarily reflect the official position or policies of the U.S. Department of Justice.
V. References 1 Bartick, E.G., Applications of Vibrational Spectroscopy in Criminal Forensic Analysis, in Handbook of Vibrational Spectroscopy, J.M. Chalmers and P.R. Griffiths (Eds), John Wiley and Sons Ltd, Chichester, 2002. 2 Chang, R.K.; Furtak, T.E., Surface Enhanced Raman Scattering ; (Plenum, New York, 1982). 3 Van Duyne, R.P., Surface Enhanced Raman Scattering; Chemical and Biochemical Applications of Lasers, edited by C. B. Moore, (Academic Press, New York, 1979), Vol. 4, p.101. 4 Moskovits, M., Surface Enhanced Spectroscopy; Rev. Mod.Phys.1985, 57, 783. 5 Birke, R.L.; Lombardi, J.R., Surface Enhanced Raman Scattering; in Spectroelectrochemistry: Theory and Practice Ed. R.J. Gale, Plenum,1988. 6 Uehara,J.;Nishihara,H.; Aramaki,K.,An Investigation of Adsorption and Orientation of Some Nitrogen Compounds at Iron Surface in an Acid Solution by Surface-Enhanced Raman Scattering Spectroscopy; J. Electrochem. Soc. 1990, 137, 2677. 7 Vo-Dinh, T., Surface-enhanced Raman spectroscopy using metallic nanostructures, Trends in Analytical Chemistry (1998) 17: (8-9) 557-582. 8 Lombardi, J.R.; Birke, R.L.; Lu, T.; Xu,J., Charge-transfer theory of surface enhanced Raman spectroscopy; Herzberg-Teller contributions; J. Chem. Phys.1986, 84, 4174. 9 Cheng, C., Kirkbride, T.E., Batchelder, D.N., Lacey, R.J., & Sheldon, T.G. (1995). In Situ detection and identification of trace explosives by Raman Spectroscopy. Journal of Forensic Sciences, 40(1), 31-37. 10 Hayward, I.P., Kirkbride, T.E., Batchelder, D.N., & Lacey, R.J. (1995). Use of a fiber optic probe for the detection and identification of explosive materials by Raman spectroscopy. Journal of Forensic Sciences, 40(5), 883-884. 11 Ryder AG. (1999) Identifications and quantitative measurements of narcotics in solid mixtures using Near-IR Raman spectroscopy and multivariate analysis. Journal of Forensic Science, 44(5), 1013-1019. 12 Review Papers, 14th International Forensic Science Symposium, Interpol-Lyon, 19-22 October 2004, N. N. Daeid (Editor). 13 Rodger C, Dent G, Watkinson J, Smith WE., Surface Enhanced Resonance Raman Scattering and Near-Infrared Fourier Transform Raman Scattering as in situ Probes of Ink Jet Dyes Printed on Paper; Applied Spectroscopy 54, 11, 2000 1567-1576. 14 White PC, Munro CH, Smith WE. In situ surface enhanced resonance Raman scattering analysis of a reactive dye covalently bound to cotton; Analyst, 1996 121(6) 835-838. 15 Massonet G, Buzzini, P, Jochem G, Stauber M, Coyle T, Roux C, Thomas J, Leijenhorst H, Van Zanten Z, Wiggins K, Russell C, Chabli S, Rosengarten A. Evaluation of Raman spectroscopy for the analysis of colored fibers: a collaborative study. J. Forensic Sci. 2005, 50(5) 1028-1038.
Award Number 2006-DN-BX-K034 141 of 146
This document is a research report submitted to the U.S. Department of Justice. This report has not been published by the Department. Opinions or points of view expressed are those of the author(s)
and do not necessarily reflect the official position or policies of the U.S. Department of Justice.
TP
16 Ryder AG. Surface enhanced Raman scattering for narcotic detection and application to chemical biology. Curr. Opin. Chem. Biol. 2005 9(5) 489-493. 17 Sagmuller B, Schwarze B, Brehm G, Schneider S. Application of SERS spectroscopy to the identification of (3,4-methylenedioxy)amphetamine in forensic samples utilizing matrix stabilized silver halides. Analyst 2001 126(11) 2066-2071 18 White, P.C., Sci. Justice, 2003, 43(3), 149-152. 19 Buzzini, P., Massonnet, G., Sci. Justice, 2004, 44(3), 123-131. 20 Rodger, C., Rutherford, V., Broughton, D., White, P.C., Smith, W.E., Analyst, 1998, 123, 1823-1826. 21 Leona M. Surface enhanced Raman scattering in art and archaeology. Optics East: Advanced Environmental, Chemical, and Biological Sensing Technologies III. Sunday-Monday 23-24 October 2005, Boston, MA. Proceedings of SPIE Vol. 5993. 22 Leona M. Non-Invasive identification of fluorescent dyes in historic textiles by matrix-transfer surface-enhanced Raman scattering (MT-SERS). United States Patent and Trademark Office Provisional Patent Application 60/707,468. 23 Chen K, Leona M, Vo-Dinh KC, Yan F, Wabuyele MB, Vo-Dinh T. Application of surface-enhanced Raman scattering (SERS) for the identification of anthraquinone dyes used in works of art. Journal of Raman Spectroscopy 2006 37(4), 520-27 24 Leona M, Stenger J, Ferloni E. Application of surface-enhanced Raman scattering techniques to the ultra-sensitive analysis of natural dyes in works of art. ArtRaman 2005 3rd International Conference on the Application of Raman Spectroscopy in Art and Archaeology, Paris (F), 31 August 2005 - 3 September 2005. 25 Shadi IT, Chowdry BZ, Snowden MJ, Whitnall R., J. Raman Spectrosc. 2004; 35: 800-807 26 Bell, S.E.J., Spence, S.J.,,‘Disposable, stable media for reproducible surface-enhanced Raman spectroscopy’ Analyst (2001) 126 (1), 1-3. 27 Farquharson, S., and Maksymiuk, P., ‘Simultaneous chemical separation surface enhanced Raman spectral detection using silver doped sol-gels’ Applied Spectroscopy (2003) 57(4) 479-481. 28 Frye vs. U.S., 293 F. 1013, 1014 (D.C. Cir. 1923) 29 Brunelle, R.L., MS and Reed, R.W., MFS; Forensic Examination of Ink and Paper, Charles C. Thomas Publisher Ltd., Springfield, IL 1984, p. 255-276 30 American Society of Crime Laboratory Directors Accreditation Board 2005 Manual 31 International Standard ISO/IEC, General requirements for the competence of testing and calibration laboratories, Reference number ISO/IEC 17025:2005(E) © ISO 2005 32 ASTM (1996). E1840, Standard guide for Raman shift standards for
spectrometer calibration. Philadelphia, PA: American Society for Testing and Materials.
33 Daubert v. Merrill Dow Pharmaceuticals, Inc., 509 U.S. 591, 593 (1993)
Award Number 2006-DN-BX-K034 142 of 146
This document is a research report submitted to the U.S. Department of Justice. This report has not been published by the Department. Opinions or points of view expressed are those of the author(s)
and do not necessarily reflect the official position or policies of the U.S. Department of Justice.
VI. Dissemination of Research Findings
1. Presentations and Information Exchange On November 30, 2007, the project’s Principal Investigators Dr. John R.
Lombardi (CCNY) and Dr. Marco Leona (The Metropolitan Museum of Art) hosted a meeting of the Society of Applied Spectroscopy at the museum. The program included a tour of the facilities; a tutorial on Surface Enhanced Raman Spectroscopy (SERS) and Dr. Leona gave a talk regarding the project results and detection methods.
Principal Investigator Dr. Tuan Vo-Dinh gave a presentation on “Nanobiosensing Using Plasmonics and SERS Nanoprobes” at the LEOS 2007 conference in Orlando, FL, October 23, 2007.
Dr. Marco Leona gave a presentation on Oct. 17, 2007 at the General Forensic TWG: Fall Meeting.
“Plasmonics Nanostructures and Nanoprobes for Chemical, Biological, and Medical Sensing,” (Dr. Tuan Vo-Dinh), Fitzpatrick Institute for Photonics, 7th Annual Meeting in Durham, NC, October 11, 2007.
The CCNY based post-doc. Dr. Maria Vega Canamares attended the LACONA VII Conference (Laser for the Conservation of Artworks) in September 2007. At the conference Dr. Canamares not only learned about other applications of SERS to the analysis of dyes, but she was able to discuss the work of this project and how evolving techniques in art conservation might also apply to direct analysis of dyes on substrates such as paper.
“From Art and Archaeology to Forensic Science: Surface-Enhanced Raman Scattering as an Analytical Tool” (Dr. Marco Leona and Dr. John R. Lombardi) was presented at the Boston National Meeting of the American Chemical Society, August 23, 2007.
On August 21, 2007, the Principal Investigator and NYPD Forensic consultant, Philip Antoci, hosted a tour of the NYPD Crime Laboratory in Jamaica, Queens. Several of the projects graduate and undergraduate students were in attendance as well as post-doc Maria Vega Canamares.
Attend IRUG-8 Conference Vienna, March 2008. John Lombardi and MariaVega Canamares. Talk: Raman and Surface Enhanced Raman Spectra of 7 and 3’,4’ Hydroxyflavone”
Award Number 2006-DN-BX-K034 143 of 146
This document is a research report submitted to the U.S. Department of Justice. This report has not been published by the Department. Opinions or points of view expressed are those of the author(s)
and do not necessarily reflect the official position or policies of the U.S. Department of Justice.

2. Publications Resulting from this Award Published or Accepted for Publication:
1. “Raman and Surface Enhanced Raman Scattering of 3-Hydroxyflavone”, Minfa Wang, Tatyana Teslova, Fen Xu, John R. Lombardi, Ronald L. Birke, and Marco Leona, J. Phys. Chem.C, 111, 3044-3052 (2007).
2. “Raman and Surface Enhanced Raman Spectra of Flavone and Several Hydroxy- Derivatives”, Tatyana Teslova, Charlie Corredor, Richard Livingstone, Tudor Spataru, Ronald Birke, John R. Lombardi, Maria Vega Canamares, and Marco Leona, J. Raman Spectroscopy, 38, 802-818 (2007). DOI:10.1002/jrs.1695.
3. “Time Resolved Surface Enhanced Raman Scattering Studies of 3-hydroxyflavone on a Ag Electrode”, Minfa Wang, Tudor Spataru, John R. Lombardi, Ronald L. Birke, J. Phys. Chem. C, 111, 3038-3043 (2007).
4. “Time-Dependent Picture of the Charge-Transfer Contributions to Surface Enhanced Raman Spectroscopy”, John R. Lombardi and Ronald L. Birke, J. Chem. Phys. 126, 244709 (2007).
5. “Identification of Berberine in Archaeological Textiles by Surface Enhanced Raman Spectroscopy”, Marco Leona, John R. Lombardi, J. Raman Spec. 38, 853-858 (2007). DOI:10.1002/jrs.1726.
6. “ZnO Nanoparticle Size-dependent Excitation of Surface Raman Signal from Adsorbed Molecules: Observation of a Charge-Transfer Resonance”, Zhihua Sun, Bing Zhao, John R. Lombardi, Appl. Phys. Lett., 91,221106 (2007).
7. “Effect of Fluence on the Discoloration of Marble Cleaned with UV Lasers”; Jie Zhang, Andrew J. Birnbaum, Y. Lawrence Yao, Fen Xu, John R. Lombardi, Applied Surface Science, 253, 3083-3092 (2007). DOI: 10.1016/j.apsusc.2006.06.056
8. “Raman Scattering Study of Molecules Adsorbed on ZnS Nanocrystals”, Yanfei Wang, Zhihua Sun, Hailong Hu, Shengyu Jing, Bing Zhao, Weiqing Xu, Chun Zhao, John R. Lombardi, J. Raman Spectroscopy, 38, 34-38 (2007).
9. “Mechanism and Prediction of Laser Wet Cleaning of Marble Encrustation”, John R. Lombardi, Fen Xu, Y. Lawrence Yao, Jie Zhang, Proceedings of ICALEO Conference, November, 2006.
10. “Surface Enhanced Raman Scattering on Mercaptopyridine-Capped CdS Microclusters”, Y. Wang, Z. Sun., Y. Wang, H. Hu, B. Zhao, W. Xu, J.R. Lombardi, Spectrochimica Acta A., 66A, 1199-1203 (2007).
Award Number 2006-DN-BX-K034 144 of 146
This document is a research report submitted to the U.S. Department of Justice. This report has not been published by the Department. Opinions or points of view expressed are those of the author(s)
and do not necessarily reflect the official position or policies of the U.S. Department of Justice.
11. “ Enhanced Raman Scattering as a Probe for 4-Mercaptopyridine Surface-modified Copper Oxide Nanocrystals”, Yanfei Wang, Hailong Hu, Shengyu Jing, Yunxin Wang, Zhihua Sun, Bing Zhao, Chun Zhao, John R. Lombardi, Analytical Sciences, 23, 787 (2007).
12. “Photoinduced Shape Evolution: From Triangular to Hexagonal Silver Nanoplates” Jing An, Bin Tang, Xiaohua Ning, Ji Zhou, Shupng Xu, Bing Zhao, Weiqing Xu, Charlie Corredor, John R. Lombardi, J. Phys. Chem. C., 111, 18055-18059, (2007).
13. “ Laser-Induced Growth of Monodisperse Silver Nanoparticles with Tunable SPR Properties and Wavelength Self-Limiting Effect”, Xianliang Zheng, Weiqing Xu, Charlie Corredor, Shuping Xu, Jing An, Bing Zhao, John R. Lombardi, J. Phys. Chem. C, 111, 14962-14967, (2007).
14. “Mercaptopyridine Surface-Functionalized CdTe Quantum Dots: SERS Activity”, Yanfei Wang, Junhu Zhang, Huiying Jia, Minjie Li, Jianbo Zeng, Bai Yang, Bing Zhao, Weiqing Xu, John R. Lombardi, J. Phys. Chem.C, 112, 996-1000 (2008).
15. “Surface-Enhanced Raman Scattering Study of the Red Dye Laccaic Acid” M.V. Cañamares and M. Leona. J. Raman Spectroscopy, 38, 1259-1266 (2007).
16. “Study of Laccaic Acid and Other Natural Anthraquinone Dyes by Surface-Enhanced Raman Spectroscopy” M.V. Cañamares and M. Leona. Accepted for publication in Proceedings of Lacona VII.
17. “Raman and Surface Enhanced Raman Spectra of Chrysin, Apigenin and Luteolin” Charlie Corredor, Tatyana Teslova, Zhanguo Chen, Jie Zhang, Maria Vega Cañamares, John R. Lombardi and Marco Leona. (in press Journal of Raman spectroscopy)
18. “Surface-Enhanced Raman Scattering of Protoberberine Alkaloids” Maria Vega Cañamares, John R. Lombardi and Marco Leona. (in press Vibrational Spectroscopy 2009).
19. “Raman and Surface Enhanced Raman Spectra of 7 and 3’,4’ Hydroxyflavone” Maria Vega Cañamares, John R. Lombardi, Marco Leona, Submitted, Journal of ePreservationScience (Proceedings of the IRUG-8, Vienna Austria, Conference, 2008 in press.
20. “ Determination of the Degree of Charge-Transfer Contributions to Surface Enhanced Raman Spectroscopy”, Cat Chenal, Ronald L. Birke, and John R. Lombardi, Chem. Phys. Chem. (2008), 1617, DOI:10.1002/cphc.200800221.
21. “Growth of Tetrahedral Silver Nanocrystals in Aqueous Solution and Their SERS Enhancement”, Ji Zhou, Jing An, Bin Tang, Shuping Xu,
Award Number 2006-DN-BX-K034 145 of 146
This document is a research report submitted to the U.S. Department of Justice. This report has not been published by the Department. Opinions or points of view expressed are those of the author(s)
and do not necessarily reflect the official position or policies of the U.S. Department of Justice.
Yanxin Cao, Bing Zhao, Weiqing Xu, Jingjing Chang, John R. Lombardi, Langmuir, (2008), 24, 10407.10.1021/la800961j.
22. A Unified Approach to Surface Enhanced Raman Spectroscopy”, John R. Lombardi, Ronald L. Birke, J. Phys. Chem. C, 112 (14), 5605 -5617, (2008). 10.1021/jp800167v
23. “Direct Observation of Surface-Enhanced Raman Scattering in ZnO Nanocrystals”, Y. Wang, Y. Wang, J. Zhang, H. Hu, J. Zhang, B. Zhao, B. Yang, J.R. Lombardi, J. Raman Spect., in press (2009).
In Preparation:
1. Surface-Enhanced Raman Spectroscopy for Trace Identification of Controlled Substances: Morphine, Codeine, and Hydrocodone, Vinesh Rana, Maria Vega Cañamares, Thomas Kubic, Marco Leona, John R. Lombardi, Submitted for publication, Journal of Forensic Sciences.
2. “Application of Surface-Enhanced Raman Scattering to the Detection of Representative Ink Dyes” Irina Geiman, Maria Vega Cañamares, Marco Leona and John R. Lombardi. (in press Journal of Forensic Sciences, June 2009)
3. “A Non-Destructive Approach for the Identification of Organic Colorants by Surface Enhanced Raman Scattering: Hydrogel Matrix Transfer” Marco Leona (to be submitted to Analytical Chemistry)
4. “Inkjet Colloid Deposition as an Aid in the Microanalytical Application of SERS” Marco Leona, Dario Benedetti and Jie Zhang. (to be submitted to Analytical Chemistry)
5. “Detection of Forgeries by Surface-Enhanced-Raman Scattering” Maria Vega Cañamares, Alessa Gambardella and Marco Leona. (to be submitted to Journal of Raman Spectroscopy).
6. “TLC-SERS of Mauve, the First Synthetic Dye” Maria Vega Cañamares, David Reagan and Marco Leona. (to be submitted to Journal of Raman Spectroscopy)
Award Number 2006-DN-BX-K034 146 of 146
This document is a research report submitted to the U.S. Department of Justice. This report has not been published by the Department. Opinions or points of view expressed are those of the author(s)
and do not necessarily reflect the official position or policies of the U.S. Department of Justice.