Embed Size (px)
Citation preview

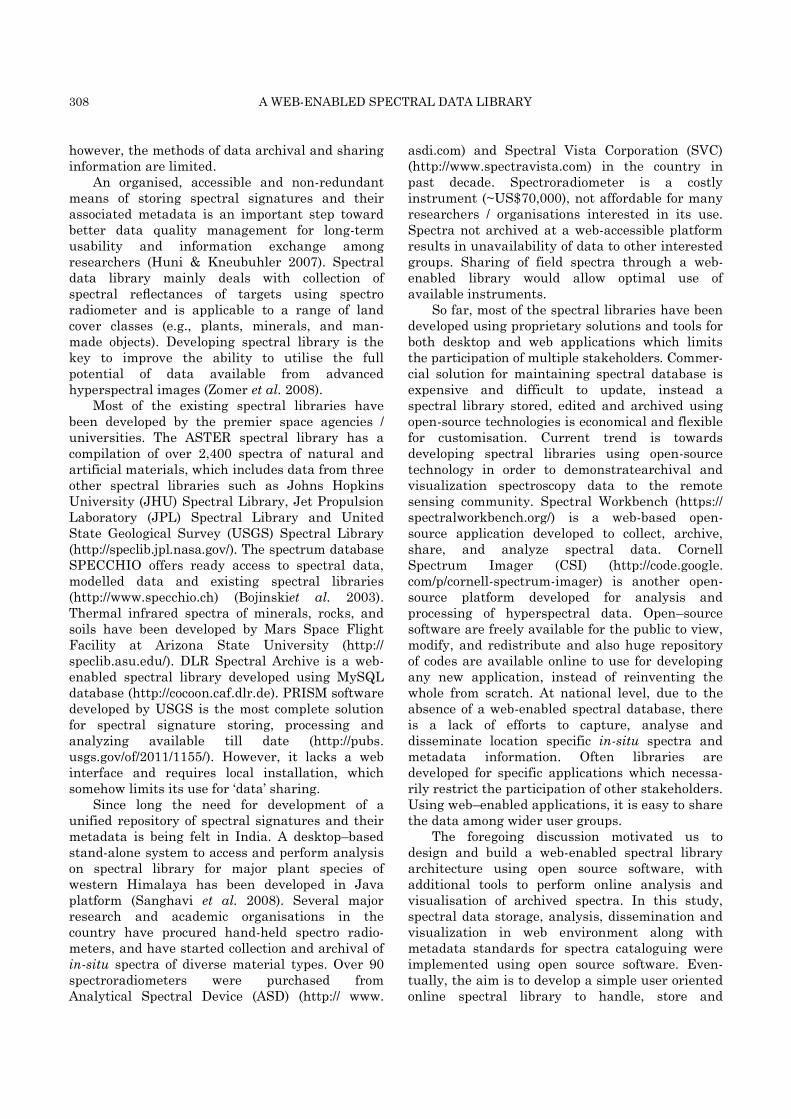
Tropical Ecology 58(2): 307–314, 2017 ISSN 0564-3295 © International Society for Tropical Ecology www.tropecol.com
Development of a web–enabled spectral data archival, visualisation and analysis architecture for tropical phytodiversity inventory
HITENDRA PADALIA1*
, KAMAL PANDEY2 & R. A. ARUMUGAM
1
1Forestry and Ecology Department, Indian Institute of Remote Sensing, ISRO,
Dehradun 248001, India 2Remote Sensing and Geoinformatics Group, Indian Institute of Remote Sensing, ISRO,
Dehradun 248001, India
Abstract: The tropical ecosystems constitute a rich array of plant species. The
identification and discrimination of varieties of plant species using remote sensing techniques,
particularly imaging spectroscopy demands conceptualization and development of a web-
enabled spectral library architecture. In this study, a web-accessible spectral data archival,
visualisation and analysis architecture has been developed using open-source software. It is a 3-
tier architecture consisting of the client interface, the application server and the database
server. Spectral signatures have been archived in a relational database management system
which can be viewed and shared along with the related metadata descriptions such as sensor
specifications, target details, observation geometry, field photograph, geolocation in ‘Bhuvan’
geoportal, collector details, etc. The online spectral data analysis such as averaging, resampling,
continuum removal, spectral matching, derivative spectra and spectral indices have been
demonstrated with appropriate examples for vegetation studies. The web-enabled feature may
encourage researchers, academicians and operational users of Earth observation data to use it
for the archival, organisation, analysis, long-term use and exchange of their field spectra.
Key words: Hyperspectral remote sensing, open-source, plant diversity, spectral analysis, spectral library.
Handling Editor: Sunil Kumar
Introduction
The tropical ecosystems encompass a rich array of plant species. Conventionally, species discrimination for floristic mapping involved exhaustive field work and is time-consuming and expensive (Kent & Coker 1992). Remote sensing is advantageously used in such a situation to discriminate different species based on their unique spectral properties that are attributed to species’ biochemical and biophysical characte-ristics (Clark et al. 2005; Gajendra et al. 2015). The narrow bands of imaging spectroscopy data (350 nm to 2500 nm) can resolve subtle differences
in the spectral signatures of plant species and help in their identification and mapping (Féret & Asner 2013; George et al. 2015; Krishnayya et al. 2015).
Spectral signatures make a useful source of information to understand reflective properties of plant species along with the underlying physical and biological phenomena. Spectral signatures are used for calibration, validation and simulation of imaging spectroscopy data, predicting the pigment concentrations in foliage, as a reference signature for spectral matching, and choice of wave bands for sensors (Joseph 2005). A large number of spectral signatures are collected using spectro radiometers in various remote sensing field campaigns;
*Corresponding Author; e-mail: [email protected]
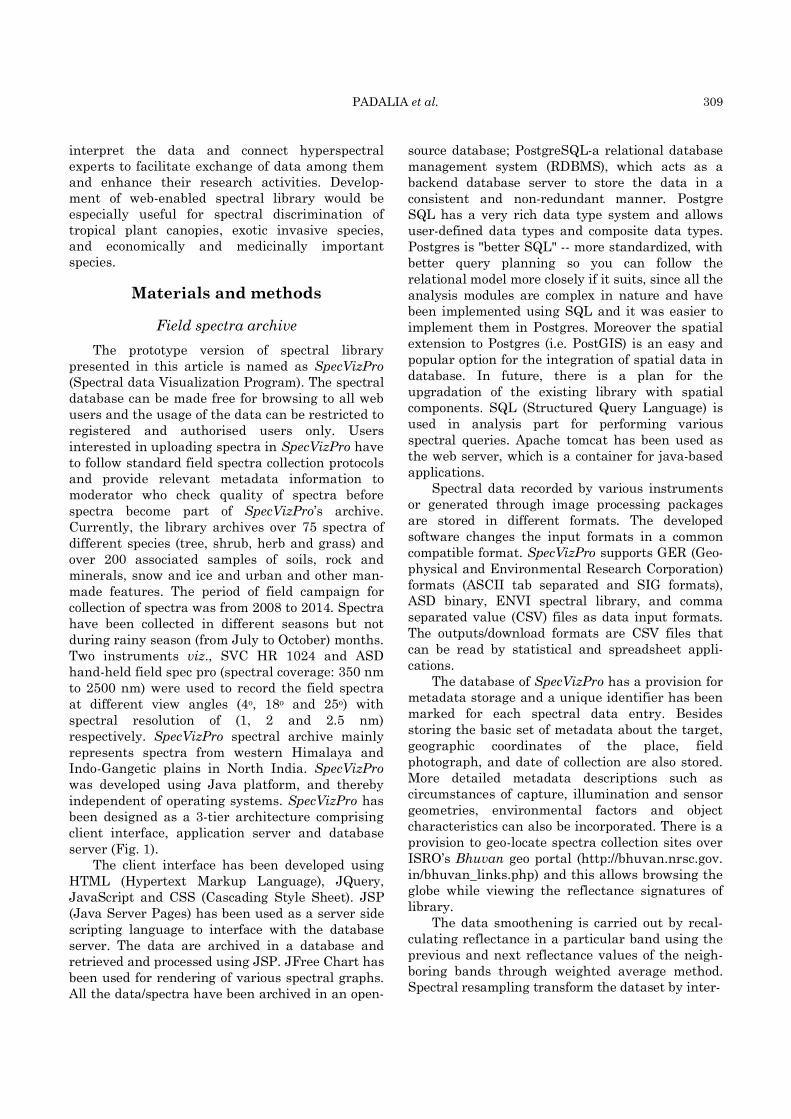
308 A WEB-ENABLED SPECTRAL DATA LIBRARY
however, the methods of data archival and sharing information are limited.
An organised, accessible and non-redundant means of storing spectral signatures and their associated metadata is an important step toward better data quality management for long-term usability and information exchange among researchers (Huni & Kneubuhler 2007). Spectral data library mainly deals with collection of spectral reflectances of targets using spectro radiometer and is applicable to a range of land cover classes (e.g., plants, minerals, and man-made objects). Developing spectral library is the key to improve the ability to utilise the full potential of data available from advanced hyperspectral images (Zomer et al. 2008).
Most of the existing spectral libraries have been developed by the premier space agencies / universities. The ASTER spectral library has a compilation of over 2,400 spectra of natural and artificial materials, which includes data from three other spectral libraries such as Johns Hopkins University (JHU) Spectral Library, Jet Propulsion Laboratory (JPL) Spectral Library and United State Geological Survey (USGS) Spectral Library (http://speclib.jpl.nasa.gov/). The spectrum database SPECCHIO offers ready access to spectral data, modelled data and existing spectral libraries (http://www.specchio.ch) (Bojinskiet al. 2003). Thermal infrared spectra of minerals, rocks, and soils have been developed by Mars Space Flight Facility at Arizona State University (http:// speclib.asu.edu/). DLR Spectral Archive is a web-enabled spectral library developed using MySQL database (http://cocoon.caf.dlr.de). PRISM software developed by USGS is the most complete solution for spectral signature storing, processing and analyzing available till date (http://pubs. usgs.gov/of/2011/1155/). However, it lacks a web interface and requires local installation, which somehow limits its use for ‘data’ sharing.
Since long the need for development of a unified repository of spectral signatures and their metadata is being felt in India. A desktop–based stand-alone system to access and perform analysis on spectral library for major plant species of western Himalaya has been developed in Java platform (Sanghavi et al. 2008). Several major research and academic organisations in the country have procured hand-held spectro radio-meters, and have started collection and archival of in-situ spectra of diverse material types. Over 90 spectroradiometers were purchased from Analytical Spectral Device (ASD) (http:// www.
asdi.com) and Spectral Vista Corporation (SVC) (http://www.spectravista.com) in the country in past decade. Spectroradiometer is a costly instrument (~US$70,000), not affordable for many researchers / organisations interested in its use. Spectra not archived at a web-accessible platform results in unavailability of data to other interested groups. Sharing of field spectra through a web-enabled library would allow optimal use of available instruments.
So far, most of the spectral libraries have been developed using proprietary solutions and tools for both desktop and web applications which limits the participation of multiple stakeholders. Commer-cial solution for maintaining spectral database is expensive and difficult to update, instead a spectral library stored, edited and archived using open-source technologies is economical and flexible for customisation. Current trend is towards developing spectral libraries using open-source technology in order to demonstratearchival and visualization spectroscopy data to the remote sensing community. Spectral Workbench (https:// spectralworkbench.org/) is a web-based open-source application developed to collect, archive, share, and analyze spectral data. Cornell Spectrum Imager (CSI) (http://code.google. com/p/cornell-spectrum-imager) is another open-source platform developed for analysis and processing of hyperspectral data. Open–source software are freely available for the public to view, modify, and redistribute and also huge repository of codes are available online to use for developing any new application, instead of reinventing the whole from scratch. At national level, due to the absence of a web-enabled spectral database, there is a lack of efforts to capture, analyse and disseminate location specific in-situ spectra and metadata information. Often libraries are developed for specific applications which necessa-rily restrict the participation of other stakeholders. Using web–enabled applications, it is easy to share the data among wider user groups.
The foregoing discussion motivated us to design and build a web-enabled spectral library architecture using open source software, with additional tools to perform online analysis and visualisation of archived spectra. In this study, spectral data storage, analysis, dissemination and visualization in web environment along with metadata standards for spectra cataloguing were implemented using open source software. Even-tually, the aim is to develop a simple user oriented online spectral library to handle, store and
PADALIA et al. 309
interpret the data and connect hyperspectral experts to facilitate exchange of data among them and enhance their research activities. Develop-ment of web-enabled spectral library would be especially useful for spectral discrimination of tropical plant canopies, exotic invasive species, and economically and medicinally important species.
Materials and methods
Field spectra archive
The prototype version of spectral library presented in this article is named as SpecVizPro (Spectral data Visualization Program). The spectral database can be made free for browsing to all web users and the usage of the data can be restricted to registered and authorised users only. Users interested in uploading spectra in SpecVizPro have to follow standard field spectra collection protocols and provide relevant metadata information to moderator who check quality of spectra before spectra become part of SpecVizPro’s archive. Currently, the library archives over 75 spectra of different species (tree, shrub, herb and grass) and over 200 associated samples of soils, rock and minerals, snow and ice and urban and other man-made features. The period of field campaign for collection of spectra was from 2008 to 2014. Spectra have been collected in different seasons but not during rainy season (from July to October) months. Two instruments viz., SVC HR 1024 and ASD hand-held field spec pro (spectral coverage: 350 nm to 2500 nm) were used to record the field spectra at different view angles (4o, 18o and 25o) with spectral resolution of (1, 2 and 2.5 nm) respectively. SpecVizPro spectral archive mainly represents spectra from western Himalaya and Indo-Gangetic plains in North India. SpecVizPro was developed using Java platform, and thereby independent of operating systems. SpecVizPro has been designed as a 3-tier architecture comprising client interface, application server and database server (Fig. 1).
The client interface has been developed using HTML (Hypertext Markup Language), JQuery, JavaScript and CSS (Cascading Style Sheet). JSP (Java Server Pages) has been used as a server side scripting language to interface with the database server. The data are archived in a database and retrieved and processed using JSP. JFree Chart has been used for rendering of various spectral graphs. All the data/spectra have been archived in an open-
source database; PostgreSQL-a relational database management system (RDBMS), which acts as a backend database server to store the data in a consistent and non-redundant manner. Postgre SQL has a very rich data type system and allows user-defined data types and composite data types. Postgres is "better SQL" -- more standardized, with better query planning so you can follow the relational model more closely if it suits, since all the analysis modules are complex in nature and have been implemented using SQL and it was easier to implement them in Postgres. Moreover the spatial extension to Postgres (i.e. PostGIS) is an easy and popular option for the integration of spatial data in database. In future, there is a plan for the upgradation of the existing library with spatial components. SQL (Structured Query Language) is used in analysis part for performing various spectral queries. Apache tomcat has been used as the web server, which is a container for java-based applications.
Spectral data recorded by various instruments or generated through image processing packages are stored in different formats. The developed software changes the input formats in a common compatible format. SpecVizPro supports GER (Geo-physical and Environmental Research Corporation) formats (ASCII tab separated and SIG formats), ASD binary, ENVI spectral library, and comma separated value (CSV) files as data input formats. The outputs/download formats are CSV files that can be read by statistical and spreadsheet appli-cations.
The database of SpecVizPro has a provision for metadata storage and a unique identifier has been marked for each spectral data entry. Besides storing the basic set of metadata about the target, geographic coordinates of the place, field photograph, and date of collection are also stored. More detailed metadata descriptions such as circumstances of capture, illumination and sensor geometries, environmental factors and object characteristics can also be incorporated. There is a provision to geo-locate spectra collection sites over ISRO’s Bhuvan geo portal (http://bhuvan.nrsc.gov. in/bhuvan_links.php) and this allows browsing the globe while viewing the reflectance signatures of library.
The data smoothening is carried out by recal-culating reflectance in a particular band using the previous and next reflectance values of the neigh-boring bands through weighted average method. Spectral resampling transform the dataset by inter-

310 A WEB-ENABLED SPECTRAL DATA LIBRARY
PostGre SQL
Database
Spectral Data Library
Architecture
Modules
Averaging
Data Smoothing
Resampling
Continuum Removal
Derivative Spectra Red Edge Analysis Spectral Angle Mapper Spectral Indices Geo-Visualization
Java Virtual Machine (JRE 1.6)
Sensor details Target details Field photograph Geo-location Site conditions ......................
Internet/Intranet Client/User
Request
Response
Webserver
(Apache Tomcat)
User Information
Log Information
Metadata
c
Database Layer
Internet Layer
Application Layer
Fig. 1. Schematic representation of SpecVizPro architecture.
Fig. 2. SpecVizPro portal Graphic User Interface.
polating the spectrally provided data and line up the exact changes in shifted data (eq. 1):
……………..........……..(1)
Where, = the current wavelength band i;
= the total number of wavelength bands The continuum (eq. 2 and eq. 3) is the
background absorption onto which other absorption features are superimposed which may be the wing of a large absorption feature:

PADALIA et al. 311
……………….........…………….(2)
………………………........……..(3)
Whereas, = Band depth, = Continuum -removed reflectance, = Normalized band depth,
= Band depth at the center (Kokaly & Clark 1999).
Derivative spectroscopy uses first or higher derivatives of absorptance with respect to wave length for qualitative and quantitative analy-sis. Derivatives were shown to be less sensi-tive to variations of soil background, illumination, and surface albedo (Demetriades- Shah et al.1990). The First Derivative Reflectance (FDR) and Second Derivative Reflectance (SDR) were calculated according to the eq. (4) and eq. (5):
……………….....….(4)
…….…..…..(5)
Where, = The FDR between band j and band j+1, where wave length equals to i; = The SDR between band j and band j+2, where wavelength equals to i; , , = Reflectance of band j, j+1, j+2; = Difference of wavelength between band j and band j+1.
Red-edge represents the region of abrupt change in leaf reflectance between 680-780 nm caused by the strong chlorophyll absorption in the red wavelength and high reflectance in the near infrared wave lengths due to intermediate scatte-ring (Horler et al. 1983). The linear four-point interpolation method assumes that the reflectance curve at the red–edge can be simplified to a straight line centered near the mid-point between the reflectance in the NIR at about 780 nm and the reflectance minimum of the chlorophyll absorption feature at about 670 nm (Guyot & Baret 1988). Red-edge position is a two-step process. In the first step, reflectance at the infection point (Rre) is calculated (eq. 5):
/2………...……………..(6)
Where, R is the reflectance. In second step, red edge wavelength or red–
edge position (REP) is calculated (eq. 6):
……………...……..(7)
Where 700 and 40 are constants resulting from interpolation in the 700-740 nm interval.
The Spectral Angle Mapper (SAM) algorithm generalizes geometric interpretation to nb -dimensional space. It determines the similarity of an unknown spectrum to a reference spectrum r,
by applying the following equation (CSES 1992) (eq. 8):
………...…(8)
User can upload their spectra into SpecVizPro and can calculate spectral similarity with reference spectra in the library.
Vegetation Indices (VIs) are combinations of surface reflectance at two or more wavelengths designed to highlight a particular property of vegetation. Table 1 has a list vegetation indices currently implemented in the library.
It also allows user to define custom made spectral indices. SpecVizPro also contains online help and user manual which describe step by step procedures for the execution of various operations.
Results and Discussion
The application server of SpecVizPro consists of three modules viz., visualization, analysis and spectral archive. Visualization deals with display of spectra in the form of graphs. This module provides option to the user to select individual or multiple target spectra, the selected spectra are fetched from the relational database and displayed as graph for visual inspection (Fig. 2). The second module, i.e. Analysis provides tools to perform various spectral operations like data smoothing for noise removal, data averaging, resampling for narrowband to broadband conversion, continuum removal, generation of derivative spectra, red-edge analysis and computation of spectral indices, etc. using SQL. The third module, i.e. Spectral Archive handles repository of available spectra in the library and allows authorized user to upload spectra into the database along with metadata and also downloading of desired reference spectra and derived information products.
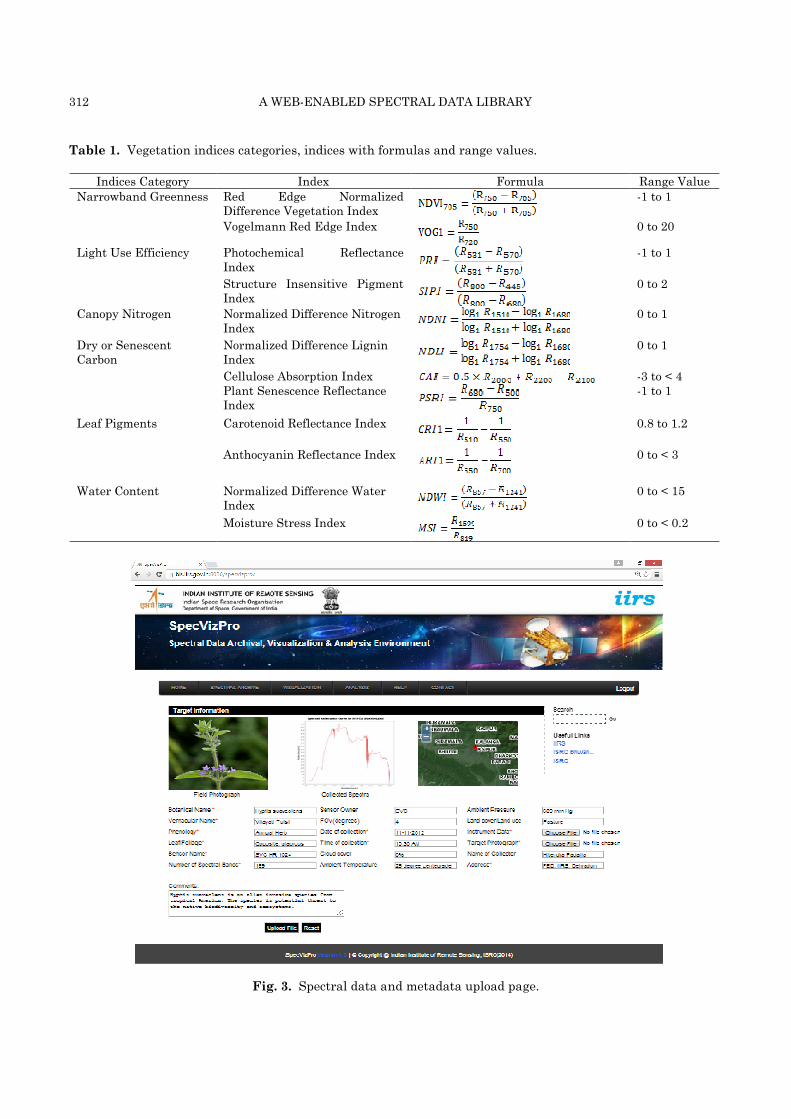
The graphic user interface of SpecVizPro provides upload and download facility besides performing other operations including help through menus and sub-menus (Fig. 3). The database can incorporate all sources of signature data, including spectra collected in laboratory, field radiometers and imaging spectrometers.
User can access all the archived spectra and view single or multiple spectra (Fig. 4a). Data resampling includes averaging narrow bands spectra as per specified waveband intervals (Fig. 4b). Fig. 4b shows how in-situ spectrum of Quercusleucotricophora (banj oak) at 1-nm was averaged to 10-nm and compared with Hyperion
312 A WEB-ENABLED SPECTRAL DATA LIBRARY
Table 1. Vegetation indices categories, indices with formulas and range values.
Indices Category Index Formula Range Value
Narrowband Greenness Red Edge Normalized Difference Vegetation Index
-1 to 1
Vogelmann Red Edge Index
0 to 20
Light Use Efficiency Photochemical Reflectance Index
-1 to 1
Structure Insensitive Pigment Index
0 to 2
Canopy Nitrogen Normalized Difference Nitrogen Index
0 to 1
Dry or Senescent Carbon
Normalized Difference Lignin Index
0 to 1
Cellulose Absorption Index -3 to < 4 Plant Senescence Reflectance Index
-1 to 1
Leaf Pigments Carotenoid Reflectance Index
0.8 to 1.2
Anthocyanin Reflectance Index
0 to < 3
Water Content Normalized Difference Water Index
0 to < 15
Moisture Stress Index
0 to < 0.2
Fig. 3. Spectral data and metadata upload page.

PADALIA et al. 313
(a) Visualisation of spectral reflectance curves of multiple
species (Murrayakoenighii, Hyptissuaveolensand Partheniumhysterophorus)
(b) In-situ collected Quercusleucotricophora spectrum (1 nm) resampled to Hyperion image derived canopy
spectra (10 nm) of Quercusleucotricophora
(c) Continuum removed absorption spectra of
Murrayakoenighii, Hyptissuaveolens and Partheniumhysterophorus.
(d) 1st and 2nd order derivative spectra calculation of selected species
(e) Calculation of red edge infection point (REIP) (% reflectance) and red-edge wavelength (nm) using linear interpolation method for selected species.
(f) Comparison of selected spectra with all the spectra in database and calculating spectral angle values for all the species
Fig. 4. Spectral analysis tools provided in SpecVizPro.
image derived spectrum at 10-nm. Fig. 4c shows how the use of continuum removal can diffe-rentiate spectrally similar species, i.e. Murraya-koenighii (karipatta) (a native shrub in sal forests in Doon valley) and Hyptissuaveolens (vilayati tulsi) and Partheniumhysterophorus (congress grass) (alien invasive herb) in post-monsoon season. Fig. 4d shows 1st and 2nd derivative spectra of selected species and their spectral separability in distinctive absorption regions. Fig. 4e shows differences in red-edge position for
different plant species. Fig.4f depicts computation of spectral similarity values between user uploaded spectra into SpecVizPro and reference spectra in the library using SAM (Spectral Angle Mapper). User can compute a range of spectral indices related to various physio-chemical pro-perties of feature types, and can compare and evaluate the sensitivity of different spectral indices.
The use of SpecVizProas a distance learning tool could help in dissemination of knowledge on

314 A WEB-ENABLED SPECTRAL DATA LIBRARY
processing, analysis and interpretation of in-situ spectral data. The future work would involve inclusion of calibration data to provide error estimates of spectral signatures, defining generic data exchange formats and expanding database through crowd sourcing tools. We plan to develop a computer application with all SpecVizPro functio-nality which could be made available in smart-phones.
Conclusions
In this study, development of a web-enabled spectral library architecture has been demon-strated to archive and visualize spectroscopy data using open–source software. Developed in an open-source environment, SpecVizPro allows customi-zation and integration of newer spectral tools as per requirement and application, and making them available to other user groups through its online interface. Being a distributed and dynamic database, library is concurrently accessible to a large numbers of web users. The web-enabled feature may encourage researchers, academicians and operational users of earth observation data to use it for the archival, organisation, analysis, long-term use and exchange of their field spectra, and contribute towards synergizing the development of a comprehensive spectral database covering a variety of earth surface feature types of different geographic regions.
Acknowledgements
Authors are grateful to Dr. Y. V. N. Krishna Murthy, Director, Indian Institute of Remote Sensing (IIRS), and Dr. S. P. S. Kushwaha, Head, Forestry and Ecology Department, IIRS (ISRO) for encouragement and support.
References
Bojinski, S., M. Schaepman, D. Schlapfer & K. Itten.
2003. SPECCHIO: a spectrum database for remote
sensing applications. Computer & Geosciences 29:
27-38.
Center for the Study of Earth from Space (CSES). 1992.
SIPS User's Guide, The Spectral Image Processing
System. ver. 1.1, University of Colorado, Boulder.
Clark, M. L., D. A. Roberts & D. B. Clark. 2005. Hyper-
spectral discrimination of tropical rain forest tree
species at leaf to crown scales. Remote Sensing of
Environment 96: 375-398.
Demetriades-Shah, T. H., M. D. Steven & J. A. Clark.
1990. High resolution derivative spectra in remote
sensing. Remote Sensing of Environment 33: 55-64.
Féret, J. & G. P. Asner. 2013. Tree species discrimi-
nation in tropical forests using airborne imagine
spectroscopy. IEEE Transactions of Geosciences &
Remote Sensing 51: 73-84.
George, R., Hitendra, P. & S. P. S. Kushwaha. 2014.
Forest tree species discrimination in western
Himalaya using EO-1 Hyperion. International
Journal of Applied Earth Observation and Geo-
information 28: 140-149.
Guyot, G. & F. Baret. 1988. Utilisation de la Haute
Resolution Spectrale Pour Suivrel'etat des Couverts
Vegetaux. pp. 279-286. Proceedings of the 4th
International colloquim on spectral signatures of
objects in remote sensing. ESA SP-287, Assois,
France.
Horler, D. N. H., M. Dockray & J. Barber. 1983. The red
edge of plant reflectance. International Journal of
Remote Sensing 4: 273-288.
Huni, A. & M. Kneubuhler. 2007. SPECCHIO: a system
for storing and sharing spectroradiometer data.
SPIE Newsroom, DOI 10.1117/2.1200711.0956.
Joseph, G. 2005. Fundamentals of Remote Sensing.
Universities Press.
Kokaly, R. F. & R. N. Clark. 1999. Spectroscopic deter-
mination of leaf biochemistry using band-depth
analysis of absorption features and stepwise
multiple linear regression. Remote Sensing of
Environment 67: 267-287.
Kent, M. & P. Coker. 1992. Vegetation Description and
Analysis: A Practical Approach. Wiley, Chichester,
UK.
Krishnayya, H. S. R., B. Christian, D. Vyas, M. Saini, M.
Joshi, K. R. Manjunath, T. Kumar, H. Padalia, R.
George & S. P. S. Kushwaha. 2015 Monitoring of
forest cover in India : imaging spectroscopy. Current
Science 108: 869–878.
Sanghavi, C., S. S. Ray & R. B. Singh. 2008. A software
tool for reflectance spectra analysis.Journal of
Indian Society of Remote Sensing 11: 129-137.
Singh, I. D., G., H. Padalia, R. R. Bharti & G. S. Rawat.
2016. Spatial extent and conservation status of Banj
oak (Quereus lecotrichophora A. Camus) Forests in
Uttarakhand, Wester Himalaya. Tropical Ecology
57: 255–262.
Zomer, R. J., A. Trabucco & S. L. Ustin. 2008. Building
spectral libraries for wetlands land cover classi-
fication and hyperspectral remote sensing. Journal
of Environment Management 90: 2170-2177.
(Received on 11.05.2015 and accepted after revisions, on 02.08.2016)