Embed Size (px)
Citation preview

The 33st International Electric Propulsion Conference, The George Washington University, USA
October 6 – 10, 2013
1
Development of a ToF setup with an ion-guide for
characterization of electrospray microthrusters IEPC-2013-413
Presented at the 33rd International Electric Propulsion Conference,
The George Washington University • Washington, D.C. • USA
October 6 – 10, 2013
Subha Chakraborty1 Simon Dandavino
2, Caglar Ataman
3, Daniel G. Courtney
4
and Herbert Shea5
Ecole Polytechnique Fédérale de Lausanne (EPFL), Neuchatel, 2002, Switzerland
Abstract: Electrospray microthrusters are a very promising micro-propulsion system
which can potentially provide very high specific impulse (Isp ~ 3000s). In this paper, we
report on the development of a time-of-flight (ToF) measurement setup for characterization
of the spray composition of the electrospray sources. This setup consists of an electrostatic
ion-guide built with 13 cascaded single-stage Einzel lenses along with a 65 cm long flight tube
to focus the emitted charges on a Faraday cup detector. The distributed lens ensures a large
fraction of the emitted beam can be collected, even when the beam divergence is high.
Simulations of the focusing capabilities of the ion guide have been performed and are
compared with a single stage Einzel lens, with excellent agreement. The efficiency of the lens
has been characterized with microfabricated capillary electrospray devices and with
electrochemically etched tungsten needles.
Nomenclature
Isp = Specific impulse
ToF = Time of flight
q = Charge
m = Mass
EMI-BF4 = 1-ethyl-3-methylimidazolium tetrafluoroborate
SOI = Silicon-on-insulator
Vem = Extraction voltage
Vlens = Lens voltage
L = Length of flight tube
D = Diameter of the Faraday cup
Idet = Detected current
Iem = Emitted current
θdet = Detection half-angle
θem = Emission half-angle
d = Diameter of a lens electrode
l = Length of a lens electrode
DRIE = Deep reactive ion etching
1 PhD student, LMTS-IMT-EPFL, [email protected].
2 PhD student, LMTS-IMT-EPFL, [email protected].
3 Group Leader IMTEK (former post doc., LMTS), [email protected].
4 Post-doc, LMTS-IMT-EPFL, [email protected].
5 Professor, LMTS-IMT-EPFL, [email protected].

The 33st International Electric Propulsion Conference, The George Washington University, USA
October 6 – 10, 2013
2
Figure 1. Calculated variation of the percentage of emitted
current that can be detected and the flight time with the
length of the flight tube. (Vem = 1 kV, θem = 40o, D = 10 mm)
I.Introduction
IME of flight (ToF) mass spectrometers are analytical instruments that distinguish charged particles based on
their different velocities due to different charge (q) over mass (m) ratios. They measure the flight time of the
charges from which the q/m can be evaluated. In principle, ToF mass spectrometers do not have a lower limit of
resolution except for detectability of the measurement instrument1. In this paper, development of a ToF setup for
characterization of ion species emitted from electrospray sources is reported. The electrospray sources are
microfabricated on silicon-on-insulator (SOI) wafers for generating thrust for nano- and pico-satellites with a very
high specific impulse2. We have also used electrochemically sharpened and roughened tungsten needles
3, which
emits pure ions by electrospray, for characterization of the lens. The devices work on the principle of emitting
charged particles (ions/charged droplets) from the emitter filled/wetted with ionic liquids (e.g. EMI-BF4) by
applying a high extraction potential (typically ~ 12 kV) in high vacuum conditions (~ 106
Pa). Depending on the
extraction potential (Vem), geometry of the emitter device and environmental conditions, the devices can spray pure
ions (typically ~ 100 nA) or charged droplets (~ 1 µA) of positive and negative polarity2,3,4,5
. While pure ion
emission can potentially produce very high Isp, droplet emission results in low Isp but higher thrust.
The spray composition can be analyzed by distinguishing the ions from the droplets based on their q/m ratio by
ToF measurement. However, it has been observed that emission takes place over an emission half-angle up to
nearly5 40
o. It is also observed that the emitted charges may have a kinetic energy distribution among themselves
4.
In order to collect the q/m information from the emission, either a very large detector is required to be placed to
collect most of the emitted charges after travelling for a measurable flight time or the charges can be focused during
their flight by electrostatic lens on a small detector. Having a large detector after a long flight path requires a large
vacuum chamber while focusing on a small detector can reduce the size of the vacuum chamber for spraying.
Electrostatic Einzel lenses are usually made of three cylindrical electrodes6 with the central electrode at high voltage
and the other two at ground potential to deflect charges towards the axis of the lens. For a given lens voltage, the
focal length of the lens depends on the angle and kinetic energy of the charges and it is therefore difficult to focus
the entire emitted beam on the small detector for a given lens voltage unless the under-focused or over-focused
charges are further deflected using other lens stages.
In order to collect those dispersed charges, an electrostatic lens-system using 13 cascaded stages of single-stage
Einzel lenses has been designed and tested. This lens system sits inside a 0.65 m long and 70 mm inner-diameter
flight tube between the emitter and the detector. This lens system compensates for the under-focusing and over-
focusing in each stage from the previous stage and thus guides the charges over a wide emission angle and energy
spread on a small (~ 10 mm diameter) Faraday cup detector. Simulation shows that the ion-guide can perform
focusing of all charges within nearly 23o emission half-angle with respect to the axis of the lens and for a 40
o
emission half-angle5 the Faraday-cup can detect 30-35% of the charges if the lens voltage Vlens is set between
0.8×Vem and Vem.
In the next section, the design and performance simulation of the ion-guide is presented. In section III, the details
of the ToF setup are explained. In section IV, the experimental results are described.
II. Ion guide design
Since emission half-angle is nearly 40o, there
is a trade-off between the current collected in a
small detector and a long flight time. The flight
time ToF is given by the expression
√
(1)
where L is the length of the flight tube. The
current detected by a Faraday cup detector with
a diameter D is approximately given by
(
)
(2)
T

The 33st International Electric Propulsion Conference, The George Washington University, USA
October 6 – 10, 2013
3
Figure 2. (a) Schematic cross-section of a single-stage lens,
(b) Schematic of the ion-guide
where Iem is the emitted current, θdet is the half-angle subjected by the Faraday cup at the tip of the emitter given
by
(3)
θem is the emission half-angle. In the Fig. 1 the variation of the detected current and the ToF for the BF4ions are
shown as function of the length of the flight tube. It is assumed that the emission takes place uniformly with an
emission half-angle θem = 40o, Vem = 1000 V and the Faraday cup diameter is D = 10 mm. The plots show that if the
detector is placed away from the emitter, the flight time increases eliminating the requirement of very high
bandwidth of detection circuit; but the detected current is very low, requiring very high trans-impedance gain. On
the other hand, if the detector is placed close to the device, it detects significant amount of current but the flight time
is very low and a very high bandwidth is required for the detection circuit to detect and separate the flight times. For
example, if a detector is placed at 100 mm from the emitter, for pure ionic mode emission of 100 nA BF4
ions, the
detector receives only 500 pA current with a flight time 2.1 µs and detection with commercially available trans-
impedance amplifiers will not be possible unless the charges are focused on the detector with electrostatic lens to
increase the detection current.
In the design, a flight length of 0.65 m is chosen for 14 µs flight time of the BF4
ion at 1000 V emission voltage.
This length is chosen from a commercially available flight tube with inner diameter 70 mm so that square metallic
plates with 51 mm side commercially available from KimballPhysics7 can fit inside the tube without additional need
of aligning them to the axis of the tube. Simulation has been performed for the lens configuration with Simion ion
simulator using the commercially available dimensions from KimballPhysics7. First, simulation has been performed
for a single Einzel lens configuration with metallic plates with circular opening as grounded electrodes and
cylindrical structure as the deflecting electrode as shown in Fig. 2(a). In these simulations, the ratio of the number of
charges detected by the detector and the number of charges emitted is defined as Lens efficiency
(4)
and is plotted in Fig. 3 as a function of the
ratio of Vlens/Vem. It has been observed that the
cylindrical electrode with commercially
available d = 25 mm diameter and l = 25 mm
length can focus up to 10% of the emitted
charges on the 10 mm diameter detector at the
end of the ToF tube for Vlens/Vem = 0.875. It is
also observed that although nearly 40% of the
charges come out of the lens, nearly 75% of it
is either under-focused or over-focused
because of their large emission angle and they
don’t reach the detector as shown in Fig. 4(a).
In order to collect these dispersing charges,
the single stage lens with d = 25 mm and l =
25 mm is augmented by additional lens-stages
all along the length of the flight tube as shown
in Fig. 2(b) to compensate for the deflection of
the charges away from axis as opposed to the
single stage lens as shown in Fig. 4(b). These
stages comprise of grounded plate electrodes
and cylindrical high-voltage deflecting
electrodes at the same lens voltage as the first
stage with inner diameter 37.5 mm and length
37.5 mm.
As shown in Fig. 3, this ion-guide can focus 2535% of the total emitted charges with Vlens/Vem between 0.8 to
1.0. This suggests that for a lens voltage 800 V, the ToF setup can detect significant amount of charges with kinetic
energy spread between 800 V and 1000 V. However, these simulations are performed with the assumption that the
(a)
(b)

The 33st International Electric Propulsion Conference, The George Washington University, USA
October 6 – 10, 2013
4
Figure 4(a). Simulated ion trajectories in the Single lens case with Vem = 1000 V and Vlens = 800 V. d = 25
mm, l = 25 mm. Emission starts at the left end of the image and ions are detected on the right end.
Figure 4(b). Simulated ion trajectories in the Ion-guide case with Vem = 1000 V and Vlens = 800 V. d = 25
mm, l = 25 mm for the first stage, d = 37.5 mm, l = 37.5 mm for all the other stages.
Figure 3. Simulation of variation of the lens efficiency of
different Einzel lens configurations and of the ion-guide with
Vlens/Vem
Figure 5. Simulation of Variation of the lens Figure 6. Simulation of variation of the ToF
efficiency with Vlens/Vem correction
for different single stage lenses and the ion-guide factor with Vlens/Vem
emission current density is uniform over 40o half-angle. Since most of the current density is concentrated within 30
o
half-angle5, the efficiency can be higher in practice.
In Fig. 5, the variation of the maximum emission angle up to which the ion-guide can focus the charges on the
detector for different Vlens/Vem is shown. This shows that the ToF setup can focus all the charges within a half-angle
nearly 23o as opposed to only 10
o for the
single-stage lens.
Although the ion-guide can focus charges
over wider energy range and emission angle,
it has an effect of increasing the flight time
due to repeated deceleration stages all along
the flight tube. This delay can be
characterized by the ToF correction factor
defined here by
√
(5)
In Fig. 6, the simulated variation of the
ToF correction factor is plotted as function
of Vlens/Vem. As seen from the plots, for
Vlens/Vem = 0.8, where the ion-guide detects
maximum number of charges, the ToF
increases by a factor of 1.6 from its value
given by equation (1).
The 33st International Electric Propulsion Conference, The George Washington University, USA
October 6 – 10, 2013
5
Figure 7. Schematic of the complete ToF measurement setup
Figure 8. (a) The ToF setup with the spray
assembly and the ion-guide inside, detector on the
left-side end of the tube, (b) The ion-guide with
cascaded deflection and ground electrodes.
(b)
(a)
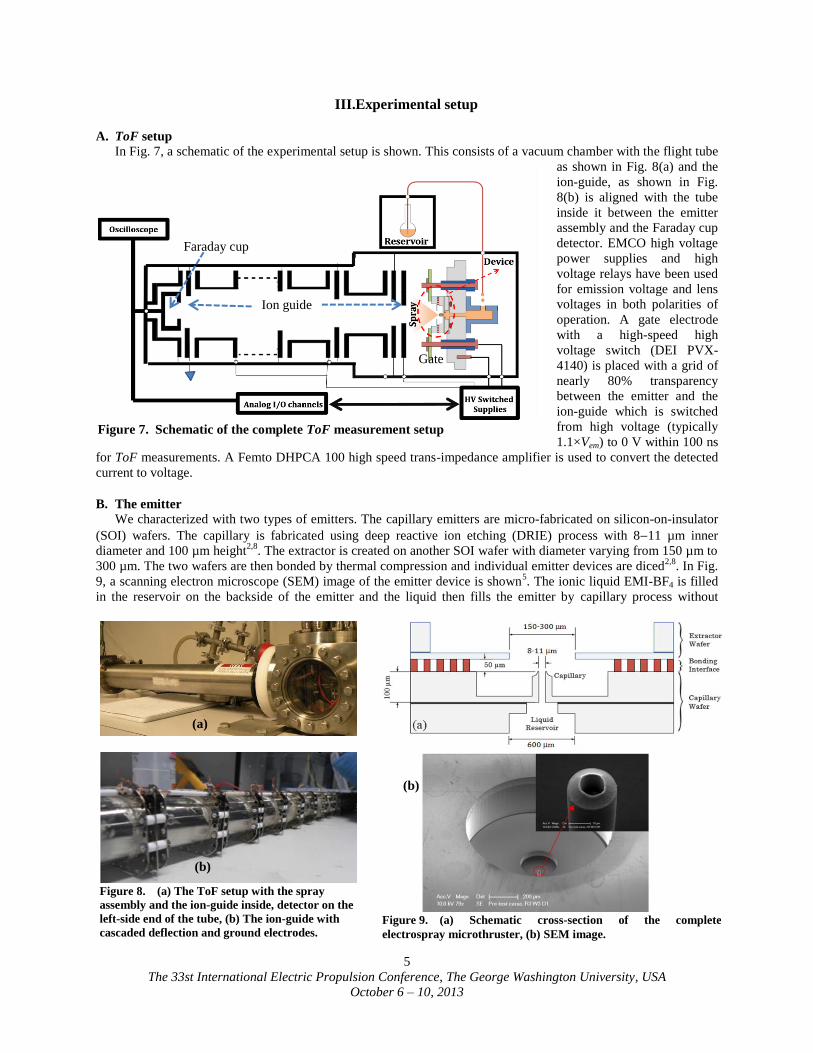
Figure 9. (a) Schematic cross-section of the complete
electrospray microthruster, (b) SEM image.
(b)
III.Experimental setup
A. ToF setup
In Fig. 7, a schematic of the experimental setup is shown. This consists of a vacuum chamber with the flight tube
as shown in Fig. 8(a) and the
ion-guide, as shown in Fig.
8(b) is aligned with the tube
inside it between the emitter
assembly and the Faraday cup
detector. EMCO high voltage
power supplies and high
voltage relays have been used
for emission voltage and lens
voltages in both polarities of
operation. A gate electrode
with a high-speed high
voltage switch (DEI PVX-
4140) is placed with a grid of
nearly 80% transparency
between the emitter and the
ion-guide which is switched
from high voltage (typically
1.1×Vem) to 0 V within 100 ns
for ToF measurements. A Femto DHPCA 100 high speed trans-impedance amplifier is used to convert the detected
current to voltage.
B. The emitter
We characterized with two types of emitters. The capillary emitters are micro-fabricated on silicon-on-insulator
(SOI) wafers. The capillary is fabricated using deep reactive ion etching (DRIE) process with 811 µm inner
diameter and 100 µm height2,8
. The extractor is created on another SOI wafer with diameter varying from 150 µm to
300 µm. The two wafers are then bonded by thermal compression and individual emitter devices are diced2,8
. In Fig.
9, a scanning electron microscope (SEM) image of the emitter device is shown5. The ionic liquid EMI-BF4 is filled
in the reservoir on the backside of the emitter and the liquid then fills the emitter by capillary process without
Ion guide
Gate
Faraday cup

The 33st International Electric Propulsion Conference, The George Washington University, USA
October 6 – 10, 2013
6
(a) (b)
Figure 11. Measured Lens efficiency for different emission voltages in positive (a) and negative (b)
polarities respectively from microfabricated electrospray device with 300 µm extractor diameter.
Figure 10. SEM image of electrochemically
sharpened and roughened tungsten needle
applying external pressure. Emission voltage is applied between the capillary and the extractor to extract charges
from the tip of the liquid from the capillary.
To characterize the lens with pure ionic emitters,
without possibility of droplet disintegration, we tested
electrochemically sharpened and roughened tungsten
needles fabricated in the process reported by Lozano and
Martínez-Sánchez in 20053. These needles have typically
1015 µm radius of curvature at the tip and they are
externally wetted with EMI-BF4 to emit pure ions. These
devices are previously reported to emit in pure ionic
regime within 1520o half-angle
7. In Figure 10, SEM
image of a tungsten needle is shown.
IV. Test results
A. Electrostatic Lens efficiency
In Fig. 11, the lens efficiency of the microfabricated
emitters for different emission voltages in positive and
negative polarities are shown. The lens voltage is varied from 0 V to ± 1650 V and the emitter current and detector
current are measured. The plots show that the efficiency of the lens is between 20% and 35% for the positive
polarity and between 30% and 40% for negative polarity. The 3040% efficiency, as opposed to the simulated value
of 2535%, may be due to the fact that the emission current density is mostly concentrated within 30o half-angle as
mentioned before5. It is also observed from the plots that as the emission voltage increases, the efficiency reduces.
This is because as the emission voltage increase, the emission spreads over higher half-angle5.
It is observed that the range of values for Vlens with the maximum efficiency is significantly larger than the
simulation results (0.8×Vem to Vem). Also there is a peak between 200 V and 300 V which is unclear. It is possible
that the emission kinetic energy is spread over a wide range for the emitters. There can be solvated ions and large
charged droplets emitted and then disintegrated into smaller droplets or ions, spreading the kinetic energy range of
the emitted species over a wide range.
Lens efficiency tests are performed with the needles and in Fig. 12, the variation of the lens efficiency is shown.
Due to smaller emission angle the efficiency is higher than the capillary emitters and the maximum efficiency is
achieved with Vlens/Vem having a value between 0.6 to 0.8.
* Vem = 1010 V
* Vem = 1040 V
* Vem = 1070 V
* Vem = 1100 V
* Vem = -1010 V
* Vem = -1040 V
* Vem = -1070 V
* Vem = -1100 V
-

The 33st International Electric Propulsion Conference, The George Washington University, USA
October 6 – 10, 2013
7
Figure 13. ToF trace from microfabricated capillary
emitter in negative polarity of emission at Vem = -1040 V,
Vlens = -710 V
Figure 12. Measured lens efficiency of electrochemically etched
and roughened tungsten needles for different emission voltages
B. ToF measurement
ToF measurements have been
performed on the capillary emitter by
shutting the gate voltage from a value
equal to 1.1×Vem to 0 V at a reference
time and measuring the ToF from the
traces of the detected current from the
oscilloscope. In Fig. 13, the ToF trace of
the capillary emitter is shown at Vem =
1040 V and Vlens = 710 V. The ToF of
the BF4ion obtained from the trace is
19.8 µs. This is 1.46 times higher than
the flight time of the BF4ions at 1040
V emission voltage without the effect of
the lens. Since Vlens/Vem ratio is 0.68, the
ToF correction factor from simulation is
1.45 which is very close to the
experimental value.
V. Conclusions
This paper reports the development
of a ToF measurement system with an
electrostatic ion-guide to increase the detected
current. The ion-guide can focus a significant
proportion of the charges emitted over a wide
emission angle and with wide energy spread
on a small detector at the end of a long flight
tube. For micro-fabricated capillary emitters,
the system can detect up to 40% of the
charges emitted over 40o emission half-angle.
This would help collecting the q/m
information from a significant portion of the
emitted beam rather than the portion that is
mostly along the axis of the flight tube. The
ion-guide has an effect of increased flight
time of the charges and the effect can be
modeled to a very good precision with the
experimental value. The q/m can be mapped
back from the delayed flight time by knowing
the ToF correction factor.
For capillary emitters, the wide-spread
range of Vlens for maximum efficiency and the
peak between 200 V and 300 V are still not
very clear. However, when compared with the
needle emitters, this spread seems to be associated with the emission property of the capillary emitter itself which is
not visible in case of the needle emitters. Retarded potential analysis of the spray energy spread of the capillary
emitters may be useful in understanding this issue.
For the needle emitters, the efficiency can reach much higher values due to lower emission angle. Theoretically
the system should be able to collect 100% of the emitted charges from the needles due to 1520o emission half-
angle. Therefore, tests with the needles will be very helpful in characterizing the characteristics of the ToF system.

The 33st International Electric Propulsion Conference, The George Washington University, USA
October 6 – 10, 2013
8
Acknowledgments
This work has been partially supported by the Swiss National Science Foundation 200021_146365, and by
MicroThrust project, grant agreement number 263035, funded by the EC Seventh Framework Programme theme
FP7-SPACE-2010.
References 1Cotter R. J., Time-of-flight Mass Spectrometry: Instrumentation and Applications in Biological Research, 1st ed., ACS
Professional Reference Books, Washington DC. 2Ataman C., Dandavino S. and Shea H., “Wafer-level integrated electrospray emitters for a pumpless microthruster system
operating on high efficiency ion-mode” MEMS, Paris, France, 2012, pp. 1293−1296. 3Lozano P., Martínez-Sánchez M., “Ionic liquid ion sources: characterization of externally wetted emitters”, Journal of
Colloid and Interface Science 282, 2005, pp. 415–421. 4Kroupn R., “Micromachined Electrospray Thrusters for Spacecraft Propulsion”, PhD Dissertation EDMI, EPFL,
Switzerland, 2009. 5Chakraborty S., Ataman C., Dandavino S. and Shea H., “Microfabrication of an electrospray thruster for small spacecraft”,
POWERMEMS, Atlanta, USA, 2012, p-073. 6Sise O., Ulu M. and Dogan M., “Multi-element cylindrical electrostatic lens systems for focusing and controlling charged
particles”, Nuclear Instruments and Methods in Physics Research Section A: Accelerators, Spectrometers, Detectors and
Associated Equipment, Vol. 554, Issues 1–3, 1 December 2005, pp. 114–131. 7 http://www.kimballphysics.com/ev-parts/stainless-steel-cylinders. 8Dandavino S., Ataman C., Chakraborty S. and Shea H., “Design and fabrication of the thruster heads for the MicroThrust
MEMS electrospray propulsion system”, IEPC 13, Washington DC, USA, 2013.