Embed Size (px)
Citation preview
Portland State University Portland State University
PDXScholar PDXScholar
Dissertations and Theses Dissertations and Theses
Winter 2-13-2017
Development of a Technology Transfer Score for Development of a Technology Transfer Score for
Evaluating Research Proposals: Case Study of Evaluating Research Proposals: Case Study of
Demand Response Technologies in the Pacific Demand Response Technologies in the Pacific
Northwest Northwest
Judith Estep Portland State University
Follow this and additional works at: https://pdxscholar.library.pdx.edu/open_access_etds
Part of the Engineering Commons, and the Technology and Innovation Commons
Let us know how access to this document benefits you.
Recommended Citation Recommended Citation Estep, Judith, "Development of a Technology Transfer Score for Evaluating Research Proposals: Case Study of Demand Response Technologies in the Pacific Northwest" (2017). Dissertations and Theses. Paper 3479. https://doi.org/10.15760/etd.5363
This Dissertation is brought to you for free and open access. It has been accepted for inclusion in Dissertations and Theses by an authorized administrator of PDXScholar. Please contact us if we can make this document more accessible: [email protected].

Development of a Technology Transfer Score for Evaluating Research Proposals: Case
Study of Demand Response Technologies in the Pacific Northwest
by
Judith Estep
A dissertation submitted in partial fulfillment of the
requirements for the degree of
Doctor of Philosophy
in
Technology Management
Dissertation Committee:
Tugrul Daim, Chair
Dundar Kocaoglu, Co-Chair
Jisun Kim
Loren Lutzenhiser
Portland State University
2017
i
ABSTRACT
Investment in Research and Development (R&D) is necessary for innovation,
allowing an organization to maintain a competitive edge. The U.S. Federal
Government invests billions of dollars, primarily in basic research technologies to
help fill the pipeline for other organizations to take the technology into
commercialization. However, as Lewis Duncan suggests, it is not about just investing
in innovation, it is about converting that research into application. A cursory review
of the research proposal evaluation criteria suggests that there is little to no emphasis
placed on the transfer of research results. This effort is motivated by a need to move
research into application.
One segment that is facing technology challenges is the energy sector.
Historically, the electric grid has been stable and predictable; therefore, there were no
immediate drivers to innovate. However, an aging infrastructure, integration of
renewable energy, and aggressive energy efficiency targets are motivating the need
for research and to put promising results into application. Many technologies exist or
are in development but the rate at which they are being adopted is slow.
The goal of this research is to develop a decision model that can be used to
identify the technology transfer potential of a research proposal. An organization can
use the model to select the proposals whose research outcomes are more likely to
move into application. The model begins to close the chasm between research and
application – otherwise known as the “valley of death”.

ii
A comprehensive literature review was conducted to understand when the idea
of technology application or transfer should begin. Next, the attributes that are
necessary for successful technology transfer were identified. The emphasis of
successful technology transfer occurs when there is a productive relationship between
the researchers and the technology recipient. A hierarchical decision model, along
with desirability curves, was used to understand the complexities of the researcher
and recipient relationship, specific to technology transfer. In this research, the
evaluation criteria of several research organizations were assessed to understand the
extent to which the success attributes that were identified in literature were
considered when reviewing research proposals. While some of the organizations
included a few of the success attributes, none of the organizations considered all of
the attributes. In addition, none of the organizations quantified the value of the
success attributes.
The effectiveness of the model relies extensively on expert judgments to
complete the model validation and quantification. Subject matter experts ranging
from senior executives with extensive experience in technology transfer to principal
research investigators from national labs, universities, utilities, and non-profit
research organizations were used to ensure a comprehensive and cross-functional
validation and quantification of the decision model.
The quantified model was validated using a case study involving demand
response (DR) technology proposals in the Pacific Northwest. The DR technologies
were selected based on their potential to solve some of the region’s most prevalent
iii
issues. In addition, several sensitivity scenarios were developed to test the model’s
response to extreme case scenarios, impact of perturbations in expert responses, and if
it can be applied to other than demand response technologies. In other words, is the
model technology agnostic? In addition, the flexibility of the model to be used as a
tool for communicating which success attributes in a research proposal are deficient
and need strengthening and how improvements would increase the overall technology
transfer score were assessed. The low scoring success attributes in the case study
proposals (e.g. project meetings, etc.) were clearly identified as the areas to be
improved for increasing the technology transfer score. As a communication tool, the
model could help a research organization identify areas they could bolster to improve
their overall technology transfer score. Similarly, the technology recipient could use
the results to identify areas that need to be reinforced, as the research is ongoing.
The research objective is to develop a decision model resulting in a technology
transfer score that can be used to assess the technology transfer potential of a research
proposal. The technology transfer score can be used by an organization in the
development of a research portfolio. An organization’s growth, in a highly
competitive global market, hinges on superior R&D performance and the ability to
apply the results. The energy sector is no different. While there is sufficient research
being done to address the issues facing the utility industry, the rate at which
technologies are adopted is lagging. The technology transfer score has the potential
to increase the success of crossing the chasm to successful application by helping an
organization make informed and deliberate decisions about their research portfolio.

iv
DEDICATION
“All great achievements require time.”
- Maya Angelou
This research is dedicated to patience…those who have it, those who need it, and
those who are learning it.

v
ACKNOWLEDGEMENTS
This research represents an effort that could not be done in isolation. The list
of those who supported me is remarkable, and I’m certain to leave someone out.
However, here I am, crossing the finish line and I only have thanks and gratitude to
express.
I am grateful for my family that endured missed soccer practices and track
meets, and delayed vacations so that I could pursue my passion. Craig, Sophia, and
Samuel, your tolerance and patience with me are unsurpassed. I am in awe! Of
course, there is my extended family in California, Washington, Texas, and Oregon
that told me I could – and I did.
To my committee members, I appreciate your support, encouragement, and
most of all brainstorming with me to narrow my research topic. It resulted in a
perfect complement to my work environment. This synergy made my research more
meaningful knowing the model can have an immediate impact on how a research
portfolio is selected in my organization. Notably Dr. Daim – you willingly agreed to
be my chairperson and made yourself available to answer my questions, provide
advice, and make opportunities available for me. In addition, you agreed to be my
mentor – I respect your input and look forward to your guidance as I move forward in
the academic world. While the product is important, it is really the journey that you
helped me appreciate.
Dr. Kocaoglu, at the time I didn’t know how much I would value taking the
ETM Decision Making class - it was a tough class and you challenged us. However,
vi
the way you presented the material, encouraged me to ask questions and to succeed,
engaged me more than I realized such that I am using decision modeling as my
research methodology. Thank you setting high expectations and accepting nothing
less than excellence.
Dr. Lutzenhiser and Dr. Kim, I appreciate your input, especially as it pertained
to energy related R&D – your expertise and thoughtful approach to energy topics and
to research management was critical to the success of my research.
I am thankful for a collaborative work environment and for my manager, Terry
Oliver, who encourages creativity and creates a space where there is NEVER a dumb
question. I am excited to see how using this model will impact our portfolio. In
addition, I am privileged to have access to some of the best practical thinkers on
research management. My panels were made up of world-renowned experts who,
without a doubt, had a significant impact on the quality of my research. Thank you to
those who must remain anonymous.
Along the way, I met fabulous students who became friends – we share a
common interest in higher learning and a desire to become well-rounded “T-type”
people. Good luck on your journeys. I have every confidence that you will be
successful.

vii
TABLE OF CONTENTS
ABSTRACT ......................................................................................................................... i
DEDICATION ................................................................................................................... iv
ACKNOWLEDGEMENTS ................................................................................................ v
LIST OF TABLES ............................................................................................................ xii
LIST OF FIGURES ......................................................................................................... xiii
CHAPTER 1: INTRODUCTION ....................................................................................... 1
1.1 Research Scope ......................................................................................................... 1
1.2 Organization of the Dissertation ............................................................................... 5
1.3 Terminology .............................................................................................................. 7
CHAPTER 2: LITERATURE REVIEW .......................................................................... 18
2.1 Citing TT in the Research Proposal Phase .............................................................. 18
2.2 Attributes of Successful TT .................................................................................... 20
2.2.1 Organizational .................................................................................................. 21
2.2.2 Technological ................................................................................................... 26
2.2.3 Social................................................................................................................ 29
2.2.4 Market .............................................................................................................. 33
2.3 Methods use in TT Research................................................................................... 37
2.3.1 Case Study ....................................................................................................... 40
2.3.2 Surveying ......................................................................................................... 40
2.3.3 Literature Reports ............................................................................................ 41
2.3.4 Model Development......................................................................................... 41
2.3.5 Hypothesis Testing........................................................................................... 42
2.4 Evaluation of Research Proposals by Funding Agencies ....................................... 43
2.4.1 Department of Energy: EERE and ARPA-e .................................................... 44

viii
2.4.2 California Energy Commission........................................................................ 57
2.4.3 National Institutes of Health (NIH) ................................................................. 59
2.4.4 National Science Foundation ........................................................................... 61
CHAPTER 3: RESEARCH OBJECTIVES, QUESTIONS, AND METHODOLOGY .. 70
3.1 Objective ................................................................................................................. 70
3.2 Questions................................................................................................................. 71
3.3 Methodology ........................................................................................................... 72
3.3.1 Introduction to Hierarchical Decision Modeling (HDM) ................................ 72
3.3.2 Inconsistency and Disagreement of Expert Judgments ................................... 76
3.3.3 Disagreement and Clustering ........................................................................... 79
3.3.4 Calculating the Technology Transfer Score .................................................... 82
3.3.5 Desirability Curves .......................................................................................... 83
3.3.6 Validation of the HDM .................................................................................... 85
3.3.7 Expert Panel Development .............................................................................. 86
CHAPTER 4: DEVELOPMENT OF THE RESEARCH MODEL .................................. 89
4.1 Expert Panel Formation .......................................................................................... 89
4.2 Conceptual HDM .................................................................................................... 93
4.2.1 Mission Level................................................................................................... 96
4.2.2 Perspective Level ............................................................................................. 96
4.2.3 Success Attribute Level ................................................................................... 97
4.2.4 Alternative Level – Research Proposals .......................................................... 98
4.3 Data Collection ....................................................................................................... 99
CHAPTER 5: RESULTS OF MODEL QUANTIFICATION........................................ 101
5.1 Content Validation ................................................................................................ 101
5.1.1 Perspective Level ........................................................................................... 102
5.1.2 Organizational Success Attributes ................................................................. 103
ix
5.1.3 Technology Success Attributes ...................................................................... 104
5.1.4 Social Success Attributes ............................................................................... 105
5.1.5 Market Success Attributes ............................................................................. 106
5.2 Perspective Level Quantification .......................................................................... 107
5.3 Success Attribute Quantification .......................................................................... 109
5.3.1 Organizational Perspective ............................................................................ 109
5.3.2 Technological Perspective ............................................................................. 110
5.3.3 Social Perspective .......................................................................................... 112
5.3.4 Market Perspective......................................................................................... 114
5.3.5 Final Model Weights...................................................................................... 115
5.4 Desirability Curves ............................................................................................... 119
5.4.1 Organizational Success Attributes ................................................................. 119
5.4.2 Technological Success Attributes .................................................................. 125
5.4.3 Social Success Attributes ............................................................................... 130
5.4.4 Market Success Attributes ............................................................................. 135
CHAPTER 6: ANALYSIS CASE DEVELOPMENT .................................................... 141
6.1 DR in the Pacific Northwest - What is it and Why is it Important? ..................... 141
6.2 DR Future.............................................................................................................. 144
6.3 The R&D Organization and Process ..................................................................... 145
6.3.1 Research Proposals ........................................................................................ 146
CHAPTER 7: ANALYSIS OF CASE AND SENSITIVITY ANALYSIS .................... 150
7.1 Technology Transfer Scores for Case Study ........................................................ 151
7.2 Scenario Analysis.................................................................................................. 157
7.2.1 Future Based Scenario – Perspective Weights Change ................................. 158
7.2.2 Preserve Highest TT Score ............................................................................ 161
7.2.3 Can the Model be used for Other Technologies?........................................... 161

x
7.2.4 What can the Researcher do to Improve Their TT Score (and increase the
potential for successful TT)? .................................................................................. 164
CHAPTER 8: MODEL VALIDATION ......................................................................... 170
8.1 Construct Validity ................................................................................................. 170
8.2 Content Validity .................................................................................................... 171
8.3 Criteria Related Validity ....................................................................................... 172
CHAPTER 9: DISCUSSION .......................................................................................... 173
9.1 Practical Application: General .............................................................................. 173
9.2 Practical Application: Organizational Perspective ............................................... 174
9.3 Practical Application: Technological Perspective ................................................ 175
9.4 Practical Application: Social Perspective ............................................................. 176
9.5 Practical Application: Market Perspective............................................................ 176
CHAPTER 10: CONCLUSIONS ................................................................................... 178
10.1 Conclusions and Contributions ........................................................................... 178
10.2 Limitations .......................................................................................................... 180
10.3 Future Work ....................................................................................................... 181
BIBLOGRAPHY ............................................................................................................ 184
APPENDIX A: PROPOSAL EVALUATION CRITERIA ............................................ 197
Appendix A1: Proposal Evaluation Criteria: EERE .................................................. 197
Appendix A2: Proposal Evaluation Criteria: BPA ................................................... 198
Appendix A3: Proposal Evaluation Criteria: CEC ................................................... 199
Appendix A5: Proposal Evaluation Criteria: NSF .................................................... 206
APPENDIX B: DEFINITIONS OF REISMAN’S TAXONOMY ................................ 209
APPENDIX C: MODEL VALIDATION ASSESSMENT TOOL ................................. 215
APPENDIX D: MODEL QUANTIFICATION ASSESSMENT TOOLS .................... 222
Appendix D1: Quantification Tool for Perspective Level ......................................... 222
Appendix D2: Quantification Tool for Organizational Success Attributes ............... 223
Appendix D3: Quantification Tool for Technological Success Attributes ................ 224
Appendix D4: Quantification Tool for Social Success Attributes ............................. 225

xi
Appendix D5: Quantification Tool for Market Success Attributes ........................... 226
APPENDIX E: MODEL VALIDATION RESULTS ..................................................... 227
Appendix E1: Validation of Perspective Level ......................................................... 227
Appendix E2: Validation of Organizational Perspective Success Attributes ............. 228
Appendix E3: Validation of Technological Perspective Success Attributes ............. 229
Appendix E4: Validation of Social Perspective Success Attributes .......................... 230
Appendix E5: Validation of Market Perspective Success Attributes ........................ 231
APPENDIX F: PAIRWISE COMPARISON RESULTS ............................................... 232
Appendix F1: Perspective Level Pairwise Comparisons ........................................... 232
Appendix F2: Organizational Pairwise Comparisons ................................................ 233
Appendix F3: Technological Pairwise Comparisons ................................................. 234
Appendix F4: Social Pairwise Comparisons.............................................................. 235
Appendix F5: Market Pairwise Comparisons ............................................................ 236
APPENDIX G: DESIRABILITY CURVES FOR CASE STUDY– ACTUAL VALUES
237
Appendix G1: Summary of Desirability Curves ........................................................ 237
Appendix G2: Success Attributes for Case Studies ................................................... 238
Appendix G3: Corresponding Desirability Curve Values ......................................... 239
xii
LIST OF TABLES
Table 1: Technology Readiness Levels [50, 51] .............................................................. 10
Table 2: Definitions of Technology Transfer ................................................................... 15
Table 3: Organizational Success Attributes ...................................................................... 26
Table 4: Technological Success Attributes ....................................................................... 29
Table 5: Social Success Attributes ................................................................................... 33
Table 6: Market Success Attributes ................................................................................. 36
Table 7: Technology Transfer Analysis Methods ............................................................ 39
Table 8: Research Organization Evaluation Criteria ........................................................ 67
Table 9: Research Gaps .................................................................................................... 69
Table 10: Method Assessment .......................................................................................... 74
Table 11: Example of Inconsistency and Disagreement ................................................... 82
Table 12: Summary of Expert Panels ............................................................................... 92
Table 13: Expert Panels ................................................................................................... 93
Table 14: Success Attribute Measurements ...................................................................... 98
Table 15: Perspective Level Quantification .................................................................... 108
Table 16: Organizational Success Attribute Quantification ........................................... 110
Table 17: Technological Success Attribute Quantification ............................................ 111
Table 18: Social Success Attribute Quantification ......................................................... 113
Table 19: Market Success Attribute Quantification........................................................ 115
Table 20: Final Model Weights ..................................................................................... 117
Table 21: BPA Project Evaluation Criteria [19] ............................................................. 146
Table 22: Research Proposals ......................................................................................... 148
Table 23: Proposal Characteristics .................................................................................. 153
Table 24: Proposal #1 Strengths and Weaknesses .......................................................... 153
Table 25: Proposal #2 Strengths and Weaknesses ......................................................... 154
Table 26: Proposal #3 Strengths and Weaknesses .......................................................... 155
Table 27: Baseline Technology Transfer Scores ........................................................... 155
Table 28: Organizational Emphasis – Impact on Proposal Rank ................................... 158
Table 29: Technological Emphasis – Impact on Proposal Rank .................................... 159
Table 30: Social Emphasis – Impact on Proposal Rank ................................................. 160
Table 31: Allowable Change in Perspective Values ....................................................... 161
Table 32: Proposal 4 Characteristics............................................................................... 163
Table 33: TT Score Increases with Changes to Desirability Values .............................. 168
Table 34: Actions for the Organizational Perspective .................................................... 175
Table 35: Actions for the Technological Perspective ..................................................... 175
Table 36: Actions for the Social Perspective ................................................................. 176
Table 37: Actions for the Market Perspective ................................................................ 177
Table 38: Research Contributions .................................................................................. 180
xiii
LIST OF FIGURES
Figure 1: Federal R&D funding 2014-2015....................................................................... 2
Figure 2: How Technology Transfer is Understood for this Research ............................ 17
Figure 3: Conceptual Model Design ................................................................................. 76
Figure 4: Template for Developing Desirability Curve .................................................... 84
Figure 5: Sample Desirability Curve ................................................................................ 84
Figure 6: Validated Model ................................................................................................ 95
Figure 7: Perspective Validation Results ........................................................................ 102
Figure 8: Organizational Strategies Success Attributes Validation ................................ 103
Figure 9: Technological Success Attributes Validation.................................................. 104
Figure 10: Social Success Attributes Validation ............................................................ 105
Figure 11: Market Success Attributes Validation ........................................................... 106
Figure 12: Weighted Model ............................................................................................ 118
Figure 13: Budget Cost Share Desirability Curve .......................................................... 120
Figure 14: Geographic Proximity Desirability Curve ..................................................... 121
Figure 15: Average Time to Contract Desirability Curve .............................................. 122
Figure 16: Technical Complexities Desirability Curve .................................................. 123
Figure 17: Stakeholder Complexities Desirability Curve ............................................... 124
Figure 18: Combined Research Experience Desirability Curve .................................... 125
Figure 19: Technology Publications Desirability Curve ............................................... 126
Figure 20: Personnel Assigned to TTO Desirability Curve ........................................... 127
Figure 21: Technology Benefits Desirability Curve ...................................................... 128
Figure 22: Budget Allocated to TT Activities Desirability Curve .................................. 129
Figure 23: Diversity Events Desirability Curve.............................................................. 130
Figure 24: Personnel Dedicated to Support TT Desirability Curve ................................ 131
Figure 25: Project Meetings Desirability Curve ............................................................. 132
Figure 26: Personnel Loaned to Recipient Desirability Curve ....................................... 133
Figure 27: Successful TT Experience Desirability Curve .............................................. 134
Figure 28: Comprehensiveness of the Use Case Desirability Curve .............................. 135
Figure 29: Credibility of the Organizational Champion ................................................. 136
Figure 30: Level of Top Management Interest Desirability Curve................................. 137
Figure 31: Government Incentives Desirability Curve ................................................... 138
Figure 32: Common Technology Standards Desirability Curve..................................... 139
Figure 33: ROI Desirability Curve ................................................................................. 140
Figure 34: BPA Balancing Authority Load for 05/05-12/2014 ...................................... 142

1
CHAPTER 1: INTRODUCTION
The first chapter of the dissertation will lay the foundation for the research
effort. The scope of the research is defined and begins to describe why technology
transfer is so important and why starting to think about technology application during
the research phase is critical to overcoming technology transfer barriers. The focus of
the research is on federal funding and moving this research into application, but the
concept can easily be adapted to any research organization.
The introduction describes how the document is organized and ends with
understanding the term “technology transfer” and how it will be interpreted for the
purpose of this research.
1.1 Research Scope
In order to maintain a competitive edge, organizations must innovate. The
National Science Board states that in order for an organization to remain competitive ,
investment in research is an imperative. Research and development investments by
the National Labs are significant. The labs primarily invest in basic research and feed
the innovation pipeline for companies to take the research into application. Figure 1
was derived from the individual organizations’ websites and shows recent federal
investments in research.

2
Figure 1: Federal R&D funding 2014-2015
A company’s growth hinges on successful R&D [167]. However, investments
in research alone do not guarantee success. Rather the application of research results
is what propels an organization to remain competitive in a global economy.
Despite the significant investments, there are many examples of application
failures. In fact, the reasons for some of these failures can be attributed to the
technology transfer process. Solyndra was a manufacturer of solar panels. Their
cylindrical design was unique and unlike other solar panel technology, Solyndra
used copper indium gallium selenide thin film solar cells. This combination would
allow the panels to be packaged more densely on commercial rooftops and absorb
light from many directions because of it cylindrical design. As a result, Solyndra
claimed this technology would produce more electricity than a contemporary solar
panel. The company was one of the first recipients of the 2009 Recovery Act [39] -

3
Solyndra received a $535M loan guarantee. The technology looked like a viable
alternative to polysilicon, which, at the time, was in short supply. These shortages
were temporary since new manufacturing plants were in process. The polysilicon
market prices plummeted and Solyndra failed – spectacularly [168]. While the
technology was a success, the reasons for their technology transfer failure were
attributed to not putting a good business case together and a lack of understanding the
end-user: their panel technology was not compatible with the residential sector or for
large solar farms.
While there are voluminous amounts of information about technology transfer and
attributes of successful technology transfer, there is a lack of information about how to
assimilate these success attributes – in other words a framework for how successful
technology transfer occurs.
The problem of successful technology transfer is critical for the energy sector,
specifically power utilities; this is the basis for the research done by Jenkins and Mansur.
Their research emphasizes “…an urgent national imperative to modernize and diversify
its energy system…” [161]. Against the backdrop of the United States’ Energy Action
Plan, which includes increased research investments in clean energy, the utility industry
needs to respond to unprecedented technology challenges. These challenges include an
aging infrastructure, a growing population, and aggressive energy efficiency targets.
There is a large population of utility equipment (e.g. poles, power transformers) that has
exceeded or is nearing its useful service life [36]. As the population grows, concerns
about congestion management grow proportionately. Regarding energy efficiency

4
targets, the President called for an energy strategy for the future, requiring out-of-the-box
thinking about energy solutions. For example, the Pacific Northwest region has a target
to meet 85% of the load growth with energy efficient devices and strategies [37]. To
complicate matters, the changes to the grid, with the integration of “smart” technologies,
demand response solutions, and renewable resource integration make a previously
predictable system more unstable. The utility industry acknowledges these challenges
and is investing in research to identify solutions. However, relative to other industries,
utilities spend very little on research and development. A recent National Science
Foundation report on R&D spending (2012) shows that, on average, utilities spend 0.1%
[38].
It is not enough to just develop a technology that solves an energy related
problem. Utilities are also faced with a challenge of integrating the technology into an
existing infrastructure and doing so, reliably and seamlessly [70, 71, 72, 36]. In order for
a solution to be effective and have an impact, the technology needs to be applied –
without the technology transfer component, energy strategies cannot be realized.
Therefore, there is a need to understand the difficulties associated with technology
transfer. The better barriers are understood and the relevant success attributes are known,
the more likely results can be applied, ensuring that these technologies are
commercialized. However, success attributes need to be considered before the decision is
made to develop these technologies as part of the proposal evaluation; literature is
provided in Chapter 2.4 to support this supposition. Therefore, we need to look at the
decision point when technology transfer or commercialization is considered. Specific to

5
energy related topics, there is a need to understand how the Department of Energy (DOE)
is evaluating technology proposals. While the preceding example emphasizes the need for
successful technology transfer in the energy sector, other sectors face similar challenges
with implementing research results.
The goals of this research are to:
1. Identify when technology transfer should be considered,
2. Identify what attributes should be the focus to facilitate successful technology
transfer, and
3. Understand how federally funded organizations consider technology transfer
as part of their research proposals.
Achieving these goals helped to meet the objective of this research. That is to
develop a technology transfer score that can be used to inform the selection of research
proposals that have the most potential for technology transfer.
Knowledge is power – by identifying those attributes, which contribute to
successful technology transfers, an industry could take a proactive approach by ensuring
that those elements are present during the research and development phase.
1.2 Organization of the Dissertation
The introduction includes a description of how technology transfer is
considered for the purposes of this research. Technology transfer has different
interpretations given the maturity of the technology, so it is important to understand
the context.

6
Chapter 2 provides an organized literature review, which considered: 1. When
an organization should start to consider technology transfer, 2: What are the attributes
for successful technology transfer, 3: What mechanisms have been used to
understand technology transfer, and 4: How and to what degree are research
organizations considering technology transfer?
Chapter 3 and a discussion of the methodology follow the literature review.
Included is justification for choosing a hierarchical decision model to research
technology transfer as well as a discussion about the use of desirability curves to
quantify subjective measures, selection of expert panels and how to measure
inconsistency and disagreement with their responses.
Chapter 4 develops the model and talks about the expert panel and how the
different panels will be used. Lastly, the research assessment tools that will collect
their expert opinions to validate and quantify the model are discussed.
Chapter 5 presents the quantified model and chapter 6 develops the case study
that will be used to test the model. The case study uses technologies and research
proposals that are being considered for the Pacific Northwest. These technologies
will help the utilities address grid stability issues resulting from renewable energy
integration, meet aggressive energy efficiency targets, and provide alternatives to grid
expansion or upgrades.
Case study and sensitivity analysis are conducted in Chapter 7, with the final
model validation being discussed in Chapter 8.

7
Finally, Chapter 9 provides the research conclusions, contributions,
assumptions, and discusses limitations. These limitations will identify opportunities
for future work.
1.3 Terminology
It would be worthwhile to begin the research with an understanding of the term
technology transfer. The definitions cover the spectrum from whimsical - PNNL has
informally described the tech transfer process as a “contact sport” [165] to more formal
definitions as describe by E.M. Rogers, et al: “…a technological innovation is fully
transferred when it is commercialized into a product that is sold in the market place…”
[62]. In general, the technology transfer process involves the sharing of knowledge and
facilities among:
• Federal laboratories
• Industry
• Universities
• Federal, state, and local governments
• Third party intermediaries [91]
Technology transfer is not a new concept. The considerable amount of literature
agrees that defining technology transfer is difficult due to the complexity of the technology
transfer process. The definitions vary depending on the organization, technology type, and
technology maturity, among other factors.
The term technology transfer can be defined as the process of movement of
technology from one entity to another. The transfer may be said to be successful if the

8
receiving entity, the transferee, can effectively utilize the technology transferred and
eventually assimilate it. The movement may involve physical assets, expertise, and
technical knowledge. Technology transfer in some situations may be confined to relocating
and exchanging of personnel or the movement of a specific set of capabilities. [106]
Technology transfer has also been used to refer to movements of technology from
the laboratory to industry, developed to developing countries, or from one application to
another domain [106].
The National Technology Transfer Center (NTTC) focuses on the players involved
in federal technology transfer “…the purpose of a federal technology transfer program is
to make federally generated scientific and technological developments accessible to private
industry and state and local governments.” The expectation is that the technology will be
further developed once transferred and “…enhance our nation's industrial competitiveness
or otherwise improve our quality of life.” [110] A similar definition of federal research and
technology transfer includes the reference to the serving public and private needs,
“…technology transfer is the process by which existing knowledge, facilities or capabilities
developed under federal research and development funding are utilized to fulfill public and
private needs”. [108] Further supporting the theme of providing efficiencies, the
Transportation Research Board defines technology transfer as doing things better,
“…technology transfer is the process by which research and other new technologies are
transferred into useful process, products, and programs. Another way of saying the same
thing is: technology transfer is the process by which a better way of doing something is put
into use as quickly as possible.” [109] At a very basic level technology transfer has been

9
defined as simply, “…technology transfer addresses the assessment, adoption and
implementation of technology” [108]
The definitions of technology transfer are as disparate as the organizations that
apply them. Technology transfer includes knowledge transfer, enabling people or
countries to be ready to accept new technologies – preparations, and involves many
stakeholders to include national labs, government agencies, private industries,
technical and management level personnel, as well as developing countries. Because
of the literature review it can be inferred that the definition of technology transfer is
dependent on the context and the technology.
The type of technology transfer also depends on the maturity of the
technology. For less mature technologies, it may be appropriate to transfer
knowledge about the technology so it can be developed further. In contrast , more
mature technologies are more likely to be applied. The idea of Technology Readiness
Levels (TRLs) helps a researcher to communicate the maturity of a technology.
Lower TRL values 1-5 would be considered more basic research, with one being the
lowest, while TRLs 6-9 describe technologies that are more advanced. A complete
description of the Department of Energy (DOE) TRLs with the NASA stages is
presented in Table 1.
STAGES TECHNOLOGY
READINESS
LEVEL
DESCRIPTION
Discovery 1 Scientific research begins translation to applied R&D,
lowest level of technology readiness. Scientific research
begins to be translated into applied R&D. Examples
might include paper studies of a technology’s basic
principles.

10
STAGES TECHNOLOGY
READINESS
LEVEL
DESCRIPTION
2 Invention begins – Once basic principles are observed,
practical applications can be invented. Applications are
speculative and there may be no proof or detailed
analysis to support the assumptions. Examples are
limited to analytic studies.
Development 3 Active R&D is initiated – This includes analytic studies
and laboratory studies to physically validate analytical
predictions of separate elements of the technology.
Examples include components that are not yet integrated
or representative.
4 Basic technological components are integrated to
establish that the pieces will work together.
5 Fidelity of breadboard technology improves
significantly. The basic technological components are
integrated with reasonably realistic supporting elements
so it can be tested in a simulated environment.
Examples include “high fidelity” laboratory integration
of components.
Demonstration 6 Model/prototype is tested in a relevant environment –
represents model or prototype system, which is tested
well beyond TRL 5, is tested in a relevant environment.
Represents a major step up in a technology’s
demonstrated readiness. Examples include testing a
prototype in a high fidelity laboratory environment or in
a simulated operational environment.
7 Prototype near or at planned operational system.
Represents a major step up from TRL 6, requiring
demonstration of an actual system prototype in an
operational environment.
Commercialization 8 Technology is proven to work – actual technology
completed and qualified through test and demonstration.
9 Actual application of technology is in the final form –
technology proven through successful operations.
Table 1: Technology Readiness Levels [50, 51]
Frank Geels describes the multi-criteria aspects of technology transfer process,
relative to sustainability transitions. He emphasizes that, “…technological transitions
not only involve the technology…but also changes in elements such as user practices,
regulation, industrial networks, infrastructure….”. [42] and “…technical trajectories
11
are not only influenced by engineers, but also by users, policy makers, societal
groups, suppliers, …” [43] In this context, Geels refers to the technology transfer
process as a relationship and describes the interaction of different perspectives as the
“…dynamics of structural change…”. [42] Geels identifies the unique levels of
interaction: landscape developments, socio-technical regimes, and technological
niches. Technology transitions occur when there is an interaction among the different
levels. The interaction results from a need in the landscape created by the socio-
technical regime in the form of understanding user preferences, policy drivers,
culture, etc. In anticipation, the niche has technology developments ready to respond
to the landscape need – a window of opportunity is opened and the technology is
transitioned. In other words, transition occurs when all three levels are synchronized
and reinforce each other. A definition of each level is provided:
• Socio-technical landscape: impacted by external inputs; change happens slowly,
typically over a period of decades. Relative to this research, the technology
recipient can be seen as the landscape.
• Socio-technical regime: Influences the landscape through identification of
market/user preferences, culture, and policy implementation
• Niche – Innovations: research and development of new technologies occurs in
this space.
A verbatim explanation from Frank Geels puts context around the relationship:
[44] “…(a) niche-innovations build up internal momentum, through learning processes,
price/performance improvements, and support from powerful groups, (b) changes at the

12
landscape level create pressure on the regime and (c) destabilization of the regime creates
a window of opportunity for niche-innovations. The alignment of these processes
enables the breakthrough of these…technologies…”. The different levels are similarly
described in several of Geels’ research [42, 43, 44, 45, 46].
Geels explains issues with sustainable technology transitions. These include not
offering obvious benefits for the end-user, comfort level with incumbent technologies
that requires a strategic over-haul of those who support existing technologies, existing
infrastructures, and user practices that are aligned with the existing technology. [42] In
this research, a utility is seen as the incumbent.
Sharma’s dissertation [48] describes the technology transfer process through time
and clearly shows building a relationship as a prominent theme to successful technology
transfer.
The relationship theme is also prominent in the work of Franza, R.M., and K.P.
Grant. “Improving Federal to Private Sector Technology Transfer,” Research-Technology
Management 49, no. 3 (2006): 36–40 [49]. The attributes they identify as necessary for
technology transfer demonstrate that a relationship is important. Franza and Grant
highlight the “difference makers” – those attributes that are essential for successful
technology transfer.
For the purposes of this research, the relationship definition of technology transfer
will be understood as transfer of a technology or application from a research partner (e.g.
national lab, industry partner, university, or an internal researcher) to a utility. A
description of the research partners considered for this research is provided.

13
The research organizations include five likely partners: Universities,
Collaborative Partnerships (EPRI, CEATI, etc.), National Labs (LBNL, PNNL, etc.),
Industry Partners (Intel, IBM, etc.), and other utilities (So Cal Edison, Consolidated
Edison, etc.).
Collaborative Partnerships: Utilities partner with national labs or purchase
memberships through consortiums such as Electric Power Research Institute (EPRI),
Centre for Energy Advancement through Technological Innovation (CEATI), or Power
System Engineering Resource Center (PSERC). These consortiums conducted research
on behalf of the utility industry. A query of utility partners has identified these
organizations as collaborative partnerships.
Industry: The research is proposed by industry. Examples of industry partners
include Intel, GE, and IBM. Existing technology may have been applied to other
industries but an application to the utility industry has been identified.
University: Consists of research conducted by universities.
National Labs: The United States Department of Energy national laboratories and
technology centers are a system of facilities and laboratories overseen by the United
States Department of Energy (DOE) for the purpose of advancing science and technology
to fulfill the DOE mission. Sixteen of the seventeen DOE national laboratories are
federally funded research and development centers administered, managed, operated and
staffed by private-sector organizations under management and operating (M&O) contract
with DOE. [85] There are 17 national labs operated by the US Department of Energy.
14
Analogous to Geels research, the research partner can be seen as developing the
niche innovations and the research drivers (renewable integration, meeting energy
efficiency targets, etc.) and utilities are represented by the socio-technical landscape. The
objective is for these technologies to help a utility address the challenges of an aging
infrastructure, meeting energy efficiency targets, integrating renewable resources, or
accommodating load growth.
As stated, there are many ways to think about technology transfer. It can be
described, in early stages of research, as transferring knowledge that will help to move
the technology into more mature stages of development. In contrast, for more mature
technologies, technology transfer can mean the actual adoption and availability of a
technology in the market place.
More subjective definitions of technology transfer include building a relationship
between the researchers and the technology recipients. A strong relationship is a
mechanism for successful technology transfer. Important to the relationship is the
technology transfer “player” – who is conducting the research and who is receiving the
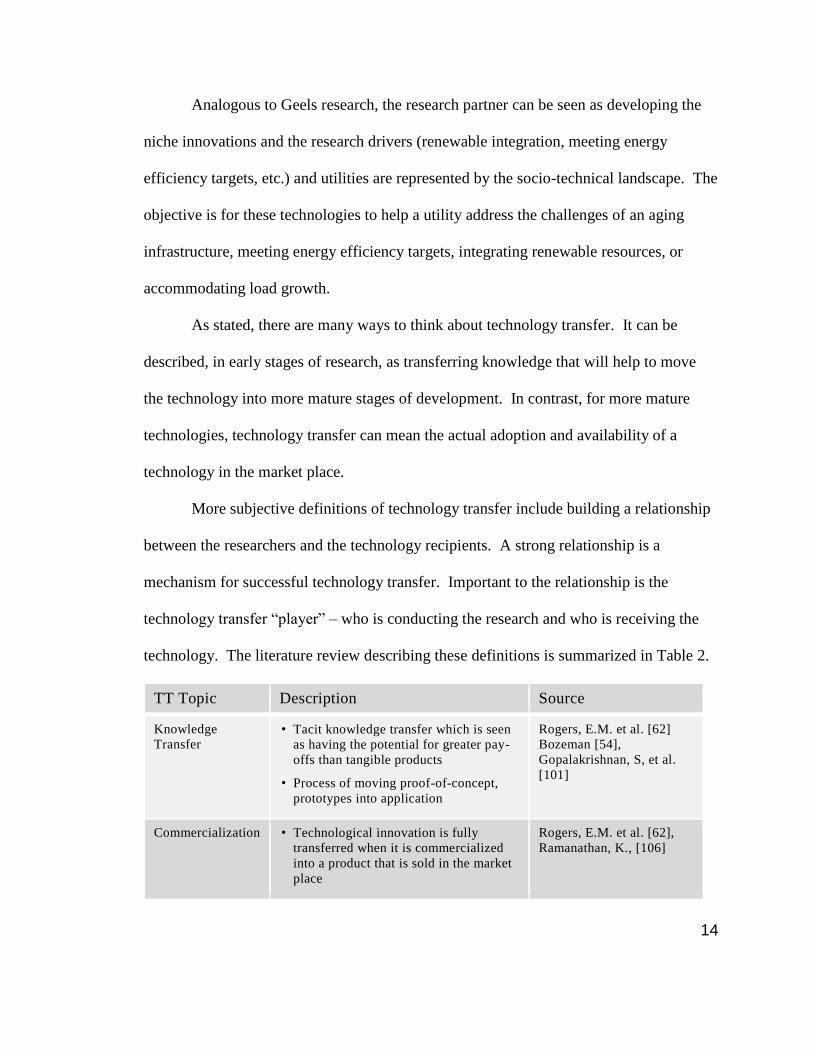
technology. The literature review describing these definitions is summarized in Table 2.
TT Topic Description Source
Knowledge
Transfer • Tacit knowledge transfer which is seen
as having the potential for greater pay-
offs than tangible products
• Process of moving proof-of-concept,
prototypes into application
Rogers, E.M. et al. [62]
Bozeman [54],
Gopalakrishnan, S, et al.
[101]
Commercialization • Technological innovation is fully
transferred when it is commercialized
into a product that is sold in the market
place
Rogers, E.M. et al. [62],
Ramanathan, K., [106]

15
TT Topic Description Source
• Effectively utilize the technology
transferred and eventually assimilate it
Relationship
Building
• Involve the technology…but also
changes in elements such as user
practices, regulation, industrial
networks, infrastructure
• Technical trajectories are not only
influenced by engineers, but also by
users, policy makers, societal groups,
suppliers
• Describes the interaction of different
perspectives as the “…dynamics of
structural change…”
• Technology transfer is described as a
“contact sport”: requiring continuous
interaction between technology
sources, academia, the government,
industry, and end users
• Process by which existing knowledge,
facilities or capabilities developed
under federal research and
development funding are utilized to
fulfill public and private needs;
Described as technology development
chains
Sharma, [48], Geels, et al.
[44], www.pnnl.gov, [164]
Lecture ETM 533, [108],
Perry [56], Franza, RM, et
al. [49]
TT Players • Transfer process involves the sharing
of knowledge and facilities among:
Federal laboratories, Industry,
Universities, Federal, state, and local
governments, Third party
intermediaries
• Movements of technology from the
laboratory to industry, developed to
developing countries, or from one
application to another domain
Okoli and Pawlowski, [91],
Ramanathan, K., [106],
Bozeman [54]
Table 2: Definitions of Technology Transfer
Figure 2 represents how technology transfer will be understood for the
purposes of this research. The players are the research organizations (national labs,
universities, non-profit collaborators, and private industry) and the technology
recipient. The model is generalizable such that the technology recipient could be any
organization that sponsors research; several federally funded labs are evaluated in
16
chapter 2. The case study emphasis will be on the Bonneville Power Administration.
The technologies considered in the case study (Chapter 6) have higher TRLs, so the
transfer is more about application of the technology. The technology transfer success
attributes describe the continuous relationship building between the research and the
technology recipient that is a necessary ingredient for success.

17
Figure 2: How Technology Transfer is Understood for this Research

18
CHAPTER 2: LITERATURE REVIEW
The focus of this chapter is to understand how the various dimensions of
technology transfer are described in literature. Four primary literature reviews were
completed. The first review was on the timing of when an organization should start to
consider technology transfer. Is it at the beginning of the research or should
technology transfer start when the research is completed? Next, the literature review
focused on those attributes that have been identified as necessary for technology
transfer. In addition, taxonomies were used to understand logical grouping of the
success attributes.
The next literature review considered how technology transfer was analyzed
and which would be appropriate for understanding the groups of success attributes.
The final review synthesized the information by looking at the evaluation criteria of
several different federally funded research organizations. The objective was to
understand if these organizations assess technology transfer success attributes as part
of their evaluation criteria for research proposals.
Ultimately, the literature review identified gaps that are addressed by this
research effort.
2.1 Citing TT in the Research Proposal Phase
One assumed outcome of research is that it will be applied to solve a problem.
When should the technology transfer activities start? Literature suggests that technology
transfer should not start once the research is finished. Rather, it is an integral part of the

19
research and development process. The following literature review infers that TT should
be considered as part of the research proposal evaluation process.
In Mead and Presley’s research [111], they connect the need to innovate and stay
competitive to research that addresses an organization’s strategic objectives. As such,
they developed a model to select a research portfolio. The evaluation criteria include
elements that consider the end-state of the research, in other words, the technology
transfer. For example, the probability of market success, market size, existence of a
project champion, and availability and competence of resources were assessed [111].
While technology transfer was not explicitly mentioned, consideration is given to the
potential of project success and application or technology transfer.
Hsu, et al [112], explicitly mention technology transfer as part of their research
project selection model. Their selection criteria consider the “…success rate of
commercialization…the probability of the success in technology transfer, product
development, and commercialization…”. The authors also state that their methodology
will help to develop better projects and hence improve the likelihood of
commercialization and technology transfer.
Similar evaluation criteria regarding assessment of commercialization are seen in
the research done by Bordley [113] and Bard [114]. In both cases, the probability of
successful commercialization is seen as a necessary evaluation consideration when
selecting a research proposal.
Kumar’s research of using an AHP based system for R&D project evaluation has
commercial sponsorship as one of the evaluation criteria [115]. When the importance of

20
the evaluation criteria was determined, commercial sponsorship ranked the most
important (when compared to other criteria).
This section of the literature review suggests that technology transfer should
be an integral part of the research proposal evaluation phase. The implication is that
the earlier researchers and recipients start to consider technology transfer the more
likely the technology will survive the theoretical “valley of death” often experienced
by research projects. The theories about including technology transfer topics as part
of the research proposal phase are practically considered when the evaluation criteria
for several research organizations are presented in section 2.4 of the literature review.
The next section examines those success attributes that are necessary for
technology transfer and organizes them using a multi-perspective approach.
2.2 Attributes of Successful TT
A comprehensive literature review was conducted to understand what is necessary
for successful technology transfer. Is there a special “recipe” that will guarantee a
successful technology transfer? What should the research organization focus on to be
successful? Should the technology recipient focus on similar attributes? Or do
something different instead? How should the researcher and the technology recipient
interact to emphasize the relationship element of technology transfer? The goal of this
literature review section is to identify and define the success attributes. Initially the
technology transfer literature was organized using Reisman’s taxonomy. Organizing the
literature this way was helpful to identify ways of conceptualizing the voluminous
amount of technology transfer literature. Reisman’s taxonomy categorizes technology

21
transfer into four main factors: the actors, transaction types, motivations, and disciplines
involved in the technology transfer [116]. The first factor describes the actors – who is
involved in the transfer process? Sub groups include scientific discipline, geographic
locations, etc. Next are the transaction types that are important to frame the transfer
process – does the process include internal or external elements, joint venture
opportunities, or intellectual property, etc. As implied, motivations describe the reasons
for executing the technology transfer. The disciplines factor helps to understand if the
technology transfer discussion is related to economics, management, etc. A complete
definition of the framework is included in Appendix B. As previously stated, a taxonomy
framework was helpful to identify likely themes for organizing technology transfer
literature.
The taxonomy was an initial way to frame the success attributes and look for
logical groupings. The final aggregation of success attributes is an assimilation of H.A.
Linstone, Bozeman, and Greiner and Franza’s work [160, 54, 61] . The final analysis
structure looks at Organizational, Technological, Social, and Market Readiness; Bozeman
and Franza, Greiner’s emphasis is on creating a market ready to accept the technology.
Using this framework, success attributes related to technology transfer are considered.
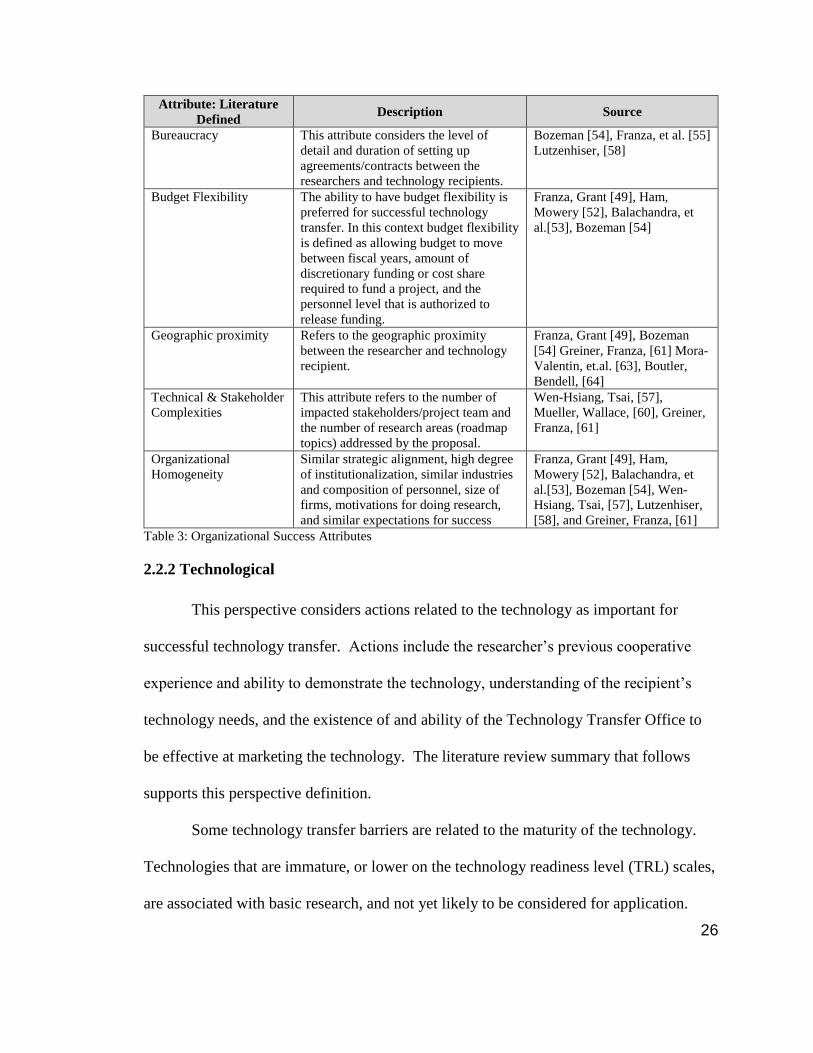
2.2.1 Organizational
Organizational elements emphasize actions or processes within an organization
that are necessary for successful technology transfer. Resounding themes in literature are
developed in subsequent paragraphs. Researchers agree that less bureaucracy, close
proximity between the researcher and the technology recipient and the benefits of the two

22
organizations to have a similar make-up in terms of size, mission objectives, overall
having organizational homogeneity, are beneficial for technology transfer. Literature
also discusses the need to have a flexible budget as beneficial for technology transfer.
Understanding the technical and stakeholder organizational complexities is also
important to consider for technology transfer success.
Agreements or contracts are necessary for research and subsequent technology
transfer. However, the degree of process or bureaucracy related to these agreements has
an impact on successful technology transfer. Big or small, all organizations have a
certain amount of agreements or contracts that are a necessary part of technology transfer.
Bureaucracy is associated with any organization. Franza and Greiner suggest that
organizations that have long times to contract or are otherwise bureaucratic in their
processes is not good for technology transfer [61]. The impact of too much process is also
described by Bozeman when he discusses Cooperative Research and Development
Agreements (CRADAs). A CRADA agreement provides a quick and unique access to
extensive government-funded R&D resources that can be pooled with your own money to
yield powerful research results, while providing intellectual property protection as you
move swiftly to commercialization [100]. Franza, Rogers, and Bozeman agree that the
length of time to execute agreements and extensive bureaucracy is not desirable for
technology transfer.
Ham and Mowrey say that flexible budgets are necessary for successful
technology transfer. Working with the government labs, flexible budgets allow for a
gradual ramp-up of a project. However, too much time to negotiate the contracting

23
mechanism can stall the research and potentially change the project goals. [52].
Bozeman states the inflexible budgets and managerial processes make the CRADA
ineffective with requirements of technology development projects that must meet a tight
schedule for success [100]. Another way of defining budget flexibility is with requiring
cost share as part of the project funding. The Bonneville Power Administration, along
with other Department of Energy research organizations, requires research partners to
share in the financial responsibility of funding a project. There are varying degrees of
cost share required but the purpose is to create a collaborative work environment between
the researcher and technology recipient. This is done through a shared investment.
The proximity between the researcher and the technology recipient is an
important characteristic for successful technology transfer. Mora-Valentin et. al.
hypothesized that the closer the two entities are the better for technology transfer. Closer
geographic locations facilitate face-to-face communications among team members and
encourage relationship building. However, their research results were not conclusive
[63]. In contrast, Franza, et al, identify geographic proximity as a “difference maker”.
As defined a difference maker is a set of attributes that were present in the successful
transfers they researched and tend to be absent in the failed transfer attempts. [49]
Boulter and Bendell look at the contributions of firm size, high degree of
institutionalization, similar experiences for success, the mission of the organization,
similar agendas to successful technology transfers [64]. They describe these similarities
as homophily or organizational homogeneity – they allow people to communicate better
based on the degree of similarity. When there are disparities, especially with the

24
expectations for success, there could be difficulties in successfully transferring the
technology. One example of different expectations would be with national labs.
Typically, the national lab culture is described as slow to change, with a basic research
focus. This is in sharp contrast to private firms, which are characterized by speed, a quick
decision making, and fast returns on investments [53], [138]. Establishing common goals
is a foundation for building collaborative relationships, which are fundamental to
successful technology transfer. Grant and Franza researched 19 technology transfer
actions from the US Air Force lab. The 19 actions or projects included failed and
successful technology transfer. Of these 92.9% of the successes had technology transfer
between similar industries and 100% had similar composition [49]. Research results
from Ham and Mowrey, Balachandra, Bozeman, Wen-Hsiang, and Greiner and Franza
supports the concept of similarities between the research organization and the technology
recipient as contributing to successful technology transfer. The concept of organizational
homogeneity can be extended to include risk propensity. Risk propensity is defined as
the level of research risk he researcher and technology recipient are willing to manage.
Perry states that national labs are risk averse – their target is to by 80-90% successful.
Compare this risk inclination to a start-up where the expectation is an 80-90% failure
rate; these mindsets are in stark contrast. The expectations for success are very different
so the likelihood of successful technology transfer is diminished [56]. Greiner, Franza
specify technical risk adversity as a barrier to technology transfer. In their research
operators are comfortable with the status-quo, which creates an unwillingness to test or
accept the new technology. [61]

25
Finally, complexities related to technologies and stakeholders are considered
relative to successful technology transfer. In order to ensure a sense of ownership is
created with the research, stakeholders need to be considered during the R&D phase.
Their contributions during the R&D phase will facilitate a successful technology transfer.
A common theme related to organizational cultures is the need for stakeholder
engagement. Balachandra states, “…a climate for stimulating innovation and facilitating
meaningful technology diffusion is created by…stakeholders.” [53] Painuly identifies
critical elements necessary for a successful technology transfer to include mechanisms to
realize and encourage stakeholder involvement. Stakeholders are also pivotal to the
identification and navigating barriers to successful outcomes [69]. Related to technical
complexities the more complex technology requires higher cooperation between
transferor and transferee in order to make the best utility in the technology. Technologies
that are more complex will incite more interest and interest in obtaining the technology
from the researcher. [57]
Table 3 summarizes the organizational strategies that are necessary for successful
technology transfer.
26
Attribute: Literature
Defined Description Source
Bureaucracy This attribute considers the level of
detail and duration of setting up
agreements/contracts between the
researchers and technology recipients.
Bozeman [54], Franza, et al. [55]
Lutzenhiser, [58]
Budget Flexibility The ability to have budget flexibility is
preferred for successful technology
transfer. In this context budget flexibility
is defined as allowing budget to move
between fiscal years, amount of
discretionary funding or cost share
required to fund a project, and the
personnel level that is authorized to
release funding.
Franza, Grant [49], Ham,
Mowery [52], Balachandra, et
al.[53], Bozeman [54]
Geographic proximity Refers to the geographic proximity
between the researcher and technology
recipient.
Franza, Grant [49], Bozeman
[54] Greiner, Franza, [61] Mora-
Valentin, et.al. [63], Boutler,
Bendell, [64]
Technical & Stakeholder
Complexities
This attribute refers to the number of
impacted stakeholders/project team and
the number of research areas (roadmap
topics) addressed by the proposal.
Wen-Hsiang, Tsai, [57],
Mueller, Wallace, [60], Greiner,
Franza, [61]
Organizational
Homogeneity
Similar strategic alignment, high degree
of institutionalization, similar industries
and composition of personnel, size of
firms, motivations for doing research,
and similar expectations for success
Franza, Grant [49], Ham,
Mowery [52], Balachandra, et
al.[53], Bozeman [54], Wen-
Hsiang, Tsai, [57], Lutzenhiser,
[58], and Greiner, Franza, [61]
Table 3: Organizational Success Attributes
2.2.2 Technological
This perspective considers actions related to the technology as important for
successful technology transfer. Actions include the researcher’s previous cooperative
experience and ability to demonstrate the technology, understanding of the recipient’s
technology needs, and the existence of and ability of the Technology Transfer Office to
be effective at marketing the technology. The literature review summary that follows
supports this perspective definition.
Some technology transfer barriers are related to the maturity of the technology.
Technologies that are immature, or lower on the technology readiness level (TRL) scales,
are associated with basic research, and not yet likely to be considered for application.

27
However, technologies that have higher TRLs (levels 8-9) are ready for demonstration;
the concept of technology readiness levels was introduced in Chapter 1. Mueller, M, et al,
Shove, E, and Luiten, E. et al state that the interest in a technology is elevated when there
have been successful demonstration projects [60]. Successful demonstrations minimize
the risk of investing in an otherwise unknown technology communicate the benefits of
using the technology, help to develop interoperability standards [122] and provide an
opportunity for user feedback that could be included in future revisions. In fact, these
demonstrations help to create a market, or demand, for the technology. These
demonstrations set the stage for a “market-pull” environment, where technology transfer
is more likely to occur. The researchers suggest that successful demonstration projects
help to establish the market and this market is made up of individuals who will be
technology recipients. Demonstration projects are helpful to minimize the public’s
perception of the “invisibility of energy measures” [61]. In other words, the public is less
likely to adopt a technology if they cannot appreciate the net benefit. The technology
must address the question, “What’s in it for me?” Specific to energy efficiency
innovations, communication is vital to increase user acceptance or encourage people to
use the technology. One way of communicating is through demonstrations or technology
publications.
It is important to understand the needs of the technology recipient. This
knowledge helps to proactively address the question of “what’s in it for me.” The
public’s willingness to change has the potential of stifling technology transfer. They
don’t want to change their lifestyle (e.g. turning back their hot water heater or turning up

28
their air conditions in demand response scenarios), they are skeptical of new innovations,
and there is a feeling that the public opinion was not considered when designing
products. In these cases, a market was not created. [69], [54].
The existence of a dedicated technology transfer office is identified as a
“difference maker”, when considering successful attributes. Franza, et al research [49]
was to identify attributes most strongly associated with successful technology transfer.
Franza identified “difference makers” as essential elements that were included in the
majority of successful transfers. The existence of a dedicated TT Office was foremost. It
is a necessary conduit moving from research into application. Given the existence of a
TTO, it should be staffed with marketing experience and dedicate a portion of the budget
to marketing and technology transfer activities is seen as essential to create a market that
is willing to accept the technology [66]. Franza states that emphasis should be placed on
advertising to the relevant industry [49]. In fact, Siegel suggests that the TT Office
should be staffed with marketing personnel [66]. A market pull is more easily created if
the needs of the adopters are understood.
Technology elements do not refer to the technology itself, in terms of its ability to
meet technology specifications (e.g. durability, etc.). Rather the focus is on setting up an
environment for technology transfer to occur. In addition, an emphasis is placed on
activities that create a market that is ready to accept the technology. Therefore,
Technological elements are defined as creating these opportunities. Table 4 summarizes
the Technological success attributes.

29
Attribute: Literature
Defined Description Source
Cooperative Experience How much experience does the researcher have
working with others? Are they new (no
cooperative experience) or are they very familiar
working with other organizations on R&D. More
cooperative experience implies higher likelihood
of technology transfer because they are familiar
with potential barriers based on their previous
experience.
Wen-Hsiang, Tsai,
[57], Mora-Valentin,
et.al. [63]
Understanding the
Recipient
Understand perceptions of adopters; How familiar
is the research organization with the customer
requirements and/or market needs?
Sharma, [48],
Balachandra, et al.
[53], Isaacs, et al. [67]
Educate/Demonstrate
Technology
How many successful technology demonstrations
does the organization have (for the case study)? As
an example, assuming the case study is for demand
response technologies, how many demonstrations
of heat pump water heaters has the researcher been
involved with - more technology demonstrations
are better for successful technology transfer.
Demonstrations are one way to educate others
about the technology.
Balachandra, et al.
[53], Wen-Hsiang,
Tsai, [57], Greiner,
Franza, [61], Spann, et
al. [65]
Dedicated TTO Does the research organization have a dedicated
TTO that can coordinate activities between the
researcher and the technology recipient?
Franza, Grant, [49]
TTO Marketing
Experience
Literature suggests that the TTO should be staffed
with personnel who have marketing experience.
Siegel, et al. [66]
Table 4: Technological Success Attributes
2.2.3 Social
The social perspective is the view of the situation from the eyes of the
individual(s) and involve actions related to people. A common theme among the
researchers is creating an atmosphere of trust – having transparent, effective
communication is pivotal for success. This involves a heightened cultural awareness as
necessitated by an ever-developing global economy. The policies around how many
people are dedicated to the technology transfer effort and the willingness of the
researcher to “loan” personnel is desirable for successful technology transfer. Finally,
recognizing success with a reward system is cited as beneficial for technology transfer.
These themes will be developed and substantiated with literature citations.

30
An atmosphere of trust is created by effective and frequent communication
throughout the R&D process. Communication within or to an organization is also
significant as technology moves from research and development to the early stages of
technology transfer. Consistent throughout the literature was the significant influence
communication had on the technology transfer process, especially when discussing
energy innovation. L.M. Murphy, et al states that “…reducing information gaps between
public and private sectors…” and “…ensuring access to data knowledge…” is essential.
[123]. Other authors discuss the higher the trust the more willing an organization is to
share information – the trust is established via effective and active communication. [52]
“Trust is crucial in aiding the process involved with the transfer of all types of
knowledge” [101]. Lai and Tsai state that the technology transfer process faces many
skills related to the interaction of the stakeholders [57]. Therefore, a clear, positive, and
understandable message facilitates technology transfer. Mora-Valentin verified that there
was a correlation between higher levels of trust and a positive influence on technology
transfer. [63]
The idea of developing a relationship by creating an atmosphere of trust between
the researcher and the recipient is complementary to the success attribute of cultural
awareness. The global world economy provides opportunities to interface with other
cultures. Being sensitive to communication styles, different heritages, and being
cognizant of the diversity of technology recipients is necessary for successful technology
transfer. Lai and Tsai state “…cultural awareness is seen by researchers as necessary for
successful technology transfer. Cultural differences have a significant impact on the

31
success or failure of TT. Also, it is obvious that the higher similarity of cultures for two
parties, the greater facilitation to the TT’s performance…” [57]. Boulter and Bendell
agree by stating “…attitude towards outsiders…find a common ground to be able to
communicate effectively about multiple interests to seek a shared sense of purpose, goals,
and rewards…” [64] Regarding university technology transfer, Siegal says that work to
eliminate cultural and informational barriers which are an impediment to technology
transfer process. [66]
Personnel involved in the technology transfer process, whether they be dedicated
to integrate the technology or whether the research organization has a favorable leave
policy, is beneficial for technology transfer. Related to university technology transfer,
Siegal suggests devoting extra resources to the process [66]. Franza et al., suggest that
the technology recipient should dedicate personnel over the life of the transfer project.
This is one of the seven “difference makers” Franza identifies for successful technology
transfer [49]. The research done by Mora-Valentin et al., says that more commitment has
a positive influence on technology transfer [63]. Finally, E.M. Rogers suggests that the
favorable entrepreneurial leave policies of the federal labs encourage technology transfer.
By allowing researchers to be loaned to the technology recipient they are being used as a
technology transfer mechanism, in essence, the movement of technology through people.
This is a common practice in Japan. E.M. Rogers, et al uses a case study to illustrate the
effectiveness of ‘shuko’ – a Japanese term that describes the temporary transfer of
personnel knowledgeable about the technology to work with the technology recipient.

32
This process encourages tacit knowledge transfer which is seen as having the potential
for greater pay-offs than tangible products [62].
Acknowledging successful transfers by having an established reward system
encourages more innovative thinking as well as suggests the researchers have knowledge
and experience with those attributes necessary for successful technology transfer. Siegal
states that if universities want to foster an atmosphere of commercialization, one area of
focus should be on developing a rewards system [66]. This practice is also in place at
national labs and industry with the appointment of “Fellows”. This is a way of
recognizing technical excellence in support of the organization’s mission statement. To
encourage research not being done in their “spare time”, the CHI panel discussion
encourages a reward system. [166]
The balance between the public’s disdain for new technology and realizing the
benefits of the technology is precarious. The relationships between national labs and
private firms are on similar footing. The consensus among the researchers is that sharing
of information, personnel, and using opportunities for transparency are fundamental for
successful technology transfer. Table 5 summarizes the social success attributes for
technology transfer.
Attribute:
Literature Defined Description Source
Atmosphere of
Trust
Fundamental to successful technology
transfer is establishing a trusting
relationship between the research and
technology recipient. This can be
accomplished by frequent communication,
structured project management,
cooperative risk assessments, etc.
Franza, Grant, [49], Wen-
Hsiang, Tsai, [57], Greiner,
Franza, [61], Rogers, et al.
[62], Mora-Valentin, et al.
[63], Boulter, Bendell, [64]
Cultural Awareness Personnel that are more aware of and have
more experience interacting with different
Wen-Hsiang, Tsai, [57],
Greiner, Franza, [61], Mora-

33
Attribute:
Literature Defined Description Source
cultures are more successful at technology
transfer.
Valentin, et al. [63], Boulter,
Bendell, [64]
Personnel
Involvement
This attribute refers to the degree that
researchers are involved in the hand-off
process. When do the researchers start to
consider technology transfer and start to
involve end-users/technology recipients
Ham, Mowrey, [52], Rogers, et
al. [68]
Manpower
Flexibility
The willingness to “loan” researchers to
help with technology transfer was cited as
necessary for technology transfer;
favorable leave policies;
Balachandra, et al. [53], Perry
[56]
Rewards System Does the research or technology recipient
organization have systems in place to
recognize innovative thinking? Literature
suggests that having a reward system in
place facilitates technology transfer.
Franza, Grant, [49], Wen-
Hsiang, Tsai, [57], Greiner,
Franza, [61], Rogers, et al.
[62], Mora-Valentin, et al. [63]
Table 5: Social Success Attributes
2.2.4 Market
The last perspective to consider when identifying technology transfer success
attributes is Market. As the name implies, these success elements emphasize those
attributes that are necessary to create a market that is willing and ready to accept the
technology. These attributes include creating a business plan, having common
standards and government incentives to encourage transfer, and establishing that the
technology is financially feasible – think making a business case for solar panels.
Related to people within the technology recipient organization, a supportive champion
and the level of interest from top management can have an impact on technology
transfer success. Each of these assertions is developed to include references from
literature.
The adoption of solar panels is a good example of how financial feasibility, using
government incentives, works to create a viable market for the technology. Initially
34
solar was too expensive for widespread adoption by the consumer. However, as the
technology matured and incentives were implemented the business case improves and
adoption increases. Examples of government incentives include the 2009 Recovery Act,
which invested billions into energy research. At the consumer level, the Ashland, OR
“Bright Way to Heat Loan” encourages solar-based water heating. The latter incentive is
targeted to residential customers in the form of rebates or access to interest free loans. In
a market dominated by incumbent technologies, the researchers agree that in order to
realize wide spread diffusion of a new technology, policies that encourage adoption are
necessary. L.M.Murphy, et al, states “…government activities to promote sustainable
energy technologies must include both a supply push and a demand pull…” [123] This
environment is created by effective government policies. Fred Gordon, Energy Trust
Oregon, suggested that in order to transform the market, the government agencies need to
inject supply chain features when developing a technology as well as to provide training
skills to help market adoption. Related to green buildings N.Kok, et al, provides evidence
that the “…diffusion of energy efficient technologies is more responsive to energy
prices…” [153]. Incentives to help create financial feasibility is also supported by
Balachandra, “…government activities to support…adoption include both supply-push
and demand-pull policies during the period spanning pre-commercialization…” [53]. Lai
and Tsai state that, “…government policy is always a crucial factor in influencing
technology transfer. The integrity of law…will stimulate or facilitate technology transfer
activities.” [57] Franza identifies having a business plan for commercialization as one of
his “difference makers” and serves as the basis for determining financial feasibility [49].

35
Grant and Franza’s research, which examined 19 technology transfer activities, shows
that an adequately funded project was present in 71% of successful transfers and having a
business plan in place was identified in 80% of successful transfers. [49]
Related to the need for support within the technology recipient organization, the
CHI panel discussion stated, “…people, not papers, transfer technology. Technology
transfer is a grass roots effort and requires buy-in and active participation. It requires
support from the top.” [166] Lai and Tsai state that the technology recipient’s support is
an important factor for successful technology transfer [57]. Carayannis, et al., examined
five successful technology transfer cases and the presence of an internal champion and
their commitment through the transfer process was vital; a strong champion was
identified as a bridge between the research and technology application [103]. In
Balachandra’s research, top management support was a component in 100% of all
successful technology transfers [53]. Bozeman supports the need for active support from
management, “…Projects were more likely to transfer if they were initiated by either the
R&D managers or top managers in the company…” [54]
The Table 6 summarizes the market related success attributes.
Attribute: Literature Defined Description Source
Business Plan Clearly defined need is created;
technology recipient has a
business plan for
commercialization; Diffusion
process needs to be induced;
Does a comprehensive business
plan exist that supports the
technology in the recipient
organization?
Franza, Grant, [49]
Balachandra, et al. [53]

36
Attribute: Literature Defined Description Source
Government Incentives Incentives are seen as a way to
entice a market to invest in
technology. Examples include
rebates for purchasing LED
lightbulbs or tax credits for
wind farms.
Balachandra, et al. [53]
Financial Feasibility Has financial feasibility been
determined? Examples include,
price point of solar panels for
the residential market have not
been completely realized and is
seen as one of the barriers to
their widespread adoption in
the US.
Sharma, [48], Franza, Grant
[49]
Organizational Technology
Champion
A dedicated champion in the
recipient organization is
fundamental to successful
technology transfer. The
champion can shepherd the
technology through
organizational barriers; a sense
of ownership is created.
Balachandra, et al. [53],
Bozeman [54], and Painuly,
[69]
Level of Top Management
Interest
Technology transfer initiated
and having top management
involvement is necessary for
technology transfer.
The top management in the
organization needs to see the
value of the technology. Their
support is required for
successful technology transfer.
Bozeman [54]
Common Standards Common standards help to
facilitate the introduction of
multiple but similar
technologies into the market.
Common communication
protocols are examples of
standards that help to facilitate
demand response technologies.
Neshati, [41], Balachandra, et
al. [53]
Table 6: Market Success Attributes
37
2.3 Methods use in TT Research
The comprehensive review of technology transfer attributes identified a number
of ways to understand and evaluate technology transfer. However, none assimilates
multiple attributes into a practical tool for assessing the potential of technology transfer.
A taxonomy approach was successful to understand the relationships and success
attributes related to technology transfer. Therefore, a similar approach was used to
capture how other researchers have analyzed technology transfer. Table 7 was adapted
from the taxonomy used by Tran and Kocaoglu [75]. The adaptation was to add the
success attributes as a sub-category to the research topics completed in Tran, Kocaoglu’s
work. As an example, literature, patents, license, etc. were added as examples of transfer
media. The articles were categorized based on their research method. A number of
different methods were used to understand the success attributes and their contribution to
technology transfer. However, none attempted to assess them in totality. Following the
table, considerations for each research method are discussed.
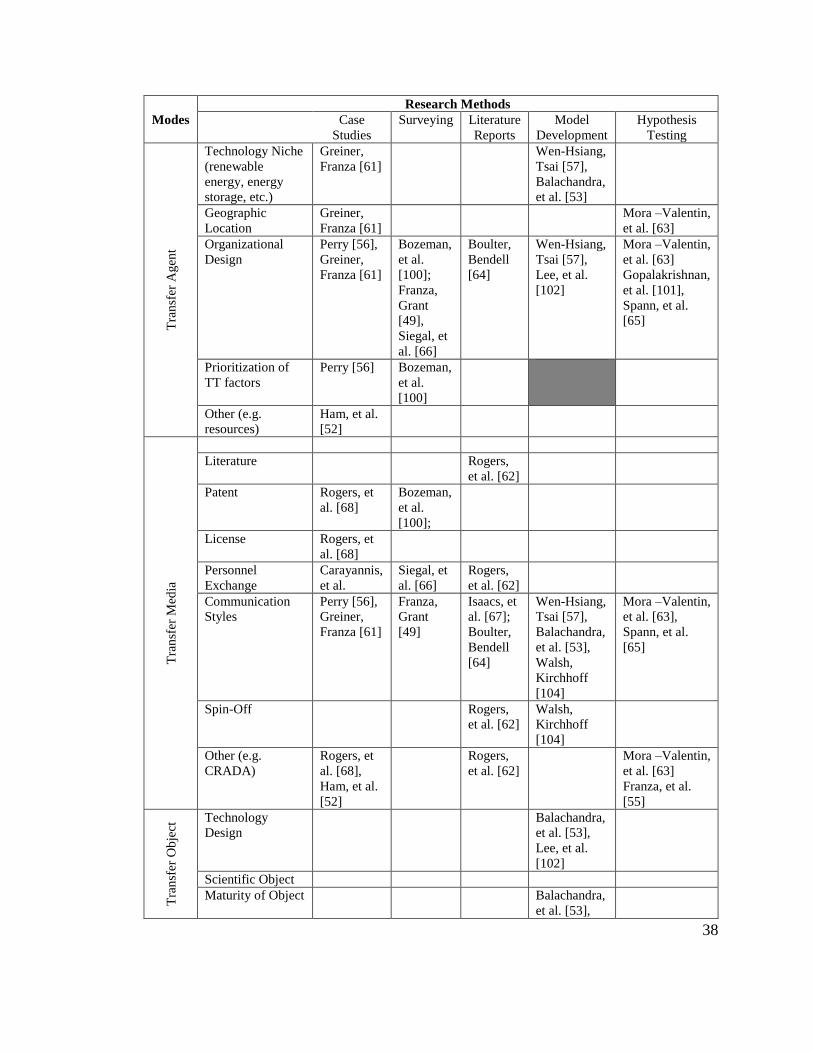
38
Modes
Research Methods
Case
Studies
Surveying Literature
Reports
Model
Development
Hypothesis
Testing
Tra
nsf
er A
gen
t
Technology Niche
(renewable
energy, energy
storage, etc.)
Greiner,
Franza [61]
Wen-Hsiang,
Tsai [57],
Balachandra,
et al. [53]
Geographic
Location
Greiner,
Franza [61]
Mora –Valentin,
et al. [63]
Organizational
Design
Perry [56],
Greiner,
Franza [61]
Bozeman,
et al.
[100];
Franza,
Grant
[49],
Siegal, et
al. [66]
Boulter,
Bendell
[64]
Wen-Hsiang,
Tsai [57],
Lee, et al.
[102]
Mora –Valentin,
et al. [63]
Gopalakrishnan,
et al. [101],
Spann, et al.
[65]
Prioritization of
TT factors
Perry [56] Bozeman,
et al.
[100]
Other (e.g.
resources)
Ham, et al.
[52]
Tra
nsf
er M
edia
Literature Rogers,
et al. [62]
Patent Rogers, et
al. [68]
Bozeman,
et al.
[100];
License Rogers, et
al. [68]
Personnel
Exchange
Carayannis,
et al.
Siegal, et
al. [66]
Rogers,
et al. [62]
Communication
Styles
Perry [56],
Greiner,
Franza [61]
Franza,
Grant
[49]
Isaacs, et
al. [67];
Boulter,
Bendell
[64]
Wen-Hsiang,
Tsai [57],
Balachandra,
et al. [53],
Walsh,
Kirchhoff
[104]
Mora –Valentin,
et al. [63],
Spann, et al.
[65]
Spin-Off Rogers,
et al. [62]
Walsh,
Kirchhoff
[104]
Other (e.g.
CRADA)
Rogers, et
al. [68],
Ham, et al.
[52]
Rogers,
et al. [62]
Mora –Valentin,
et al. [63]
Franza, et al.
[55]
Tra
nsf
er O
bje
ct Technology
Design
Balachandra,
et al. [53],
Lee, et al.
[102]
Scientific Object
Maturity of Object Balachandra,
et al. [53],
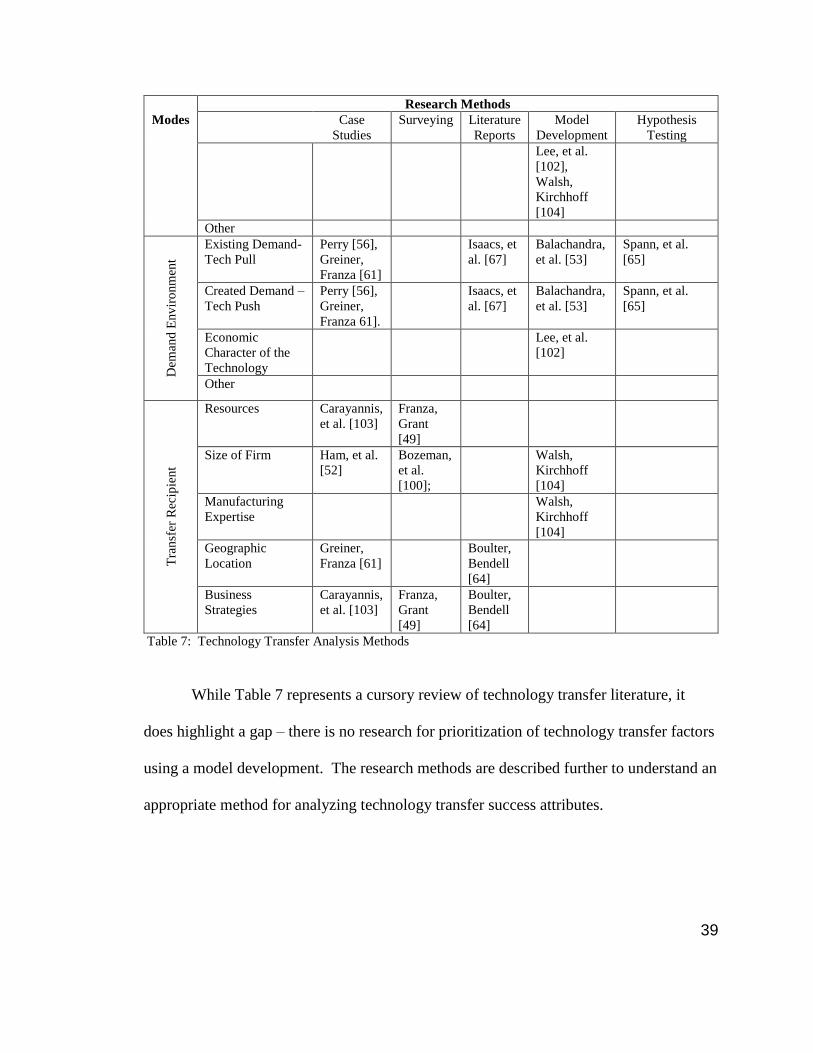
39
Modes
Research Methods
Case
Studies
Surveying Literature
Reports
Model
Development
Hypothesis
Testing
Lee, et al.
[102],
Walsh,
Kirchhoff
[104]
Other
Dem
and
Env
iro
nm
ent
Existing Demand-
Tech Pull
Perry [56],
Greiner,
Franza [61]
Isaacs, et
al. [67]
Balachandra,
et al. [53]
Spann, et al.
[65]
Created Demand –
Tech Push
Perry [56],
Greiner,
Franza 61].
Isaacs, et
al. [67]
Balachandra,
et al. [53]
Spann, et al.
[65]
Economic
Character of the
Technology
Lee, et al.
[102]
Other
Tra
nsf
er R
ecip
ien
t
Resources Carayannis,
et al. [103]
Franza,
Grant
[49]
Size of Firm Ham, et al.
[52]
Bozeman,
et al.
[100];
Walsh,
Kirchhoff
[104]
Manufacturing
Expertise
Walsh,
Kirchhoff
[104]
Geographic
Location
Greiner,
Franza [61]
Boulter,
Bendell
[64]
Business
Strategies
Carayannis,
et al. [103]
Franza,
Grant
[49]
Boulter,
Bendell
[64]
Table 7: Technology Transfer Analysis Methods
While Table 7 represents a cursory review of technology transfer literature, it
does highlight a gap – there is no research for prioritization of technology transfer factors
using a model development. The research methods are described further to understand an
appropriate method for analyzing technology transfer success attributes.
40
2.3.1 Case Study
As defined, a case study approach is a descriptive, exploratory or explanatory
analysis of a person, group or event. An explanatory case study is used to explore
causation in order to find underlying principles [76]. A case study provides a detailed
contextual analysis of a limited number of events and describes their relationship. The
method is often used by social scientists to understand the relationship between real-life
and proposed models. In addition, the method is used for comparisons of organizations
to illustrate their theoretical concept. [76]
Some of the drawbacks of a using a case study approach are that only a small
number of environments are studied and the method does not offer reliability or
repeatability as an analysis tool; as a tool they lack scientific rigor to draw definite
conclusions. As a result, they are recommended for exploratory research only. In
addition, the potential for bias is introduced when only one case is studied. [76]
2.3.2 Surveying
Surveying is defined as a non-experimental descriptive research method, used to
assess thought, opinions or feelings [77]. The method is useful to collect data on
phenomena that cannot be directly observed. Often, it is used to assess attributes and
characteristics. Therefore, the sample population is critical to a successful survey. This
last point is also an issue for using a survey as an analysis tool – designing an experiment
can be challenging. The challenges include ensuring the sample is random and that the
questions asked are to exact and accurate to obtain the desired information. Also,
assumptions about the terminology can lead to incorrect outcomes or conclusions. [77]
41
2.3.3 Literature Reports
This analysis tool is defined as text written by someone to consider the critical
points of current knowledge including substantive findings, as well as theoretical and
methodological contributions to a particular topic. Literature reviews are secondary
sources, and as such, does not report any new or original experimental work [78]. This
analysis tool is helpful to identify gaps in the literature as was done for this research.
This analysis tool should be used as a basis for starting research; it is effective to
generate a hypothesis or as a background. However, the tool does not synthesize
information and often the reader is left to draw his or her own conclusions. [78]
2.3.4 Model Development
Model development is an effective research method. It assists investigators and
scientists in relating more accurately to reality; it also aids them to describe, predict, test
or understand complex systems or events. Thus, models often provide a framework for
the conduct of research and might consist of actual objects or abstract forms, such as
sketches, mathematical formulas, or diagrams. A model is an abstraction, a mental
framework for analysis of a system. [79]
There are several benefits to developing a model for analysis purposes. In
general, a multi-criteria decision model is used to illustrate relationships. The
information is presented in a way such that policy makers can understand alternatives and
their relationship to the hierarchy or other intangible attributes [81]. A model also
aggregates the opinions of experts – their input is captured and allows for ranking of
alternative to inform a decision.

42
Model development has limitations. The number of pairwise comparisons
required to comprehensively describe the model could be significant and a deterrent to
soliciting expert participation. Additionally, there is a potential for achieving linear
quality on outcomes/decisions - the framework to solicit feedback could be considered
restrictive (e.g. pairwise comparisons). As mentioned with surveying, the word choice
needs to be explicit and decisive to minimize interpretation by the expert panels. Finally,
the tendency is to use the outcome of a model as an absolute answer. Rather, the
outcomes should be used to inform decisions.
2.3.5 Hypothesis Testing
The process of testing an assumption about a population parameter is referred to
as hypothesis testing. The process defines the null hypothesis (Ho) which is the sample
observation results purely from chance and the alternate hypothesis (Ha) which is he
sample observation is influenced by some non-random cause. [80] The issues with
hypothesis testing, relative to this research, include sample size, obtaining a
representative population, and interpretation of results. The results only represent the
probability that the null hypothesis should be rejected. The design of the experiment is
critical. Overall, this would not be an appropriate tool for the purposes of this research.
There are many approaches to analyzing a research topic. For the research
presented, a decision model is well suited to describe a multi-dimensional relationship as
well as to quantify otherwise subjective attributes. Also, it provides clear connections to
the mission objective and alternatives, allowing decision makers to make informed
choices.

43
The next section describes how the success attributes are considered as part of the
research proposal phase. Recall from section 2.1, literature suggests that technology
transfer should be reflected in the research proposals.
2.4 Evaluation of Research Proposals by Funding Agencies
The last section of the literature review is to understand how research
organizations evaluate research proposals. Are the criteria identified as necessary for
technology transfer used in their decision processes?
A subset of government organizations was reviewed to determine if and how
technology transfer was considered in their proposal evaluation criteria. These
organizations included the Department of Energy (DOE), National Science Foundation
(NSF), National Institutes of Health (NIH), Bonneville Power Administration (BPA) and
the California Energy Commission (CEC); the DOE is a large organization with many
groups that sponsors research. Therefore, two DOE groups were reviewed: the Advanced
Research Project Agency – Energy (ARPA-e) and Energy Efficiency and Renewable
Energy (EERE) [1] – [35], [170], [171]. The investments made by these organizations
are significant, ranging from $30.2B in 2015 by the NIH to approximately $18M by BPA
in 2016. Despite the disparity in the investments levels, there is still a need to ensure that
the research dollars are spent purposefully in order to achieve their individual missions.
Templates and evaluation criteria used by each organization are provided for reference in
Appendix A. Are there similarities in how they select a portfolio? How do they differ in
their evaluations? To what extent do they consider the technology transfer attributes
identified in chapter 2.2? These topics are presented followed by a discussion of how this
44
research topic, a technology transfer score, could contribute to a more comprehensive
evaluation approach.
2.4.1 Department of Energy: EERE and ARPA-e
The United States Department of Energy (DOE) is a Cabinet-level department of
the United States government concerned with the United States' policies regarding energy
and safety in handling nuclear material. Its responsibilities include the nation's nuclear
weapons program, nuclear reactor production for the United States Navy, energy
conservation, energy-related research, radioactive waste disposal, and domestic energy
production. The agency’s current administrator is Energy Secretary Dr. Ernest Moniz.
The origin of the agency resides in nuclear energy. In 1942, during World War II,
the United States started the Manhattan Project, a project to develop the atomic bomb,
under the eye of the U.S. Army Corps of Engineers. After the war, the Atomic Energy
Commission (AEC) was created to control the future of the project. The AEC was
reinstated and gave way to Nuclear Regulatory Commission, which was tasked with
regulating the nuclear power industry, and the Energy Research and Development
Administration, which was tasked to manage the nuclear weapon, naval reactor, and
energy development programs.
The 1973 oil crisis called attention to the need to consolidate energy policy. On
August 4, 1977, President Jimmy Carter signed into law The Department of Energy
Organization Act of 1977 (Pub.L. 95–91, 91 Stat. 565, enacted August 4, 1977), which
created the Department of Energy. The new agency, which began operations on October
1, 1977, consolidated the Federal Energy Administration, the Energy Research and
45
Development Administration, the Federal Power Commission, and programs of various
other agencies. [27]
EERE
The mission statement for the EERE includes its commitment to creating a clean
energy economy. Also, the agency leads the DOE’s “…efforts to develop and deliver
market-driven solutions for energy-saving homes, buildings, and manufacturing;
sustainable transportation; and renewable electricity generation.”[33]. Similar to the
other organizations discussed in this response, the EERE partners with industry,
state/local governments, universities and other manufacturers to develop a portfolio that
invests in clean energy technologies. The net effect of sponsoring these proposals will be
to strengthen the economy, protect the environment and reduced dependency on foreign
oil supplies [33]. The emphasis of EERE proposals are around improving energy
efficiency practices and increasing their adoption.
The EERE has a process in place for managing the portfolio using a structured
approach. The process begins with a solicitation, referred to as a Funding Opportunity
Announcement (FOA), via a web portal (http://www1.eere.energy.gov/financing/) [36].
The link directs the applicant to relevant documents, templates, and evaluation criteria.
EERE’s uses a two-phased approach to evaluate proposals. Phase I is an initial review
and serves as a screening process. An eligibility determination is made based on the
information that is provided in the initial documents. This information should include
clear objectives for a relevant topic. The assessment can be done by the financial officer
and is facilitated by the checklist provided in Appendix A. This checklist can be tailored
46
to include more specific criteria as appropriate for the solicitation. Assuming the
requirements are met, the proposal is submitted to a more thorough Phase II review.
However, if the applicant fails to provide the required information in Phase I (e.g.
statement of clear objectives, project team, etc.) they would be removed from further
consideration and notified of their ineligibility by the financial officer.
Phase II is a more comprehensive merit review. This phase includes an
evaluation of the proposal by two review panels, an independent review and then a
requirement to achieve consensus ratings. The purpose of this phase is to conduct a
thorough, consistent and objective examination of applications based on the pre-
established evaluation criteria set forth in the funding announcement. The evaluation
criteria include the following elements:
Criterion 1: Scientific and Technological Merit – This criterion describes the degree to
which the proposed technology and methodology meets the stated objectives of the
funding announcement, identifies and/or makes progress with new or existing concepts,
and the degree to which the work is based on sound scientific and engineering principles.
The likelihood of developing the successful technology is also considered. The
evaluators are asked to assess the anticipated benefits of the proposed work, relative to
current commercial or emerging technologies.
Criterion 2: Technical Approach – This criterion takes into account the following
elements:
Adequacy and feasibility of approach to achieving the stated objectives,

47
Appropriateness, rationale, and completeness of the objectives – in other words
the clarity of the proposal
Extent of prior research experience
Adequacy of the schedule, staffing plan, and travel, identified high risk challenges
and presented reasonable mitigation strategies, and
Sufficiency of the technology transfer plan
Criterion 3: Technical and Management Capabilities - Finally the evaluators assess the
capability and experience of the applicant and associated organizations. The focus of this
criterion is on the clarity, completeness and appropriateness of the project management
plan, demonstrated capability and experience of the team (to include participating
organizations), and the adequacy of the proposed personnel and other resources to
perform the project tasks.
While the financial assistance officer can exclusively conduct the initial review,
the reviews may include obtaining input and expertise from individuals within EERE, or
other individuals from industry, academia, and national laboratories. This process
ensures a comprehensive and well-vetted review.
ARPA-e
The Advanced Research Projects Agency Energy (ARPA‐E), an organization
within the Department of Energy is chartered by Congress in the America COMPETES
Act of 2007 (P.L.110‐69), as amended by the America COMPETES Reauthorization Act
of 2010 (P.L. 111‐358). The agency was established with the sole objective of
48
supporting the creation of transformational energy technologies and systems through
funding and managing Research and Development (R&D) efforts. A more detailed
history of the agency was obtained on the ARPA-e website [28]: In 2005, leaders from
both parties in Congress asked the National Academies to "identify the most urgent
challenges the U.S. faces in maintaining leadership in key areas of science and
technology," as well as specific steps policymakers could take to help the U.S. compete,
prosper, and stay secure in the 21st Century. In its report for Congress, Rising Above the
Gathering Storm: Energizing and Employing America for a Brighter Economic Future,
the National Academies called for decisive action, warning policymakers that U.S.
advantages in science and technology--which made the country a world leader for
decades--had already begun to erode. The report recommended that Congress establish an
Advanced Research Projects Agency within the U.S. Department of Energy (DOE)
modeled after the successful Defense Advanced Research Projects Agency (DARPA) -
the agency credited with such innovations as GPS, the stealth fighter, and computer
networking.
In 2007, Congress passed and then President George W. Bush signed into law
The America COMPETES Act, which officially authorized ARPA-E's creation. In
2009, Congress appropriated and President Barack Obama allocated $400 million to
the new Agency, which funded ARPA-E's first projects. Since this time, ARPA-E has
funded over 350 potentially transformational energy technology projects. Many of
these projects have already demonstrated early indicators of technical success and
include:

49
Developed a 1 megawatt silicon carbide transistor the size of a fingernail
Engineered microbes that use hydrogen and carbon dioxide to make liquid
transportation fuel
Pioneered a near-isothermal compressed air energy storage system
ARPA-e funds applied research and development projects. As defined by the
Office of Personnel Management, applied research is “…study designed to gain
knowledge or understanding necessary to determine the means by which a recognized
and specific need may be met.” Ultimately, the ARPA-e proposals want to ensure that the
United States maintains a technological lead in developing and deploying advanced
energy technologies. Their website provides a very explicit and clear understanding of
the types of proposals they fund and, by extension, those they do not fund: “…ARPA‐e
exists to support transformational, rather than incremental research. … While this
incremental improvement of technology is important to the ultimate success of a
technology in the marketplace, ARPA‐E exists to fund transformational research – i.e.,
research that creates fundamentally new learning curves rather than moving existing
technologies down their learning curves.” [30]
How does ARPA-e differ from EERE? Without looking further, it would appear
that they have similar mission statements and objectives. In reality, ARPA-e is a
complement to other DOE R&D organizations by supporting objectives that are
“…transformational and translational…”. The basic research would be funded out of the
Office of Science, and proposals that are interested in the improvement of existing
technology (incremental research) would be supported by the applied programs (e.g.

50
EERE, Office of Nuclear Energy, or Office of Electricity Delivery and Energy
Reliability).
Similar to EERE, ARPA-e has a comprehensive and rigorous portfolio process.
The process begins with a solicitation, referred to as a Funding Opportunity
Announcement (FOA), via a web portal. The portal directs the applicant to relevant
documents, templates, and evaluation criteria.
Unique to ARPA-e, the proposal is required to devote a certain percentage of its
funding to Technology Transfer and Outreach (TT&O) activities. As stated, every
project team must devote 5% of its federal funding award to TT&O. These activities
must be detailed in the proposal. The details of the plan are outlined in the Tech-To-
Market Plan described below:
During award negotiations, Prime Recipients are required to negotiate and submit
an initial Technology‐to‐Market Plan to the ARPA‐E Program Director, and obtain the
ARPA‐E Program Director’s approval prior to the execution of the award. Prime
Recipients must show how budgeted Technology Transfer and Outreach (TT&O) costs
relate to furthering elements of the Technology‐to‐Market Plan. During the project
period, Prime Recipients are required to provide regular updates on the initial
Technology‐to‐Market plan and report on implementation of Technology‐to‐Market
activities. Prime Recipients may be required to perform other actions to further the
commercialization of their respective technologies. [31]
Regarding the evaluation process, a reoccurring theme of using a multi-phased
approach is evident. A description of each phase is provided. [32]
51
ARPA-e Phase 1 Criteria
The emphasis of the first phase is on the impact of the proposal to state of the art
and the overall scientific merit. Each is weighted 50% of the total evaluation. The
impact of the proposal considers the extent to which the technology merits demonstrate
the potential for transformation of an energy related field. It is important that the
applicant demonstrate a comprehensive understanding of the current technology status
and the ability to improve the status quo. This includes knowing other technologies that
provide a solution and a clear statement regarding why this proposal is better (than other
technology solutions). The emphasis of the other 50% is on the scientific and technical
merit of the proposal. Evaluation factors include technical feasibility, a unique and
innovative solution is provided, and the applicants ability to communicate, clearly, the
outcomes, deliverables, and how the technology could be deployed.
ARPA-e Phase 2 Criteria
The first two criteria for phase 2 are the same as phase 1 – impact of technology
and technical merit. However, each is only weighted as 30% of the total. The focus of
the remaining 40% is on the project team and project plan. Of the forty percent, thirty is
reserved for evaluating the qualifications, experience, and capabilities of the project team.
The proposed team must clearly demonstrate that they have the necessary skill, expertise,
and access to facilities as demonstrated by other R&D work. While not insignificant,
10% of the overall phase 2 evaluation is reserved for evaluating the soundness of the
management plan. Factors that are considered include the clarity of the plan to achieve

52
deliverables/results, appropriate levels of effort are communicated, and whether the
schedule is feasible to complete the work.
In addition to the Phase 1 and 2 criteria, other factors may be used at ARPA-e’s
discretion and include:
Portfolio Balance: The goal is to strike a balance between factors like technology,
organizational (e.g. industry, national labs), geographic regions, and
commercialization risk.
Contribution to ARPA-e’s mission goals of reduction of dependence on foreign
oil sources, emphasis on domestic manufacturing and competitiveness, reduction
of emissions, and increases in energy efficiency.
Minimize duplication of efforts between public and private projects, encourages
collaboration with non-governmental entities, and to promote technology transfer.
Funding sources: the extent that the applicant has identified cost sharing
opportunities and demonstrates high potential project impact, relative to the
overall project cost.
The ARPA-e website suggests a yearly solicitation with subsequent year portfolio
projects announced in June and contracts executed to start work at the beginning of the
next fiscal year. Similar to EERE, APRA-e relies on outside reviewers for Phase 2
proposals. These individuals are selected based on their knowledge and expertise in a
relevant field.
Bonneville Power Administration
53
BPA is under the Department of Energy and operates as a non-profit organization
in the Pacific Northwest. The agency provides transmission and markets wholesale
electrical power to five states in the Pacific Northwest. The source of electrical power
comes from 31 federal hydro projects in the Columbia River Basin, one non-federal
nuclear plant, and several other small non-federal power plants. In total, one-third of the
electric power used in the Northwest is provided by BPA. Related to transmission, BPA
operates and maintains approximately three-fourths of the high voltage transmission lines
in the region, approximately 15,300 circuit miles. BPA’s service territory includes Idaho,
Oregon, Washington, and parts of Montana, California, Nevada, Utah and Wyoming.
Overall, the area serviced by BPA covers approximately 300,000 square miles. The BPA
pamphlet provides specifics on their mission, vision, and values. [24]
The Bonneville Power Administration's mission as a public service organization
is to create and deliver the best value for our customers and constituents as we act in
concert with others to assure the Pacific Northwest:
An adequate, efficient, economical and reliable power supply;
A transmission system that is adequate to the task of integrating and transmitting
power from federal and non-federal generating units, providing service to BPA's
customers, providing interregional interconnections, and maintaining electrical
reliability and stability; and
Mitigation of the Federal Columbia River Power System's impacts on fish and
wildlife.

54
BPA is committed to cost-based rates, and public and regional preference in its
marketing of power. BPA will set its rates as low as possible consistent with sound
business principles and the full recovery of all of its costs, including timely repayment of
the federal investment in the system.
As part of their responsibility, BPA promotes energy efficiency, renewable
resources and new technologies. New technologies and energy efficient solutions are
identified through the utilization of a roadmapping process. Roadmapping is widely used
across the agency to ensure that research proposals are consistent with BPA’s Vision
[24].
The Technology Innovation office is responsible for selecting and managing
BPA’s R&D portfolio of projects. The process involves a rigorous portfolio selection
which is completed March through July of every year. Subsequently, a review cycle is
conducted from January through March, implementing project management best
practices, and once the research projects are complete transferring the projects to
application. The primary function of this department is therefore portfolio, project
management, and technology transfer.
Roadmaps serve as the basis for selecting research proposals. The input from the
roadmaps is used to drive focus area decisions that are used as the basis for the annual
R&D solicitation. The roadmaps represent a cross-functional effort, involving many
stakeholders, subject-matter-experts (SME’s) within the agency, as well as soliciting
input from external organizations.
55
The Agency solicits research proposals for the next fiscal year (FY) in March and
final decisions are made by July. The proposals are subjected to a two-phase review
approach. [25]
Phase I Criteria [9]
The Phase 1 application will be evaluated individually based on the response to
BPA’s requirements and the evaluation criteria. Phase 1 submittals will not be evaluated
against each other. BPA reserves the right to utilize third party consultants in the review
of Phase 1. BPA is solely responsible for any decisions made pursuant to this phase,
including the determination of the applicant’s capability to bring the proposed idea to a
successful conclusion and the relative technical and schedule risks for the project.
Applicants will be notified of the decision by BPA of whether they can proceed to Phase
2. Phase 1 submittals will be evaluated using the following criteria, listed in descending
order of importance:
a. Relevance of the proposed project to the identified Technology Roadmap
b. Principal investigator and project team qualifications including technical
expertise, capabilities, related experience, and previous project successes, as
well as the resources, facilities, techniques and/or unique combinations of
these which are integral factors for achieving the application objectives;
c. Probability of achieving the 50 percent cost-share requirement; and
d. Clarity, quality, and organization of the Phase 1 application.
Phase II Criteria [9]

56
Applications will be reviewed by the Financial Assistance Officer to determine
responsiveness to the application requirements provided in the announcement. These
requirements include submission of all required documents and meeting the 50%
minimum cost share. Responsive applications will proceed to the next level of evaluation.
Non-responsive applications will not be given any further consideration for award.
Responsive applications will then be reviewed and evaluated by an evaluation
panel composed of BPA staff and third party subject matter experts. Qualified subject
matter experts are used at BPA’s sole discretion and are required to sign non-disclosure
agreements and certify that they do not have a conflict of interest in participating in the
evaluation of each application along with internal evaluators.
The application will be evaluated across several criteria. BPA applies a portfolio
model to manage its technology innovation projects. Under this portfolio model, BPA’s
goal is to have a balance of projects in its Technology Innovation Portfolio across various
technologies, time horizons, risk/reward profiles, cost concerns, and other needs. Highly
ranked applications will be considered for inclusion in the BPA Technology Innovation
Portfolio. Portfolio decisions are more complex than a technical review of a project taken
in isolation. The decision to include a project in the Technology Innovation Portfolio
includes consideration of the project risk/benefit profiles, the need to address the
Roadmap, a balance of projects, ability to commit resources, a balance of time horizons
and other factors.
Applicants are advised that an application for a project on a subject matter that is
not currently included in BPA’s TI portfolio may stand a better chance of selection for
57
award compared to another application on a subject matter that is already well
represented in the portfolio. Portfolio funding decisions are based in part on the
information provided in the application. BPA reserves the right to consider other
information from any source, including past performance information, for all project
participants. BPA may request an oral project presentation after Phase 2. Applicants will
be contacted if this is required.
2.4.2 California Energy Commission
As defined on the California Energy Commission website, the CEC is the state's
primary energy policy and planning agency. The Commission was by the Legislature in
1974 and located in Sacramento, six basic responsibilities guide the Energy Commission
as it sets state energy policy:
Forecasting future energy needs;
Promoting energy efficiency and conservation by setting the state's appliance and
building efficiency standards;
Supporting public interest energy research that advances energy science and
technology through research, development and demonstration programs;
Developing renewable energy resources and alternative renewable energy
technologies for buildings, industry and transportation;
Licensing thermal power plants 50 megawatts or larger;
Planning for and directing state response to energy emergencies

58
Similar to the other organizations, the agency’s mission and vision statements
support collaboration with others to improve energy systems and promote a stronger
economy and environment.
The Energy Commission administers several research programs. The primary
emphasis is to drive innovation and advance science in the following areas: energy
efficiency, renewable energy, clean generation, transmission, and transportation. One
program is the newly created electric Program Investment Charge (EPIC). EPIC was
created in November 2013 by the California Public Utilities Commission (CPUC) and
replaces the Public Goods Charge R&D program. CEC is one of the four administrators
of the EPIC program [13]. Others include Southern California Edison (SCE), Pacific Gas
& Electric (PG&E), and San Diego Gas and Electric (SDG&E). The objectives of the
program are to fund research that will promote more reliability, lower costs, increased
safety, and environmental sustainability for the ratepayers in the service territories
designated as administrators of the program. Ultimately the goal of the program is to
move “…energy technologies and products from the lab to life…” and give ratepayers
choices in their electricity consumption [13].
There are other research programs that address specific topics. Examples are
provided and selected based on their relevance to the PNW research interests. There is a
big emphasis on end-use energy efficiency to meet load growth in the PNW so the work
that the CEC is funding related to buildings end-use energy efficiency is of interest. As
described on the CEC website, this research focuses on effective building and appliance
technologies that put California on the path to zero net energy residential buildings by

59
2020 and zero net energy commercial buildings by 2030 [19]. This research explores
new and emerging energy efficiency technologies suitable for retrofitting existing
buildings, as well as energy efficiency techniques for building maintenance and
commissioning to optimize all cost-effective energy efficiency measures. The focus of
this program is on short- to medium-term applied research in new and existing buildings.
Related to their evaluation criteria, the CEC also uses a multi-phased approach.
The template or checklist for Phase 1 is included in Appendix A. The checklist does not
evaluate the technical aspects of the proposal, only if the required documentation has
been provided. Although the checklist does require that the proposal addresses a topic
area.
2.4.3 National Institutes of Health (NIH)
The NIH invests billions of dollars annually to prevent diseases and improve
health. The mission of the organization is to “…seek fundamental knowledge about
the nature and behavior of living systems and the application of that knowledge to
enhance health, lengthen life, and reduce illness and disability.” [171]. The agency
started as the Laboratory of Hygiene in 1887 and has grown in to many Institutes
(National Cancer Institute, National Eye Institute, etc.) and Centers (Center for
Scientific Review, NIH Clinical Center, etc.). The federal agency is under the
Department of Health and Human Services and is the focal point for health related
research in the US.
The NIH seeks research proposals to support their mission and goals of
protecting and improving health, preventing disease, and expanding their knowledge

60
base. Their research portfolio spans basic research to clinical translational research
that “…transforms discoveries into medical practice…” [171]. Similar to the other
research organizations reviewed for this research, the NIH uses a rating scale and two
phased approach to evaluation the proposals.
The proposals are reviewed by a Scientific Review Group (SRG) against
several criteria. The reviewers for each proposal are selected by the SRG based on
their area of expertise. Reviews may be done in peer review meetings and are rated
on the following criteria:
Significance of the proposal
Are the investigators well suited to conduct the research?
Is the idea innovative? In other words, does it challenge or seek a shift in the
status quo.
Approach – this includes a review of strategic alignment, and are the
methodologies and analysis well-reasoned, and
Environmental considerations: Does the scientific environment contribute to
the probability of success?
The evaluation criteria are reviewed on a scale of 1 – 9. These reviews are
provided to the SRG who makes a recommendation to the Institute and Center
National Advisory Councils. The decisions about portfolio projects are made by the
Advisory Council based on strategic needs and really involve more of a prioritization
effort of the recommendations provided by the SRG.

61
2.4.4 National Science Foundation
The NSF was created in 1950 by Congress to “…promote the progress of
science; to advance the national health, prosperity, and welfare; to secure the national
defense…”. [170] Their annual budget is in excess of $7B USD and is used to issue
limited term grants. There are in excess of 12,000 new awards per year with a typical
project duration of three years. Most of the 12,000 awards go to individuals or small
group investors.
The NSF’s “organic” legislation allows the agency flexibility to engage in a
variety of different initiatives. The NSF web site describes their areas of
participation: (www.nsf.gov)
Initiate and support, through grants and contracts, scientific and engineering research
and programs to strengthen scientific and engineering research potential, and
education programs at all levels, and appraise the impact of research upon industrial
development and the general welfare.
Award graduate fellowships in the sciences and in engineering.
Foster the interchange of scientific information among scientists and engineers in the
United States and foreign countries.
Foster and support the development and use of computers and other scientific
methods and technologies, primarily for research and education in the sciences.

62
Evaluate the status and needs of the various sciences and engineering and take into
consideration the results of this evaluation in correlating our research and educational
programs with other federal and non-federal programs.
Provide a central clearinghouse for the collection, interpretation and analysis of data
on scientific and technical resources in the United States, and provide a source of
information for policy formulation by other federal agencies.
Determine the total amount of federal money received by universities and appropriate
organizations for the conduct of scientific and engineering research, including both
basic and applied, and construction of facilities where such research is conducted, but
excluding development, and report annually thereon to the President and the
Congress.
Initiate and support specific scientific and engineering activities in connection
with matters relating to international cooperation, national security and the effects
of scientific and technological applications upon society.
Initiate and support scientific and engineering research, including applied
research, at academic and other nonprofit institutions and, at the direction of the
President, support applied research at other organizations.
Recommend and encourage the pursuit of national policies for the promotion of
basic research and education in the sciences and engineering. Strengthen research
and education innovation in the sciences and engineering, including independent
research by individuals, throughout the United States.

63
Support activities designed to increase the participation of women and minorities
and others underrepresented in science and technology. [170]
The NSF is the funding source for approximately 24% of all federally funded
basic research. Their approach to identifying research is “bottom-up” – their
organizations keep in touch with research communities in the US and around the
world to have an awareness of the latest technology developments in their areas of
interest. Their goal is to support basic research and to find those technologies that
“…may seem like science fiction today…”. [170]
Similar to the other research organizations, the NSF uses a two-phased
approach to evaluating research proposals. However, unique to NSF is that they
encourage the proposers to engage with the NSF program personnel prior to the
preparation and submission of a proposal.
Phase I includes a review by at least three external reviewers based on their
area of expertise. The reviews may be conducted ad-hoc and/or by a panel review and
could even include some site visits as part of the evaluation process. The reviewers
are asked to review the proposals against two criteria: Intellectual Merit and Broader
Impacts. The purpose of Intellectual Merit is to consider if the research has the
potential to advance knowledge. The Broader Impacts criteria look at the potential
benefits to society under the following conditions:
1. What is the potential for the proposed activity to:
a. Advance knowledge and understanding within its own field or across different
fields (Intellectual Merit); and
64
b. Benefit society or advance desired societal outcomes (Broader Impacts)?
2. To what extent do the proposed activities suggest and explore creative, original, or
potentially transformative concepts?
3. Is the plan for carrying out the proposed activities well-reasoned, well-organized, and
based on a sound rationale? Does the plan incorporate a mechanism to assess success?
4. How well qualified is the individual, team, or organization to conduct the proposed
activities?
5. Are there adequate resources available to the PI (either at the home organization or
through collaborations) to carry out the proposed activities? [170]
Phase II of the proposal review process starts with providing the evaluation
criteria to the NSF Program Office. The Program Office makes a recommendation to
the Division Director who makes a final decision about which projects are selected,
based on strategic and agency needs. The budget contracting and budget officers do a
final review.
The use of a multi-attribute perspective, as suggested in this research, helps to
identify more than just the technical aspects of an issue. In this case, the issue that is
addressed is the need to apply research results. While the importance of technology
cannot be underscored, there are many other attributes that contribute to successful
application of research – a multi-perspective approach identifies and emphasizes these
other characteristics. The attributes that were identified in the literature review as
necessary for successful technology transfer that were considered for this comparison are:

65
• Dedicated TTO • Rewards system in place
• Cooperative experience • Business plan exists
• Bureaucracy • Government incentives exist
• Technology and Stakeholder
complexity
• Financial feasibility is assessed
• Cultural awareness • Organizational champion is identified
• Manpower flexibility • TT initiated by top management
• Demonstrations • Common standards and codes
• Geographic proximity • TTO staffed with marketing experience
• Organizational homogeneity • Create an atmosphere of trust
• Budget flexibility • Personnel involved in TT
• Understanding the recipient
Some general observations can be made about how all of the organizations
considered in this research evaluated proposals. Each organization uses a two-phased
approach to solicit and evaluate proposals. This approach minimizes the work for both
the applicant and the sponsoring organization – if not all the Phase 1 criteria is met, the
application is terminated. In all cases, the applicant is notified about their status and why
they are unable to continue in the solicitation process. Also, the Phase 2 criterion is
similar - all ask about the technical feasibility, the project team, and potential application.
Regarding potential application, all evaluation processes fall short of quantifying
the potential for technology transfer success. While some organizations ask evaluators to
consider some of the attributes identified in literature, none develops a comprehensive
evaluation that considers many perspectives of technology transfer. The CEC program is

66
the closest when the application is evaluated on whether or not the project team has
previous research experience as well as successful demonstrations. However, even for
this case, the amount of experience is not quantified (e.g. five years of experience is
better than one year of experience, etc.). As an example, assigning a relative value to this
would provide a more tangible quantification about the amount of research experience, as
opposed to having it (research experience) or not.
Despite being identified as necessary for successful technology transfer in
literature, none of the organizations consider geographic proximity, time to contract,
manpower flexibility, organizational homogeneity, marketing experience of the
Technology Transfer Office, or most success attributes in the social perspective, as part
of the evaluation criteria. This inference was drawn from the absence of these success
attributes as part of the evaluation forms. Table 8 summarizes the evaluation criteria for
each of the federal organizations reviewed for this research. The emphasis for the
evaluation criteria are on the technical aspects and largely does not address the other
success attributes identified in research. The use of a technology transfer score, as
proposed by this body of work, would provide a more comprehensive, multi-criteria
approach to evaluating research proposals, with the focus of improving the potential of
moving from research into application.

67
Research
Organization
TT Success Attributes Considered for Evaluating Research Proposals
Organizational Technological Social Market
BPA Time to
Contract
Geographic
Proximity
Cooperative
Experience
Technical
Complexity
Understanding
the Recipient
Communication
Plan
Use
Case
CEC N/A Cooperative
Experience;
technology
demonstrations
Technical
Complexity
N/A N/A
ARAP-e N/A Cooperative
Experience
Technical
Complexity
Percentage of
budget
dedicated to TT
N/A N/A
EERE N/A Cooperative
Experience
Technical
Complexity
N/A N/A
NSF N/A Cooperative
Experience
Technical
Complexity
N/A N/A
NIH N/A Cooperative
Experience
Technical
Complexity
N/A N/A
Table 8: Research Organization Evaluation Criteria

68
Overall, while there is a common theme of applying research or technology
transfer as an organization’s goal, there are no evaluation criteria to assess its probability.
Adopting a TT score and including it as part of the proposal evaluation process will help
an organization close the gap between technologies just being available to their actual
adoption and delivery of expected results.
A comprehensive literature review to include a review of journal articles, text
citations, web searches, and meetings with utility research leaders has been completed
in the following areas:
• When technology transfer should be considered,
• Technology transfer definitions and success attributes,
• The research methods used to analyze technology transfer, and
• What criteria an organization uses to evaluate a research proposal
Because of the literature reviews, interviews and preliminary content validation,
several research gaps have been identified. Table 9 describes the gap and relevant
citations.
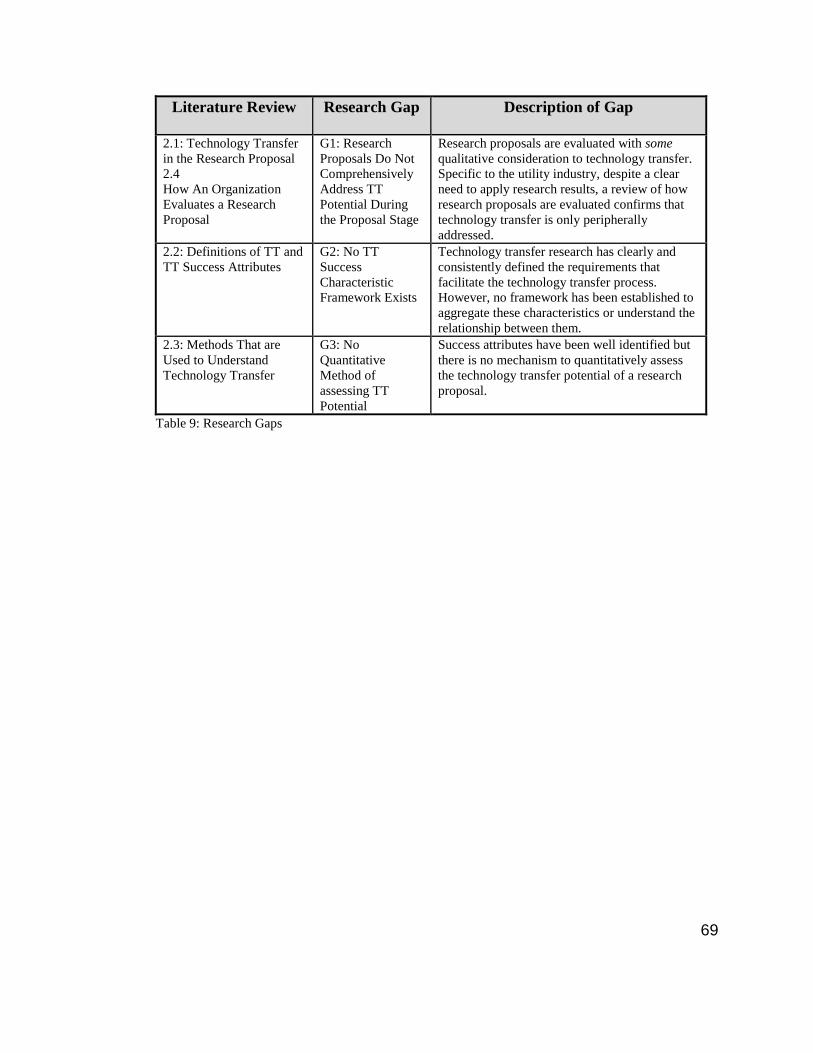
69
Literature Review Research Gap Description of Gap
2.1: Technology Transfer
in the Research Proposal
2.4
How An Organization
Evaluates a Research
Proposal
G1: Research
Proposals Do Not
Comprehensively
Address TT
Potential During
the Proposal Stage
Research proposals are evaluated with some
qualitative consideration to technology transfer.
Specific to the utility industry, despite a clear
need to apply research results, a review of how
research proposals are evaluated confirms that
technology transfer is only peripherally
addressed.
2.2: Definitions of TT and
TT Success Attributes
G2: No TT
Success
Characteristic
Framework Exists
Technology transfer research has clearly and
consistently defined the requirements that
facilitate the technology transfer process.
However, no framework has been established to
aggregate these characteristics or understand the
relationship between them.
2.3: Methods That are
Used to Understand
Technology Transfer
G3: No
Quantitative
Method of
assessing TT
Potential
Success attributes have been well identified but
there is no mechanism to quantitatively assess
the technology transfer potential of a research
proposal.
Table 9: Research Gaps

70
CHAPTER 3: RESEARCH OBJECTIVES, QUESTIONS, AND
METHODOLOGY
The framework for how the research gaps are analyzed is presented in this
chapter. The appropriateness of a multi-criteria hierarchical decision model and the
use of associated data collection analysis tools are discussed. These tools include the
general model framework to determine the technology transfer score, inconsistency
and disagreement analysis, the use of desirability curves to characterize the
“usefulness” of the success attributes, and the validation and quantification of the
model. The validation and quantification of the model and desirability curves rely on
expert judgment so this chapter also includes considerations for selecting expert
panels.
3.1 Objective
The preceding chapter identified research gaps in literature regarding technology
transfer. That, despite the need for addressing technology transfer at the start of research
and development, specifically as part of the research proposal, a review of the evaluation
criteria from several organizations determined that technology transfer is not
comprehensively or quantitatively assessed. In addition, there is consistent information
among the research community about what is necessary for successful technology
transfer. However, there is not a way of aggregating this information into a framework
for assessing and measuring technology transfer potential as part of the research and
development phase.
Assuming the ultimate goal of research is to apply results, it is important to
understand how the transfer occurs most effectively. The objective of this research is

71
to develop a technology transfer score that can be used for assessing the technology
transfer potential of a research proposal. It will be used during the proposal
evaluation stage to identify those research proposals that have the most potential for
technology transfer because the organizations involved in the technology transfer
exhibit characteristics that have been identified as necessary for technology transfer.
3.2 Questions
Once the framework for assessing and quantifying technology transfer has
been developed, an organization can use the tool to inform the selection of a research
portfolio. The premise is that in addition to technical feasibility and strategic
alignment, the potential for successful application should be considered.
The case study and recommendations will be used to ask some key questions.
These include:
1. Is the proposed framework and method for assessing transfer potential an
appropriate assimilation of literature findings?
2. Are some attributes more important than others for the case study industry?
3. What level of effort is required to gather the data in order to compute the
technology transfer score? and
4. Is the assessment framework appropriate for assessing multiple
technologies in any industry? In other words, is the model generalizable?

72
3.3 Methodology
3.3.1 Introduction to Hierarchical Decision Modeling (HDM)
Much the same way Geels and Sharma describe an interaction between levels to
capture the technology transfer relationship, the proposed conceptual model describes a
similar relationship. However, this research goes a step further to specify the success
attributes associated with technology transfer, using a multi-perspective view. In total, the
literature review identified 22 success attributes, across the four perspectives, which
contribute to successful technology transfer.
A multi-criteria decision model was the selected tool to analyze technology
transfer success attributes and develop a technology transfer score. Alternative
approaches to analyze and assimilate technology transfer success attributes into a tool
that can be used to evaluate research proposals have been considered. Statements
regarding the strengths and weakness of each method are provided in Table 10.
Following the table is further justification to substantiate the selected research method.
ANALYSIS METHOD STRENGTHS OF THE
ANALYSIS METHOD
WEAKNESSES OF THE
ANALYSIS METHOD
Case Studies are used to
explore causation and find
the underlying principle.
The approach is defined
as a descriptive,
exploratory or
explanatory analysis of a
person, group or event.
[76]
• Emphasizes a detailed contextual
analysis of a limited number of
events and their relationship
• Often used by social scientists to
understand the relationship
between real-life and proposed
methods
• Used for comparisons of
organizations to illustrate a
theoretical concept.
• Only studies a small number of
environments and do not offer
reliability
• Intense study in one case
introduces the potential for bias
• Case studies should only be used
as an exploratory tool
• Typically lacks scientific rigor to
draw definite correlations
Surveying is used to
assess thoughts, opinions
or feelings. [77]
• Collects data on phenomena that
cannot be directly observed
• Used to assess attributes and
characteristics - sample
• Design of the survey is critical to
success
• Needs to ensure the sample being
surveyed is random

73
ANALYSIS METHOD STRENGTHS OF THE
ANALYSIS METHOD
WEAKNESSES OF THE
ANALYSIS METHOD
population is key to a successful
survey
• Questions are asked explicitly to
extract correct information; don't
assume terms are familiar to
sample population.
Literature Reviews are
defined as text written by
someone to consider the
critical points of current
knowledge including
substantive findings, as
well as theoretical and
methodological
contributions to a
particular topic. Literature
reviews are secondary
sources, and as such, do
not report any new or
original experimental
work [78]
• Combines a summary of a
particular topic(s).
• How the literature review is
presented could give new
interpretation to old material;
similar to a taxonomy to identify
research gaps
• Information is reported - not
synthesized. The researcher is
left to draw inferences or
assimilate to form new ideas.
• Used to generate a hypothesis-
provides background
information to form ideas.
Decision Model
Development is defined
as an effective research
method. It assists
investigators and
scientists in relating more
accurately to reality; it
also aids them to describe,
predict, test or understand
complex systems or
events. Thus, models
often provide a
framework for the
conduct of research and
might consist of actual
objects or abstract forms,
such as sketches,
mathematical formulas, or
diagrams. A model is an
abstraction, a mental
framework for analysis of
a system. [79]
• Aggregates the opinions of
experts - captures a rank of
candidates to inform a decision
• Provides better problem
abstraction
• Good predictive outcome tool
• Multi-criteria decision models are
used to illustrate multi-level
relationships
• Helpful for policy makers to
understand alternatives [81]
• Structures tangible and intangible
attributes
• Multi-Attribute Utility Theory
(MAUT) includes the use of
utility functions to describe the
preference of the decision maker.
[173]
• The number of pairwise
comparisons required to
comprehensively describe the
model could be significant and a
deterrent to soliciting expert
participation
• A model is an abstract
representation of reality.
• When models have not been
properly validated, their use as a
knowledge source might be
unwarranted. In addition, unless
care is taken, models often invite
overgeneralizations.
• It is critical to be explicit and
unambiguous with terms.
• There may be a tendency to use
model output as a decision
(versus being used as a tool to
inform decisions)
Hypothesis Testing is
defined as the process of
testing an assumption
about a population
parameter. The process
defines the null
hypothesis (Ho) which is
the sample observation
results purely from
• Doesn't rely on subjective input
• The test statistic is influenced by
the effect size, the explained
variation and sample size
• Sample needs to be
representative of the population
• 95% confidence interval is
arbitrary
• Results are misinterpreted as
absolute when they are really
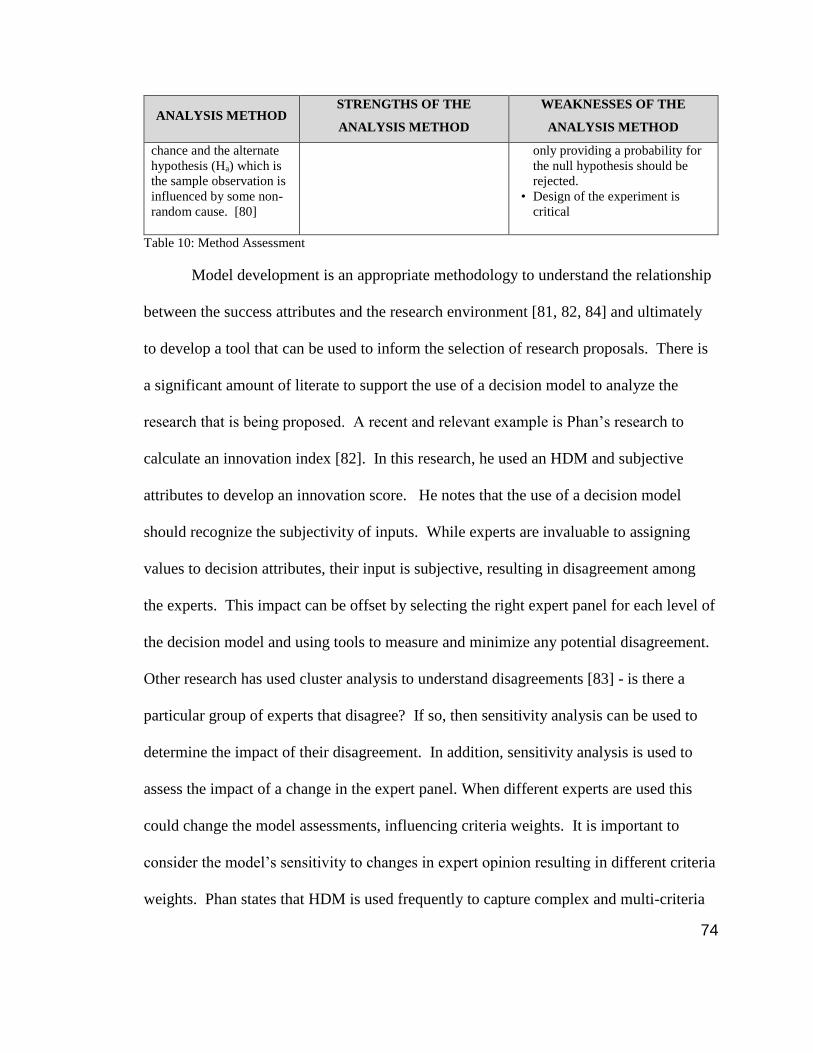
74
ANALYSIS METHOD STRENGTHS OF THE
ANALYSIS METHOD
WEAKNESSES OF THE
ANALYSIS METHOD
chance and the alternate
hypothesis (Ha) which is
the sample observation is
influenced by some non-
random cause. [80]
only providing a probability for
the null hypothesis should be
rejected.
• Design of the experiment is
critical
Table 10: Method Assessment
Model development is an appropriate methodology to understand the relationship
between the success attributes and the research environment [81, 82, 84] and ultimately
to develop a tool that can be used to inform the selection of research proposals. There is
a significant amount of literate to support the use of a decision model to analyze the
research that is being proposed. A recent and relevant example is Phan’s research to
calculate an innovation index [82]. In this research, he used an HDM and subjective
attributes to develop an innovation score. He notes that the use of a decision model
should recognize the subjectivity of inputs. While experts are invaluable to assigning
values to decision attributes, their input is subjective, resulting in disagreement among
the experts. This impact can be offset by selecting the right expert panel for each level of
the decision model and using tools to measure and minimize any potential disagreement.
Other research has used cluster analysis to understand disagreements [83] - is there a
particular group of experts that disagree? If so, then sensitivity analysis can be used to
determine the impact of their disagreement. In addition, sensitivity analysis is used to
assess the impact of a change in the expert panel. When different experts are used this
could change the model assessments, influencing criteria weights. It is important to
consider the model’s sensitivity to changes in expert opinion resulting in different criteria
weights. Phan states that HDM is used frequently to capture complex and multi-criteria

75
problems. The HDM provides a mechanism for clearly describing the relationships
between the decision model factors. Technology transfer, especially when it is
understood in terms of building a relationship, is an ideal issue to be framed by a HDM.
Other literature supports the use of a decision model to understand relationship
between multiple levels. Geels’ research identifies a model to describe the relationship
that facilitates technology transfer [43]. Decision models have been used to decompose
problems related to health care, technology selections…and strategic planning [84]. A
hierarchical decision model is used to illustrate multi-level relationships and is commonly
used to help outline alternatives using a systematic and quantitative approach [81]. It is a
tool that incorporates qualitative and quantitative feedback from subject matter experts
via the use of pairwise comparisons. These comparisons allow the subject matter experts
to provide their feedback about the relative importance of success criteria. Phan states
that “…this process makes the experts more comfortable because their decisions are
based on the relative preference of one criterion over another rather than an absolute
preference” [82].
The comprehensive literature review discussed in chapter 2.2 identified that
successful technology transfer is dependent more on qualitative characteristics rather than
quantitative and involves interaction among many different domains. As described, this
type of problem is particularly suited for the Hierarchical Decision Model approach.
Figure 3 presents a conceptual HDM.

76
Figure 3: Conceptual Model Design
3.3.2 Inconsistency and Disagreement of Expert Judgments
Generally, inconsistency can be defined as disagreement within an individual’s
evaluation. The concept can be illustrated with the following example. Suppose an
expert is asked to compare three types of music, classical (a), jazz (b), or modern (c).
The expert likes classical more than jazz (a>b), and jazz more than modern (b>c). An
inconsistent response would be that the respondent liked modern more than classical, or
c>a. In other words, if a>b, and b>c, then c>a. This example demonstrates measuring
ordinal inconsistency. Ordinal consistency does not take into account the strength of a
decision maker’s comparison. [93] Another measure is cardinal inconsistency which does
take into account the decision makers preference of one option over another. In the
example cited, suppose that the expert likes classical music twice as much as jazz, and
jazz three times as much as modern music. Cardinal consistency would require the
decision maker to like classical six times as much as modern. Otherwise, cardinal
consistency is violated.

77
Kocaoglu’s research provides a comprehensive definition of inconsistency and
discusses the analysis and measurement of the term. The methodology is widely
referenced in recent dissertations by Chan, Phan, and Sheik [82, 84, 92, 93]. It is
provided here for reference:
For n elements, the constant sum calculations result in a vector of relative values
r1, r2, …, rn for each of the n! orientations of the elements. For example, if three elements
are evaluated, n is 3, and n! is 6. The six orientations would be ABC, ACB, BAC, BCA,
CAB, and CBA. If an expert is consistent in providing pairwise comparisons, the relative
values are consistent for each orientation. However, if an expert is inconsistent in
providing pairwise comparisons, the relative values are different for each unique
orientation. The inconsistency in this methodology is measured by the variance among
the relative values of the elements calculated in the n! orientations.
Let
rij = relative value of the ith element in the jth orientation for an expert
�̅� i = mean relative value of the ith element for that expert
1
𝑛!∑ 𝑟𝑛!
𝑗=1 ij Equation 1
The population standard deviation is shown in Equation 2:
Equation 2
For i = 1, 2,…,n

78
Inconsistency is defined as the mean standard deviation of n elements and is described in
Equation 3:
Kocaoglu recommends 0.10 as the limiting value for the inconsistency for any
value of n.
Recent research conducted by Dr. Mustafa Abbas refines the inconsistency
measure using the Root Sum of the Variance (RSV) method [169], versus the mean of the
standard deviations to measure inconsistency. Dr. Abbas’ research objectives were to
“…establish consistency threshold that are tied to the number of variables and linked to
corresponding ∝ levels.” [169].
The next measure to consider is the disagreement among the group of experts.
Before defining disagreement and methods used to analyze and measure it is important to
mention that disagreement among experts should not be unexpected [92]. What is
important is to understand why there would be disagreement. Often times, when there is
disagreement, follow-up by the researcher is necessary. Did the expert interpret
something incorrectly? In which case their evaluation may change, resulting in no
disagreement. On the other hand, did the expert make the pairwise comparisons
correctly? In this case, the disagreement would remain along with an explanation for a
discrepancy.
Equation 3
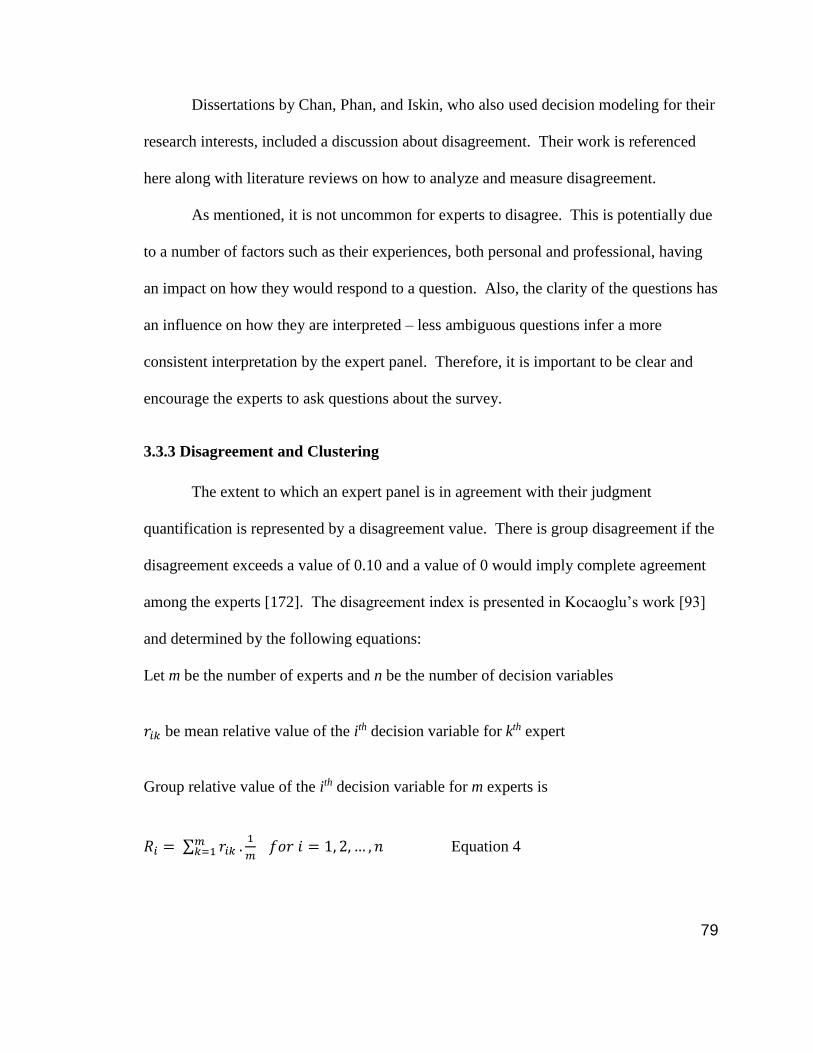
79
Dissertations by Chan, Phan, and Iskin, who also used decision modeling for their
research interests, included a discussion about disagreement. Their work is referenced
here along with literature reviews on how to analyze and measure disagreement.
As mentioned, it is not uncommon for experts to disagree. This is potentially due
to a number of factors such as their experiences, both personal and professional, having
an impact on how they would respond to a question. Also, the clarity of the questions has
an influence on how they are interpreted – less ambiguous questions infer a more
consistent interpretation by the expert panel. Therefore, it is important to be clear and
encourage the experts to ask questions about the survey.
3.3.3 Disagreement and Clustering
The extent to which an expert panel is in agreement with their judgment
quantification is represented by a disagreement value. There is group disagreement if the
disagreement exceeds a value of 0.10 and a value of 0 would imply complete agreement
among the experts [172]. The disagreement index is presented in Kocaoglu’s work [93]
and determined by the following equations:
Let m be the number of experts and n be the number of decision variables
𝑟𝑖𝑘 be mean relative value of the ith decision variable for kth expert
Group relative value of the ith decision variable for m experts is
𝑅𝑖 = ∑ 𝑟𝑖𝑘𝑚𝑘=1 .
1
𝑚 𝑓𝑜𝑟 𝑖 = 1, 2, … , 𝑛 Equation 4

80
The standard deviation of the relative value of the ith decision variable is:
STDi = √1
𝑚∑ (𝑅𝑖 − 𝑟𝑖𝑘)2𝑚
𝑘=1 Equation 5
Disagreement for m experts is calculated as the mean standard deviation of the group n
relative values of variables
D = 1
𝑛 ∑ 𝑆𝑇𝐷𝑖
𝑛𝑖=1 Equation 6
The disagreement can also be represented by an intra-class correlation coefficient,
ric. The intra-class correlation compares the means among the judgments of the experts to
show whether a pairwise comparison result might have a high or low disagreement. The
intra-class correlation coefficient takes a value from -1/(k-1) ≤ ric ≤ 1. A coefficient of 1
means an absolute agreement among the experts, and a value of 0 or less indicates a
significant disagreement. [174].
In order to make a more confident decision about the value of ric, and whether
there is significant disagreement among the expert panel, a hypothesis testing procedure
is used with the F-test [175]. The Null Hypothesis (H0) for the F-test is that there is a
significant disagreement among the expert panel judgment quantification, or H0 : ric = 0.
The F-value of a pairwise comparison procedure is calculated and compared against the
F-critical value of the procedure to determine whether the Null Hypothesis can be
rejected or not. If H0 is rejected, we can conclude that there is not a significant

81
disagreement in the experts’ judgments. The F-values and F-critical values of the
pairwise comparisons are provided readily by the ©HDM software.
Iskin used a combination of pairwise comparison group disagreement and
hierarchical clustering to understand disagreements between experts in his research of
developing an assessment model for Energy Efficiency Program Planning [83]. The
group disagreement was used to identify group disagreements and the clustering
identified those experts who disagreed with the others. Acceptable disagreement is a
value of 0.1 or less.
What if there are disagreements among the experts? The Hierarchical Clustering
Method is used to identify those data points in a group that are similar, or agree. The
objective is for clustering to discover natural groupings. For instance, when assessing the
Level 1importance, is the disagreement among experts in the utility industry, when
compared to other experts at universities, for example? This method was used in Iskin’s
research of Energy Efficiency Program Planning. Hierarchical clustering was defined as,
“…. obtains homogeneous clusters of cases based on measured characteristics. The
process starts where each case is considered as a separate cluster; and for each iteration, a
new cluster is determined by combining one case with a cluster identified earlier in a
fashion that the arithmetic distance between new and old clusters remain the shortest
among all possible alternatives. The process continues until one cluster is left.” [83]
In summary, if disagreement among the experts exists, one of the three
methods described in this chapter can be used to understand the source and

82
severity/importance of the disagreement. Table 11 provides an example of
inconsistency and disagreement scores. As shown, the inconsistency and
disagreement scores are within acceptable limits so no further analysis would be
necessary.
Per
spec
tiv
e L
evel
Qu
an
tifi
cati
on
Expert Organizational Social Technological Market Inconsistency
Expert
10
0.15 0.23 0.25 0.38 0.01
Expert
11
0.12 0.23 0.29 0.36 0.06
Expert 1 0.1 0.09 0.49 0.33 0.01
Expert 2 0.31 0.05 0.37 0.28 0.02
Expert 3 0.28 0.14 0.15 0.43 0.02
Expert 4 0.16 0.34 0.09 0.41 0
Expert 5 0.2 0.23 0.14 0.43 0.01
Expert 6 0.1 0.23 0.23 0.44 0.02
Expert 7 0.27 0.27 0.16 0.3 0.01
Expert 8 0.17 0.18 0.21 0.44 0.06
Expert 9 0.15 0.19 0.2 0.47 0.09
Mean 0.18 0.2 0.23 0.39
Std Dev 0.07 0.08 0.11 0.06
Disagreement 0.072
Table 11: Example of Inconsistency and Disagreement
3.3.4 Calculating the Technology Transfer Score
The score is determined by the sum product of the success attributes and
perspective weights. The weights are determined by judgment quantifications from
the experts and are used as an input to calculating the overall score. The
mathematical expression for calculating the score is represented by the following
equation:

83
3.3.5 Desirability Curves
Several recent dissertations have used desirability curves as part of their research.
In particular, Phan’s research uses a similar approach as proposed here – development of
an index using desirability curves [82]. The purpose of these curves is to identify how
“desirable” or “valuable” a metric is for a decision maker. There are several ways to
determine the value of a metric. These include standard gamble, constant-sum method,
and graphically representing the relative value of the metric. As was done in Phan’s
dissertation, desirability curves for this research were developed using an expert panel,
with consideration to inconsistency and disagreement.
As part of the content validation phase, subject matter experts provided their
insight into the appropriateness of how each attribute is measured by a desirability
curve. The measurements were determined based on one- on-one interviews with the
expert panels. A sample of the quantification tool and subsequent desirability curve
is provided.
Equation 7

84
Figure 4: Template for Developing Desirability Curve
Figure 5: Sample Desirability Curve
Incorporating the influence of the desirability curves, the technology transfer
score can be computed using the following mathematical representation:

85
3.3.6 Validation of the HDM
Content Validity
In a technical setting, content validity refers to “…test items need to reflect the
knowledge actually required for a given topic area (e.g., history) or job skill (e.g.,
accounting)…” [87]. In other words, does the model capture the necessary elements
needed to define the test subject. Specific to this research, have the appropriate
perspectives and success attributes been captured to sufficiently define technology
transfer?
Given these results, how can it be determined if a perspective or attribute is valid?
A widely accepted method for detecting disagreement among experts is given by Lawshe
[87]. Ultimately, if more than half the panelists indicate that an item is essential, then
there is some validity. Higher levels of validity are achieved as more expert panel
members agree. An equation for determining content validity is given by:
Equation 9
Where
Content validity ratio,
Number of SME panelists indicating "essential",
Equation 8
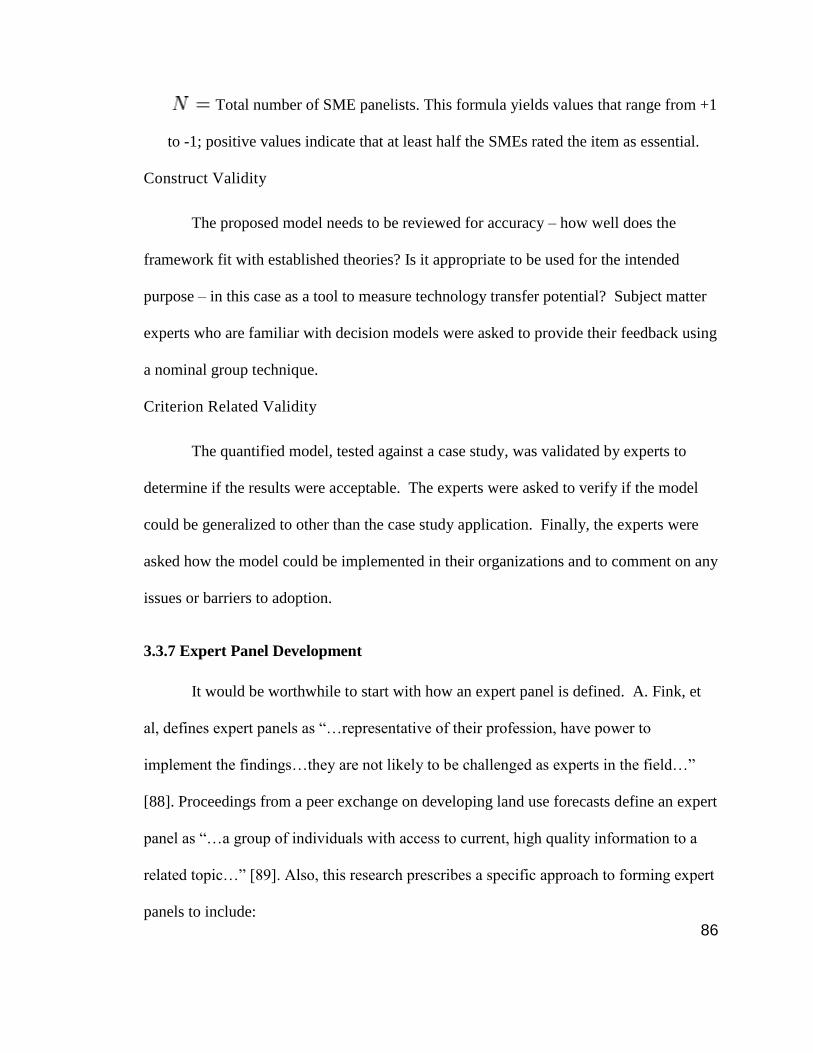
86
Total number of SME panelists. This formula yields values that range from +1
to -1; positive values indicate that at least half the SMEs rated the item as essential.
Construct Validity
The proposed model needs to be reviewed for accuracy – how well does the
framework fit with established theories? Is it appropriate to be used for the intended
purpose – in this case as a tool to measure technology transfer potential? Subject matter
experts who are familiar with decision models were asked to provide their feedback using
a nominal group technique.
Criterion Related Validity
The quantified model, tested against a case study, was validated by experts to
determine if the results were acceptable. The experts were asked to verify if the model
could be generalized to other than the case study application. Finally, the experts were
asked how the model could be implemented in their organizations and to comment on any
issues or barriers to adoption.
3.3.7 Expert Panel Development
It would be worthwhile to start with how an expert panel is defined. A. Fink, et
al, defines expert panels as “…representative of their profession, have power to
implement the findings…they are not likely to be challenged as experts in the field…”
[88]. Proceedings from a peer exchange on developing land use forecasts define an expert
panel as “…a group of individuals with access to current, high quality information to a
related topic…” [89]. Also, this research prescribes a specific approach to forming expert
panels to include:
87
• The researcher has to know and communicate the big picture – being able to
describe the purpose for the study ensures that the desired information is
extracted.
• Design the process – what questions will each participant be asked to answer
and understand how the information will be obtained. Will the results be
provided anonymously, formal panel? Will there be interaction or exchange
among the participants?
• The researcher should determine the size of the panel that is needed to have
credible information
• The remaining steps include finalizing the panel, managing the process, and
documenting the results. [89]
Critical Issues and Benefits of an Expert Panel
The land use peer proceeding discusses the benefits of an expert panel. Most
importantly, the expert panel provides credibility with stakeholders [89]. Stakeholders
tend to believe the outcome of research if it is substantiated by expert opinion versus
relying solely on a model output or abstract analysis. The research focus of the journal
articles was on forming expert panels for land use projects and the importance of an
expert panel to mediate sensitive situations related to public opinion and human interface,
so not technical issues. However, inferences can be drawn between land use research and
developing a technology transfer score. In each case the issues are not technical ones,
rather they are more concerned with qualitative measures.

88
The Federal Transportation article [89] addresses a number of potential issues
with using expert panels. The relationship of the expert panel to other
organizations/authorities needs to be closely considered. In fact, the article states that it
is almost a paradox – by definition expert panels are often and likely made of subject
matter experts, intimately familiar with a topic, but their participation could give the
perception of bias. The bias could be introduced if the panel was allowed to discuss
responses. By doing so, the article suggests that some panel responses could be
influenced by other panel participant’s opinions. In addition, the amount of flexibility
placed on the panel to provide additional feedback, or elaborate on a response is seen as a
potential drawback. Without some flexibility, the response could be too limiting. [89]
Other issues could include the availability of experts and their willingness to participate.
Okoli and Pawlowski, in their research on e-commerce in sub-Saharan Africa,
outline a systematic process for selecting experts. Specifically, their process includes
identifying relevant disciplines or skills by looking at their connections to organizations
or practitioners. In addition, Okoli and Pawlowski recommend between 10 and 18
experts to participate in the panel. [91]
Despite the rigor that is applied to selecting a panel, inconsistency and
disagreements in the responses is inevitable. The expert panels were asked to assess the
relative contribution for different levels of the model using pairwise comparisons.
Templates for obtaining their judgment quantification are included in Appendix D.

89
CHAPTER 4: DEVELOPMENT OF THE RESEARCH MODEL
The concept of technology transfer, the attributes that are necessary for
successful technology transfer and an appropriate framework to describe the
relationship of these factors have been presented in the previous chapters. The
objective of this chapter is to describe the expert selection criteria and how these
experts were included in appropriate panels to validate and quantify the decision
model.
This chapter also shows the conceptual model that was validated by the expert
panels. The assessment tools that were used to capture the expert judgment are
described with the actual assessment tools given in Appendix C.
4.1 Expert Panel Formation
This research relies heavily on expert opinion of perspectives, success
attributes and methodologies related to technology transfer. Model weights are
determined and desirability curves are developed by quantified expert judgments.
The previous chapter identified the issues with identifying an appropriate
expert panel. These issues were considered when forming the seven panels,
comprised of 53 experts; some experts served on multiple panels. One of the most
critical elements was their ability and willingness to participate.
The Federal Merit Review Guide identifies eight key characteristics of expert
reviewers. These include consideration of the following:
• The individual’s scientific or technical education

90
• The extent to which the individual has engaged in relevant work or research, the
capacities in which the individual has done so, and the quality of the research
work
• Relevant publications and patents, including having a significant number of peer
reviewed publications
• Other evidence of a recognized expert in the field
• An advanced degree in the relevant field
• Relevant awards
• Key Society Memberships
• And the need for the review panel to include experts from various specialty
areas within relevant scientific research [90]
Using these criteria as the basis for selection, the panels were developed with
key experts to evaluate the decision model.
Expert panel P0 was used for the validation of the literature based hierarchical
decision model. The experts were selected based on their expertise in the areas of
research management and subsequent technology transfer. The panel represented
practitioners from the utility industry, collaborative partners, research labs and
universities.
Expert panel P1 was formed to quantify the perspective level of the decision
model. Members of this panel were selected based on their senior level positions in a
research management organization.
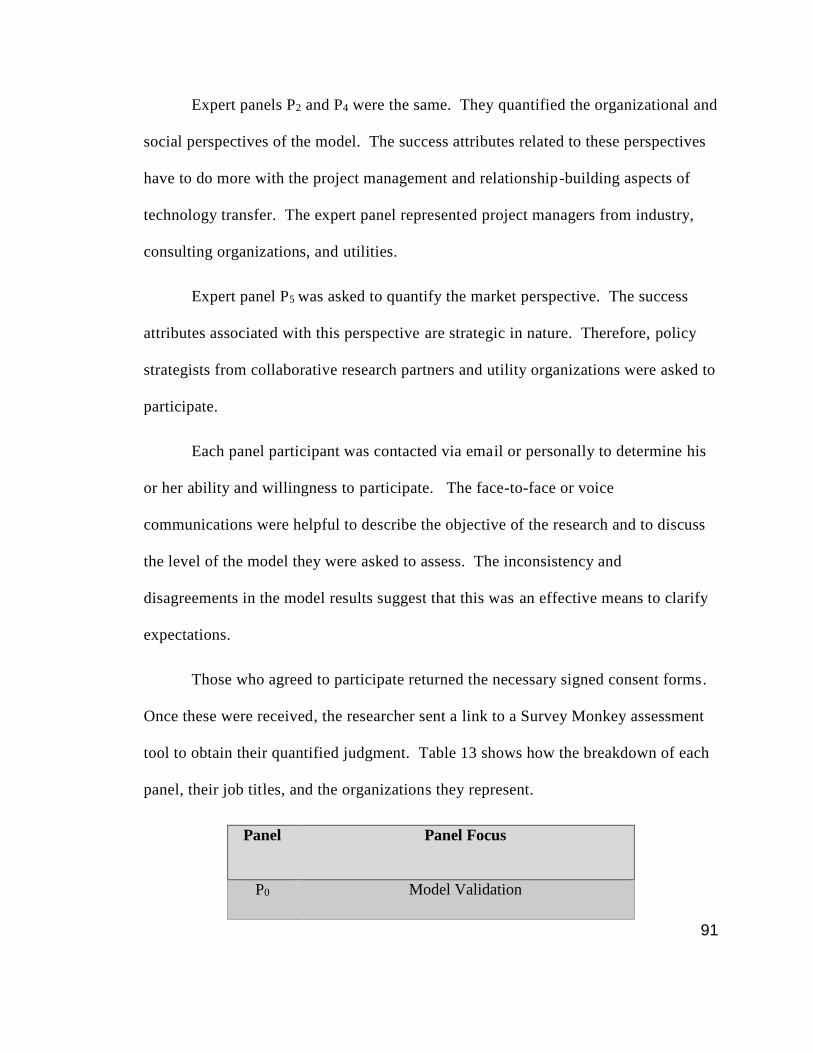
91
Expert panels P2 and P4 were the same. They quantified the organizational and
social perspectives of the model. The success attributes related to these perspectives
have to do more with the project management and relationship-building aspects of
technology transfer. The expert panel represented project managers from industry,
consulting organizations, and utilities.
Expert panel P5 was asked to quantify the market perspective. The success
attributes associated with this perspective are strategic in nature. Therefore, policy
strategists from collaborative research partners and utility organizations were asked to
participate.
Each panel participant was contacted via email or personally to determine his
or her ability and willingness to participate. The face-to-face or voice
communications were helpful to describe the objective of the research and to discuss
the level of the model they were asked to assess. The inconsistency and
disagreements in the model results suggest that this was an effective means to clarify
expectations.
Those who agreed to participate returned the necessary signed consent forms.
Once these were received, the researcher sent a link to a Survey Monkey assessment
tool to obtain their quantified judgment. Table 13 shows how the breakdown of each
panel, their job titles, and the organizations they represent.
Panel Panel Focus
P0 Model Validation

92
P1 Perspective Level Quantification
P2 Organizational Strategies Quantification
P3 Technology Elements Quantification
P4 Social Strategies Quantification
P5 Market Readiness Quantification
P6 Desirability Curve Validation and Quantification
Table 12: Summary of Expert Panels
Expert Background P0 P1 P2 P3 P4 P5 P6
E1 Program Director, DOE x x
E2 R&D Chief Officer, Utility x x x
E3 Vice President, Utility R&D
Cooperative
x x
E4 Vice President, Utility R&D
Cooperative
x
E5 Sr. Vice President, Utility x
E6 Executive VP, Utility x
E7 Sr. Research Scientist, National Lab x x
E8 R&D Executive, CAISO x
E9 Sr. Technology Transfer Manager,
National Lab
x
E10 Technology to Market Advisor, DOE x x
E11 Vice President Technology
Management, Utility R&D
Cooperative
x x
E12 Sr. Analyst, NW Power Council x
E13 Sr. Analyst, Utility x
E14 Executive VP, Utility x x
E15 Policy Strategist, Utility x x
E17 Manager, Power Resources, Utility x
E18 Public Utilities Specialist, Utility x
E19 Director of Retail Programs, Utility x
E20 Sr. Public Utilities Specialist, Utility x x
E21 Project Manager, Industry x x
E22 Project Manager, Utility x x
E23 Project Manager, Consulting Services x x x,x
E24 Project Manager, Industry x x
E25 Professor, University x x
E26 Sr. Instructor, University x x
E27 Project Manager, Industry x x
E28 Project Manager, Industry x x
E29 Project Manager, Industry x x x,x
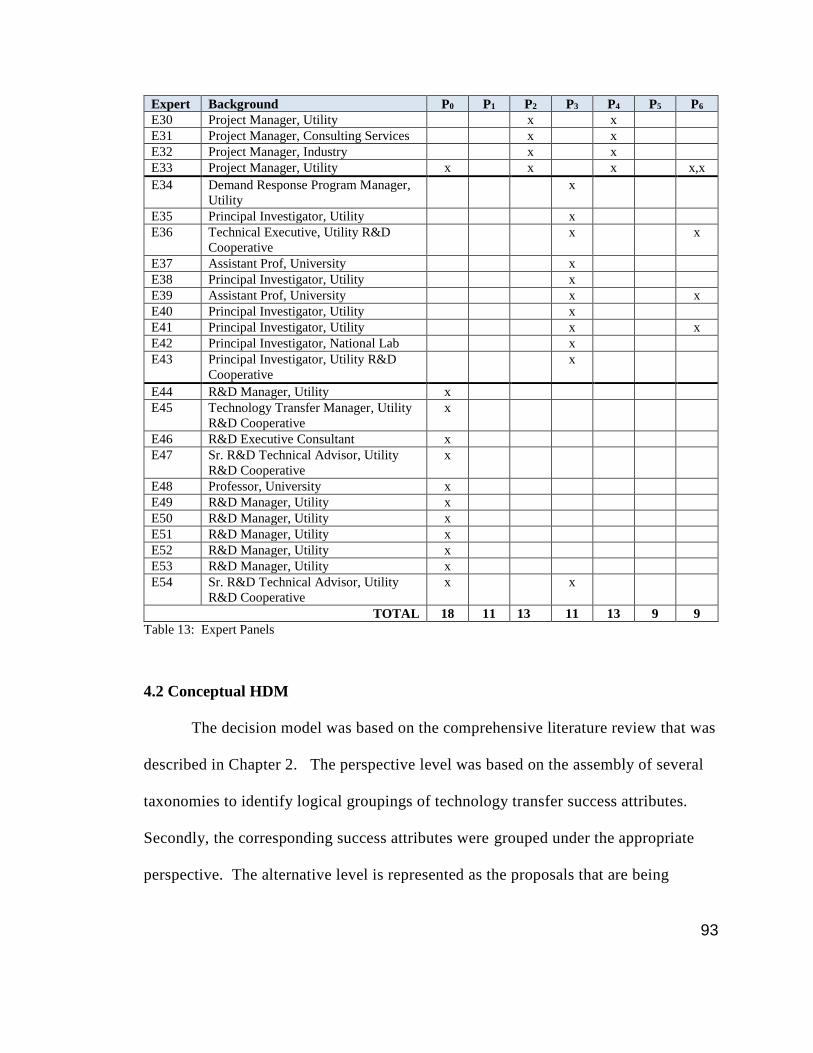
93
Expert Background P0 P1 P2 P3 P4 P5 P6
E30 Project Manager, Utility x x
E31 Project Manager, Consulting Services x x
E32 Project Manager, Industry x x
E33 Project Manager, Utility x x x x,x
E34 Demand Response Program Manager,
Utility
x
E35 Principal Investigator, Utility x
E36 Technical Executive, Utility R&D
Cooperative
x x
E37 Assistant Prof, University x
E38 Principal Investigator, Utility x
E39 Assistant Prof, University x x
E40 Principal Investigator, Utility x
E41 Principal Investigator, Utility x x
E42 Principal Investigator, National Lab x
E43 Principal Investigator, Utility R&D
Cooperative
x
E44 R&D Manager, Utility x
E45 Technology Transfer Manager, Utility
R&D Cooperative
x
E46 R&D Executive Consultant x
E47 Sr. R&D Technical Advisor, Utility
R&D Cooperative
x
E48 Professor, University x
E49 R&D Manager, Utility x
E50 R&D Manager, Utility x
E51 R&D Manager, Utility x
E52 R&D Manager, Utility x
E53 R&D Manager, Utility x
E54 Sr. R&D Technical Advisor, Utility
R&D Cooperative
x x
TOTAL 18 11 13 11 13 9 9
Table 13: Expert Panels
4.2 Conceptual HDM
The decision model was based on the comprehensive literature review that was
described in Chapter 2. The perspective level was based on the assembly of several
taxonomies to identify logical groupings of technology transfer success attributes.
Secondly, the corresponding success attributes were grouped under the appropriate
perspective. The alternative level is represented as the proposals that are being

94
considered for a research portfolio. Using this model, each proposal will have an
associated technology transfer score.
During the model development process, subject matter experts from panel P0
provided input on the overall organization and nomenclature of the model. The
terminology used for the literature-based model was polished, with consideration to
the essence of the definitions presented to the expert panel. There were several
iterations of the model before the final one was determined. Using a Survey Monkey
tool, the experts were asked if the framework was appropriate for assessing
technology transfer potential of a research proposal. They responded with “Yes” or
“No” for each perspective and associated success attribute. In addition, the expert
panel had the opportunity to provide comments to further explain their response.
Verbatim responses for the content validation phase are presented in Chapter 5.
Recent dissertations that used decision modeling and expert quantification identified
an acceptance level of 2/3 to determine if attributes were appropriate for their
decision models. Using this criterion, a final, validated model was developed. The
finalized model is shown in Figure 6. This model served as the basis for soliciting
quantified judgments to determine relative contributions of success factors to the
perspectives, and the perspective’s contributions to the mission of developing a
technology transfer score.

95
Figure 6: Validated Model

96
4.2.1 Mission Level
The mission level states the objective of this research. That is to develop a
technology transfer score, using a decision model, that can be used to evaluate
research proposals. For the purposes of this research, the model will be validated
with a case study from the utility industry. The case study will involve mature (high
TRL) demand response research proposals for application in the Pacific Northwest.
While the case study is specific to the utility industry, the model can be adapted for
use by other research organizations, similar to those described in the introduction
chapter, and for any technology readiness level.
4.2.2 Perspective Level
The perspective level was based on logical groupings of the literature review
on success attributes. The perspectives are a combination of Linstone, Bozeman, and
Greiner, Franza’s methodologies.
1. The organizational perspective refers to the actions between the research
organization and the technology recipient. For the purposes of this research
the organizations include five likely research partners: Universities,
Collaborative Partnerships (Electric Power Research Institute (EPRI), etc.),
National Labs (Lawrence Berkley, Pacific Northwest National, etc.), Industry
Partners (Intel, IBM, etc.), and other utilities (So Cal Edison, Consolidated
Edison, etc.).
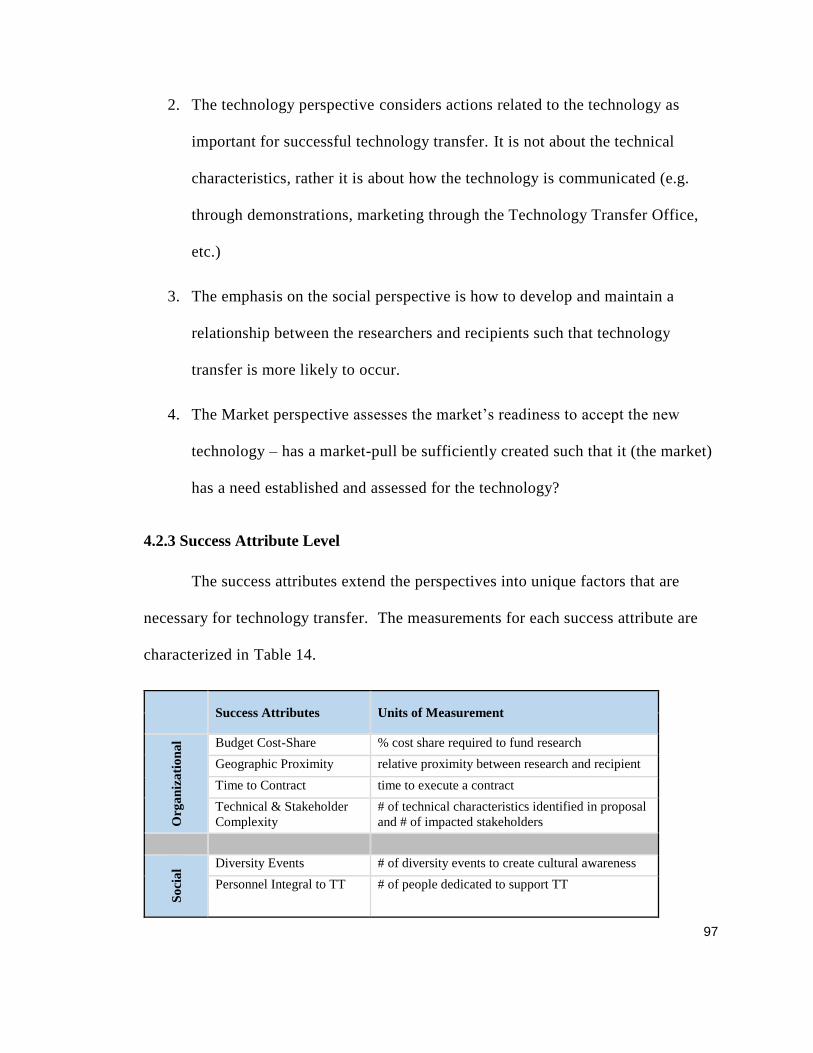
97
2. The technology perspective considers actions related to the technology as
important for successful technology transfer. It is not about the technical
characteristics, rather it is about how the technology is communicated (e.g.
through demonstrations, marketing through the Technology Transfer Office,
etc.)
3. The emphasis on the social perspective is how to develop and maintain a
relationship between the researchers and recipients such that technology
transfer is more likely to occur.
4. The Market perspective assesses the market’s readiness to accept the new
technology – has a market-pull be sufficiently created such that it (the market)
has a need established and assessed for the technology?
4.2.3 Success Attribute Level
The success attributes extend the perspectives into unique factors that are
necessary for technology transfer. The measurements for each success attribute are
characterized in Table 14.
Success Attributes Units of Measurement
Org
an
iza
tio
na
l
Budget Cost-Share % cost share required to fund research
Geographic Proximity relative proximity between research and recipient
Time to Contract time to execute a contract
Technical & Stakeholder
Complexity
# of technical characteristics identified in proposal
and # of impacted stakeholders
So
cia
l Diversity Events # of diversity events to create cultural awareness
Personnel Integral to TT # of people dedicated to support TT

98
Success Attributes Units of Measurement
Project Meetings # of comms described in the comm project plan
Personnel Loaned to
Recipient
time that researchers are loaned to help with TT
Successful TT Awards # of previous successful TT
Tec
hn
olo
gic
al
Combined Research
Experience
# years of cooperative experience of principles
Technology Publications # publications about technology
Personnel Assigned to
TTO
personnel assigned to TTO
Technology Benefits # technology benefits identified in the research
proposal
Budget Allocated to TT % R&D budget dedicated to TTO activities
Ma
rket
Comprehensive Use Case How well is the use Case Defined
Credibility of
Organizational Champion
Credibility of the Organizational Champion
Level of Top Management
Interest
Level of Organizational Support for TT
Government Incentives # of government incentives
Common Technology
Standards
How are common standards supported
ROI ROI
Table 14: Success Attribute Measurements
4.2.4 Alternative Level – Research Proposals
The research proposals that were used to validate the model are discussed in
detail in Chapter 6. Referring to Table 14 the source column indicates where the data
are obtained to evaluate the contributions of each success attribute. The term
“research proposal” in the SOURCE column of Table 14 means that the information is
available in the proposals that were used for the model validation. If the source of the
data is shown as Research Organization or Recipient, this means that the respective

99
organization had to be contacted to obtain the data. Also, some success attribute
measurements were publicly available.
4.3 Data Collection
Section 4.2 described the acceptance criteria for model validation. Eighteen
experts responded to validate the model. Because of the expert’s suggestions, one
success attribute was omitted from the model. The attribute was organizational
homogeneity. The researcher moved forward with data collection after that attribute
was removed.
For all subsequent data collection efforts, Survey Monkey® was used. Each
assessment tool included an introduction, a description of the elements to assess or
compare, and an example of how to do a pairwise comparison. Equation 10 gives the
number of comparisons each expert would make for “n” elements:
𝑛(𝑛−1)
2 Equation 10
The first assessment tool asked Expert Panel P1 to provide quantified
judgments for relative contribution of each perspective to the mission. The experts
considered how much each perspective contributes to technology transfer, in
comparison to other perspectives. There was a total of six comparisons for four
perspectives.
Assessment tools for weighting the importance of each success attribute within
the corresponding perspective contained similar instructions except that the success
attribute definitions changed depending on which panel was assessing which perspective.

100
Expert panels P2 and P4 were asked to assess the contribution of organizational
and social perspectives. For the organizational perspective, there were a total of six
comparisons for four success attributes and the social perspective had 10 comparisons for
five success attributes. For the organizational and social perspectives, the expert panel
was asked to compare the relative importance of each success attribute. The experts
considered which success attribute contributed more to enhancing the organizational
effectiveness and therefore contributing to successful technology transfer. Similar
comparisons were made for the social perspective success attributes.
Expert panel P3 was asked to assess the contribution of the success attributes of
the Technology perspective. There were 10 comparisons for five success attributes.
Expert panel P5 was asked to assess the contribution of the success attributes of
the Market perspective. There were 15 comparisons for six success attributes.
Each assessment tool is provided in Appendix D.
101
CHAPTER 5: RESULTS OF MODEL QUANTIFICATION
This chapter provides the outcomes of model validation, the pairwise
comparisons of the expert panels for all levels of the model quantification, and
desirability curves. The output is a quantified model with the associated weights for
perspectives and success attributes. The model is presented at the end of the chapter.
Inconsistency and disagreements are discussed as appropriate.
5.1 Content Validation
Panel P0 consisted of 18 participants who had a broad overview of the
technology transfer process. They are senior level personnel who have extensive
research management experience, starting with the R&D project through technology
transfer. The panel was asked to comment on the model structure and content. The
assessment tool was intended to capture their judgment of the suitability of the
proposed perspectives and success attributes, and identify those that might have gone
undetected during the literature review. They were asked if the proposed perspectives
and success attributes were appropriate for developing a technology transfer score,
and if not, why. They were also given an opportunity to comment on other attributes
that were not presented. The following graphs show their assessments. A 2/3
majority was necessary to keep the attribute.

102
5.1.1 Perspective Level
Figure 7: Perspective Validation Results
All experts agreed that the perspectives were appropriate for assessing technology
transfer. There were some general comments about needing to consider cost vs. benefit,
the maturity of the technology, and to engage stakeholders early in the R&D process.
There were also many comments, about the importance of the market for technology
transfer. These responses were captured as success attributes under the Market
perspective. Also, the technology maturity is addressed in the case studies – more mature
technologies were selected to test the model.
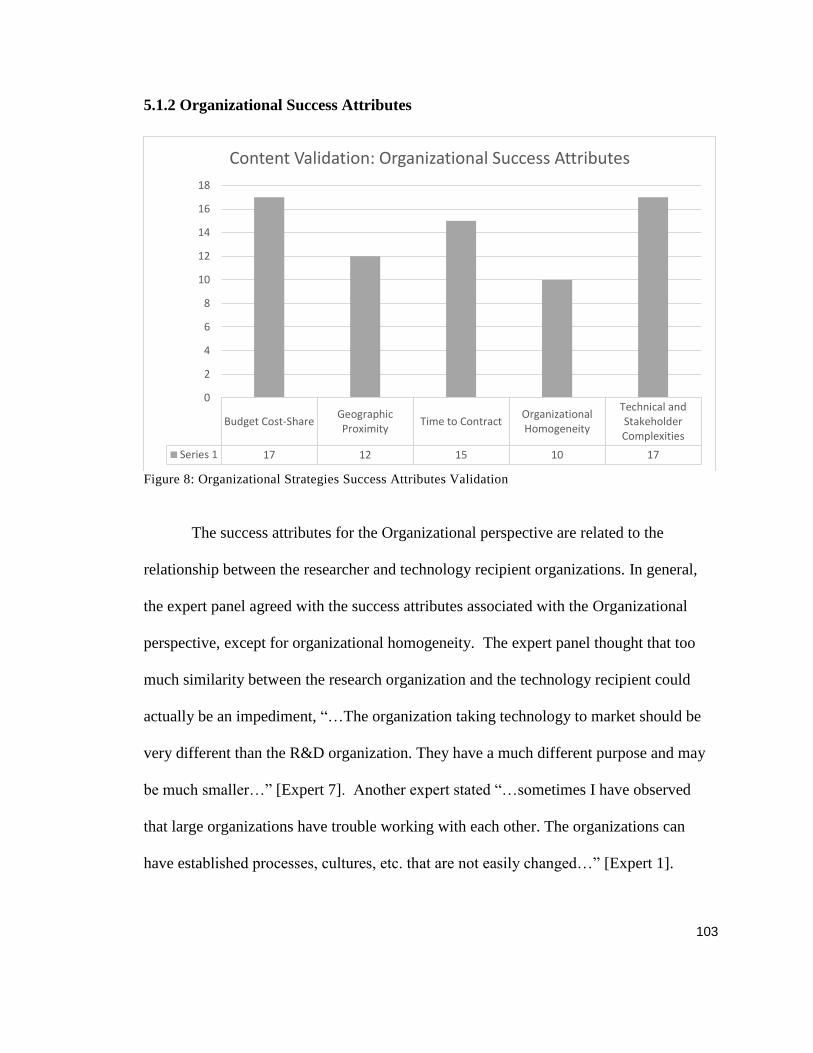
103
5.1.2 Organizational Success Attributes
Figure 8: Organizational Strategies Success Attributes Validation
The success attributes for the Organizational perspective are related to the
relationship between the researcher and technology recipient organizations. In general,
the expert panel agreed with the success attributes associated with the Organizational
perspective, except for organizational homogeneity. The expert panel thought that too
much similarity between the research organization and the technology recipient could
actually be an impediment, “…The organization taking technology to market should be
very different than the R&D organization. They have a much different purpose and may
be much smaller…” [Expert 7]. Another expert stated “…sometimes I have observed
that large organizations have trouble working with each other. The organizations can
have established processes, cultures, etc. that are not easily changed…” [Expert 1].
Budget Cost-ShareGeographicProximity
Time to ContractOrganizationalHomogeneity
Technical andStakeholderComplexities
Series 1 17 12 15 10 17
0
2
4
6
8
10
12
14
16
18
Content Validation: Organizational Success Attributes
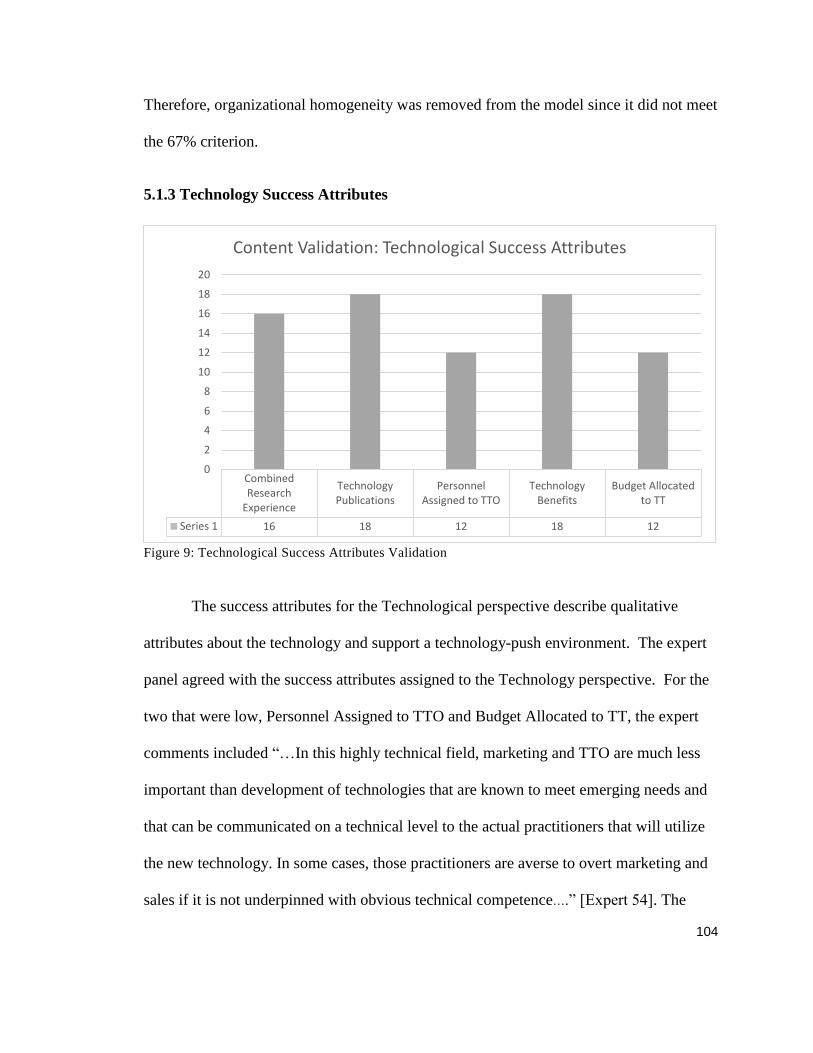
104
Therefore, organizational homogeneity was removed from the model since it did not meet
the 67% criterion.
5.1.3 Technology Success Attributes
Figure 9: Technological Success Attributes Validation
The success attributes for the Technological perspective describe qualitative
attributes about the technology and support a technology-push environment. The expert
panel agreed with the success attributes assigned to the Technology perspective. For the
two that were low, Personnel Assigned to TTO and Budget Allocated to TT, the expert
comments included “…In this highly technical field, marketing and TTO are much less
important than development of technologies that are known to meet emerging needs and
that can be communicated on a technical level to the actual practitioners that will utilize
the new technology. In some cases, those practitioners are averse to overt marketing and
sales if it is not underpinned with obvious technical competence….” [Expert 54]. The
CombinedResearch
Experience
TechnologyPublications
PersonnelAssigned to TTO
TechnologyBenefits
Budget Allocatedto TT
Series 1 16 18 12 18 12
0
2
4
6
8
10
12
14
16
18
20
Content Validation: Technological Success Attributes

105
term “much more important…” will be captured when expert panels will be asked to
quantify, or rank, the success attributes, relative to others in the same perspective.
5.1.4 Social Success Attributes
Figure 10: Social Success Attributes Validation
The success attributes for the Social perspective are related to the personnel
involved with technology transfer. The experts agreed that the success attributes
assigned to the Social perspective are appropriate for assessing technology transfer.
Regarding diversity events as it relates to cultural awareness, one expert commented
that, “…Although cultural awareness is important …, I don't think it is at the same
level of importance as the other categories. Something that measures an atmosphere
of innovation would be interesting…” [Expert 3]
Diversity EventsPersonnel
Dedicated to TTProject Meetings
Personnel LoanPolicy
Successful TTExperiences
Series 1 16 18 18 16 15
13
14
15
16
17
18
Content Validation: Social Success Attributes

106
Three experts did not think that successful technology transfer experiences
were necessary for success. Expert 49 commented, “…the organization's culture
should nurture innovative thinking. Rewarding seems like an afterthought.”
5.1.5 Market Success Attributes
Figure 11: Market Success Attributes Validation
The success attributes for the Market perspective are related to creating a
market for the technology. Again, we see general agreement among the expert panel
regarding Market perspective success attributes. Government incentives is the
attribute where there was the least agreement. Expert 44 commented that, “…For the
Government Subsidy, I disagreed because that is really around making it more
economical. A broader "Regulatory Support" might be better as in California with
batteries pushing emerging markets. The subsidy itself would be the same as a
Comprehensive Use Case
Credibility ofOrganizational
Champion
Level of TopManagement
Interest
GovernmentIncentives
CommonTechnologyStandards
ROI
Series 1 15 18 16 12 16 15
0
2
4
6
8
10
12
14
16
18
20
Content Validation: Market Success Attributes

107
breakthrough in technology reducing the cost.” Expert 51 felt that government
incentives were a subset of determining financial feasibility.
The next section presents the pairwise comparisons to determine the weights of
the decision model. The expert panels identified in Chapter 4 were sent invitation letters
to participate in the model quantification phase. Once their confirmation was received,
they were sent a link to a Survey Monkey® assessment tool where they were asked to
conduct a series of pairwise comparisons. The assessment tool included an example of
how to complete an assessment as well as definitions of the elements that were being
evaluated. The panels were asked distribute 100 points between two perspectives or
success attributes, depending on the panel. This data was transcribed to the Hierarchical
Decision Model Software© to determine the weights for each assessment, the
inconsistency, and disagreement. F-Test data is also provided.
5.2 Perspective Level Quantification
Panel P1 consisted of 11 participants. They were asked to compare the
contribution of the four perspectives to the overall objective of defining a score to assess
technology transfer potential. The experts completed six comparisons to determine the
output shown in Table 15.

108
Per
spec
tiv
e L
evel
Qu
an
tifi
cati
on
Expert Organizational Social Technological Market Inconsistency
Expert
10
0.15 0.23 0.25 0.38 0.01
Expert
11
0.12 0.23 0.29 0.36 0.06
Expert 1 0.1 0.09 0.49 0.33 0.01
Expert 2 0.31 0.05 0.37 0.28 0.02
Expert 3 0.28 0.14 0.15 0.43 0.02
Expert 4 0.16 0.34 0.09 0.41 0
Expert 5 0.2 0.23 0.14 0.43 0.01
Expert 6 0.1 0.23 0.23 0.44 0.02
Expert 7 0.27 0.27 0.16 0.3 0.01
Expert 8 0.17 0.18 0.21 0.44 0.06
Expert 9 0.15 0.19 0.2 0.47 0.09
Mean 0.18 0.2 0.23 0.39
Std Dev 0.07 0.08 0.11 0.06
Disagreement 0.072
Source of Variation Sum of Square Degrees of
Freedom
Mean Square F-Test
Value
Between Subjects 0.29 3 0.97 10.02
Between Conditions 0.00 10 0.000
Residual 0.29 30 0.010
Total 0.58 43
Critical F value with degrees of freedom 3 & 30 at 0.01 level: 4.51
Critical F value with degrees of freedom 3 & 30 at 0.025 level: 3.59
Critical F value with degrees of freedom 3 & 30 at 0.05 level: 2.92
Critical F value with degrees of freedom 3 & 30 at 0.1 level: 2.28
Table 15: Perspective Level Quantification
The inconsistency within each expert is acceptable (all < 0.10). Using F-Test
data, the null hypothesis (Ho = there are disagreements among the experts) can be
rejected at the 0.01 level. The between subjects F-Test value is 10, while the critical
F value at the 0.01 level is 4.51. This expert panel assessed the Market perspective as
most important (0.39)
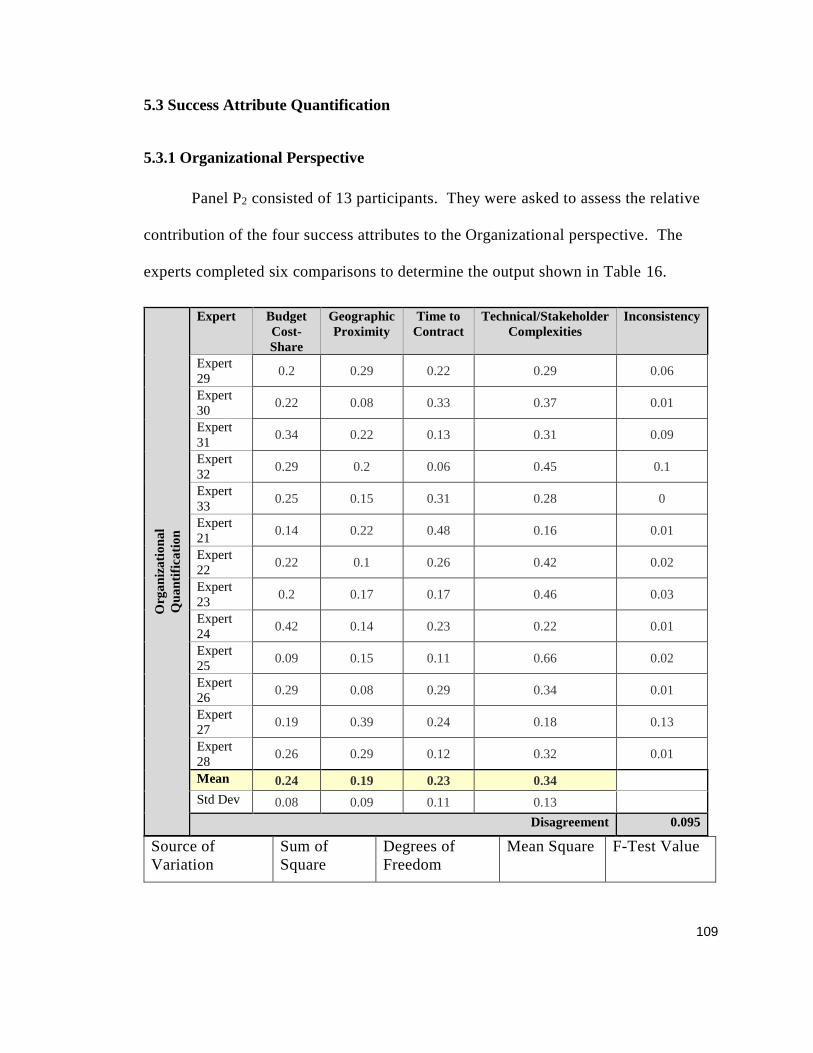
109
5.3 Success Attribute Quantification
5.3.1 Organizational Perspective
Panel P2 consisted of 13 participants. They were asked to assess the relative
contribution of the four success attributes to the Organizational perspective. The
experts completed six comparisons to determine the output shown in Table 16.
Org
an
iza
tio
na
l
Qu
an
tifi
cati
on
Expert Budget
Cost-
Share
Geographic
Proximity
Time to
Contract
Technical/Stakeholder
Complexities
Inconsistency
Expert
29 0.2 0.29 0.22 0.29 0.06
Expert
30 0.22 0.08 0.33 0.37 0.01
Expert
31 0.34 0.22 0.13 0.31 0.09
Expert
32 0.29 0.2 0.06 0.45 0.1
Expert
33 0.25 0.15 0.31 0.28 0
Expert
21 0.14 0.22 0.48 0.16 0.01
Expert
22 0.22 0.1 0.26 0.42 0.02
Expert
23 0.2 0.17 0.17 0.46 0.03
Expert
24 0.42 0.14 0.23 0.22 0.01
Expert
25 0.09 0.15 0.11 0.66 0.02
Expert
26 0.29 0.08 0.29 0.34 0.01
Expert
27 0.19 0.39 0.24 0.18 0.13
Expert
28 0.26 0.29 0.12 0.32 0.01
Mean 0.24 0.19 0.23 0.34
Std Dev 0.08 0.09 0.11 0.13
Disagreement 0.095
Source of
Variation
Sum of
Square
Degrees of
Freedom
Mean Square F-Test Value

110
Between
Subjects
0.21 3 0.071 4.88
Between
Conditions
0.00 11 0.000
Residual 0.48 33 0.015
Total 0.69 47
Critical F value with degrees of freedom 3 & 33 at 0.01 level: 4.44
Critical F value with degrees of freedom 3 & 33 at 0.025 level: 3.54
Critical F value with degrees of freedom 3 & 33 at 0.05 level: 2.89
Critical F value with degrees of freedom 3 & 33 at 0.1 level: 2.26
Table 16: Organizational Success Attribute Quantification
The inconsistency within each expert is acceptable (all < 0.10) for all experts
except Expert 27 (0.13); there was slight inconsistency. The impact of Expert 27’s
inconsistency was determined not to have an impact on the overall rank of the success
attributes – the assessment was removed and the rank of the success attributes
remained the same. Using F-Test data, the null hypothesis (Ho = there are
disagreements among the experts) can be rejected at the 0.01 level. The between
subjects F-Test value is 4.88, while the critical F value at the 0.01 level is 4.44. This
expert panel assessed the Technical and Stakeholder Complexities as contributing the
most to the Organizational perspective (0.34).
5.3.2 Technological Perspective
Panel P3 consisted of 11 participants. They were asked to assess the relative
contribution of the five success attributes to the Technological perspective. The
experts completed 10 comparisons to determine the output shown in Table 17.
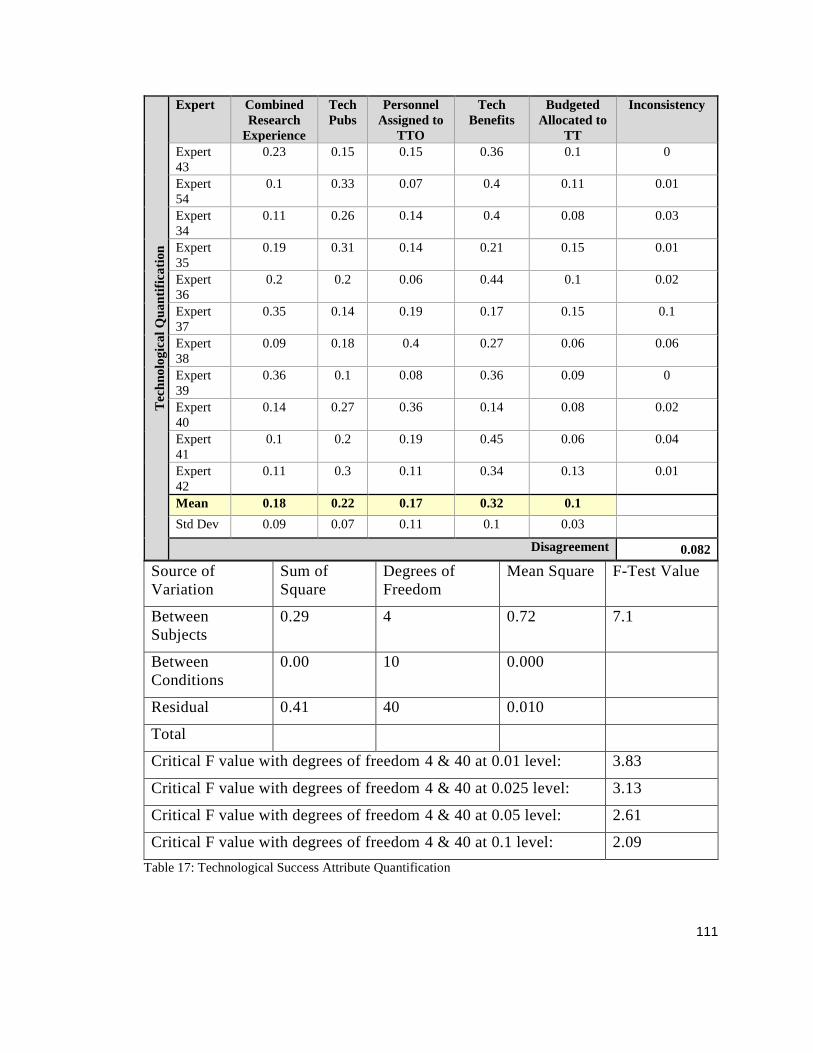
111
Tec
hn
olo
gic
al
Qu
an
tifi
cati
on
Expert Combined
Research
Experience
Tech
Pubs
Personnel
Assigned to
TTO
Tech
Benefits
Budgeted
Allocated to
TT
Inconsistency
Expert
43
0.23 0.15 0.15 0.36 0.1 0
Expert
54
0.1 0.33 0.07 0.4 0.11 0.01
Expert
34
0.11 0.26 0.14 0.4 0.08 0.03
Expert
35
0.19 0.31 0.14 0.21 0.15 0.01
Expert
36
0.2 0.2 0.06 0.44 0.1 0.02
Expert
37
0.35 0.14 0.19 0.17 0.15 0.1
Expert
38
0.09 0.18 0.4 0.27 0.06 0.06
Expert
39
0.36 0.1 0.08 0.36 0.09 0
Expert
40
0.14 0.27 0.36 0.14 0.08 0.02
Expert
41
0.1 0.2 0.19 0.45 0.06 0.04
Expert
42
0.11 0.3 0.11 0.34 0.13 0.01
Mean 0.18 0.22 0.17 0.32 0.1
Std Dev 0.09 0.07 0.11 0.1 0.03
Disagreement 0.082
Source of
Variation
Sum of
Square
Degrees of
Freedom
Mean Square F-Test Value
Between
Subjects
0.29 4 0.72 7.1
Between
Conditions
0.00 10 0.000
Residual 0.41 40 0.010
Total
Critical F value with degrees of freedom 4 & 40 at 0.01 level: 3.83
Critical F value with degrees of freedom 4 & 40 at 0.025 level: 3.13
Critical F value with degrees of freedom 4 & 40 at 0.05 level: 2.61
Critical F value with degrees of freedom 4 & 40 at 0.1 level: 2.09
Table 17: Technological Success Attribute Quantification

112
The inconsistency within each expert is acceptable (all < 0.10). Using F-Test
data, the null hypothesis (Ho = there are disagreements among the experts) can be
rejected at the 0.01 level. The between subjects F-Test value is 7.1, while the critical
F value at the 0.01 level is 3.83. This expert panel assessed the technology benefits as
most important (0.32)
5.3.3 Social Perspective
Panel P4 consisted of 13 participants. They were asked to assess the relative
contribution of the five success attributes to the Social perspective. The experts
completed 10 comparisons to determine the output shown in Table 18.
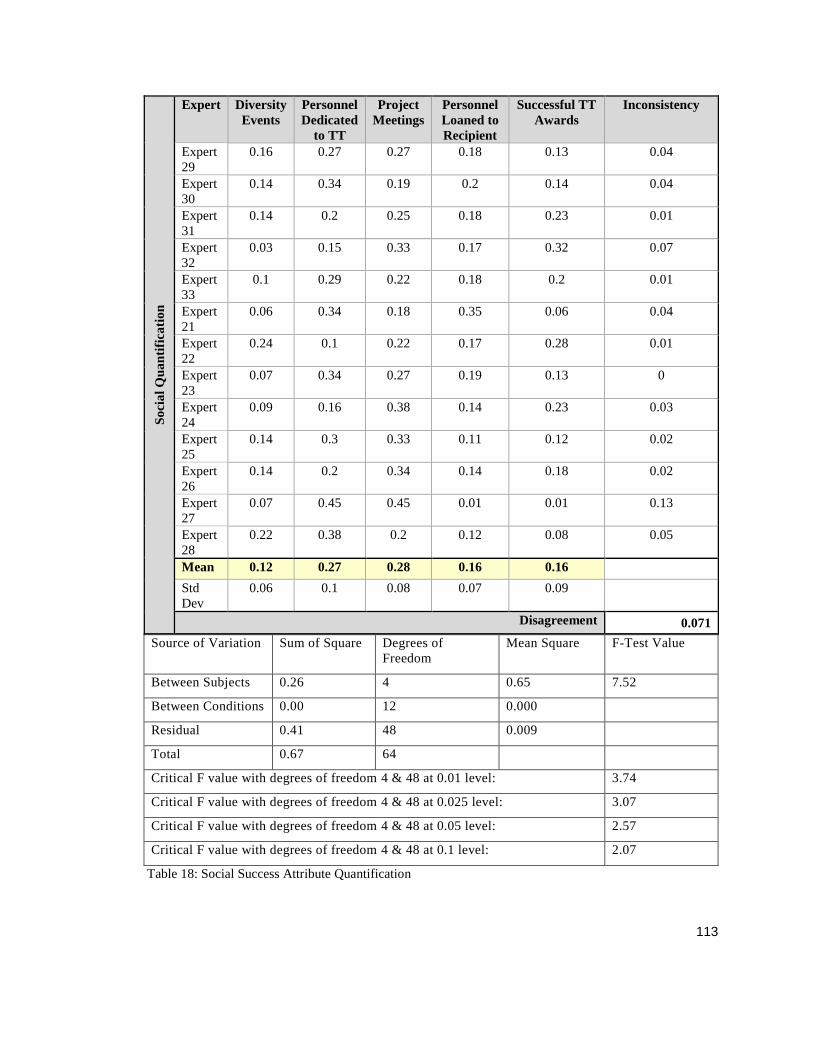
113
So
cia
l Q
ua
nti
fica
tio
n
Expert Diversity
Events
Personnel
Dedicated
to TT
Project
Meetings
Personnel
Loaned to
Recipient
Successful TT
Awards
Inconsistency
Expert
29
0.16 0.27 0.27 0.18 0.13 0.04
Expert
30
0.14 0.34 0.19 0.2 0.14 0.04
Expert
31
0.14 0.2 0.25 0.18 0.23 0.01
Expert
32
0.03 0.15 0.33 0.17 0.32 0.07
Expert
33
0.1 0.29 0.22 0.18 0.2 0.01
Expert
21
0.06 0.34 0.18 0.35 0.06 0.04
Expert
22
0.24 0.1 0.22 0.17 0.28 0.01
Expert
23
0.07 0.34 0.27 0.19 0.13 0
Expert
24
0.09 0.16 0.38 0.14 0.23 0.03
Expert
25
0.14 0.3 0.33 0.11 0.12 0.02
Expert
26
0.14 0.2 0.34 0.14 0.18 0.02
Expert
27
0.07 0.45 0.45 0.01 0.01 0.13
Expert
28
0.22 0.38 0.2 0.12 0.08 0.05
Mean 0.12 0.27 0.28 0.16 0.16
Std
Dev
0.06 0.1 0.08 0.07 0.09
Disagreement 0.071
Source of Variation Sum of Square Degrees of
Freedom
Mean Square F-Test Value
Between Subjects 0.26 4 0.65 7.52
Between Conditions 0.00 12 0.000
Residual 0.41 48 0.009
Total 0.67 64
Critical F value with degrees of freedom 4 & 48 at 0.01 level: 3.74
Critical F value with degrees of freedom 4 & 48 at 0.025 level: 3.07
Critical F value with degrees of freedom 4 & 48 at 0.05 level: 2.57
Critical F value with degrees of freedom 4 & 48 at 0.1 level: 2.07
Table 18: Social Success Attribute Quantification

114
The inconsistency within each expert is acceptable (all < 0.10) for all experts
except Expert 27 (0.13); there was some inconsistency. Similar to Organizational
success attribute assessments, the impact of Expert 27’s inconsistency was determined
not to have an impact on the overall rank of the success attributes – the assessment
was removed and the rank of the success attributes remained the same. Using F-Test
data, the null hypothesis (Ho = there are disagreements among the experts) can be
rejected at the 0.01 level. The between subjects F-Test value is 7.52, while the
critical F value at the 0.01 level is 3.74. This expert panel assessed Project Meetings
as contributing the most to the Social perspective (0.28). However, this is only
slightly higher than personnel dedicated to the technology transfer activities (0.27) .
5.3.4 Market Perspective
Panel P5 consisted of nine participants. They were asked to assess the relative
contribution of the six success attributes to the Market perspective. The experts
completed 15 comparisons to determine the output shown in Table 19.
Ma
rket
Qu
an
tifi
cati
on
Expert Comp
Use
Case
Credibility
of Org
Champion
Level of
Top Mgmt
Interest
Government
Incentives
Common
Tech
Standards
ROI Inconsistency
Expert
12
0.17 0.17 0.17 0.04 0.05 0.4 0
Expert
13
0.14 0.1 0.19 0.11 0.25 0.18 0.02
Expert
14
0.31 0.11 0.18 0.02 0.09 0.28 0.01
Expert
15
0.12 0.12 0.29 0.07 0.26 0.13 0.04
Expert
17
0.01 0.08 0.05 0.35 0.33 0.16 0.08
Expert
18
0.1 0.19 0.18 0.07 0.15 0.31 0.01
Expert
19
0.14 0.23 0.36 0.04 0.06 0.16 0.02

115
Expert
20
0.11 0.05 0.37 0.11 0.14 0.21 0.07
Expert
2
0.25 0.22 0.19 0.05 0.04 0.24 0.05
Mean 0.15 0.14 0.22 0.1 0.16 0.23
Std
Dev 0.08 0.06 0.09 0.09 0.1 0.08
Disagreement 0.082
Source of Variation Sum of Square Degrees of
Freedom
Mean Square F-Test Value
Between Subjects 0.12 5 0.024 2.3
Between Conditions 0.00 8 0.000
Residual 0.41 40 0.010
Total 0.53 53
Critical F value with degrees of freedom 3 & 30 at 0.01 level: 3.51
Critical F value with degrees of freedom 3 & 30 at 0.025 level: 2.9
Critical F value with degrees of freedom 3 & 30 at 0.05 level: 2.45
Critical F value with degrees of freedom 3 & 30 at 0.1 level: 2
Table 19: Market Success Attribute Quantification
The inconsistency within each expert is acceptable (all < 0.10). Using F-Test
data, the null hypothesis (Ho = there are disagreements among the experts) can be
rejected at the 0.1 level. The between subjects F-Test value is 2.3, while the critical F
value at the 0.1 level is 2. This expert panel assessed the ROI as most important
(0.23). However, this is only slightly higher than the Level of Top Management
Interest (0.22).
5.3.5 Final Model Weights
Table 20 summarizes the output of expert judgment quantification. The most
important perspective is market with a value of 0.39 and the corresponding most
important success attribute is determining financial feasibility by assessing the ROI
(0.23). This is followed closely by level of top management interest (0.22). In order
116
of contribution to developing a technology transfer score, technological, social, and
organizational are next important. Within each perspective, the associated success
attribute with the highest score supports the concept described in literature as
important, that is building a relationship is necessary for successful technology
transfer. For example, in organizational perspective, technical and stakeholder
complexities are most important. In the technological perspective, describing the
technology benefits ranked highest. Finally, in the social perspective, project team
meetings to facilitate communication and develop trust is the most important success
attribute.

117
Perspectives Value
Success Attributes Success
Attribute
Global Value –
Contribution to
TT Score
Attribute Local Value
Organizational 0.18
Budget Cost-Share 0.24
0.043
Geographic
Proximity 0.19 0.034
Time to Contract 0.23 0.041
Technical &
Stakeholder
Complexities
0.34
Technical
Complexities 0.50 0.031
Stakeholder
Complexities 0.50 0.031
Technological 0.23
Combined Research
Experience 0.22
0.041
Technology
Publications 0.22 0.051
Personnel Assigned
to TTO 0.17 0.039
Technology Benefits 0.32 0.074
Budget Allocated to
TT 0.10 0.023
Social 0.20
Diversity Events 0.12
0.024
Personnel Dedicated
to TT 0.27 0.054
Project Meetings 0.28 0.056
Personnel Loan
Policy 0.16 0.032
Successful TT
Experiences 0.16 0.032
Market 0.39
Use Case 0.15
0.058
Organizational
Champion 0.14 0.055
Level of Top Mgmt
Interest 0.22 0.086
Government
Incentives 0.1 0.039
Common
Technology
Standards
0.16 0.062
ROI 0.23 0.089
Total 1.0 1.0
Table 20: Final Model Weights

118
Figure 12: Weighted Model

119
5.4 Desirability Curves
There were nine experts on panel P6 who validated and quantified the desirability
curves. These experts were subsets of panels P2 – P5. A significant amount of care was
taken when working with the experts to explain the purpose of desirability curves and
how they are developed. The researcher completed the desirability curves through a face-
to-face meeting with the expert or via a phone conversation.
The graphical method was used to develop the curves. Participants were asked
the desirability of a success attribute on a score of 0-100. The arithmetic mean of their
responses, for each success attribute, determined the overall desirability. Figures 13 – 33
show the results of the desirability curves for each of the 20 success attributes.
5.4.1 Organizational Success Attributes
Budget Cost Share Desirability Curve
The measurement for budget cost share is the percentage of cost share that is
required by the researcher to fund the project. The expert panel was asked to
determine the intermediate desirability values between “no cost share required” with a
desirability of 100 and “100% of the funding comes from the cost-share by the
researcher” with a desirability of zero.

120
Figure 13: Budget Cost Share Desirability Curve
0
10
20
30
40
50
60
70
80
90
100
No cost share required 20% cost share isrequired
40% cost share isrequired
60% cost share isrequired
80% cost share isrequired
100% of funding comesfrom cost share
Budget Cost Share
No cost share required 20% cost share is
required
40% cost share is
required
60% cost share is
required
80% cost share is
required
100% of funding
comes from cost
shareE23 100 100 100 20 0 0
E29 100 100 100 60 30 0
E33 100 70 60 50 10 0
Mean 100 90 87 43 13 0
BUDGET COST-SHARE

121
Geographic Proximity
The measurement for geographic proximity is the distance between the
researcher and the technology recipient. The expert panel was asked to develop the
desirability curve for ranges of 0-10 miles to greater than 3000 miles. 0-10 miles is
the most desirable while greater than 3000 miles is the least desirable measure.
Figure 14: Geographic Proximity Desirability Curve
0
10
20
30
40
50
60
70
80
90
100
0 - 10 mile separation 10 - 250 mile separation 250 - 1500 mile separation 1500 - 3000 mile separation > 3000 mile separation
Geographic (distance) between Researcher and Tech Recipient
0 - 10 mile separation 10 - 250 mile
separation
250 - 1500 mile
separation
1500 - 3000 mile
separation
> 3000 mile separation
E23 100 80 40 20 10
E29 100 100 20 20 20
E33 100 80 50 40 0
Mean 100 87 37 27 10
GEOGRAPHIC PROXIMITY

122
Average Time to Contract
The measurement for average time to contract is the average time for the
technology recipient to execute a contract with a researcher. If there is no prior
experience with the researcher, it would be an estimate of the average time similar
contracts took to execute; similar is defined as the same type of organization (e.g.
university, utility, industry, national lab, collaborative research partner). The expert
panel was asked to determine the desirability curve between 0.5 month and a contract
execution time of greater than one year.
Figure 15: Average Time to Contract Desirability Curve
0
10
20
30
40
50
60
70
80
90
100
0.5 month 1.5 months 6 months 12 months > 12 months
Average Time to Contract
0.5 month 1.5 months 6 months 12 months > 12 months
E23 100 100 20 0 0
E29 100 100 50 20 20
E33 100 80 50 20 0
Mean 100 93 40 13 7
AVERAGE TIME TO CONTRACT

123
Technical Complexity
The measurement for technical complexity is the number of technology
characteristics the proposal addresses. For the case study, the technology
characteristics are identified in the technology roadmaps of the recipient organization.
The expert panel was asked to determine the desirability curve between the proposal
addressing one technology characteristic to the proposal addressing more than five
characteristics.
Figure 16: Technical Complexities Desirability Curve
0
10
20
30
40
50
60
70
80
90
100
1 2 3 5 greater than 5
Technical Complexity (# of technical characteristics)
1 2 3 5 greater than 5
E23 100 60 30 0 0
E29 100 100 80 10 0
E33 100 90 70 40 0
Mean 100 83 60 17 0
TECHNICAL COMPLEXITIES

124
Stakeholder Complexity
The measurement for stakeholder complexity is the number of stakeholders
involved in the research project. The expert panel was asked to determine the
desirability curve for the proposal involving only one stakeholder and for the proposal
involving more than five stakeholders.
Figure 17: Stakeholder Complexities Desirability Curve
0
10
20
30
40
50
60
70
80
90
100
1 2 3 5 greater than 5
Stakeholder Complexity (# of impacted stakeholders)
1 2 3 5 greater than 5
E23 100 80 30 0 0
E29 100 90 70 20 10
E33 100 90 60 30 0
Mean 100 87 53 17 3
STAKEHOLDER COMPLEXITIES

125
5.4.2 Technological Success Attributes
Combined Research Experience
The measurement for combined research experience is the number of years of
experience for the principal investigators. The scale ranges from zero years, which is
least desirable, up to more than 75 years.
Figure 18: Combined Research Experience Desirability Curve
0
10
20
30
40
50
60
70
80
90
100
0 years 15 years 25 years 50 years >75 years
Combined Research Experience
0 years 15 years 25 years 50 years >75 years
E36 0 60 80 100 100
E39 0 75 75 80 100
E41 0 30 80 90 100
Mean 0 55 78 90 100
COMBINED RESEARCH EXPERIENCE
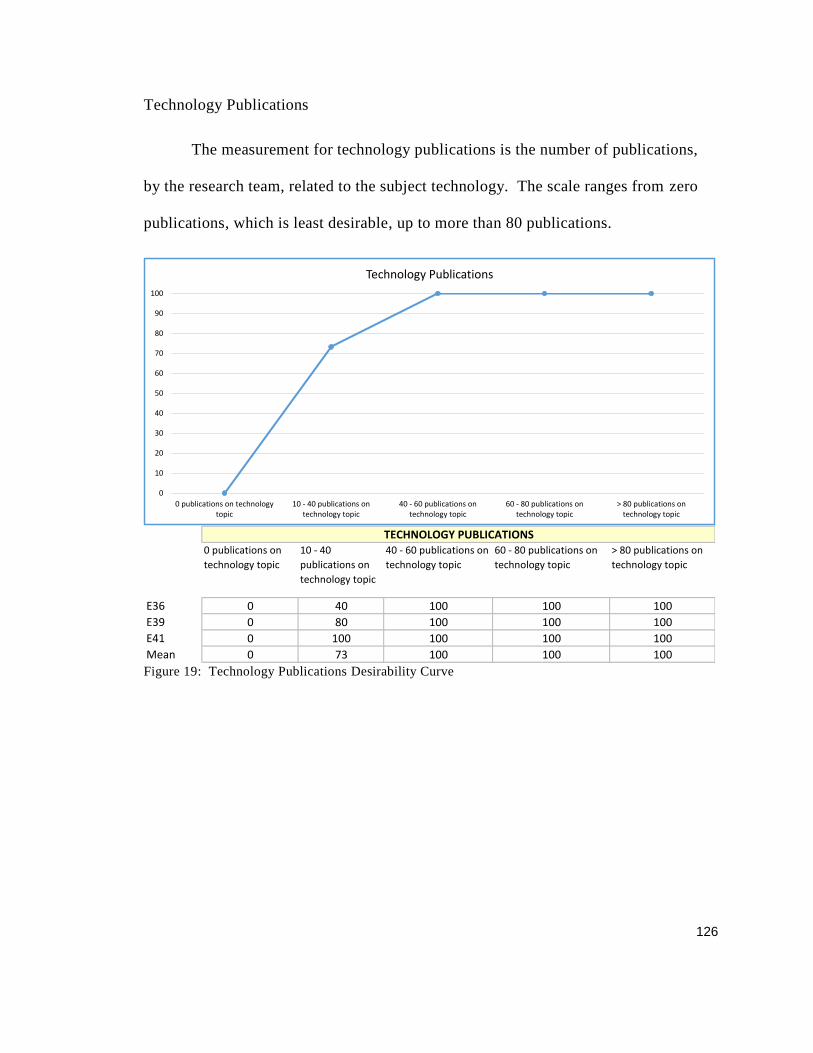
126
Technology Publications
The measurement for technology publications is the number of publications,
by the research team, related to the subject technology. The scale ranges from zero
publications, which is least desirable, up to more than 80 publications.
Figure 19: Technology Publications Desirability Curve
0
10
20
30
40
50
60
70
80
90
100
0 publications on technologytopic
10 - 40 publications ontechnology topic
40 - 60 publications ontechnology topic
60 - 80 publications ontechnology topic
> 80 publications ontechnology topic
Technology Publications
0 publications on
technology topic
10 - 40
publications on
technology topic
40 - 60 publications on
technology topic
60 - 80 publications on
technology topic
> 80 publications on
technology topic
E36 0 40 100 100 100
E39 0 80 100 100 100
E41 0 100 100 100 100
Mean 0 73 100 100 100
TECHNOLOGY PUBLICATIONS

127
Personnel Assigned to TTO
The measurement for personnel assigned to the technology transfer office
(TTO) is a count of the people assigned. The scale ranges from zero people assigned
to three full-time, dedicated staff.
Figure 20: Personnel Assigned to TTO Desirability Curve
0
10
20
30
40
50
60
70
80
90
100
0 personnel - nodedicated TTO exists
1 person assigned part-time to TTO
1 person assigned fulltime to TTO activities
2 person staff assignedpart-time
2 person staff assignedfull time to TTO activities
3 person dedicated staffassigned to TTO
Personnel Assigned to TTO
0 personnel - no
dedicated TTO
exists
1 person assigned
part-time to TTO
1 person assigned full
time to TTO activities
2 person staff assigned
part-time
2 person staff
assigned full time to
TTO activities
3 person dedicated
staff assigned to TTO
E36 0 40 80 100 100 100
E39 0 40 80 60 90 100
E41 0 20 30 60 80 100
Mean 0 33 63 73 90 100
PERSONNEL ASSIGNED TO TTO

128
Technology Benefits
The measurement for technology benefits is the number of benefits that are
described in the research proposal. The scale ranges from no benefits identified to
more than 10 benefits are defined.
Figure 21: Technology Benefits Desirability Curve
0 benefits identified2 benefits identified in the
research proposal4 benefits identified in the
research proposal6 benefits identified in the
research proposal> 10 benefits identified in
the research proposal
Series1 0 43 87 100 100
0
10
20
30
40
50
60
70
80
90
100
Technology Benefits (# Identified in the Research Proposal)
0 benefits identified 2 benefits
identified in the
research proposal
4 benefits identified in
the research proposal
6 benefits identified in
the research proposal
> 10 benefits
identified in the
research proposal
E36 0 20 60 100 100
E39 0 60 100 100 100
E41 0 50 100 100 100
Mean 0 43 87 100 100
TECHNOLOGY BENEFITS

129
Budget Allocated to TT
The measurement for budget allocated to technology transfer is the percentage
of the R&D budget that is allocated to technology transfer activities. The scale ranges
from no budget allocated to more than 10% of the budget is allocated.
Figure 22: Budget Allocated to TT Activities Desirability Curve
0
10
20
30
40
50
60
70
80
90
100
No budget is allocated 1% of R&D budget is allocatedto TT activities/marketing
5% of R&D budget is allocatedto TT activities/marketing
10% of R&D budget isallocated to TT
activities/marketing
>10% of R&D budget isallocated to TT
activities/marketing
Budget Allocated to TTO Activities (% of R&D Budget)
No budget is
allocated
1% of R&D
budget is
allocated to TT
activities/marketi
ng
5% of R&D budget is
allocated to TT
activities/marketing
10% of R&D budget is
allocated to TT
activities/marketing
>10% of R&D budget
is allocated to TT
activities/marketing
E36 0 10 40 100 100
E39 0 20 60 100 100
E41 0 10 70 100 100
Mean 0 13 57 100 100
BUDGET ALLOCATED TO TT ACTIVITIES

130
5.4.3 Social Success Attributes
Diversity Events
The measurement for diversity events is the number of events an organization
requires to train their personnel on working with or being sensitive to other cultures.
The scale differentiates between recommended and required events. The scale ranges
from zero events are required to at least two events are required.
Figure 23: Diversity Events Desirability Curve
There are no diversity eventsrequired
One diversity event isrecommended
One diversity event isrequired
Two diversity events arerecommended
At least two diversity eventsare required
Series1 3 22 43 43 100
0
10
20
30
40
50
60
70
80
90
100
Diversity Events
There are no
diversity events
required
One diversity event is
recommended
One diversity event
is required
Two diversity events
are recommended
At least two diversity
events are required
E23 0 30 50 50 100
E29 10 10 30 30 100
E33 0 25 50 50 100
Mean 3 22 43 43 100
DIVERSITY EVENTS

131
Personnel Dedicated to TT
The measurement for personnel dedicated to technology transfer is the number
of personnel, independent of the technology transfer office, that are dedicated to
technology transfer. These people would include principal investigators, subject
matter experts, or others from the research project team. The scale ranges from no
one is dedicated to technology transfer activities to more than 10 personnel are
assigned.
Figure 24: Personnel Dedicated to Support TT Desirability Curve
No individuals are availableto support technology
transfer
One FTE is assigned totechnology transfer
2 FTE are dedicated tosupport technology transfer
5 FTE are dedicated tosupport technology transfer
> 10 FTE are dedicated tosupport TT
Series1 0 13 40 73 100
0
10
20
30
40
50
60
70
80
90
100
Personnel Dedicated to Support TT
No individuals are
available to support
technology transfer
One FTE is assigned to
technology transfer
2 FTE are dedicated to
support technology
transfer
5 FTE are dedicated to
support technology
transfer
> 10 FTE are dedicated to
support TT
E23 0 10 50 100 100
E29 0 10 20 50 100
E33 0 20 50 70 100
Mean 0 13 40 73 100
PERSONNEL DEDICATED TO TT
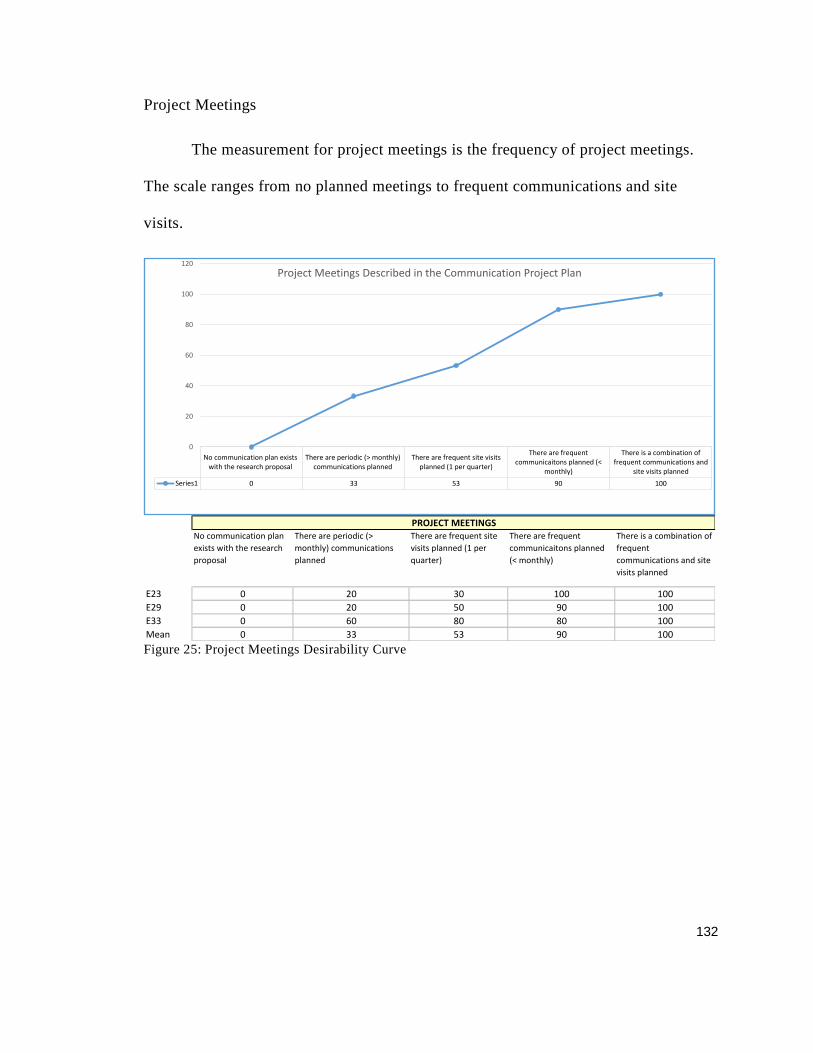
132
Project Meetings
The measurement for project meetings is the frequency of project meetings.
The scale ranges from no planned meetings to frequent communications and site
visits.
Figure 25: Project Meetings Desirability Curve
No communication plan existswith the research proposal
There are periodic (> monthly)communications planned
There are frequent site visitsplanned (1 per quarter)
There are frequentcommunicaitons planned (<
monthly)
There is a combination offrequent communications and
site visits planned
Series1 0 33 53 90 100
0
20
40
60
80
100
120
Project Meetings Described in the Communication Project Plan
No communication plan
exists with the research
proposal
There are periodic (>
monthly) communications
planned
There are frequent site
visits planned (1 per
quarter)
There are frequent
communicaitons planned
(< monthly)
There is a combination of
frequent
communications and site
visits planned
E23 0 20 30 100 100
E29 0 20 50 90 100
E33 0 60 80 80 100
Mean 0 33 53 90 100
PROJECT MEETINGS

133
Personnel Loaned to Recipient
The measurement for personnel loaned to the technology recipient is how many
months the researcher is loaned to the recipient. The scale ranges from researchers are
not loaned to researchers are loaned for more than 12 months.
Figure 26: Personnel Loaned to Recipient Desirability Curve
Researchers are not loanedResearchers are loaned for 1
monthResearchers are loaned for 6
monthsResearchers are loaned for 12
months
Researchers are loaned for >12 months (implies that
personnel are loaned until TTis complete)
Series1 0 15 37 77 100
0
10
20
30
40
50
60
70
80
90
100
Personnel Loaned to Recipient
Researchers are not
loaned
Researchers are loaned for 1
month
Researchers are loaned
for 6 months
Researchers are loaned for
12 months
Researchers are loaned
for > 12 months (implies
that personnel are
loaned until TT is
complete)E23 0 10 10 60 100
E29 0 10 30 80 100
E33 0 25 70 90 100
Mean 0 15 37 77 100
PERSONNEL LOANED TO RECIPIENT

134
Successful TT Experiences
The measurement for successful technology transfer experiences is the number of
previous project successes. The inference is that the more successful transfers, the more
familiar the researcher is with how to be successful. The scale ranges from no previous
successes to more than 10 successful transfers.
Figure 27: Successful TT Experience Desirability Curve
The organization has noprevious successful TTs
The organization has at least 1successful TT
The organization has 5successful technology
transfers
The organization has 10successful technology
transfers
The organization has > 10successful technology
transfers
Series1 0 37 70 92 100
0
10
20
30
40
50
60
70
80
90
100
Successful TT Experience
The organization has no
previous successful TTs
The organization has at least
1 successful TT
The organization has 5
successful technology
transfers
The organization has 10
successful technology
transfers
The organization has > 10
successful technology
transfersE23 0 10 50 80 100
E29 0 50 80 100 100
E33 0 50 80 95 100
Mean 0 37 70 92 100
SUCCESSFUL TT EXPERIENCE
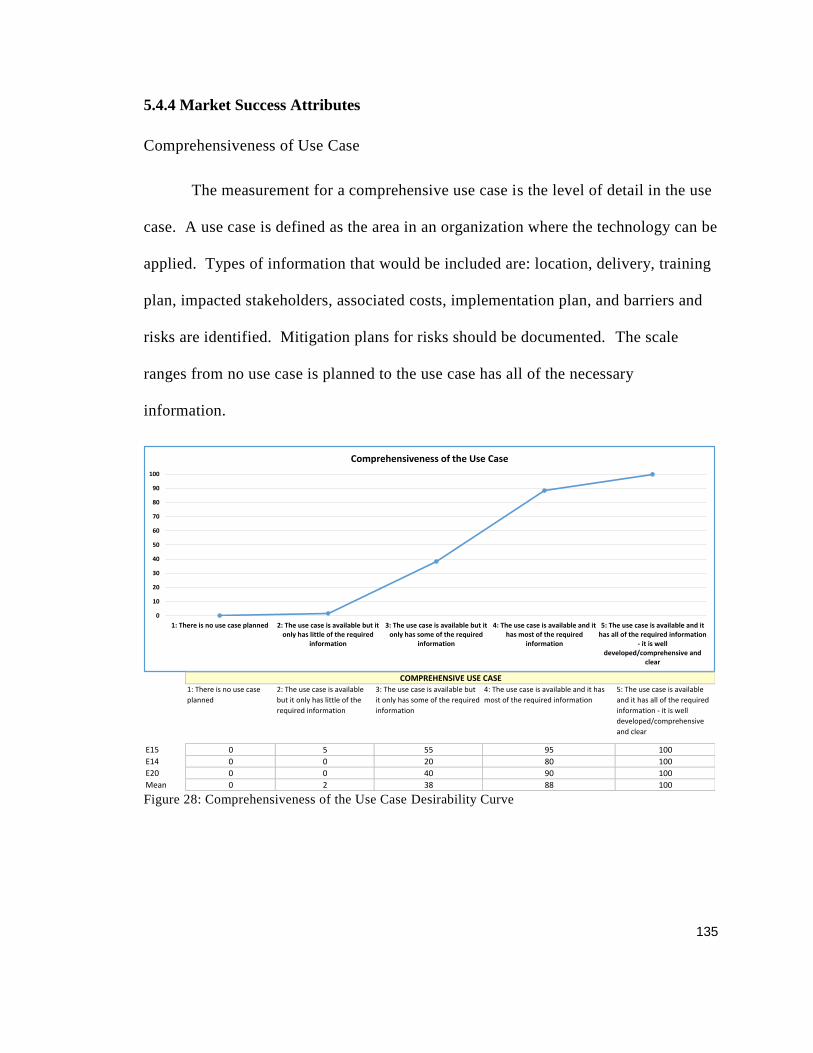
135
5.4.4 Market Success Attributes
Comprehensiveness of Use Case
The measurement for a comprehensive use case is the level of detail in the use
case. A use case is defined as the area in an organization where the technology can be
applied. Types of information that would be included are: location, delivery, training
plan, impacted stakeholders, associated costs, implementation plan, and barriers and
risks are identified. Mitigation plans for risks should be documented. The scale
ranges from no use case is planned to the use case has all of the necessary
information.
Figure 28: Comprehensiveness of the Use Case Desirability Curve
0
10
20
30
40
50
60
70
80
90
100
1: There is no use case planned 2: The use case is available but itonly has little of the required
information
3: The use case is available but itonly has some of the required
information
4: The use case is available and ithas most of the required
information
5: The use case is available and ithas all of the required information
- it is welldeveloped/comprehensive and
clear
Comprehensiveness of the Use Case
1: There is no use case
planned
2: The use case is available
but it only has little of the
required information
3: The use case is available but
it only has some of the required
information
4: The use case is available and it has
most of the required information
5: The use case is available
and it has all of the required
information - it is well
developed/comprehensive
and clear
E15 0 5 55 95 100
E14 0 0 20 80 100
E20 0 0 40 90 100
Mean 0 2 38 88 100
COMPREHENSIVE USE CASE
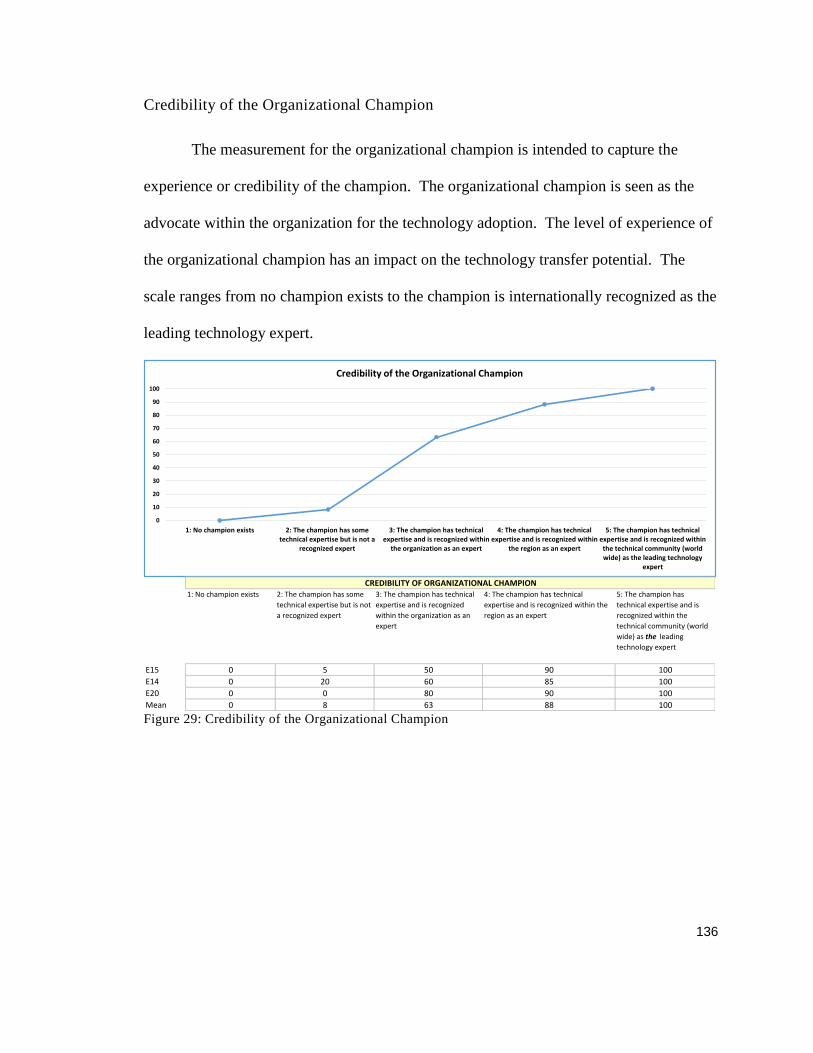
136
Credibility of the Organizational Champion
The measurement for the organizational champion is intended to capture the
experience or credibility of the champion. The organizational champion is seen as the
advocate within the organization for the technology adoption. The level of experience of
the organizational champion has an impact on the technology transfer potential. The
scale ranges from no champion exists to the champion is internationally recognized as the
leading technology expert.
Figure 29: Credibility of the Organizational Champion
0
10
20
30
40
50
60
70
80
90
100
1: No champion exists 2: The champion has sometechnical expertise but is not a
recognized expert
3: The champion has technicalexpertise and is recognized within
the organization as an expert
4: The champion has technicalexpertise and is recognized within
the region as an expert
5: The champion has technicalexpertise and is recognized withinthe technical community (worldwide) as the leading technology
expert
Credibility of the Organizational Champion
1: No champion exists 2: The champion has some
technical expertise but is not
a recognized expert
3: The champion has technical
expertise and is recognized
within the organization as an
expert
4: The champion has technical
expertise and is recognized within the
region as an expert
5: The champion has
technical expertise and is
recognized within the
technical community (world
wide) as the leading
technology expert
E15 0 5 50 90 100
E14 0 20 60 85 100
E20 0 0 80 90 100
Mean 0 8 63 88 100
CREDIBILITY OF ORGANIZATIONAL CHAMPION
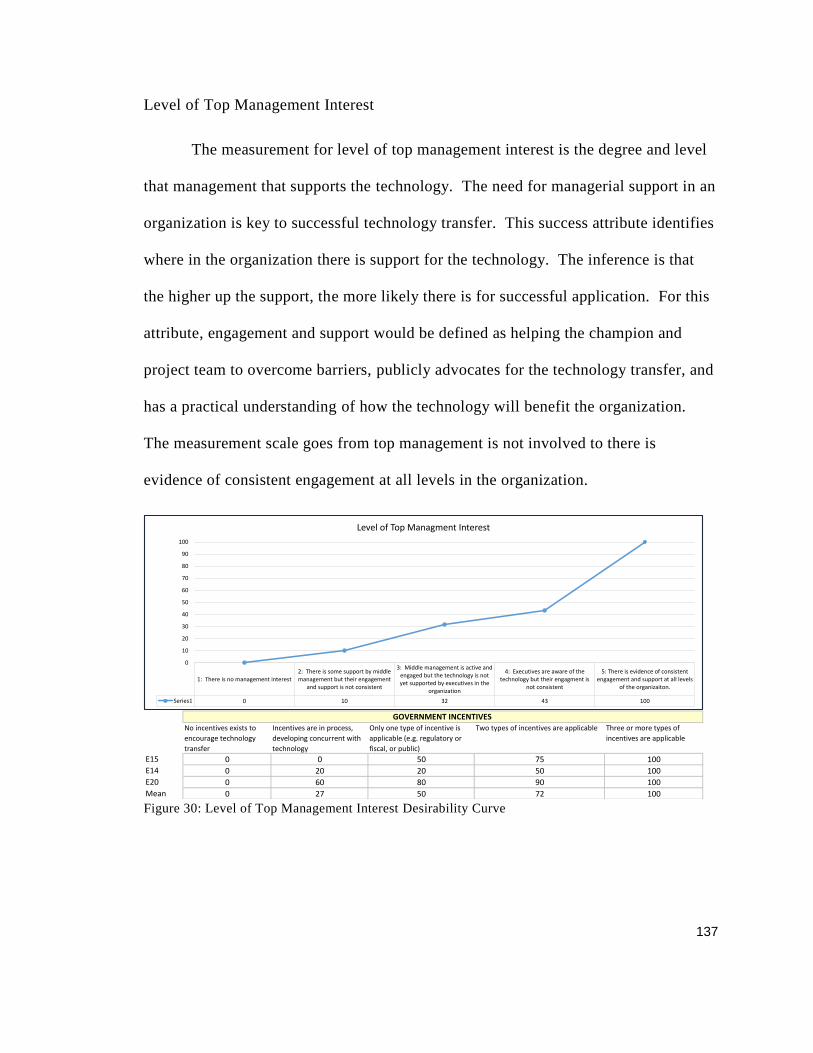
137
Level of Top Management Interest
The measurement for level of top management interest is the degree and level
that management that supports the technology. The need for managerial support in an
organization is key to successful technology transfer. This success attribute identifies
where in the organization there is support for the technology. The inference is that
the higher up the support, the more likely there is for successful application. For this
attribute, engagement and support would be defined as helping the champion and
project team to overcome barriers, publicly advocates for the technology transfer, and
has a practical understanding of how the technology will benefit the organization.
The measurement scale goes from top management is not involved to there is
evidence of consistent engagement at all levels in the organization.
Figure 30: Level of Top Management Interest Desirability Curve
1: There is no management interest2: There is some support by middlemanagement but their engagement
and support is not consistent
3: Middle management is active andengaged but the technology is notyet supported by executives in the
organization
4: Executives are aware of thetechnology but their engagment is
not consistent
5: There is evidence of consistentengagement and support at all levels
of the organizaiton.
Series1 0 10 32 43 100
0
10
20
30
40
50
60
70
80
90
100
Level of Top Managment Interest
No incentives exists to
encourage technology
transfer
Incentives are in process,
developing concurrent with
technology
Only one type of incentive is
applicable (e.g. regulatory or
fiscal, or public)
Two types of incentives are applicable Three or more types of
incentives are applicable
E15 0 0 50 75 100
E14 0 20 20 50 100
E20 0 60 80 90 100
Mean 0 27 50 72 100
GOVERNMENT INCENTIVES

138
Government Incentives
The measurement for government incentives is the number of incentives that are
available to support the technology. The scale ranges from no incentives exist to there
are three or more applicable incentives.
Figure 31: Government Incentives Desirability Curve
No incentives exists to encouragetechnology transfer
Incentives are in process,developing concurrent with
technology
Only one type of incentive isapplicable (e.g. regulatory or
fiscal, or public)
Two types of incentives areapplicable
Three or more types of incentivesare applicable
Series1 0 26.66666667 50 71.66666667 100
0
10
20
30
40
50
60
70
80
90
100
Government Incentives
No incentives exists to
encourage technology
transfer
Incentives are in process,
developing concurrent with
technology
Only one type of incentive is
applicable (e.g. regulatory or
fiscal, or public)
Two types of incentives are applicable Three or more types of
incentives are applicable
E15 0 0 50 75 100
E14 0 20 20 50 100
E20 0 60 80 90 100
Mean 0 27 50 72 100
GOVERNMENT INCENTIVES

139
Common Technology Standards
The measurement for common technology standards is understanding how the
standard is supported. Standards that are encouraged by an organization with little
support in the technical community are seen as not as influential as those required by the
government (e.g . communication protocols, etc.); standards can be defined as a
specification for how technology operates or interfaces with other technologies. The
scale ranges from there are no common standards to the standard is mandated by the
government.
Figure 32: Common Technology Standards Desirability Curve
0
10
20
30
40
50
60
70
80
90
100
1: There are no common standards forthe technology
2: Initiated by recipient organizationtherefore only local knowledge and
little influence
3: Supported by a consortium - moregeneralized support and awareness
by a community but there is noformal requirement in place
4: The standards are in the approvalprocess of being required by the
federal government
5: The standard is mandated by thegovernment
Common Technology Standards
1: There are no common
standards for the
technology
2: Initiated by recipient
organization therefore only
local knowledge and little
influence
3: Supported by a consortium -
more generalized support and
awareness by a community but
there is no formal requirement
in place
4: The standards are in the approval
process of being required by the
federal government
5: The standard is mandated
by the government
E15 0 0 25 30 100
E14 0 10 25 65 100
E20 0 5 70 75 100
Mean 0 5 40 57 100
COMMON TECHNOLOGY STANDARD
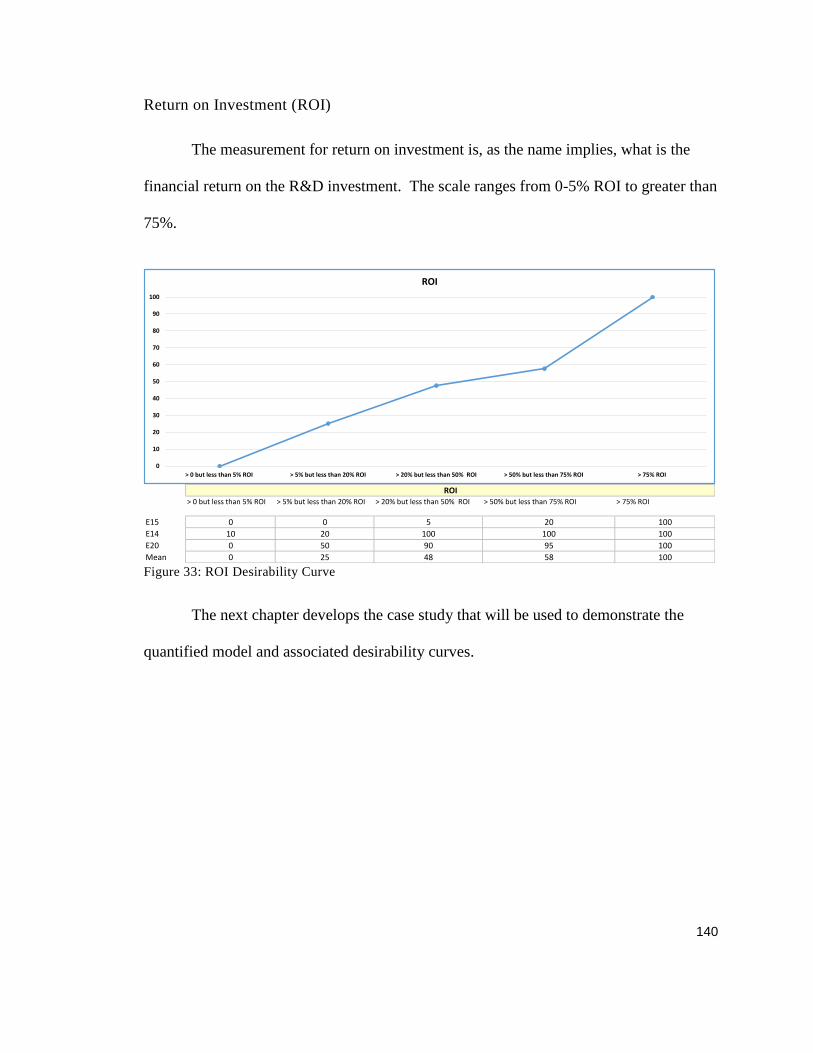
140
Return on Investment (ROI)
The measurement for return on investment is, as the name implies, what is the
financial return on the R&D investment. The scale ranges from 0-5% ROI to greater than
75%.
Figure 33: ROI Desirability Curve
The next chapter develops the case study that will be used to demonstrate the
quantified model and associated desirability curves.
0
10
20
30
40
50
60
70
80
90
100
> 0 but less than 5% ROI > 5% but less than 20% ROI > 20% but less than 50% ROI > 50% but less than 75% ROI > 75% ROI
ROI
> 0 but less than 5% ROI > 5% but less than 20% ROI > 20% but less than 50% ROI > 50% but less than 75% ROI > 75% ROI
E15 0 0 5 20 100
E14 10 20 100 100 100
E20 0 50 90 95 100
Mean 0 25 48 58 100
ROI

141
CHAPTER 6: ANALYSIS CASE DEVELOPMENT
As previously described, this research focuses on moving (research) from a
demonstration stage (TRLs 6-7) to the commercialization stage (TRLs 8-9). The model
is validated using a case study of Demand Response technologies. The research portfolio
at BPA has many projects that fall within the specified TRL range and will be used for
this case study. A background of the BPA research program and the selected projects,
abstracts, research organizations, and associated TRLs that will be used for the case study
are provided.
6.1 DR in the Pacific Northwest - What is it and Why is it Important?
The case study will be based on the regional interest and application of DR in the
Pacific North West. As such, the BPA has defined DR as “…changes in electric use by
demand side resources from their normal consumption patterns in response to changes in
the price of Electricity, or to incentive payments designed to induce changes in
consumption and/or when system reliability is jeopardized.” [70] Demand side resources
would include technologies like heat pump water heaters, industrial loads (HVAC,
lighting, or refrigeration). DR can be described as these types of technologies/systems
are able to adjust their load requirements when a need arises.
The term DR is not new to the utility industry. Historically, DR has been used for
emergency response and peak load management. In the past, system operators have been
able to predict demand with 95% accuracy. The original version, DR v1.0, is
characterized by manual, one-way communication to manage peak loads [40]. One
example of when v1.0 would be used is in the summer to handle typical load increases
due to air conditioning. But, the grid is changing. Renewable integration, specifically
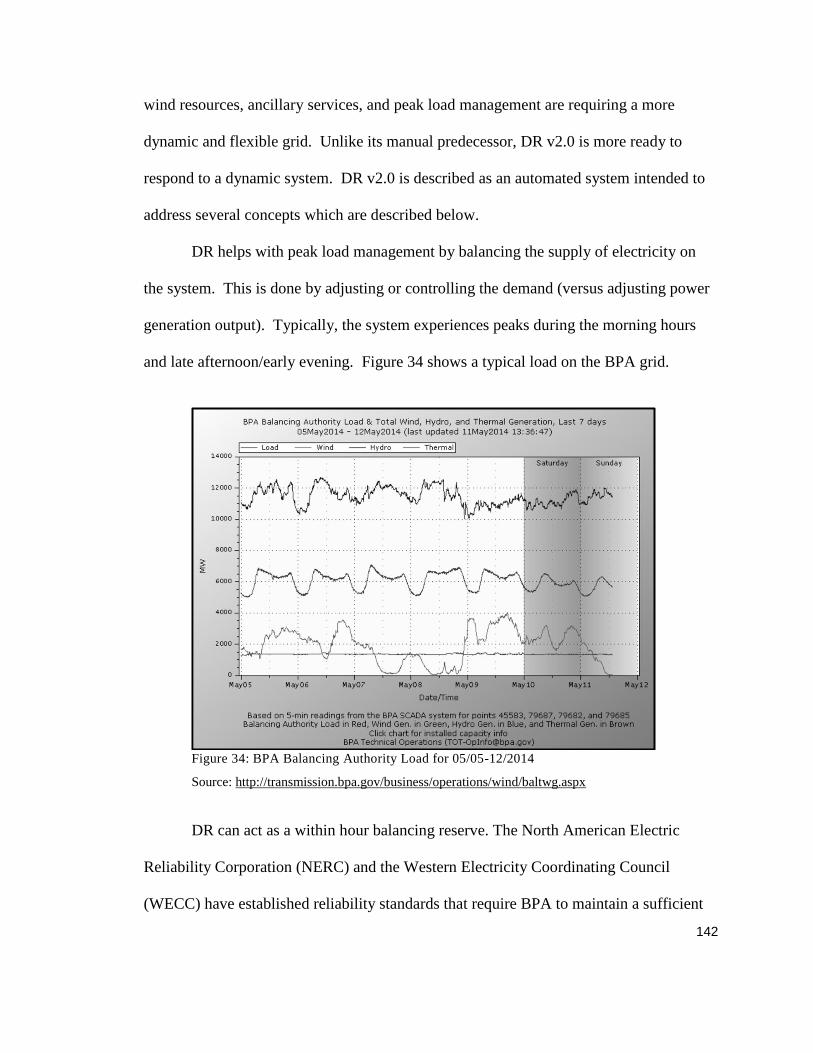
142
wind resources, ancillary services, and peak load management are requiring a more
dynamic and flexible grid. Unlike its manual predecessor, DR v2.0 is more ready to
respond to a dynamic system. DR v2.0 is described as an automated system intended to
address several concepts which are described below.
DR helps with peak load management by balancing the supply of electricity on
the system. This is done by adjusting or controlling the demand (versus adjusting power
generation output). Typically, the system experiences peaks during the morning hours
and late afternoon/early evening. Figure 34 shows a typical load on the BPA grid.
Figure 34: BPA Balancing Authority Load for 05/05-12/2014
Source: http://transmission.bpa.gov/business/operations/wind/baltwg.aspx
DR can act as a within hour balancing reserve. The North American Electric
Reliability Corporation (NERC) and the Western Electricity Coordinating Council
(WECC) have established reliability standards that require BPA to maintain a sufficient

143
amount of balancing reserve capacity to ensure a reliable balancing authority (BA) area.
In order to meet the standard, BPA must set aside or acquire an amount of capacity
necessary to support the balancing reserve needs of the BPA transmission users. DR
could be used as a source of acquired capacity.
Instead of building more transmission lines, DR can provide a “non-wire”
solution. This term addresses the need to increase capacity of the transmission system
without capital investment in new transmission lines. The solutions identify viable non-
transmission alternatives to transmission expansion. BPA considers “…DR, distributed
generation …and conservation measures that individually, or in combination, delay or
eliminate the need for upgrades to the transmission system”. [71]
However, with such relatively low cost of power in the PNW, what is the
incentive for customers (commercial and residential) to implement DR? EnerNOC
identifies four reasons why DR is an attractive alternative to PNW commercial and
residential customers:
• A business can earn cash while supporting the electric grid – customers can use
electricity when the price of electricity is low (in response to a market or target
price signal, using DR v2.0), or the customer can receive paybacks from the
utility when they responded to a DR event/request.
• Related to the payback, a customer could start an energy efficiency program.
The funds raised by responding to a DR event can offset the cost of purchasing
energy efficient equipment.
144
• Participating in DR projects demonstrates the customer’s commitment to
sustainability. In turn, this would incentivize their customers, who also want to
show their sustainability.
• Secure LEED credits – LEED certification is sponsored by the US Green
Building Council (USGB). Statistically, buildings that have this certification
command a higher rent premium ($11.33/ft2 over non-certified buildings) and
have a 4.1% higher occupancy rate. [74]
A number of past and current projects have demonstrated the potential for demand
response technologies to provide reliable options for addressing the future needs of the
grid.
6.2 DR Future
The BPA Demand Response team has outlined a plan to conduct more advanced
DR projects to demonstrate larger scale capacity and reinforce the potential as a reliable
and available resource, ultimately being able to use the resources for operational needs.
This effort involves investigating the potential of aggregators. The commercial
aggregators take many smaller, DR loads and “aggregate” them into a larger composite
load. The aggregator concept is part of BPA’s effort to develop a Demand Response
Management System that is capable of managing and dispatching an evolving portfolio of
DR projects. There are a number of other alternatives to adoption of DR in PNW to
include policy incentives, regional outreach communication, and rate incentives.
However, the emphasis of this response is on the technology solutions.

145
To manage the demand response program more effectively, 2014-2015 work
included the development of technology roadmaps based on prioritized research topics.
These technology areas served as the basis for developing technology roadmaps that will
be used to guide future research investments.
6.3 The R&D Organization and Process
As part of their vision statement, BPA promotes energy efficiency, renewable
resources and new technologies. The new technologies, energy efficient solutions, and
integration of renewable resources are identified through the utilization of a roadmapping
process. Roadmapping is widely used across the agency to ensure that product
requirements that are consistent with BPA’s Vision and are initiated through the Office of
Technology Innovation (TI); the group manages all of the research and development for
the agency. [24]
The Technology Innovation office is responsible for selecting and managing
BPA’s R&D portfolio of projects. The process involves a rigorous portfolio selection, a
yearly portfolio review, implementing project management best practices, and once the
research projects are complete, transferring the projects to application. The primary
functions of this department are therefore portfolio and project management and
technology transfer.
The basis for the research portfolio is defined by the technology roadmaps. The
roadmaps representation a cross-functional effort, involving many stakeholders, subject-
matter-experts (SME’s) within the agency, as well as soliciting input from external
organizations. The yearly solicitation opens in March and final decisions are made by

146
July. The proposals are subjected to a two-phase review approach. [25] The proposal
review process is described in detail in Chapter 2. The Phase II Evaluation criteria and
corresponding Agency objective is shown in Table 21.
Criteria BPA Objective
The degree to which the project strengthens BPA’s
existing portfolio of projects
The right portfolio
The degree to which project scope addresses the
R&D Program(s) identified in the Technology
Roadmap(s)
The right research
The quantitative or qualitative expected benefits as
applied system-wide, assuming this project is a
technical success
Magnitude of benefits to
BPA and Pacific
Northwest commensurate
with risks
Team members have sufficient experience and are
qualified to carry out the project
The right mix of talent
The probability of the project being a technical
success
Achieving successful
project results
The probability of near or long term successful
application to BPA
Successful application to
BPA business challenges
The degree to which proposed Stage Gates
(go/stop decision points) reflect real
options/choices for project decisions, and relate to
real discovery/science/achievement thresholds
The right decision points
Cost share which exceeds the minimum
requirement, e.g. greater than 50%
The right leverage
The percentage of cost share which is a cash
contribution
The right leverage
Table 21: BPA Project Evaluation Criteria [19]
6.3.1 Research Proposals
The BPA sends out a yearly solicitation for research proposals to address
topics identified in their technology roadmaps. Access to these research proposals is
a unique opportunity to use them as a case study and test the concept of the
technology transfer score. These proposals are part of the current R&D portfolio, so
performance data is available to measure against.

147
Demand response technologies were selected for the case study because they
provide solutions for Pacific Northwest Utility needs, which are renewable energy
integration, load growth, and alternatives for an aging infrastructure. In addition, they
are typically more mature technologies. This criterion (mature technologies) was also
mentioned as increasing the technology transfer potential. Specific information about
the research organization (e.g. name, technology characteristics) will remain
anonymous.
Table 22 lists the general technology that is being tested, participating
organizations, and the potential energy impact. The TRLs for these projects are 7-9
(e.g. ready for application). A more thorough discussion of each technology, and how
it can be used as a resource for demand response, follows the summary table.
Proposal 1 Proposal 2 Proposal 3
DR Technology Utility scale
battery storage
Consumer heat
pump water heaters
(HPWH)
Retail Supermarket
refrigeration
Participating
Organizations
Industry
Utility Partner
University
Collaborative
Partner
National Lab
National Lab
Industry
Potential Energy
Impact
1 MWh storage Not stated – will be
measured as part of
research
Not stated – will
be measured as
part of research
Objectives Develop control
strategies to
maximize
storage potential
and
demonstration of
a 500-kW, 1-
MWh storage
Develop protocols
for DR testing of
HPWH and fully
characterize the
energy storage
potential
Develop control
strategies and
evaluate the
strategies in
supermarket field
tests.
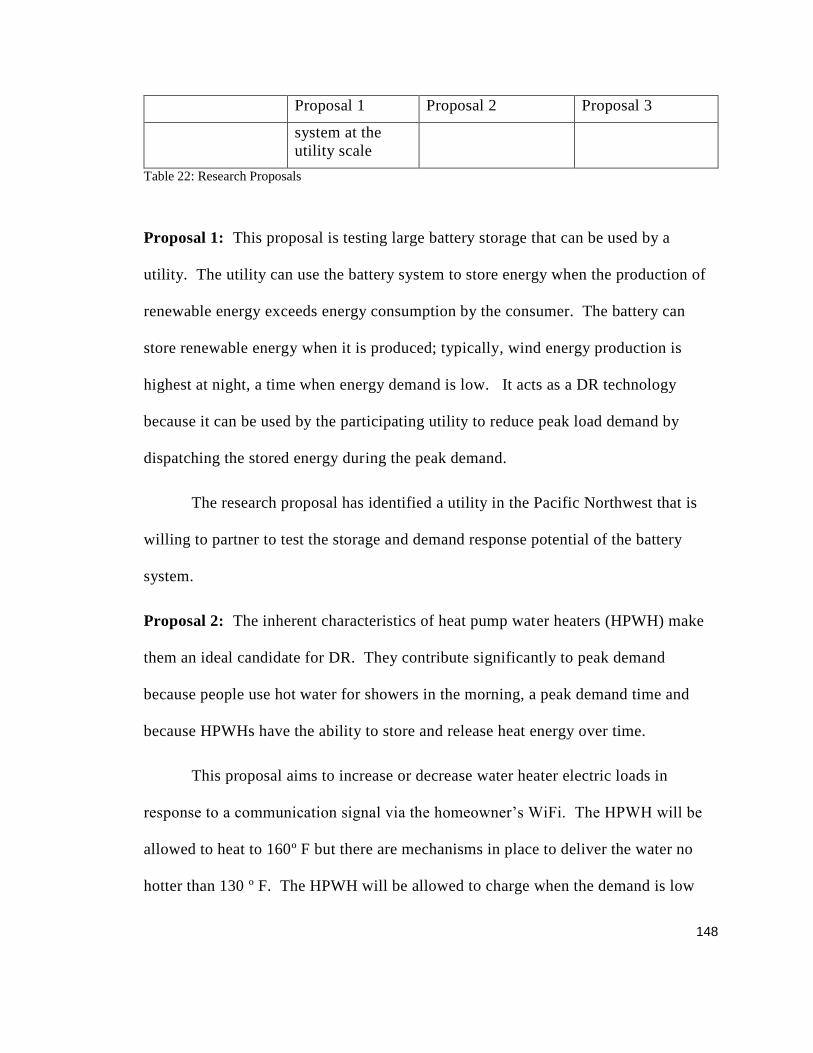
148
Proposal 1 Proposal 2 Proposal 3
system at the
utility scale
Table 22: Research Proposals
Proposal 1: This proposal is testing large battery storage that can be used by a
utility. The utility can use the battery system to store energy when the production of
renewable energy exceeds energy consumption by the consumer. The battery can
store renewable energy when it is produced; typically, wind energy production is
highest at night, a time when energy demand is low. It acts as a DR technology
because it can be used by the participating utility to reduce peak load demand by
dispatching the stored energy during the peak demand.
The research proposal has identified a utility in the Pacific Northwest that is
willing to partner to test the storage and demand response potential of the battery
system.
Proposal 2: The inherent characteristics of heat pump water heaters (HPWH) make
them an ideal candidate for DR. They contribute significantly to peak demand
because people use hot water for showers in the morning, a peak demand time and
because HPWHs have the ability to store and release heat energy over time.
This proposal aims to increase or decrease water heater electric loads in
response to a communication signal via the homeowner’s WiFi. The HPWH will be
allowed to heat to 160º F but there are mechanisms in place to deliver the water no
hotter than 130 º F. The HPWH will be allowed to charge when the demand is low

149
(typically overnight) in anticipation of usage in the morning. The benefit is that it
will reduce peak load in the morning, since it will already be charged during the
night.
The proposal will work with end-use customers to understand the ability of
HPWHs to respond to DR signals as well as get feedback from the customers
regarding how they perceive the technology. For instance, was there any interruption
to the quality of your hot water? Or, were there any interface issues with the DR
signal equipment?
Proposal 3: The objective of this proposal is to use supermarket refrigeration for
DR. Typically, supermarket refrigeration systems are “energy hogs” and represent a
substantial load for a utility. As well, energy costs cut into the already slim profit
margins for a supermarket. If the system can be used for DR and to control the load,
there is a benefit for the utility as well as the operator.
There are many components in a refrigeration system. These include
compressors, condensers, lighting, fans, and defrost equipment. If one or many of
these can respond to a DR event, then there is the potential to balance system loads
for a utility and for the supermarket, it allows them to operate the system more
predictably and at potentially higher temperatures; one test was to ensure food
integrity and safety. In this case, a DR event is defined as cooling the refrigeration
system or turning off cooling capacity.
The next chapter applies the model to these use cases and conducts four
scenario analyses to understand the model’s sensitivity to perturbations. Project
150
performance and reasons for including the projects in the portfolio will be considered
in combination with the technology transfer score. During the model validation phase
experts would be asked to verify: 1. if a technology transfer score was used, would
these proposals have been selected? And 2. Based on the project performance, would
technology transfer scores provide an insight into what is actually happening in the
project now? As an example, if a weak communication plan was identified as part of
assessing the technology transfer score, how is the actual project communication
occurring?
CHAPTER 7: ANALYSIS OF CASE AND SENSITIVITY ANALYSIS
This chapter uses the research proposals identified in the previous chapter to
demonstrate the model. The desirability values and resulting technology transfer
score will be calculated. The model is used to test several analysis scenarios. These
include:
Look at future based scenarios to determine the impact on the proposal rank if
one of the other perspectives is evaluated as the most important,
Determine how sensitive the model is to changes in expert opinion such that
the highest TT Score is preserved,
Assess whether the model is effective for other technology-type proposals, and
What can an organization do to improve the overall technology transfer
potential?
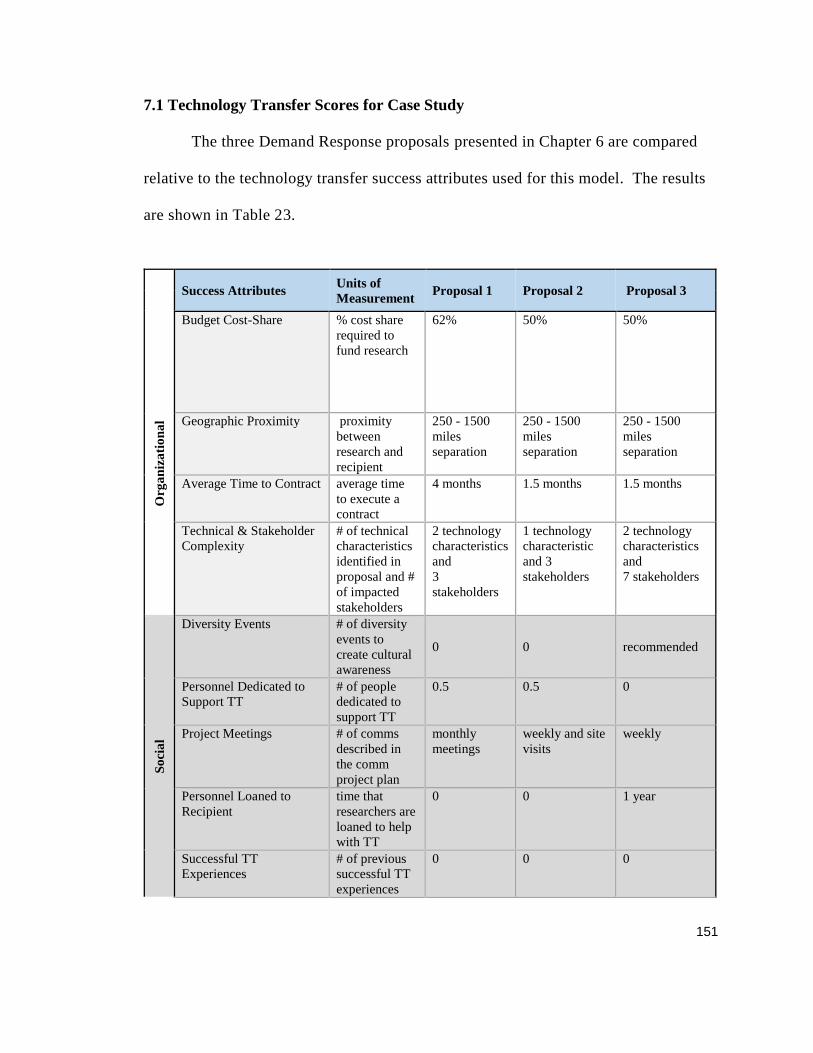
151
7.1 Technology Transfer Scores for Case Study
The three Demand Response proposals presented in Chapter 6 are compared
relative to the technology transfer success attributes used for this model. The results
are shown in Table 23.
Success Attributes
Units of
Measurement Proposal 1 Proposal 2 Proposal 3
Org
an
iza
tio
na
l
Budget Cost-Share % cost share
required to
fund research
62% 50% 50%
Geographic Proximity proximity
between
research and
recipient
250 - 1500
miles
separation
250 - 1500
miles
separation
250 - 1500
miles
separation
Average Time to Contract average time
to execute a
contract
4 months 1.5 months 1.5 months
Technical & Stakeholder
Complexity
# of technical
characteristics
identified in
proposal and #
of impacted
stakeholders
2 technology
characteristics
and
3
stakeholders
1 technology
characteristic
and 3
stakeholders
2 technology
characteristics
and
7 stakeholders
So
cia
l
Diversity Events # of diversity
events to
create cultural
awareness
0 0 recommended
Personnel Dedicated to
Support TT
# of people
dedicated to
support TT
0.5 0.5 0
Project Meetings # of comms
described in
the comm
project plan
monthly
meetings
weekly and site
visits
weekly
Personnel Loaned to
Recipient
time that
researchers are
loaned to help
with TT
0 0 1 year
Successful TT
Experiences
# of previous
successful TT
experiences
0 0 0
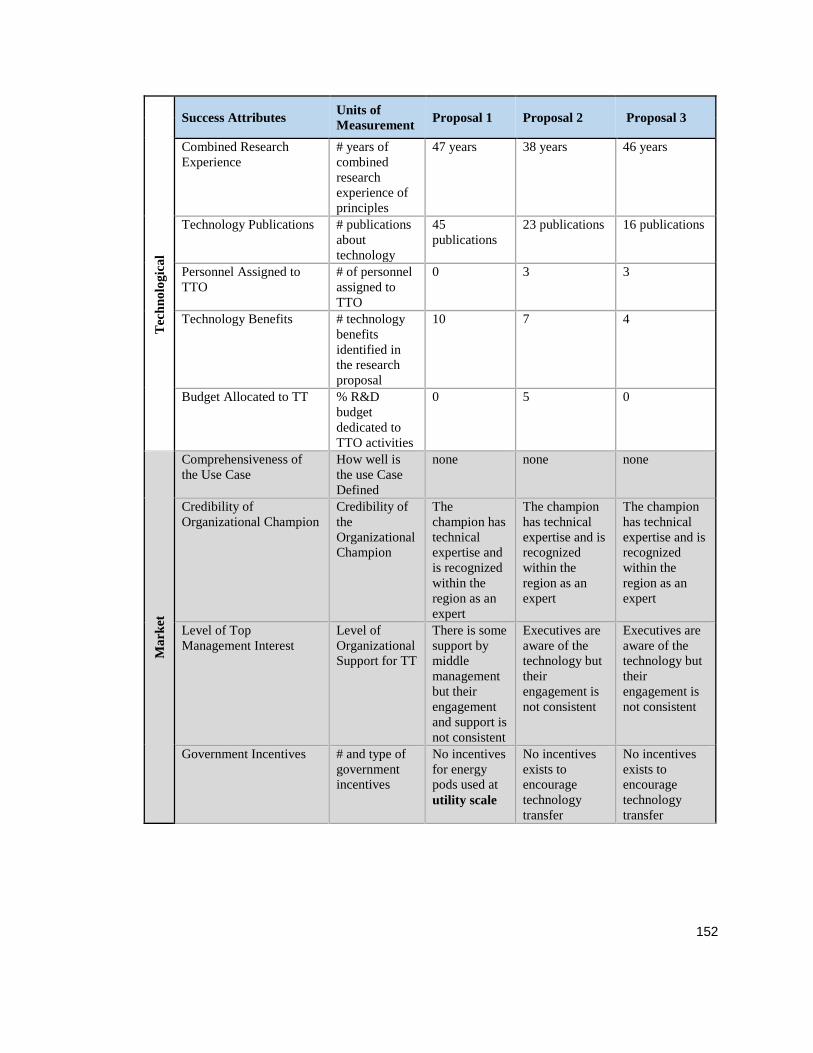
152
Success Attributes
Units of
Measurement Proposal 1 Proposal 2 Proposal 3
Tec
hn
olo
gic
al
Combined Research
Experience
# years of
combined
research
experience of
principles
47 years 38 years 46 years
Technology Publications # publications
about
technology
45
publications
23 publications 16 publications
Personnel Assigned to
TTO
# of personnel
assigned to
TTO
0 3 3
Technology Benefits # technology
benefits
identified in
the research
proposal
10 7 4
Budget Allocated to TT % R&D
budget
dedicated to
TTO activities
0 5 0
Ma
rket
Comprehensiveness of
the Use Case
How well is
the use Case
Defined
none none none
Credibility of
Organizational Champion
Credibility of
the
Organizational
Champion
The
champion has
technical
expertise and
is recognized
within the
region as an
expert
The champion
has technical
expertise and is
recognized
within the
region as an
expert
The champion
has technical
expertise and is
recognized
within the
region as an
expert
Level of Top
Management Interest
Level of
Organizational
Support for TT
There is some
support by
middle
management
but their
engagement
and support is
not consistent
Executives are
aware of the
technology but
their
engagement is
not consistent
Executives are
aware of the
technology but
their
engagement is
not consistent
Government Incentives # and type of
government
incentives
No incentives
for energy
pods used at
utility scale
No incentives
exists to
encourage
technology
transfer
No incentives
exists to
encourage
technology
transfer

153
Success Attributes
Units of
Measurement Proposal 1 Proposal 2 Proposal 3
Common Technology
Standards
How are
common
standards
supported
There are no
common
standards or
codes for the
technology
Communication
standards (CEA
2045, WiFi,
radio, etc.) -
Supported by a
consortium
Communication
standards (CEA
2045, WiFi,
radio, etc.) -
Supported by a
consortium
ROI ROI 0 0 0
Table 23: Proposal Characteristics
Relative to the other proposals, the strengths of proposal 1 (utility scale energy
storage) is that they have the most years of combined research experience, most
technology publications, and best awareness of recipient needs – their proposal
includes 10 technology benefits. The weaknesses of their proposal are they require
more cost-share and there is some support from middle management but it is not
consistent. The strengths and weaknesses of proposal 1 and the corresponding
desirability curve values are provided:
Proposal 1 Success Attribute Success Attribute Score Desirability Value
Strengths Combined Research
Experience
47 years of combined
experience
85
Technology Publications 45 publications 100
Technology Benefits 10 technology benefits 100
Weaknesses Cost-Share 62% 40
Level of Management
Interest
Some support by middle Mgmt
but it is not consistent
32
Table 24: Proposal #1 Strengths and Weaknesses

154
Proposal 2’s (heat pump water heaters for demand response) strengths include
have the least technical complexity, therefore, the researchers are able to have very
directed focus and not worry about the interface of many technology characteristics.
The proposal has the best description of project team meetings – weekly meetings and
site visits are planned. There is support, but not consistent, from executives within
the organization. It also is the only proposal that dedicates a portion of the project
budget to technology transfer activities. Its weakest area is in their personnel loan
policy – one does not exist. The strengths and weaknesses of proposal 2 and the
corresponding desirability curve values are provided:
Proposal 2 Success Attribute Success Attribute Score Desirability Value
Strengths Technical Complexity 1 technology characteristic 100
Project Meetings Weekly meetings and site visits 100
Level of Management
Interest
Execs are aware but their
engagement is not consistent
43
Budget Allocated to TT 5% of R&D budget is allocated
to TT
57
Weaknesses Personnel Loan to Recipient Researchers are not loaned to
TT recipient
0
Table 25: Proposal #2 Strengths and Weaknesses
Proposal 3 (Supermarket Refrigeration) characteristics are similar to proposal
2 except that proposal 3 has a personnel loan policy and recommend diversity events
– each of these supports successful technology transfer. However, this proposal has
the most amount of stakeholder complexity, which could be a barrier to successful
technology transfer. This weakness could be offset by the number of project team
meetings they have proposed. The strengths and weaknesses of proposal 3 and the
corresponding desirability curve values are provided:

155
Proposal 3 Success Attribute Success Attribute Score Desirability Value
Strengths Technical Complexity 2 technology characteristics 83
Project Meetings Weekly meetings 90
Level of Management
Interest
Execs are aware but their
engagement is not consistent
43
Personnel Loan to Recipient Researchers are loaned up to 1
year
77
Diversity Events Recommended 22
Weakness Stakeholder Complexity 7 stakeholders 3
Table 26: Proposal #3 Strengths and Weaknesses
For all proposals in the case study, an ROI was not available. It’s not that one
cannot be calculated; rather, it is about one not being determined for each proposal.
Therefore, the score of ROI is zero for all three proposals and the corresponding
desirability value is also zero.
The desirability values for each of the success attributes were captured for
each proposal. These values were multiplied by the relative weights and the
perspective weight to determine the technology transfer score. The corresponding
success attributes are captured in Appendix G. Table 27 shows the technology
transfer score for each proposal.
Baseline Analysis Proposal 1 Proposal 2 Proposal 3
Technology Transfer Score 37.6 47.7 45.7
Rank 3 1 2
Table 27: Baseline Technology Transfer Scores
The highest possible score for each proposal, based on the perspective
priorities and corresponding weights for the success attributes, is 100.00. None of the

156
proposals had a high technology transfer score. One of the analysis scenarios will
discuss how a proposal can improve the technology transfer potential.
Proposal 2 had the highest technology transfer score. Looking at the
desirability curve values, along with the success attribute and perspective
prioritization to understand the resulting technology transfer score, proposal 2 had
executive engagement in the Market perspective; Market perspective was the most
important perspective as determined by the expert panel (.39). The executive
engagement was not consistent, however. Nonetheless, this set the proposal apart for
proposal 1 were there was only middle management support. The next most
important perspective was technological (0.23). Within the technological perspective,
the most important success attribute was technology benefits (0.32). Proposal 2 had a
high number technology benefits identified. Proposal 2 also had personnel assigned
to the TTO. The social perspective is where the biggest differences are for proposal
2. Relative to the other two proposals, proposal 2 has the best project meetings value.
Their proposal identified weekly team meetings and site visits. These attributes are
important to facilitate communication and subsequently trust among the project team.
Proposal 1 scored the lowest of all three (proposals). One difference was the
level of top management support. This success attribute is associated with the highest
ranked perspective (Market, 0.39) and it corresponds to the second highest ranked
success attribute (level of top management interest, 0.22) – so if a proposal scores low
in this area it is bound to have an impact on its overall technology transfer score. In

157
fact, it does. Of the three proposals, this one only had middle management support
and it was inconsistent.
In this section, we have established the baseline technology transfer scores.
The remainder of this chapter will look several scenarios to understand the robustness
of the model.
7.2 Scenario Analysis
In these scenarios, the model looks at the impact to the proposal rank if the
emphasis or importance of the perspective level changes. Currently, the emphasis is
on Market, suggesting that a “market-pull” is most important for successful
technology transfer. In other words, creating an environment, through financial and
managerial support systems, that creates a market that is ready to accept the
technology. Each perspective will be changed to a value of 0.97, keeping the other
perspectives at 0.01 to maintain the overall contribution to the technology transfer
score at 1.0. The result will be three scenarios where each perspective is changed,
independently. The impact on the proposal rank will be discussed.
The next analysis will be to understand how sensitive the perspective level is
to potential changes in the expert judgment quantification. If new experts were to
quantify the perspective level, how sensitive is the model in order to preserve the rank
of the proposals? The acceptable range of perturbations will be discussed.
The focus of the case study was on demand response technologies. However,
can the model be used to evaluate other technology types? This scenario will test

158
how generalizable the model is. A non-demand response technology will be used to
determine if the success attributes are appropriate to be used with other technologies.
Finally, as we saw in the baseline analysis, the scores for the three proposals
were not extraordinary – there is room for improvement. The last analysis scenario
will address what a research organization can do to improve their technology transfer
potential.
7.2.1 Future Based Scenario – Perspective Weights Change
The expert panels determined that the market perspective is the most important
to facilitate technology transfer. However, what if another perspective was evaluated
as more important?
If the organizational perspective were ranked highest, this suggests that
organizational activities are more important to focus on to improve technology
transfer potential. Setting the organizational perspective to 0.97 and the other values
are kept at 0.01. Doing this results in the following proposal rank:
Baseline Analysis Proposal 1 Proposal
2
Proposal
3
Technology Transfer Score 37.6 47.7 45.7
Rank (baseline) 3 1 2
Organizational Emphasis
Technology Transfer Score
48.78 62.09 51.06
Rank (organizational) 3 1 2
Table 28: Organizational Emphasis – Impact on Proposal Rank
Changing the emphasis to an organizational slant does not impact the rank of the
proposals. The overall scores increase, especially for proposal 2. This is because the

159
highest weighted success attribute is technical complexities – proposal 2 has the least
technical complexity project, and therefore has a higher desirable value.
Changing the emphasis to a technological one would suggest a technology push is
more important for developing a technology transfer score; in the baseline scenario,
technological is the second most important perspective. For this scenario, technological
weight was changed to 0.97, while the other three were kept at 0.01. The impact to the
rank of the proposals is shown in Table 29.
Baseline Analysis Proposal 1 Proposal
2
Proposal
3
Technology Transfer Score 37.6 47.7 45.7
Rank (baseline) 3 1 2
Technological Emphasis:
Technology Transfer Score
71.58 87.23 78.52
Rank (organizational) 3 1 2
Table 29: Technological Emphasis – Impact on Proposal Rank
While the rank does not change, the gap between the scores is less, with a
significant improvement by proposal 1. This can be understood when looking at the
highest success attribute within the technological perspective. The highest weighted
success attribute is technology benefits (0.32) and then technology publications
(0.22). Both proposal 1 and 2 have the highest desirability scores for these attributes.
Finally, what happens to the rank if the social perspective is weighted the
highest? This scenario would represent more emphasis on project management skills
to improve the technology transfer score.

160
Similar to the other scenarios, the social perspective is set to 0.97 and the other
three perspectives have a value of 0.01. The impact to the proposal rank is shown in
Table 30.
Baseline Analysis Proposal 1 Proposal
2
Proposal
3
Technology Transfer Score 37.6 47.7 45.7
Rank (baseline) 3 1 2
Social Emphasis: Technology
Transfer Score
27.27 30.37 40.65
Rank (organizational) 3 2 1
Table 30: Social Emphasis – Impact on Proposal Rank
Changing the importance of the perspectives to a social emphasis does have an
impact on the rank of the proposals. Proposal 1 remains in third place, but proposal 2
and 1 swap. Looking at the success attributes to understand the change, proposal 3 is
the only one that recommends diversity events and has a personnel loan policy. These
success attributes are included under the social perspective and therefore the swap of
proposals 2 and 3 is appropriate.
Each of these represents an extreme, and unlikely, change in perspective
weight. The unlikeliness is due to the probability that an expert panel would all
answer similarly when doing pairwise comparisons, such that any perspective would
result in such a high score.
The next scenario will examine the sensitivity of the model to perturbations in
the expert responses at the perspective level.

161
7.2.2 Preserve Highest TT Score
This scenario looks at what happens to the rank if there are changes in the
expert judgment quantification. What are the allowable changes in their input in
order to preserve the rank of the proposals? Using the sensitivity analysis presented
by Chen [98], Table 31 shows the allowable changes in each perspective weight, in
order to preserve the rank of Proposal 2, Proposal 3, and Proposal 1.
Perspective Base Value Tolerance [min, max]
Organizational 0.18 [0.008, 1]
Technological 0.23 [0.012, 1]
Social 0.20 [0, 0.381]
Market 0.39 [0.008, 1]
Table 31: Allowable Change in Perspective Values
The model is sensitive to changes in the social perspective. Both proposal 2
and 3 have similar desirability values for the top weighted success attributes in the
social perspective. However, when the personnel loan policy is considered (0.16),
proposal 2 does not have a policy while proposal 3 has a favorable leave policy.
7.2.3 Can the Model be used for Other Technologies?
The emphasis of the case study is on demand response technologies because of
their ability to address the system stability issues facing the utility industry.
However, there are other technologies that can be used as potential solutions for
stability that are not related to demand response.

162
Another proposal was considered from the 2016 BPA R&D portfolio. Again,
specifics about the technology and research partnerships will remain anonymous.
This technology looks at algorithms to push the operating envelope of the electric
grid. By allowing the system operating limits to increase this would help with
congestion management and subsequent system stabilities. Similar to the demand
response proposals the technology is mature (TRL 7-9). This scenario also uses an
actual value for ROI that was provided with the research proposal.
The corresponding proposal attributes are shown in Table 32.
Success Attributes Units of Measurement Proposal 4
Org
an
iza
tio
na
l
Budget Cost-Share % cost share required to
fund research
50%
Geographic Proximity proximity between
research and recipient
1500-3000 mile
separation
Average Time to
Contract
average time to execute a
contract
4 months
Technical &
Stakeholder Complexity
# of technical
characteristics identified in
proposal and # of impacted
stakeholders
5 technology
characteristics and 2
stakeholder
So
cia
l
Diversity Events # of diversity events to
create cultural awareness 0
Personnel Dedicated to
Support TT # of people dedicated to
support TT
1
Project Meetings # of comms described in
the comm project plan
monthly meetings
Personnel Loaned to
Recipient time that researchers are
loaned to help with TT
1 week
Successful TT
Experiences # of previous successful
TT experiences
4

163
Success Attributes Units of Measurement Proposal 4
Tec
hn
olo
gic
al
Combined Research
Experience # years of combined
research experience of
principles
44 years
Technology
Publications # publications about
technology
16 publications
Personnel Assigned to
TTO # of personnel assigned to
TTO
0
Technology Benefits # technology benefits
identified in the research
proposal
7
Budget Allocated to TT % R&D budget dedicated
to TTO activities
0
Ma
rket
Comprehensiveness of
Use Case
How well is the use Case
Defined
none
Credibility of
Organizational
Champion
Credibility of the
Organizational Champion
The champion has
technical expertise
and is recognized
within the
organization as an
expert
Level of Top
Management Interest
Level of Organizational
Support for TT
There is some
support by middle
management but
their engagement
and support is not
consistent
Government Incentives # and type of government
incentives
transient stability
modeling important -
1 regulatory
incentive
Common Technology
Standards
How are common
standards supported
IEEE Standards for
PMU data used with
modeling -
Supported by a
consortium - more
generalized support
and awareness by a
community but there
is no formal
requirement in place
ROI ROI > 20% but less than
50% ROI
Table 32: Proposal 4 Characteristics
164
The technology transfer score is evaluated as 39.54
Looking at the success attributes and perspectives, none of them is
specific to a technology. Therefore, the model is generalizable and technology
agnostic – it can be used to evaluate research proposals for all types of technologies,
not just those used for the case study.
7.2.4 What can the Researcher do to Improve Their TT Score (and increase the
potential for successful TT)?
The value of this research is most readily seen when we consider the literature
review in Chapter 2.4. This section looked at the evaluation criteria of several
government R&D organizations. While the objective for each organization is to apply
promising research results – the evaluation criteria stops short of explicitly and
comprehensively addressing the technology transfer success attributes as part of the
evaluation criteria. This research would provide a supplemental assessment tool that
would increase the likelihood of successful application. Recall that the top TT score
possible is 100. What could each proposal do to increase their technology transfer
potential from the baseline values shown earlier is this chapter (Table 27)?
Proposal 1 (baseline score of 37.61)
To improve the baseline score the level of top management support needs to
improve. It could improve by more dedicated meetings with the management team to
understand their resistance to the technology and to clarify any misgivings or to
emphasize the benefits of the technology. The next area of improvement would be to
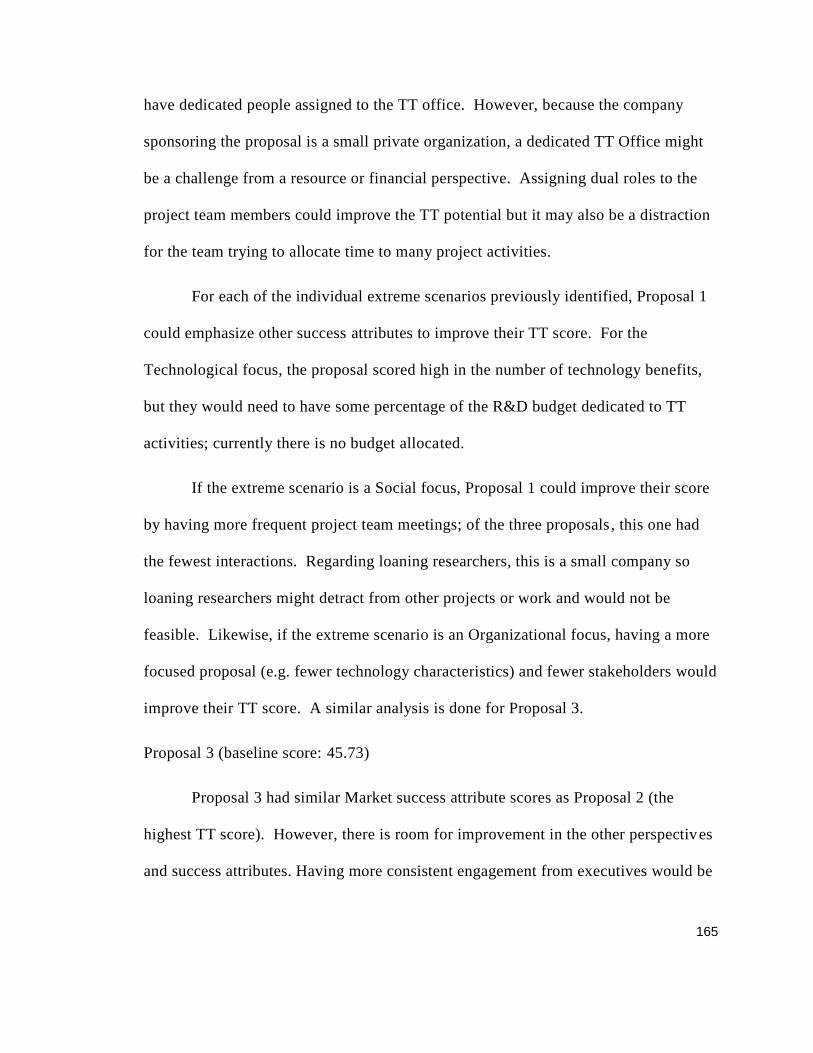
165
have dedicated people assigned to the TT office. However, because the company
sponsoring the proposal is a small private organization, a dedicated TT Office might
be a challenge from a resource or financial perspective. Assigning dual roles to the
project team members could improve the TT potential but it may also be a distraction
for the team trying to allocate time to many project activities.
For each of the individual extreme scenarios previously identified, Proposal 1
could emphasize other success attributes to improve their TT score. For the
Technological focus, the proposal scored high in the number of technology benefits,
but they would need to have some percentage of the R&D budget dedicated to TT
activities; currently there is no budget allocated.
If the extreme scenario is a Social focus, Proposal 1 could improve their score
by having more frequent project team meetings; of the three proposals , this one had
the fewest interactions. Regarding loaning researchers, this is a small company so
loaning researchers might detract from other projects or work and would not be
feasible. Likewise, if the extreme scenario is an Organizational focus, having a more
focused proposal (e.g. fewer technology characteristics) and fewer stakeholders would
improve their TT score. A similar analysis is done for Proposal 3.
Proposal 3 (baseline score: 45.73)
Proposal 3 had similar Market success attribute scores as Proposal 2 (the
highest TT score). However, there is room for improvement in the other perspectives
and success attributes. Having more consistent engagement from executives would be

166
beneficial for the TT score; this is the highest weighted perspective (Market) and the
highest rated success attribute (Level of Top Management Interest).
In a Technological focus extreme scenario increasing the number of
technology publications and the number of technology benefits would improve the TT
score; Proposal 3 had the lowest number of technology benefits identified of the three
proposals.
For a Social focus Proposal 3 could increase the number of team meetings and
the number of personnel dedicated to the TTO. Proposal 3 would benefit from
decreasing the number of impacted stakeholders in an Organizational focus extreme
scenario. Proposal 3 had the highest number of impacted stakeholders (7). The effort
to maintain effective communication among so many stakeholders would be
significant.
A summary of the changes is shown in Table 33. The table shows the baseline
TT score as well as the impact of making incremental changes to improve desirability
value. The incremental impacts are represented by the “better success attribute score”
and the corresponding TT score and percent increase over the baseline TT score are
shown. Also, the impact of increasing to the best success attribute score is provided.
However, it may or may not be possible to increase the values this significantly (e.g.
decreasing the number of impacted stakeholders or increasing the number of
personnel dedicated to TT), but the outcome is shown for the best potential increase.
Note that the changes in desirability values and subsequent TT scores are only

167
considered for the highest success attributes. Increases in other success attributes
would also incrementally improve the TT score.
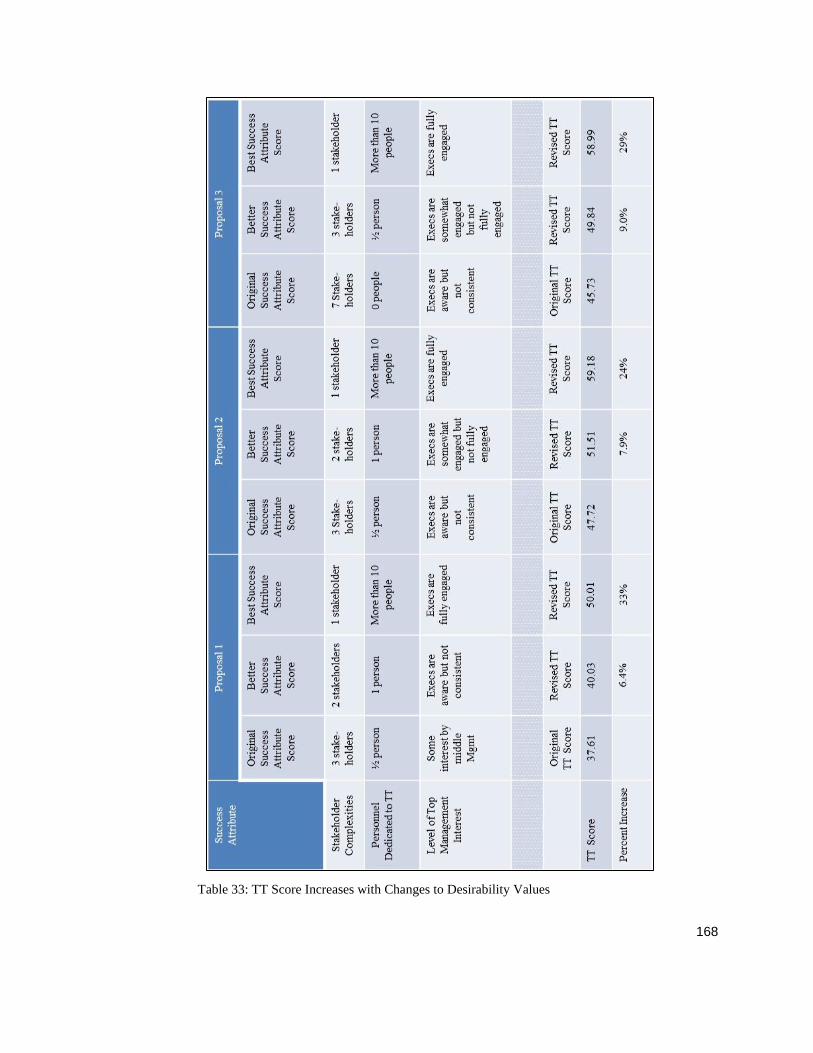
168
Table 33: TT Score Increases with Changes to Desirability Values

169
The TT Scores can also be used to highlight potential areas where the
researcher or technology recipient should focus during the R&D phase. As an
example, Proposal 1 does not have support in the organization from executives and
there is no personnel loan policy. Despite the low TT score, the technology recipient
may still want to include the proposal because it is technically interesting. Knowing
the areas of weakness related to TT, the recipient organization can implement
measures to address the weaknesses. For example, they may be able to fund
personnel to encourage a loan policy and they can be proactive in engaging
executives. The model provides enough detail that areas of proposal weakness,
related to technology transfer potential, can be assessed. This information can be
used to either 1. Not include the proposal in the portfolio or 2. Emphasize areas the
technology recipient should focus on if the proposal is selected. This latter scenario
assumes that the project is technically attractive but the technology transfer score
suggests it should not be added to the portfolio.
In summary, the case study and analysis scenarios demonstrate the capabilities
of this model. It is generalizable and technology agnostic and relatively robust to
changes in the perspective weights.
The next chapter reviews the validation processes and comments on the
model’s ability to represent what happened: did the case study results accurately
reflect portfolio decisions at BPA?

170
CHAPTER 8: MODEL VALIDATION
The process for developing a model includes construct validation, content
validation and criterion related validation. Each of these steps was performed with
the model developed for this research. Each process is discussed to include the
purpose for doing the validation, the method, and the outcomes.
8.1 Construct Validity
The purpose for doing construct validation is to determine if the preliminary
model construct is suitable for measuring the desired outcome – this is the initial
check with the people who are familiar with model development and solicit their
feedback.
The model was developed based on a comprehensive literature review that
included four parts – these are outlined in chapter 2. The outcome resulted in a multi-
perspective decision model that included more than 50 technology transfer success
attributes. These 50-plus attributes were consolidated as appropriate, to the final
number of 22 success attributes. As an example, organizational homogeneity was
used to capture similar strategic alignment, similar industries and composition of
personnel, size of firms, motivations for doing research, and similar expectations for
success.
The next step was for faculty and students who are familiar with hierarchical
decision modeling to comment on the clarity of the questions and definitions. Their
feedback was incorporated into the model that is used for content validation.

171
8.2 Content Validity
Experts from panel P0 were asked to validate the content of the HDM as a tool
to measure the technology transfer potential of a research proposal. In other words,
do these perspectives and success attributes look appropriate for successful
technology transfer?
Panel P0 provided their input via a Survey Monkey assessment tool. They
were asked if each perspective and success attribute was accurate for a successful
technology transfer (yes or no) and if not, they were asked to comment why. Also,
space was provided to add additional comments.
Based on their input and follow-up with my committee members, the
following model adaptations were made:
Organizational homogeneity was removed
Technical and stakeholder complexities was further subdivided into
Technical Complexities and Stakeholder Complexities
The nomenclature was simplified to define exactly what was being
measured. As an example, bureaucracy is a very broad term. The
attribute was further refined to “Average Time to Contract” – the spirit
of the attribute did not change, it was made more specific with what
was being measured
The revised model was presented to other expert panels for quantification.

172
8.3 Criteria Related Validity
The final validation was to test the model against a case study and ask experts
to determine if the results of the model represent reality. The experts were also asked
to verify if the model could be generalized to other than the case study application.
Finally, the experts are asked how the model could be implemented in their
organizations and to comment on any issues or barriers to adoption.
The model results were presented to BPA executives and they were asked if
the model represented the performance of these projects in the portfolio. Both
proposal two and three were performing well and said that the model correctly
identified these two as high performers and having the most potential for technology
transfer. Proposal one scored low based on the level of top management support. In
fact, the proposal was cut from the BPA portfolio before it completed due to lack of
support from upper management. In addition, BPA confirmed that the Technology
Transfer score will be piloted as part of their fiscal year 2018 research solicitation.
The analysis scenarios were also appropriate and mirror activities at the
agency. The BPA is reviewing their current portfolio and project management
practices for capital projects – this activity is what is postulated in the analysis
scenarios where the Social perspective could be the most important. While there was
only one expert from BPA on the P1 panel, this is the panel that quantified the
perspective level, the agency may consider re-evaluating the perspective level,
representing a more BPA focus. This would be a recommended action if the
technology transfer score were going to be implemented for the capital program.

173
CHAPTER 9: DISCUSSION
So far the research and analysis results show that the technology transfer score
is an agnostic tool that can help an organization in the selection of proposals that have
the most potential for technology transfer. But how can a research organization, like
those discussed in Chapter 2.4, practically apply the results?
9.1 Practical Application: General
Looking at the general structure of the decision model, the perspective level
and success attributes can be applied to any research organization. Each perspective
and corresponding success attribute has been validated by expert panels that have a
broad understanding of technology transfer, across many sectors. The expert panels
confirmed that the structure and model content were appropriate for measuring
successful technology transfer. Similarly, the perspective level and success attribute
weights were assessed by expert panels with a breadth of appropriate technology
transfer expertise. Therefore, the model is generalizable and can be readily applied to
any research organization, regardless of technology.
A specific response for how a research organization can practically use the
tool is understood with a more thorough consideration of the case study results. For
these proposals, the desirability scores were extracted, in most cases, from the
information already included in the research proposal provided to the BPA. In a few
cases (e.g. level of top management interest, etc.), interviews with BPA personnel
was required. Knowing that other research organizations may not have the same
proposal requirements, the proposal content may have to be adapted to obtain the

174
information required to calculate the score. In fact, the BPA will be conducting a
pilot of the technology transfer score as part of their fiscal year 2018 solicitation. The
solicitation will include an appendix that specifically asks for the information needed
to calculate a technology transfer score. The objectives of the pilot will be to assess
the willingness of the researchers to provide information and any other potential
issues with collecting the necessary data.
The remaining sections of this chapter review the prioritized success attributes
within each perspective and make suggestions about actions an organization can take
to ensure these are incorporated into their technology transfer process. Note that the
emphasis of these recommendations is only on the highest ranked success attribute
within each perspective – it will have the biggest impact on the technology transfer
score. Of course actions can be taken for the other success attributes.
9.2 Practical Application: Organizational Perspective
The success attributes within the organizational perspective that ranked
highest are technology and stakeholder complexities. This attribute refers to the
number of technology characteristics or research areas the proposal addresses as well
as the number of impacted stakeholders. An organization should aim for projects
with less technical and stakeholder complexity for successful technology transfer. The
recommended actions are summarized in Table 34.

175
Table 34: Actions for the Organizational Perspective
9.3 Practical Application: Technological Perspective
The success attribute within the technological perspective that ranked the
highest is technology benefits. As defined, this success attribute emphasizes the need
to understand the perceptions of the technology adopter. Actions that an organization
can take to improve the technology benefit value are identified in Table 35. The
understanding of technology recipient needs was underscored by the expert panel
during the model validation phase, “…ensure technology is developed with an
understanding of ultimate transfer requirements…”
Table 35: Actions for the Technological Perspective
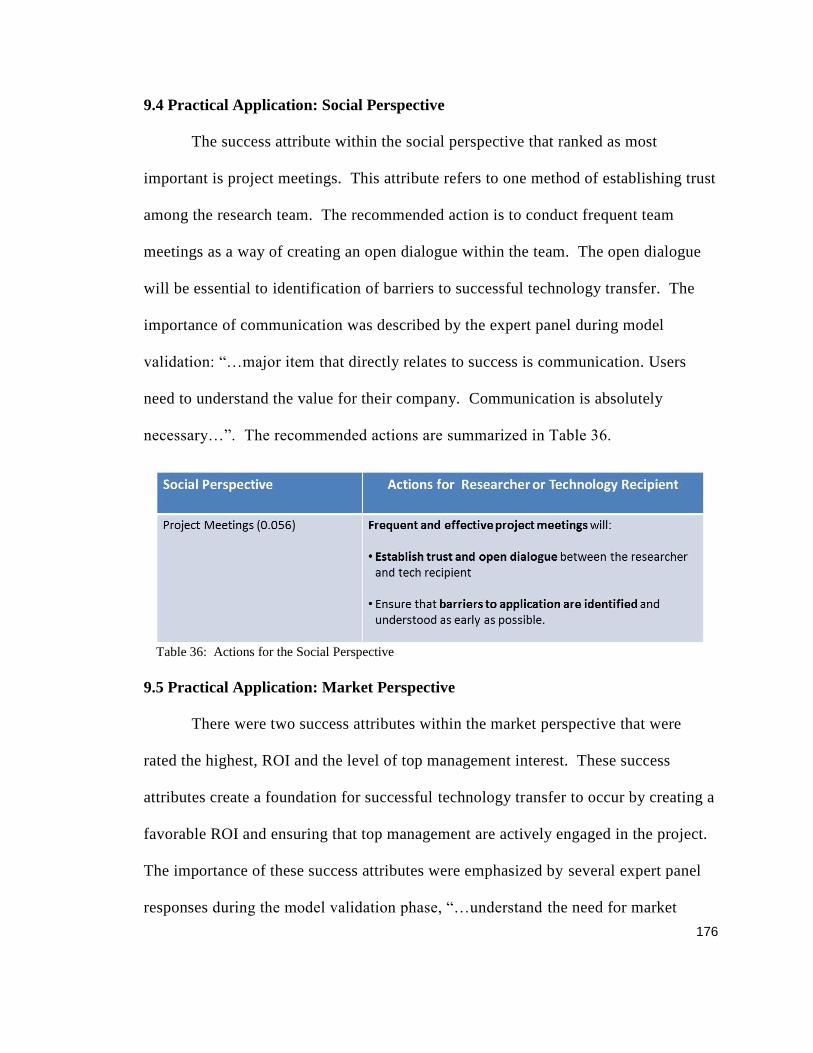
176
9.4 Practical Application: Social Perspective
The success attribute within the social perspective that ranked as most
important is project meetings. This attribute refers to one method of establishing trust
among the research team. The recommended action is to conduct frequent team
meetings as a way of creating an open dialogue within the team. The open dialogue
will be essential to identification of barriers to successful technology transfer. The
importance of communication was described by the expert panel during model
validation: “…major item that directly relates to success is communication. Users
need to understand the value for their company. Communication is absolutely
necessary…”. The recommended actions are summarized in Table 36.
Table 36: Actions for the Social Perspective
9.5 Practical Application: Market Perspective
There were two success attributes within the market perspective that were
rated the highest, ROI and the level of top management interest. These success
attributes create a foundation for successful technology transfer to occur by creating a
favorable ROI and ensuring that top management are actively engaged in the project.
The importance of these success attributes were emphasized by several expert panel
responses during the model validation phase, “…understand the need for market
177
interest….does the result fix a specific problem or can it be broadly applied…” ,
“…cost/benefit assessments for the technology and applications are necessary for
technology transfer…”, and “…successful technology transfer requires 1. Early
management of commercial entities/vendors and the end users within the R&D
organization developing the technology to ensure it is developed with an
understanding of ultimate transfer requirements 2. Significant commitment from the
R&D organization…” The recommended actions are described in Table 37.
Table 37: Actions for the Market Perspective
178
CHAPTER 10: CONCLUSIONS
This final chapter summarizes the research by documenting the conclusions,
demonstrating how the gaps were addressed, and how this research contributes to
increasing the potential of successful technology transfer. The analysis of the data
identified potential limitations; assumptions were made that represent constraints or
model limitations. Discussion is included to suggest how the limitations present
opportunities for future research.
10.1 Conclusions and Contributions
This research focused on identifying what attributes should be the focus to
facilitate successful technology transfer and development of a technology transfer score
that can be used to inform the selection of the most promising research proposal. The
model framework and literature defined success attributes were determined appropriate
for assessing the technology transfer potential of a research proposal by an extensive
expert panel. The qualitative results of the model are consistent with literature findings.
That is, technology transfer is more about building and maintaining an effective
relationship between the researcher and technology recipient.
The real benefit of this research is seen when Chapter 2.4 is considered. This
segment of the literature review demonstrated that the success attributes necessary for
technology transfer are only peripherally addressed as part of the proposal evaluation
criteria. While some are addressed, they are not quantified. For instance, having 10
technology related publications is better than five publications versus whether the
research organization just had relevant publications. While the objective for each
organization is to apply promising research results – the evaluation criteria stops short of

179
explicitly and comprehensively addressing the technology transfer success attributes as
part of the evaluation criteria. This research would provide a supplemental assessment
tool that would increase the likelihood of successful application.
The results of this research will provide valuable information to organizations that
sponsor research. Knowledge is power – by identifying those attributes which contribute
to successful technology transfers, an organization could take a proactive approach by
ensuring that those elements are implemented and effective in their organizations. While
the case study focus is on the utility industry, the model can easily be applied to any
organization that solicits technology research proposals and the TT score can be
incorporated appropriately in an assessment methodology.
The criterion related validation confirmed that this model would be useful as an
additional input into the proposal evaluation process. If the model had been used, would
proposal 3 have been selected? If so, it would have identified potential issues with
management support that could have been addressed, instead of the project being
removed from the portfolio.
The model addresses the gaps identified as part of the literature review. Table 38
summarizes the gaps and the contributions this research addresses.
Research Gaps Contributions
Research proposals do not
comprehensively consider technology
transfer potential
The model demonstrates that attributes
that are included with research proposal
can be used to develop a framework for
comprehensively considering technology
transfer during the research proposal
phase.
No comprehensive technology transfer
success attribute framework exists
No quantitative way of assessing
technology transfer potential exits
Using desirability curves along with the
hierarchical decision model provides a
way to quantitatively assess the
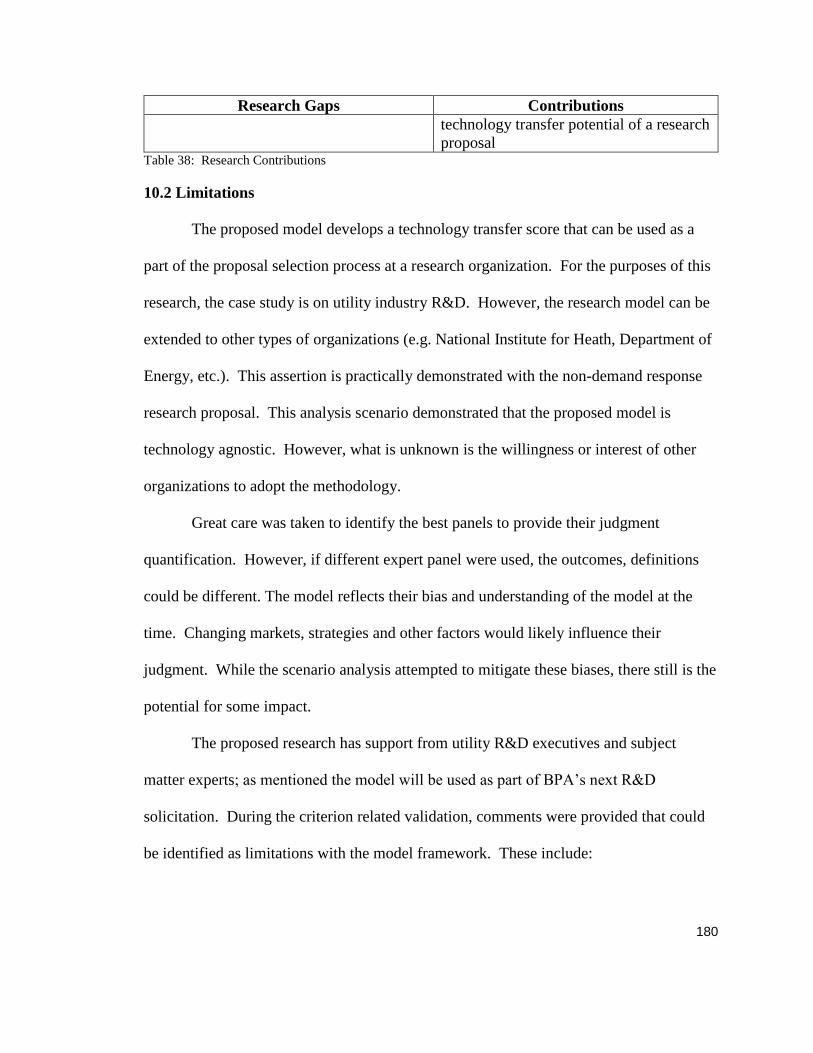
180
Research Gaps Contributions
technology transfer potential of a research
proposal Table 38: Research Contributions
10.2 Limitations
The proposed model develops a technology transfer score that can be used as a
part of the proposal selection process at a research organization. For the purposes of this
research, the case study is on utility industry R&D. However, the research model can be
extended to other types of organizations (e.g. National Institute for Heath, Department of
Energy, etc.). This assertion is practically demonstrated with the non-demand response
research proposal. This analysis scenario demonstrated that the proposed model is
technology agnostic. However, what is unknown is the willingness or interest of other
organizations to adopt the methodology.
Great care was taken to identify the best panels to provide their judgment
quantification. However, if different expert panel were used, the outcomes, definitions
could be different. The model reflects their bias and understanding of the model at the
time. Changing markets, strategies and other factors would likely influence their
judgment. While the scenario analysis attempted to mitigate these biases, there still is the
potential for some impact.
The proposed research has support from utility R&D executives and subject
matter experts; as mentioned the model will be used as part of BPA’s next R&D
solicitation. During the criterion related validation, comments were provided that could
be identified as limitations with the model framework. These include:

181
• Quantifying data: most of the success attributes that were identified are
qualitative (e.g. level of top management interest, personnel loan policies, etc.).
Translating these to quantitative measurements via desirability curves requires
explicit definition of terms. Nevertheless, the evaluations and development of
utility curves is left to interpretation by subject matter experts and reliance on
linguistic choices [99]. Therefore, it is extremely important that the success
attribute terms be defined to minimize the interpretation by evaluators.
• Who would be responsible for gathering data to develop the technology transfer
score? When considering the entire model, there were 21 grouped success
attributes identified. The concern is that a lot of information is required to
calculate the score and this effort could detract from the evaluation process. The
practical implications of the technology transfer score are discussed in the next
section, Future Work.
• The case study proposals were on more mature technologies. It would likely
have to be adapted to evaluate more basic research proposals. In this case the
model could be modified (e.g. some of the success attributes would not be
applicable) to exclude those that are focused on more mature technologies. One
example would be when calculating an ROI for basic research would be nothing
more than an estimate. More accurate ROIs are expected as the technology
continues to mature.
10.3 Future Work
The limitations described in the previous section offer opportunities to develop
the model further. In particular, it is anticipated that the pilot with the BPA will

182
inspire additional opportunities that were not considered as part of this research.
However, specific to the limitations identified, the success attribute definitions that
were used for this research could be assessed by a larger group of experts, and
groupings around their responses considered to see if a particular group is inclined to
one definition or another. Because the disagreements were all at an acceptable level,
categorical groupings were not considered.
The case study was very specific, in that they involved demand response
technologies, higher TRLs, and were moving from research into application at a
utility. However, depending on how technology transfer is defined, could impact
which success attributes are applicable. As was pointed out, some of the success
attributes may not be appropriate to assess for early stage or basic research. Often,
technology transfer for basic research is more about knowledge transfer than it is
putting something into use – the technology just is not ready. The model could be
better understood to identify which attributes are universal and which are intended for
more mature technologies.
The pilot study will likely identify additional opportunities. How would the
organizations considered in this research practically implement the model as part of
their research proposal evaluation? The planned pilot will require modifications to
the solicitation to minimize the need for outreach to the research organization. Recall
that some of the success attributes relied on additional communication with the
recipient or researching public information. Having all the information available, to
easily populate the model, will be an improvement and address feedback during the
183
validation phase of this research. Other questions, regarding the researcher’s
willingness to provide the information to populate the model will be assessed as part
of the pilot. Additional questions to consider for the pilot include, are there any legal
issues with providing the information? Is a score calculated for all research proposals
in a portfolio or should a strategy be developed to use the score for an individual
R&D program? Is the score reassessed throughout the R&D phase to measure
improvements over the initial score? It is certain there will be other findings as a
result of the pilot that can be captured and reported as part of a future study.
Additionally, there has been some discussion at BPA to use the model for
improving the performance of capital projects. The attributes for successful change
management are similar to those identified in this research. The model can be used to
emphasize areas where the capital project is weak (e.g. project communication or
credibility of the organizational champion) and the program office can address these
before they become an issue.

184
BIBLOGRAPHY
[1] Available: http://science.energy.gov/about/organization/
[2] Available: http://science.energy.gov/wdts/vfp/how-to-apply/submitting-a-proposal-
to-doe/
[3] Available: http://science.energy.gov/wdts/vfp/how-to-apply/developing-a-research-
proposal/
[4] Available: http://www.energy.gov/
[5] Available:
http://www.grants.gov/web/grants/home.html;jsessionid=8QZyTQfRTnGQ3XnlRfG
RQjQSW9TKyNJcfBwhlmQVgMkbNnJwqTLN
[6] Available: https://eere-exchange.energy.gov/#FoaIdb3ab7cc1-f5b1-45f2-9f4d-
0d5a091f8ef5
[7] Available: http://science.energy.gov/sbir/funding-opportunities/
[8] Available: http://www.energy.gov/leadership/organization-chart
[9] Available: http://en.wikipedia.org/wiki/United_States_Department_of_Energy
[10] Available: http://arpa-e.energy.gov/?q=arpa-e-site-page/arpa-e-history
[11] Available: http://arpa-e.energy.gov/?q=arpa-e-site-page/arpa-e-budget
[12] Available: http://arpa-e.energy.gov/?q=arpa-e-site-page/about
[13] Available: (http://arpae.
energy.gov/sites/default/files/documents/files/Applicants%20Guide%20to%20ARPAE%
20Award%20Negotiations%20Nov2012.pdf)
[14] Available: https://arpa-e-foa.energy.gov/
[15] Available: http://www.energy.gov/eere/about-us/mission
[16] Available: http://www4.eere.energy.gov/office_eere/current_budget.php
[17] Available: http://energy.gov/sites/prod/files/maprod/documents/meritrev.pdf:
Appendix D
[18] Available: http://www1.eere.energy.gov/financing/
[19]: Available https://bpa-exchange.energy.gov/
[20] Walls, D., Kinross, A., Graham, S., Prasad,S, “R&D Management Benchmarking
Study”, Navigant Energy, Chicago, IL, Contract # Final Report, February 19, 2014

185
[21] Callahan, J., interview/private conversation, May 2014
[22] Oliver, T., interview/private conversation, April 2014
[23] Vowles, M., interview/private conversation, May 2014
[24] Available: http://www.bpa.gov/news/pubs/GeneralPublications/gi-BPA-Facts.pdf
[25] Available: http://www.bpa.gov/news/pubs/FactSheets/fs-201310-Technology-
Innovation.pdf
[26] Available: http://www.energy.ca.gov/2012publications/CEC-500-2012-082/
[27] Available: http://www.energy.ca.gov/contracts/
[28] Available: http://www.energy.ca.gov/research/
[29] Available: http://www.energy.ca.gov/contracts/epic.html#PON-13-301
[30] Available: Example FOA: http://www.energy.ca.gov/contracts/pier.html#PON-
13-301
[31] Available: http://www.energy.ca.gov/
[32] Available: http://www.energy.ca.gov/commission/orgchart.html
[33] Available: http://www.energy.ca.gov/commission/mission_statement.html
[34] Available: http://www.energy.ca.gov/research/buildings/index.html
[35] Available: http://www.energy.ca.gov/research/innovations/
[36] Available: http://www.resilience.org/stories/2008-05-07/u-s-electric-grid-will-it-be-
our-undoing
[37] Available: http://www.nwcouncil.org/energy/powerplan/6/plan/
[38] Available: http://www.nsf.gov/statistics/seind10/c4/c4s3.htm
[39] Available: http://energy.gov/recovery-act
[40] De Martini, Paul, “DR 2.0: A Future of Customer Response”, Newport Consulting,
prepared for Association for Demand Response and Smart Grid, July 2013,
Available:
http://www.demandresponsesmartgrid.org/Resources/Documents/FINAL_DR%202.
0_13.07.08.pdf

186
[41] Neshati, Ramin, "Participation in Technology Standards Development: A Decision
Model for the Information and Communications Technology Industry" (2014).
Dissertations and Theses. Paper 1850.
[42] Geels, Frank, “The Multi-Level Perspective on Sustainability Transitions: Responses
to Seven Criticisms”, Environmental Innovation and Societal Transitions, 1(2011) 24-
40
[43] Geels, Frank, “Technological Transitions as Evolutionary Reconfiguration
Processes: A Multi-Level Perspective and a Case-Study”, Research Policy, 31
(2002) 1257-1274
[44] Geels, Frank and Schot, Johan, “Typology of Sociotechnical Transition Pathways”,
Research Policy, 36 (2007) 399-417
[45] Verbong, GPJ and Geels, Frank, “Exploring Sustainability Transitions in the
Electricity Sector with Socio-Technical Pathways”, Technological Forecasting and
Social Change, 77 (2010) 1214-1221
[46] Verbong, GPJ and Geels, Frank, “The Ongoing Energy Transition: Lessons from a
Socio-Technical, Multi-Level Analysis of the Dutch Electricity System (1960 –
2004)”, Energy Policy, 35 (2007) 1025 - 1037
[47] Meseri, O and Maital, S, “A Survey Analysis of University-Technology Transfer in
Israel: Evolution of Projects and Determinants for Success”, Journal of Technology
Transfer, 26, (2001) 115-126
[48] Sharma, Kishandutt Jaydayal “A new inquiring system for technology transfer and
its role in planning and policymaking”, (1973). Dissertations and Theses. Paper 582.
[49] Franza, R.M., and K.P. Grant. “Improving Federal to Private Sector Technology
Transfer,” Research-Technology Management 49, no. 3 (2006): 36–40
[50] DOE TRL definitions Available:
http://en.wikipedia.org/wiki/Technology_readiness_level
[51] NASA TRL Heat Map Available:
http://www.nasa.gov/directorates/heo/scan/engineering/technology/txt_accordion1pr
t.htm

187
[52] Ham, R.M., and D.C. Mowery. “Improving Industry-government Cooperative R&D”
Issues in Science and Technology 11, no. 4 (1995): 67–73
[53] P. Balachandra, H. S. Kristle Nathan, and B. S. Reddy, “Commercialization of
sustainable energy technologies,” Renewable Energy, vol. 35, no. 8, pp. 1842–1851,
2010
[54] B. Bozeman, “Technology transfer and public policy: a review of research and
theory,” Research policy, vol. 29, no. 4–5, pp. 627–656, 2000
[55] Franza, R.M., K.P. Grant, and W.A. Spivey. “Technology Transfer Contracts
Between R&D Labs and Commercial Partners: Choose Your Words Wisely.” The
Journal of Technology Transfer (n.d.): 1–11
[56] Perry IV, T.D. Ampulse Corporation: A Case Study on Technology Transfer in US
Department of Energy Laboratories. National Renewable Energy Laboratory
(NREL), Golden, CO., 2010
[57] WEN-HSIANG, LAI, and C.T.Z.U. TSAI. “Analyzing Influence Factors of
Technology Transfer Using Fuzzy Set Theory” PICMET Proceedings, 2008
[58] L. Lutzenhiser, “Innovation and organizational networks Barriers to energy
efficiency in the US housing industry,” Energy Policy, vol. 22, no. 10, pp. 867–876,
1994
[60] M. Mueller and R. Wallace, “Enabling science and technology for marine renewable
energy,” Energy Policy, vol. 36, no. 12, pp. 4376–4382, 2008
[61] Greiner, M.A., and R.M. Franza. “Barriers and Bridges for Successful
Environmental Technology Transfer” The Journal of Technology Transfer 28, no. 2
(2003): 167–177
[62] Rogers, Everett M., Shiro Takegami, and Jing Yin. “Lessons Learned About
Technology Transfer.” Technovation 21, no. 4 (April 2001): 253–261
[63] E. M. Mora-Valentin, A. Montoro-Sanchez, and L. A. Guerras-Martin, “Determining
factors in the success of R&D cooperative agreements between firms and research
organizations,” Research Policy, vol. 33, no. 1, pp. 17–40, 2004

188
[64] Boulter, L., and T. Bendell, “Managing the Technology Transfer Process” In
Engineering Management Conference, 2002, IEMC’02. 2002 IEEE International,
2:643–648, 2002
[65] Spann, M.S., M. Adams, and W.E. Souder. “Measures of Technology Transfer
Effectiveness: Key Dimensions and Differences in Their Use by Sponsors,
Developers and Adopters.” Engineering Management, IEEE Transactions vol 42, no.
1 (1995): 19–29
[66] Siegel, D.S., D.A. Waldman, L.E. Atwater, and A.N. Link. “Toward a Model of the
Effective Transfer of Scientific Knowledge from Academicians to Practitioners:
Qualitative Evidence from the Commercialization of University Technologies.”
Journal of Engineering and Technology Management 21, no. 1–2 (2004): 115–142
[67] Isaacs, E.A., J.C. Tang, J. Foley, J. Johnson, A. Kuchinsky, J. Scholtz, and J.
Bennett. “Technology Transfer: So Much Research, so Few Good Products.” In
Conference Companion on Human Factors in Computing Systems: Common
Ground, 155–156, 1996
[68] Rogers, E.M., E.G. Carayannis, K. Kurihara, and M.M. Allbritton. “Cooperative
Research and Development Agreements (CRADAs) as Technology Transfer
Mechanisms,” R&D Management 28, no. 2 (1998): 79–88
[69] J. P. Painuly, “Barriers to renewable energy penetration; a framework for analysis,”
Renewable Energy, vol. 24, no. 1, pp. 73–89, 2001
[70] Hall, L., Draft – BPA Business Plan for Demand Response, dated: 4/10/2014
[71] Hall, L., interview/private conversation, May 2014
[72] “Demand Response Aligning EPRI’s Research Portfolio”, Omar Siddiqui, EPRI
presentation, PDU Sector Council – Energy Utilization Breakout, Huntington Beach,
California, February 13, 2014
[74] EnerNOC EnergySmart Conference March 2014, Philadelphia PA
http://energysmart.enernoc.com/4-ways-your-peers-use-demand-response-as-a-
competitive-advantage

189
[75] Tran, T.A., and D.F. Kocaoglu. “Literature Review on Technology Transfer from
Government Laboratories to Industry”, Management of Engineering & Technology,
2009 PICMET 2009, Portland International Conference, 2771–2782, 2009
[76] Case Studies – Available: (a)
https://www.ischool.utexas.edu/~ssoy/usesusers/l391d1b.htm and (b) Rowley,
Jennifer. "Using case studies in research," Management research news 25.1 (2002):
16-27
[77] Surveying – Available: http://www.research.psu.edu/training/research-protections-
workshops/orp-video-archive/documents/irb-101-best-practices-in-survey-
research.pdf
[78] Literature Reviews – Available: http://writingcenter.unc.edu/handouts/literature-
reviews/
[79] Model Development- Available:
http://www.webpages.uidaho.edu/~mbolin/shafique-mahmood.htm
[80] Hypothesis Testing – Available: (a)
http://en.wikipedia.org/wiki/Statistical_hypothesis_testing and (b) Carver, Ronald P.
"The case against statistical significance testing." Harvard Educational Review 48.3
(1978): 378-399 and (c) Gliner, Jeffrey A., Nancy L. Leech, and George A. Morgan.
"Problems with null hypothesis significance testing (NHST): what do the textbooks
say?." The Journal of Experimental Education 71.1 (2002): 83-92.
[81] T. Saaty, The Analytical Hierarchy Process: Planning, Priority Setting, Resource
Allocation, New York: McGraw-Hill, 1980
[82] Phan, Kenny, "Innovation Measurement: A Decision Framework to Determine
Innovativeness of a Company" (2013), Dissertations and Theses, Paper 1017
[83] Iskin, Ibrahim, “An Assessment Model for Energy Efficiency Program Planning in
Electric Utilities: Case of Northwest U.S.” Ph.D. dissertation, ETM, PSU, Portland,
OR, 2014
[84] Chang, Leong, “Developing a Strategic Policy Choice Framework for Sustainable
Technological Innovation”, Ph.D. dissertation, ETM, PSU, Portland, OR, 2013
190
[85] Wikipedia:
http://en.wikipedia.org/wiki/United_States_Department_of_Energy_National_Labor
atories
[86] Francoise Bourdonnec, Intel, Guest lecture, ETM 533/633 Summer 2011, July 29,
Tech Transfer Process
[87] Content validity defined – Available: http://en.wikipedia.org/wiki/Content_validity
[88] A. Fink, J. Kosecoff, M. Chassin, and R. H. Brook, “Consensus methods:
characteristics and guidelines for use.,” American journal of public health, vol. 74,
no. 9, pp. 979–983, 1984.
[89] “Use of Expert Panels in Developing Land Use Forecasts”, Proceedings of Peer
Exchange, Federal Highway Administration, Oct 23-24, 2002 doc # FHWA-EP-03-
018 Available:
http://www.fhwa.dot.gov/planning/tmip/publications/other_reports/expert_panels_lu
_forecasting/panels.pdf
[90] Available: http://energy.gov/management/downloads/merit-review-guide
[91] C. Okoli and S. D. Pawlowski, “The Delphi method as a research tool: an example,
design considerations and applications,” Information & Management, vol. 42, no. 1,
pp. 15–29, Dec. 2004.
[92] Sheikh, Nasir Jamil, "Assessment of Solar Photovoltaic Technologies Using
Multiple Perspectives and Hierarchical Decision Modeling" (2013). Dissertations
and Theses. Paper 978.
[93] D. F. Kocaoglu, “A participative approach to program evaluation,” Engineering
Management, IEEE Transactions on, no. 3, pp. 112–118, 1983.
[94] Abel, E, et. al, “Reducing Inconsistency in Pairwise Comparisons Using Multi-
objective Evolutionary Computing”, 2013 IEEE International Conference on
Systems, Man, and Cybernetics, Oct. 2013, pp.80-85
[95] McKenna, Hugh P. "The Delphi technique: A worthwhile research approach for
nursing?", Journal of advanced nursing 19.6 (1994): 1221-1225.

191
[96] G. Rowe and G. Wright, “The Delphi technique: Past, present, and future prospects
— Introduction to the special issue,” Technological Forecasting and Social Change,
vol. 78, no. 9, pp. 1487–1490, Nov. 2011.
[97] C.-W. Chang, C.-R. Wu, C.-T. Lin, and H.-C. Chen, “An application of AHP and
sensitivity analysis for selecting the best slicing machine,” Computers & Industrial
Engineering, vol. 52, no. 2, pp. 296–307, Mar. 2007.
[98] Chen, Hongyi, “Sensitivity Analysis for Hierarchical Decision Models”, Ph.D
dissertation, ETM, PSU, Portland, OR, 2007
[99] E. Triantaphyllou and S. H. Mann, “Using the analytic hierarchy process for
decision making in engineering applications: some challenges,” International
Journal of Industrial Engineering: Applications and Practice, vol. 2, no. 1, pp. 35–
44, 1995
[100] Bozeman, B., and S. Pandey. “Cooperative R&D in Government Laboratories:
Comparing the US and Japan.” Technovation 14, no. 3 (1994): 145–159.
[101] Gopalakrishnan, S., and M.D. Santoro. “Distinguishing Between Knowledge
Transfer and Technology Transfer Activities: The Role of Key Organizational
Factors.” Engineering Management, IEEE Transactions On 51, no. 1 (2004): 57–
69.
[102] Lee, A.H.I., W.M. Wang, and T.Y. Lin. “An Evaluation Framework for
Technology Transfer of New Equipment in High Technology Industry.”
Technological Forecasting and Social Change 77, no. 1 (2010): 135–150.
[103] Carayannis, Elias G, and Jeffrey Alexander. “Secrets of Success and Failure in
Commercialising US Government R&D Laboratory Technologies: a Structured
Case Study Approach.” International Journal of Technology Management 18, no. 3
(January 1, 1999): 246–269.
[104] Walsh, S.T., and B.A. Kirchhoff. “Technology Transfer from Government Labs to
Entrepreneurs.” Journal of Enterprising Culture 10, no. 2 (2002): 133–149.
[105] E. G. Carayannis, J. Alexander, and A. Ioannidis, “Leveraging knowledge,
learning, and innovation in forming strategic government university- industry

192
(GUI) R&D partnerships in the US, Germany, and France,” Technovation, vol. 20,
no. 9, pp. 477–488, 2000.
[106] K. Ramanathan. “An Overview of Technology Transfer and Technology Transfer
Models”. Available Online:
http://www.businessasia.net/Pdf_Pages/Guidebook%20on%20Technology%20Tra
nsfer%20Mechanisms/An%20overview%20of%20TT%20and%20TT%20Models.p
df
[107] “Technology Transfer Definitions”. CACCI journal,Vol.2, 2005. Available
Online:http://www.cacci.org.tw/Journal/2005%20Vol%202/Technology%20Transf
er%20Definitions.pdf
[108] Lecture: Daim, T., “Technology Transfer (Research Phase)”, ETM 533, Summer
2011, Portland State University, Portland, OR
[109] “What is Technology Transfer?” Available Online:
http://onlinepubs.trb.org/onlinepubs/millennium/00114.pdf
[110] National Technology Transfer Center (NTTC), USA
http://www.nttc.edu/products/guide/seca01.html
[111] Meade, L. and Presley, A., “R&D Project Selection Using the Analytic Network
Process”, IEEE Transactions on Engineering Management, Vol 49, No. 1,
February 2002
[112] Hsu, Y., Gwo-Hshing,T., and Shyu, J., “Fuzzy Multiple Criteria Selection of
Government-Sponsored Frontier Technology R&D projects”, R&D Management,
Vol 33, 5, 2003
[113] Bordley, R., “R&D Project Selection Versus R&D Project Generation”, IEEE
Transactions on Engineering Management, Vol 45, 4, Nov 1998
[114] Bard, J.F., “Using Multi-criteria Methods in the Early Stages of New Product
Development”, the Journal of the Operational Research Society, Vol. 41, No. 8
(Aug., 1990), pp. 755-766
[115] Kumar, Suresh, “AHP Based Formal System for R&D Project Evaluation”,
Journal of Scientific and Industrial Research, Vol 63, Nov 2004, pp 888-896
[116] Reisman, Arnold, “Transfer of technologies: a cross-disciplinary taxonomy,”
Omega, vol. 33, no. 3, pp. 189–202, Jun. 2005.
[117] T. U. Daim and N. Intarode, “A framework for technology assessment: Case of a
Thai building material manufacturer,” Energy for Sustainable Development, vol.
13, no. 4, pp. 280–286, 2009.
[118] P. Ogden, J. Podesta, and J. Deutch, “A new strategy to spur energy innovation,”
Issues in Science and Technology, vol. 24, no. 2, pp. 35– 44, 2008.
[119] J. N. Erlich and A. Gutterman, “A practical view of strategies for improving
Federal technology transfer,” The Journal of TechnologyTransfer, vol. 28, no. 3,
pp. 215–226, 2003.
[120] M. Weiss, M. Junginger, M. K. Patel, and K. Blok, “A review of experience curve
analyses for energy demand technologies,” Technological forecasting and social
change, vol. 77, no. 3, pp. 411–428, 2010.

193
[121] T. Okazaki and M. Yamaguchi, “Accelerating the transfer and diffusion of energy
saving technologies steel sector experience–Lessons learned,” Energy Policy,
2011.
[122] B. N. Lohani and A. M. Azimi, “Barriers to energy end-use efficiency,” Energy
policy, vol. 20, no. 6, pp. 533–545, 1992.
[123] L. M. Murphy, P. L. Edwards, N. R. E. L. (US), and A. G. LLC, Bridging the
Valley of Death: Transitioning from Public to Private Sector Financing. National
Renewable Energy Laboratory, 2003.
[124] S. Reddy and J. P. Painuly, “Diffusion of renewable energy technologies—barriers
and stakeholders’ perspectives,” Renewable Energy, vol. 29, no. 9, pp. 1431–1447,
2004.
[125] P. D. Lund, “Effects of energy policies on industry expansion in renewable
energy,” Renewable Energy, vol. 34, no. 1, pp. 53–64, 2009.
[126] L. A Greening, D. L. Greene, and C. Difiglio, “Energy efficiency and
consumption—the rebound effect—a survey,” Energy policy, vol. 28,no. 6, pp.
389–401, 2000.
[127] R. M. Margolis and D. M. Kammen, “Evidence of Under-investment in Energy
R&D in the United States and the Impact of Federal Policy,” Energy Policy, vol.
27, no. 10, pp. 575–584, 1999.
[128] J. L. Lewis and R. H. Wiser, “Fostering a renewable energy technology industry:
An international comparison of wind industry policy support mechanisms,” Energy
Policy, vol. 35, no. 3, pp. 1844–1857, 2007.
[129] E. Shove, “Gaps, barriers and conceptual chasms: theories of technology transfer
and energy in buildings,” Energy Policy, vol. 26,no. 15, pp. 1105–1112, 1998.
[130] A. Purkus and V. Barth, “Geothermal power production in future electricity
markets—A scenario analysis for Germany,” Energy Policy, vol. 39, no. 1, pp.
349–357, 2011.
[131] R. Parnell and O. P. Larsen, “Informing the development of domestic energy
efficiency initiatives,” Environment and Behavior, vol. 37, no. 6, pp. 787–807,
2005.
[132] S. Meyers, J. Sathaye, B. Goldberg, D. Renné, A. Kaupp, M. Mendis, J. Ernst, A.
Kokorin, and T. Kerr, “International Workshop on Greenhouse-Gas Mitigation
Technologies and Measures-Summary,” Applied Energy, vol. 56, no. 3–4, pp. 203–
223, 1997.
[133] D. G. Ockwell, J. Watson, G. MacKerron, P. Pal, and F. Yamin, “Key policy
considerations for facilitating low carbon technology transfer to developing
countries,” Energy Policy, vol. 36, no. 11, pp. 4104–4115, 2008.
[134] K. S. Gallagher, “Limits to leapfrogging in energy technologies? Evidence from the
Chinese automobile industry,” Energy policy, vol.34, no. 4, pp. 383–394, 2006.
[135] P. Söderholm and M. Pettersson, “Offshore wind power policy and planning in
Sweden,” Energy Policy, vol. 39, no. 2, pp. 518–525, 2011.
[136] W. Van der Gaast, K. Begg, and A. Flamos, “Promoting sustainable energy
technology transfers to developing countries through the CDM,” Applied Energy,
vol. 86, no. 2, pp. 230–236, 2009.

194
[137] D. Roessner, “Quantitative and qualitative methods and measures in the evaluation
of research,” Research Evaluation, vol. 9, no. 2, pp. 125–132, 2000.
[138] K. Ehrhardt-Martinez and J. A. Laitner, “Rebound, technology and people:
Mitigating the rebound effect with energy-resource
management and people-centered initiatives,” Proceedings of the 2010 ACEEE
Summer Study on Energy Efficiency in Buildings, 2010.
[139] D. Kaya, “Renewable energy policies in Turkey,” Renewable and Sustainable
Energy Reviews, vol. 10, no. 2, pp. 152–163, 2006.
[140] E. Luiten, H. van Lente, and K. Blok, “Slow technologies and government
intervention: Energy efficiency in industrial process technologies,” Technovation,
vol. 26, no. 9, pp. 1029–1044, 2006.
[141] R. Wüstenhagen, M. Wolsink, and M. J. Bürer, “Social acceptance of renewable
energy innovation: An introduction to the concept,” Energy policy, vol. 35, no. 5,
pp. 2683–2691, 2007.
[142] A. Mallett, “Social acceptance of renewable energy innovations: The role of
technology cooperation in urban Mexico,” Energy policy, vol.35, no. 5, pp. 2790–
2798, 2007.
[143] J. C. Stephens, E. J. Wilson, and T. R. Peterson, “Socio-Political Evaluation of
Energy Deployment (SPEED): An integrated research framework analyzing
energy technology deployment,” Technological Forecasting and Social Change,
vol. 75, no. 8, pp. 1224–1246, 2008.
[144] J. Noailly and S. Batrakova, “Stimulating energy-efficient innovations in the Dutch
building sector: Empirical evidence from patent counts and policy lessons,”
Energy Policy, vol. 38, no. 12, pp. 7803–7817, 2010.
[145] J. C. J. . van den Bergh, A. Faber, A. M. Idenburg, and F. H. Oosterhuis, “Survival
of the greenest: evolutionary economics and policies for energy innovation,”
Environmental Sciences, vol. 3, no. 1, pp. 57–71, 2006.
[146] H. Herring and R. Roy, “Technological innovation, energy efficient design and the
rebound effect,” Technovation, vol. 27, no. 4, pp. 194–203, 2007.
[147] J. I. Lewis, “Technology acquisition and innovation in the developing world: Wind
turbine development in China and India,” Studies in Comparative International
Development (SCID), vol. 42, no. 3, pp. 208–232, 2007.
[148] V. K. Upadhyay, P. Sikka, and D. K. Abrol, “Technology dissemination
programmes and extramural R&D support in India,” The Journal of Technology
Transfer, vol. 35, no. 6, pp. 680–690, 2010.
[149] V. Kathuria, “Technology transfer for GHG reduction: a framework with
application to India,” Technological Forecasting and Social Change, vol. 69, no.
4, pp. 405–430, 2002.
[150] H. De Coninck, F. Haake, and N. Van Der Linden, “Technology transfer in the
Clean Development Mechanism,” Climate Policy, vol. 7, no. 5, pp. 444–456, 2007.
[151] E. Worrell, R. Van Berkel, Z. Fengqi, C. Menke, R. Schaeffer, and R. O Williams,
“Technology transfer of energy efficient technologies in industry: a review of
trends and policy issues,” Energy Policy, vol. 29, no. 1, pp. 29–43, 2001.
[152] Q. Shujing, “The Analysis on Barriers of Low Carbon Technology Transfer,”
Energy Procedia, vol. 14, pp. 1398–1403, 2012.

195
[153] N. Kok, M. McGraw, and J. M. Quigley, “The diffusion of energy efficiency in
building,” The American Economic Review, vol. 101, no.3, pp. 77–82, 2011.
[154] S. Jacobsson and A. Johnson, “The diffusion of renewable energy technology: an
analytical framework and key issues for research,” Energy policy, vol. 28, no. 9,
pp. 625–640, 2000.
[155] S. Jacobsson and V. Lauber, “The politics and policy of energy system
transformation—explaining the German diffusion of renewable energy technology,”
Energy policy, vol. 34, no. 3, pp. 256–276, 2006.
[156] J. Bessant, “The rise and fall of [] Supernet’: a case study of technology transfer
policy for smaller firms,” Research Policy, vol. 28, no. 6, pp. 601–614, 1999.
[157] D. Toke, “The UK offshore wind power programme: A sea-change in UK energy
policy?,” Energy Policy, vol. 39, no. 2, pp. 526–534, 2011.
[158] S. K. Markham, S. J. Ward, L. Aiman-Smith, and A. I. Kingon, “The valley of
death as context for role theory in product innovation,” Journal of Product
Innovation Management, vol. 27, no. 3, pp. 402–417, 2010.
[159] S. Jacobsson and A. Bergek, “Transforming the energy sector: the evolution of
technological systems in renewable energy technology,” Industrial and corporate
change, vol. 13, no. 5, pp. 815–849, 2004.
[160] H. A. Linstone, Decision making for technology executives: using multiple
perspectives to improved performance. Artech House Norwood, MA, 1999.
[161] Jenkins, J and Mansur, S., “Bridging the Clean Energy Valleys of Death”,
Breakthrough Institute, November 2011
[162] Kyoto Protocol, Available: http://www.kyotoprotocal.com
[163] http://seekingalpha.com/article/224005-crossing-the-biotech-valley-ofdeath-from-
innovation-to-cure, 09/06/2010, Jason Chew
[164] Available: http://www.pnnl.gov/business/techtransfer/documents/TechComm
Overview-singlepgs.pdf
[165] Available: http://www.pnnl.gov/business/techtransfer/documents/TechComm
Overview-singlepgs.pdf
[166] Panel discussion: TT: So Much Research, So Few Good Products CHI 96
Conference Available:
http://www.sigchi.org/chi96/proceedings/panels/Isaacs/eai_tech.html
[167] Pisano, Gary, “Creating an R&D Strategy”, Harvard Business School, 2012;
Available: http://www.hbs.edu/faculty/Publication%20Files/12-095_fb1bdf97-e0ec-
4a82-b7c0-42279dd4d00e.pdf
[168] Available: HCS, //techcrunch.com/2011/10/04/why-did-solyndra-fail-so-
spectacularly/
[169] Abbas, Mustafa, “Consistency Analysis for Judgment Quantification in
Hierarchical Decision Model”, Ph.D. dissertation, ETM, PSU, Portland, OR 2016
[170] NSF Proposal Evaluation Criteria:
http://www.nsf.gov/bfa/dias/policy/merit_review/
[171] NIH Proposal Evaluation Criteria:
http://grants.nih.gov/grants/peer_review_process.htm#scoring2

196
[172] P. Gerdsri, "A Systematic Approach to Developing National Technology Policy
and Strategy for Emerging Technologies," Portland State University, 2009.
[173] J. Wallenius, J. S. Dyer, P. C. Fishburn, R. E. Steuer, S. Zionts, K. Deb, J. S. Dyer,
P. C. Fishburn, and R. E. Steuer, “Multiple Criteria Decision Making , Multiattribute
Utility Theory : Recent Accomplishments and What Lies Ahead,” Manage. Sci., no. June
2016, 2008.
[174] D. Sheskin, Handbook of Parametric and Nonparametric Statistical Procedures.
Chapman&Hall/CRC Publisher, 2007.
[175] Shrout. P.E. and Fleiss. J.L., “Intraclass Correlation: Uses In Assessing Rater
Reliability,”
Psychological Bulletin, vol. 86, pp. 420–428, 1979.
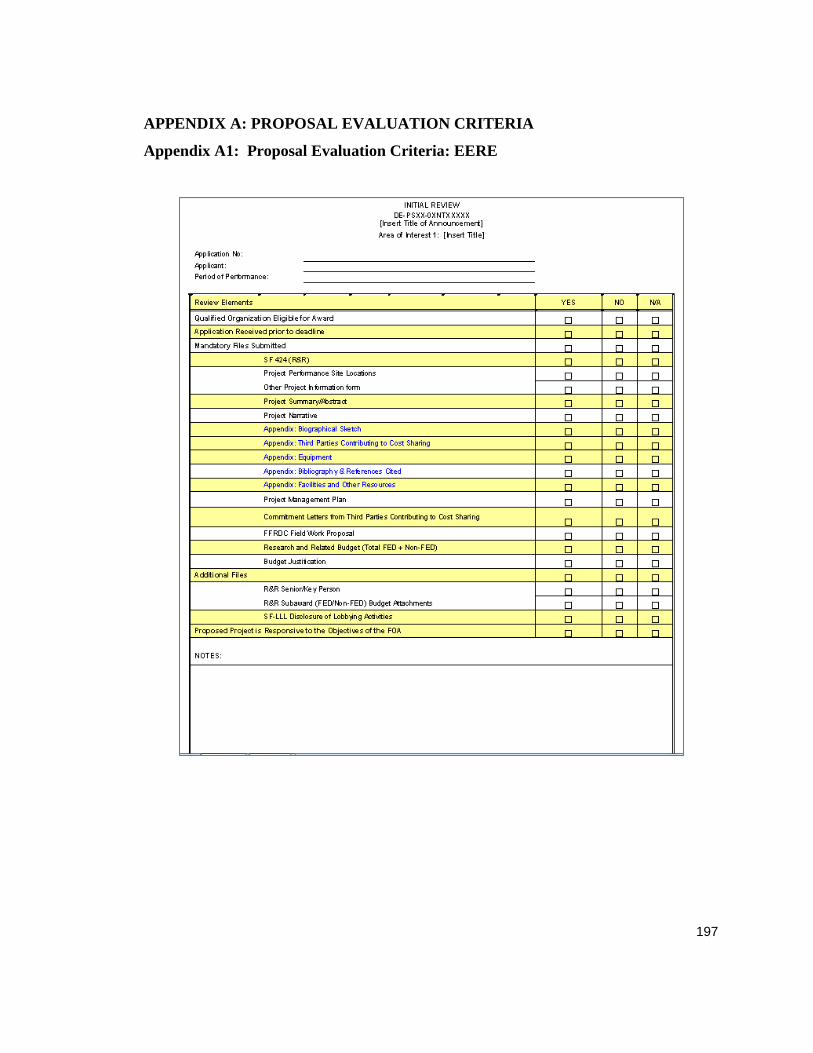
197
APPENDIX A: PROPOSAL EVALUATION CRITERIA
Appendix A1: Proposal Evaluation Criteria: EERE

198
Appendix A2: Proposal Evaluation Criteria: BPA
Criteria BPA Objective
The degree to which the
project strengthens BPA’s
existing portfolio of projects
The right portfolio
The degree to which project
scope addresses the R&D
Program(s) identified in the
Technology Roadmap(s)
The right research
The quantitative or qualitative
expected benefits as applied
system-wide, assuming this
project is a technical success
Magnitude of benefits to BPA
and Pacific Northwest
commensurate with risks
Team members have
sufficient experience and are
qualified to carry out the
project
The right mix of talent
The probability of the project
being a technical success
Achieving successful project
results
The probability of near or
long term successful
application to BPA
Successful application to
BPA business challenges
The degree to which
proposed Stage Gates
(go/stop decision points)
reflect real options/choices
for project decisions, and
relate to real
discovery/science/achieveme
nt thresholds
The right decision points
Cost share which exceeds the
minimum requirement, e.g.
greater than 50%
The right leverage
The percentage of cost share
which is a cash contribution
The right leverage

199
Appendix A3: Proposal Evaluation Criteria: CEC
STAGE ONE: APPLICATION SCREENING CHECKLIST
When comparing the stage 2 criteria to the other organizations considered in this
response, the CEC criteria is much more comprehensive and quantitative. The stage 2
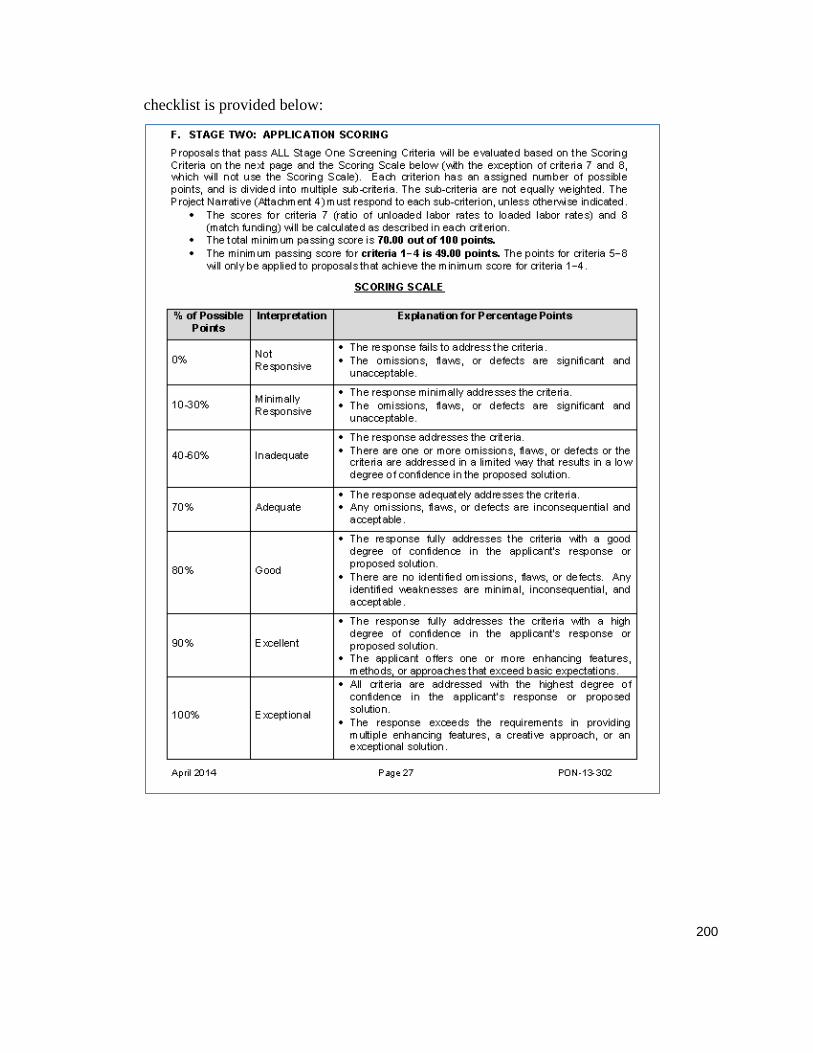
200
checklist is provided below:
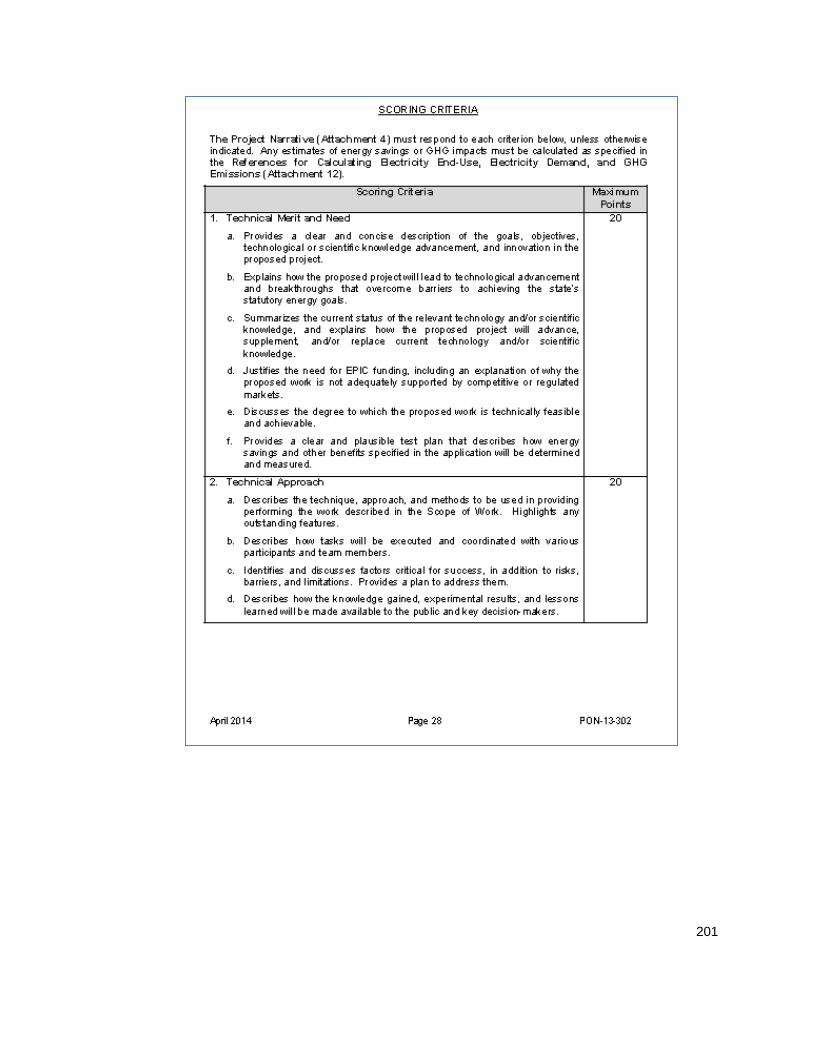
201

202

203
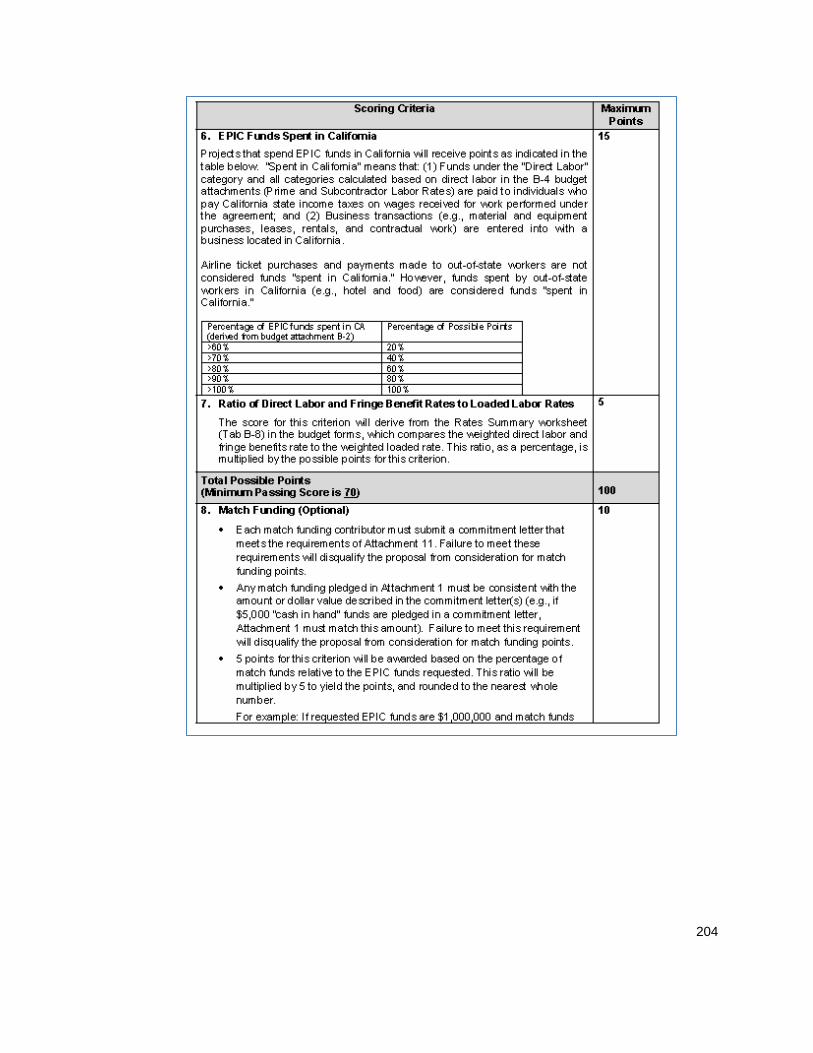
204

205

206
Appendix A5: Proposal Evaluation Criteria: NSF
Excerpt from NSF site:
http://www.nsf.gov/pubs/policydocs/pappguide/nsf16001/gpg_3.jsp#IIIA
A. Merit Review Principles and Criteria
The National Science Foundation strives to invest in a robust and diverse portfolio of
projects that creates new knowledge and enables breakthroughs in understanding across
all areas of science and engineering research and education. To identify which projects
to support, NSF relies on a merit review process that incorporates consideration of both
the technical aspects of a proposed project and its potential to contribute more broadly
to advancing NSF’s mission “to promote the progress of science; to advance the
national health, prosperity, and welfare; to secure the national defense; and for other
purposes.” NSF makes every effort to conduct a fair, competitive, transparent merit
review process for the selection of projects.
1. Merit Review Principles
These principles are to be given due diligence by PIs and organizations when preparing
proposals and managing projects, by reviewers when reading and evaluating proposals,
and by NSF program staff when determining whether or not to recommend proposals
for funding and while overseeing awards. Given that NSF is the primary federal agency
charged with nurturing and supporting excellence in basic research and education, the
following three principles apply:
All NSF projects should be of the highest quality and have the potential to
advance, if not transform, the frontiers of knowledge.
NSF projects, in the aggregate, should contribute more broadly to achieving
societal goals. These broader impacts may be accomplished through the research
itself, through activities that are directly related to specific research projects, or
through activities that are supported by, but are complementary to, the project.
The project activities may be based on previously established and/or innovative
methods and approaches, but in either case must be well justified.
Meaningful assessment and evaluation of NSF funded projects should be based
on appropriate metrics, keeping in mind the likely correlation between the effect
of broader impacts and the resources provided to implement projects. If the size
of the activity is limited, evaluation of that activity in isolation is not likely to be
meaningful. Thus, assessing the effectiveness of these activities may best be
done at a higher, more aggregated, level than the individual project.
207
With respect to the third principle, even if assessment of Broader Impacts outcomes for
particular projects is done at an aggregated level, PIs are expected to be accountable for
carrying out the activities described in the funded project. Thus, individual projects
should include clearly stated goals, specific descriptions of the activities that the PI
intends to do, and a plan in place to document the outputs of those activities.
These three merit review principles provide the basis for the merit review criteria, as
well as a context within which the users of the criteria can better understand their intent.
2. Merit Review Criteria
All NSF proposals are evaluated through use of two National Science Board approved
merit review criteria. In some instances, however, NSF will employ additional criteria
as required to highlight the specific objectives of certain programs and activities.
The two merit review criteria are listed below. Both criteria are to be given full
consideration during the review and decision-making processes; each criterion is
necessary but neither, by itself, is sufficient. Therefore, proposers must fully address
both criteria. (GPG Chapter II.C.2.d.(i) contains additional information for use by
proposers in development of the Project Description section of the proposal.) Reviewers
are strongly encouraged to review the criteria, including GPG Chapter II.C.2.d.(i), prior
to the review of a proposal.
When evaluating NSF proposals, reviewers will be asked to consider what the
proposers want to do, why they want to do it, how they plan to do it, how they will
know if they succeed, and what benefits could accrue if the project is successful. These
issues apply both to the technical aspects of the proposal and the way in which the
project may make broader contributions. To that end, reviewers will be asked to
evaluate all proposals against two criteria:
Intellectual Merit: The Intellectual Merit criterion encompasses the potential to
advance knowledge; and
Broader Impacts: The Broader Impacts criterion encompasses the potential to
benefit society and contribute to the achievement of specific, desired societal
outcomes.
The following elements should be considered in the review for both criteria:
1. What is the potential for the proposed activity to:
a. Advance knowledge and understanding within its own field or across different fields
(Intellectual Merit); and
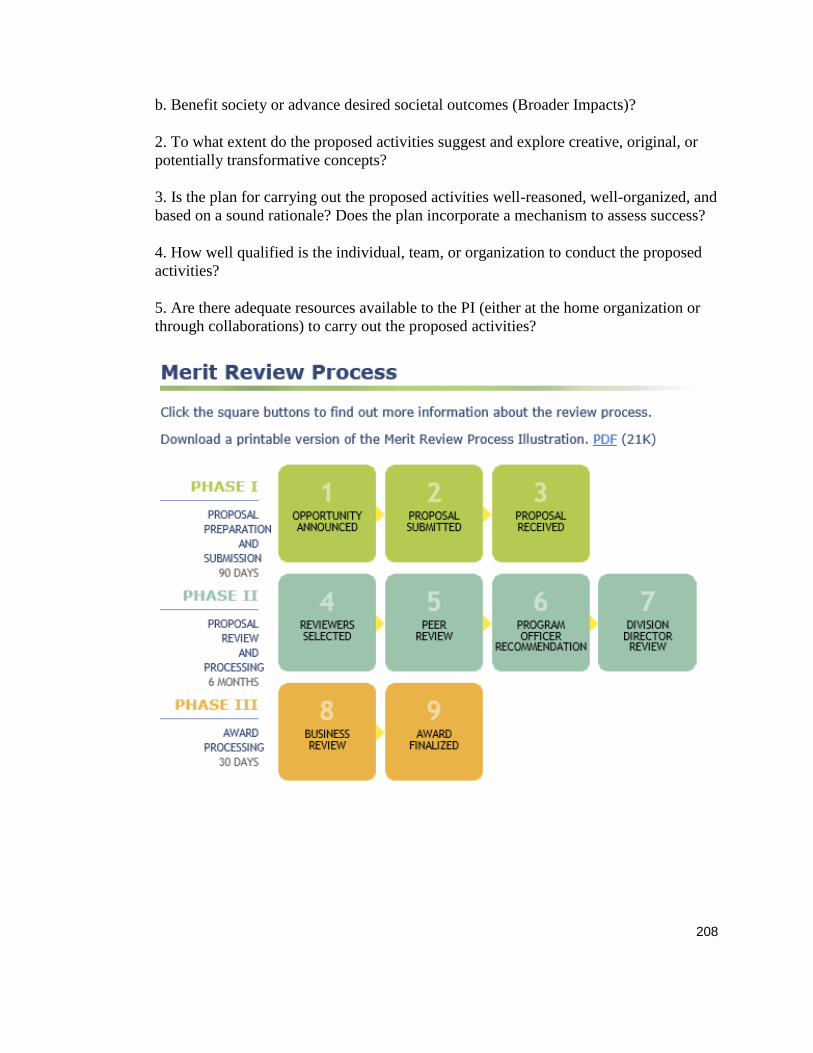
208
b. Benefit society or advance desired societal outcomes (Broader Impacts)?
2. To what extent do the proposed activities suggest and explore creative, original, or
potentially transformative concepts?
3. Is the plan for carrying out the proposed activities well-reasoned, well-organized, and
based on a sound rationale? Does the plan incorporate a mechanism to assess success?
4. How well qualified is the individual, team, or organization to conduct the proposed
activities?
5. Are there adequate resources available to the PI (either at the home organization or
through collaborations) to carry out the proposed activities?

209
APPENDIX B: DEFINITIONS OF REISMAN’S TAXONOMY
Key 1: Actors 1.1 Transferors
1.1.1. Scientific disciplines 1.1.2. Professions 1.1.3. Corporate or institutional entities 1.1.4. Industries 1.1.5. Economic sectors 1.1.6. Geographic regions 1.1.7. Societies/countries.
1.2. Transferees 1.2.1. Scientific disciplines 1.2.2. Professions 1.2.3. Corporate or institutional entities 1.2.4. Industries 1.2.5. Economic sectors 1.2.6. Geographic regions 1.2.7. Societies/countries.
Key 2: Transaction Types 2.1 External Transfers
2.1.1. Information exchange 2.1. 1.1 Programs: (Sabbaticals, scholarship programs such as the Fulbright awards, work study arrangements, internships) 2.1.1.2 Conferences and Symposia 2.1.1.3 Technical Correspondence 2.1. 1.4 Free Technical Services 2.1.1.5 Professional-Journal Publications 2.1. 1.6 Software programs 2.1.1.7 Internet/Web usage related exchanges 2.1.2. Sales 2.1.2.1 Sales of Equipment and/or Intellectual Properties: (A single piece of equipment or an entire system such as a factory, turn-key projects, etc., a formula, new designs. drawings, blueprints, procedures, market surveys, demographic statistics) 2.1.2.2 Sales of Services: (Consulting assistance, user manuals, equipment maintenance) 2.1.3 Cooperative agreement 2.1.3.1 Co-production: (The GE (USA) - SNECMA (French)) collaboration in the aerospace industry 2.1.3.2 Co-research (the U.S. Human Genome Project. a 13-year effort coordinated by the Department of

210
Energy and the National Institutes of Health) 2.1.3.3 Co-design (Arrow anti- missile system (USA and Israel), The UK Watch-keeper' unmanned spy plane project (UK, USA, Israel) 2.1.4 Arm's length licensing 2.1.4.1 Licensing: Conveyance of manuals, blueprints, design drawings or data: provision of technical and managerial assistance. 2.1.4.2 Cross licensing: (same as above)
2.1.5 Franchising (McDonald's hamburgers in USSR. Holiday Inn Hotels in USA).
2.1.6 Joint venture 2.1.6.1 Equity Joint Venture: 2.1.6.2 Contractual Joint Venture
2.2 Internal Transfers 2.2.1 Internal information exchange 2.2.1.1 Meetings: 2.2.1.2 Correspondence: 2.2.1.3 Publications: 2.2.2 Cooperative agreement 2.2.3 Arm's length licensing 2.2.4 Internal joint venture 2.2.5 Wholly owned subsidiary
2.3 Time duration 2.3.1 Short term 2.3.2 Long term
2.4 Payment requirement 2.4.1 None 2.4.2 Required
2.5 Network 2.5.1 Two nodes 2.5.2 Multi nodal
2.6 Flow 2.6.1 Unidirectional 2.6.2 Bi-directional 2.6.3 Multi-directional
2.7 Nature of TT 2.7.1 Proprietary 2.7.2 Non- Proprietary
Key 3 Motivations 3.1 Economic Factors
3.1.1 Cost savings 3.1.2 Economic growth
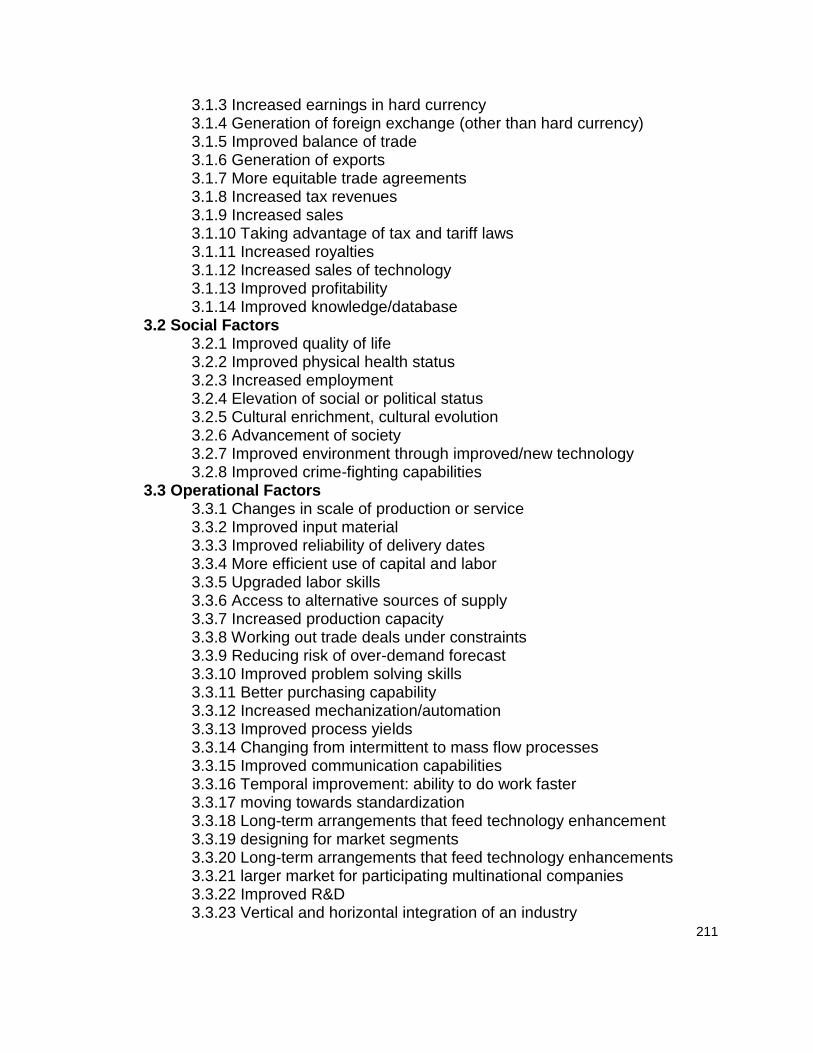
211
3.1.3 Increased earnings in hard currency 3.1.4 Generation of foreign exchange (other than hard currency) 3.1.5 Improved balance of trade 3.1.6 Generation of exports 3.1.7 More equitable trade agreements 3.1.8 Increased tax revenues 3.1.9 Increased sales 3.1.10 Taking advantage of tax and tariff laws 3.1.11 Increased royalties 3.1.12 Increased sales of technology 3.1.13 Improved profitability 3.1.14 Improved knowledge/database
3.2 Social Factors 3.2.1 Improved quality of life 3.2.2 Improved physical health status 3.2.3 Increased employment 3.2.4 Elevation of social or political status 3.2.5 Cultural enrichment, cultural evolution 3.2.6 Advancement of society 3.2.7 Improved environment through improved/new technology 3.2.8 Improved crime-fighting capabilities
3.3 Operational Factors 3.3.1 Changes in scale of production or service 3.3.2 Improved input material 3.3.3 Improved reliability of delivery dates 3.3.4 More efficient use of capital and labor 3.3.5 Upgraded labor skills 3.3.6 Access to alternative sources of supply 3.3.7 Increased production capacity 3.3.8 Working out trade deals under constraints 3.3.9 Reducing risk of over-demand forecast 3.3.10 Improved problem solving skills 3.3.11 Better purchasing capability 3.3.12 Increased mechanization/automation 3.3.13 Improved process yields 3.3.14 Changing from intermittent to mass flow processes 3.3.15 Improved communication capabilities 3.3.16 Temporal improvement: ability to do work faster 3.3.17 moving towards standardization 3.3.18 Long-term arrangements that feed technology enhancement 3.3.19 designing for market segments 3.3.20 Long-term arrangements that feed technology enhancements 3.3.21 larger market for participating multinational companies 3.3.22 Improved R&D 3.3.23 Vertical and horizontal integration of an industry
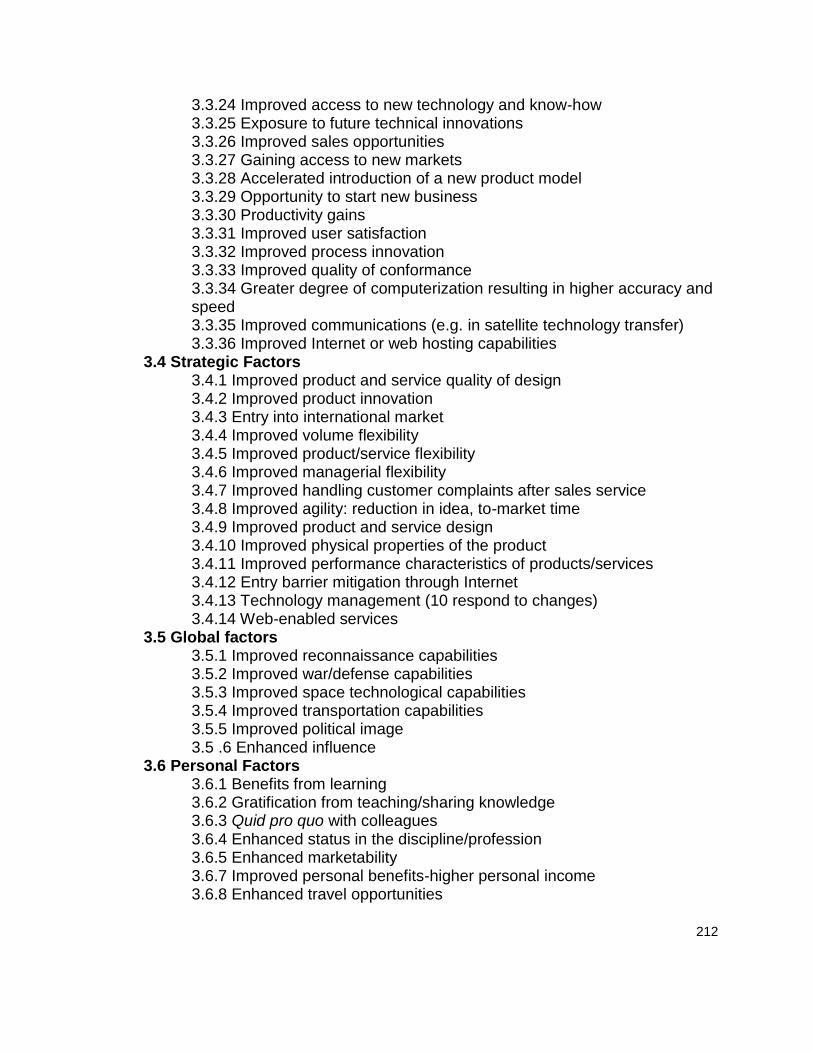
212
3.3.24 Improved access to new technology and know-how 3.3.25 Exposure to future technical innovations 3.3.26 Improved sales opportunities 3.3.27 Gaining access to new markets 3.3.28 Accelerated introduction of a new product model 3.3.29 Opportunity to start new business 3.3.30 Productivity gains 3.3.31 Improved user satisfaction 3.3.32 Improved process innovation 3.3.33 Improved quality of conformance 3.3.34 Greater degree of computerization resulting in higher accuracy and speed 3.3.35 Improved communications (e.g. in satellite technology transfer) 3.3.36 Improved Internet or web hosting capabilities
3.4 Strategic Factors 3.4.1 Improved product and service quality of design 3.4.2 Improved product innovation 3.4.3 Entry into international market 3.4.4 Improved volume flexibility 3.4.5 Improved product/service flexibility 3.4.6 Improved managerial flexibility 3.4.7 Improved handling customer complaints after sales service 3.4.8 Improved agility: reduction in idea, to-market time 3.4.9 Improved product and service design 3.4.10 Improved physical properties of the product 3.4.11 Improved performance characteristics of products/services 3.4.12 Entry barrier mitigation through Internet 3.4.13 Technology management (10 respond to changes) 3.4.14 Web-enabled services
3.5 Global factors 3.5.1 Improved reconnaissance capabilities 3.5.2 Improved war/defense capabilities 3.5.3 Improved space technological capabilities 3.5.4 Improved transportation capabilities 3.5.5 Improved political image 3.5 .6 Enhanced influence
3.6 Personal Factors 3.6.1 Benefits from learning 3.6.2 Gratification from teaching/sharing knowledge 3.6.3 Quid pro quo with colleagues 3.6.4 Enhanced status in the discipline/profession 3.6.5 Enhanced marketability 3.6.7 Improved personal benefits-higher personal income 3.6.8 Enhanced travel opportunities

213
Key 4 Disciplines and Professions 4.1 Economics
4.1.1 Vertical n 4.1.2 Horizontal n 4.1.3 Physical item n 4.1.4 Information n 4.1.5 Industry- industry n 4.1 .6 Sector-sector TT 4.1.7 Region-.region n 4.1.8 Domestic n 4.1.9 International TT 4.1.9.1 West-East 4.1.9.2 North-South TT
4.2 Anthropology Cross-cultural TT 4.2.1 Group program 4.2.2 Community program 4.2.3 Village program 4.2.4 Rural program 4.2.5 Urban program
4.3 Sociology 4.3.1 Diffusion of innovation 4.3.2 Adoption 01 Innovation 4.3.3 Diffusion 01 social technology 4.3.4 Diffusion of non-social technology 4.3.5 Centralized diffusion 4.3.6 Decentralized diffusion
4.4 Management engineering and other professions 4.4.1 Vertical TT 4.4.2 Horizontal n 4.4.3 Physical item n 4.4.4 Information n 4.4.5 Industry-industry TT 4.4.6 Sector-sector TT 4.4.7 Region-region IT 4.4.8 Domestic TT 4.4.9 International TT 4.4.10 Material TT 4.4.11 Design TT 4.4.12 Capacity TT 4.4.13 imparts operational capability 4.4.14 TT imparts duplicative capability 4.4.15 TT imparts innovative capability 4.4.16 Markel level IT 4.4.17 Production level IT 4.4.18 R&D level TT

214
4.4.19 Inter-firm IT 4.4.20 Intra-firm TT 4.4.21 Internal TT 4.4.22 Arms-Length TT 4.4.23 TT to wholly owned subsidiary 4.4.24 TT to joint venture 4.4.25 TT to independent company 4.4.26 Web-based Innovations 4.4.27 Web-based customer interactions
215
APPENDIX C: MODEL VALIDATION ASSESSMENT TOOL
MODEL VALIDATION Thank you very much for agreeing to participate in my research. Please answer the 5 questions to complete the content validation assessment. The assessment aims to capture your judgment on a number of proposed assessment variables. The objective of this assessment tool is to validate the preliminary hierarchical model that was developed based on a comprehensive literature review. The following questions are intended to capture your judgment of the suitability of the proposed perspectives and success attributes, and identify those that might have gone undetected during my literature review. Your input will be used to help finalize my model. The model is presented below in its entirety. Individual questions will address specific levels of the model for you to assess. Also, each question includes a definition of the perspective and corresponding success attributes as appropriate. You are NOT being asked to comment on desirability curves (indicated as "DC" in the diagram). Note: This research defines technology transfer as moving from Technology Readiness Levels 7-9 into application at an organization. Thank you again for your time and for providing your expert opinion - it will make a significant difference in the quality of my research. I would appreciate it if you would provide responses at your earliest convenience. Sincerely, Judith Estep PMO, Technology Innovation, BPA
PhD Candidate, Dept of Engineering and Technology Management, PSU
[MODEL GRAPH WAS INSERTED]

216
QUESTION 1 WAS OMITTED TO MAINTAIN EXPERT ANONIMITY QUESTION 2 A comprehensive literature review was used to develop four major perspectives when considering technology transfer. A definition of each perspective is provided. Organizational: This perspective refers to the strategies developed between the research organization and the technology recipient. Strategies consider how similar the research partners are, in terms of organizational structure, their location, and how many stakeholders are involved in the technology transfer transaction. For the purposes of this proposal the research organizations include 5 likely partners: Universities, Collaborative Partnerships (EPRI, CEATI, etc.), National Labs (LBNL, PNNL, etc.), Industry Partners (Intel, IBM, etc.), and other utilities (So Cal Edison, Consolidated Edison, etc.). Technological: This perspective considers actions related to the technology as important for successful technology transfer. Actions include the researcher’s previous cooperative experience and ability to demonstrate the technology, understanding of the recipient’s technology needs, and the existence of and ability of the Technology Transfer Office to be effective at marketing the technology. Social: The emphasis on social strategies is how to develop and maintain a relationship between the researchers and recipients such that technology transfer is more likely to occur. This perspective and associated success attributes identify the necessary activities to facilitate a successful technology transfer. Market: This perspective assesses the market’s readiness to accept the new technology – has a market-pull be sufficiently created such that it (the market) has a need established and assessed for the technology? The success attributes that support this perspective include: a business plan has been created, financial feasibility has been confirmed, common standards exist, there is an appropriate level of support from management, and government incentives exist to make the technology more appealing to use or be adopted on a larger scale. Please indicate whether the proposed perspectives are valid for developing a technology transfer score. Organizational Yes No Technological Yes No Social Yes No Market Yes No Please use this space to comment on additional perspectives that should be included when considering technology transfer.
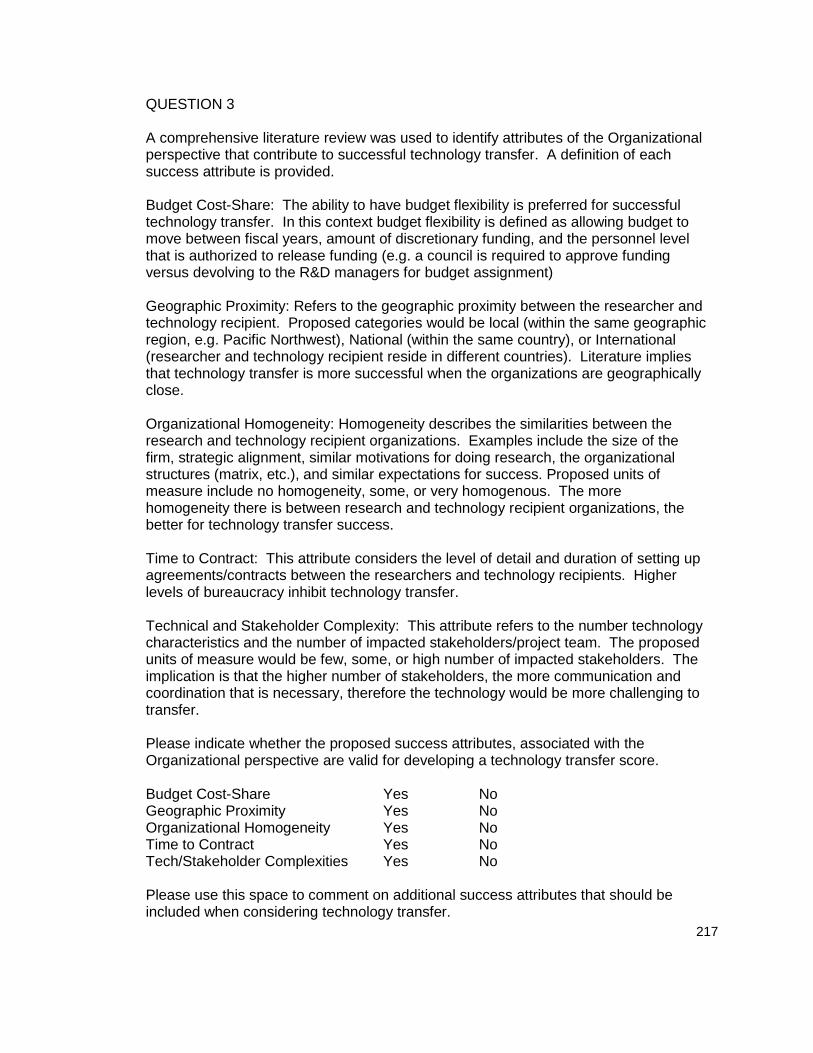
217
QUESTION 3 A comprehensive literature review was used to identify attributes of the Organizational perspective that contribute to successful technology transfer. A definition of each success attribute is provided. Budget Cost-Share: The ability to have budget flexibility is preferred for successful technology transfer. In this context budget flexibility is defined as allowing budget to move between fiscal years, amount of discretionary funding, and the personnel level that is authorized to release funding (e.g. a council is required to approve funding versus devolving to the R&D managers for budget assignment) Geographic Proximity: Refers to the geographic proximity between the researcher and technology recipient. Proposed categories would be local (within the same geographic region, e.g. Pacific Northwest), National (within the same country), or International (researcher and technology recipient reside in different countries). Literature implies that technology transfer is more successful when the organizations are geographically close. Organizational Homogeneity: Homogeneity describes the similarities between the research and technology recipient organizations. Examples include the size of the firm, strategic alignment, similar motivations for doing research, the organizational structures (matrix, etc.), and similar expectations for success. Proposed units of measure include no homogeneity, some, or very homogenous. The more homogeneity there is between research and technology recipient organizations, the better for technology transfer success. Time to Contract: This attribute considers the level of detail and duration of setting up agreements/contracts between the researchers and technology recipients. Higher levels of bureaucracy inhibit technology transfer. Technical and Stakeholder Complexity: This attribute refers to the number technology characteristics and the number of impacted stakeholders/project team. The proposed units of measure would be few, some, or high number of impacted stakeholders. The implication is that the higher number of stakeholders, the more communication and coordination that is necessary, therefore the technology would be more challenging to transfer. Please indicate whether the proposed success attributes, associated with the Organizational perspective are valid for developing a technology transfer score. Budget Cost-Share Yes No Geographic Proximity Yes No Organizational Homogeneity Yes No Time to Contract Yes No Tech/Stakeholder Complexities Yes No Please use this space to comment on additional success attributes that should be included when considering technology transfer.
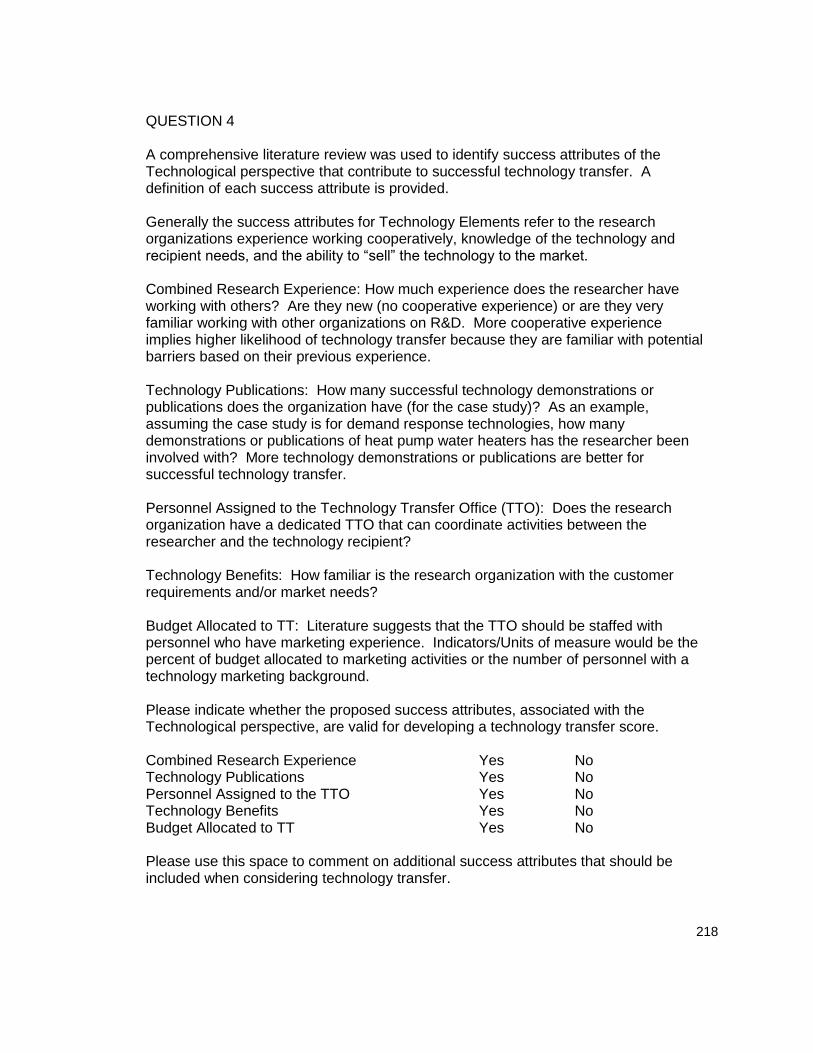
218
QUESTION 4 A comprehensive literature review was used to identify success attributes of the Technological perspective that contribute to successful technology transfer. A definition of each success attribute is provided. Generally the success attributes for Technology Elements refer to the research organizations experience working cooperatively, knowledge of the technology and recipient needs, and the ability to “sell” the technology to the market. Combined Research Experience: How much experience does the researcher have working with others? Are they new (no cooperative experience) or are they very familiar working with other organizations on R&D. More cooperative experience implies higher likelihood of technology transfer because they are familiar with potential barriers based on their previous experience. Technology Publications: How many successful technology demonstrations or publications does the organization have (for the case study)? As an example, assuming the case study is for demand response technologies, how many demonstrations or publications of heat pump water heaters has the researcher been involved with? More technology demonstrations or publications are better for successful technology transfer. Personnel Assigned to the Technology Transfer Office (TTO): Does the research organization have a dedicated TTO that can coordinate activities between the researcher and the technology recipient? Technology Benefits: How familiar is the research organization with the customer requirements and/or market needs? Budget Allocated to TT: Literature suggests that the TTO should be staffed with personnel who have marketing experience. Indicators/Units of measure would be the percent of budget allocated to marketing activities or the number of personnel with a technology marketing background. Please indicate whether the proposed success attributes, associated with the Technological perspective, are valid for developing a technology transfer score. Combined Research Experience Yes No Technology Publications Yes No Personnel Assigned to the TTO Yes No Technology Benefits Yes No Budget Allocated to TT Yes No Please use this space to comment on additional success attributes that should be included when considering technology transfer.

219
QUESTION 5 A comprehensive literature review was used to identify the Social perspective attributes that contribute to successful technology transfer. A definition of each success attribute is provided. Generally, these success attributes consider the personnel relationships and activities that facilitate technology transfer both at the research organization and technology recipient’s organization. Diversity Events: Personnel that are more aware of and have more experience interacting with different cultures are more successful at technology transfer. Potential units of measure are the organizations have none, some, a lot of diversity/cultural training opportunities. Personnel Dedicated to TT: This attribute refers to the degree that researchers are involved in the hand-off process. When do the researchers start to consider technology transfer and start to involve end-users/technology recipients (e.g. as part of the R&D process or after the research is complete)? Project Meetings: Fundamental to successful technology transfer is establishing a trusting relationship between the research and technology recipient. This can be accomplished by frequent communication, structured project management/meetings, cooperative risk assessments, etc. Personnel Loan Policy: The willingness to “loan” researchers to help with technology transfer was cited as necessary for technology transfer. Successful TT Experiences: Does the research or technology recipient organization have systems in place to recognize innovative thinking? Literature suggests that having a reward system in place facilitates technology transfer. Please indicate whether the proposed success attributes, associated with the Social perspective are valid for developing a technology transfer score. Diversity Events Yes No Personnel Dedicated to TT Yes No Project Meetings Yes No Personnel Loan Policy Yes No Please use this space to comment on additional success attributes that should be included when considering technology transfer.

220
QUESTION 6 A comprehensive literature review was used to identify attributes of the Market perspective that contribute to successful technology transfer. A definition of each success attribute is provided. Generally, these success attributes refer to how ready is the market to receive the technology. Has the technical and financial feasibility been verified? Are incentives in place to encourage technology transfer (e.g. rebates, common standards, etc.)? Also, does the recipient organization have a structure in place to accept the technology? Use Case: Does a comprehensive business plan exist that supports the technology in the recipient organization? Organizational Champion: Literature suggests that a dedicated champion in the recipient organization is fundamental to successful technology transfer. The champion can shepherd the technology through organizational barriers; a sense of ownership is created. Level of Top Management Support: Similar to an organizational champion, the top management in the organization needs to see the value of the technology. Their support is required for successful technology transfer. Government Incentives: Incentives are seen as a way to entice a market to invest in technology. Examples include rebates for purchasing LED lightbulbs or tax credits for wind farms. Common Technology Standards: Common standards help to facilitate the introduction of multiple but similar technologies into the market. Common communication protocols are examples of standards that help to facilitate demand response technologies. ROI: Similar to the business plan, has financial feasibility been determined? Examples include, price point of solar panels for the residential market have not been completely realized and is seen as one of the barriers to their widespread adoption in the US. Please indicate whether the proposed success attributes, associated with the Market perspective, are valid for developing a technology transfer score. Use Case Yes No Organizational Champion Yes No Level of Top Mgmt Support Yes No Government Incentives Yes No Common Tech Standards Yes No ROI Yes No

221
Please use this space to comment on additional success attributes that should be included when considering technology transfer.
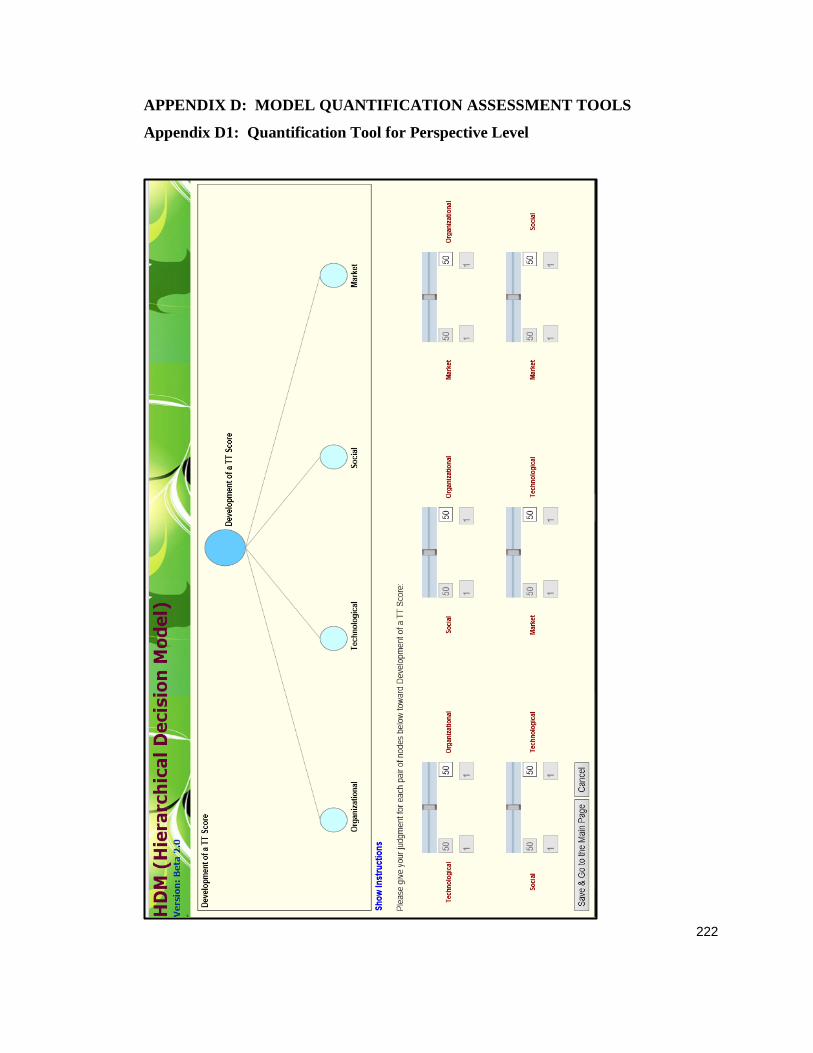
222
APPENDIX D: MODEL QUANTIFICATION ASSESSMENT TOOLS
Appendix D1: Quantification Tool for Perspective Level

223
Appendix D2: Quantification Tool for Organizational Success Attributes

224
Appendix D3: Quantification Tool for Technological Success Attributes

225
Appendix D4: Quantification Tool for Social Success Attributes

226
Appendix D5: Quantification Tool for Market Success Attributes
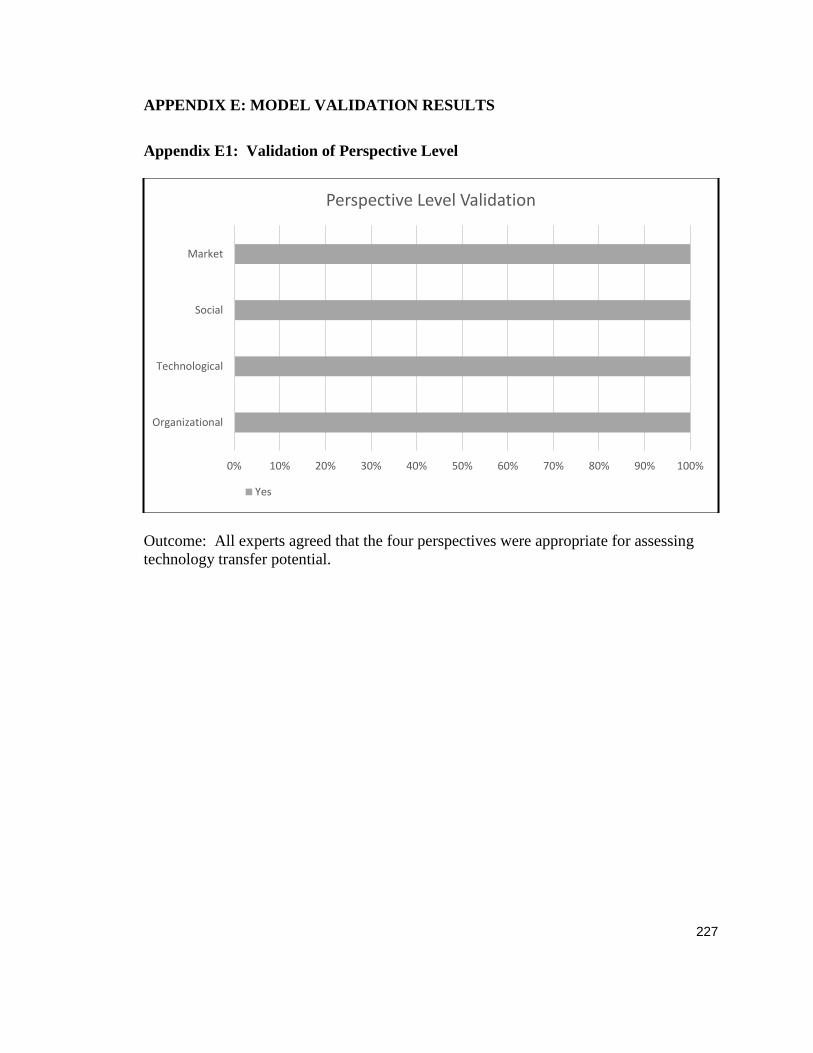
227
APPENDIX E: MODEL VALIDATION RESULTS
Appendix E1: Validation of Perspective Level
Outcome: All experts agreed that the four perspectives were appropriate for assessing
technology transfer potential.
0% 10% 20% 30% 40% 50% 60% 70% 80% 90% 100%
Organizational
Technological
Social
Market
Perspective Level Validation
Yes

228
Appendix E2: Validation of Organizational Perspective Success Attributes
Verbatim Feedback:
Geographic proximity is a matter of convenience but with today’s technology
barriers are easier to overcome.
First adopter: Consider the willingness of the recipient to be the first one to
use a new product. Some organizations are conservative and insist only on
commercially available technologies
Regarding stakeholders – a large number of stakeholders may create a market
pull
Outcome:
Less than 67% of experts thought that Organizational Homogeneity was valid
for developing a TT score
0% 10% 20% 30% 40% 50% 60% 70% 80% 90% 100%
Budget Cost-Share
Geographic Proximity
Organizational Homogeneity
Time to Contract
Technical & Stakeholder Complexities
Organizational Perspective Success Attributes
No Yes

229
o “…the organization taking technology to market should be very
different than the R&D organization. They have a much different
purpose and may be much smaller…” [Expert 7]
o “…sometimes I have observed that large organizations have trouble
working with each other. The organizations can have established
processes, cultures, etc. that are not easily changed…” [Expert 1]
The success attribute was removed from the final model
Appendix E3: Validation of Technological Perspective Success Attributes
Outcome: All success attributes were determined to be appropriate for developing a
technology transfer score.
0% 10% 20% 30% 40% 50% 60% 70% 80% 90% 100%
Combined Research Experience
Technology Publications
Personnel Assigned to TTO
Technology Benefits
Budget Allocated to TT
Technological Perspective Success Attributes
No Yes

230
Appendix E4: Validation of Social Perspective Success Attributes
Outcome: All success attributes were determined to be appropriate for developing a
technology transfer score.
0% 10% 20% 30% 40% 50% 60% 70% 80% 90% 100%
Diversity Events
Personnel Dedicated to TT
Project Meetings
Personnel Loan Policy
Successful TT Experiences
Social Perspective Success Attributes
No Yes

231
Appendix E5: Validation of Market Perspective Success Attributes
Outcome: All success attributes were determined to be appropriate for developing a
technology transfer score.
0% 20% 40% 60% 80% 100% 120%
Use Case
Organizational Champion
Level of Top Management Interest
Government Incentives
Common Standards
ROI
Market Perspective Success Attributes
No Yes

232
APPENDIX F: PAIRWISE COMPARISON RESULTS
Appendix F1: Perspective Level Pairwise Comparisons
Expert A : B A : C A : D B : C B : D C : D
Expert 1 20 50 20 85 65 20
Expert 2 40 90 50 90 50 20
Expert 3 60 70 40 60 30 20
Expert 4 65 30 30 20 20 40
Expert 5 60 50 30 70 30 30
Expert 6 25 25 25 50 30 30
Expert 7 60 50 50 70 40 40
Expert 8 50 40 30 30 20 40
Expert 9 35 50 25 70 45 15
Expert 10 40 35 30 60 35 40
Expert 11 20 50 20 60 50 40
A: Organizational
B: Technological
C: Social
D: Market

233
Appendix F2: Organizational Pairwise Comparisons
Expert A : B A : C A : D B : C B : D C : D
Expert 21 40 20 50 30 60 70
Expert 22 75 40 35 25 25 30
Expert 23 60 65 20 50 30 35
Expert 24 75 70 60 40 35 60
Expert 25 40 35 15 60 20 10
Expert 26 75 50 50 25 15 50
Expert 27 25 25 75 75 50 50
Expert 28 40 70 50 65 45 25
Expert 29 40 50 40 70 35 60
Expert 30 80 40 30 20 20 50
Expert 31 60 85 35 70 35 50
Expert 32 75 75 35 70 50 5
Expert 33 65 40 50 35 35 50
A: Budget Cost-Share
B: Geographic Proximity
C: Average Time to Contract
D: Technical/Stakeholder Complexities
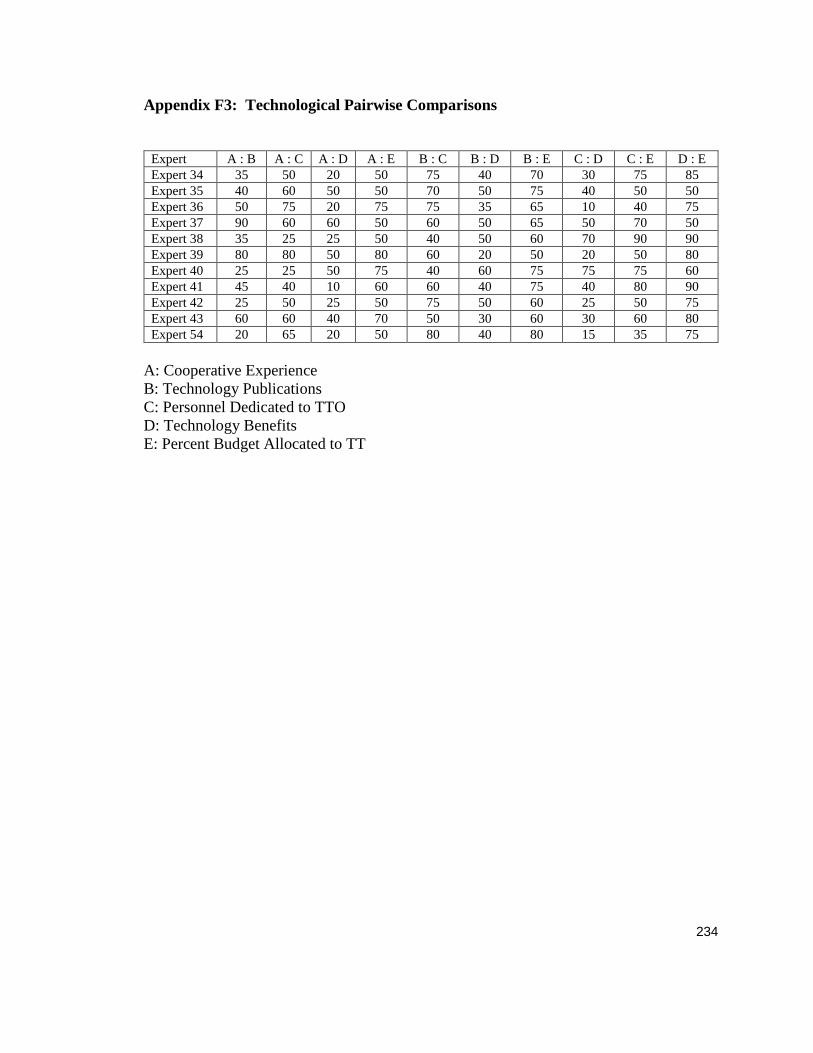
234
Appendix F3: Technological Pairwise Comparisons
Expert A : B A : C A : D A : E B : C B : D B : E C : D C : E D : E
Expert 34 35 50 20 50 75 40 70 30 75 85
Expert 35 40 60 50 50 70 50 75 40 50 50
Expert 36 50 75 20 75 75 35 65 10 40 75
Expert 37 90 60 60 50 60 50 65 50 70 50
Expert 38 35 25 25 50 40 50 60 70 90 90
Expert 39 80 80 50 80 60 20 50 20 50 80
Expert 40 25 25 50 75 40 60 75 75 75 60
Expert 41 45 40 10 60 60 40 75 40 80 90
Expert 42 25 50 25 50 75 50 60 25 50 75
Expert 43 60 60 40 70 50 30 60 30 60 80
Expert 54 20 65 20 50 80 40 80 15 35 75
A: Cooperative Experience
B: Technology Publications
C: Personnel Dedicated to TTO
D: Technology Benefits
E: Percent Budget Allocated to TT

235
Appendix F4: Social Pairwise Comparisons
Expert A : B A : C A : D A : E B : C B : D B : E C : D C : E D : E
Expert 21 10 30 10 65 60 50 80 35 75 80
Expert 22 75 50 60 40 40 35 25 60 50 40
Expert 23 15 20 25 35 55 65 70 60 65 60
Expert 24 30 20 40 35 20 60 40 75 50 45
Expert 25 40 30 60 40 50 70 80 75 75 50
Expert 26 40 40 50 35 30 60 60 70 70 40
Expert 27 25 25 75 75 50 99 99 99 99 50
Expert 28 30 70 50 75 60 80 80 65 80 50
Expert 29 40 50 30 60 50 60 70 70 70 50
Expert 30 40 50 25 50 70 70 70 50 70 50
Expert 31 35 40 45 40 45 50 40 55 60 40
Expert 32 30 5 15 5 50 50 30 75 50 50
Expert 33 25 35 40 30 55 60 60 50 60 45
A: Diversity Events
B: Personnel Dedicated to TT
C: Project Team Communications
D: Personnel Loan Policy
E: Successful TT Experiences

236
Appendix F5: Market Pairwise Comparisons
Exper
t
A:
B
A:
C
A:
D
A:
E
A:
F
B:
C
B:
D
B:
E
B:
F
C:
D
C:
E
C:
F
D:
E
D:
F
E:
F
E12 50 50 80 80 30 50 80 80 30 80 80 30 40 10 10
E13 55 45 60 35 40 40 35 25 35 75 40 50 25 50 55
E14 75 65 95 70 50 45 80 50 30 90 70 40 20 10 20
E15 30 30 75 40 50 20 60 25 50 75 50 65 20 40 60
E17 10 10 5 5 10 50 20 20 25 15 5 40 60 75 50
E18 30 30 70 35 30 50 70 60 35 70 60 30 30 20 35
E19 25 25 80 80 50 45 80 75 50 90 85 70 40 25 25
E20 60 90 50 80 20 10 50 40 50 60 50 50 40 80 60
E2 60 70 80 80 50 60 80 90 40 85 90 40 50 30 10
A: Comprehensiveness of Use Case
B: Credibility of the Organizational Champion
C: Level of Top Management Interest
D: Government Incentives
E: Common Standards
F: ROI

237
APPENDIX G: DESIRABILITY CURVES FOR CASE STUDY– ACTUAL
VALUES
Appendix G1: Summary of Desirability Curves

238
Appendix G2: Success Attributes for Case Studies
Budget Cost-Share % cost share required to
fund research
62% 50% 50% 50%
Geographic Proximity proximity between
research and recipient
250 - 1500 mile
separation
250 - 1500 mile
separation
250 - 1500 mile
separation
1500-3000 mile
separation
Average Time to Contract average time to execute a
contract
4 months 1.5 months 1.5 months 4 months
Technical & Stakeholder
Complexity
# of technical characteristics
identified in proposal and #
of impacted stakeholders
2 technology
characteristics and
3 stakeholders
1 technology
characteristic and 3
stakeholders
2 technology
characteristics and
7 stakeholders
5 technology
characteristics and 2
stakeholder
Diversity Events# of diversity events to
create cultural awareness0 0 recommended 0
Personnel Dedicated to
Support TT
# of people dedicated to
support TT
0.5 0.5 0 1
Project Meetings # of comms described in the
comm project plan
monthly meetings weekly and site visits weekly monthly meetings
Personnel Loaned to
Recipienttime that researchers are
loaned to help with TT
0 0 1 year 1 week
Successful TT Experiences # of previous successful TT
experiences
0 0 0 4
Combined Research
Experience
# years of combined
research experience of
principles
47 years 38 years 46 years 44 years
Technology Publications # publications about
technology
45 publications 23 publications 16 publications 16 publications
Personnel Assigned to TTO # of personnel assigned to
TTO
0 3 3 0
Technology Benefits # technology benefits
identified in the research
proposal
10 7 4 7
Budget Allocated to TT % R&D budget dedicated to
TTO activities
0 5 0 0
Comprehensiveness of Use
Case
How well is the use Case
Defined
none none none none
Credibility of Organizational
Champion
Credibility of the
Organizational Champion
The champion has
technical expertise
and is recognized
within the region as an
expert
The champion has
technical expertise
and is recognized
within the region as
an expert
The champion has
technical expertise
and is recognized
within the region as
an expert
The champion has
technical expertise
and is recognized
within the
organization as an
expert
Level of Top Management
Interest
Level of Organizational
Support for TT
There is some support by
middle management but
their engagement and
support is not consistent
Executives are aware of
the technology but
their engagment is not
consistent
Executives are aware of
the technology but their
engagment is not
consistent
There is some support
by middle management
but their engagement
and support is not
consistent
Government Incentives # and type of government
incentives
No incentives for energy
pods used at utility scale
No incentives exists to
encourage technology
transfer
No incentives exists to
encourage technology
transfer
transient stability
modeling important - 1
regulatory incentive
Common Technology
Standards
How are common standards
supported
There are no common
standards or codes for
the technology
Communication
standards (CEA 2045,
WiFi, radio, etc.) -
Supported by a
consortium
Communication
standards (CEA 2045,
WiFi, radio, etc.) -
Supported by a
consortium
IEEE Standards for PMU data
used with modeling -
Supported by a consortium -
more generalized support and
awareness by a community
but there is no formal
requirement in place
ROI ROI 0 0 0 > 20% but less than
50% ROI
Mar
ket
Att
rib
ute
s o
f R
esea
rch
Prop
osa
ls
Soci
al
Proposal 4
Org
aniz
atio
nal
Te
chn
olo
gy E
lem
en
ts
Proposal 2 Proposal 3Success Attributes Proposal 1Units of Measurement

239
Appendix G3: Corresponding Desirability Curve Values
Budget Cost Share 40 60 60 60
Geographic Proximity 37 37 37 27
Average Time to Contract 40 65 65 40
Stakeholder Complexity 53 53 3 87
Technical Complexity 83 100 83 17
Diversity Events 0 0 22 0
Personnel Dedicated to
Support TT 5 50 13
Project Meetings 90 100 90 90
Personnel Loaned to
Recipient 0 0 77 10
Successful TT
Experiences 0 0 0 60
Combined Research
Experience 85 81 85 82
Technology Publications 100 73 73 73
Personnel Assigned to
TTO 0 100 100 0
Technology Benefits
100 100 87 100
Budget Allocated to TT 0 57 0 0
Comprehensiveness of
the Use Case 0 0 0 0
Credibility of
Organizational Champion
88 88 88 63
Level of Top Mgmt
Interest
32 43 43 32
Government Incentives 0 0 0 50
Common Technology
Standards
0 40 40 40
ROI 0 0 0 48
Mar
ket
Co
rresp
on
din
g D
esir
ab
ilit
y C
urve V
alu
es
Success Attributes Proposal 1 Proposal 2 Proposal 3
Soci
al
Tech
no
logy
Ele
me
nts
Proposal 4
Ora
gan
izat
ion
al