Embed Size (px)
Citation preview
Development of a Prototype of a Visualization Tool
for Assessing the Efficiency of Primary and
Secondary Public Schools in the Philippines
John Lorenzo A. Yambot
Thesis Fellow
Philippine Statistical Research
and Training Institute
Assistant Professor
Institute of Statistics
University of the Philippines Los Baños

Raising the Quality of Education
Writing, reading and
comprehension, numeracy,
communication in early grades
Learning the required
competencies
Employability
Responsiveness
to Philippine realities
Global competitiveness
Educational Attainment
by Population Share: Philippines
Image Source: Acosta, et al. 2017. Developing Socioemotional Skills for the Philippines’
Labor Market, The World Bank

Are we getting
the highest possible value
from this investment?
improving education outcomes
without spending more
reducing the expenseson education without sacrificing
the education outcomes

Education Production Function
Mathematical relationship defined by Bowles(1970)
Y = f (X1,…,Xm, Xn,…, Xv,Xw,…,Xz)
school
output school
environment
outside
environment student
characteristics

Education Production Function
Education Output
Total number
of Grade 6
(for primary schools),
and 4th year
(for secondary
schools) examinees
achieving at least
a minimum overall
proficiency level
Education Input
school
characteristics
community
characteristics
teacher
characteristics
student
characteristics
region

Data Sources and Description
DepEd’s Enhanced Basic Education Information System (EBEIS)
PSA Census of Population
and Housing Form 5
(Barangay Schedule)
DepEd Bureau of Education
Assessment (BEA) National
Achievement Test Scores
For S.Y. 2014-2015,
38,648 total number
3,355
number
of sampled
schools(excluding ARMM)
7,976
709
Primary
Public
Secondary
Public

Technical Efficiency Score Estimates (Primary Public Schools)
Summary statistics and distribution of the estimated technical efficiency
scores of the sampled primary public schools
SUMMARY STATISTIC T.E. SCORE
Minimum 0.0268
1st Quartile 0.6221
Median 0.7305
3rd Quartile 0.8285
Maximum 1.0000
Mean 0.7162
Standard Deviation 0.1582

Technical Efficiency Score Estimates (Secondary Public Schools)
Summary statistics and distribution of the estimated technical efficiency
scores of the sampled secondary public schools
SUMMARY STATISTIC T.E. SCORE
Minimum 0.0273
1st Quartile 0.5481
Median 0.6753
3rd Quartile 0.8094
Maximum 0.9978
Mean 0.6701
Standard Deviation 0.1764
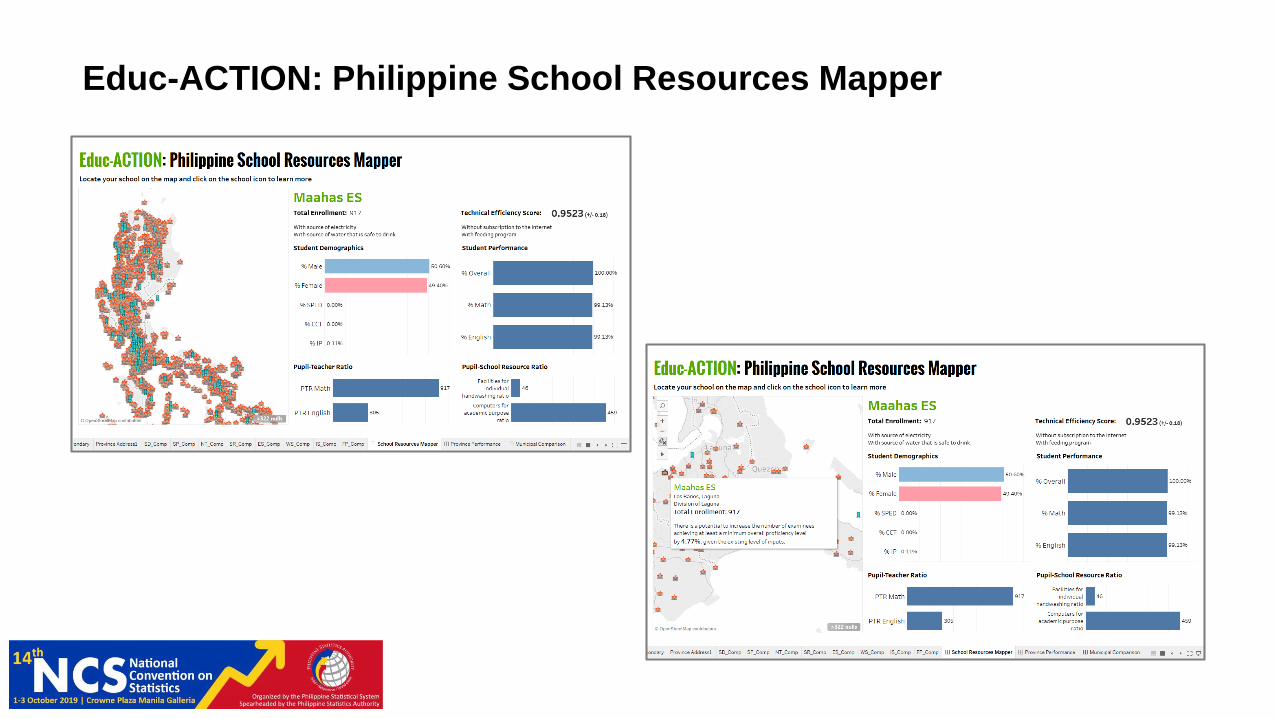
Educ-ACTION: Philippine School Resources Mapper

Educ-ACTION: Provincial Education Performance Assessment

Educ-ACTION: Municipal/ City Comparison

Thank you very much for listening!
Para sa bayan,
John Lorenzo A. Yambot
3/F Wing C, Francisco O. Santos Hall, Harold Cuzner Royal Palm Avenue,
University of the Philippines Los Baños, College, Laguna 4031
+63917 700 5354 | [email protected]