Embed Size (px)
Citation preview
Pedro Filipe dos Santos Anjos
Licenciado em Ciências da Engenharia Biomédica
Development of a fundus camera for analysis of photoreceptor directionality in
the healthy retina
Dissertação para obtenção do Grau de Mestre em Engenharia Biomédica
Orientador: Brian Vohnsen, Senior Lecturer, University College Dublin, School of Physics
Co-orientador: Pedro Vieira, Professor Auxiliar, FCT-UNL
Março, 2015

ii

iii
Development of a fundus camera for analysis of photoreceptor directionality in the healthy retina
Copyright © Pedro Filipe dos Santos Anjos, Faculdade de Ciências e Tecnologia, Universidade Nova
de Lisboa.
A Faculdade de Ciências e Tecnologia e a Universidade Nova de Lisboa têm o direito, perpétuo e sem
limites geográficos, de arquivar e publicar esta dissertação através de exemplares impressos
reproduzidos em papel ou de forma digital, ou por qualquer outro meio conhecido ou que venha a
ser inventado, e de a divulgar através de repositórios científicos e de admitir a sua cópia e
distribuição com objectivos educacionais ou de investigação, não comerciais, desde que seja dado
crédito ao autor e editor.

iv

v
This project was developed at University College Dublin within the Advanced
Optical Imaging Group.

vi

vii
Dedico esta dissertação aos meus avós: Elisabeth Santos, Camilo Luiz dos Santos, Maria
José dos Anjos e Carlos Batista dos Anjos.
Por tudo o que me ensinaram e por serem uma fonte de inspiração.

viii

ix
Acknowledgements
I would like to express my appreciation and gratitude to my supervisor Brian Vohnsen for
accepting me into his research group, providing me with an amazing opportunity and experience,
and for his guidance throughout the project. I would also like to thank PhD student Denise Valente
for her support and for the valuable advice at certain key moments. I offer a very special thanks to
Salihah Qaysi, just starting her PhD, the person without who the completion of this project would not
have been possible. Thank you for your availability and contagious perseverance. Finally, I would like
to thank the rest of the Advanced Optical Imaging group: PhD student Rebecca McQuaid, Doctor
Atikur Jewel and Doctor Jia Jun Li, for their support and companionship.
I would also like to express my immense gratitude towards my family, for the continuous
sacrifices they took on my behalf and for their support, making the conclusion of my Masters studies
possible.

x
xi
Abstract
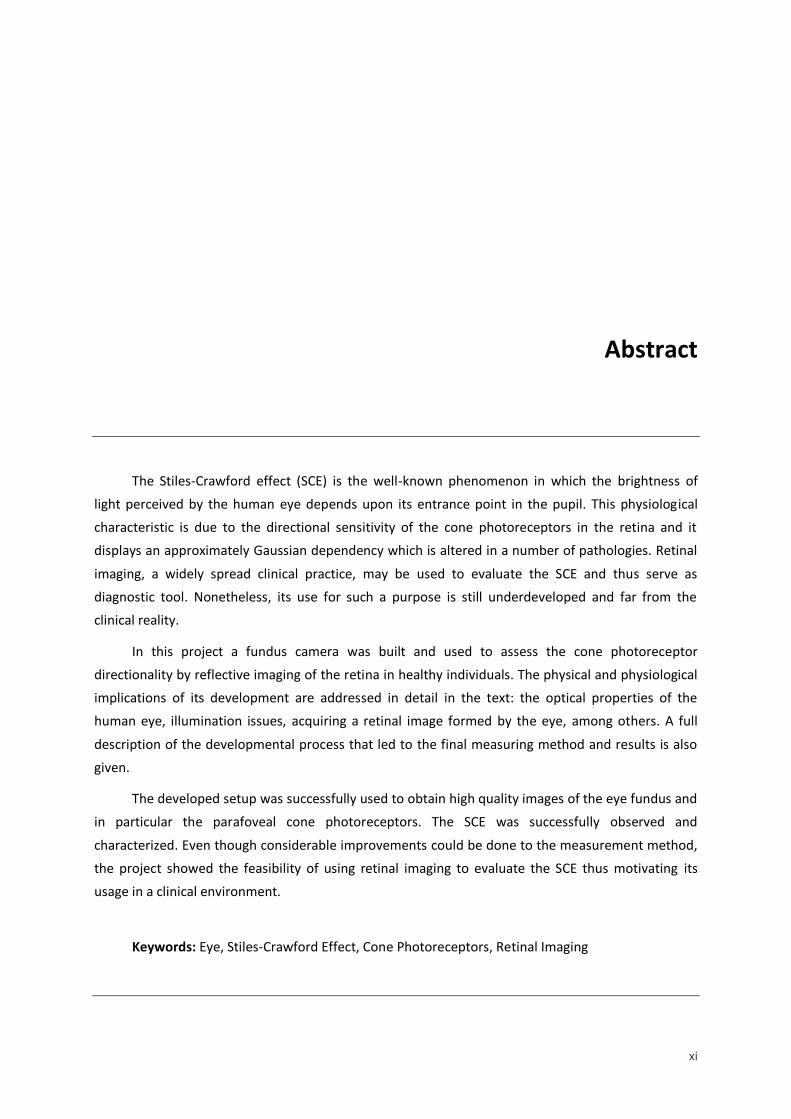
The Stiles-Crawford effect (SCE) is the well-known phenomenon in which the brightness of
light perceived by the human eye depends upon its entrance point in the pupil. This physiological
characteristic is due to the directional sensitivity of the cone photoreceptors in the retina and it
displays an approximately Gaussian dependency which is altered in a number of pathologies. Retinal
imaging, a widely spread clinical practice, may be used to evaluate the SCE and thus serve as
diagnostic tool. Nonetheless, its use for such a purpose is still underdeveloped and far from the
clinical reality.
In this project a fundus camera was built and used to assess the cone photoreceptor
directionality by reflective imaging of the retina in healthy individuals. The physical and physiological
implications of its development are addressed in detail in the text: the optical properties of the
human eye, illumination issues, acquiring a retinal image formed by the eye, among others. A full
description of the developmental process that led to the final measuring method and results is also
given.
The developed setup was successfully used to obtain high quality images of the eye fundus and
in particular the parafoveal cone photoreceptors. The SCE was successfully observed and
characterized. Even though considerable improvements could be done to the measurement method,
the project showed the feasibility of using retinal imaging to evaluate the SCE thus motivating its
usage in a clinical environment.
Keywords: Eye, Stiles-Crawford Effect, Cone Photoreceptors, Retinal Imaging

xii

xiii
Resumo
O efeito de Stiles-Crawford (ESC) é um fenómeno bem conhecido no qual o brilho da luz
percepcionado pelo olho humano depende do ponto de entrada da mesma na pupila. Esta
característica fisiológica deve-se à sensibilidade direccional dos fotorreceptores na retina,
nomeadamente os cones, e apresenta uma dependência aproximadamente Gaussiana que se
encontra alterada numa série de patologias. A imagiologia da retina, uma prática clínica comum,
pode ser usada para avaliar o ESC e portanto servir como ferramenta de diagnóstico. No entanto, o
seu uso para este fim encontra-se ainda sub-desenvolvido e distante da realidade clínica.
Neste projecto, uma câmara de fundo ocular foi criada e usada para aferir a direcionalidade
dos cones na retina de indivíduos saudáveis por imagiologia de reflexão. As implicaçoes físicas e
fisiológicas do seu desenvolvimento são abordadas em detalhe no texto: as propriedades ópticas do
olho humano, questões de iluminação, adquirir uma imagem da retina formada pelo olho, entre
outras. Uma descrição completa do processo de desenvolvimento que levou ao método de medição
e resultados finais é também feita.
O sistema desenvolvido foi usado com sucesso para obter imagens de alta qualidade do fundo
ocular e em particular dos cones na parafóvea. O ESC foi observado e caracterizado com sucesso.
Apesar do facto de que melhorias consideráveis pudessem ser feitas ao método de medição, o
projecto mostrou a viabilidade do uso de imagiologia da retina para avaliar o ESC e assim motivar o
seu uso em ambiente clínico.
Palavras-chave: Olho, Efeito de Stiles-Crawford, Cones, Imagiologia da Retina

xiv

xv
Table of Contents
Acknowledgements .................................................................................................................. ix
Abstract .................................................................................................................................... xi
Resumo ................................................................................................................................... xiii
Table of Contents .................................................................................................................... xv
Table of Figures ..................................................................................................................... xvii
Table of Tables ........................................................................................................................ xix
1. Introduction ..........................................................................................................................1
2. Theoretical Background ........................................................................................................3
2.1 The Stiles-Crawford Effect ................................................................................................3
2.2 The Waveguide Theory.....................................................................................................5
2.3 The SCE of the Second Kind ..............................................................................................6
2.4 Biological Function ...........................................................................................................7
2.5 The Optical SCE.................................................................................................................7
2.6 The Fundus Camera ..........................................................................................................9
3. State of the art ...................................................................................................................13
3.1 Adaptive optics and retinal imaging ...............................................................................13
3.2 Ultra-small spot size scanning laser ophthalmoscopy ....................................................16
3.3 A layered scattering model of outer-segment photoreceptor pigments ........................18
4. Work plan ...........................................................................................................................21
5. Camera Design Considerations ...........................................................................................23
5.1 Optical Properties of the Eye ..........................................................................................23
5.1.1 Refractive elements .................................................................................................23
5.1.2 Aperture ..................................................................................................................24
5.1.3 Sensitive Surface .....................................................................................................25
5.2 Eye motion .....................................................................................................................26
5.3 Illumination ....................................................................................................................26
5.3.1 Maxwellian Illumination ..........................................................................................27
5.3.2 Illuminated Region ..................................................................................................27
5.3.3 Illuminance ..............................................................................................................28
5.3.4 Eye Focus .................................................................................................................28
5.3.5 Positioning the Subject ............................................................................................28
5.4 Acquiring an Image .........................................................................................................29
5.4.1 Field of View and Magnification ..............................................................................29

xvi
5.4.2 Changing the focusing plane and magnification ......................................................32
5.5 Shielding .........................................................................................................................32
5.6 Health and Safety ...........................................................................................................33
6. Optical Elements and Other Tools ......................................................................................35
7. System Development and Experimenting...........................................................................39
8. Final Setup and Directionality Measurements ....................................................................49
9. Results ................................................................................................................................53
9.1 Retinal Images ................................................................................................................53
9.1.1 Optic Disc.................................................................................................................53
9.1.2 Blood Vessels ...........................................................................................................54
9.1.4 Capillaries and Cone Photoreceptors ......................................................................55
9.1.5 Digitally Enhanced Images .......................................................................................55
9.2 Directionality Results and Analysis .................................................................................57
10. Discussion and Conclusion ..................................................................................................61
11. Future Research Directions ................................................................................................65
References ...............................................................................................................................67
Appendices ..............................................................................................................................71
A.1 Health and Safety ...........................................................................................................71
A.2 Sensor Specifications .....................................................................................................73
A.3 System Development Photographs ................................................................................74
A.4 Photographs of the Final System....................................................................................76
A.5 Cone Mosaic and Capillary Images .................................................................................78
xvii
Table of Figures
1.1 The Stiles-Crawford Effect ..................................................................................................1
2.1 The Stiles-Crawford Curve ..................................................................................................4
2.2 Cone Photoreceptor Model for the Waveguide Theory ......................................................5
2.3 Optical SCE Curve ...............................................................................................................8
2.4 Direct Illumination and Observation of the Eye ..................................................................9
2.5 Annular Illumination of the Eye in a Commercial Fundus Camera ....................................10
2.6 Illuminated Area of the Retina in Annular Illumination ....................................................10
2.7 System Diagram of a Commercial Fundus Camera ...........................................................11
2.8 Prim System in a Commercial Fundus Camera ..................................................................11
3.1 Diagram of an Adaptive Optics Imaging System ...............................................................14
3.2 Diagram of a Wavefront Sensor and Deformable Mirror ..................................................15
3.3 Retinal Image with Individual Cone Photoreceptor Directionality ....................................16
3.4 Normal and Annular Beam PSF Comparison .....................................................................17
3.5 Retinal Image with Average and Individual Cone Photoreceptor Directionality ..............18
3.6 Cone Outer-Segments Numerical Models .........................................................................19
5.1 Diffraction vs Aberrations Effects in the Eye .....................................................................25
5.2 Spectral Reflectance of the Eye Fundus ............................................................................26
5.3 Maxwellian View System ..................................................................................................27
5.4 Field of View Depending on Lens Distance and Diameter .................................................29
5.5 Magnification and Field of View .......................................................................................31
5.6 Total Field of View ............................................................................................................31
6.1 sCMOS Rolling Shutter Mode ............................................................................................37
6.2 sCMOS Global Shutter Mode ............................................................................................37
7.1 Image of the Graphite Arrow Obtained with the System ..................................................40
7.2 Image of the Black Target Obtained Using the Thin Optical Fibre ....................................41
7.3 First Visualization of Blood Vessels ...................................................................................43
7.4 First Visualization of Possible Cone Photoreceptors .........................................................44
7.5 Retinal Image Obtained Using Polarizer Filters .................................................................45
7.6 First Visualization of Parafoveal Cone Photoreceptors .....................................................46
8.1 Diagram of the Final System .............................................................................................50
9.1 11.5 and 12 Times Magnified Images of the Optic Disc ....................................................54
9.2 Set of Images of Large Blood Vessels ................................................................................54
9.3 2 Images of Blood Vessels .................................................................................................55

xviii
9.4 Digitally Enhanced Images of the Optic Disc .....................................................................56
9.5 Digitally Enhanced Images of the Cone Mosaic and Capillaries ........................................56
9.6 Digitally Enhanced Image of the Cone Mosaic ..................................................................57
9.7 to 9.9 Directionality Measurements Results ......................................................................58
A.1 Photograph of the System with the Telescope Configuration ..........................................74
A.2 Photographs of the System Under Developement ...........................................................74
A.3 Photograph of the Experimental Setup Using the Thin Optical Fibre ...............................75
A.4 Setup Which Produced the First Images of Cones at Large Eccentricities ........................75
A.5 to A.7 Photographs of the Final System ............................................................................76
A.8 to A.14 Cone Mosaic and Capillary Images .......................................................................78

xix
Table of Tables
8.1 Distance From Each Element in the System to the Previous One .....................................51
A.1 Maximum Permissible Radiant Power ..............................................................................71
A.2 Parameters to be Used in Table A.1 .................................................................................71
A.3 Key Specifications of the Andor Neo 5.5 sCMOS Image Sensor ........................................73

xx
1
1. Introduction
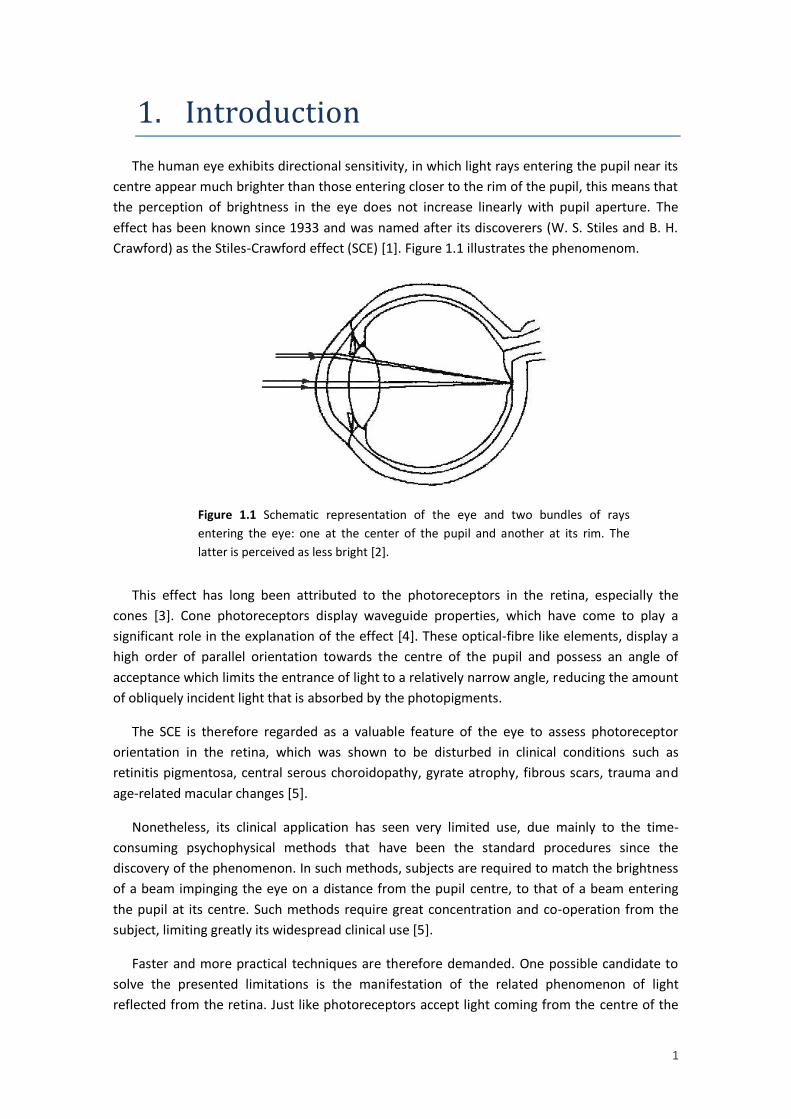
The human eye exhibits directional sensitivity, in which light rays entering the pupil near its
centre appear much brighter than those entering closer to the rim of the pupil, this means that
the perception of brightness in the eye does not increase linearly with pupil aperture. The
effect has been known since 1933 and was named after its discoverers (W. S. Stiles and B. H.
Crawford) as the Stiles-Crawford effect (SCE) [1]. Figure 1.1 illustrates the phenomenom.
0.1.1 Stiles-Crawford Effect
This effect has long been attributed to the photoreceptors in the retina, especially the
cones [3]. Cone photoreceptors display waveguide properties, which have come to play a
significant role in the explanation of the effect [4]. These optical-fibre like elements, display a
high order of parallel orientation towards the centre of the pupil and possess an angle of
acceptance which limits the entrance of light to a relatively narrow angle, reducing the amount
of obliquely incident light that is absorbed by the photopigments.
The SCE is therefore regarded as a valuable feature of the eye to assess photoreceptor
orientation in the retina, which was shown to be disturbed in clinical conditions such as
retinitis pigmentosa, central serous choroidopathy, gyrate atrophy, fibrous scars, trauma and
age-related macular changes [5].
Nonetheless, its clinical application has seen very limited use, due mainly to the time-
consuming psychophysical methods that have been the standard procedures since the
discovery of the phenomenon. In such methods, subjects are required to match the brightness
of a beam impinging the eye on a distance from the pupil centre, to that of a beam entering
the pupil at its centre. Such methods require great concentration and co-operation from the
subject, limiting greatly its widespread clinical use [5].
Faster and more practical techniques are therefore demanded. One possible candidate to
solve the presented limitations is the manifestation of the related phenomenon of light
reflected from the retina. Just like photoreceptors accept light coming from the centre of the
Figure 1.1 Schematic representation of the eye and two bundles of rays
entering the eye: one at the center of the pupil and another at its rim. The
latter is perceived as less bright [2].

2
pupil more efficiently, they also reflect it more intensely towards the centre of the pupil [6];
this is called the optical Stiles-Crawford effect (OSCE).
By taking advantage of this optical effect, several techniques have been developed in the
last few years; such techniques form what is now termed as fundus reflectometry. Among
these methods one may highlight a few: scanning laser ophthalmoscopy [7], imaging
spectography [8], optical coherence tomography [9] and retinal photography. The last of these
makes use of a fundus camera, which in essence is an ophthalmoscope that redirects the
observation light to the film or electronic sensor of a camera.
In this project (developed within the Advanced Optical Imaging Group of the School of
Physics, University College Dublin) an in-house built fundus camera is developed and optimized
for a minimal impact of aberrations at different angles and wavelengths of illumination of the
retina, with the purpose of exploring its directionality on the group members, who will serve as
test subjects.

3
2. Theoretical Background
The eye is the image forming device of the human body. It conveys a comprehensive visual
perception of the outer world. Information from exterior objects comes in the form of millions
of light rays (or photons) with no particular direction or orientation, the eye gathers those rays
through its aperture, the pupil, and bends them with resort to strong lenses, the cornea and
crystalline lens, focusing a previously disorganized bundle in one single point on the image
sensing layer of the eye, the retina.
The retina is a neuronal tissue layer that covers the posterior wall of the eye, the fundus. It
is formed of several intricate intra-layers, one of which is light sensitive, just like the film or
electronic sensor of a camera. This layer is formed by tube like photoreceptors which are
neurons very generically made up of an inner and an outer segment. Light enters the
photoreceptors on the inner segment and is directed towards the outer segment, where it
interacts with the photopigments initiating the phototransduction process.
Two types of photoreceptors may be distinguished: cones and rods. Their names come
from their outer segments shape, but their differences apart from shape are responsible
respectively for: daylight or photopic vision and low light or scotopic vision.
2.1 The Stiles-Crawford Effect
The directional sensitivity of the eye, or SCE, was shown to be retinal in origin [3]. The peak
of this sensitivity to light entering the pupil is typically located at approximately 0.2 mm
superior and 0.5 mm nasal to its centre (𝑑𝑚𝑎𝑥) [10] and is traditionally measured in terms of:
𝜂(𝑑, 𝜆) =𝑎𝑚𝑜𝑢𝑛𝑡 𝑜𝑓 𝑙𝑖𝑔ℎ𝑡 𝑒𝑛𝑡𝑒𝑟𝑖𝑛𝑔 𝑎𝑡 𝑡ℎ𝑒 𝑐𝑒𝑛𝑡𝑒𝑟 𝑜𝑓 𝑡ℎ𝑒 𝑝𝑢𝑝𝑖𝑙 (𝑑 = 0)
𝑎𝑚𝑜𝑢𝑛𝑡 𝑜𝑓 𝑙𝑖𝑔ℎ𝑡 𝑒𝑛𝑡𝑒𝑟𝑖𝑛𝑔 𝑎𝑡 𝑎 𝑑𝑖𝑠𝑡𝑎𝑛𝑐𝑒 𝑑 ≠ 0 𝑡ℎ𝑎𝑡 𝑝𝑟𝑜𝑑𝑢𝑐𝑒𝑠 𝑡ℎ𝑒 𝑠𝑎𝑚𝑒 𝑠𝑡𝑖𝑚𝑢𝑙𝑢𝑠
With a Gaussian fit of the form:
𝜂(𝑟) = 𝜂𝑚𝑎𝑥10𝑝(𝜆)(𝑟−𝑟max)2
Or a parabola fit by taking its logarithm and normalizing:
log(𝜂(𝑟)) = log(𝜂𝑚𝑎𝑥) − 𝑝(𝜆)(𝑟 − 𝑟max)2
log(𝜂(𝑟))
log(𝜂𝑚𝑎𝑥)= −𝑝(𝜆)(𝑟 − 𝑟max)2
Where 𝑝, the width of the parabola, is a measure of the directional sensitivity (larger 𝑝
values correspond to narrower parabolas and greater directional sensitivity) and on average
equals 0.05 mm−2; 𝑟 is the distance to the centre of the pupil.
A representation of the parabola fit is shown in figure 2.1:
4
0.1.1 THe Stiles-Crawford Curve
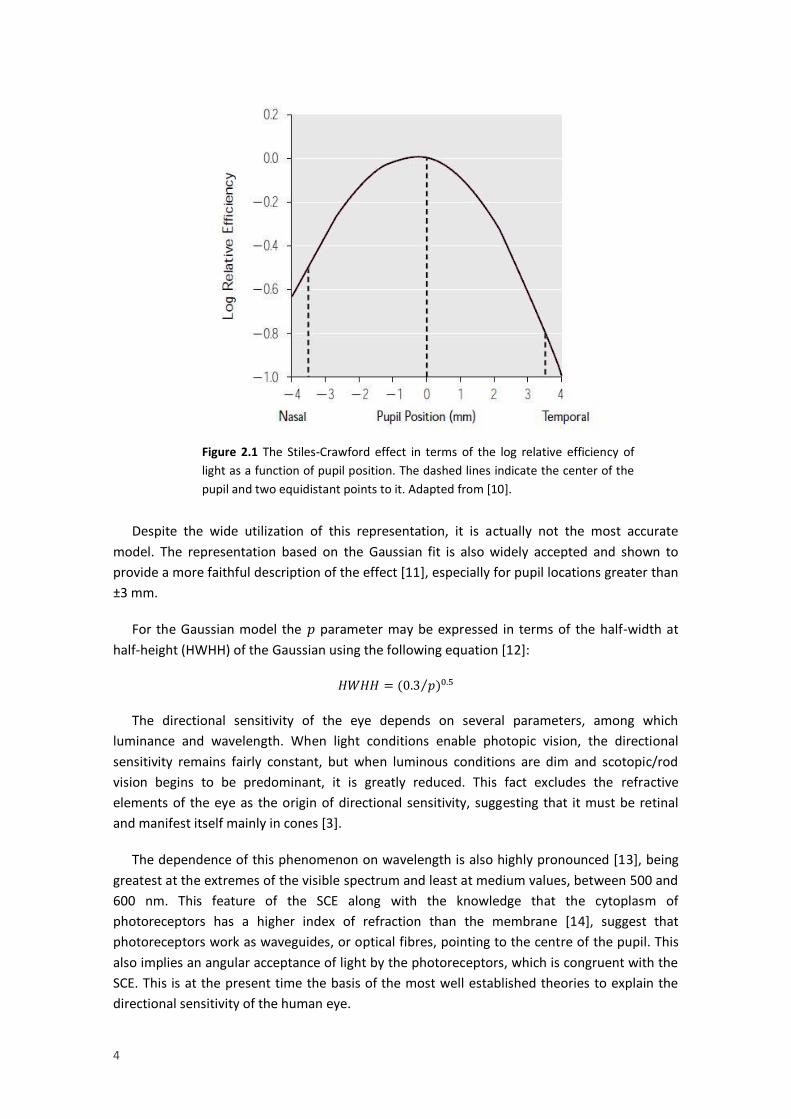
Despite the wide utilization of this representation, it is actually not the most accurate
model. The representation based on the Gaussian fit is also widely accepted and shown to
provide a more faithful description of the effect [11], especially for pupil locations greater than
±3 mm.
For the Gaussian model the 𝑝 parameter may be expressed in terms of the half-width at
half-height (HWHH) of the Gaussian using the following equation [12]:
𝐻𝑊𝐻𝐻 = (0.3 𝑝⁄ )0.5
The directional sensitivity of the eye depends on several parameters, among which
luminance and wavelength. When light conditions enable photopic vision, the directional
sensitivity remains fairly constant, but when luminous conditions are dim and scotopic/rod
vision begins to be predominant, it is greatly reduced. This fact excludes the refractive
elements of the eye as the origin of directional sensitivity, suggesting that it must be retinal
and manifest itself mainly in cones [3].
The dependence of this phenomenon on wavelength is also highly pronounced [13], being
greatest at the extremes of the visible spectrum and least at medium values, between 500 and
600 nm. This feature of the SCE along with the knowledge that the cytoplasm of
photoreceptors has a higher index of refraction than the membrane [14], suggest that
photoreceptors work as waveguides, or optical fibres, pointing to the centre of the pupil. This
also implies an angular acceptance of light by the photoreceptors, which is congruent with the
SCE. This is at the present time the basis of the most well established theories to explain the
directional sensitivity of the human eye.
Figure 2.1 The Stiles-Crawford effect in terms of the log relative efficiency of
light as a function of pupil position. The dashed lines indicate the center of the
pupil and two equidistant points to it. Adapted from [10].
5
2.2 The Waveguide Theory
A waveguide is a structure which confines light by means of total internal reflection,
allowing its almost lossless propagation across distances. One such example are optical fibres.
To allow for total internal reflection, optical fibres are made up of a core with a high refractive
index and a cladding of lower refractive index. Light propagates in the core by being reflected
at the cladding at an angle greater than the critical angle required for total internal reflection.
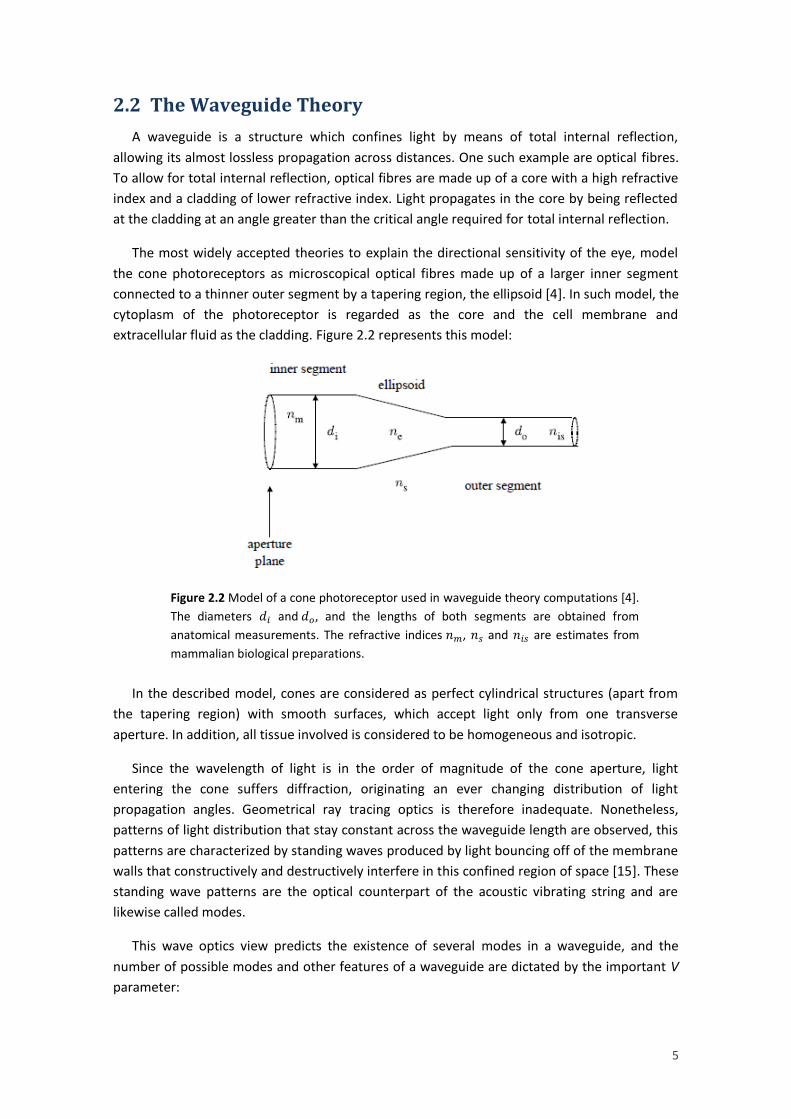
The most widely accepted theories to explain the directional sensitivity of the eye, model
the cone photoreceptors as microscopical optical fibres made up of a larger inner segment
connected to a thinner outer segment by a tapering region, the ellipsoid [4]. In such model, the
cytoplasm of the photoreceptor is regarded as the core and the cell membrane and
extracellular fluid as the cladding. Figure 2.2 represents this model:
0.1 Cone Photoreceptor Model
In the described model, cones are considered as perfect cylindrical structures (apart from
the tapering region) with smooth surfaces, which accept light only from one transverse
aperture. In addition, all tissue involved is considered to be homogeneous and isotropic.
Since the wavelength of light is in the order of magnitude of the cone aperture, light
entering the cone suffers diffraction, originating an ever changing distribution of light
propagation angles. Geometrical ray tracing optics is therefore inadequate. Nonetheless,
patterns of light distribution that stay constant across the waveguide length are observed, this
patterns are characterized by standing waves produced by light bouncing off of the membrane
walls that constructively and destructively interfere in this confined region of space [15]. These
standing wave patterns are the optical counterpart of the acoustic vibrating string and are
likewise called modes.
This wave optics view predicts the existence of several modes in a waveguide, and the
number of possible modes and other features of a waveguide are dictated by the important V
parameter:
Figure 2.2 Model of a cone photoreceptor used in waveguide theory computations [4].
The diameters 𝑑𝑖 and 𝑑𝑜, and the lengths of both segments are obtained from
anatomical measurements. The refractive indices 𝑛𝑚, 𝑛𝑠 and 𝑛𝑖𝑠 are estimates from
mammalian biological preparations.
6
𝑉 = 𝜋𝑑/𝜆(𝑛12 − 𝑛2
2)0.5
Where 𝑑 is the diameter of the waveguide, 𝜆 the wavelength of light, and 𝑛1 and 𝑛2 are the
indices of refraction of the core and cladding respectively.
The energy propagating in a mode exists both inside and outside the photoreceptors. While
lower order modes possess more energy inside than outside, higher order modes have a lower
percentage of their energy within the photoreceptors. Of this energy, only the one contained
within the interior of the photoreceptors will be able to interact with the photopigments. Since
higher order modes are more efficiently excited by greater angles of incidence, as these angles
increase less energy from the trapped light will be interacting with the photopigments and
contributing to the brightness sensation.
Although the described approach seems to provide a satisfactory explanation to the
phenomenon, one must bear in mind that those are rather simplistic abstract models that
make a series of compromises, yielding a formulation that is quite far from the real biological
situation [16]. As a consequence, no definitive model of the SCE has yet been established.
The V parameter of the waveguide model is the main factor contributing to the wavelength
dependence of the SCE, i.e. the SCE parameter 𝑝. An additional effect related to the
wavelength of light is the shift in perceived hue and saturation of a monochromatic beam of
light when it enters the pupil towards its rim. Such observation has been named chromatic SCE
or SCE of the second kind (SCE-2).
2.3 The SCE of the Second Kind
As observed by W. S. Stiles in 1937, light entering the eye pupil at a distance from its centre
will not only seem less bright, it will also change its apparent color [17].
This phenomenon is characterized by a shift of the hue of short and long wavelengths to
the hue of longer wavelengths, whereas medium wavelengths shift their perceived hue to
those of shorter wavelengths. Moreover, supersaturation occurs in wavelengths greater than
about 515 nm and desaturation in wavelengths between 515 and 480 nm [18]. The magnitude
of the shift and the point at which it reverses direction differ greatly between individuals.
The perception of a specific color hue by the human eye is obtained from the relative
amount of photopigment stimuli between each cone type (short, medium and long
wavelength cones) [19]. Therefore, changes in relative photopigment photon absorption
numbers must be the basis for the phenomenon.
Two main factors are thought to influence these numbers: the changing of spectral
sensitivity of cones with changing incident angle and differences in morphology and refractive
indices between the three cone types [20]. As previously stated, when light enters a
photoreceptor at greater angles, higher order modes of propagation are excited. These higher
order modes have less energy inside of the photoreceptor, thus producing less photopigment
photon absorptions and as a consequence a narrowing of the spectral sensitivity of the
photopigment takes place. This process is called self-screening. On the other hand, if the three
cone types exhibit systematic differences between each other, then its waveguiding properties
7
will differ as well, resulting in different numbers of photon absorptions between cone types for
varying incident angles.
2.4 Biological Function
The SCE can be regarded as a reduction of the effective diameter of the pupil – an
apodization –, a gradual reduction in opposition to a sharp cutoff provided by the iris. This
effect has the consequence of reducing off-axis rays entering the eye, thus reducing the
amount of aberrated rays contributing to form an image. Although this effect is thought to give
little contribution to image quality in eyes with normal focusing ability, it was shown to provide
greater image quality in accommodation lag situations or in ametropic eyes [21].
The several elements of the eye, from the cornea to the fundus itself, are known to
produce scatter phenomena. These events contribute to the glare we see around luminous
points of light. By being able to select light that comes from the centre of the pupil, the retina
filters out to some extent the scattered photons that deteriorate image quality.
A further advantage of this pupil apodization comes from the fact that it manifests mainly
in cone photoreceptors. Since rods require large pupil diameters to maximally absorb larger
amounts of light whereas cones provide more acute images with non-aberrated, non-scattered
light, the SCE provides a clever means to allow optimum rod and cone simultaneous
functioning in medium light conditions (mesoscopic vision), by reducing the pupil effective
diameter for cones while maintaining the real pupil dimensions for rods [12].
An additional possible purpose of waveguiding in the retina, is that it might be
advantageous to have the photopigments packed in a smaller region of space, this way
photopigment production and maintenance may be more cost efficient while simultaneously
allowing for an equivalent photon absorption of a larger area.
2.5 The Optical SCE
Most of the light reaching the retina is absorbed either by the photopigments, contributing
to forming an image, or by other elements in the fundus such as the retinal pigment
epithelium (RPE) or the choroid. Nonetheless, a very small percentage of the light reaching the
retina is always reflected back to the pupil [6].
The reflectivity of the retina is explained by two main processes: backscattering and
photoreceptor waveguiding [22]. The first happens as a result of those photons that reach the
extracellular space in between photoreceptors and are scattered back, resulting in a relatively
uniform distribution of reflected light at the pupil plane with no considerable directional
component which produces a constant background in the reflectance profile. The second, is
due to the recapture of light that is reflected at the RPE after fully traversing the
photoreceptors without being absorbed by the photopigments, being posteriorly redirected
towards the pupil centre and producing a reflectance profile similar to that of the SCE.
This last feature of the reflectance of the retina, clearly reflects the directionality of the eye
and constitutes a measure of the SCE, it is therefore called the optical Stiles-Crawford effect, in
contrast to the psychophysical SCE. It also suggests that better measurements may be carried
8
by bleaching the photopigments with a relatively strong light source, thus reducing the amount
of absorptions of the incident beam by the photopigments.
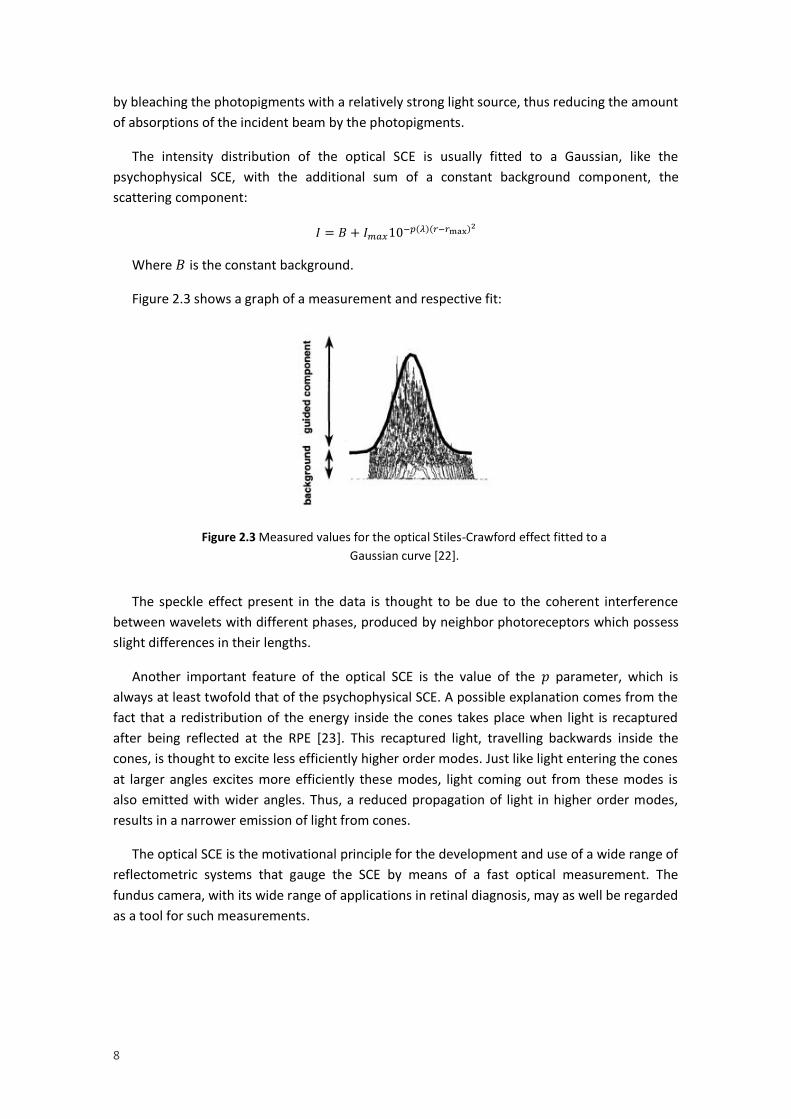
The intensity distribution of the optical SCE is usually fitted to a Gaussian, like the
psychophysical SCE, with the additional sum of a constant background component, the
scattering component:
𝐼 = 𝐵 + 𝐼𝑚𝑎𝑥10−𝑝(𝜆)(𝑟−𝑟max)2
Where 𝐵 is the constant background.
Figure 2.3 shows a graph of a measurement and respective fit:
0.1 Optical SCE curve
The speckle effect present in the data is thought to be due to the coherent interference
between wavelets with different phases, produced by neighbor photoreceptors which possess
slight differences in their lengths.
Another important feature of the optical SCE is the value of the 𝑝 parameter, which is
always at least twofold that of the psychophysical SCE. A possible explanation comes from the
fact that a redistribution of the energy inside the cones takes place when light is recaptured
after being reflected at the RPE [23]. This recaptured light, travelling backwards inside the
cones, is thought to excite less efficiently higher order modes. Just like light entering the cones
at larger angles excites more efficiently these modes, light coming out from these modes is
also emitted with wider angles. Thus, a reduced propagation of light in higher order modes,
results in a narrower emission of light from cones.
The optical SCE is the motivational principle for the development and use of a wide range of
reflectometric systems that gauge the SCE by means of a fast optical measurement. The
fundus camera, with its wide range of applications in retinal diagnosis, may as well be regarded
as a tool for such measurements.
Figure 2.3 Measured values for the optical Stiles-Crawford effect fitted to a
Gaussian curve [22].

9
2.6 The Fundus Camera
As the name indicates, a fundus camera is a device designed with the purpose of acquiring
images of the eye fundus and recording them in some way. In order to accomplish this, light
must be projected on the fundus and regathered after bouncing off of its surface, just like in
any photograph. Such endeavor has however a few particularities in the case of the fundus of
the eye: light must enter and leave the “place” where the subject of interest is, by the same
relatively small “hole”, the pupil; the eye has its own refractive system which bends light
entering and leaving the “hole”; finally, the subject of interest, the retina, reflects very little
light when compared with the other optical elements present in the process, either those from
the camera system or from the eye itself [24].
A very simple way to photograph the eye fundus is to take a portrait photograph with a
normal camera using a flash, the famous red eye effect is no more than the choroid reflection
from the eye fundus. But when trying to do the same at a closer, more useful distance, all we
get is a black round hole. This happens because the flash is imaged in a certain region of the
fundus, instead of illuminating the whole fundus (due to the refraction of the eye), while what
the observer sees through the patient’s pupil is the image of another region of the patient’s
fundus [25]. Figure 2.4 illustrates the situation.
0.1 Direct Illumination of the Eye
In order to solve this issue, the light source must be made collinear or near collinear with
the observer, this way the observer will be seeing the illuminated area of the patient’s eye. On
the other hand, the illumination beam and the observation (imaging) beam must be separated
on the cornea surfaces and on the crystalline lens anterior surface, in order to prevent light of
the illumination beam from being reflected at those surfaces and interfere with the imaging
beam [26].
These two apparent incompatible requirements may be met by the use of an annulus
mirror and a convex lens, or objective lens. The two elements are placed such that the annulus
mirror lies in the pupil conjugate plane, in which the patient’s pupil is magnified. The light
source is then shaped into an annulus by a diaphragm, imaged by another set of lens at the
annulus mirror and reimaged at the pupil plane [24]. Light will thus enter the eye through the
periphery of the pupil and exit at its centre, as shown in figure 2.5, this way both illumination
and observation beams will be separated, while maintaining collinearity.
Figure 2.4 The region that the observer is able to see stays dark, while the light
from the illuminated region is reflected towards the source [25].

10
0.2 Annular Illumination of the Eye
Therefore, the inner circle of the annulus delimits the observation region at the pupil plane,
the area from which the observation beam comes out with the visual information of the
fundus. This region is also called the total entrance pupil (TEP), because it encloses the total
area of each individual entrance pupil, each of which is determined by the eccentricity angle of
the fundus region under study and the parameters of the lens system: refractive indices,
thicknesses and curvatures [27].
The annulus inner circle also determines how much of the peripheral zone of the fundus is
illuminated: with smaller diameters, larger eccentric angles become illuminated. However, by
reducing this diameter we are concomitantly reducing the total entrance pupil. The size of the
eye pupil on the other hand, dictates how much of the central region of the fundus gets to be
illuminated: with larger pupil diameters, smaller eccentric angles become illuminated. Figure
2.6 clarifies these issues.
After leaving the eye, the observation beam reenters the objective lens which forms an
aerial image of the retina at its focal plane, behind the annulus mirror, with the imaging beam
Figure 2.5 Diagram showing light entering the eye at the periphery of the pupil
and leaving at its center [28].
Figure 2.6 Diagram of the illumination
of the fundus. If the pupil is enlarged, a
larger area of the posterior pole will be
illuminated. On the other hand, by
enlarging the TEP, less peripheral
fundus regions will be illuminated. CW
stands for corneal window, the inner
circle of the annulus at the corneal
plane. [27]

11
passing through its hole. If the fundus camera allows for wide angle imaging, a lens or set of
lenses named field lens may follow the objective lens to help bring the aerial image to focus in
a linear plane by choice of appropriate individual entrance pupils. Finally, a zoom lens which
the observer operates focuses on the aerial image of the retina, creating an image on the film
of the camera. An additional astigmatism correction lens is also commonly present. Figure 2.7
shows a diagram of such a system.
To allow the camera operator to focus the retinal image on the camera film, a mirror and a
prism are used [28]. The mirror stands in front of the film making a 45º angle with it, deviating
the image upwards in a 90º angle. The prism is placed above the mirror such that the image is
once again redirected in a 90º angle towards the observer eye. The base of the prism is placed
precisely at the same distance from the mirror and making the same angle with it, as the film
does. The operator should therefore focus the image of the retina in the base of the prism. In
order to prevent the operator’s eye from accommodating on an image formed in a plane
which is not in the base of the prism, etched black lines are printed in a glass which lies in this
plan. This lines form the focusing reticle. The operator must focus his eyes on this reticle
before focusing the retinal image with the zoom lens. When both the focusing reticle and the
retinal image are seen in focus, the operator presses the camera shutter and the mirror is
raised allowing the image to fall on the film of the camera, like in an SLR camera. Figure 2.8
exemplifies the process.
Figure 2.8 Illustration of the mirror and prism system used in the camera. [28]
Figure 2.7 Simplified diagram of the optics
of a fundus camera. The camera film lies in
point 6. 12 is the light source, 10 the
diaphragm, 3 the annulus mirror, 2 the
objective lens, 4 the focusing reticle and 5
the zoom lens. [24]

12

13
3. State of the art
A variety of techniques have been employed by several authors to measure the
directionality of the photoreceptors in the human retina. Gao et al. [9] explored the
directionality of different layers in the retina through the use of optical coherence tomography
(OCT), Gorrand & Delori [32] developed a reflectometric technique that measures
photoreceptor alignment by gauging the reflected intensity at the pupil, Zagers et al. [8]
measured foveal spectral reflectance and cone directionality using an imaging spectrograph.
Although part of the content of the previous section may already be regarded as state of
the art, in this section three specific works with major relevance to the project are briefly
analyzed. The first of those, borrows a technique from astronomy to obtain high-resolution
images with a fundus camera; the other two were developed within the same research group
as this project was developed: a scanning laser ophthalmoscope technique and a numerical
analysis approach.
3.1 Adaptive optics and retinal imaging
J. Liang, D. R. Williams, and D. T. Miller have successfully used adaptive optics to obtain
high-resolution images of the in-vivo human retina to an extent that was only possible to date
in ex-vivo samples [29]. By using this technology, A. Roorda and D. R. Williams have studied the
optical fibre properties of individual human cones [30].
The concept behind adaptive optics is to correct the natural aberrations of the human eye
allowing for higher resolution images of the retina. The human eye is not a perfect focusing
device, even with the most acute of visions it presents a host of higher order aberrations that
blur vision and reduce the quality of images of the retina. When in bright light conditions, the
eye can afford to reduce pupil size allowing a reduction of these aberrations; nonetheless, a
smaller pupil size also results in less spatial resolution due to diffraction effects. Thus, by
reducing aberrations of the eye while keeping large pupil sizes, high resolution images of the
retina may be obtained and vision acuity may be further enhanced.
The adaptive optics module integrated in the fundus camera developed by Roorda and
Williams, is made up of two phases: the wave-front sensing and the wave-front compensation.
Figure 3.1 illustrates the configuration of these elements within the camera:

14
The first phase comprises a Hartmann–Shack wave-front sensor, which consists of an array
of 217 small lenses (lenslets) conjugate to the pupil plane, each lenslet with a diameter of 0.5
mm, a centre-to-centre distance of 0.4 mm and a focal length of 97 mm. Behind the lenslet
array lies a scientific-grade CCD with 512×512 pixels. A laser beam is focused by the eye onto
the retina, which in turn reflects some of the light towards the pupil; this light is then gathered
by the lenslet array with each lenslet forming an image of the wave-front on the CCD that lies
behind. The displacement of each image gives the local wave-front slope, which is then used to
construct the total wave-front slope using a least squares fit.
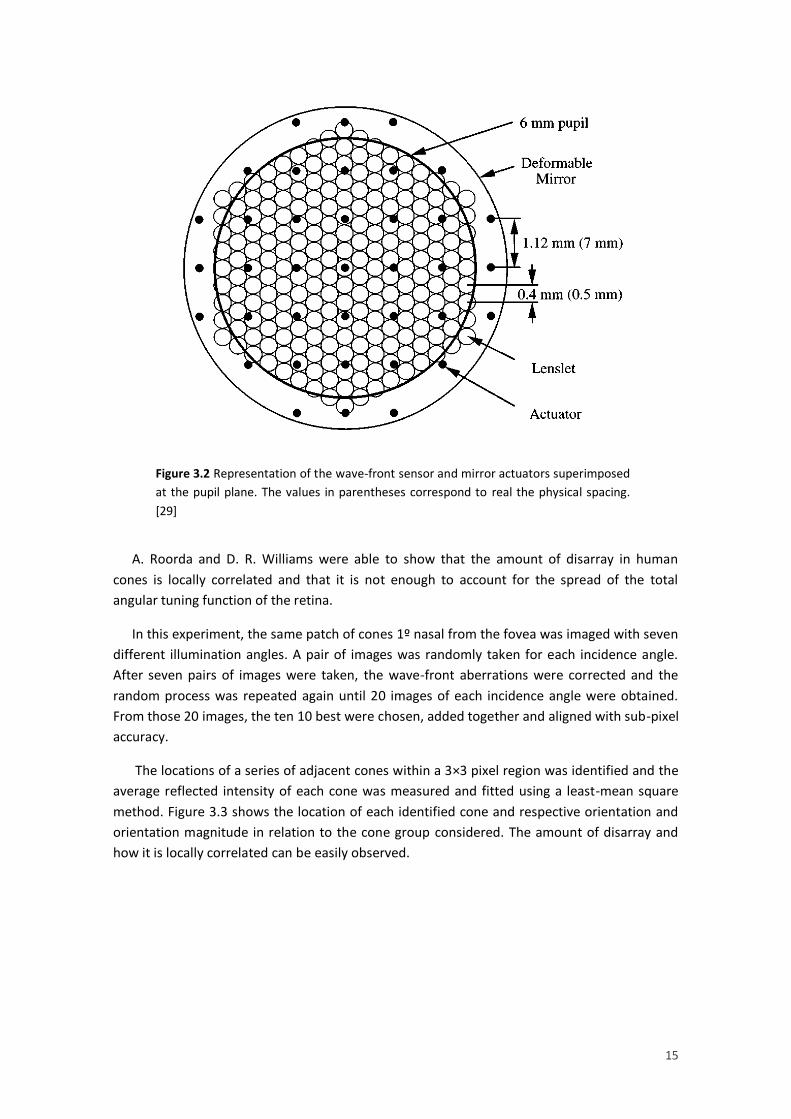
The second phase of the wave-front correction module comprises one deformable mirror
with 37 actuators, each actuator 7 mm apart and producing a local deformation of ±2 µm in
4096 steps (12 bits). The mirror lies on the conjugate plane of the pupil, which is magnified
6.25 times on the mirror plane, translating the actuator spacing to 1.12 mm in the pupil plane.
Light coming from the eye is reflected by the mirror in its flat configuration towards the
sensor, which is also in the conjugate plane of the mirror, the sensor and computer measure
the wave-front aberration and compute the required mirror deformation. This information is
then sent to the mirror actuators completing a closed-loop circuit. After corrected by the
proper mirror deformation, a high resolution image of the retina is captured. Figure 3.2 shows
a superimposed diagram of both wave-front sensor and deformable mirror.
Figure 3.1 Diagram of the optical system used. [29]
15
A. Roorda and D. R. Williams were able to show that the amount of disarray in human
cones is locally correlated and that it is not enough to account for the spread of the total
angular tuning function of the retina.
In this experiment, the same patch of cones 1º nasal from the fovea was imaged with seven
different illumination angles. A pair of images was randomly taken for each incidence angle.
After seven pairs of images were taken, the wave-front aberrations were corrected and the
random process was repeated again until 20 images of each incidence angle were obtained.
From those 20 images, the ten 10 best were chosen, added together and aligned with sub-pixel
accuracy.
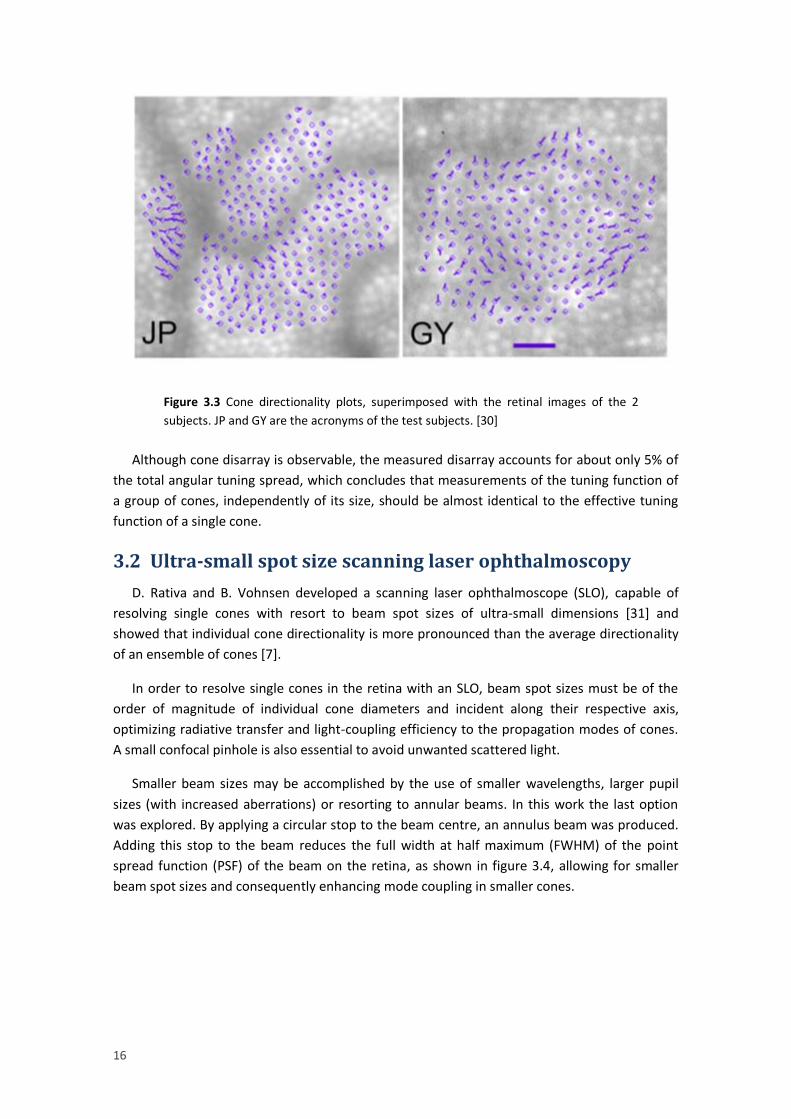
The locations of a series of adjacent cones within a 3×3 pixel region was identified and the
average reflected intensity of each cone was measured and fitted using a least-mean square
method. Figure 3.3 shows the location of each identified cone and respective orientation and
orientation magnitude in relation to the cone group considered. The amount of disarray and
how it is locally correlated can be easily observed.
Figure 3.2 Representation of the wave-front sensor and mirror actuators superimposed
at the pupil plane. The values in parentheses correspond to real the physical spacing.
[29]
16
Although cone disarray is observable, the measured disarray accounts for about only 5% of
the total angular tuning spread, which concludes that measurements of the tuning function of
a group of cones, independently of its size, should be almost identical to the effective tuning
function of a single cone.
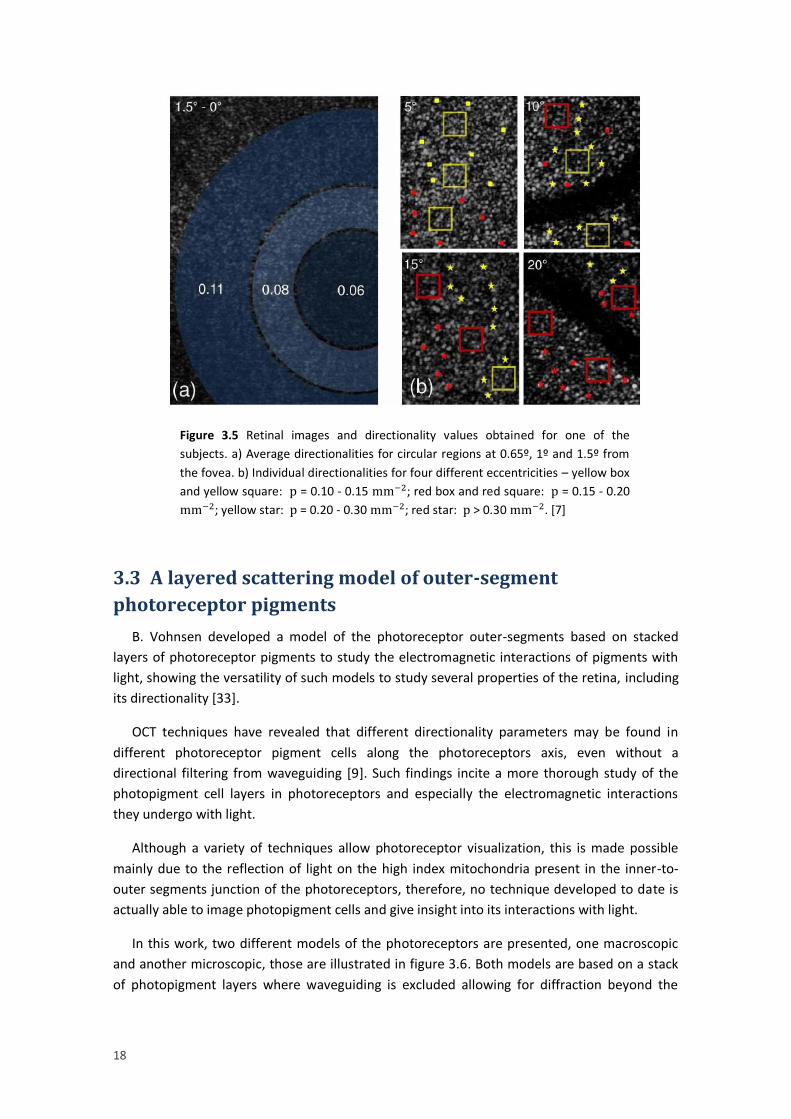
3.2 Ultra-small spot size scanning laser ophthalmoscopy
D. Rativa and B. Vohnsen developed a scanning laser ophthalmoscope (SLO), capable of
resolving single cones with resort to beam spot sizes of ultra-small dimensions [31] and
showed that individual cone directionality is more pronounced than the average directionality
of an ensemble of cones [7].
In order to resolve single cones in the retina with an SLO, beam spot sizes must be of the
order of magnitude of individual cone diameters and incident along their respective axis,
optimizing radiative transfer and light-coupling efficiency to the propagation modes of cones.
A small confocal pinhole is also essential to avoid unwanted scattered light.
Smaller beam sizes may be accomplished by the use of smaller wavelengths, larger pupil
sizes (with increased aberrations) or resorting to annular beams. In this work the last option
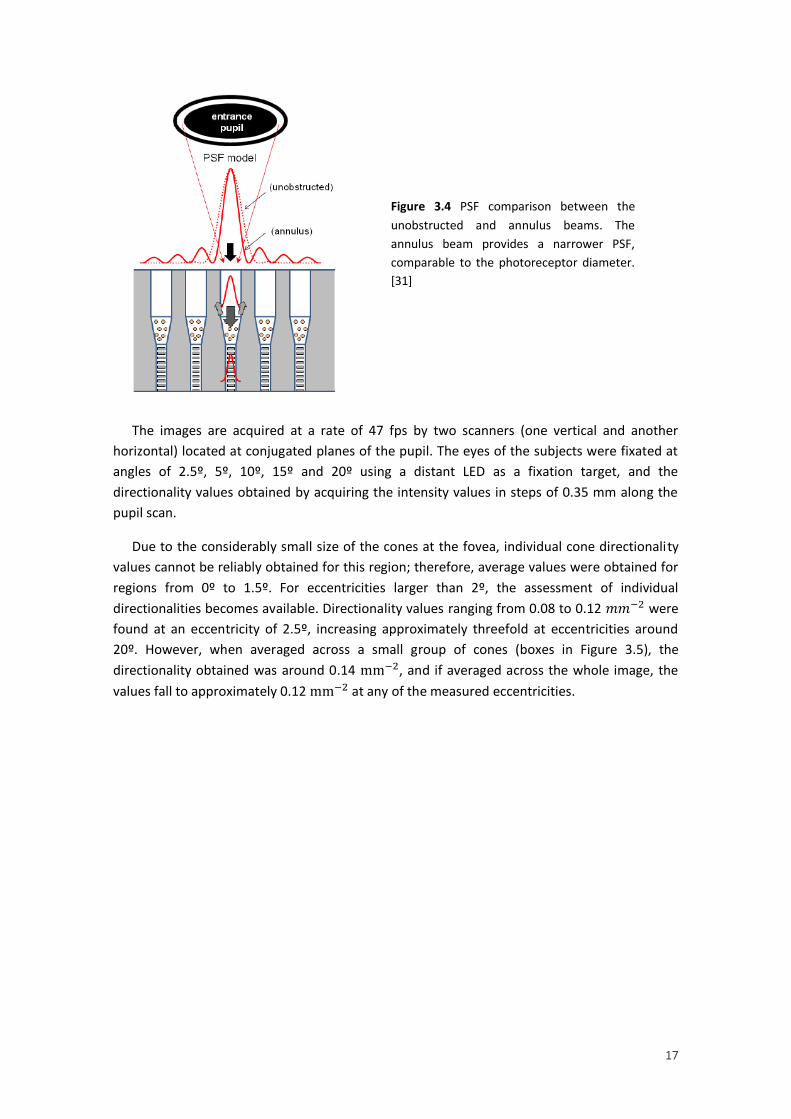
was explored. By applying a circular stop to the beam centre, an annulus beam was produced.
Adding this stop to the beam reduces the full width at half maximum (FWHM) of the point
spread function (PSF) of the beam on the retina, as shown in figure 3.4, allowing for smaller
beam spot sizes and consequently enhancing mode coupling in smaller cones.
Figure 3.3 Cone directionality plots, superimposed with the retinal images of the 2
subjects. JP and GY are the acronyms of the test subjects. [30]
17
The images are acquired at a rate of 47 fps by two scanners (one vertical and another
horizontal) located at conjugated planes of the pupil. The eyes of the subjects were fixated at
angles of 2.5º, 5º, 10º, 15º and 20º using a distant LED as a fixation target, and the
directionality values obtained by acquiring the intensity values in steps of 0.35 mm along the
pupil scan.
Due to the considerably small size of the cones at the fovea, individual cone directionality
values cannot be reliably obtained for this region; therefore, average values were obtained for
regions from 0º to 1.5º. For eccentricities larger than 2º, the assessment of individual
directionalities becomes available. Directionality values ranging from 0.08 to 0.12 𝑚𝑚−2 were
found at an eccentricity of 2.5º, increasing approximately threefold at eccentricities around
20º. However, when averaged across a small group of cones (boxes in Figure 3.5), the
directionality obtained was around 0.14 mm−2, and if averaged across the whole image, the
values fall to approximately 0.12 mm−2 at any of the measured eccentricities.
Figure 3.4 PSF comparison between the
unobstructed and annulus beams. The
annulus beam provides a narrower PSF,
comparable to the photoreceptor diameter.
[31]
18
0.2 Retinal Images With Average and Individual Photoreceptor Directionality
3.3 A layered scattering model of outer-segment
photoreceptor pigments
B. Vohnsen developed a model of the photoreceptor outer-segments based on stacked
layers of photoreceptor pigments to study the electromagnetic interactions of pigments with
light, showing the versatility of such models to study several properties of the retina, including
its directionality [33].
OCT techniques have revealed that different directionality parameters may be found in
different photoreceptor pigment cells along the photoreceptors axis, even without a
directional filtering from waveguiding [9]. Such findings incite a more thorough study of the
photopigment cell layers in photoreceptors and especially the electromagnetic interactions
they undergo with light.
Although a variety of techniques allow photoreceptor visualization, this is made possible
mainly due to the reflection of light on the high index mitochondria present in the inner-to-
outer segments junction of the photoreceptors, therefore, no technique developed to date is
actually able to image photopigment cells and give insight into its interactions with light.
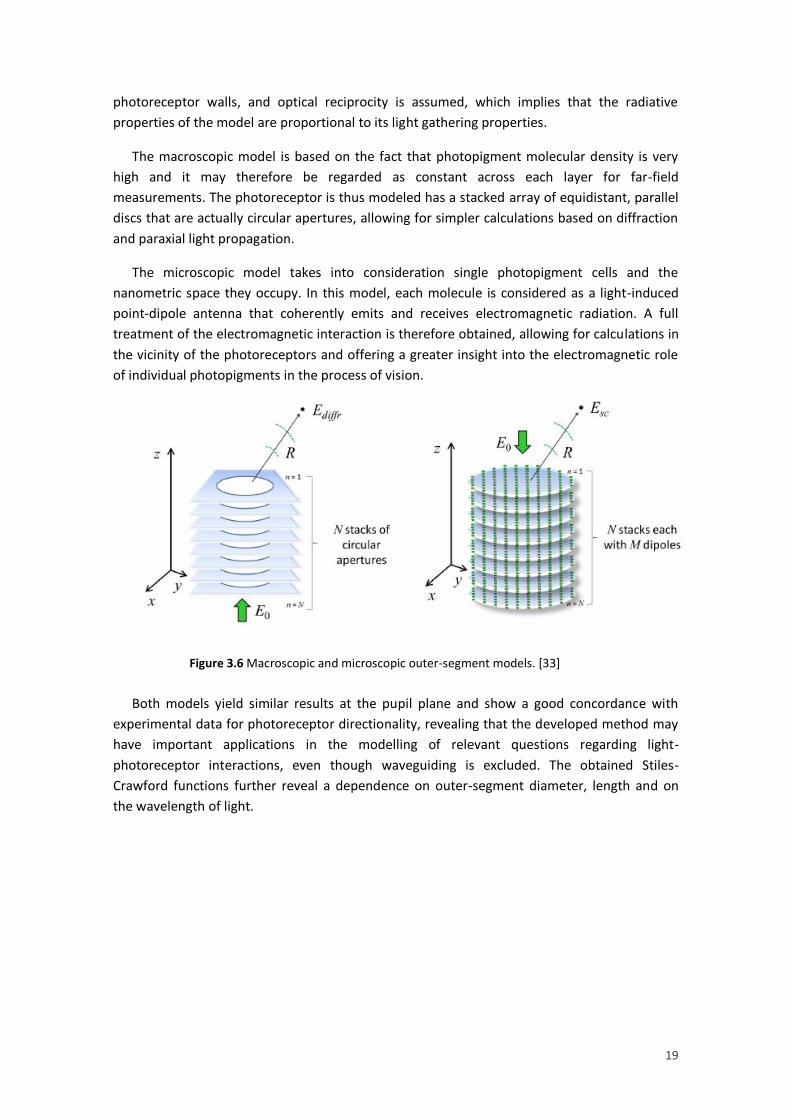
In this work, two different models of the photoreceptors are presented, one macroscopic
and another microscopic, those are illustrated in figure 3.6. Both models are based on a stack
of photopigment layers where waveguiding is excluded allowing for diffraction beyond the
Figure 3.5 Retinal images and directionality values obtained for one of the
subjects. a) Average directionalities for circular regions at 0.65º, 1º and 1.5º from
the fovea. b) Individual directionalities for four different eccentricities – yellow box
and yellow square: p = 0.10 - 0.15 mm−2; red box and red square: p = 0.15 - 0.20
mm−2; yellow star: p = 0.20 - 0.30 mm−2; red star: p > 0.30 mm−2. [7]
19
photoreceptor walls, and optical reciprocity is assumed, which implies that the radiative
properties of the model are proportional to its light gathering properties.
The macroscopic model is based on the fact that photopigment molecular density is very
high and it may therefore be regarded as constant across each layer for far-field
measurements. The photoreceptor is thus modeled has a stacked array of equidistant, parallel
discs that are actually circular apertures, allowing for simpler calculations based on diffraction
and paraxial light propagation.
The microscopic model takes into consideration single photopigment cells and the
nanometric space they occupy. In this model, each molecule is considered as a light-induced
point-dipole antenna that coherently emits and receives electromagnetic radiation. A full
treatment of the electromagnetic interaction is therefore obtained, allowing for calculations in
the vicinity of the photoreceptors and offering a greater insight into the electromagnetic role
of individual photopigments in the process of vision.
Both models yield similar results at the pupil plane and show a good concordance with
experimental data for photoreceptor directionality, revealing that the developed method may
have important applications in the modelling of relevant questions regarding light-
photoreceptor interactions, even though waveguiding is excluded. The obtained Stiles-
Crawford functions further reveal a dependence on outer-segment diameter, length and on
the wavelength of light.
Figure 3.6 Macroscopic and microscopic outer-segment models. [33]

20

21
4. Work plan
This project builds up from the work of two Master’s students who developed a fundus
camera with the purpose of imaging the vessels in the human retina.
In a first phase, the previously conceived setup was reassembled and modified with the aim
of reducing the exposed area of the retina, obtaining a greater magnification and allowing the
visualization of the cone mosaic in the parafovea with reasonable resolution.
Once an acceptable setup has been achieved, preliminary tests of the system were
conducted in order to obtain optimum illumination and focus conditions with a minimal impact
of aberrations and system reflections. High quality retinal images were obtained at this point.
Directionality measurements were then undertaken in group-member eyes for verification
of the system and demonstration of the Stiles-Crawford effect.

22

23
5. Camera Design Considerations
Some considerations must be taken into account when designing a fundus camera, some of
those have already been introduced in a previous section of this dissertation in the context of
a commercial fundus camera. In this section, such considerations are extended and analyzed in
greater detail in the context of the present problem. These concerns became relevant as the
project unfolded.
5.1 Optical Properties of the Eye
The human eye, already introduced in chapters 1 and 2, may be regarded as an intricate
optical system comprising several optical elements: lenses, apertures, a light sensitive device
and its own propagation media which forms a structure to hold everything in place.
Just like in any optical system, a myriad of different variables and characteristics of these
optical elements influence the passage of light through the system and consequently its
performance. This performance affects not only the image formation of the outer world inside
of the eye, but also the opposite process of forming an image of its interior that is captured by
an external imaging device.
5.1.1 Refractive elements
Two main elements form the refractive machinery of the eye: the cornea and the crystalline
lens. When imaging the retina, one must take into consideration the fact that the object under
study is not within direct reach, it lies instead behind these refractive elements that change
the way light reaches it and is reflected from it. The total refractive power of the
unaccommodated eye sums to approximately 60 D which translates to a focal distance of
approximately 16.7 mm [34].
The cornea constitutes two thirds of the refracting power of the eye. It is an aspheric
surface, flattening away from the vertex, made up of several layers with an average refractive
index of 1.376 and a refractive power of approximately 42.2 D. The stroma, the main layer,
constitutes 90% of the cornea and is composed of collagen lamellae disposed in regular arrays
providing transparency and structure. The outer layer of the cornea, the tear film, forms an
oily and aqueous coating that moistens and smoothens the rough surface of the cornea,
maintaining its transparency; due to its considerably fast drying, frequent blinking is essential
to maintain high image quality.
The large difference in refractive indices between the air and the cornea is responsible for
the refraction of light entering the eye, but as a consequence, some of the light is also
reflected from the cornea, approximately 3% of the incoming light. This poses a major
difficulty when imaging the retina, due to the production of considerable veiling glare, as the
retina itself only reflects about 0.1% of the incident light. This disadvantage may be overcome
by asking the test subject to look slightly away from the illumination spot to separate the
reflected light from the image or by taking advantage of the birefringence of the eye.
24
The second lens of the eye, the crystalline lens or simply lens, is responsible for the rest of
the refracting work of the eye. Unlike the cornea, the lens is able to change its refracting
power in order to focus on close objects. For the emmetropic eye, this power change ranges
from 19 D, in an eye focused for infinity, to 30 D, if the eye focuses in an object 10 cm away
from the cornea. This process is called accommodation, and it holds a major influence in the
formation of an image of the retina outside the eye: the distance at which the eye is focusing is
also the distance where an image of the retina will be formed.
The effect of the eye lenses may nonetheless be changed in some individuals. When this
occurs, an eye is said to be ametropic or to have refractive error. This condition influences
retinal image formation depending on the kind of refractive error: if an eye is myopic, either
the fundus is elongated or the refractive power of the eye is abnormally increased, as a result a
retinal image will always be formed closer to the eye instead of at infinity; on the other hand,
if the eye is hypermetropic either its fundus is shortened or the refractive power of the eye is
abnormally reduced and it will be required that the test subject accommodates in order to
produce an image of the retina at infinity; finally, when an eye exhibits astigmatism, the
refractive power of the eye lenses is different depending on its axis, forming a retinal image
which displays a gradual blurring along one of the axis. Refractive errors may be corrected by
the use of lenses that compensate the abnormal power of the eye, and they may be inserted in
the experimental setup or used by the test subject as spectacles.
Another property of the cornea and lens that may be used advantageously in retinal
imaging is the fact that the propagation of light inside them is dependent on the polarization,
this property takes by the name of birefringence and it is due to the regular structures of these
tissues. Thus, linearly polarized light entering the eye will exhibit a change in polarization when
leaving it. This property may be exploited to reduce corneal reflections through the use of
simple polarizer filters; this approach is explored in greater detail later in the text.
5.1.2 Aperture
The aperture stop of the eye is formed by the iris, it lies between the cornea and the
crystalline lens; both the image of its aperture as formed by the cornea and the aperture itself
are commonly called the eye pupil, nonetheless, the former is the one usually measured. As in
other optical systems, the eye pupil controls the amount of light entering the eye: in response
to high intensity levels the pupil constricts to a minimum of less than 2 mm in diameter and
extends up to 8 mm in low light levels [34].
Just like for any other aperture, light passing through the eye pupil is diffracted, this means
that the ability to resolve two points in an image is affected by the size of the pupil. Reducing
the size of the pupil smears out the image of a single point, resulting in poorer resolution; on
the other hand, increased pupil sizes reduce the effects of diffraction, relaying a less smeared
out image of each point in the object resulting in improved resolution [35].
Large pupil sizes should ideally therefore always be desirable; however, this is not the case:
as pupil size increases so does the allowed entrance angle of light into the eye and aberrations
start to settle in. Image formation inside and outside the eye takes place due to the refraction
of light by the lenses of the eye, this refraction is ruled by Snell’s Law which has a sinusoidal
25
dependence, as the angle of the entrance of light into the eye increases the higher orders of
the sine expansion in Snell’s Law start to have an effect and not all the light coming from a
single point of the object will converge onto the same point in the image space, resulting in a
blurred image. This is what is called optical aberration [36].
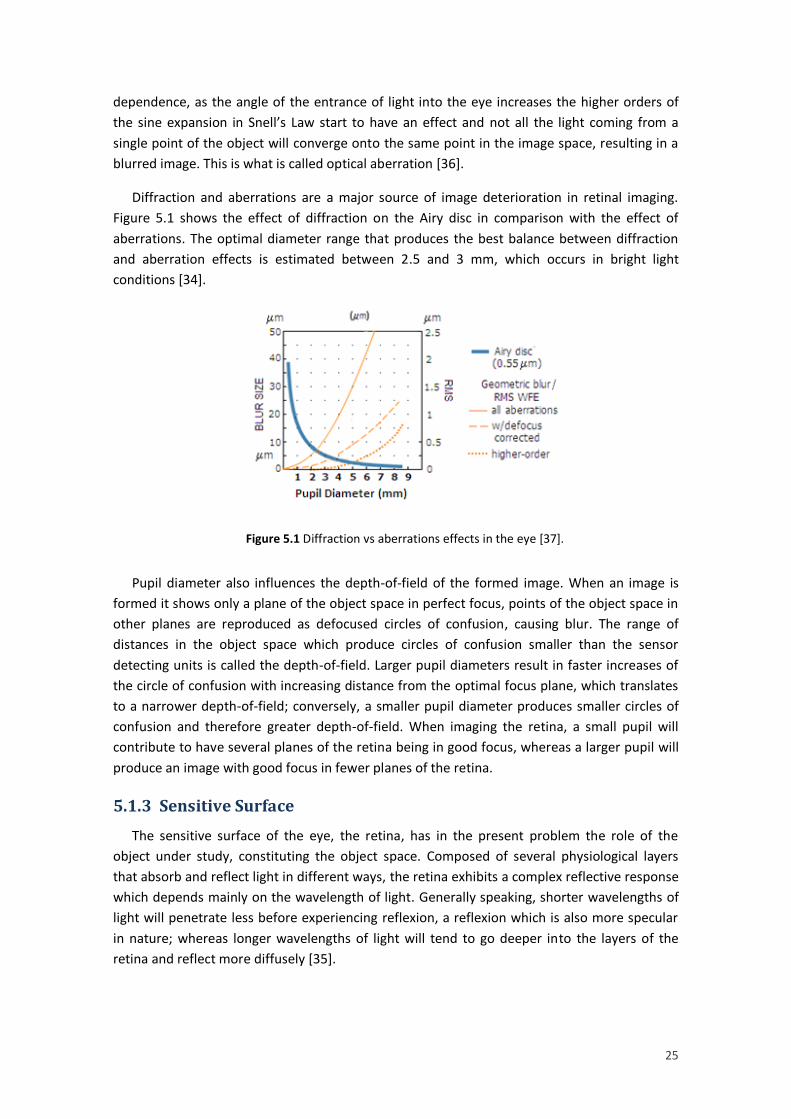
Diffraction and aberrations are a major source of image deterioration in retinal imaging.
Figure 5.1 shows the effect of diffraction on the Airy disc in comparison with the effect of
aberrations. The optimal diameter range that produces the best balance between diffraction
and aberration effects is estimated between 2.5 and 3 mm, which occurs in bright light
conditions [34].
Pupil diameter also influences the depth-of-field of the formed image. When an image is
formed it shows only a plane of the object space in perfect focus, points of the object space in
other planes are reproduced as defocused circles of confusion, causing blur. The range of
distances in the object space which produce circles of confusion smaller than the sensor
detecting units is called the depth-of-field. Larger pupil diameters result in faster increases of
the circle of confusion with increasing distance from the optimal focus plane, which translates
to a narrower depth-of-field; conversely, a smaller pupil diameter produces smaller circles of
confusion and therefore greater depth-of-field. When imaging the retina, a small pupil will
contribute to have several planes of the retina being in good focus, whereas a larger pupil will
produce an image with good focus in fewer planes of the retina.
5.1.3 Sensitive Surface
The sensitive surface of the eye, the retina, has in the present problem the role of the
object under study, constituting the object space. Composed of several physiological layers
that absorb and reflect light in different ways, the retina exhibits a complex reflective response
which depends mainly on the wavelength of light. Generally speaking, shorter wavelengths of
light will penetrate less before experiencing reflexion, a reflexion which is also more specular
in nature; whereas longer wavelengths of light will tend to go deeper into the layers of the
retina and reflect more diffusely [35].
Figure 5.1 Diffraction vs aberrations effects in the eye [37].
26
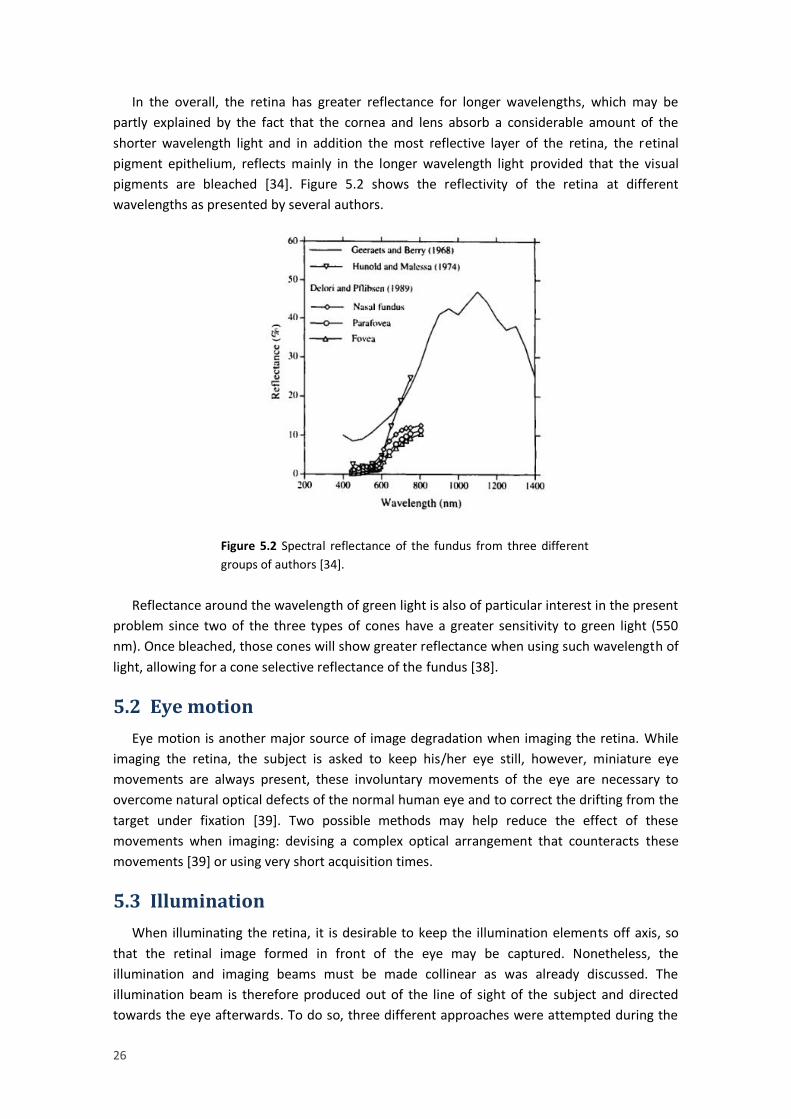
In the overall, the retina has greater reflectance for longer wavelengths, which may be
partly explained by the fact that the cornea and lens absorb a considerable amount of the
shorter wavelength light and in addition the most reflective layer of the retina, the retinal
pigment epithelium, reflects mainly in the longer wavelength light provided that the visual
pigments are bleached [34]. Figure 5.2 shows the reflectivity of the retina at different
wavelengths as presented by several authors.
Reflectance around the wavelength of green light is also of particular interest in the present
problem since two of the three types of cones have a greater sensitivity to green light (550
nm). Once bleached, those cones will show greater reflectance when using such wavelength of
light, allowing for a cone selective reflectance of the fundus [38].
5.2 Eye motion
Eye motion is another major source of image degradation when imaging the retina. While
imaging the retina, the subject is asked to keep his/her eye still, however, miniature eye
movements are always present, these involuntary movements of the eye are necessary to
overcome natural optical defects of the normal human eye and to correct the drifting from the
target under fixation [39]. Two possible methods may help reduce the effect of these
movements when imaging: devising a complex optical arrangement that counteracts these
movements [39] or using very short acquisition times.
5.3 Illumination
When illuminating the retina, it is desirable to keep the illumination elements off axis, so
that the retinal image formed in front of the eye may be captured. Nonetheless, the
illumination and imaging beams must be made collinear as was already discussed. The
illumination beam is therefore produced out of the line of sight of the subject and directed
towards the eye afterwards. To do so, three different approaches were attempted during the
Figure 5.2 Spectral reflectance of the fundus from three different
groups of authors [34].
27
development of the camera, each differing on the optical element used to deviate the light
towards the eye: a beam splitter, a mirror and a very thin optical fibre.
Other illumination concerns include the size, illuminance and uniformity of the illuminated
region of the retina, the focusing of the eye, the existence of corneal reflections and the fact
that it should be possible to choose a specific entrance point within the pupil to allow the
required measurements of the Stiles-Crawford apodization curve.
5.3.1 Maxwellian Illumination
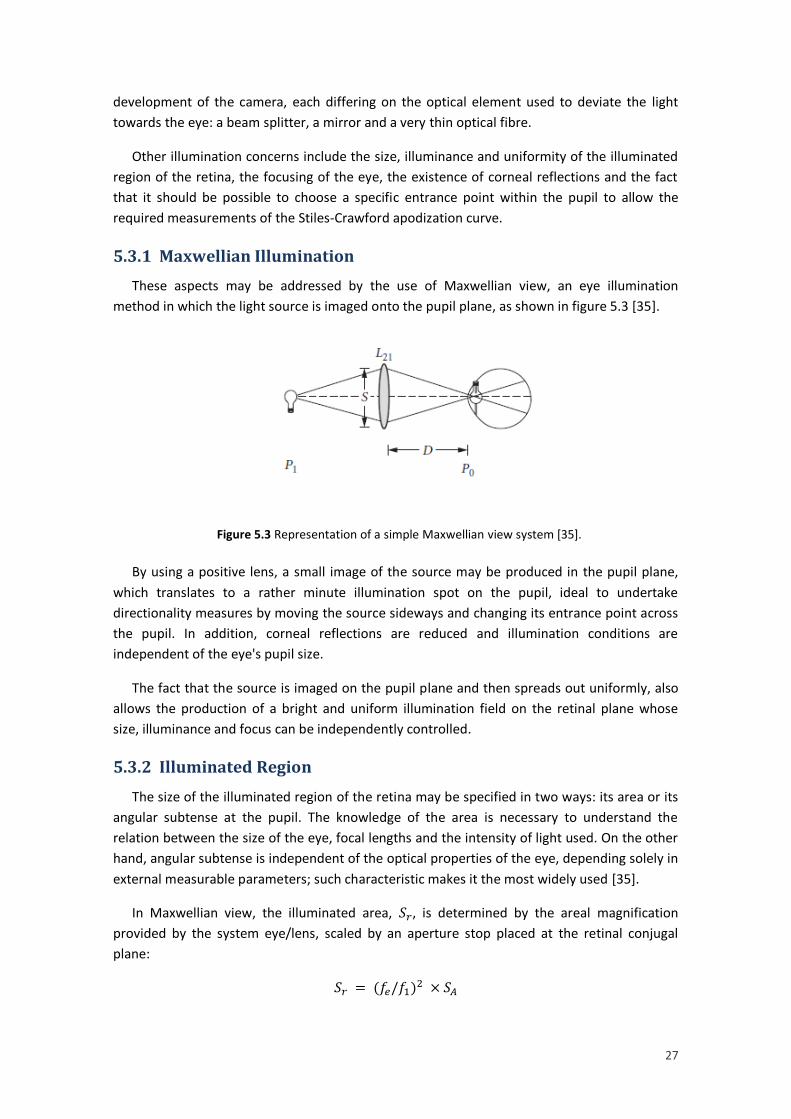
These aspects may be addressed by the use of Maxwellian view, an eye illumination
method in which the light source is imaged onto the pupil plane, as shown in figure 5.3 [35].
By using a positive lens, a small image of the source may be produced in the pupil plane,
which translates to a rather minute illumination spot on the pupil, ideal to undertake
directionality measures by moving the source sideways and changing its entrance point across
the pupil. In addition, corneal reflections are reduced and illumination conditions are
independent of the eye's pupil size.
The fact that the source is imaged on the pupil plane and then spreads out uniformly, also
allows the production of a bright and uniform illumination field on the retinal plane whose
size, illuminance and focus can be independently controlled.
5.3.2 Illuminated Region
The size of the illuminated region of the retina may be specified in two ways: its area or its
angular subtense at the pupil. The knowledge of the area is necessary to understand the
relation between the size of the eye, focal lengths and the intensity of light used. On the other
hand, angular subtense is independent of the optical properties of the eye, depending solely in
external measurable parameters; such characteristic makes it the most widely used [35].
In Maxwellian view, the illuminated area, 𝑆𝑟, is determined by the areal magnification
provided by the system eye/lens, scaled by an aperture stop placed at the retinal conjugal
plane:
𝑆𝑟 = (𝑓𝑒/𝑓1)2 × 𝑆𝐴
Figure 5.3 Representation of a simple Maxwellian view system [35].

28
Where 𝑓𝑒 is the focal of the eye, 𝑓1is the focal length of the Maxwellian lens and 𝑆𝐴 is the
area of the aperture stop.
The angular subtense, 𝛼, may be computed by considering figure 5.3. The tangent of the
half angular tense is equal to the ratio of the radius of the illuminated area and the focal length
of the eye. By measuring the diameter of the aperture stop placed at a conjugal plane of the
retina (it is impossible to directly measure the radius of the illuminated area of the retina), the
angular subtense may be obtained:
𝑡𝑎𝑛(𝛼/2) = (𝑑/2)
𝑓𝑒
𝛼 = 2 × 𝑡𝑎𝑛−1(𝑑/2𝑓𝑒)
Where 𝑑 is the diameter of the illuminated area on the retina or the diameter of the
aperture stop.
The illuminated region of the retina is therefore mainly determined by aperture stops.
5.3.3 Illuminance
The light available in the system (the luminous flux 𝜙) is determined by the area of the
source, its luminance, the aperture of the system and the focal length of the lens used [35]:
𝜙 = 𝑆𝑆𝐿𝑆𝑆𝐴/𝑓12
By dividing luminous flux by the illuminated area, the illuminance of the retina is obtained:
𝐸𝑅 =𝜙
𝑆𝑅= 𝑆𝑆𝐿𝑆/𝑓𝑒
2
As it can be seen, the illuminance of the retina depends only on the area of the source and
its luminance, being independent from the aperture stops. By changing its area, both luminous
flux and illuminated area change, canceling each other.
5.3.4 Eye Focus
The Maxwellian view method allows control of the focus of the eye. By placing a target
after the light source one focal length away from the lens, at the retinal conjugate plane, the
image of the target will be at infinity and a real image is produced at the retina of a non-
accommodated emmetropic eye. On the other hand, by placing the target closer to the lens, a
virtual image is produced and the subject will be required to accomodate in order to focus on
this image. The focus of the eye may thus be changed according to necessity [35].
An alternative illumination method using a very thin optical fibre was briefly explored in
this project. This is exposed in greater detail in another point of this dissertation.
5.3.5 Positioning the Subject
The first problem arising when positioning a subject is the fact that his/her head must be
still in order to reduce undesired eye motion. Head movements may be suppressed by the use
29
of a chin rest, a wax impression of the subject’s teeth (bite bar) or any other device that may
help stabilize the movements of the head. This device should then be attached to a mechanism
which allows accurate displacements in order to position the subject’s eye [35].
Once the subject’s head is stabilized, the centre of the eye pupil must be precisely
positioned at the focal point of the source image, in order to establish the viewing system
previously described. The first step is to position the eye at the right distance from the
Maxwellian lens; to do so, the subject’s head is moved sideways at several distances close to
the focal point, this will occlude the source image if the eye is in the wrong plane. When the
correct plane is achieved, the image of the source will be seen by the subject as uniformly
dimming, instead of being occluded on the sides. A second person, or the experimenter, may
also help on locating this distance by observing the image of the source on the eye pupil while
moving the person’s head closer or farther from the lens.
Following this process, the image of the source, or illumination spot, must be centered in
the eye pupil. By displacing the head sideways such that the spot becomes occluded by the iris
as seen by the subject, first to one side then the other, the horizontal centre of the pupil may
be obtained as the centre between these two positions. By repeating the process vertically,
the pupil may be centered.
5.4 Acquiring an Image
Once the retina is illuminated, its image will be formed by the lenses of the eye at the
infinite outside the eye. One or more lenses are then required to focus this image onto an
image sensor. A few concerns regard the development of this part of the system, these are
discussed here.
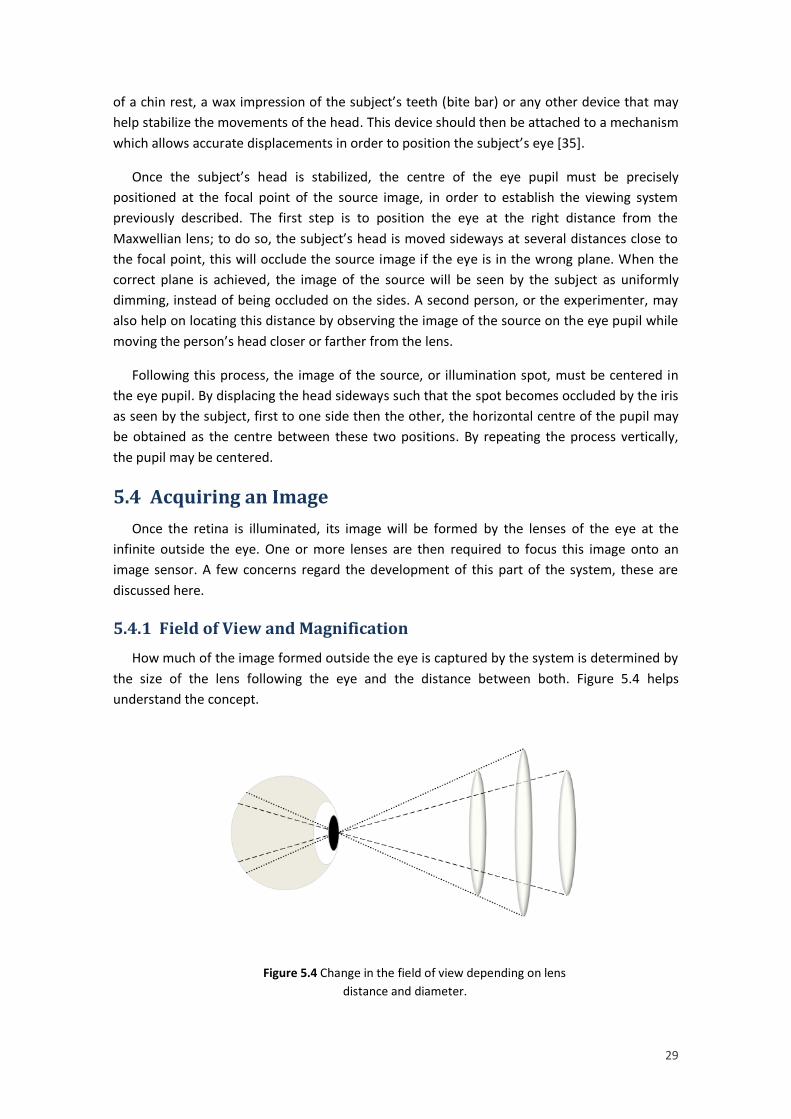
5.4.1 Field of View and Magnification
How much of the image formed outside the eye is captured by the system is determined by
the size of the lens following the eye and the distance between both. Figure 5.4 helps
understand the concept.
Figure 5.4 Change in the field of view depending on lens
distance and diameter.

30
The farther the lens is from the eye or the smaller its diameter, the smaller the angle of
view will be. In order to more accurately quantify the dimension of this angle a similar
expression to the angle of the illuminated region may be used:
𝛼 = 2 × 𝑡𝑎𝑛−1(𝑑/2𝑠)
Where now 𝑑 is the diameter of the lens, and 𝑠 the distance between the pupil and the
lens.
An image will be formed at the focal distance of the lens. The magnification of this image
may be approximated through the thin lens combination equation [36]:
𝑀 =𝑓1𝑠𝑖2
𝑑(𝑠𝑜1 − 𝑓1) − 𝑠𝑜1𝑓1
Where 𝑓1 is the focal length of the first lens (counting from the object towards the final
image), 𝑠𝑖2 is the distance from the second lens to the image formed by it, 𝑑 is the distance
between both lenses and 𝑠𝑜1 the distance from the object to the first lens.
In the present situation the first lens may be considered to be the lenses of the eye, the
final image is formed by the second lens at its focal length and the distance from the object to
the first lens is the focal length of the eye, therefore:
𝑓1 = 𝑓𝑒 ; 𝑠𝑖2 = 𝑓𝑙 ; 𝑠𝑜1 = 𝑓𝑒
The magnification of the system ‘eye plus lens’ may thus be obtained by the ratio between
the focal length of the lens used and the focal length of the eye:
𝑀 =𝑓𝑙
𝑓𝑒
Following this lens, a second lens may be desirable to increase magnification, to help
changing the plane of focus in the retina or simply to refocus the retinal image enhancing its
quality and allowing to view the whole image formed by the first lens.
This second lens will focus on the aerial image formed by the first and produce a new image
whose magnification will depend on its distance from the aerial image, 𝑠𝑜 [36]:
𝑀2 =𝑓2
𝑠𝑜 − 𝑓2
The total magnification is given by the product of both steps of magnification:
𝑀𝑇 = 𝑀1 × 𝑀2
Increasing magnification will also further reduce the field of view. The greater the
magnification, the closer the second lens must be to the aerial image and the farther the
image is formed; considering the fact that the sensor size stays the same, the field of view will
be reduced, as figure 5.5 clarifies.
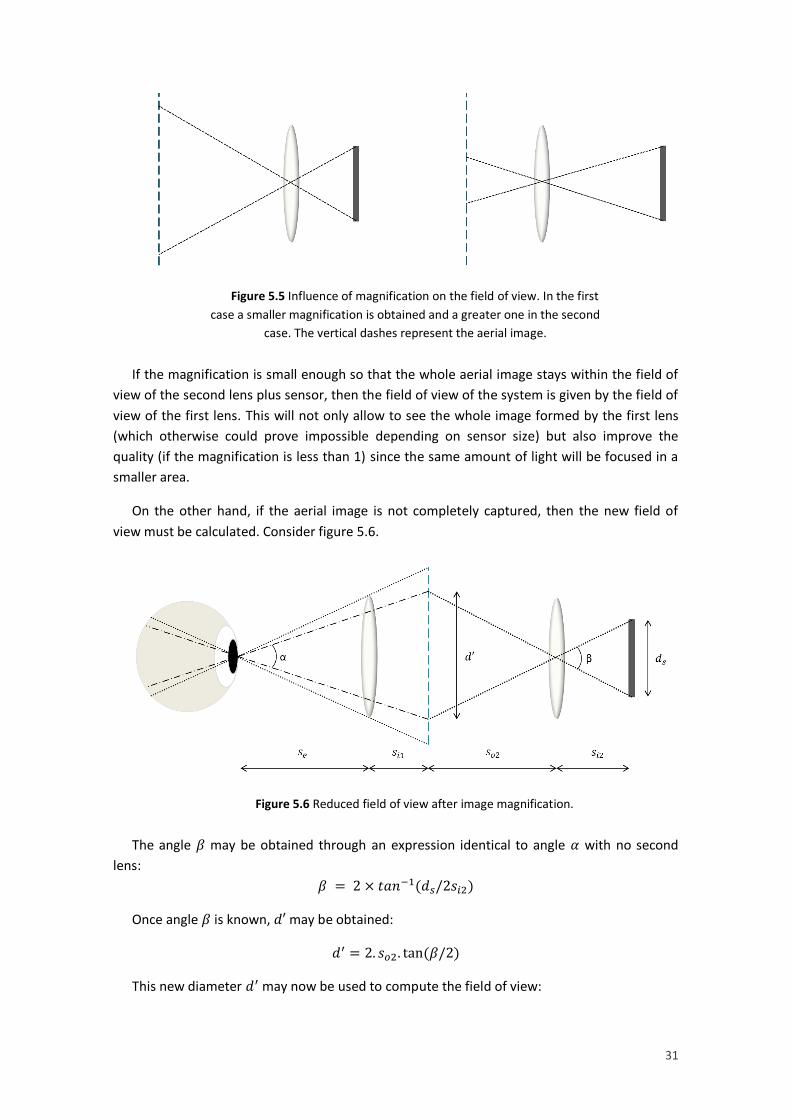
31
If the magnification is small enough so that the whole aerial image stays within the field of
view of the second lens plus sensor, then the field of view of the system is given by the field of
view of the first lens. This will not only allow to see the whole image formed by the first lens
(which otherwise could prove impossible depending on sensor size) but also improve the
quality (if the magnification is less than 1) since the same amount of light will be focused in a
smaller area.
On the other hand, if the aerial image is not completely captured, then the new field of
view must be calculated. Consider figure 5.6.
The angle 𝛽 may be obtained through an expression identical to angle 𝛼 with no second
lens:
𝛽 = 2 × 𝑡𝑎𝑛−1(𝑑𝑠/2𝑠𝑖2)
Once angle 𝛽 is known, 𝑑′ may be obtained:
𝑑′ = 2. 𝑠𝑜2. tan (𝛽/2)
This new diameter 𝑑′ may now be used to compute the field of view:
Figure 5.5 Influence of magnification on the field of view. In the first
case a smaller magnification is obtained and a greater one in the second
case. The vertical dashes represent the aerial image.
Figure 5.6 Reduced field of view after image magnification.

32
𝛼 = 2 × 𝑡𝑎𝑛−1 (𝑑′
2(𝑠𝑒 + 𝑠𝑖1))
5.4.2 Changing the focusing plane and magnification
The different layers of the retina lie within slightly different distances from the pupil, as a
result, these layers are simultaneously imaged by the first lens at slightly different planes. By
moving both the sensor and second lens back and forth, the second lens will be focusing on
different aerial images, so that different planes of the retina will be focused by the system and
different layers will be imaged, while keeping the magnification unchanged. If no second lens is
used the same may be accomplished by moving the sensor alone.
If only the sensor is moved (considering two lenses are being used), the magnification will
be modified with only a minor change of the plane under focus. This happens because when a
lens is close to an object, the magnification will be increased by bringing it closer to the object;
however, the displacement of the magnified image will be considerably larger than the
displacement of the lens towards the object. This means that by moving the sensor alone away
from the second lens for example, a magnified image of an aerial image slightly closer to the
second lens will be acquired, and therefore a slightly more superficial layer of the retina will be
imaged. Nonetheless, this change in the plane under focus is so small when compared with the
increase in magnification, that it may be neglected.
We may in this case more easily obtain the magnification provided by the second lens by
measuring the distance between the sensor and the second lens and applying the following
expression [36]:
𝑀2 =𝑠𝑖2 − 𝑓2
𝑓2
5.5 Shielding
As previously mentioned the amount of light reflected from the retina is extremely small,
therefore a sensor with a considerably high sensitivity is required in order to capture the
image. This also means that any other source of light other than the retina will add background
noise to the final image occluding the real retinal image.
These sources of unwanted or stray light are, in their majority, considerably stronger than
the reflection from the retina and originate from the illumination apparatus, reflections from
several surfaces in the system, corneal reflections and possible sources which are not part of
the system. It is therefore of absolute importance to impede as much as possible this light
from reaching the sensor. To accomplish this, low reflectance dark shields may be used to
isolate the different parts of the system, especially the imaging components from the
illumination apparatus and elements. Metallic components should also be covered by black
card and the whole system covered by a soft black material, eliminating light coming from
outside into the system.

33
5.6 Health and Safety
When working with light and real human eyes one must take into consideration the
possible hazards to the health of the individuals being submitted to the experiment. These
hazards may be divided into two main types depending on the underlying mechanism: thermal
and photochemical [35].
Thermal damage to the eye basically means overheating or burning of the tissue due to
absorption of light and its conversion to heat. Although it is predominant at longer
wavelengths, it takes place over a wide range of the visible and IR spectrum regions, and is
mainly dependent on the exposure duration being therefore a rate process with dependence
upon the time-temperature absorption history of a volume of tissue as a whole. It also means
longer exposure times will require a lower critical temperature to induce damage.
Photochemical damage is the loss of electrons by the molecular constituents of cells due to
the absorption of light [40], resulting in the production of reactive radicals and free electrons
with harmful consequences for the eye tissue. Unlike the thermal reactions, this kind of
reaction is highly dependent on the wavelength of light and displays action spectra in the
shorter wavelength and UV regions of the electromagnetic spectrum, which usually have a
Gaussian-like shape with a full width at half height of less than 100 nm. An action spectrum is a
curve describing the effectiveness of light in causing biological damage photochemically,
depending on its wavelength. This process exhibits as well a characteristic reciprocity between
the irradiance 𝐸 (W cm2⁄ ) and exposure duration 𝑡 (𝑠): 𝐻 = 𝐸. 𝑡; this value, 𝐻, the radiant
exposure (J cm2⁄ ) may be used to express the injury threshold.
For the past few decades, the aforementioned hazards to human health have been
thoroughly studied and guidelines have been conceived to avoid eye injury during experiments
with light. The American National Standards Institute (ANSI) provides a set of guidelines that
may be used to calculate the maximum permissible retinal irradiance (𝑀𝑃𝐸𝑟). By using an
optical power meter, the irradiance of the illumination spot in the eye may be controlled and
maintained under the calculated value. These guidelines and calculations are shown in
appendix A.1.

34
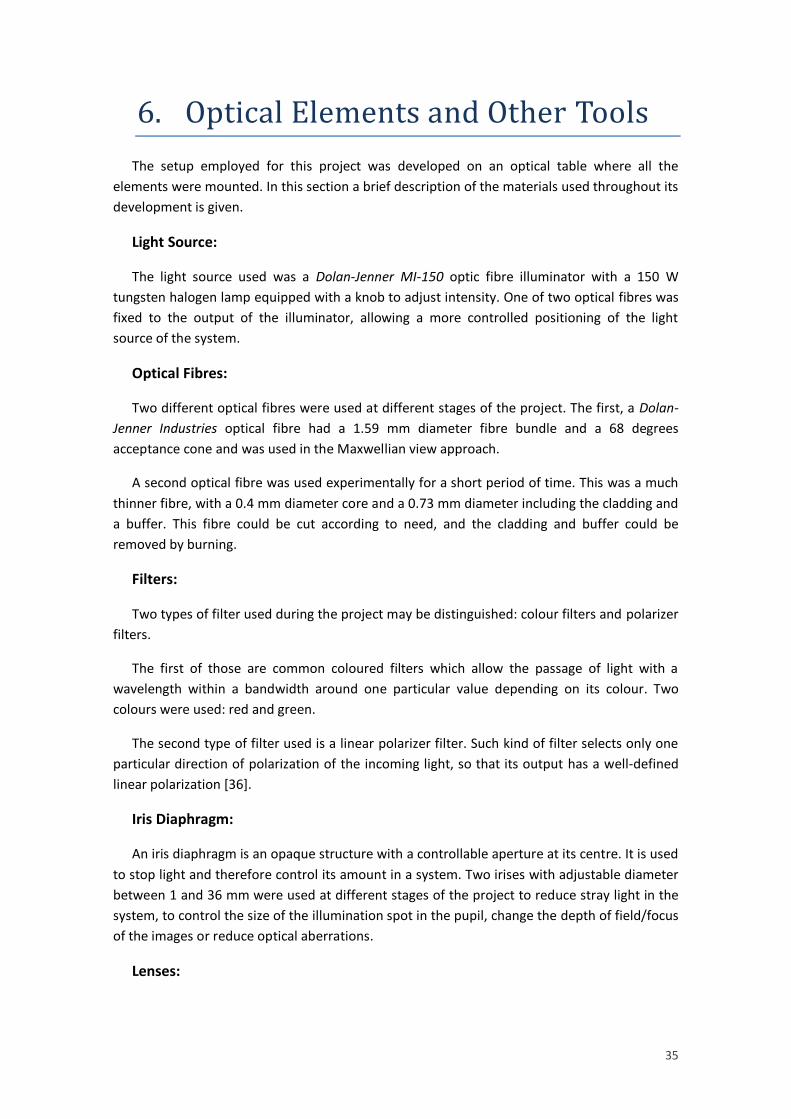
35
6. Optical Elements and Other Tools
The setup employed for this project was developed on an optical table where all the
elements were mounted. In this section a brief description of the materials used throughout its
development is given.
Light Source:
The light source used was a Dolan-Jenner MI-150 optic fibre illuminator with a 150 W
tungsten halogen lamp equipped with a knob to adjust intensity. One of two optical fibres was
fixed to the output of the illuminator, allowing a more controlled positioning of the light
source of the system.
Optical Fibres:
Two different optical fibres were used at different stages of the project. The first, a Dolan-
Jenner Industries optical fibre had a 1.59 mm diameter fibre bundle and a 68 degrees
acceptance cone and was used in the Maxwellian view approach.
A second optical fibre was used experimentally for a short period of time. This was a much
thinner fibre, with a 0.4 mm diameter core and a 0.73 mm diameter including the cladding and
a buffer. This fibre could be cut according to need, and the cladding and buffer could be
removed by burning.
Filters:
Two types of filter used during the project may be distinguished: colour filters and polarizer
filters.
The first of those are common coloured filters which allow the passage of light with a
wavelength within a bandwidth around one particular value depending on its colour. Two
colours were used: red and green.
The second type of filter used is a linear polarizer filter. Such kind of filter selects only one
particular direction of polarization of the incoming light, so that its output has a well-defined
linear polarization [36].
Iris Diaphragm:
An iris diaphragm is an opaque structure with a controllable aperture at its centre. It is used
to stop light and therefore control its amount in a system. Two irises with adjustable diameter
between 1 and 36 mm were used at different stages of the project to reduce stray light in the
system, to control the size of the illumination spot in the pupil, change the depth of field/focus
of the images or reduce optical aberrations.
Lenses:
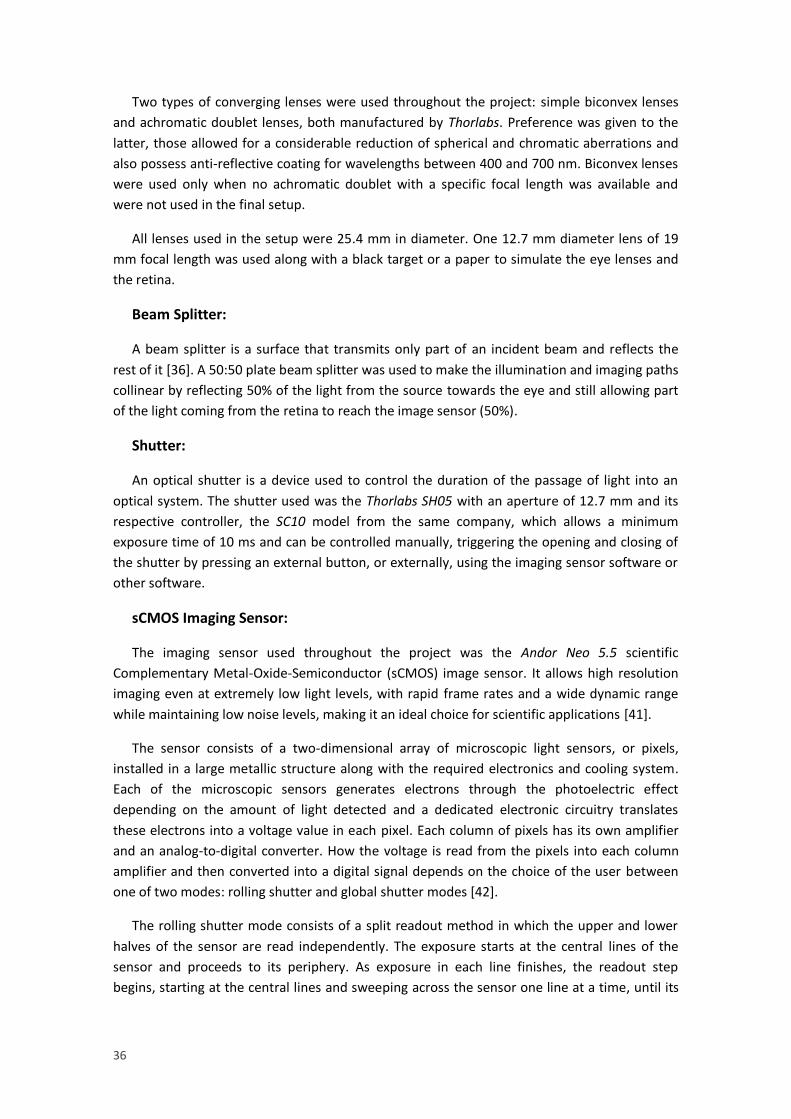
36
Two types of converging lenses were used throughout the project: simple biconvex lenses
and achromatic doublet lenses, both manufactured by Thorlabs. Preference was given to the
latter, those allowed for a considerable reduction of spherical and chromatic aberrations and
also possess anti-reflective coating for wavelengths between 400 and 700 nm. Biconvex lenses
were used only when no achromatic doublet with a specific focal length was available and
were not used in the final setup.
All lenses used in the setup were 25.4 mm in diameter. One 12.7 mm diameter lens of 19
mm focal length was used along with a black target or a paper to simulate the eye lenses and
the retina.
Beam Splitter:
A beam splitter is a surface that transmits only part of an incident beam and reflects the
rest of it [36]. A 50:50 plate beam splitter was used to make the illumination and imaging paths
collinear by reflecting 50% of the light from the source towards the eye and still allowing part
of the light coming from the retina to reach the image sensor (50%).
Shutter:
An optical shutter is a device used to control the duration of the passage of light into an
optical system. The shutter used was the Thorlabs SH05 with an aperture of 12.7 mm and its
respective controller, the SC10 model from the same company, which allows a minimum
exposure time of 10 ms and can be controlled manually, triggering the opening and closing of
the shutter by pressing an external button, or externally, using the imaging sensor software or
other software.
sCMOS Imaging Sensor:
The imaging sensor used throughout the project was the Andor Neo 5.5 scientific
Complementary Metal-Oxide-Semiconductor (sCMOS) image sensor. It allows high resolution
imaging even at extremely low light levels, with rapid frame rates and a wide dynamic range
while maintaining low noise levels, making it an ideal choice for scientific applications [41].
The sensor consists of a two-dimensional array of microscopic light sensors, or pixels,
installed in a large metallic structure along with the required electronics and cooling system.
Each of the microscopic sensors generates electrons through the photoelectric effect
depending on the amount of light detected and a dedicated electronic circuitry translates
these electrons into a voltage value in each pixel. Each column of pixels has its own amplifier
and an analog-to-digital converter. How the voltage is read from the pixels into each column
amplifier and then converted into a digital signal depends on the choice of the user between
one of two modes: rolling shutter and global shutter modes [42].
The rolling shutter mode consists of a split readout method in which the upper and lower
halves of the sensor are read independently. The exposure starts at the central lines of the
sensor and proceeds to its periphery. As exposure in each line finishes, the readout step
begins, starting at the central lines and sweeping across the sensor one line at a time, until its
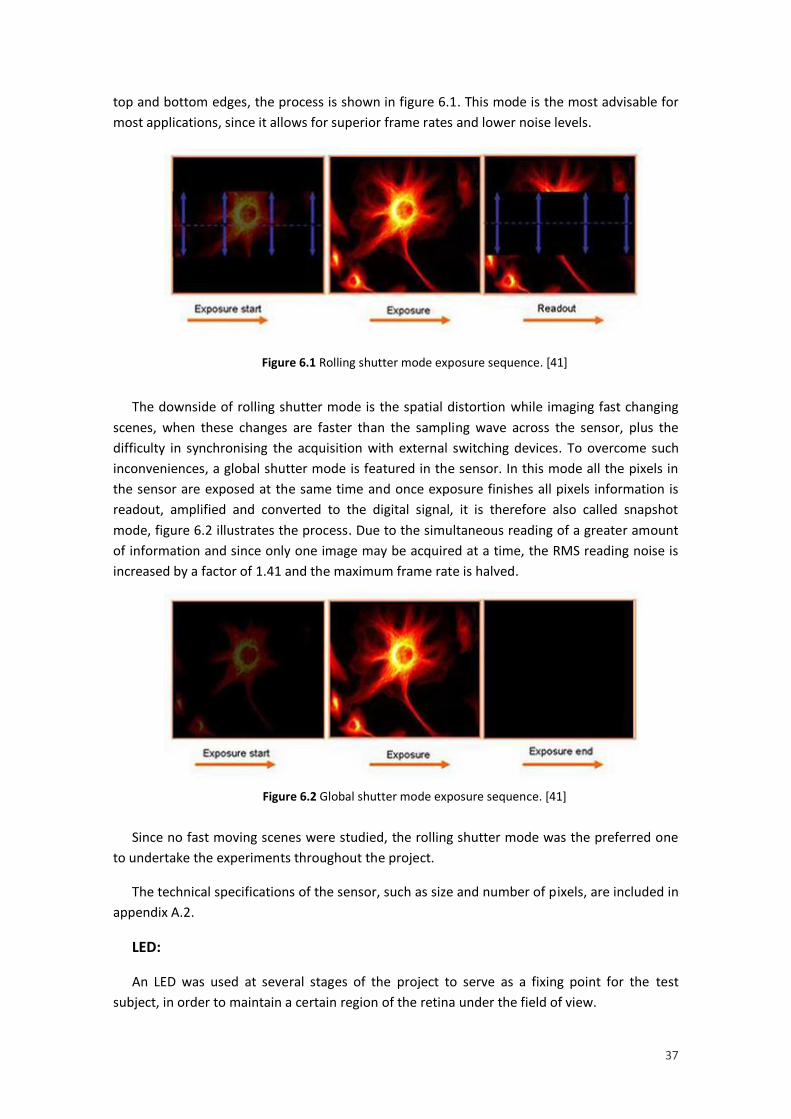
37
top and bottom edges, the process is shown in figure 6.1. This mode is the most advisable for
most applications, since it allows for superior frame rates and lower noise levels.
The downside of rolling shutter mode is the spatial distortion while imaging fast changing
scenes, when these changes are faster than the sampling wave across the sensor, plus the
difficulty in synchronising the acquisition with external switching devices. To overcome such
inconveniences, a global shutter mode is featured in the sensor. In this mode all the pixels in
the sensor are exposed at the same time and once exposure finishes all pixels information is
readout, amplified and converted to the digital signal, it is therefore also called snapshot
mode, figure 6.2 illustrates the process. Due to the simultaneous reading of a greater amount
of information and since only one image may be acquired at a time, the RMS reading noise is
increased by a factor of 1.41 and the maximum frame rate is halved.
Since no fast moving scenes were studied, the rolling shutter mode was the preferred one
to undertake the experiments throughout the project.
The technical specifications of the sensor, such as size and number of pixels, are included in
appendix A.2.
LED:
An LED was used at several stages of the project to serve as a fixing point for the test
subject, in order to maintain a certain region of the retina under the field of view.
Figure 6.1 Rolling shutter mode exposure sequence. [41]
Figure 6.2 Global shutter mode exposure sequence. [41]
38
Shielding:
The shielding used was low reflectance black card which was cut into several different
shapes according to need and put in place using black tape. A large low reflectance black cloak
was also used to cover the whole system.
Bite-bar:
A bite-bar was used to hold the subject’s head in place. A super hydrophilic impression
material from Dental Product Report was used to produce an impression of the subject’s teeth
by asking the subject to bite the heated material bar. Once cooled, the material hardens and
preserves an impression of the subject’s teeth, which may be used as a bite-bar for
stabilization of head movement.
Movable Stages:
Millimetric movable stages are ideal for precise millimetric displacements, allowing
accurate adjustments of optical elements and other system components. Two different
movable stages were used in this project. Both feature one or more rotating knobs that
produce small displacements and sub-millimetric scales that allow the quantification of these
displacements.
In order to allow the minute lateral displacements with no vertical change necessary for the
directionality measurements, the 1.59 mm diameter optical fibre used as the light source was
fixed in a holder attached to a long one-dimensional movable stage.
The bite-bar was fixed on a three-dimensional movable stage allowing the precise
adjustment of the eye position in all three directions.
Mydriatic Eye drops:
Mydriatic drugs are substances used to maintain a dilated eye pupil by blocking the
neurotransmitter receptors responsible for pupil constriction or by stimulating the ones
responsible for pupil dilation [34]. At a certain stage of the project pupil dilation with
tropicamide 1% was used with the goal of increasing image resolution.
Optical Power Meter:
An optical power meter (OPM) was used throughout the project to measure the power of
light delivered to the eye before any experiment. It basically consists of a calibrated sensor
with an amplifier and two displays: one analogue, other digital.
The OPM used was a Thorlabs PM30-130, which is able to measure optical powers from 5
nW to 500 mW with wavelengths between 400 and 1100 nm. Before any measure, the average
wavelength of light being used in the system must be specified, therefore, when using the red
filter the wavelength chosen was 650 nm; likewise, if the green filter was being used the
wavelength would be set to 550 nm.
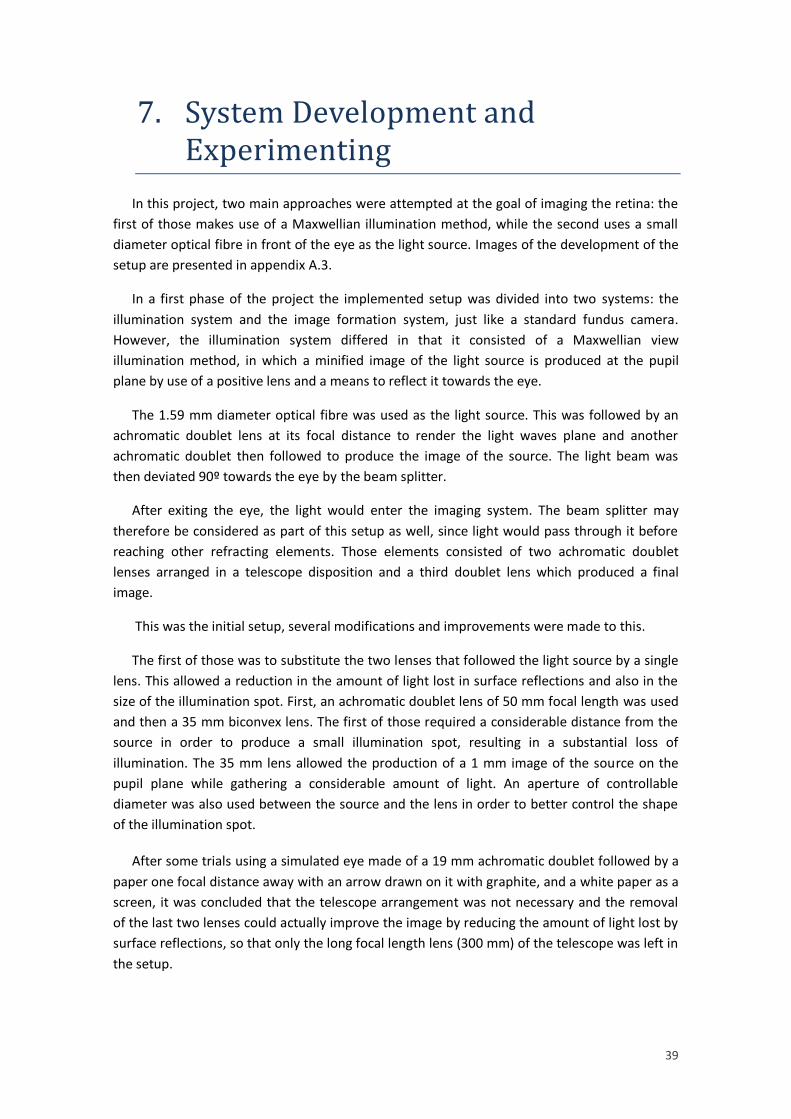
39
7. System Development and Experimenting
In this project, two main approaches were attempted at the goal of imaging the retina: the
first of those makes use of a Maxwellian illumination method, while the second uses a small
diameter optical fibre in front of the eye as the light source. Images of the development of the
setup are presented in appendix A.3.
In a first phase of the project the implemented setup was divided into two systems: the
illumination system and the image formation system, just like a standard fundus camera.
However, the illumination system differed in that it consisted of a Maxwellian view
illumination method, in which a minified image of the light source is produced at the pupil
plane by use of a positive lens and a means to reflect it towards the eye.
The 1.59 mm diameter optical fibre was used as the light source. This was followed by an
achromatic doublet lens at its focal distance to render the light waves plane and another
achromatic doublet then followed to produce the image of the source. The light beam was
then deviated 90º towards the eye by the beam splitter.
After exiting the eye, the light would enter the imaging system. The beam splitter may
therefore be considered as part of this setup as well, since light would pass through it before
reaching other refracting elements. Those elements consisted of two achromatic doublet
lenses arranged in a telescope disposition and a third doublet lens which produced a final
image.
This was the initial setup, several modifications and improvements were made to this.
The first of those was to substitute the two lenses that followed the light source by a single
lens. This allowed a reduction in the amount of light lost in surface reflections and also in the
size of the illumination spot. First, an achromatic doublet lens of 50 mm focal length was used
and then a 35 mm biconvex lens. The first of those required a considerable distance from the
source in order to produce a small illumination spot, resulting in a substantial loss of
illumination. The 35 mm lens allowed the production of a 1 mm image of the source on the
pupil plane while gathering a considerable amount of light. An aperture of controllable
diameter was also used between the source and the lens in order to better control the shape
of the illumination spot.
After some trials using a simulated eye made of a 19 mm achromatic doublet followed by a
paper one focal distance away with an arrow drawn on it with graphite, and a white paper as a
screen, it was concluded that the telescope arrangement was not necessary and the removal
of the last two lenses could actually improve the image by reducing the amount of light lost by
surface reflections, so that only the long focal length lens (300 mm) of the telescope was left in
the setup.
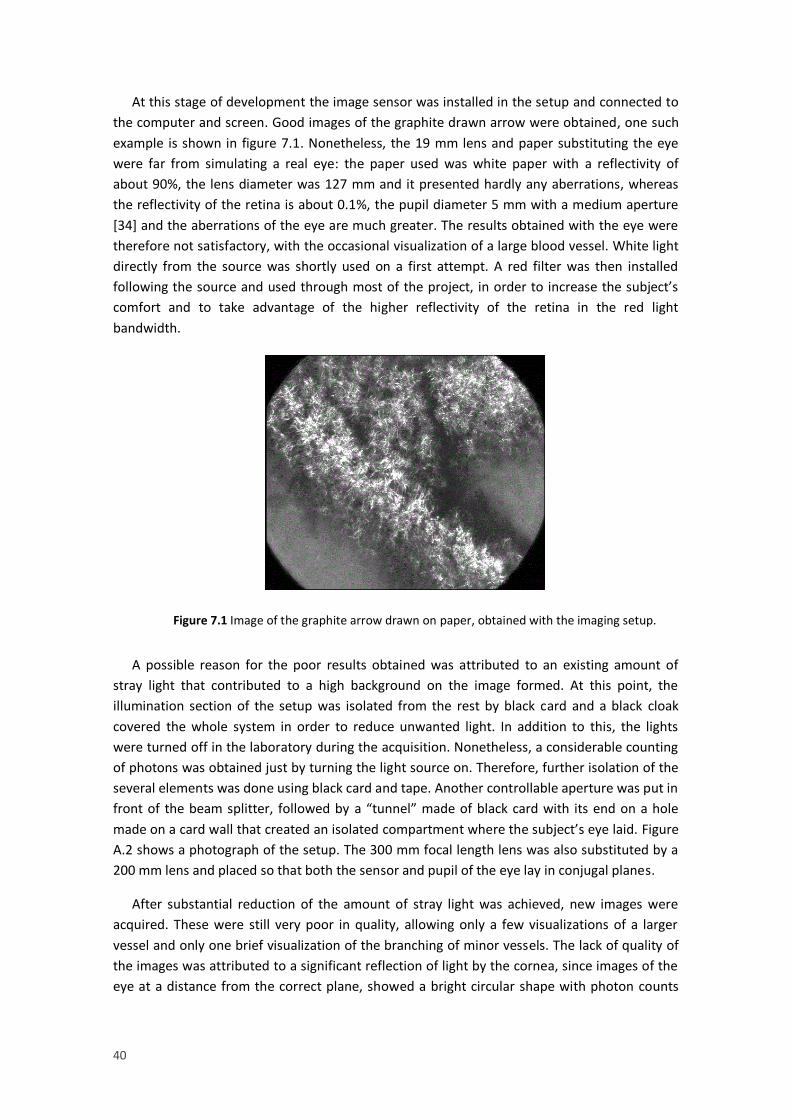
40
At this stage of development the image sensor was installed in the setup and connected to
the computer and screen. Good images of the graphite drawn arrow were obtained, one such
example is shown in figure 7.1. Nonetheless, the 19 mm lens and paper substituting the eye
were far from simulating a real eye: the paper used was white paper with a reflectivity of
about 90%, the lens diameter was 127 mm and it presented hardly any aberrations, whereas
the reflectivity of the retina is about 0.1%, the pupil diameter 5 mm with a medium aperture
[34] and the aberrations of the eye are much greater. The results obtained with the eye were
therefore not satisfactory, with the occasional visualization of a large blood vessel. White light
directly from the source was shortly used on a first attempt. A red filter was then installed
following the source and used through most of the project, in order to increase the subject’s
comfort and to take advantage of the higher reflectivity of the retina in the red light
bandwidth.
A possible reason for the poor results obtained was attributed to an existing amount of
stray light that contributed to a high background on the image formed. At this point, the
illumination section of the setup was isolated from the rest by black card and a black cloak
covered the whole system in order to reduce unwanted light. In addition to this, the lights
were turned off in the laboratory during the acquisition. Nonetheless, a considerable counting
of photons was obtained just by turning the light source on. Therefore, further isolation of the
several elements was done using black card and tape. Another controllable aperture was put in
front of the beam splitter, followed by a “tunnel” made of black card with its end on a hole
made on a card wall that created an isolated compartment where the subject’s eye laid. Figure
A.2 shows a photograph of the setup. The 300 mm focal length lens was also substituted by a
200 mm lens and placed so that both the sensor and pupil of the eye lay in conjugal planes.
After substantial reduction of the amount of stray light was achieved, new images were
acquired. These were still very poor in quality, allowing only a few visualizations of a larger
vessel and only one brief visualization of the branching of minor vessels. The lack of quality of
the images was attributed to a significant reflection of light by the cornea, since images of the
eye at a distance from the correct plane, showed a bright circular shape with photon counts
Figure 7.1 Image of the graphite arrow drawn on paper, obtained with the imaging setup.

41
close to those of the attempted images of the retina; this circular shape corresponds to the
cornea.
The beam splitter was also a major source of unwanted light reflection into the sensor. In
order to remove these reflections, the beam-splitter was replaced by a semi-circle mirror
which reflected half of the illumination beam into eye while allowing light coming from the
retina to travel through the space where there was no mirror. Illumination was nonetheless
uneven and poorer image quality was obtained.
Optical Fibre
At this point of the project a new strategy was adopted: the 0.73 mm diameter optical fibre
was used as a light source to directly illuminate the retina. The previous thicker optical fibre
was removed along with the 35 mm lens and the beam splitter. In this new configuration, the
optical fibre was placed as close as possible to the eye by using a thin plastic coverslip with a
hole at its centre smaller than the cladding of the fibre but larger than its core, therefore, by
removing the cladding of the fibre the coverslip could be used to hold it. The coverslip was
secured on a movable stage with a millimetric knob to allow for fine adjustment. Behind the
coverslip lay an iris and a black card tunnel that entered a card wall ensuring an efficient
shielding of stray light. The fibre was bent away from the imaging path avoiding any shadows.
Like in the previous setup, a 200 mm focal length lens laid between the eye and the sensor.
This new approach had the advantage of using all the light that comes from the retina,
since no beam splitter or other reflecting element is required. In addition, since the
illumination source was so close to the eye, the imaging light shared a very short travelling
distance with the illumination light, reducing greatly any interference between both light
beams. Corneal reflections were also reduced.
Good results were obtained using a simulated eye and are shown in figure 7.2, this time the
white paper on the simulated eye was substituted by a black and white target.
Figure 7.2 Image of the target used to simulate the retina, obtained with
the thin optical fibre setup.
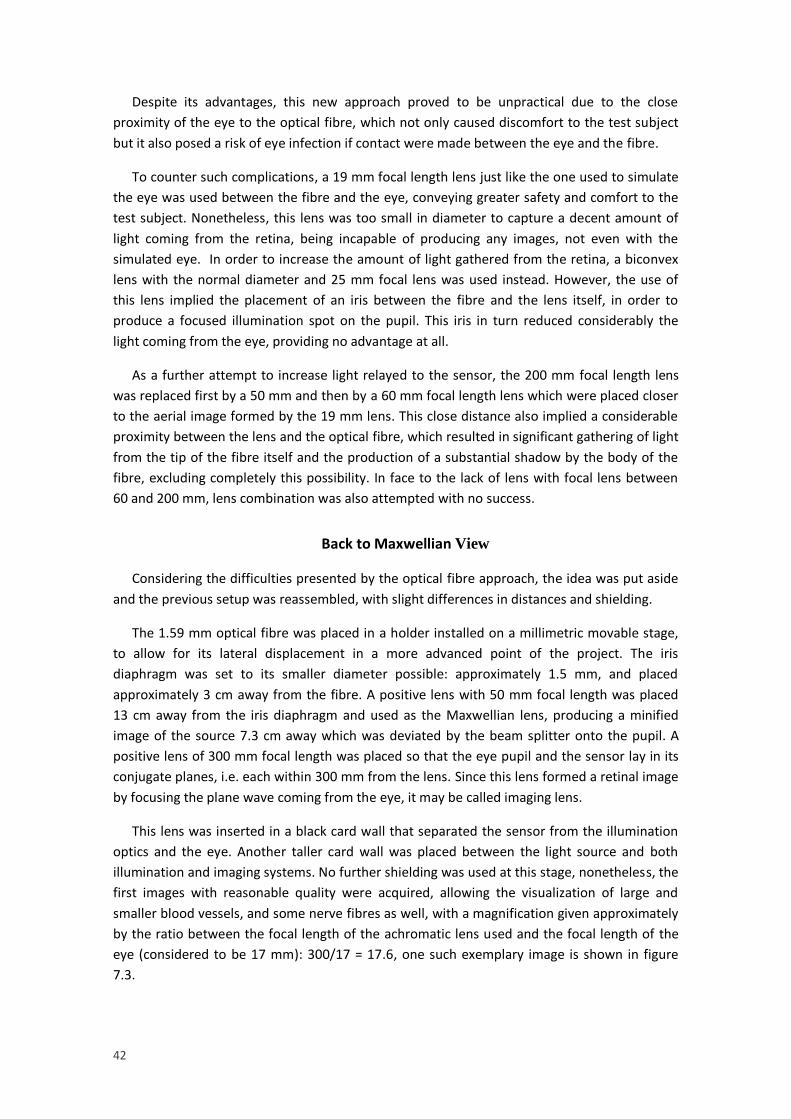
42
Despite its advantages, this new approach proved to be unpractical due to the close
proximity of the eye to the optical fibre, which not only caused discomfort to the test subject
but it also posed a risk of eye infection if contact were made between the eye and the fibre.
To counter such complications, a 19 mm focal length lens just like the one used to simulate
the eye was used between the fibre and the eye, conveying greater safety and comfort to the
test subject. Nonetheless, this lens was too small in diameter to capture a decent amount of
light coming from the retina, being incapable of producing any images, not even with the
simulated eye. In order to increase the amount of light gathered from the retina, a biconvex
lens with the normal diameter and 25 mm focal lens was used instead. However, the use of
this lens implied the placement of an iris between the fibre and the lens itself, in order to
produce a focused illumination spot on the pupil. This iris in turn reduced considerably the
light coming from the eye, providing no advantage at all.
As a further attempt to increase light relayed to the sensor, the 200 mm focal length lens
was replaced first by a 50 mm and then by a 60 mm focal length lens which were placed closer
to the aerial image formed by the 19 mm lens. This close distance also implied a considerable
proximity between the lens and the optical fibre, which resulted in significant gathering of light
from the tip of the fibre itself and the production of a substantial shadow by the body of the
fibre, excluding completely this possibility. In face to the lack of lens with focal lens between
60 and 200 mm, lens combination was also attempted with no success.
Back to Maxwellian View
Considering the difficulties presented by the optical fibre approach, the idea was put aside
and the previous setup was reassembled, with slight differences in distances and shielding.
The 1.59 mm optical fibre was placed in a holder installed on a millimetric movable stage,
to allow for its lateral displacement in a more advanced point of the project. The iris
diaphragm was set to its smaller diameter possible: approximately 1.5 mm, and placed
approximately 3 cm away from the fibre. A positive lens with 50 mm focal length was placed
13 cm away from the iris diaphragm and used as the Maxwellian lens, producing a minified
image of the source 7.3 cm away which was deviated by the beam splitter onto the pupil. A
positive lens of 300 mm focal length was placed so that the eye pupil and the sensor lay in its
conjugate planes, i.e. each within 300 mm from the lens. Since this lens formed a retinal image
by focusing the plane wave coming from the eye, it may be called imaging lens.
This lens was inserted in a black card wall that separated the sensor from the illumination
optics and the eye. Another taller card wall was placed between the light source and both
illumination and imaging systems. No further shielding was used at this stage, nonetheless, the
first images with reasonable quality were acquired, allowing the visualization of large and
smaller blood vessels, and some nerve fibres as well, with a magnification given approximately
by the ratio between the focal length of the achromatic lens used and the focal length of the
eye (considered to be 17 mm): 300/17 = 17.6, one such exemplary image is shown in figure
7.3.
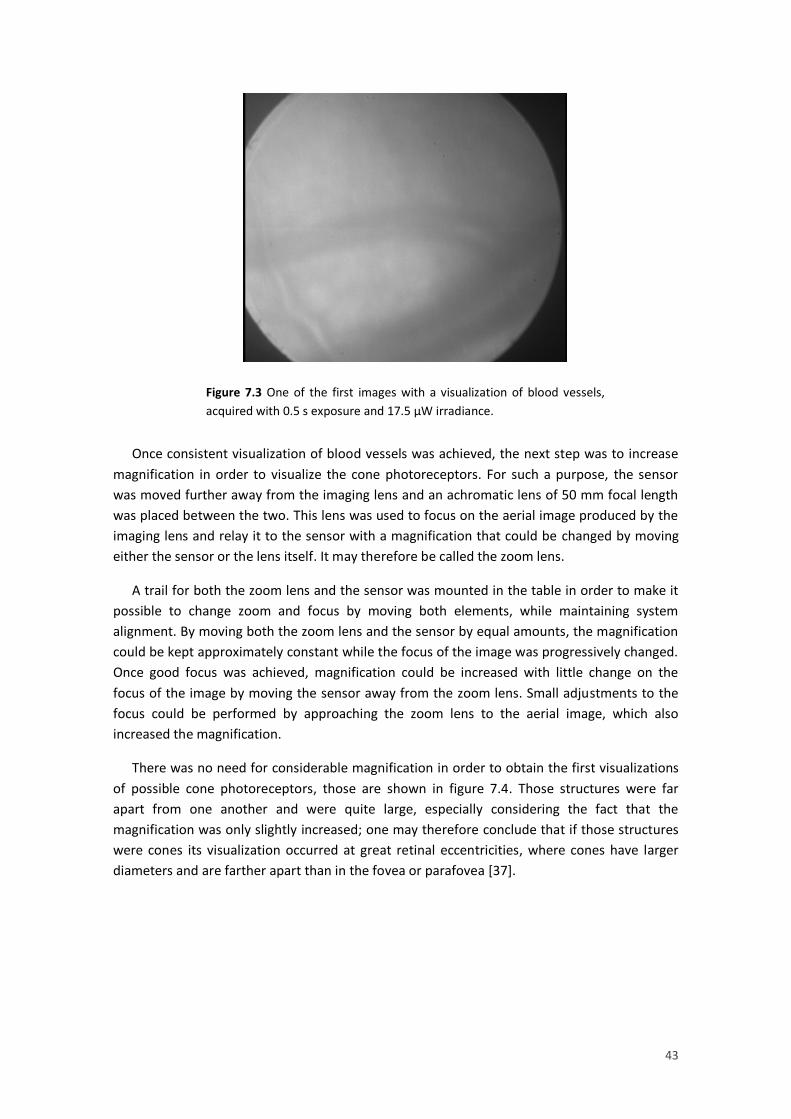
43
Once consistent visualization of blood vessels was achieved, the next step was to increase
magnification in order to visualize the cone photoreceptors. For such a purpose, the sensor
was moved further away from the imaging lens and an achromatic lens of 50 mm focal length
was placed between the two. This lens was used to focus on the aerial image produced by the
imaging lens and relay it to the sensor with a magnification that could be changed by moving
either the sensor or the lens itself. It may therefore be called the zoom lens.
A trail for both the zoom lens and the sensor was mounted in the table in order to make it
possible to change zoom and focus by moving both elements, while maintaining system
alignment. By moving both the zoom lens and the sensor by equal amounts, the magnification
could be kept approximately constant while the focus of the image was progressively changed.
Once good focus was achieved, magnification could be increased with little change on the
focus of the image by moving the sensor away from the zoom lens. Small adjustments to the
focus could be performed by approaching the zoom lens to the aerial image, which also
increased the magnification.
There was no need for considerable magnification in order to obtain the first visualizations
of possible cone photoreceptors, those are shown in figure 7.4. Those structures were far
apart from one another and were quite large, especially considering the fact that the
magnification was only slightly increased; one may therefore conclude that if those structures
were cones its visualization occurred at great retinal eccentricities, where cones have larger
diameters and are farther apart than in the fovea or parafovea [37].
Figure 7.3 One of the first images with a visualization of blood vessels,
acquired with 0.5 s exposure and 17.5 µW irradiance.

44
In order to achieve the visualization of parafoveal cones, image contrast needed to be
increased. This was accomplished by adding a linear polarizer after the light source and
another linear polarizer after the imaging lens. This approach exploits the birefringent nature
of the eye: linearly polarized light entering the eye will exhibit elliptical polarization when
leaving it [34]; by setting the polarization axis of each polarizer perpendicular to one another,
the only light that will pass the second polarizer will be the component of light coming from
the retina with a polarization axis parallel to the this polarizer axis, light coming from
reflections on the beam splitter and other surfaces is greatly reduced. This approach also
implies a greater demand of power from the light source.
The use of polarizers enhanced the contrast of blood vessels, as shown in figure 7.5;
nonetheless, the fundus lost detail and neither the cones nor the nerve fibres could be
visualized with reasonable quality, probably due to the reduction of the amount of light
contributing to the image.
Figure 7.4 First visualization of possible cone photoreceptors at large
eccentricities, those moved consistently across the screen as the subject moved
her eye; acquired with 0.3 s exposure and 24 µW irradiance.
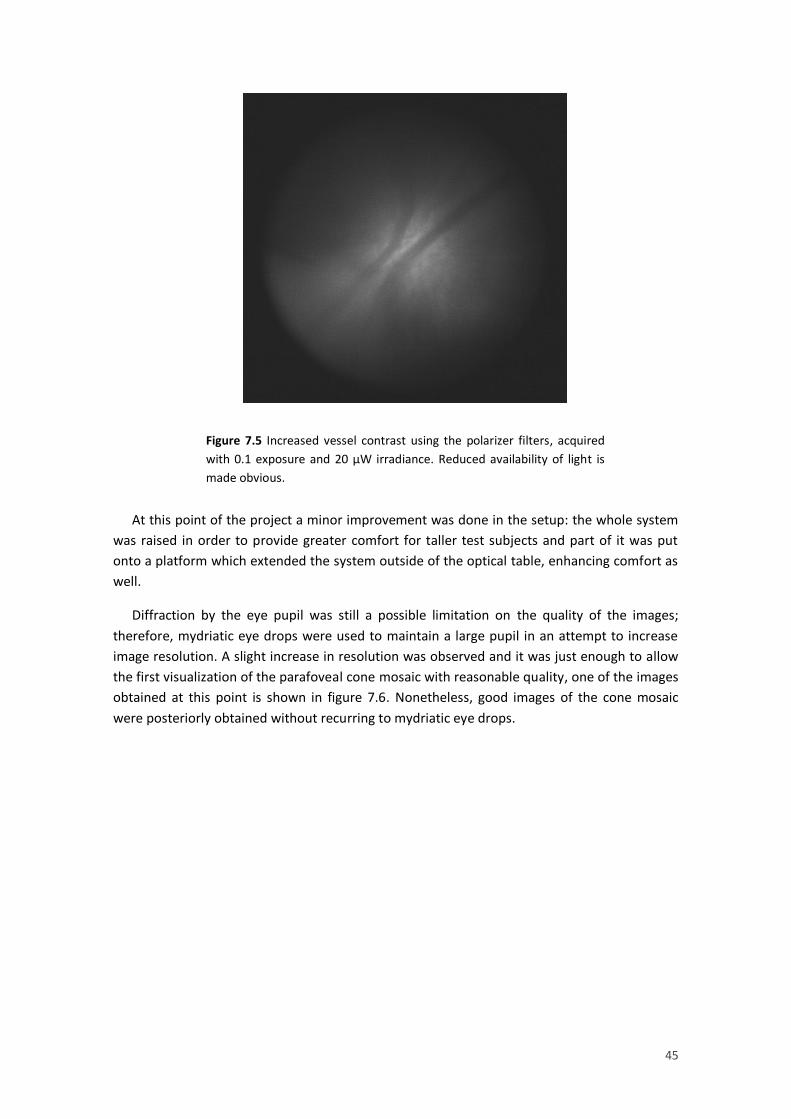
45
At this point of the project a minor improvement was done in the setup: the whole system
was raised in order to provide greater comfort for taller test subjects and part of it was put
onto a platform which extended the system outside of the optical table, enhancing comfort as
well.
Diffraction by the eye pupil was still a possible limitation on the quality of the images;
therefore, mydriatic eye drops were used to maintain a large pupil in an attempt to increase
image resolution. A slight increase in resolution was observed and it was just enough to allow
the first visualization of the parafoveal cone mosaic with reasonable quality, one of the images
obtained at this point is shown in figure 7.6. Nonetheless, good images of the cone mosaic
were posteriorly obtained without recurring to mydriatic eye drops.
Figure 7.5 Increased vessel contrast using the polarizer filters, acquired
with 0.1 exposure and 20 µW irradiance. Reduced availability of light is
made obvious.

46
Two final resorts were attempted with the aim of improving image quality: a green filter
and an optical shutter. For reasons already presented in the text, the use of green light is often
preferred when imaging the cones; in the absence of a green light source, a green filter was
used. In order to maintain the test subject’s comfort and safety, a lower source power was
required while imaging the retina, due to the higher sensitivity of the eye for green light. Such
reduction of the light available in the system, resulted however in a reduction of image quality.
In order to reconcile high power levels and subject’s safety, a shutter was used to limit the
amount of time during which the eye is exposed to light. Exposure times between 1 and 3
seconds were used, and reasonable results were attained. Nonetheless, no considerable
improvement was observed and the use of a green filter was excluded.
The optical shutter found nevertheless a second application: allow the use of high light
power levels to obtain videos with a high frame rate, reducing motion artifacts and ultimately
improving image quality. Exposure times between 1 s and 10 ms were used either by triggering
the opening and closing of the shutter manually or by synchronizing it with the software.
Synchronization with exposure times of less than 50ms proved to be unfeasible, due to a delay
between the acquisition by the sensor and the opening of the shutter. Manual triggering of the
shutter yielded reasonable results by setting the shutter to an exposure time of 1 second and
using exposures times between 0.09 and 0.01 seconds in the sensor (with light irradiances
between 30 and 100 µW respectively), producing 1 second videos with different frame rates.
Surprisingly, no considerable improvements were observed and the method proved to be less
practical, since it did not allow the free exploration of the retina for longer periods of time, and
the sudden opening and closing of the shutter prompted a reflex in the subject which resulted
in a considerable displacement from the region to be imaged. The idea was therefore
discarded.
Figure 7.6 One of the first images of the parafoveal cone mosaic
obtained, acquired with 0.05 s exposure and 20 µW irradiance. The
minute cones are visible among the vessels.

47
At this point, continuous experimentation with different magnification values and focusing
planes was done with exposure times around 0.1 seconds, in order to find the conditions
which provided optimum image quality of parafoveal cone photoreceptors.

48
49
8. Final Setup and Directionality Measurements
Once good images of the cone mosaic were consistently obtained, the magnification,
focusing plane and exposure time were fixed and the directionality measurements were finally
undertaken.
In the final setup, the Maxwellian lens formed an image of the optical fibre with a 0.46
magnification (a minified image) on the pupil plane. The zoom lens and sensor were fixed to
the optical table at such distances that the total magnification produced was approximately
11.5 times. This means that the zoom lens actually reduced the magnification provided by the
imaging lens and the eye lenses; although a superior magnification would be desirable, it
would require the use of higher irradiance levels which would compromise the health and
comfort of the test subject, nonetheless the magnification provided by the system proved to
be enough to allow visualization of the cone mosaic with enough quality to proceed to the
directionality measurements. Greater magnification would also imply increased motion
artefacts and aberration effects.
The exposure time chosen for the measurements was 0.1s. This choice made it possible to
use relatively low irradiance levels (around 25 µW) while keeping motion artefacts low and
allowing the production of short videos, instead of single images or extremely short videos.
These videos were desirable to guide the test subject’s stare into the right position, so that the
same region of the retina could be consistently imaged at all the pupil entrance positions for
the light, while producing a set of images from which those with best quality could be chosen.
A red filter was used rendering the wavelength bandwidth of light around 650 nm. The
measurements were performed at approximately 15º retinal eccentricity.
The optical elements which would not be used in the final measurements, such as the
polariser filters and the optical shutter, were left in the setup in such a way that they could be
easily added and used in the system in a posterior application. The same applies to the trail
mounted for the zoom lens and the sensor; even though these two optical elements were now
fixed to the table, they could be easily unscrewed from the table and slid along the trail to
change focus/magnification.
A schematic representation of the final setup follows in figure 8.1, along with a table with
the distances between the optical elements, table 8.1. Only the elements used in the
directionality measurements are represented: the light source illuminates the system through
the optical fibre which is fixed on the millimetric movable stage and scale; this is then followed
by the red filter, iris diaphragm, Maxwellian lens and beam splitter; after leaving the eye (black
dashes), light is focused by the imaging lens forming an aerial image which is focused on the
sensor by the zoom lens; the sensor is finally connected to the desktop computer allowing
visualization. Photographs of the final system are also shown in appendix A.4.
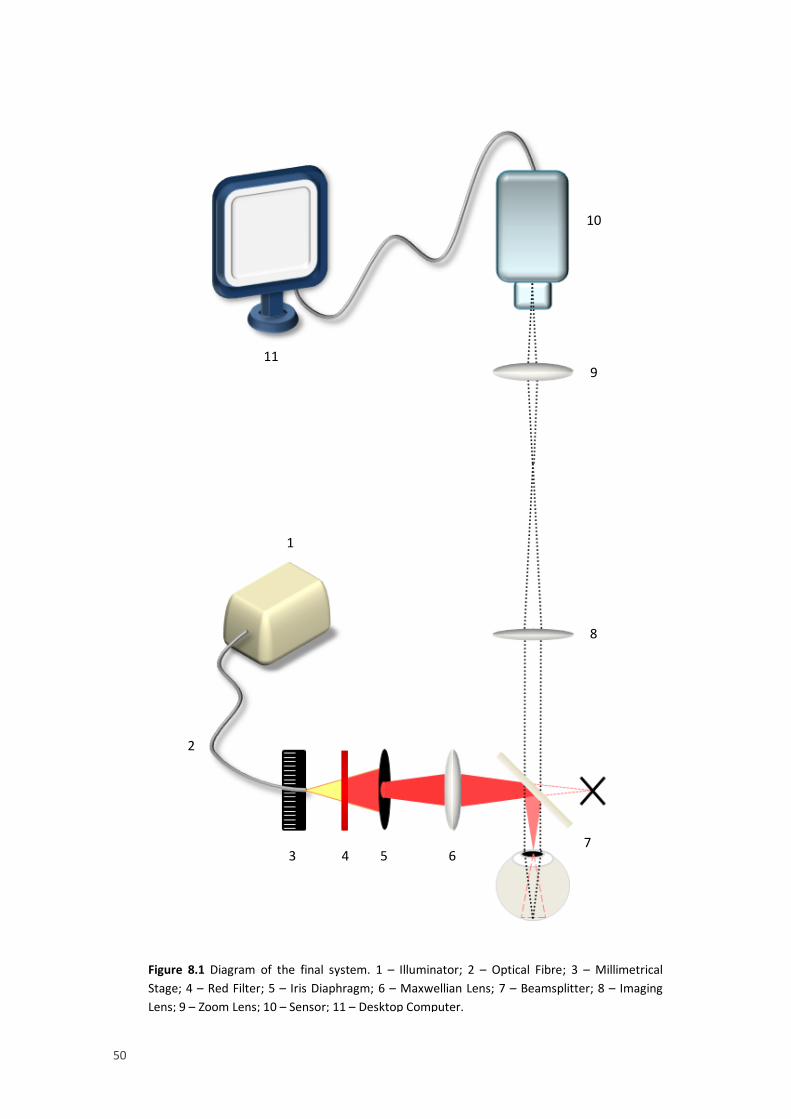
50
Figure 8.1 Diagram of the final system. 1 – Illuminator; 2 – Optical Fibre; 3 – Millimetrical
Stage; 4 – Red Filter; 5 – Iris Diaphragm; 6 – Maxwellian Lens; 7 – Beamsplitter; 8 – Imaging
Lens; 9 – Zoom Lens; 10 – Sensor; 11 – Desktop Computer.
1
2
3 4 5 6 7
8
9
10
11

51
Distance (cm) Info
Optical Fibre 0 Ø = 1.59 mm
Iris Diaphragm 3 Ø = 1.5 mm
Maxwellian Lens 13 f = 50 mm
Beam Splitter 5.6 50:50
Eye Pupil 1.7 2 mm < Ø < 8 mm
Imaging Lens 30 f = 300 mm
Zoom Lens 35.5 f = 50 mm
Sensor 8.3 2560 x 2160 pixels
The method used to perform the directionality measurements in the test subject’s right eye
is now outlined:
1. The light source is aligned with the Maxwellian lens using an alignment target.
2. The subject’s eye is carefully positioned and aligned with the illumination beam.
3. Once aligned, the illumination beam is displaced laterally in the temporal direction
(away from the nose) so that the illumination beam is occluded by the subject’s iris.
4. The beam is slowly displaced nasally until the subject starts seeing the beam circle
completely. This will be the first entrance position of light in pupil.
5. The subject is asked to look in the direction of the LED used to maintain the chosen
region of the retina under the field of view of the camera, but to keep focusing
behind it.
6. A 9 seconds video of the selected region of the retina is made.
7. The optical fibre is displaced 0.5 mm which translates to an approximate 0.2 mm
nasal displacement of the illumination beam in the pupil.
8. A new 9 seconds video of the same region in retina is made.
9. Steps 7 and 8 are repeated until the subject starts seeing the beam occluded by the
iris in the nasal side.
Table 8.1 Distance from each element in the system to the previous one. The lenses
focal length, the diameter of both the iris diaphragm and the optical fibre and other
information is also provided.

52
53
9. Results
The main goal of the project was the study of the directionality of the retinal cone
photoreceptors using imaging; therefore, the visualization of these structures constitutes a
goal in itself. Hence, two types of results may be distinguished: retinal images and
directionality measurements.
Two test subjects participated in the experiments providing these results: Salihah Qaysi and
the author. Both participants had no ocular pathologies; participant Salihah Qaysi had no
significant refractive error while the author required -2.5 Dioptre refractive correction.
9.1 Retinal Images
In this section, multiple images obtained during the development of the system and after
its conclusion are shown. Even though the photoreceptors constitute the structures of main
interest to the project, several different structures of clinical interest were also visualized.
Most of these images were obtained from the right eye of the test subject Salihah Qaysi, some
were obtained from the author’s right eye and an indication will be given when this is the case.
The wavelength bandwidth of light used was around 650 nm (using a red filter), the irradiance
was kept below 30 µW and the illumination duration below 30s at all times, well below the
safety guidelines shown in appendix A.1. Most images shown here display 11.5 times
magnification and a field of view of 5º; considering the fact that those of the parafoveal cone
mosaic were acquired at retinal eccentricities close to 15º and that cones have diameters of
approximately 8 µm at such eccentricities [12], the image resolution may be estimated to 8
µm, since cones are the smallest discernible structures in the images.
9.1.1 Optic Disc
With its large circular shape, high reflectivity and branching of large blood vessels, the optic
disc is an easily identifiable structure while imaging the retina. Due to the relatively high
magnification used during the project, no images of the whole disc were obtained;
nonetheless, a few exemplars where the optic disc can be partially seen were acquired and are
shown in figure 9.1.
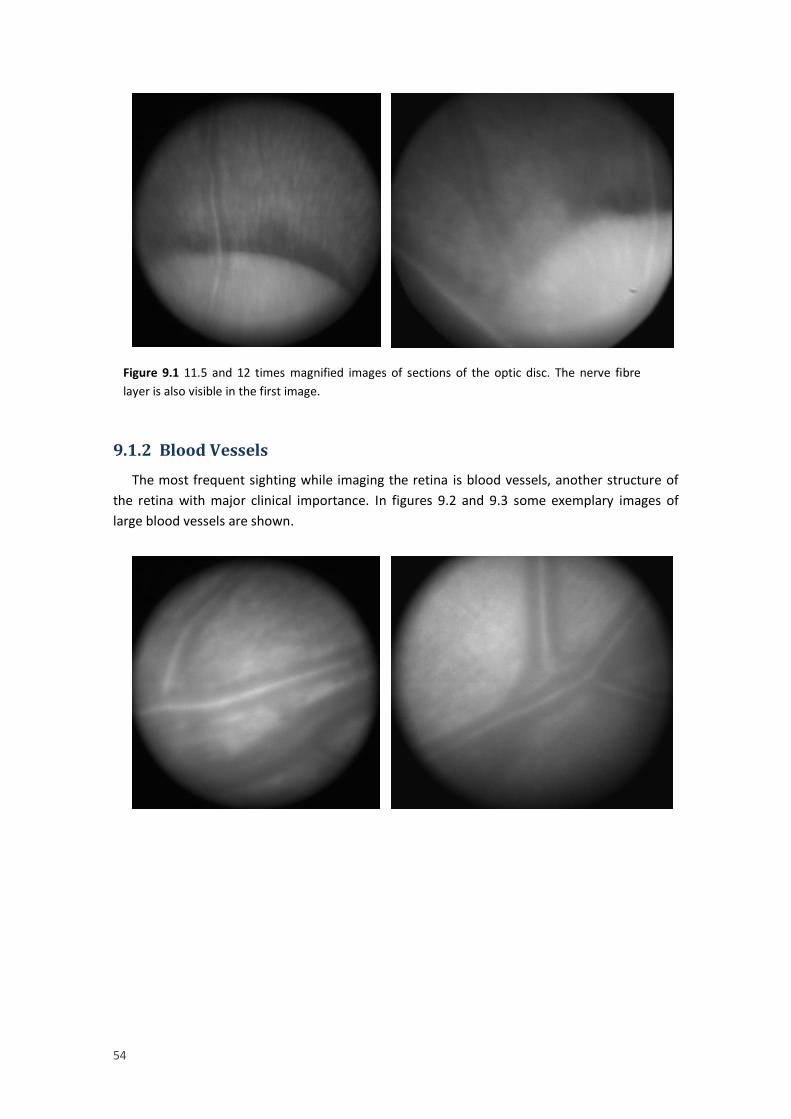
54
9.1.2 Blood Vessels
The most frequent sighting while imaging the retina is blood vessels, another structure of
the retina with major clinical importance. In figures 9.2 and 9.3 some exemplary images of
large blood vessels are shown.
Figure 9.1 11.5 and 12 times magnified images of sections of the optic disc. The nerve fibre
layer is also visible in the first image.
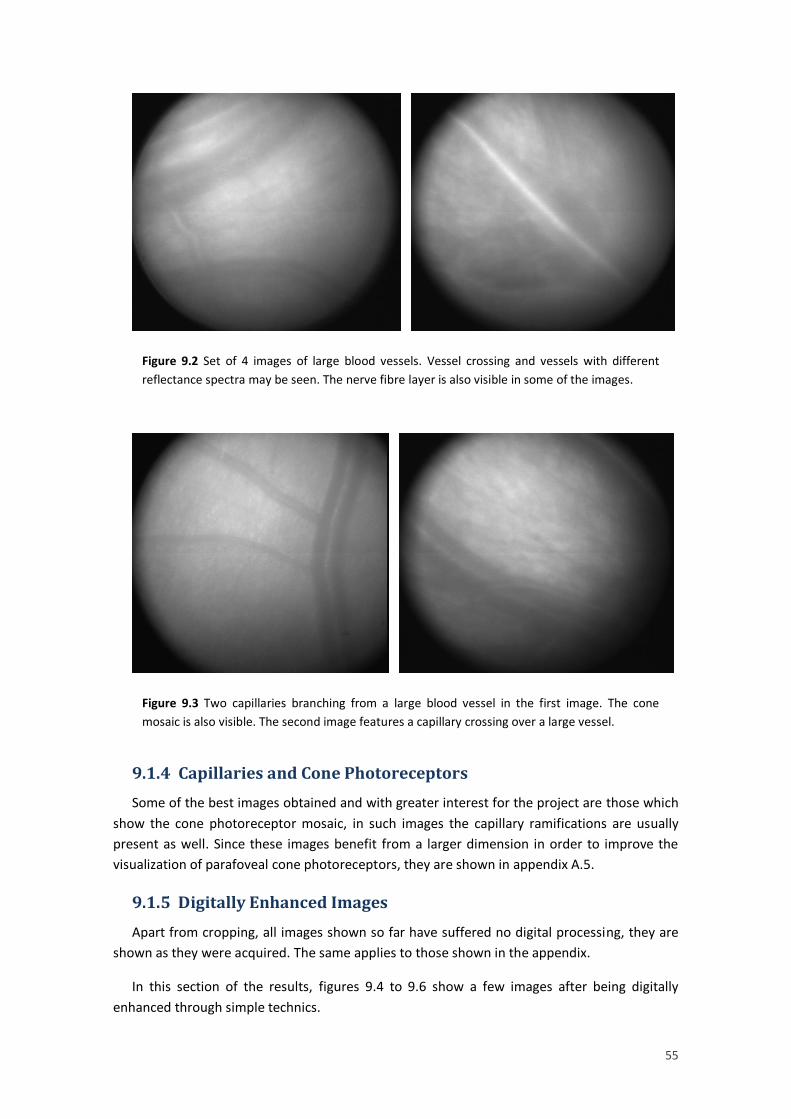
55
9.1.4 Capillaries and Cone Photoreceptors
Some of the best images obtained and with greater interest for the project are those which
show the cone photoreceptor mosaic, in such images the capillary ramifications are usually
present as well. Since these images benefit from a larger dimension in order to improve the
visualization of parafoveal cone photoreceptors, they are shown in appendix A.5.
9.1.5 Digitally Enhanced Images
Apart from cropping, all images shown so far have suffered no digital processing, they are
shown as they were acquired. The same applies to those shown in the appendix.
In this section of the results, figures 9.4 to 9.6 show a few images after being digitally
enhanced through simple technics.
Figure 9.2 Set of 4 images of large blood vessels. Vessel crossing and vessels with different
reflectance spectra may be seen. The nerve fibre layer is also visible in some of the images.
Figure 9.3 Two capillaries branching from a large blood vessel in the first image. The cone
mosaic is also visible. The second image features a capillary crossing over a large vessel.
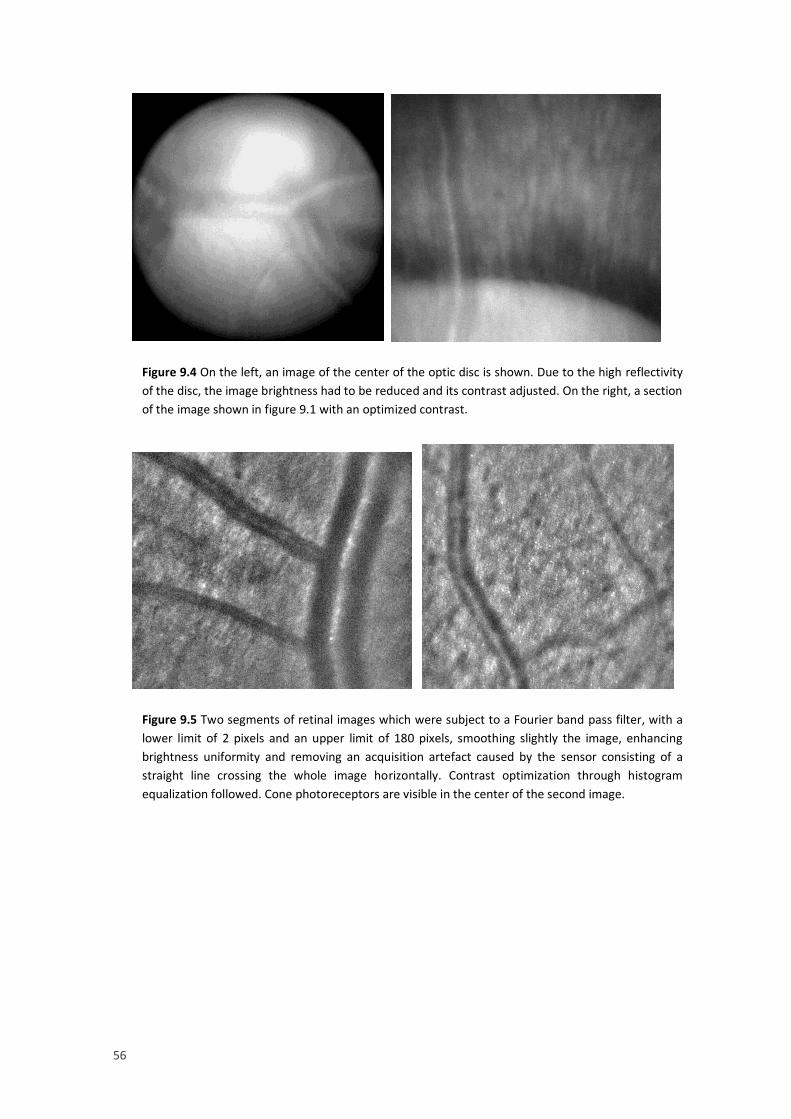
56
Figure 9.4 On the left, an image of the center of the optic disc is shown. Due to the high reflectivity
of the disc, the image brightness had to be reduced and its contrast adjusted. On the right, a section
of the image shown in figure 9.1 with an optimized contrast.
Figure 9.5 Two segments of retinal images which were subject to a Fourier band pass filter, with a
lower limit of 2 pixels and an upper limit of 180 pixels, smoothing slightly the image, enhancing
brightness uniformity and removing an acquisition artefact caused by the sensor consisting of a
straight line crossing the whole image horizontally. Contrast optimization through histogram
equalization followed. Cone photoreceptors are visible in the center of the second image.
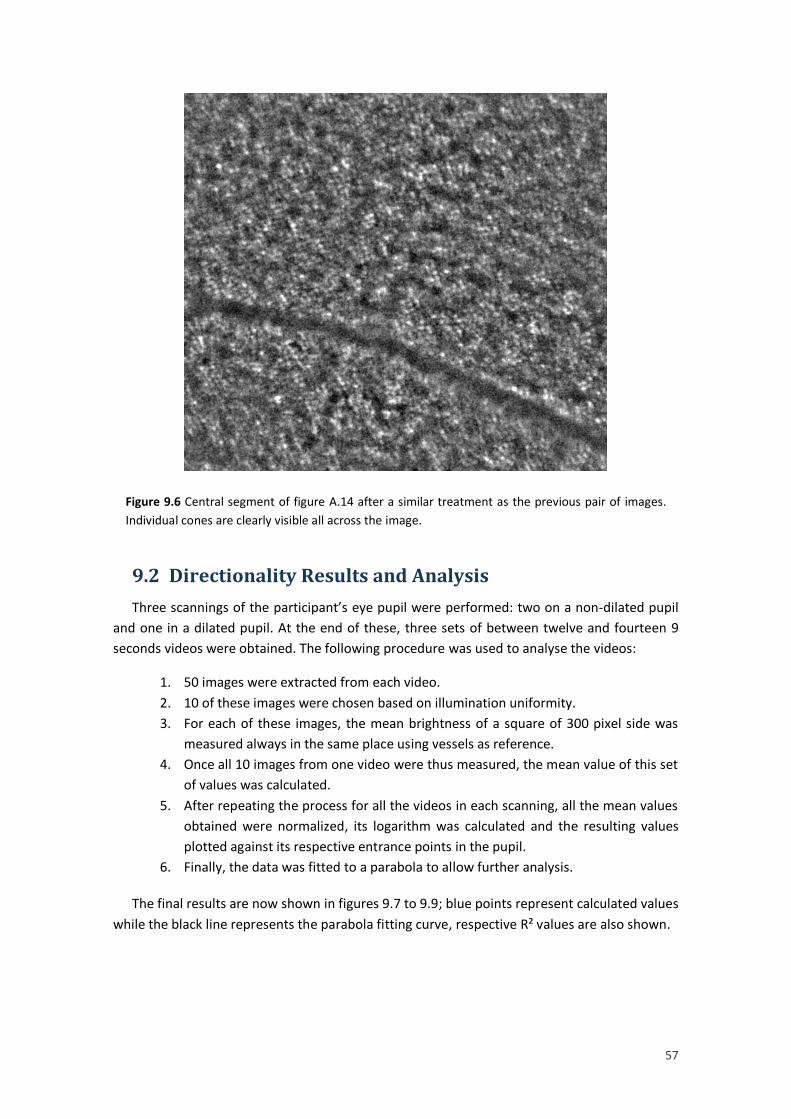
57
9.2 Directionality Results and Analysis
Three scannings of the participant’s eye pupil were performed: two on a non-dilated pupil
and one in a dilated pupil. At the end of these, three sets of between twelve and fourteen 9
seconds videos were obtained. The following procedure was used to analyse the videos:
1. 50 images were extracted from each video.
2. 10 of these images were chosen based on illumination uniformity.
3. For each of these images, the mean brightness of a square of 300 pixel side was
measured always in the same place using vessels as reference.
4. Once all 10 images from one video were thus measured, the mean value of this set
of values was calculated.
5. After repeating the process for all the videos in each scanning, all the mean values
obtained were normalized, its logarithm was calculated and the resulting values
plotted against its respective entrance points in the pupil.
6. Finally, the data was fitted to a parabola to allow further analysis.
The final results are now shown in figures 9.7 to 9.9; blue points represent calculated values
while the black line represents the parabola fitting curve, respective R² values are also shown.
Figure 9.6 Central segment of figure A.14 after a similar treatment as the previous pair of images.
Individual cones are clearly visible all across the image.

58
R² = 0,6829
-0,12
-0,1
-0,08
-0,06
-0,04
-0,02
0
0,02
0,2 0,4 0,6 0,8 1,0 1,2 1,4 1,6 1,8 2,0 2,2 2,4 2,6
Log
No
rmal
ize
d B
righ
tnes
s
Pupil Position (mm)
Measurement 1
→ Nasal
R² = 0,6374
-0,2
-0,18
-0,16
-0,14
-0,12
-0,1
-0,08
-0,06
-0,04
-0,02
0
0,02
0,2 0,4 0,6 0,8 1,0 1,2 1,4 1,6 1,8 2,0 2,2 2,4
Log
No
rmal
ize
d B
righ
tnes
s
Pupil Position (mm)
Measurement 2
→ Nasal
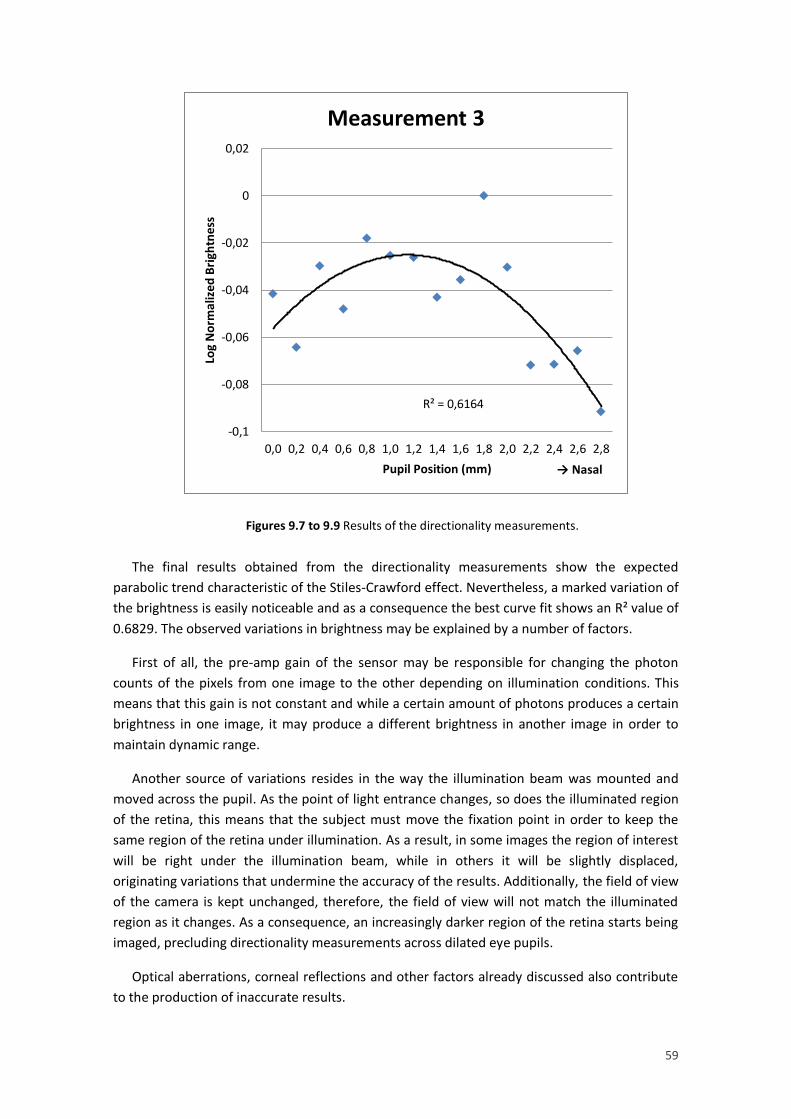
59
The final results obtained from the directionality measurements show the expected
parabolic trend characteristic of the Stiles-Crawford effect. Nevertheless, a marked variation of
the brightness is easily noticeable and as a consequence the best curve fit shows an R² value of
0.6829. The observed variations in brightness may be explained by a number of factors.
First of all, the pre-amp gain of the sensor may be responsible for changing the photon
counts of the pixels from one image to the other depending on illumination conditions. This
means that this gain is not constant and while a certain amount of photons produces a certain
brightness in one image, it may produce a different brightness in another image in order to
maintain dynamic range.
Another source of variations resides in the way the illumination beam was mounted and
moved across the pupil. As the point of light entrance changes, so does the illuminated region
of the retina, this means that the subject must move the fixation point in order to keep the
same region of the retina under illumination. As a result, in some images the region of interest
will be right under the illumination beam, while in others it will be slightly displaced,
originating variations that undermine the accuracy of the results. Additionally, the field of view
of the camera is kept unchanged, therefore, the field of view will not match the illuminated
region as it changes. As a consequence, an increasingly darker region of the retina starts being
imaged, precluding directionality measurements across dilated eye pupils.
Optical aberrations, corneal reflections and other factors already discussed also contribute
to the production of inaccurate results.
R² = 0,6164
-0,1
-0,08
-0,06
-0,04
-0,02
0
0,02
0,0 0,2 0,4 0,6 0,8 1,0 1,2 1,4 1,6 1,8 2,0 2,2 2,4 2,6 2,8
Log
No
rmal
ize
d B
righ
tnes
s
Pupil Position (mm)
Measurement 3
→ Nasal
Figures 9.7 to 9.9 Results of the directionality measurements.

60
On the other hand, the fact that the Stiles-Crawford curve is usually measured through a
dilated pupil should also be considered, this means that a length of approximately 8 mm is
scanned, whereas in the present study only a section of this curve was obtained, therefore, by
enlarging the length of the scanning the variations would fade and the standard deviation of
the normalized brightness would be reduced. The last set of results shown here (measurement
3) was obtained from a dilated pupil; however, these could not be performed to its whole
extent due to reasons already discussed.
61
10. Discussion and Conclusion
The present project set out to develop a fundus camera using simple optical elements, and
use this camera to study the photoreceptor directionality in the healthy human retina. This
well-known phenomenon, known as the Stiles-Crawford effect, is characterized by a Gaussian
dependence of the change in brightness perception with the position of light entrance in the
pupil, and it is altered in a number of ocular pathologies. While fundus imaging is a well-
established clinical practice, its use in the assessment of retinal directionality outside the
academic sphere is still taking its first steps. Its widespread use in the clinical environment
would represent a significant improvement in the health technology.
The first challenge presented in this project consisted of devising a way to obtain retinal
images of the cone mosaic by assembling a light source, lenses and an image sensor device.
Direct illumination of the eye using a thin optical fibre cobbled to a light source was
attempted with no success: the proximity between the fibre and the eye required to obtain
reasonable images posed a risk for the health and safety of the participant, a more advanced
device would be required to assure no contact occurred between the cornea and the fibre,
such device could incorporate a camera or distance sensor which along with a precise robotic
or manual arm could place the fibre at a safe distance from the cornea; participant’s head
movement would also have to be completely eliminated. Maxwellian illumination was
therefore the preferred method to illuminate the retina: by using a larger optical fibre, one
lens and a beam splitter a simple method was conceived to deliver light to the eye fundus. This
approach provided a uniform illumination field in the retina and a very minute illumination
spot on the cornea in a safe way while still making it possible to change the entrance point in
the pupil. An iris diaphragm was also necessary to control the illumination spot size and reduce
its aberrations and the use of a red filter was found to be of advantage by increasing the
participant’s comfort while availing of the increased retinal reflectance on the red wavelength
bandwidth of the spectrum. The beam splitter was necessary to deflect the illumination beam
towards the eye while keeping the light source, lens and the other elements out of the way of
the eye. This was a 50:50 beam splitter, which meant the light intensity produced by the
system was halved before it reached the eye and halved again after it left the eye while making
its way to the sensor, a significant reduction on the amount of image forming light was thus
inflicted. Nonetheless, the alternatives proved unpractical: a high reflectance mirror was used
to reflect half of the illumination beam to the eye while allowing half of the image formed to
reach the sensor, although theoretically possible this method did not produce any reasonable
images, probably due to the fact that it was attempted on an early stage of the development,
later attempts could have proved the feasibility of the method. Another possible approach
would be to use an annular mirror which would reflect the periphery of the beam towards the
eye while allowing the whole image of the retina to reach the sensor by traversing the centre
of this ring. The ring would have to be elliptical in shape, due to the 90º angle between the
illumination beam and the eye. The means to manufacture such a mirror were however not
available.

62
To properly illuminate the eye with the illumination beam created and to retrieve an image
with quality from its fundus, the intrinsic properties of this human organ had to be taken into
account. The most obvious of these is the fact that the retina lies behind lenses made of live
tissue whose properties, namely refractive power, are not constant. These lenses produce an
image of the illuminated retina which might form somewhere between the infinite and 10 cm
from the eye, by asking the participant to relax her eyesight and avoid focusing in close
distances it was possible to place the image formed close to infinity and use an external lens to
focus this image onto a sensor. Another property of the eye lenses that constantly changes is
its surface rugosity, which is dictated by the amount and quality of the tear film covering it and
drastically influences the image quality, it is therefore required that the participant blinks her
eye constantly to maintain this tear film. Like any other lens, the eye lenses reflect a
considerable amount of the incoming light; one of the strategies devised to overcome such
inconvenience was the use of polariser filters to take advantage of the birefringence properties
of the eye, although promising, this approach proved unworthy in the present setup: further
study of the birefringence properties of the individual elements of the eye would be required
and a more thorough development of the illumination system would be necessary to deliver a
superior amount of light to the eye while maintaining the test subject’s safety. A developed
skill to eliminate corneal reflections by avoiding looking directly to the illumination beam was
therefore required from the test subject. Finally, head motion presented a major source of
image deterioration; the use of a bite-bar bar was found to be an efficient and easy way to
overcome this issue. This bite-bar could be easily produced by warming a specific malleable
material, ask the test subject to bite it and wait a few minutes for it to harden and acquire its
definitive shape, it could then be used to maintain the subject’s head stable by asking her to
bite it. This strategy also allowed to precisely align the eye with the illumination beam by
attaching the bite-bar to a three-dimensional millimetric movable stage.
Even though it was shown that one external lens was enough to form an image of the retina
on the image sensor, it was found to be advantageous to further extend the system with at
least one more lens. This lens allowed the refocusing of the retinal image, which increased
image quality by concentrating more light coming from a particular point in the retina onto the
same point in the sensor. It also made it possible to easily change the magnification and the
focusing plane of the image by moving this lens and the image sensor away or closer to the
eye. The use of a third lens was found to be unnecessary, since it constituted another source of
aberrations and reflections in the system while adding no advantage at all. In addition to the
lenses, an iris diaphragm could be used in between them, at the point where an aerial image is
formed in order to reduce aberrations present in the image with the drawback of a reduction
in resolution. However, this aerial image is formed at several simultaneous planes in between
the lenses and they change slightly with time, making the task a more complicated endeavour
which would require a greater in-depth understanding of the matter.
To finally acquire the images, a scientific CMOS image sensor with high sensitivity and low
noise levels was used. Most images were acquired from short videos, no longer than 30
seconds in length. These videos proved to be valuable to explore the eye fundus and choose
the regions of interest, contrarily to the acquisition of single images, which would yield
visualizations of random regions of the fundus unless it had been explored beforehand and
provided the staring point was fixed. Moreover, single acquisitions yielded mostly images with
63
eye motion artefacts, whereas within a short video there would always be a number of frames
with no motion artefact. Increasingly shorter exposure times proved to further reduce these
artefacts, nonetheless, this implied increasingly higher light irradiance levels. An exposure time
of 0.1 seconds was shown to be the one with the best balance between subject’s safety and
image quality. Further reduction of the exposure time was attempted while making use of an
optical shutter to control the span of time during which the eye was exposed to the necessarily
stronger light. Although shorter exposure images were obtained, no improvement in quality
was observed due to the fact that the shutter opening and closing noises produced an
unwanted reaction in the subject which resulted in even larger motion artefacts; in addition,
acquisition artefacts due to the poor synchronization between optical shutter and sensor were
observed, such issue could be tackled by developing a dedicated software which would assure
the proper synchronization between sensor and optical shutter. The Labview tools associated
with the sensor could be used to develop such interface in a future phase of the project.
The high sensitivity of the sensor made it possible to acquire the extremely low-intensity
images of the retina, nonetheless, it posed a disadvantage as well: any other source of light in
the system, either reflective or emissive, would be detected by the sensor and added to the
original signal prevenient from the retina. The shielding of the several parts of the system
showed therefore to be a fundamental step to the acquisition of images with good quality. This
step consisted mainly of isolating as most as possible the light source and illumination optics
from the sensor while allowing the illumination and imaging beams to traverse the necessary
paths, this implied cutting several shapes in black paper card with low reflectance, to
accommodate the system design. A large black fabric was also necessary to cover the system
and cut off external light sources such as the computer screen. An additional issue regarding
stray light in the system was one of the half of the illumination beam which was not reflected
towards the eye in the beam splitter, but traversed it instead, this beam continued ahead just
to be reflected in the first surface which it encountered. This surface had to be very low in
reflectance and should be turned away from the beam splitter; otherwise, when bounced off
this surface light would be reflected at the beam splitter and directed towards the sensor,
contributing to the illumination noise. The use of a black card at a non-perpendicular angle
with the beam or a beam blocker proved to reduce this stray light, even though not
completely. A beam blocker is a dark box designed to trap a light beam reducing considerably
its reflection.
After a developmental period, a setup capable of producing high quality retinal images of
the parafoveal cone mosaic with considerable consistency was conceived. This setup allowed
the visualization of the eye fundus in real time and the acquisition of its images with optimum
quality at a magnification of 11.5, a field of view of 5º and a resolution of 14 µm. This
magnification could nevertheless be easily increased at the expense of less image quality, on
the other hand, decreasing the magnification did not increase the field of view, it only
provided a smaller image with the need for less light. High quality images of the several retinal
structures, including parafoveal cone photoreceptors, were thus acquired. Further
improvement in image quality would require the implementation of more elaborate elements
in the setup, such as a badal or an adaptive optics module. Such module would be able to
correct the natural aberrations of the human eye which impose a limit in image quality and
make it impossible to take advantage of the full resolution that a dilated eye pupil provides. A

64
lens with a modifiable refractive power could also be used to compensate the defocus which
takes place as a result of spontaneous accommodation. The development of such devices
would constitute a whole project in itself. Image post processing was also undertaken with
visible quality enhancement, Fourier filtering was found to enhance brightness uniformity,
reduce noise deterioration and remove a horizontal acquisition artefact line, while histogram
equalization allowed the optimization of contrast facilitating the discrimination of the several
retinal structures. More laborious techniques such as image addition or image registration may
further enhance image quality.
Once good images of the photoreceptor cones were acquired, the directionality
measurements were made possible. Each of those was undertaken during a period of between
2 and 3 hours and yielded results that despite showing the expected parabolic trend also
display considerable variations. Hence, the method used to execute these measurements
required longer dedication and major improvement. First of all, the long period of time
required to perform the measurements was far from ideal, a much faster method would be
preferred to maintain the measurement conditions throughout the whole process and to avoid
the test subject’s fatigue. Secondly, the design of the illumination system hindered the
accuracy of the measurements: as the light source was displaced laterally to change the
entrance point on the pupil, the region of the retina under illumination changed as well, this
was probably due to the fact that the Maxwellian lens was not displaced along with the source,
a method to concomitantly displace both the source and the Maxwellian lens should be
devised. Sensor pre-amp settings should also be further explored to keep gain constant and
eliminate undesired compensations of image brightness. Finally, the use of adaptive optics on
a dilated pupil would improve not only image quality but also the accuracy of the
measurements.
The goal established at the outset of this project was thus successfully accomplished: a
fundus camera was developed and consistently used to obtain high quality retinal images and
to study photoreceptor directionality in the healthy retina. Retinal imaging is a wide field with
relevant clinical applications, the challenge hereby presented contributed largely to a better
understanding of this important science by the student and author of this thesis. Even though
substantial improvement could be made to the developed setup in the situation of an ongoing
project, the Stiles-Crawford effect was effectively demonstrated, showing how a simple system
capable of assessing this natural feature of the human eye may be created and thus serving as
a motivation to its further development and usage on the clinical environment.

65
11. Future Research Directions
This work serves as a starting point for a PhD project entitled: “Exploring Photoreceptor
Directionality using Quadrant Pupil Detection” [43].
In this project, the developed setup will be modified to use a quadrant detection
arrangement in which light enters the pupil near the SCE peak and reflected light from the
retina is captured through four equal-sized sectors in the pupil plane from which individual
photoreceptor inclinations can be computed.
The method will allow the determination of photoreceptor tilt without requiring the
displacement of the incident beam across the pupil, considerably simplifying the process. In
addition, numerical analysis predicts that the technique will be able to detect photoreceptor
tilts of less than 1 degree in the retinal plane, demonstrating its clinical potential for analysis of
retinal perturbations caused by drusen and retinal pathologies in which photoreceptor
inclination is altered.

66
67
References
[1] Stiles, W. S., & Crawford, B. H. (1933). The luminous efficiency of rays entering the eye
pupil at different points. Proceedings of the Royal Society of London. Series B, Containing
Papers of a Biological Character, 428-450.
[2] Zhevandrov, N. D. (1995). Polarisation physiological optics. Physics-Uspekhi,38(10),
1147.
[3] Flamant, F., & Stiles, W. S. (1948). The directional and spectral sensitivities of the retinal
rods to adapting fields of different wave-lengths. The Journal of physiology, 107(2), 187-
202.
[4] Snyder, A. W., & Pask, C. (1973). The Stiles-Crawford effect—explanation and
consequences. Vision research, 13(6), 1115-1137.
[5] Gorrand, J.M., (2006). The directionality of photoreceptors in the human retina. Bull.
Soc. belge Ophtalmol, 302, 215-229.
[6] Francia, G., & ronchi, L. (1952). Directional scattering of light by the human
retina. JOSA, 42(10), 782_1-783.
[7] Rativa, D., & Vohnsen, B. (2011). Analysis of individual cone-photoreceptor directionality
using scanning laser ophthalmoscopy. Biomedical optics express,2(6), 1423-1431.
[8] Zagers, N., van de Kraats, J., Berendschot, T. T., & van Norren, D. (2002). Simultaneous
measurement of foveal spectral reflectance and cone-photoreceptor
directionality. Applied optics, 41(22), 4686-4696.
[9] Gao, W., Cense, B., Zhang, Y., Jonnal, R. S., & Miller, D. T. (2008). Measuring retinal
contributions to the optical Stiles-Crawford effect with optical coherence
tomography. Optics express, 16(9), 6486-6501.
[10] Applegate, R. A., & Lakshminarayanan, V. (1993). Parametric representation of Stiles-
Crawford functions: normal variation of peak location and directionality.JOSA A, 10(7),
1611-1623.
[11] Safir, A., Hyams, L., Philpot, J., & Jagerman, L. S. (1970). Studies in refraction: I. The
precision of retinoscopy. Archives of ophthalmology, 84(1), 49-61.
[12] Packer, O., & Williams, D. R. (2003). Light, the retinal image, and photoreceptors. The
Science of Color, 2nd ed SK. Shevall, ed. Optical Society of America, Elsevier (Oxford, UK),
41-102.
[13] Flamant, F., & Stiles, W. S. (1948). The directional and spectral sensitivities of the retinal
rods to adapting fields of different wave-lengths. The Journal of physiology, 107(2), 187-
202.
68
[14] Wright, W. D., & Nelson, J. H. (1936). The relation between the apparent intensity of a
beam of light and the angle at which the beam strikes the retina.Proceedings of the
Physical Society, 48(3), 401.
[15] Quimby, R. S. (2006). Photonics and lasers: an introduction. John Wiley & Sons.
[16] Horowitz, B. R. (1981). Theoretical considerations of the retinal receptor as a
waveguide. Vertebrate photoreceptor optics, 23, 219-300.
[17] Stiles, W. S. (1937). The luminous efficiency of monochromatic rays entering the eye
pupil at different points and a new colour effect. Proceedings of the Royal Society of
London. Series B, Biological Sciences, 90-118.
[18] Enoch, J. M., & Stiles, W. S. (1961). The colour change of monochromatic light with
retinal angle of incidence. Journal of Modern Optics, 8(4), 329-358.
[19] Krantz, D. H. (1975). Color measurement and color theory: I. Representation theorem for
Grassmann structures. Journal of Mathematical Psychology, 12(3), 283-303.
[20] Alpern, M. (1986). The Stiles-Crawford effect of the second kind (SCII): a review.
Perception, 15(6), 785-799.
[21] Zhang, X., Ye, M., Bradley, A., & Thibos, L. (1999). Apodization by the Stiles-Crawford
effect moderates the visual impact of retinal image defocus. JOSA A,16(4), 812-820.
[22] Marcos, S., Burns, S. A., & He, J. C. (1998). Model for cone directionality reflectometric
measurements based on scattering. JOSA A, 15(8), 2012-2022.
[23] Gorrand, J. M., & Delori, F. C. (1997). A model for assessment of cone
directionality. Journal of Modern Optics, 44(3), 473-491.
[24] DeHoog, E., & Schwiegerling, J. (2009). Fundus camera systems: a comparative
analysis. Applied optics, 48(2), 221-228.
[25] Colenbrander, A. (2009). Principles of Ophthalmology. Duane's Ophthalmology. 15th ed.
Philadelphia, Pa: Lippincott Williams & Wilkins.
[26] Gullstrand, A. (1910). Neue methoden der reflexlosen ophthalmoskopie.Berichte
Deutsche Ophthalmologische Gesellschaft, 36.
[27] Pomerantzeff, O., Webb, R. H., & Delori, F. C. (1979). Image formation in fundus
cameras. Investigative ophthalmology & visual science, 18(6), 630-637.
[28] Saine, P. Focusing The Fundus Camera: A Clinical Approach. Davis Duehr Eye Associates
[29] Liang, J., Williams, D. R., & Miller, D. T. (1997). Supernormal vision and high-resolution
retinal imaging through adaptive optics. JOSA A, 14(11), 2884-2892.
[30] Roorda, A., & Williams, D. R. (2002). Optical fiber properties of individual human
cones. Journal of Vision, 2(5), 4.
69
[31] Vohnsen, B., & Rativa, D. (2011). Ultrasmall spot size scanning laser
ophthalmoscopy. Biomedical optics express, 2(6), 1597-1609.
[32] Gorrand, J. M., & Delori, F. (1995). A reflectometric technique for assessing
photorecelptor alignment. Vision Research, 35(7), 999-1010.
[33] Vohnsen, B. (2014). Directional sensitivity of the retina: A layered scattering model of
outer-segment photoreceptor pigments. Biomedical optics express,5(5), 1569-1587.
[34] Atchison, D. A., Smith, G., & Smith, G. (2000). Optics of the human eye.
[35] Van Stryland, E., Williams, D., & Wolfe, W. (1996). Handbook of optics (Vol. 2). M. Bass
(Ed.). McGraw-Hill.
[36] Hecht, E. (2002). Optics. Addison Wesley.
[37] Sacek, V. Notes on amateur telescope optics, 2006.
[38] Roorda, A., & Williams, D. R. (1999). The arrangement of the three cone classes in the
living human eye. Nature, 397(6719), 520-522.
[39] Steinman, R. M., Haddad, G. M., Skavenski, A. A., & Wyman, D. (1973). Miniature eye
movement. Science, 181(4102), 810-819.
[40] Wu, J., Seregard, S., & Algvere, P. V. (2006). Photochemical damage of the retina. Survey
of ophthalmology, 51(5), 461-481.
[41] Andor sCMOS Brochure
[42] Andor sCMOS White Paper
[43] Vohnsen, B., Qaysi, S., Anjos, P., & Valente, D. (2015). Exploring Photoreceptor
Directionality using Quadrant Pupil Detection. In: ARVO 2015 Annual Meeting; 2015 May
3-7; Denver, Colorado. Abstract nr 4080.
[44] Delori, F. C., Webb, R. H., & Sliney, D. H. (2007). Maximum permissible exposures for
ocular safety (ANSI 2000), with emphasis on ophthalmic devices. JOSA A, 24(5), 1250-
1265.
[45] Andor Neo sCMOS Specifications

70

71
Appendices
A.1 Health and Safety
Table A.1 Maximum Permissible Radiant Power MPΦ (in watts)
entering the natural or dilated pupil [44]
Table A.2 Parameters to be used in table A.1 [44]
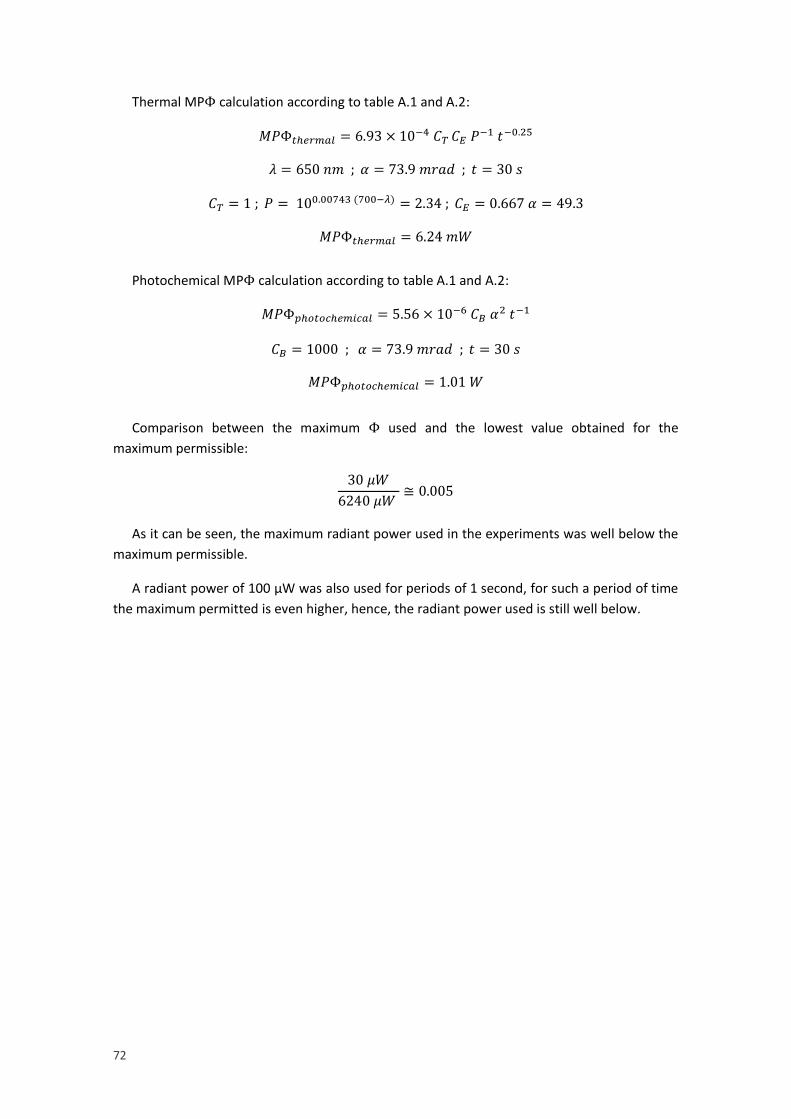
72
Thermal MPΦ calculation according to table A.1 and A.2:
𝑀𝑃Φ𝑡ℎ𝑒𝑟𝑚𝑎𝑙 = 6.93 × 10⁻⁴ 𝐶𝑇 𝐶𝐸 𝑃−1 𝑡−0.25
𝜆 = 650 𝑛𝑚 ; 𝛼 = 73.9 𝑚𝑟𝑎𝑑 ; 𝑡 = 30 𝑠
𝐶𝑇 = 1 ; 𝑃 = 100.00743 (700−𝜆) = 2.34 ; 𝐶𝐸 = 0.667 𝛼 = 49.3
𝑀𝑃Φ𝑡ℎ𝑒𝑟𝑚𝑎𝑙 = 6.24 𝑚𝑊
Photochemical MPΦ calculation according to table A.1 and A.2:
𝑀𝑃Φ𝑝ℎ𝑜𝑡𝑜𝑐ℎ𝑒𝑚𝑖𝑐𝑎𝑙 = 5.56 × 10⁻⁶ 𝐶𝐵 𝛼2 𝑡−1
𝐶𝐵 = 1000 ; 𝛼 = 73.9 𝑚𝑟𝑎𝑑 ; 𝑡 = 30 𝑠
𝑀𝑃Φ𝑝ℎ𝑜𝑡𝑜𝑐ℎ𝑒𝑚𝑖𝑐𝑎𝑙 = 1.01 𝑊
Comparison between the maximum Φ used and the lowest value obtained for the
maximum permissible:
30 𝜇𝑊
6240 𝜇𝑊 ≅ 0.005
As it can be seen, the maximum radiant power used in the experiments was well below the
maximum permissible.
A radiant power of 100 µW was also used for periods of 1 second, for such a period of time
the maximum permitted is even higher, hence, the radiant power used is still well below.

73
A.2 Sensor Specifications
Key Specifications
Sensor Type Front Illuminated Scientific CMOS
Active Pixels 2560 x 2160 (5.5 Megapixel)
Sensor Size 16.6 x 14.0 mm (21.8 mm diagonal)
Pixel readout rate (MHz) 560 (280 MHz x 2 sensor halves)
200 (100 MHz x 2 sensor halves)
Read Noise (e-)
200 MHz
560 MHz
Rolling Shutter
1
1.3
Global Shutter
2.3
2.5
Minimum temperature air cooled
Minimum temperature coolant
-30 °C
-40 °C
Dark current, e-/pixel/sec
@ -30°C
@ -40°C
0.015
0.007
Data range 12 bit & 16 bit
Peak Quantum Efficiency 60%
Readout modes Rolling Shutter and Global (Snapshot) Shutter
Internal memory buffer size 4 GB
Maximum burst frame rates
2560 x 2160 (full frame)
128 x 128 ROI
100 fps Rolling Shutter, 49 fps Global (Snapshot) Shutter
1,639 fps Rolling Shutter, 716 fps Global (Snapshot) Shutter
Pixel well depth (e-) 30,000
Table A.3 Key specifications of the Andor Neo 5.5 sCMOS image sensor [45]

74
A.3 System Development Photographs
Figure A.2 Photographs of the system after the removal of the telescope, installation of
the sensor and proper shielding. The light source (the tip of optical fibre) is completely
shielded with black card and a soft plastic fabric.
Figure A.1 Photograph of the system
with the telescope configuration
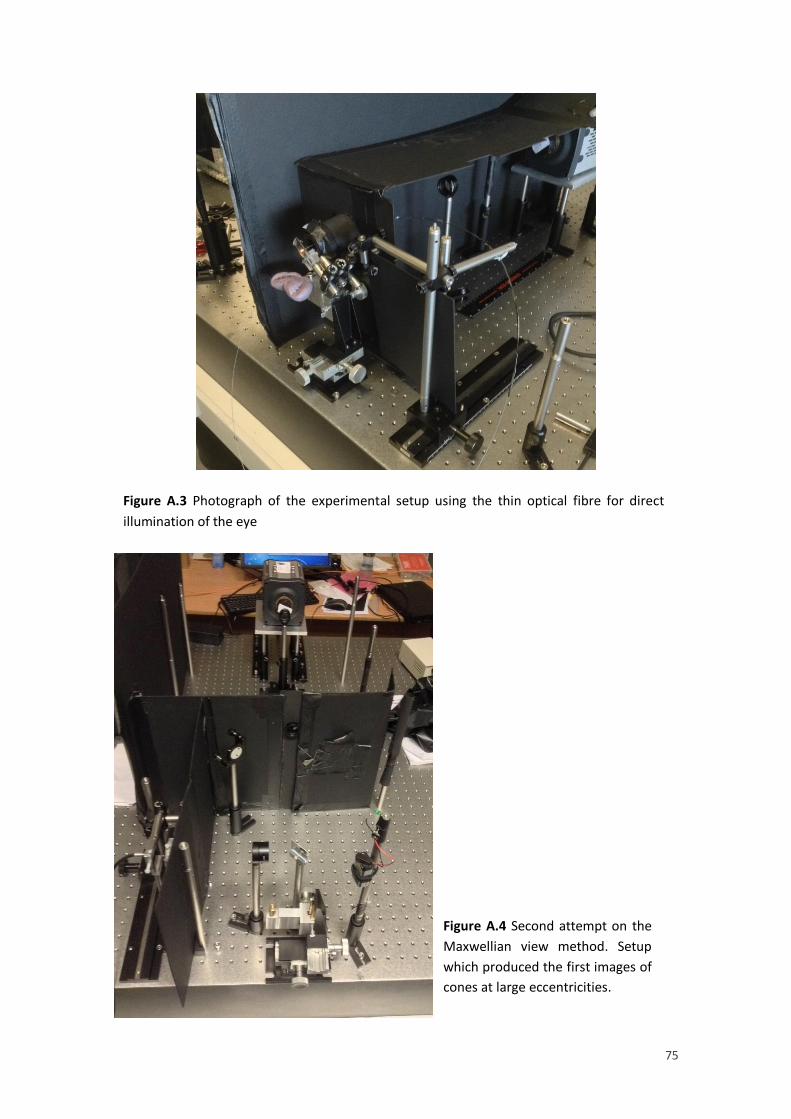
75
Figure A.3 Photograph of the experimental setup using the thin optical fibre for direct
illumination of the eye
Figure A.4 Second attempt on the
Maxwellian view method. Setup
which produced the first images of
cones at large eccentricities.
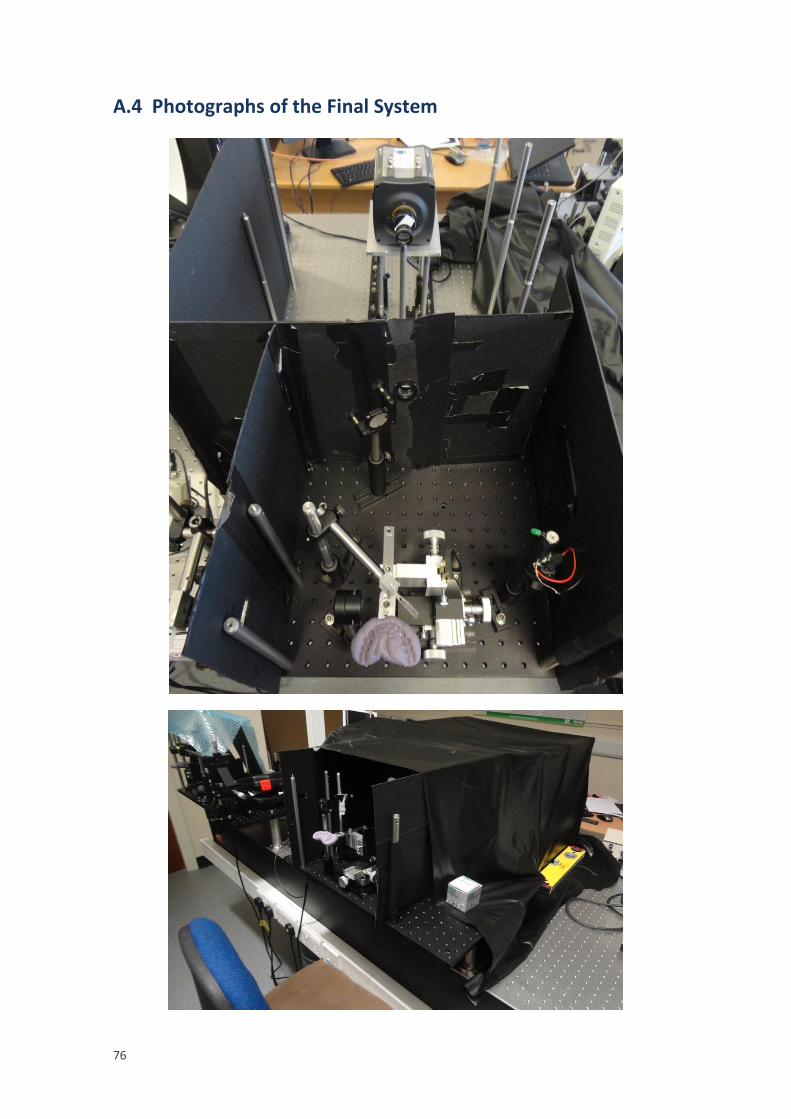
76
A.4 Photographs of the Final System
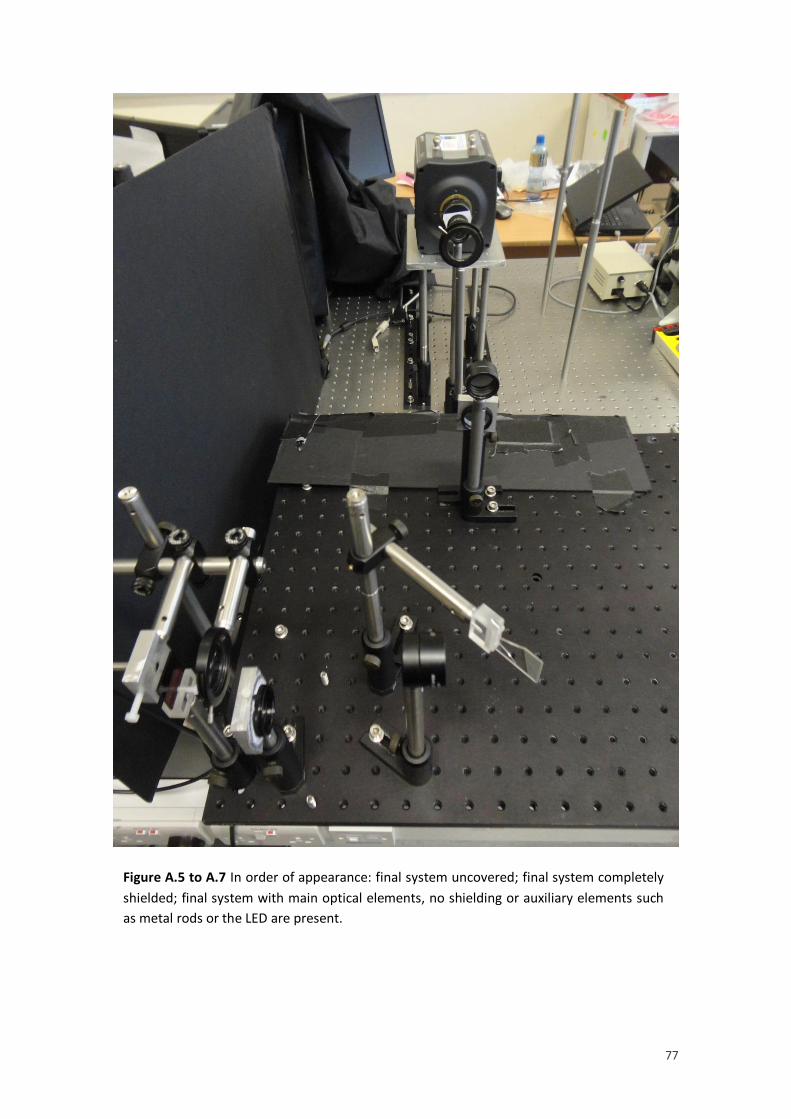
77
Figure A.5 to A.7 In order of appearance: final system uncovered; final system completely
shielded; final system with main optical elements, no shielding or auxiliary elements such
as metal rods or the LED are present.
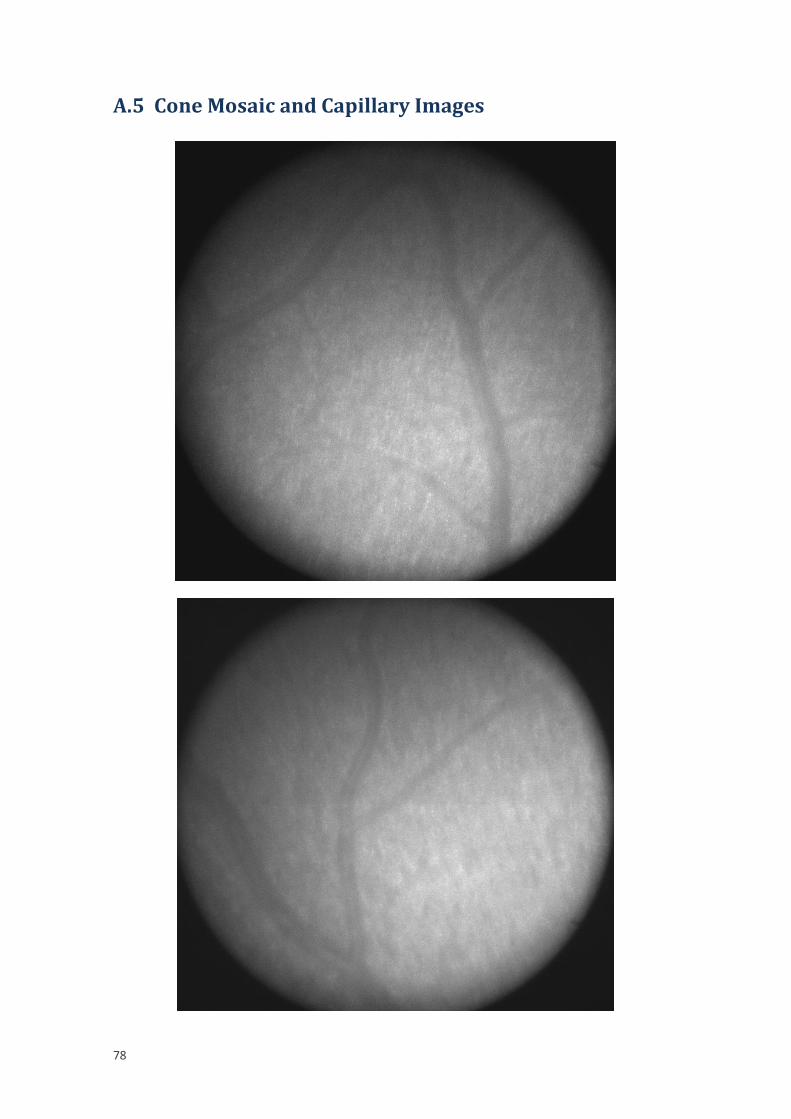
78
A.5 Cone Mosaic and Capillary Images

79

80

81
Figure A.8 to A.14 Parafoveal retinal images obtained with a magnification of 11.5 times.
The last two images were obtained from the author’s right eye while wearing myopic
refraction correction.