Embed Size (px)
Citation preview

4
M
(4) L
(1
(13) Inter
43
Development of a Europeanulti-Model Ensemble Systemfor Seasonal to Inter-AnnualPrediction (DEMETER)
T. N. Palmer(1), A. Alessandri(2), U. Andersen(3),P. Cantelaube(4), M. Davey(5), P. Délécluse(6),M. Déqué(7), E. Díez(8), F. J. Doblas-Reyes(1),H. Feddersen(3), R. Graham(5), S. Gualdi(2),
J.-F. Guérémy(7), R. Hagedorn(1), M. Hoshen(9),N. Keenlyside(10), M. Latif(10), A. Lazar(6),
E. Maisonnave(11), V. Marletto(12), A. P. Morse(9),B. Orfila(8), P. Rogel(11), J.-M. Terres(4)
and M. C. Thomson(13)
Research DepartmentAccepted for publication in Bull.Amer.Meteor.Soc.
February 2004(1) European Centre for Medium-Range Weather Forecasts, Reading, UK
(2) Istituto Nazionale de Geofisica e Vulcanologia, Bologna, Italy(3) Danmarks Meteorologiske Institut, Copenhagen, Denmark
and Management Unit, Institute for Environment and Sustainability, Joint Research Centre, Ispra, Italy(5) Met Office, Bracknell, UK
(6) Laboratoire d’Océanographie Dynamique et de Climatologie, Paris, France(7) Centre National de Recherches Météorologiques, Météo-France, Toulouse, France
(8) Instituto Nacional de Meteorología, Madrid, Spain(9) Department of Geography, University of Liverpool, UK
(10) Max-Planck Institut für Meteorologie, Hamburg, Germany1) European Centre for Research and Advanced Training in Scientific Computation, Toulouse, France
(12) Agenzia Regionale Prevenzione Ambiente dell'Emilia Romagna, Bologna, Italynational Research Institute for Climate Prediction (IRI), The Earth Institute of Columbia University, USA

Series: ECMWF Technical Memoranda A full list of ECMWF Publications can be found on our web site under: http://www.ecmwf.int/publications/ Contact: [email protected] © Copyright 2004 European Centre for Medium Range Weather Forecasts Shinfield Park, Reading, RG2 9AX, England Literary and scientific copyrights belong to ECMWF and are reserved in all countries. This publication is not to be reprinted or translated in whole or in part without the written permission of the Director. Appropriate non-commercial use will normally be granted under the condition that reference is made to ECMWF. The information within this publication is given in good faith and considered to be true, but ECMWF accepts no liability for error, omission and for loss or damage arising from its use.

Development of a European Multi-Model Ensemble System …
Technical Memorandum No.434 1
Summary
Multi-model ensembles comprising leading European global coupled climate models show impressive reliability for seasonal prediction of climate. Output is used to predict probability distributions of malaria incidence and crop yield.
1. Introduction Seasonal-timescale climate predictions are now made routinely at a number of operational meteorological centers around the world, using comprehensive coupled models of the atmosphere, oceans, and land surface (e.g. Stockdale et al. 1998, Mason et al. 1999, Kanamitsu et al. 2002, Alves et al. 2002). This development can be traced back to a revolution in our understanding of the coupled ocean-atmosphere system in the second half of the 20th century (Neelin et al. 1998), to the development and deployment of specialized buoys to observe and measure the evolution of near-surface waters in the tropical Pacific (McPhaden et al. 1998), and, most importantly, to successful predictions of El Niño by prototype coupled ocean-atmosphere models (Zebiak and Cane 1987). In turn, these developments were fostered by the outstandingly successful international Tropical Ocean Global Atmosphere programme (WCRP 1985).
Seasonal forecasts are clearly of value to a wide cross-section of society, for personal, commercial and humanitarian reasons (e.g. National Research Council 1999, Thomson et al. 2000, Pielke and Carbone 2002, Hartmann et al. 2002a, Murnane et al. 2002). However, notwithstanding predictable signals arising from atmosphere-ocean coupling, the overlying atmosphere is intrinsically chaotic, implying that predicted day-to-day evolution of weather is necessarily sensitive to initial conditions (Palmer 1993, Shukla 1998). In practice, the impact of such sensitivity can be determined by integrating forward in time ensembles of forecasts of a coupled ocean atmosphere model, the individual members of the ensemble differing by small perturbations to the starting conditions of the atmosphere and underlying oceans. The phase-space dispersion of the ensemble gives a quantifiable flow-dependent measure of the underlying predictability of the flow.
However, if uncertainties in initial conditions are the only perturbations represented in a seasonal-forecast ensemble, then the resulting measures of predictability will not be reliable; the reason being that the model equations are also uncertain. More specifically, although the equations for the evolution of climate are well understood at the level of partial differential equations, their representation as a finite-dimensional set of ordinary differential equations, for integrating on a digital computer, inevitably introduces inaccuracy. Such inaccuracies can in principle propagate upscale and infect the entire spectrum of scales being predicted by the model.
At present, there is no underlying theoretical formalism from which a probability distribution of model uncertainty can be estimated (see Palmer 2001) - as such a more pragmatic approach must be sought. One such approach relies on the fact that global climate models have been developed somewhat independently at different climate institutes. An ensemble comprising such quasi-independent models is referred to as a multi-model ensemble. The ability of multi-model ensembles to produce more reliable probability forecasts of seasonal climate risk over single-model ensembles, has been addressed by the PROVOST (Prediction of Climate Variations on Seasonal to Interannual Timescales) project funded by the European Union IVth Framework Environment Programme; a similar “sister” project DSP (Dynamical Seasonal Prediction) was undertaken in the United States (Palmer and Shukla 2000, and references therein).
As part of the PROVOST project, several atmospheric general circulation models were integrated over 4-month timescales with prescribed observed sea surface temperatures (SSTs). Each model was itself run in ensemble mode, based on nine different initial conditions from each start date; results were stored in a

Development of a European Multi-Model Ensemble System …
2 Technical Memorandum No.434
common archive in identical format. One of the key results from PROVOST and DSP, is that despite identical SSTs, ensembles showed considerable model-to-model variability in the estimates both of the SST-forced seasonal-mean signal, and the seasonal-mean “noise” generated by internal dynamics (Straus and Shukla 2000, Pavan and Doblas-Reyes 2000). As a result, single-model ensemble estimates of the response to observed SSTs were generally not reliable. Within the PROVOST project, both single-model and multi-model ensembles were treated as potential forecasts (assuming, in some sense, oracular knowledge of the ocean), and scored using probability-forecast skill scores (Doblas-Reyes et al. 2000, Graham et al. 2000, Palmer et al. 2000). A key result was that probability scores based on the full multi-model ensemble were generally higher than those from any of the single-model ensembles.
Based on such results, the DEMETER project (Development of a European Multi-model Ensemble System for Seasonal to Interannual Prediction) was conceived, and funded under the European Union Vth Framework Environment Programme. The principal aim of DEMETER was to advance the concept of multi-model ensemble prediction by installing a number of state-of-the-art global coupled ocean-atmosphere models on a single supercomputer, and to produce a series of six-month multi-model ensemble hindcasts with common archiving and common diagnostic software. Such a strategy posed substantial technical problems, as well as more mundane but nevertheless important issues (e.g. on agreeing units in which model variables were archived).
A description of the DEMETER coupled models, the DEMETER hindcast integrations, the archival structure, and the common diagnostics package used to evaluate the hindcasts, is given in section 2. Some meteorological and oceanographic results, comparing these single and multi-model ensemble hindcasts are described in section 3.
The DEMETER project has applications partners in agronomy and in tropical disease prediction. These applications are described in section 4. A general methodology for assessing the value of ensemble forecasts for such users was discussed in Palmer (2002). In particular, if users have quantitative application models requiring forecast weather information as input (Hartmann et al. 2002b), these models can be directly linked to the output of individual members of the forecast ensemble. The net result is a probability forecast, not of weather or climate, but of a variable directly relevant to the user - e.g. in the case of the agronomist, a forecast probability distribution of crop yield. The potential usefulness of the DEMETER system can then be judged by asking whether the forecast probability distributions of crop yield are sufficiently different from climatological probability distributions and sufficiently reliable, for the agronomist to be able to make decisions or recommendations e.g. on the types of crop to plant. As such, the design of DEMETER was based on the concept of an “end-to-end” system (Buizer et al. 2000, Pielke and Carbone 2002), in which users feed information back to the forecast producers1.
Quantitative application models of the sort used in DEMETER have been derived using data from specific meteorological stations. By contrast, the output from global climate models represents averages over a relatively coarse grid. As such, the statistics of model variables, especially precipitation in regions of steep orography, can differ substantially from the statistics of station data. It is therefore necessary to down-scale the climate model output (Goddard et al. 2001), either by some statistical/empirical scheme, or by embedding a high-resolution limited-area model into the climate model. Both approaches have been followed in DEMETER, and are described in section 4 before discussing the application results.
1 To obtain more information on seasonal-to-interannual prediction applications visit the WMO-CLIPS programme site: http://www.wmo.ch/web/wcp/clips2001/html/index.html
Development of a European Multi-Model Ensemble System …
Technical Memorandum No.434 3
Section 5 describes some experiments intending to analyze the sensitivity of the results to different factors involved in ensemble seasonal prediction with coupled models.
As a result of DEMETER, real-time multi-model ensemble seasonal predictions are now routinely made at the European Centre for Medium-Range Weather Forecasts (ECMWF). This development, and other plans that derive from DEMETER, are outlined in section 6.
2. The DEMETER System 2.1 Coupled models and initialization procedures The DEMETER system comprises 7 global coupled ocean-atmosphere models. A brief summary2 of the different coupled models used in DEMETER is given in Table 1. For each model, except that of the Max Planck Institute (MPI), uncertainties in the initial state are represented through an ensemble of nine different ocean initial conditions (Figure 1). This is achieved by creating three different ocean analyses; a control ocean analysis is forced with momentum, heat and mass flux data from the ECMWF 40-year Re-Analysis3 (ERA-40 henceforth), and two perturbed ocean analyses are created by adding daily wind stress
pos W-P
11/86 02/87 05/87 08/87 11/88
neg W-P
positiveSST-Perturbations
negative SST-Perturbations
no W-P
Figure 1: Schematic representation of the ensemble generation and hindcast production strategy. Dashed lines represent the three continuous runs of ocean analyses forced by ERA-40 data, the control analysis without any windstress perturbations (grey) and two additional analyses with positive/negative (green/red) daily windstress perturbations applied. In order to generate 9 different initial conditions for the coupled hindcasts, four SST-perturbations (represented by the ellipses) are added (blue ellipse) and subtracted (yellow ellipse) to the ocean analyses. Thus, there is one member with no windstress or SST-perturbations applied on and 8 perturbed ensemble members. This procedure is performed every three months at every start date of the hindcasts.
perturbations to the ERA-40 momentum fluxes. The wind stress perturbations are randomly taken from a set of monthly differences between two quasi-independent analyses. In addition, in order to represent the uncertainty in SSTs, four SST perturbations are added and subtracted at the start of the hindcasts. As in the case of the wind perturbations, the SST perturbations are based on differences between two quasi-independent SST analyses. Atmospheric and land-surface initial conditions are taken directly from ERA-40. A separate ensemble initialization procedure is used for the MPI model. Ocean data assimilation has been
2 Detailed information on the models and the initialization procedures can be found on the DEMETER web site: http://www.ecmwf.int/research/demeter/general/docmodel/index.html. 3 ERA-40 intends to produce a global analysis of variables for the atmosphere, land and ocean surface for the period 1958-2001. More information is available in http://www.ecmwf.int/research/era.

Development of a European Multi-Model Ensemble System …
4 Technical Memorandum No.434
used in the MetOffice experiment after 1987 as well as in a sensitivity experiment carried out with the ECMWF model.
CERFACS ECMWF INGV LODYC Météo-France
Met Office MPI
atmosphere component
ARPEGE IFS ECHAM-4 IFS ARPEGE HadAM3 ECHAM-5
resolution T63 31 Levels
T95 40 Levels
T42 19 Levels
T95 40 Levels
T63 31 Levels
2.5º x 3.75º 19 Levels
T42 19 Levels
atmosphere initial conditions
ERA-40 ERA-40 coupled AMIP-type experiment
ERA-40 ERA-40 ERA-40 coupled run relaxed to observed SSTs
reference Déqué 2001 Gregory et al. 2000
Roeckner 1996
Gregory et al. 2000
Déqué 2001 Pope et al. 2000
Roeckner 1996
ocean component
OPA 8.2 HOPE-E OPA 8.1 OPA 8.2 OPA 8.0 GloSea OGCM, based on HadCM3
MPI-OM1
resolution 2.0º x 2.0º 31 Levels
1.4º x 0.3º-1.4º 29 Levels
2.0º x 0.5º-1.5º 31 Levels
2.0º x 2.0º 31 Levels
182 GP x 152 GP 31 Levels
1.25º x 0.3º-1.25º 40 Levels
2.5º x 0.5º-2.5º 23 Levels
ocean initial conditions
ocean analyses forced by ERA-40
ocean analyses forced by ERA-40
ocean analyses forced by ERA-40
ocean analyses forced by ERA-40
ocean analyses forced by ERA-40
ocean analyses forced by ERA-40
coupled run relaxed to observed SSTs
reference Delecluse and Madec 1999
Wolff et al. 1997
Madec et al. 1998
Delecluse and Madec 1999
Madec et al. 1997
Gordon et al. 2000
Marsland et al. 2002
ensemble generation
windstress and SST perturbations
windstress and SST perturbations
windstress and SST perturbations
windstress and SST perturbations
windstress and SST perturbations
windstress and SST perturbations
9 different atmospheric conditions from the coupled initialization run (lagged method)
Table 1: Combinations of atmosphere and ocean models used by the seven partners contributing with coupled models to DEMETER. The resolution of the models and the initialization strategy is outlined as well. The modeling partners are: CERFACS (European Centre for Research and Advanced Training in Scientific Computation, France), ECMWF (European Centre for Medium-Range Weather Forecasts, International Organization), INGV (Istituto Nazionale de Geofisica e Vulcanologia, Italy), LODYC (Laboratoire d’Océanographie Dynamique et de Climatologie, France), Météo-France (Centre National de Recherches Météorologiques, Météo-France, France), Met Office (The Met Office, UK) and MPI (Max-Planck Institut für Meteorologie, Germany).
2.2 Definition of hindcast experiments The performance of the DEMETER system has been evaluated from a comprehensive set of hindcasts over a substantial part of the ERA-40 period. Only hindcasts for the period 1980 to 2001 will be discussed in this paper. This is the period which all seven coupled models participating in the project have generated hindcasts for. Longer time series (up to 43 years) are available for a smaller number of models.
In order to assess seasonal dependence on skill, the DEMETER hindcasts have been started from 1st February, 1st May, 1st August, and 1st November initial conditions. Each hindcast has been integrated for 6 months and comprises an ensemble of 9 members. In its simplest form, the multi-model ensemble is formed

Development of a European Multi-Model Ensemble System …
Technical Memorandum No.434 5
by merging the ensemble hindcasts of the seven models, thus comprising 7x9 ensemble members. To enable a fast and efficient post-processing and analysis of this complex data set, much attention was given to the definition of a common archiving strategy for all models; the ECMWF’s Meteorological Archival and Retrieval System (MARS) was used for this purpose. A large subset of atmosphere and ocean variables4, both daily data and monthly means, has been stored into MARS. Special attention was given to the time-consuming task of ensuring that all model output complies with agreed data formats and units.
A significant part of the DEMETER data set (monthly averages of a large subset of surface and upper-air fields) is freely available for research purposes through an online data retrieval system installed at ECMWF5.
2.3 Diagnostics and evaluation tools The need to provide a common verification methodology has been recognized by the World Meteorological Organization Commission for Basic Systems (WMO-CBS), and an internationally accepted standardized verification system (SVS) is being prepared. Based upon this standard, a comprehensive verification system to evaluate all DEMETER single models as well as the multi-model DEMETER ensemble system has been set up at ECMWF. It is run periodically to monitor hindcast production, to quality control the data (and correct archival) and to calculate a common set of diagnostics.
The DEMETER verification system is designed with a modular structure so as to easily incorporate new evaluation tools provided by project partners or other sources. The basic set of diagnostics is summarized as follows:
• Global maps and zonal averages of the single-model bias are shown. Hindcast anomalies are computed by removing the model climatology for each grid point, each initial month, and each lead time from the original ensemble hindcasts. A similar process is used to produce the verification anomalies.
• Time series of specific climate indices, e.g. related to area-averaged SSTs, precipitation and circulation patterns are displayed.
• Standard deterministic ensemble mean scores, such as anomaly correlation coefficient (ACC), root mean square skill score (RMSSS), and mean square skill score (MSSS) are shown.
• Probabilistic skill measures, such as reliability diagrams, relative operating characteristic (ROC) score, Brier score, ranked probability skill score (RPSS), and potential economic value curves, are calculated and displayed. Significance tests are applied to most of the skill measures.
• The skill of single-model ensembles is compared with that of multi-model ensembles using scatter diagrams of area-averaged skill measures and probability density functions (PDFs) of grid-point skill scores.
Both anomalies and scores have been computed using a cross-validation “leave-one-out” method (Wilks 1995, Livezey 1999). To generate the anomaly or the score for a particular time t, only data at other times different from t have been used.
4 A complete description of the atmosphere and ocean archived variables can be found on the DEMETER website: http://www.ecmwf.int/research/demeter/news/var_list.html 5 Model hindcasts can be retrieved in GRIB and NetCDF formats from http://www.ecmwf.int/research/demeter/data . A tool to display the fields is also available.

Development of a European Multi-Model Ensemble System …
6 Technical Memorandum No.434
The main verification data set used in this system is ERA-40. This is consistent with the general concept of producing the DEMETER hindcasts, in which ERA-40 is used as forcing for the ocean analyses and as atmospheric and land-surface initial conditions. Effectively, it is assumed that we are “living in the ERA-40 world”. However, because of the modularity of the validation system, it is possible to validate the model data with more than one verification data set. In fact, precipitation has been verified against the GPCP dataset6
3. Hindcast Skill Assessment A sample of results from the DEMETER standard verification system is presented in this section. To view a more comprehensive set of verification diagnostics the reader is referred to the DEMETER website7.
The scientific basis for seasonal atmospheric prediction relies on the premise that the lower boundary forcing, in particular SST, can impart significant predictability on atmospheric development (e.g. Palmer and Anderson 1994). Thus, a pre-requisite for successful seasonal forecasts is an ability to represent and predict accurately the state of the ocean. A basic problem, faced when attempting to predict SST with coupled models, is the bias in the model forecasts, which may be comparable to the magnitude of the interannual anomalies to be predicted. Since SSTs in the tropical Pacific are a major source of predictability in the atmosphere on seasonal timescales, model performance in the tropical Pacific is of particular interest. To demonstrate the typical level of skill in this area, Table 2 shows the anomaly correlation coefficient (ACC) of the ensemble mean for the single-model ensembles and the multi-model ensemble for the SSTs averaged over the Niño 3.4 area. The correlation has been computed for the 1-month and 3-month lead seasonal hindcasts starting in February, May, August, and November. Therefore, the values verify during the seasons MAM, JJA, SON and DJF for the 1-month lead hindcasts, and MJJ, ASO, NDJ and FMA for the 3-month lead hindcasts. Results suggest that the single-model ensembles generally perform well as ENSO prediction systems. For the sake of comparison, the ACC for a persisted-SST hindcast has been included. The SST anomaly in the month previous to the starting date has been taken as persistence hindcast. For instance, the 6-month long persistence hindcasts starting on the first of February are obtained from the anomaly on the previous January. Both, the multi-model ensemble and the single models perform at levels comparable to dedicated ENSO prediction models and much better than persistence, especially in the 3-month lead-time
Multi-model CERFACS ECMWF INGV LODYC Météo-France Met Office MPI Persistence
1-month lead
ACC 0.95 0.94 0.93 0.92 0.95 0.93 0.92 0.86 0.80
Bias - -0.34 -0.87 -0.60 -0.96 -0.03 -0.53 -2.07 -
3-month lead
ACC 0.89 0.86 0.86 0.82 0.89 0.83 0.81 0.66 0.62
Bias - 0.07 -1.50 -0.76 -1.52 0.43 1.45 -3.42 - Table 2: Ensemble-mean anomaly correlation coefficient (ACC) and bias for the 1-month and 3-month lead seasonal average of sea surface temperature over the Niño 3.4 area calculated using all start dates for the years 1980-2001. The model acronyms are defined in Table 1. The persistence hindcast is formulated as the anomaly in the month previous to the starting date. Hindcasts verify on the seasons MAM, JJA, SON and DJF for the lead time of 1 month, and MJJ, ASO, NDJ and FMA for the lead time of 3 month. Note that the bias for the multi-model ensemble and the persistence hindcast are not defined because the multi-model ensemble is based on single-model anomalies, which are constructed with regard to the single-model bias, while persistence uses observed anomalies.
6 The GPCP dataset can be found at http://orbit-net.nesdis.noaa.gov/arad/gpcp/ 7 A selection of the verification results is displayed and automatically updated at http://www.ecmwf.int/research/demeter/verification/index.html
Development of a European Multi-Model Ensemble System …
Technical Memorandum No.434 7
range. In addition, note the high correlation of the multi-model ensemble for both lead times, proving it to be the most skilful system in an overall assessment. The bias of the single-models is generally in the range of ±1 K (Table 2). These are typical figures for current state-of-the-art coupled models. As is the case for most variables and areas, there appears to be no clear relationship between bias and skill, though this is a topic that needs further investigation.
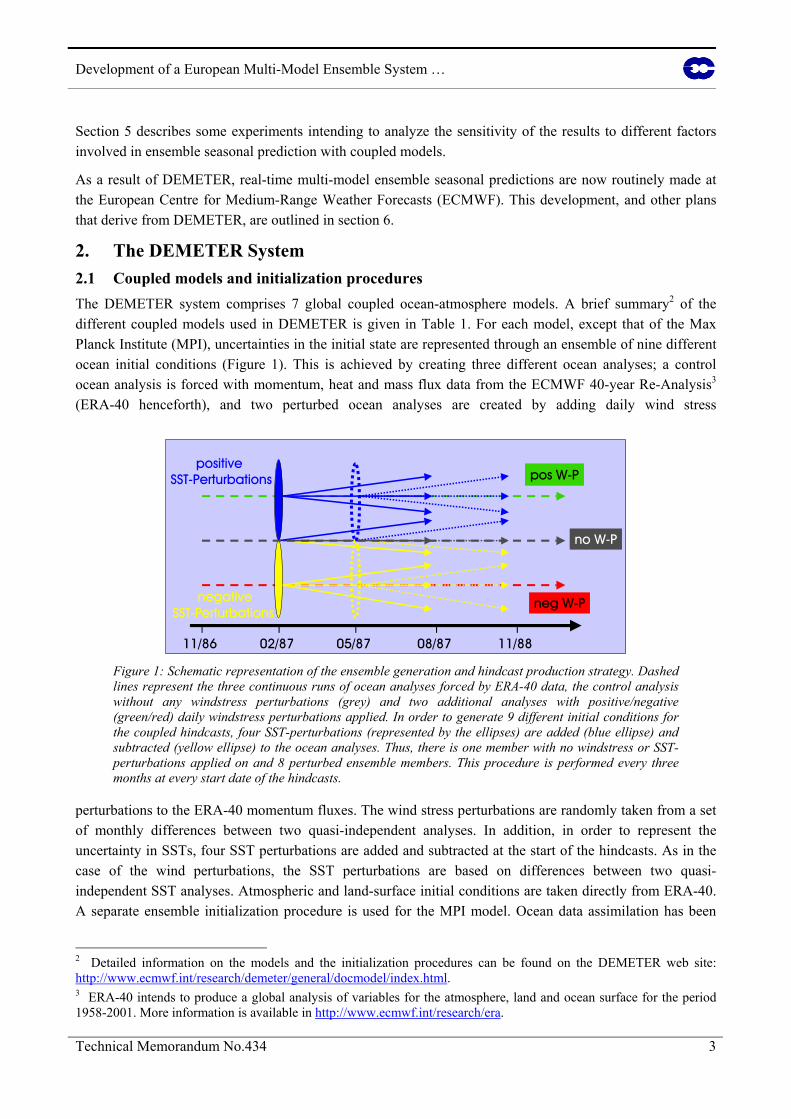
Figure 2 shows 1980-2001 time series of precipitation ACC for all single-models and the multi-model ensemble, for summer (June to August, May start date) over the tropics (Fig. 2a) and winter (December to February, November start date) over the northern extra-tropics (Fig. 2b). The skill in the northern extra-tropics is considerably less than in the tropics. In both regions the variability in prediction skill, both from year to year and between different single models is clearly evident. The occurrence of higher skill during ENSO events is consistent with relatively large ACC for 1982/83, 1987/88 and 1997/98 (Fig. 2). This in turn is consistent with the link between ENSO activity and seasonal predictability found in many studies (for PROVOST see Branković and Palmer 2000). In general, the identity of the most skilful single model varies with region and year. Finally, this figure illustrates the relatively skilful performance of the multi-model ensemble. In spite of the multi-model ensemble not being distinctly superior to the best single-model ensemble for individual events or small regions, in agreement with Peng et al. (2002), it is systematically the most skilful when the scores are averaged over large regions or long time series.
Figure 2: Time series of the ensemble mean precipitation anomaly correlation coefficients for the multi model (thick red bars) and all individual models (thin bars; ECMWF: blue, Met Office: green, Météo-France: orange, MPI: cyan, LODYC: pink, INGV: yellow, CERFACS: grey). (a) 1-month lead summer (JJA) precipitation in the tropics (latitudinal band of 30ºS-30ºN), (b) 1-month lead winter (DJF) precipitation in the northern extra-tropics (latitudinal band of 30ºN- 87.5ºN). Additionally, the average over the whole period 1980-2001 is shown at the end of each plot.
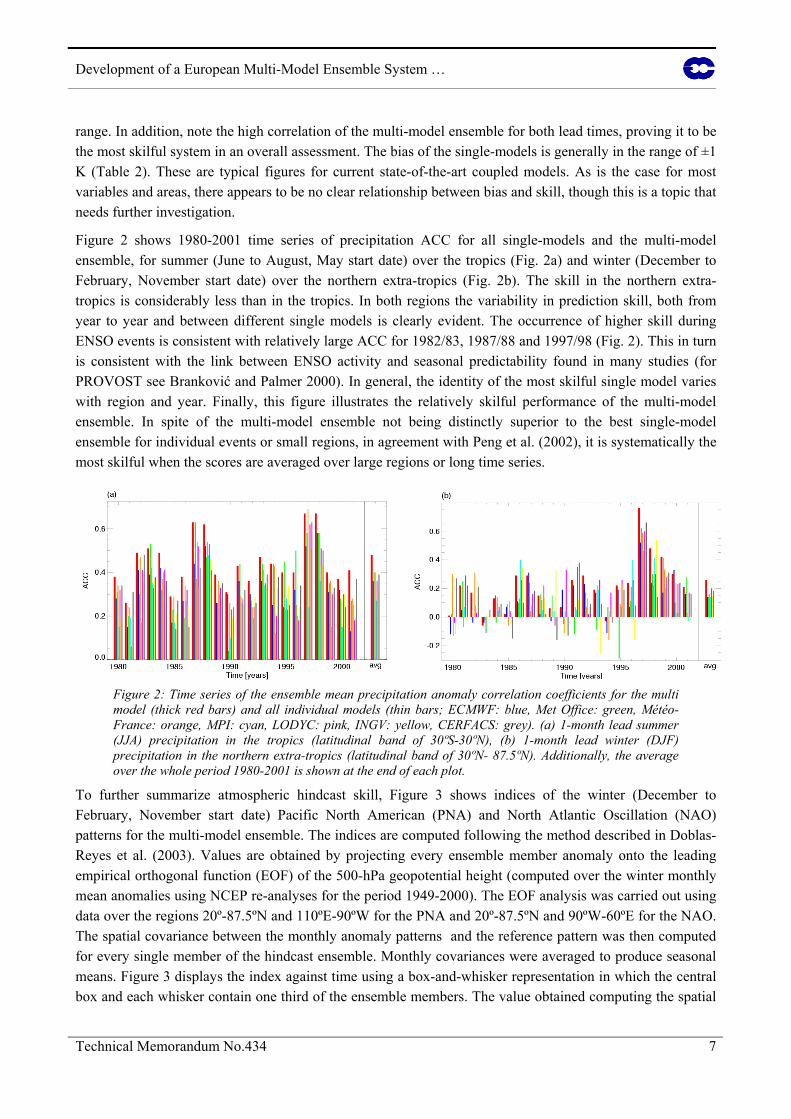
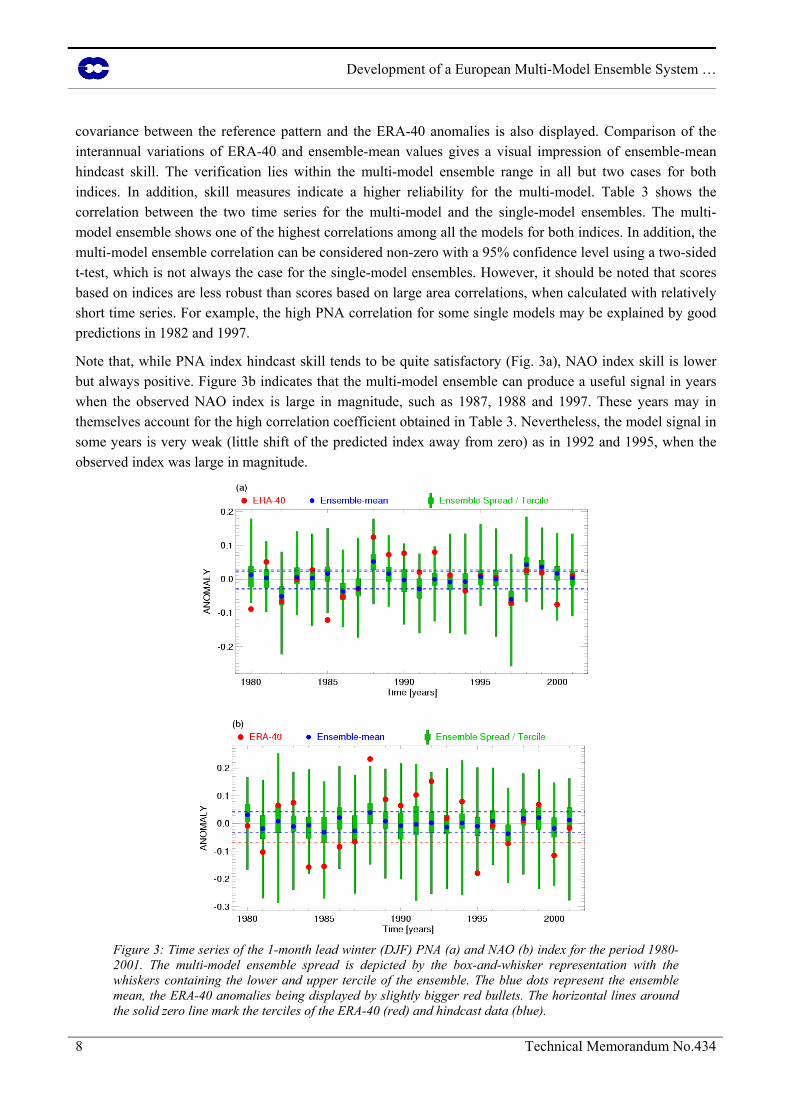
To further summarize atmospheric hindcast skill, Figure 3 shows indices of the winter (December to February, November start date) Pacific North American (PNA) and North Atlantic Oscillation (NAO) patterns for the multi-model ensemble. The indices are computed following the method described in Doblas-Reyes et al. (2003). Values are obtained by projecting every ensemble member anomaly onto the leading empirical orthogonal function (EOF) of the 500-hPa geopotential height (computed over the winter monthly mean anomalies using NCEP re-analyses for the period 1949-2000). The EOF analysis was carried out using data over the regions 20º-87.5ºN and 110ºE-90ºW for the PNA and 20º-87.5ºN and 90ºW-60ºE for the NAO. The spatial covariance between the monthly anomaly patterns and the reference pattern was then computed for every single member of the hindcast ensemble. Monthly covariances were averaged to produce seasonal means. Figure 3 displays the index against time using a box-and-whisker representation in which the central box and each whisker contain one third of the ensemble members. The value obtained computing the spatial
Development of a European Multi-Model Ensemble System …
8 Technical Memorandum No.434
covariance between the reference pattern and the ERA-40 anomalies is also displayed. Comparison of the interannual variations of ERA-40 and ensemble-mean values gives a visual impression of ensemble-mean hindcast skill. The verification lies within the multi-model ensemble range in all but two cases for both indices. In addition, skill measures indicate a higher reliability for the multi-model. Table 3 shows the correlation between the two time series for the multi-model and the single-model ensembles. The multi- model ensemble shows one of the highest correlations among all the models for both indices. In addition, the multi-model ensemble correlation can be considered non-zero with a 95% confidence level using a two-sided t-test, which is not always the case for the single-model ensembles. However, it should be noted that scores based on indices are less robust than scores based on large area correlations, when calculated with relatively short time series. For example, the high PNA correlation for some single models may be explained by good predictions in 1982 and 1997.
Note that, while PNA index hindcast skill tends to be quite satisfactory (Fig. 3a), NAO index skill is lower but always positive. Figure 3b indicates that the multi-model ensemble can produce a useful signal in years when the observed NAO index is large in magnitude, such as 1987, 1988 and 1997. These years may in themselves account for the high correlation coefficient obtained in Table 3. Nevertheless, the model signal in some years is very weak (little shift of the predicted index away from zero) as in 1992 and 1995, when the observed index was large in magnitude.
Figure 3: Time series of the 1-month lead winter (DJF) PNA (a) and NAO (b) index for the period 1980-2001. The multi-model ensemble spread is depicted by the box-and-whisker representation with the whiskers containing the lower and upper tercile of the ensemble. The blue dots represent the ensemble mean, the ERA-40 anomalies being displayed by slightly bigger red bullets. The horizontal lines around the solid zero line mark the terciles of the ERA-40 (red) and hindcast data (blue).

Development of a European Multi-Model Ensemble System …
Technical Memorandum No.434 9
Considerable effort has been devoted to the validation of the ensembles as probability forecasts. The dashed blue and red lines in Figure 3 correspond to the ensemble and ERA-40 terciles . The probabilistic skill measure used is the ranked probabilistic skill score (RPSS, Epstein 1969) based on these terciles. Hindcast performance is summarized in Table 3. RPSS is defined so that positive values imply higher skill than climatology forecasts and perfect forecasts have a skill score of 1. The skill of the multi-model ensemble for the PNA index is close to the skill of the best models and statistically significant at the 95% confidence level, in good agreement with the correlation results. Also, for the NAO index RPSS values are generally high and tend to be statistically significant, which was not the case for the correlation (RPSS statistical confidence has been assessed by computing the distribution of the skill score from a random set of hindcasts obtained by scrambling the available hindcasts and verifications).
Multi-model CERFACS ECMWF INGV LODYC Météo-
France Met Office MPI
Correlation (PNA) 0.41 (0.98) 0.16 (0.00) 0.39 (0.78) 0.23 (0.01) 0.46 (1.00) 0.23 (0.01) 0.31 (0.09) 0.32 (0.10)
Correlation (NAO) 0.54 (1.00) 0.30 (0.05) 0.10 (0.00) 0.20 (0.00) 0.43 (1.00) 0.55 (1.00) 0.18 (0.00) 0.14 (0.00)
RPSS (PNA) 0.18 (1.00) -0.19 (0.00) 0.24 (1.00) -0.02 (0.00) 0.10 (0.99) -0.11 (0.00) 0.22 (1.00) 0.10 (1.00)
RPSS (NAO) 0.10 (1.00) 0.16 (0.99) -0.12 (0.00) 0.04 (0.90) 0.00 (0.00) 0.01 (0.89) -0.12 (0.00) 0.02 (0.91) Table 3: Ensemble-mean correlation and ranked probability skill score for tercile categories for the Pacific North American (PNA) and North Atlantic Oscillation (NAO) indices calculated from the 1-month lead hindcasts started in November (DJF seasonal average) for the years 1980-2001. Confidence levels are indicated in brackets. The model acronyms are defined in Table 1
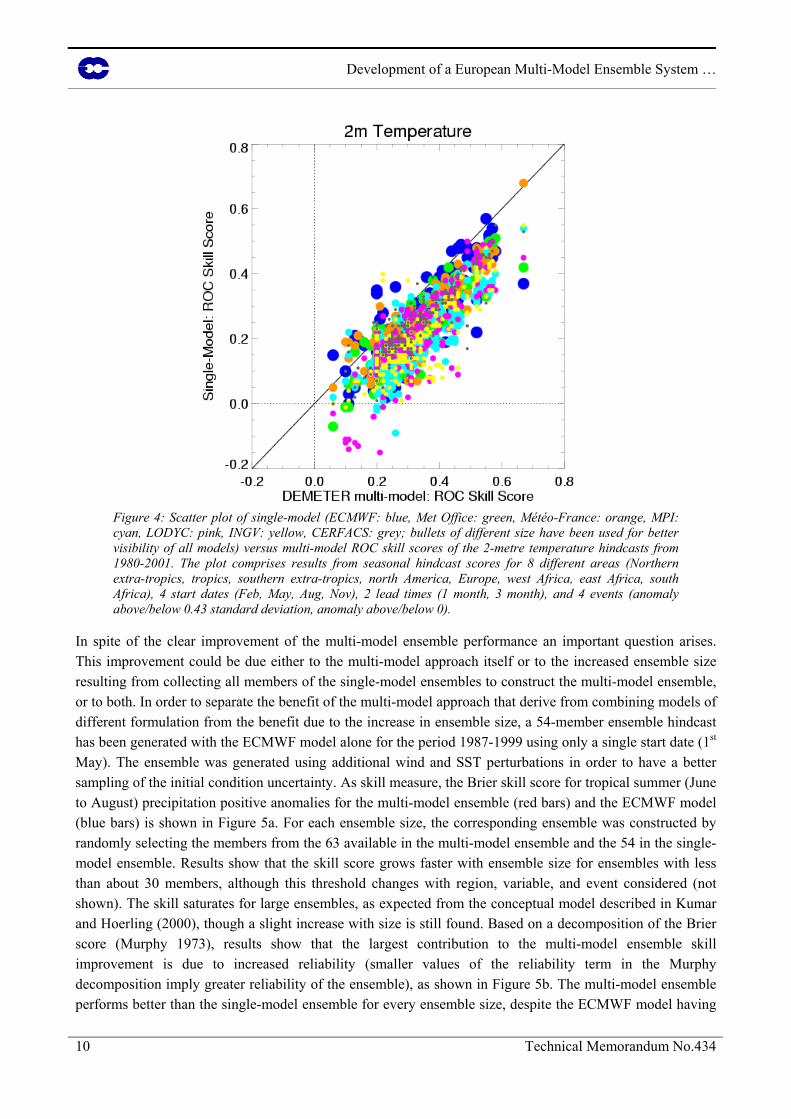
In order to get a more comprehensive assessment of single-model versus multi-model ensemble skill, a number of ROC skill scores are collected together (Fig. 4). The value of the area under the ROC curve is a probabilistic skill measure ranging from 0 to 1 (Swets 1988). The ROC skill score is constructed as twice the area minus one, ranging between -1 and +1. Values below 0 imply lower skill than climatology, whilst a perfect forecast has a ROC skill score of 1. The comparison of all ROC skill scores for 2-metre temperature, calculated over different regions, start dates, lead times and events shows that, although in some cases single-model ensembles have a higher ROC score than the multi-model ensemble, in the vast majority of cases (90%) the ROC skill score of the multi-model ensemble exceeds the score of the single models. Furthermore, the number of cases with less skill than climatology is greatly reduced for the multi-model ensemble; for the latter there are no cases with negative ROC skill score compared to 25 cases for the single models.
The greater probabilistic skill of the multi-model ensemble compared to the single-model skill leads to an increased potential economic value (Richardson 2000, Palmer et al. 2000, Atger 2001). For instance, it has been found that, for predictions of positive tropical winter (December to February, November start date) precipitation anomalies, the multi-model ensemble improves potential economic value from 15% to 80%, depending on the single model taken as reference (not shown).
Development of a European Multi-Model Ensemble System …
10 Technical Memorandum No.434
Figure 4: Scatter plot of single-model (ECMWF: blue, Met Office: green, Météo-France: orange, MPI: cyan, LODYC: pink, INGV: yellow, CERFACS: grey; bullets of different size have been used for better visibility of all models) versus multi-model ROC skill scores of the 2-metre temperature hindcasts from 1980-2001. The plot comprises results from seasonal hindcast scores for 8 different areas (Northern extra-tropics, tropics, southern extra-tropics, north America, Europe, west Africa, east Africa, south Africa), 4 start dates (Feb, May, Aug, Nov), 2 lead times (1 month, 3 month), and 4 events (anomaly above/below 0.43 standard deviation, anomaly above/below 0).
In spite of the clear improvement of the multi-model ensemble performance an important question arises. This improvement could be due either to the multi-model approach itself or to the increased ensemble size resulting from collecting all members of the single-model ensembles to construct the multi-model ensemble, or to both. In order to separate the benefit of the multi-model approach that derive from combining models of different formulation from the benefit due to the increase in ensemble size, a 54-member ensemble hindcast has been generated with the ECMWF model alone for the period 1987-1999 using only a single start date (1st May). The ensemble was generated using additional wind and SST perturbations in order to have a better sampling of the initial condition uncertainty. As skill measure, the Brier skill score for tropical summer (June to August) precipitation positive anomalies for the multi-model ensemble (red bars) and the ECMWF model (blue bars) is shown in Figure 5a. For each ensemble size, the corresponding ensemble was constructed by randomly selecting the members from the 63 available in the multi-model ensemble and the 54 in the single-model ensemble. Results show that the skill score grows faster with ensemble size for ensembles with less than about 30 members, although this threshold changes with region, variable, and event considered (not shown). The skill saturates for large ensembles, as expected from the conceptual model described in Kumar and Hoerling (2000), though a slight increase with size is still found. Based on a decomposition of the Brier score (Murphy 1973), results show that the largest contribution to the multi-model ensemble skill improvement is due to increased reliability (smaller values of the reliability term in the Murphy decomposition imply greater reliability of the ensemble), as shown in Figure 5b. The multi-model ensemble performs better than the single-model ensemble for every ensemble size, despite the ECMWF model having

Development of a European Multi-Model Ensemble System …
Technical Memorandum No.434 11
particularly good behaviour over the tropics. The increase in Brier skill score and reliability is similar for both the single-model and the multi-model ensembles, so that their difference remains approximately constant as the ensemble size increases. This implies that the multi-model ensemble advantage over a given single-model ensemble as showed in Figures 2-4 is not an artefact of the usually large ensemble size of the multi-model, but rather due to the multi-model approach itself. Similar results are found for other variables and regions. This suggests that the multi-model ensemble provides a better sampling of forecast uncertainty in the sense that it contains the verification more often than a given single model ensemble.
Figure 5: Brier skill score (a) and reliability component of the Brier score (b) for the 1-month lead tropical summer (JJA) precipitation 1987-1999 as a function of the ensemble size for the ECMWFmodel (blue) and the DEMETER multi-model (red) ensembles. The event is ''precipitation anomalies above zero''. Results are shown for different ensemble sizes from 9 to 54 members. Note that lower values of the reliability term mean better reliability.
4. Seasonal forecast applications One of the main objectives of DEMETER is a demonstration of the utility of seasonal climate forecasts through the coupling of quantitative application models, such as crop yield models, to the global climate prediction models. However, existing application models typically require weather input (precipitation, temperature, wind, radiation, etc.) at a substantially higher spatial resolution than is available from the global models. We therefore begin this section with a brief discussion of the downscaling techniques used in DEMETER.
Development of a European Multi-Model Ensemble System …
12 Technical Memorandum No.434
4.1 Downscaling In DEMETER, both statistical/empirical methods and dynamical regional climate models have been tested and applied for downscaling purposes. The methods used and some illustrative results are described in the following.
In the statistical/empirical methods, a mapping (e.g. based on regression methods, analogue techniques, or neural networks; Wilby and Wigley 1997, 2000) is derived from one or more large-scale fields to the fine scale required by the application models. The statistical methods are relatively straightforward to apply and are computationally cheap.
As an illustrative example, Figure 6 displays total precipitation over Spain for the February to April seasonal average. The raw multi-model ensemble output for the hindcast started in November 1986 (Figure 6a, showing a multi-model ensemble mean field from the ECMWF and Met Office coupled models), and the downscaled precipitation based on three different downscaling methods are shown in the figure. The observed precipitation is displayed in Figure 6b, while Figure 6c shows the network used to create this database. The first downscaling method (Fig. 6d) is based on the search for analogues of 1000 and 500 hPa geopotential and low-level relative humidity fields of the ECMWF and UKMO models. This method is currently used operationally for short-range precipitation forecasts (Fernández et al. 2001) at the Spanish Instituto Nacional de Meteorología. The second method (Fig. 6e) uses a stochastic weather generator (Richardson 1981) and is based on a regression of the leading modes of a maximum covariance analysis (MCA, Feddersen et al. 1999) between model predictions of seasonal precipitation and gridded observations of precipitation on a 50x50 km grid compiled by the European Commission Joint Research Centre (EC-JRC) (van der Voet et al. 1994, Terres 1999). Both downscaling methods emphasize the anomalously wet area over Northwestern Spain (of which there is only a slight indication in the raw model output).
As a second type of downscaling method, dynamical models have also been used in DEMETER. Dynamical downscaling has the potential to outperform statistical/empirical methods, particularly in the prediction of extreme events or in areas where observed data needed to train the statistical/empirical models, are not available. However, there are outstanding problems, including propagation of systematic biases from the global to the regional model (Giorgi and Mearns 1999). In addition, the computational expense of running a high-resolution regional climate model can be comparable to that of running a global seasonal prediction model.
Regional climate models have been applied to study local effects of global climate change resulting from increasing concentration of greenhouse gases in the atmosphere (e.g. Christensen et al. 2001). By comparison, little has been done for the seasonal time scale (Misra et al. 2003).
The dynamical downscaling method tested in DEMETER is based on the Rossby Centre Atmosphere (RCA) model, which is a climate version of the HIRLAM regional weather prediction model (Rummukainen et al. 2001). The RCA model has been nested to the ECMWF model output and run in climate mode for six months. To demonstrate the feasibility of the approach, a set of runs was started the first of November for 1986, 1987 and 1988 and the first of May for 1987, 1988 and 1989. The area covered by the RCA integration was 15.5ºN-65.0ºN and 67.5ºW-31.0ºE (Atlantic/European region). The horizontal resolution was 0.5º with 31 levels in the vertical.

Development of a European Multi-Model Ensemble System …
Technical Memorandum No.434 13
Figure 6: Three-month (February to April) average precipitation over Spain for the ensemble mean of the multi-model hindcasts (ECMWF and Met Office models) initialized in November 1986 (a). Panel (b) shows the corresponding observed precipitation, which has been computed using the stations of the Spanish synoptic network (d). The downscaled precipitation with the analogue-based (d), MCA-based (e), and dynamical (f) methods is shown in the lower row.
Figure 6f shows the hindcast for February-to-April 1987 average precipitation (November 1986 start date, 3-member ensemble) over Spain. The precipitation pattern is more realistic than that of the global-model ensemble, especially over Northwestern Spain, although for this case the statistical/empirical downscaling methods appear to perform as well or better. The RCA model has also being run for a region covering Africa to test the ability to provide downscaled climate forecast information for the malaria prediction application described below.
4.2 Crop yield prediction The total value of European Union (EU) agriculture is around 200 billion €, while EU countries are collectively the largest importers of agricultural products in the world, and the second largest exporters (European Commission 2000). Moreover, the EU production of wheat is around 100 million tons, setting the EU as the second largest producer in the world after Asia (FAOSTAT 2001). Western European agriculture is highly intensive and weather is a principal source of uncertainty for crop yield assessment and for crop management (Vossen 1995). As such, seasonal weather forecasts have high potential value for European agriculture.
Crop simulation models that estimate crop growth and crop yield, as a function of environmental conditions and management practices, are important tools for decision-makers (Boote et al. 1996, Hoogenboom 1997). These models can be used for simulating and forecasting crop yields, and in addition for computing the effects of management practices (such as irrigation, sowing time or nitrogen fertilization; Hoogenboom 2000), and assessing the pressures of these practices on the environment (for example through nitrate
Development of a European Multi-Model Ensemble System …
14 Technical Memorandum No.434
leaching or crop water requirement; Singh and Thornton 1992). They can also be applied for the assessment of climatic-change risk in agriculture (Harrison et al. 1995).
The EC-JRC Crop Growth Monitoring System uses a crop model called WOFOST (WOrld FOod STudies), and performs crop yield forecasting through a regression analysis comparing simulated crop indicators and historical yield series for the main crops at national / European level (van Diepen and van der Wal 1995). To estimate the yield at the end of the season, the regression analysis module computes the best predictor equation from: a) the technological time trend and b) a number of simulated crop indicators. However, in the current system, at the time when a crop yield forecast is issued, the weather conditions leading up to harvest time are unknown and are therefore a major source of uncertainty. The provision of seasonal predictions brings additional information for the remaining crop season. At the local level, the Regional Meteorological Service of the Emilia-Romagna environmental agency (ARPA-SMR, Italy) also uses WOFOST as part of a geographical soil water flow and transport simulation system called CRITERIA (Marletto et al. 2001).
The potential importance of seasonal predictions for crop yield estimation was demonstrated by forcing the crop model with ERA-15 re-analysis used as a “perfect forecast” and comparing with the current operational system in crop yield forecasting at EC-JRC (Terres and Cantelaube 2003). Results showed that simulated crop indicators had a higher contribution in the estimated yield, as one of them was selected as the best predictor (compared with the technological time trend factor) in a greater number of cases than the current operational system, and moreover yield estimates were closer to the reference crop yield (based on the Eurostat8 value) in nearly twice as many cases.
As stated above, given the low spatial resolution of the coupled models, a need to downscale the global model output is evident. For example, in terms of the “perfect forecast” experiment described above, the downscaled precipitation over the Iberian Peninsula improved substantially the simulated plant biomass, compared with the result obtained using raw model output. This resulted in a 10% reduction in root mean square error and an increase of regression coefficient from 0.63 to 0.71.
Based on the system described above, an innovative method to supply seasonal forecast information to crop simulation models has been developed in DEMETER. It consists of running the crop model on each individual member of the ensemble to derive a PDF of the crop yield. Based on this PDF, the end-user can directly quantify the benefits and risks of specific weather-sensitive decisions.
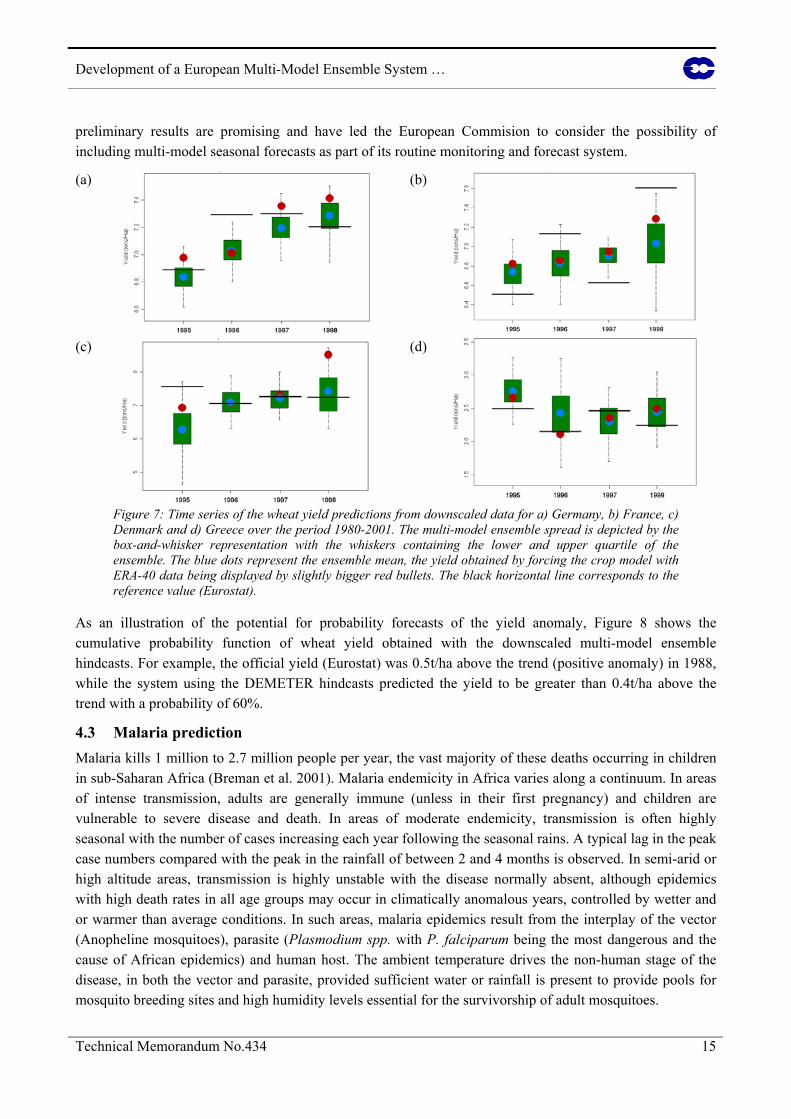
Wheat yield hindcasts for European countries were carried out over four years (1995-1998) using DEMETER multi-model ensemble downscaled data. Figure 7 shows the predictions for Germany and France, the largest wheat producers in Europe, along with those for Denmark and Greece. For the sake of comparison, a set of runs were also carried out with the crop model using downscaled ERA-40 data, these results being depicted with red dots. This reference differs in some cases from the official Eurostat figures (depicted with horizontal black lines) for several reasons not only related to the quality of ERA-40 data, but also related to the uncertainty associated with the crop yield recorded by the member states and the lack of impact from pests and conditions at harvest. Substantial interannual variations are found for the ERA-40 estimates in every country. They are satisfactorily matched by the multi-model ensemble prediction. In fact, the ERA-40 yield estimate, in every single case, lies within the multi-model ensemble range. Quantitative forecast quality estimates are not available given the short length of the time series, although these
8 Eurostat: Statistical Office of the European Union. Eurostat value being the reference for yield comparison (official yield value).
Development of a European Multi-Model Ensemble System …
Technical Memorandum No.434 15
preliminary results are promising and have led the European Commision to consider the possibility of including multi-model seasonal forecasts as part of its routine monitoring and forecast system.
(a)
(b)
(c)
(d)
Figure 7: Time series of the wheat yield predictions from downscaled data for a) Germany, b) France, c) Denmark and d) Greece over the period 1980-2001. The multi-model ensemble spread is depicted by the box-and-whisker representation with the whiskers containing the lower and upper quartile of the ensemble. The blue dots represent the ensemble mean, the yield obtained by forcing the crop model with ERA-40 data being displayed by slightly bigger red bullets. The black horizontal line corresponds to the reference value (Eurostat).
As an illustration of the potential for probability forecasts of the yield anomaly, Figure 8 shows the cumulative probability function of wheat yield obtained with the downscaled multi-model ensemble hindcasts. For example, the official yield (Eurostat) was 0.5t/ha above the trend (positive anomaly) in 1988, while the system using the DEMETER hindcasts predicted the yield to be greater than 0.4t/ha above the trend with a probability of 60%.
4.3 Malaria prediction Malaria kills 1 million to 2.7 million people per year, the vast majority of these deaths occurring in children in sub-Saharan Africa (Breman et al. 2001). Malaria endemicity in Africa varies along a continuum. In areas of intense transmission, adults are generally immune (unless in their first pregnancy) and children are vulnerable to severe disease and death. In areas of moderate endemicity, transmission is often highly seasonal with the number of cases increasing each year following the seasonal rains. A typical lag in the peak case numbers compared with the peak in the rainfall of between 2 and 4 months is observed. In semi-arid or high altitude areas, transmission is highly unstable with the disease normally absent, although epidemics with high death rates in all age groups may occur in climatically anomalous years, controlled by wetter and or warmer than average conditions. In such areas, malaria epidemics result from the interplay of the vector (Anopheline mosquitoes), parasite (Plasmodium spp. with P. falciparum being the most dangerous and the cause of African epidemics) and human host. The ambient temperature drives the non-human stage of the disease, in both the vector and parasite, provided sufficient water or rainfall is present to provide pools for mosquito breeding sites and high humidity levels essential for the survivorship of adult mosquitoes.

Development of a European Multi-Model Ensemble System …
16 Technical Memorandum No.434
Figure 8: Cumulative distribution function of the wheat yield anomalies for Spain predicted for 1987 (blue), 1988 (red) and 1989 (green) with the multi-model ensemble downscaled data. The black solid line corresponds to the historical cumulative distribution function.
It has been proposed that malaria early warning systems, which incorporate vulnerability assessment, seasonal climate forecasts, weather monitoring and case surveillance, be developed for unstable areas in Africa (WHO 2001). However, since seasonal climate forecasts are inherently probabilistic, it is important to develop models which represent the associated PDF of epidemic risk in order to give decision makers confidence in the use of such forecasts (Thomson et al. 2000).
Models for use in epidemic malaria prediction may be either statistical (Hay et al. 1998) or mathematical-biological. The biological processes may be included in the model as a series of interlinked submodels, each represented as coupled differential equations with a probabilistic transition between model stages. The equations’ parameters are deduced from empirical data (when available) or by fitting the model to data. The biological model permits the impact of malaria control interventions (such as insecticide spraying of houses) to be analyzed directly in the model. It can also be used to assess the potential impact of future climate change on malaria transmission (McCarthy et al. 2001). Furthermore, the timing of interventions in relation to their impact on the seasonal transmission of infection can be assessed and thereby the cost-effectiveness of early intervention established.
In this context, a numerical dynamic biological model that predicts the onset of potential epidemics and is driven by temperature and precipitation daily time series has been developed (Hoshen et al. 2003). The meteorological data used in the model may come from station observations, ERA-40 or seasonal hindcasts. The model simulates the population dynamics of cohorts of mosquitoes, and thus predicts the behavior of the total mosquito population. The lag that is seen between extreme climatic conditions and the actual peak in any malaria epidemic is a result of three processes: the time taken for mosquitoes to breed and develop, the time required for the parasite to develop in the mosquito and the time it takes for a human to become infectious.
The model was first tested using either station or ERA-40 data. For example, the model has been run on continental ERA-40 data to assess its value in terms of depicting the normal seasonality of the disease across Africa, and showed the known patterns of the epidemiology of malaria. It has also been compared with a short time series of hospital malaria case data using local meteorological station data. However, bias

Development of a European Multi-Model Ensemble System …
Technical Memorandum No.434 17
correction and downscaling techniques need to be applied to the ensemble outputs to maximize their potential in a malaria forecast model. Unfortunately, statistical/empirical downscaling will be harder to perform in Africa than in other regions due to the paucity of long-term local observations. Therefore, alternative modeling-based downscaling methods are required. As an initial step, a simple bias correction scheme has been used. An estimate of the seasonal cycle using daily data has been constructed for both ERA-40 and the different models. A seasonal cycle estimate has been obtained separately for each hindcast initial date and for each model. The difference between these seasonal cycles has been added to each member of an ensemble hindcast. Figure 9 shows an example for the grid point 20.0ºS 27.5ºE (the closest to Hwange, an area with high malaria incidence in Botswana) using data corrected for the daily bias of precipitation and temperature as described above. The three-month average of monthly incidence, as simulated by the biological model using ERA-40 data for the period 1987-2001, is shown in red. Incidence is defined as the percentage of people in a population who are infected over a given period (a month in this particular case) by the malaria parasite. Values obtained by forcing the model with ERA-40 data have been considered as “truth” given the scarcity of clinical cases reports. The hypothesis that an ensemble of multi-model seasonal hindcasts could predict probabilistically the temporal structure of malaria prevalence has been assessed. For this purpose, the biological model was run using temperature and precipitation from each of the 63 bias-corrected members of the multi-model ensemble. The resulting monthly indicence was then averaged over months 2 to 4 and displayed in Figure 9 using a box-and-whisker representation, with the whiskers containing the lower and upper terciles of the ensemble and the ensemble mean as a blue dot. The multi-model predictions represent the seasonal cycle with the maximum of incidence in boreal spring (March to May). In addition, the multi-model ensemble hindcasts match the interannual evolution of the ERA-40 estimates. As a measure of skill, the RPSS of the malaria prevalence time series is 0.24 for the DJF major epidemic season, which has a confidence level of 0.95. Hence, the interannual variability of the reference malaria incidence is predicted with some success, the reference value being always with the multi-model ensemble range for the MAM period. These promising results have led to further research in which the malaria model will be forced with downscaled seasonal prediction data.
Figure 9: Three-month average of relative monthly malaria incidence for the 1-month lead hindcasts at the grid point 20.0ºS-27.5ºE (Botswana). The red bullets correspond to the incidence obtained forcing the malaria model with bias-corrected ERA-40 data. The multi-model ensemble results calculated using all start dates for the period 1987-2001 are depicted using a box-and-whisker representation, with the whiskers containing the lower and upper terciles of the ensemble, and the ensemble-mean as a blue dot.

Development of a European Multi-Model Ensemble System …
18 Technical Memorandum No.434
5. Sensitivity Experiments Various sensitivity studies have been carried out falling into four categories. In the first, methods for generating ensemble spread (i.e., use of perturbed SST and wind stress patterns and stochastic physics) are assessed. In the second category, the impact of ocean initial data and model resolution on the hindcasts is investigated. In the third, experiments to determine the nature of equatorial SST biases are performed. Finally, the benefits of the coupled system over a prediction system using an atmosphere-only model forced by persisted SST anomalies are examined. In the interests of brevity, only this last sensitivity study is discussed in more detail. Further details on the other experiments will be published elsewhere.
Given the biases that are present in coupled models, it is important to assess the benefits of using a fully coupled system. The Met Office has performed a parallel set of hindcasts using the HadAM3 atmospheric model (the atmospheric component of the coupled GloSea model, see Table 1) forced by persisted SST anomalies. The initial conditions for individual ensemble members are taken from ERA-40 at 6-hourly intervals starting two days before the hindcast date. Full results can be viewed on the DEMETER web site9.
Although the advantages of a coupled model over an atmosphere-only integration with persisted SST anomalies are likely to vary between El Niño and non-El Niño conditions (Graham et al. 2000), the sample of years available is not sufficiently large to make such a distinction. Here instead, an overall comparison based on 1987-1999 hindcast is given, based on ROC scores obtained with the GloSea and HadAM3 models for probabilistic predictions of above normal seasonal-mean 2-metre temperature (Fig. 10). Scores are calculated for 3-month mean values corresponding to early and conventional seasonal periods (i.e., for boreal spring the early season is defined as February to April and the conventional season as March to May). The prediction for the early season is at 3-month lead (i.e., a long-lead outlook), while the prediction for the conventional season is at 1-month lead (i.e., corresponding to an "update" on the long-lead prediction). Scores for six geographical regions are shown. The number of times each model is more skilful than the other is indicated next to the appropriate axis. In counting the "wins" for each model, only cases where the difference in scores exceeds 2%, and the winning model has a score exceeding 0.5 are considered.
Comparisons for 2-metre temperature show a degree of scatter about the diagonal in most seasons. Nevertheless (as indicated by the number of wins) the overall performance of GloSea and HadAM3 is similar in spring, summer and autumn, while for the winter season GloSea appears notably more successful, with 7 wins versus 1. Scores are highest for the tropical region in all seasons with GloSea achieving the best scores in all cases and, as expected, the “update” scoring better than the “long-lead” hindcast. Notable successes for GloSea at 3-month lead include forecasts of February-to-April temperature over North America (Fig. 10a), and November-to-January temperature in the tropics, West Africa and Northern Extratropics (Fig. 10d). In contrast HadAM3 currently appears to perform better at both lead-times over Europe in summer and autumn. In winter scores for Europe are similar with both models, while in spring GloSea has better 1-month lead forecasts, while HadAM3 is notably better at 3-month lead (Fig. 10a).
9 http://www.ecmwf.int/research/demeter/verification/index.html

Development of a European Multi-Model Ensemble System …
Technical Memorandum No.434 19
Figure 10: Comparison of ROC scores for probabilistic predictions of the event "2-metre temperature above the climate normal" obtained with the GloSea and HadAM3 models for six geographical regions (Northern Extratropics, N; Tropics, T; Southern Extratropics, S; Europe, E; North America, A; West Africa, W). Scores for two lead times are shown, a 3-month-lead (long-lead) forecast for the "early" season (early spring/summer/autumn/winter = FMA/MJJ/ASO/NDJ) in red, and a 1-month-lead "update" forecast for the conventional season (MAM/JJA/SON/DJF) in blue. The number of times the score obtained with each model exceeds that of the other model is provided next to the appropriate axis. Only cases when the winning model achieves a ROC score that exceeds 0.5 (the "no skill" threshold), and exceeds that of the other model by 2% or more are counted. Scores are calculated over the period 1987-1999. Forecasts are verified against anomalies from ERA-40.
6. Conclusions As part of a European-Union funded DEMETER project, a multi-model ensemble system based on seven European global coupled ocean-atmosphere models has been described and validated in hindcast mode using the ECMWF Re-Analysis ERA-40 data and GPCP for precipitation. Output from the DEMETER multi-model system, suitably downscaled, has been applied to crop yield and malaria prediction models. Results indicate that the multi-model ensemble is a viable pragmatic approach to the problem of representing model uncertainty in seasonal-to-interannual prediction, and will lead to a more reliable forecasting system than that based on any one single model. An additional outcome of the project is the production of a unique seasonal hindcast dataset. This dataset offers the potential to improve our understanding of the mechanisms of intra-seasonal and interannual climate variations.
In the limited space available in this paper, a few illustrative examples of results from the DEMETER project have been given. However, we invite readers to visit the DEMETER web site
Development of a European Multi-Model Ensemble System …
20 Technical Memorandum No.434
http://www.ecmwf.int/research/demeter/verification where an extensive range of diagnostics and skill scores used to evaluate the DEMETER system are presented.
In addition to these specific diagnostics and skill scores, visitors to the DEMETER web site can download (in GRIB or NetCDF format) gridded data from a large data set comprising monthly mean fields for a large number of variables from the DEMETER hindcasts, including ERA-40 verification. We thus encourage scientists and potential users of seasonal forecasts to perform their own analysis of the DEMETER data (perhaps to assess skill for specific regions and variables of interest not covered in our standard analysis). More generally, we offer this DEMETER data set for education and training purposes, both in the developed and developing worlds.
As a result of the success of DEMETER, real-time multi-model ensemble forecasting is now being established as part of the operational seasonal forecast suite at ECMWF. At the time of writing, plans are well established for the ECMWF, Met Office and Météo-France coupled systems to be included in this multi-model mix. It is possible that other DEMETER models may be included at a later stage.
In future research it is hoped to use a successor system to DEMETER to explore the use of multi-model ensembles not only for seasonal-to-interannual timescales, but also for decadal timescales for which scientific evidence of predictability has emerged in recent years (Grötzner et al. 1999). For this purpose, it is planned to ensure that the model components used for seasonal-to-decadal ensemble prediction, are, as far as practicable, identical to those used for century-timescale anthropogenic climate change. In this way, the reliability of century-timescale climate change projections can be assessed by running essentially the same ensemble systems on timescales for which verification data exists. A unification and rationalization of research and development across these timescales will enhance enormously the credibility of climate science.
Finally, whilst the results shown in this paper clearly indicate the need to represent model uncertainty when forecasting climate, the multi-model approach cannot be considered the final solution. For example, there is manifestly no representation of common model deficiencies in a multi-model ensemble. Rather, the DEMETER results have motivated a more theoretical approach to the representation of model uncertainty using stochastic-dynamic subgrid models (Palmer 2001, Khonider et al. 2003). Practical schemes based on cellular automaton stochastic dynamics subgrid models are currently in development, and it is hoped to assess these against the multi-model approach in coming years.
7. Acknowledgments The DEMETER project has been funded by the European Union under the contract EVK2-1999-00197. The authors would like to thank M. Alonso-Balmaseda, D. Anderson, R. Barnes, L. Ferranti, M. Fuentes, J. A. García-Moya, C. Gibert, M. Huddleston, S. Ineson, C. Levy, D. Lucas, P. McLean, M. Naylor, T. Stockdale, J. Vialard and F. Vitart, for their invaluable help. This work would not have been possible without the continuous support of the ERA-40 production team. Thanks also go to D. Rijks for his continuous scientific support to the agro-meteorological activities. The authors acknowledge considerable technical support from ECMWF staff and consultants.
8. References Alves, O., G. Wang. A. Zhong, N. Smith, G. Warren, A. Marshall, F. Tzeitkin and A. Schiller, 2002: POAMA: Bureau of Meteorology operational coupled model seasonal forecast system. Proceedings of the ECMWF Workshop on the Role of the Upper Ocean in Medium and Extended Range Forecasting, in press.

Development of a European Multi-Model Ensemble System …
Technical Memorandum No.434 21
Atger, F., 2001: Verification of intense precipitation forecasts from single models and ensemble prediction systems. Nonlinear Processes Geophys., 8, 401-417.
Boote K. J., J. W. Jones and N. B. Pickering, 1996: Potential uses and limitations of crop models. Agronomy J., 88, 704-716.
Branković, Ĉ. and T. N. Palmer, 2000: Seasonal skill and predictability of ECMWF PROVOST ensembles. Quart. J. Roy. Meteor. Soc., 126, 2035-2068.
Breman J. G., A. Egan and G. T. Keusch, 2001: The intolerable burden of malaria: a new look at the numbers. Amer. J. Tropical Medicine and Hygiene, 64, iv-vii.
Buizer, J. L., J. Foster and D. Lund, 2000: Global impacts and regional actions: Preparing for the 1997-98 El Niño. Bull. Amer. Meteor. Soc., 81, 2121-2139.
Christensen J. H., J. Raisanen, T. Iversen, D. Bjorge, O. B. Christensen, and M. Rummukainen, 2001: A synthesis of regional climate change simulations. A Scandinavian perspective. Geophys. Res. Lett., 28, 1003-1006.
Delecluse, P. and G. Madec, 1999: Ocean modelling and the role of the ocean in the climate system. In Modeling the Earth's Climate and its Variability, Les Houches 1997, W. R. Holland, S. Joussaume and F. David, eds., Elsevier Science, 237-313.
Déqué M., 2001: Seasonal predictability of tropical rainfall: probabilistic formulation and validation. Tellus, 53A, 500-512.
Doblas-Reyes, F. J., M. Déqué and J.-Ph. Piedelièvre, 2000: Multi-model spread and probabilistic seasonal forecasts in PROVOST. Quart. J. Roy. Meteor. Soc., 126, 2069-2088.
Doblas-Reyes, F. J., V. Pavan and D. B. Stephenson, 2003: The skill of multi-model seasonal forecasts of the North Atlantic Oscillation. Climate Dyn., 21, 501-514.
Epstein, E. S., 1969: A scoring system for probability forecasts of ranked categories. J. Appl. Meteor., 8, 985-987.
European Commission (DG Agriculture), 2000: La Politique Agricole Commune. Synthèse 1999. Office des Publications Officielles des Communautés Européennes, Luxembourg, KF-29-00-262-FR-C, 30 pp. [Available from Office des Publications Officielles des Communautés Européennes, L - 2985 Luxembourg]
FAOSTAT, 2001: FAO Statistical Databases. United Nations Food and Agriculture Organization, Rome, Italy. [Available from http://apps.fao.org/page/collections?subset=agriculture]
Feddersen, H., A. Navarra and M. N. Ward, 1999: Reduction of model systematic error by statistical correction for dynamical seasonal predictions. J. Climate, 12, 1974-1989.
Fernández, J., J. del Hoyo, A. Mestre and C. Peral, 2001: Local probabilistic forecast of precipitation by the use of an analogical approach. Proceedings of the Fifth European Conference on Applications of Meteorology (ECAM 2001), Budapest, Hungary, 28-29.
Giorgi, F. and L. O. Mearns, 1999: Introduction to special section: Regional climate modeling revisited. J. Geophys. Res., 104, 6335-6352.
Goddard, L., S. J. Mason, S. E. Zebiak, C. F. Ropelewski, R. Basher and M. A. Cane, 2001: Current approaches to seasonal-to-interannual climate predictions. Int. J. Climatol., 21, 1111-1152.
Development of a European Multi-Model Ensemble System …
22 Technical Memorandum No.434
Gordon, C., C. Cooper, C. A. Senior, H. Banks, J. M. Gregory, T. C. Johns, J. F. B. Mitchell and R. A. Wood, 2000: The simulation of SST, sea ice extents and ocean heat transports in a version of the Hadley Centre coupled model without flux adjustments. Climate Dyn., 16, 147-168.
Graham, R. J., A. D. L. Evans, K. R. Mylne, M. S. J. Harrison and K. B. Robertson, 2000: An assessment of seasonal predictability using atmospheric general circulation models. Quart. J. Roy. Meteor. Soc., 126, 2211-2240.
Gregory, D., J. J. Morcrette, C. Jakob, A. C. M. Beljaars and T. Stockdale, 2000: Revision of convection, radiation and cloud schemes in the ECMWF Integrated Forecasting System. Quart. J. Roy. Meteor. Soc., 126, 1685-1710.
Grötzner, A., M. Latif, A. Timmermann and R. Voss, 1999: Interannual to decadal predictability in a coupled ocean-atmosphere general circulation model. J. Climate, 12, 2607-2624.
Harrison P. A., R. E. Butterfield and T. E. Downing, 1995: Climate Change and Agriculture in Europe. Assessment of impacts and adaptation. Environmental Change unit, University of Oxford, Research Report No. 9, 411 pp.
Hartmann, H. C., T. C. Pagano, S. Sorooshian and R. Bales, 2002a: Confidence builders: Evaluating seasonal climate forecasts for user perspectives. Bull. Amer. Meteor. Soc., 83, 683-698.
Hartmann, H. C., R. Bales and S. Sorooshian, 2002b: Weather, climate, and hydrologic forecasting for the US Southwest: a survey. Climate Res., 21, 239-258.
Hay S. I., R. W. Snow and D. J. Rogers, 1998: Predicting malaria seasons in Kenya using multitemporal meteorological satellite sensor data. Trans. Roy. Soc. Tropical Medicine and Hygiene, 92, 12-20.
Hoogenboom G., 1997: AEGIS/WIN: A computer program for the application of crop simulation models across geographic areas. Agronomy J., 89, 919-928.
Hoogenboom G., 2000: Contribution of agrometeorology to the simulation of crop production and its applications. Agric. Forecasting Meteor., 103, 137-157.
Hoshen M. B., E. Worrall, S. J. Connor, A. P. Morse and M. C. Thomson, 2003: Weather based modelling of the epidemiology of malaria. GEOMED, in press.
Kanamitsu, M., A. Kumar, H.-M. H. Juang, J.-K. Schemm, W. Wang, F. Yang, S.-Y. Hong, P. Peng, W. Chen, S. Moorthi and M. Ji, 2002: NCEP dynamical seasonal forecast system 2000. Bull. Amer. Meteor. Soc., 83, 1019-1037.
Khonider, B., A. J. Majda and M. A. Katsoulakis, 2003: Coarse-grained stochastic models for tropical convection and climate. Proc. Natl. Acad. Sci. USA, 100, 11941-11946.
Kumar, A. and M. P. Hoerling, 2000: Analysis of a conceptual model of seasonal climate variability and implications for seasonal prediction. Bull. Amer. Meteor. Soc., 81, 255-264
Livezey, R. E., 1999: Field intercomparison. In Analysis of Climate Variability: Applications of Statistical Techniques, H. von Storch and A. Navarra eds., Springer, 176-177.
Madec, G., P. Delecluse, M. Imbard and C. Levy, 1997: OPA Release 8, Ocean General Circulation Model Reference Manual. LODYC Internal Report, Paris, 200 pp. [Available from LODYC/IPSL, 4 Place Jussieu 75252 Paris Cedex 05, France].
Development of a European Multi-Model Ensemble System …
Technical Memorandum No.434 23
Madec G., P. Delecluse, M. Imbard and C. Levy, 1998: OPA Version 8.1 Ocean General Circulation Model Reference Manual. LODYC Technical Report No. 11, Paris, 91 pp. [Available from LODYC/IPSL, 4 Place Jussieu 75252 Paris Cedex 05, France].
Marletto V., L. Criscuolo and M. R. M. Van Soetendael, 2001: Implementation of WOFOST in the framework of the CRITERIA geographical tool. Proceedings of the Second International Symposium on Modeling Cropping Systems, European Society for Agronomy, Florence, Italy, 219-220.
Marsland, S. J., H. Haak, J. H. Jungclaus, M. Latif and F. Röske, 2002: The Max-Planck-Institute global ocean/sea ice model with orthogonal curvilinear coordinates. Ocean Modelling, in press.
Mason, S. J., L. Goddard, N. E. Graham, E. Yulaeva, L. Sun and P. A. Arkin, 1999: The IRI seasonal climate prediction system and the 1997/98 El Niño event. Bull. Amer. Meteor. Soc., 80, 1853-1873.
McCarthy J. J., O. F. Canziani, N. A. Leary, D. J. Dokken and K. S. White (eds.), 2001: Climate Change 2001: Impacts, Adaptation & Vulnerability, Contribution of Working Group II to the Third Assessment Report of the Intergovernmental Panel on Climate Change (IPCC). Cambridge University Press, Cambridge, UK, 1000 pp. [Available from http://www.grida.no/climate/ipcc_tar/wg2/359.htm]
McPhaden, M. J., A. J. Busalacchi, R. Cheney, J.-R. Donguy, K. S. Gage, D. Halpern, M. Ji, P. Julian, G. Meyers, G. T. Mitchum, P. P. Niiler, J. Picaut, R. W. Reynolds, N. Smith and K. Takeuchi, 1998: The Tropical Ocean-Global Atmosphere observing system: A decade of progress. J. Geophys. Res., 103, 14169-14240.
Misra, V., P. A. Dirmeyer and B. P. Kirtman, 2003: Dynamic Downscaling of Seasonal Simulations over South America. J. Climate, 16, 103-117.
Murnane, R. J., M. Crowe, A. Eustis, S. Howard, J. Koepsell, R. Leffler and R. Livezey, 2002: The weather risk management industry’s climate forecast and data needs. Bull. Amer. Meteor. Soc., 83, 1193-1198.
Murphy, A. H., 1973: A new vector partition of the probability score. J. Appl. Meteor., 12, 595-600.
National Research Council, 1999: Making Climate Forecasts Matter. National Academy Press, Washington D.C., 175 pp.
Neelin, J. D., D. S. Battisti, A. C. Hirst, F.-F. Jin, Y. Wakata, T. Yamagata and S. E. Zebiak, 1998: ENSO theory. J. Geophys.Res., 103, 14261-14290.
Palmer, T. N., 1993: Extended-range atmospheric prediction and the Lorenz model. Bull. Amer. Meteor. Soc., 74, 49-65.
Palmer, T. N., 2001: A nonlinear dynamical perspective on model error: A proposal for non-local stochastic-dynamic parametrization in weather and climate prediction models. Quart. J. Roy. Meteor. Soc., 127, 279-304.
Palmer, T. N., 2002: The economic value of ensemble forecasts as a tool for risk assessment: From days to decades. Quart. J. Roy. Meteor. Soc., 128, 747-774.
Palmer, T. N. and D. L. T. Anderson, 1994: The prospects for seasonal forecasting. Quart. J. Roy. Meteor. Soc., 120, 755-793.
Palmer, T. N. and J. Shukla, 2000: Editorial to DSP/PROVOST special issue. Quart. J. Roy. Meteor. Soc., 126, 1989-1990.

Development of a European Multi-Model Ensemble System …
24 Technical Memorandum No.434
Palmer, T. N., Ĉ. Brankovic and D. S. Richardson, 2000: A probability and decision-model analysis of PROVOST seasonal multi-model ensemble integrations. Quart. J. Roy. Meteor.Soc., 126, 2013-2034.
Pavan, V. and F. J. Doblas-Reyes, 2000: Multi-model seasonal hindcasts over the Euro-Atlantic: skill scores and dynamical features. Climate Dyn., 16, 611-625.
Peng, P. A. Kumar and H. van den Dool, 2002: An analysis of multimodel ensemble prediction for seasonal climate anomalies. J. Geophys. Res., 107, 4710, doi: 10.10129/2002JD002712.
Pielke Jr, R. and R. E. Carbone, 2002: Weather impacts, forecasts, and policy. Bull. Amer. Meteor. Soc., 83, 393-403.
Pope, V. D., M. L. Gallani, P. R. Rowntree and R. A. Stratton, 2000: The impact of new physical parameterizations in the Hadley Centre climate model: HadAM3. Climate Dyn., 16, 123-146.
Richardson, C. W., 1981: Stochastic simulation of daily precipitation, temperature, and solar radiation. J. Appl. Meteor., 17, 182-190.
Richardson, D. S., 2000: Skill and relative economic value of the ECMWF ensemble prediction system. Quart. J. Roy. Meteor. Soc., 126, 649-668.
Roeckner E., 1996: The Atmospheric General Circulation Model ECHAM-4: Model Description and Simulation of Present-Day Climate. Max-Planck-Institut für Meteorologie, Technical Report No 218, Hamburg, 90 pp. [Available from Max-Planck Institut für Meteorologie Bundesstr. 55, D-20146 Hamburg, Germany]
Rummukainen, M., J. Räissänen, B. Bringfelt, A. Ullerstig, A. Omstedt, U. Willen, U. Hansson and C. Jones, 2001: A regional climate model for northern Europe: model description and results from the downscaling of two GCM control simulations. Climate Dyn., 17, 339-359.
Shukla, J., 1998: Predictability in the midst of chaos: A scientific basis for climate forecasting. Science, 282, 728-731.
Singh U. and P. K. Thornton, 1992: Using crop models for sustainability and environmental quality assessment. Outlook Agric., 21, 209-218.
Stockdale, T. N., D. L. T. Anderson, J. O. S. Alves and M. A. Balmaseda, 1998: Global seasonal rainfall forecasts using a coupled ocean-atmosphere model. Nature, 392, 370-373.
Straus, D. M. and J. Shukla, 2000: Distinguishing between the SST-forced variability and internal variability in mid-latitudes: Analysis of observations and GCM simulations. Quart. J. Roy. Meteor. Soc., 126, 2323-2350.
Swets, J. A., 1988: Measuring the accuracy of diagnostic systems. Science, 240, 1285-1293.
Terres J.-M., 1999: The Crop Growth Monitoring System implemented by JRC/ARIS unit for the information needs of the EC DG VI - Agriculture. Proceedings of the International Symposium on Modeling Cropping Systems, European Society for Agronomy, Division Agroclimatology and Agronomic modeling, EX 18746/C ORA/PRO 60194R, 261-264.
Terres J.-M. and P. Cantelaube, 2003: DEMETER Project, Second Annual Report. Contribution from JRC, Application to Crop Yield Forecasts. Institute for Environment and Sustainability Technical Report, Joint Research Centre of the European Commission, S.P.I.03.20, 58 pp.
Development of a European Multi-Model Ensemble System …
Technical Memorandum No.434 25
Thomson, M. C., T. N. Palmer, A. P. Morse, M. Cresswell and S. J. Connor, 2000: Forecasting disease risk with seasonal climate predictions. Lancet, 355, 1559-1560.
van der Voet P., C. A. van Diepen and J. O. Voshaar, 1994: Spatial interpolation of daily meteorological data. Winand Staring Centre for Integrated Land, Soil and Water Research, Report No 53.3, 105 pp.
van Diepen, C. A. and T. van der Wal, 1995: Crop growth monitoring and yield forecasting at regional and national scale. Agrometeorological Models: Theory and Applications in the MARS Project, Office for Official Publications of the European Communities, Luxembourg, Report EUR 16008 EN, 143-157.
Vossen, P., 1995: Early crop production assessment of the European Union, the system implemented by the MARS-STAT Project. Agrometeorological models: Theory and Applications in the MARS Project, Office for Official Publications of the European Communities, Luxembourg, Report EUR 16008 EN, 21-51.
Wilby, R. L. and T. M. L Wigley, 1997: Downscaling general circulation model output: A review of methods and limitations. Progress Phys. Geography, 21, 530-548.
Wilby, R. L. and T. M. L. Wigley, 2000: Downscaling general circulation model output: a reappraisal of methods and limitations. Climate prediction and agriculture. Proceedings of the START/WMO International Workshop, Geneva, Switzerland, 39-68.
Wilks, D. S., 1995: Statistical Methods in the Atmospheric Sciences. Academic Press, 1st ed.
Wolff, J. E., E. Maier-Reimer and S. Legutke, 1997: The Hamburg Ocean Primitive Equation Model. Deutsches Klimarechenzentrum Technical Report No. 13, Hamburg. [Available from Model and Data Group c/o Max-Planck Institut für Meteorologie Bundesstr. 55, D-20146 Hamburg, Germany]
World Health Organization (WHO), 2001: Malaria Early Warning Systems: Concepts, Indicators and Partners. Roll Back Malaria Cabinet Project, World Health Organisation, Geneva, 80 pp.
World Climate Research Programme (WCRP), 1985: Scientific Plan for the Tropical Ocean and Global Atmosphere Program. World Meteorological Organisation, Geneva, Technical Document WMO/TD-64, 146 pp.
Zebiak, S. E. and M. A. Cane, 1987: A model of El Niño-Southern Oscillation. Mon. Wea. Rev., 115, 2262-2278.