Embed Size (px)
Citation preview

Electrical Engineering in Japan, Vol. 116, No. 6, 1996 Translated from Dcnki Gakkai Ronbunshi, Vol. 115-B, No. 12, December 1995, pp. 1447-1454
Development of a Distribution Line State Monitoring System
HIROYUKI FUDOU, YUKIO KAWASAKI, SUSUMU EGAWA and KOUICHI SHINOZAKI
Kansai Electric Power Co., Inc. NORIO ABE
Sumitomo Electric Industries, Ltd. KAZURO TODA
Matsushita Electric Industrial Co., Ltd.
SUMMARY
To improve the electricity service reliability, a distribution line state monitoring system has been developed. It is composed of a central control unit, remote control switches, the slave unit and monitoring sensors. The first system employed fiber-optic voltage and a current sensor. The latest system employs a unique form of cost reduction, with no voltage sensors incor- porated. This system can detect the grounding direction by the information of the phase difference between the line-to-line voltage and I, provided by the monitoring sensor, and grounded line information (64@) from the substation. Installation of the system has been underway since 1992.
Key words: Distribution automation; automatic distribution line operation; monitoring; optic sensor; switching slave.
1. Introduction
The number of cases of faults, which is one of the principal indicators of the reliability of distribution line supply, has been declining dramatically in recent years due to the use of oilless switches, insulated wires and improved lightning suppression equipment [ 11. Power outage time due to faults has also been decreasing due to the introduction of remote control switch systems [2].
However, these remote control systems are coupled with a conventional sequential timeout system, which is used to identify the specific fault section where the
distribution-line failure has occurred, and to partition a single distribution line into eight sections.
Thus, if the sections are long, as in a suburban (or rural) distribution line, locating the failure point may take some time. Long power outages are the consequence of this problem.
As a basic technique for resolving this problem, the authors have developed a distribution line state moni- toring sensor employing an optic current sensor [3]. By installing two of these distribution line state monitoring sensors in each distribution line section, and combining these with a switch remote control system, the authors have implemented a complete distribution line state monitoring system capable of handling a fault section in less than half the time required using conventional techniques.
The development of this system has contributed to shorter power outage times in the event of faults. It also allows identification of those fault sections that have been accidentally reclosed. (These sections could not be identi- fied using previous methods.)
This report focuses on these aspects and on the system technology.
2. Development of the Distribution Line State Monitoring Sensor
As shown in Fig. 1, a sensor is installed for each high-voltage line of the automatic distribution switch
18 ISSNO424-7760/96/0006-0018 0 1996 Scripta Technica, Inc.

Voltage/cumnt sensor section ~~
Voltage divider
sensor element sensor element
6.6-kV distribution wire r 4
Switch
Slave for switch
Communication line
Fig. 1. Construction of the fiber optic voltage and current sensor system.
service pole to detect the voltage and current of the distribution line.
2.1 Voltage sensor [4]
The voltage sensor is left ungrounded, as in Fig. 2, to prevent a drop in insulation reliability of the insulated wire. The shared voltage V,, which divided the potential difference between the wire and earth using the condenser voltage divider with two electrodes, and to-ground sus- pended capacitance is measured with a Pockels element (BSO). The shared voltage V, is expressed by the follow- ing formula:
3
1-1 v, = (E/C,)/ c (l/Ci)
The design uses approximately 200 V for the shared voltage, and the to-ground suspended capacitance C, is approximately 1 pF. The condenser voltage divider is such that C, i 20 pF and C, + 20 pF.
c
I- 1
4
High-voltage l i e 1 -E
Condensers L 1st electrode
Voltage sensor element: BSO 2nd electrode
Suspended
(Pockels
Fig. 2. Principle of voltage divider.
To facilitate installation, the sensor section has two- part construction and is formed so that the wire is pinched inside. Further, the unit is made airtight by
19

CW,,y Capacitance between the insulated wire conductor and surface
Cw8: Capacitance between the insulated %: Resistance of the insulated wire surface and the sensor surface wire surface and earth surface k.: Resistance between the optic cable
C,,,: Sensor section capacitance R,: Resistance of the sensor surface surface and the sensor surface
C,*,.,: Capacitance between the sensor q: Resistance of the optic cable surface R& Resistance between the insulated wire surface and earth
Fig. 3. Equivalent circuit of voltage sensor on distribution line.
Surface resistance R,, %, R, (n)
Surface resistance R,, k, (a)
Fig. 4. Amplitude and phase of voltage sensor output vs. surface electrical resistance k, k, R, of voltage sensor (calcu-
lated values).
housing it in a polyethylene plastic case, which is then filled with plastic. With this structure, the second electrode potential of the voltage division electrode is not fixed. This can potentially cause a drop in the shared voltage, resulting from a drop in surface resistance due to the presence of dirt, snow accumulation or rainfall on the case surface. Thus the system was studied via a simula- tion using an equivalent circuit for the installed sensor (shown in Fig. 3).
When rainfall occurs, the water adhering to the case surface forms an electrically conductive layer, causing a variation of (resistance of sensor surface), ri, (resis- tance of insulated wire surface) and R, (resistance between the insulated wire surface and the sensor sur- face). In this case, Fig. 4 shows the simulation results for variation in the phase difference and the voltage ampli- tude induced in the voltage division electrode.
Thus, a drop in amplitude is evident &om the sur- face resistance values 10"- lo9 R, and the amplitude
20
A-phase current
Wire break and open phase detection
Level determination (1.2 times ratcd cumnt)
V, of 190 V or more, and onc phase current drop of 37.5% or more
. . ........ a . . i c::r ....... 9 . , r .._..
' Adder circuit 1
B-phase current .--.. - . - kve l det.
F 0.4 A %-b
C-phase current ..-..
- lone phase only I A-phase cumnt I
Load current output
Ground fault output
Ground fault direction determination outDut
L I O - L V O
Win bnak or open phase output
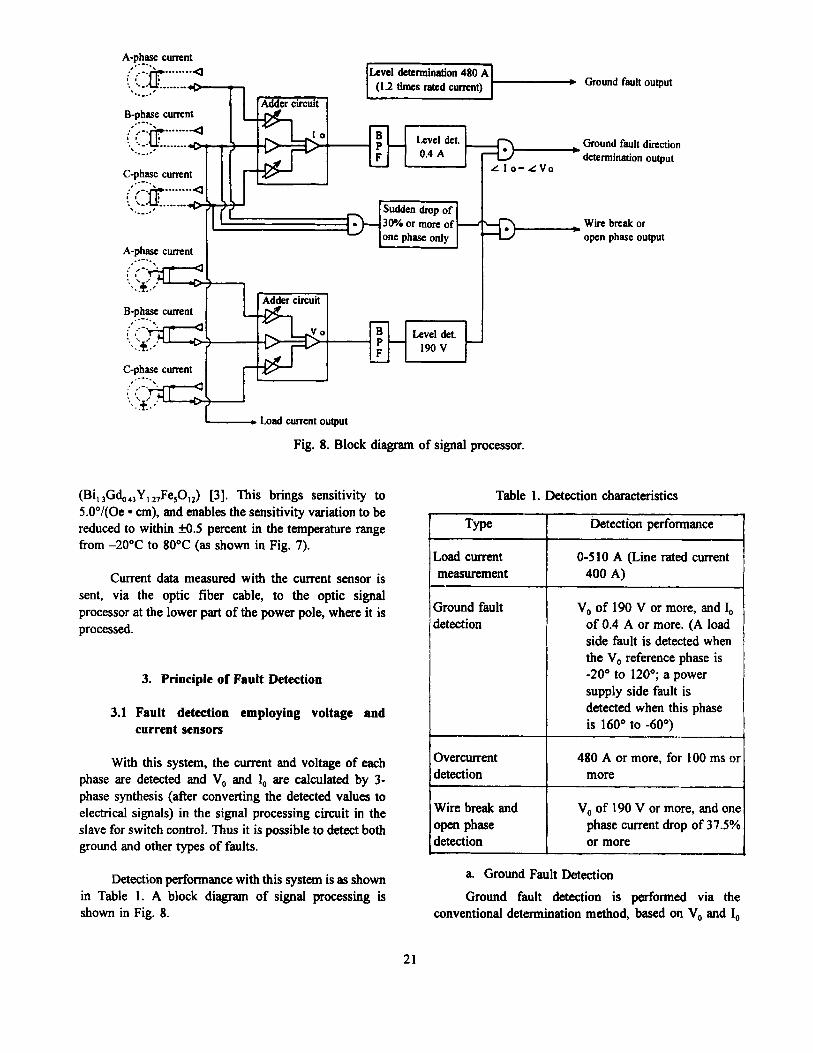
Fig. 8. Block diagram of signal processor.
(Bi, 3Gd,,,Y,,2,Fe,0,,) [3]. This brings sensitivity to 5.0"/(0e cm), and enables the sensitivity variation to be reduced to within M.5 percent in the temperature range from -20°C to 80°C (as shown in Fig. 7).
Current data measured with the current sensor is sent, via the optic fiber cable, to the optic signal processor at the lower part of the power pole, where it is processed.
3. Principle of Fault Detection
3.1 Fault detection employing voltage and current sensors
With this system, the current and voltage of each phase are detected and V, and I, are calculated by 3- phase synthesis (after converting the detected values to electrical signals) in the signal processing circuit in the slave for switch control. Thus it is possible to detect both ground and other types of faults.
Detection performance with this system is as shown in Table 1. A block diagram of signal processing is shown in Fig. 8.
Table 1. Detection characteristics
Type
Load current measurement
Ground fault detection
-
I
Detection performance
0-5 10 A (Line rated current 400 A)
V, of 190 V or more, and 4 of 0.4 A or more. (A load side fault is detected when the V, reference phase is -20" to 120"; a power supply side fault is detected when this phase is 160" to -60")
Overcurrent detection I more
480 A or more, for 100 ms 01
a. Ground Fault Detection
Ground fault detection is performed via the conventional determination method, based on V, and I,
21

Fig. 6. Appearance of sensor.
~
Surface resistance 5, %, & (n)
Fig. 5. Amplitude and phase of voltage sensor output vs. surface electrical resistance &, R,, R, of voltage sensor (calcu-
lated values).
is reduced to less than half at lo7 R. Variation in the phase difference reaches its maximum value of approxi- mately 20" at around 10' R.
Figure 5 shows the results of simulation calculation, when the optic cable section and sensor surface are wet and their water films are connected, i.e., when R, (resis- tance of sensor surface), R, (resistance of optic cable surface) and R, (resistance between optic cable surface and sensor surface) vary. This figure shows the variation in the phase difference and voltage amplitude induced in the voltage division electrode at that time.
Thus, the resistance values when the amplitude and phase difference start to vary are the same as those in Fig. 4, but variation in voltage amplitude is more than five times that when dry at lo7 R or less; the variation in phase difference is as much as 40" at around 10' a.
For this reason, drip points are provided at both ends of the sensor and at the optic cable section (as shown in Fig. 6) to ensure that R, and R, are suffi- ciently large. It has been confirmed experimentally that these measures enable suppression of sensor output fluctuation, from a variation of approximately 20 percent to a level that does not interfere with ground fault detection (a few percent only).
I I I
-50 0 50 100 Temperature ("C)
Fig. 7. Temperature variation of sensitivity of the Bi-substituted rare-earth iron
garnets.
Data measured with the voltage sensor is sent via an optic fiber cable to the optic signal processor at the lower part of the power pole, where it is then processed.
2.2 Current sensor [5]
In the current sensor, the magnetic field generated by the current flowing through the conductor converges due to the ring-shaped iron core. The current is then detected by a Faraday element placed in the iron core's gap. This current sensor is integrated with the voltage sensor in Fig. 6.
A conventional Faraday element cannot be expected to have either sufficiently high sensitivity to enable detection of ground current, or few sensitivity variations caused by increased temperature (due to sunlight exposure and current flow). Therefore, a new Faraday element was developed, employing a rare-earth iron garnet crystal
22

Table 2. Comparison of block schematic diagrams for detection of ground faults
System
Central unit
+ slave Calculation
DinCtion determination
0
{o O t j i J g -
Central unit
As before a data
Direction detenninatior
{o 0- I
Central unit
Judgment table I 0
Direction ieterminatiom
6 Q (ground fault phase determina-
. tion relay) ,+ 10. + v1 I Sensor slave
As before
Changed points ~ _____
iensor: ' Change in optic scnsor/circuit I $V& measurement ;lave: I Transmits phase difference information Substation slave: ' 4V&, measurementlcommunication Jcntral unit I Calculation of phase difference + Determination of direction
Sensor: I Change in optic sensodcircuit I 4V,-&, measurement I 4 L,-tjV, data reception I Calculation of phase difference 4
Slave: @ Reception of phase difference information Substation slave: - 4Vo+V, measurementlcommunication Central unit: No change
Determination of dinction
Sensor: 9 Transmission of phase difference informatioi Substation slave: No change
Central unit: 9 Detennination of ground fault direction
remains from before
based on decision table
calculated by the signal processing circuit. However, a gain adjustment circuit employing a D/A converter is incorporated to remove residual effects caused by variations in the way the sensor is attached to the insulated wire. As a result, the system determines whether there is a ground fault and, if so, its direction (i.e., whether it is on the load side or the power supply side,
from the perspective of the sensor), from the size and phase angle of V, and I,,.
b. Overcurrent (Short Circuit Fault) Detection
If any of the current values for each phase (measured by the current sensor) exceed their set
23

Fig. 9. Appearance of current sensor.
value, the system determines that an overcurrent has occurred.
c. Wire Break or Open Phase Fault Detection
If a wire break or open phase occurs, V, appears on the load side from that point on and the load current also drops. Therefore, the occurrence is detected from the size of V, and the variation rate of the load current.
3.2 Fault detection using only the current sensor
It was possible to verify the feasibility of the fault detection system described in section 3.1, but after evaluating the method’s cost-effectiveness, we developed a fault detection system that does not incorporate a photoelectric voltage sensor. With a system using a current sensor only, the voltage sensor and condenser voltage divider are eliminated from the sensor shown in Fig. 6, thereby yielding the new sensor shown in Fig. 9.
a. Ground Fault Detection
The ac phase voltage is used as the switch control power supply on an automatic distribution switch service pole. Thus, we considered new systems enabling ground fault detection and determination of direction by processing these voltage signals and current measurement signals, and studied the three types in Table 2 [6].
In Plan 1, the common line-to-line voltage V, (equivalent to Vca) is used as a reference both at the substation and at the slave for switch control (referred to hereafter as the slave). The phase difference 8, between V, and V, (measured at the substation) and the phase difference 8, between 1, and V, (measured at the slave)
Fig. 10. Vector orbits of I,, and I,, on grounding.
are brought together at a central unit via an automatic distribution transmission path; the ground fault direction is determined by calculating 8, - 8,.
Plan 2 is the reverse of Plan 1. In Plan 2, 8, (measured at the substation) is transmitted to the slave via an automatic distribution transmission path; the ground fault direction is determined by calculating 8, - 8, at the slave.
In Plan 3, the earth fault phase detected at the substation, and 8,, calculated at the slave, are brought together at a central unit via an automatic distribution transmission path, allowing the direction of the ground fault to be determined.
On comparing these methods, it was decided to select Plan 3, since it involves the least change to the switch remote control system under discussion. In what follows we explain the details of the principle of ground fault direction determination in Plan 3.
Figure 10 shows the vector orbits during 1-wire grounding of the zero-sequence current I,, on the load side of the ground point, and the zero-sequence current I,, on the power supply side. (This line-to-line voltage VcA is used as a reference at the ground point.)
As Fig. 10 indicates, there is overlap between the variation ranges of b, and I,, when the ground fault
24

I02 At C-phase grounding At A-phase grounding At B-phase grounding
(Side 1 : Power-supply-side grounding, Side 2: Load-side grounding)
Fig. 11. I, vector of each grounding phase.
ZCT A
6.6-kV simulated distribution line
I I I
Fig. 12. Equipment for artificial grounding test.
resistance R, is varied, determination of the ground fault direction cannot be accomplished with I, only. However, if the ground fault phase can be specified at 64$ (ground fault phase determination relay), it becomes possible to separate the ground fault direction determination ranges as in Fig. 11. To verify this approach, a grounding experiment was conducted by changing % (simulated by the resistance value of water, with the artificial grounding tester shown in Fig. 12), and setting the simulated line capacity to 2.188 pF (corresponding to a l-line grounding current of approximately 3 A with a complete ground, with fkequency 60 Hz).
voltage V, instead of the grounding resistance. There is a close match with the theoretical values, so it was possible to confm the feasibility of the new direction determination technique.
With these results, we decided to perform phase difference measurements in the range in which there is no misdetermination of direction. We partitioned 360" into 16 parts of 22.5" each and created a grounding direction determination table (minimizing the number of bits) as shown in Table 3.
b. Overcurrent (Short Fault) Detection
The results of the experiment are indicated in Fig. 13. The horizontal axis indicates the zero-sequence
The detection conditions are the same as those for the fault detection system described in section 3.1.
25

s 180 3 % 0
8 120
$ f ' 6 0 -
0 -
-60
Zero-sequence voltage (V)
..-..-. A value ___.. value . n ..*' -
... 0.- B-phase grounding ---..A? DLT".--' a*-- ---y----- -
* -. -. -0 -- -fJ' - - - - q-a*- - 0 .
A, /
C-phase grounding /. Ad' -.-. *.-- A- - - &&-*- - -&.d--
I I I I I I I I I
Fig. 13. Zero-phase voltage vs. phase difference of I, to V,.
grounding
0 1 2 Side 1 3 grounding 4 (power supply
side) c 5
Table 3. Grounding direction determination table
B-phase C-phase grounding grounding
Side 1 grounding Side 2 Dead zone grounding
Dead zone
Side 2 grounding
Side 1 Dead zone mi 1 grounding
10 Side 2 Dead zone grounding
(load side) Dead zone Side 1
grounding 15 Dead zone
26

WO con-
Level det. 480 A (1.2 Short fault times the rated current) output -
optic cur- o/E' con- rent sensor version
Ground fault phase B p angle output
Level det.,
F 0.4 or more - 1 LVca-lo
L
I : Dropto80V I or less
Sudden drop of Wire break and open phase output
Level det. (5 A
or more) :b + 80%ormore i 1 Optic cur- O/E con- * rent sensor version Reversal of the
two phases whose \AC phase1 * < load current did .
voltage I not drop
Fig. 14. Block diagram of signal processor.
c. Wire Break and Open-Phase Fault Detection
The wire break and open-phase detection condition is the logical AND operation of following three events: a sudden drop of 80 percent or more in the load current; a drop to 80 V or less of the power supply voltage; and the reversal of the two phases besides the phase whose load current dropped.
Figure 14 shows a block diagram of the signal processing circuit that performs this fault detection processing.
4. Construction and Function of Slave
Of the two fault detection systems described in section 3, it was decided (based on cost considerations) to use the one employing only a current sensor. Slave construction is shown in Fig. 15. The following parts are additions to the conventional slave construction.
(1) Interface between slave CPU and optic signal processing section
(2) Section for power supply back-up during a distribution line power outage.
The following describes the function for power supply back-up during a distribution line power outage. To detect the fault section, the detection information must be sent fiom the slave to the central unit when a distri- bution line power outage occurs. (The information is sent via a signal transmission line for distribution automation.) Thus, it is necessary to provide a back-up power supply for sending detection information to the slave when there is a distribution line power outage.
Signal transmission line systems for distribution automation include: communication line systems that use coaxial or twisted pair cable for the signal transmission line, and distribution line carrier systems where the signal is carried by the power line itself. As indicated in what follows, a different back-up system is used in each case.
a. Communication Line Systems
The battery used for the back-up power supply is the Li/MnO, type, which satisfies the following require-
27

To switch
To sensor Fig. 15. Construction of slave unit.
Storage period (days) 40 80 160 320
The points on the graph represent individual data for three batteries, and the values in parentheses are their averages
Fig. 16. Retained capacity (the number of times of communication) vs. storage temperature and period for Li/MnO, batteries.
ments: slave power consumption of 420 mA; communica- tion time of 90 s/event; communication 100 times; and no need for a charging circuit. A maintenance-free service life of ten years was added as a further criterion after taking the replacement frequency into account.
Figure 16 shows the results when the Li/MnO, batteries are subjected to isothermal storage testing under extreme conditions of -20°C.
Assuming degradation over a period of ten years is 65 cycles, and a contingency of at least twice the number of backups (1 00), required from the standpoint of retained capacity, the batteries selected above satisfy these criteria.
b. Distribution Line Carrier System
With the distribution line carrier system, the switches in the line are opened by a no-voltage opening mechanism during a power outage, such as a distribution line failure, so that the signal transmission line to the central unit is interrupted. However, communication is possible between neighboring slaves because their signal transmission lines are not broken.
With this system, there is no direct communication to the central unit during a power outage. Instead, the slave possessing the fault information sends it to the slave of the switch on the power supply side. When power is restored, the detection information is transmitted to the

67G. 64+(4) i ground phase
U
i) Ground direction detection (determined from 67G directional ground
ii) Wire break and open phase detection (determined from la, Ib and Ic) iii) Short detection V) Current measurement (determined using Ib only)
relay, 674 and Ab-V- phase difference)
Current sensor i -- - "i .Transformer for power supply control -
Fig. 17. Configuration of a distribution line state monitoring system.
2 Wb
central unit by the slave of the power supply side switch, at the point at which power has been restored to the power supply side switch.
T vca ............. * 0 @+@ +.-.....-........ Substation
slave .............................. " .
@ Phase dif. e of(i), taking (2) as standard
Therefore, the back-up time was assumed to be five seconds-including the communication time and margin. The adopted back-up system has a condenser with the necessary capacity built into the slave.
5. Overall System Configuration and Function
Figure 17 shows the overall configuration of the distribution line state monitoring system. The system comprises a central unit (Kansai Electric office CPU), substation slave, transmission path, slave and current sensor.
The following indicates operation of the entire system, using a ground fault as an example, when the signal transmission line is coaxial or twisted pair cable.
1) The current sensor measures the current of each phase and monitors I, when the system is normal.
2) If I, exceeds the threshold value, fault information (ground occurrence, phase difference 0,) is sent to the slave.
3) The breaker opens due to tripping of the ground direction relay of the substation for distribution, and a power failure occurs.
4) At the slave, the battery operates (for 90 s) and fault information is stored in the memory.
5 ) The substation transmits information from the slave during the power failure (0,) and the ground phase due to 649 to the central unit.
6 ) At the central unit, the ground fault direction is determined from the ground phase information (due to 8, and a+), so the fault section can be isolated, and load adjustment performed automatically.
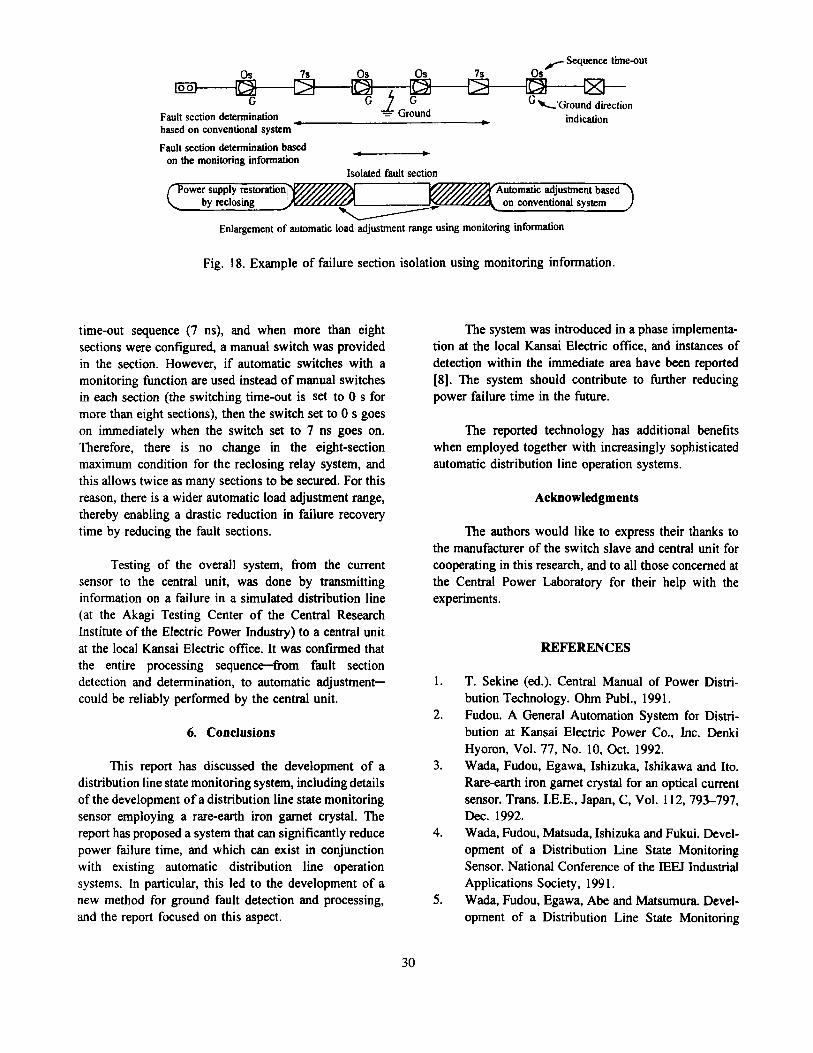
Isolation of the fault section is performed based on the logical AND condition of: the conventional failure determination based on time-out sequence, and the failure determination based on monitoring information for the short or ground direction. Figure 18 shows an example of fault section isolation using the monitoring information.
The automatic load adjustment range was previ- ously limited to section units, divided by switches with a
29
Sequence time-out 0s 7s 0s 0s 7s 0s
loo) \'Ground direction 7 d E c indication
G Fault section determination based on conventional system
Fault section determination based on the monitoring information
- Isolated fault section
adjustment based on conventional system
Enlargement of automatic load adjustment range using monitoring information
Fig. 18. Example of failure section isolation using monitoring information.
time-out sequence (7 ns), and when more than eight sections were configured, a manual switch was provided in the section. However, if automatic switches with a monitoring function are used instead of manual switches in each section (the switching time-out is set to 0 s for more than eight sections), then the switch set to 0 s goes on immediately when the switch set to 7 ns goes on. Therefore, there is no change in the eight-section maximum condition for the reclosing relay system, and this allows twice as many sections to be secured. For this reason, there is a wider automatic load adjustment range, thereby enabling a drastic reduction in failure recovery time by reducing the fault sections.
Testing of the overall system, from the current sensor to the central unit, was done by transmitting information on a failure in a simulated distribution line (at the Akagi Testing Center of the Central Research Institute of the Electric Power Industry) to a central unit at the local Kansai Electric office. It was confirmed that the entire processing sequencefrom fault section detection and determination, to automatic adjustment- could be reliably performed by the central unit.
6. Conclusions
This report has discussed the development of a distribution line state monitoring system, including details of the development of a distribution line state monitoring sensor employing a rare-earth iron garnet crystal. The report has proposed a system that can significantly reduce power failure time, and which can exist in conjunction with existing automatic distribution line operation systems. In particular, this led to the development of a new method for ground fault detection and processing, and the report focused on this aspect.
The system was introduced in a phase implementa- tion at the local Kansai Electric office, and instances of detection within the immediate area have been reported [8]. The system should contribute to further reducing power failure time in the future.
The reported technology has additional benefits when employed together with increasingly sophisticated automatic distribution line operation systems.
Acknowledgments
The authors would like to express their thanks to the manufacturer of the switch slave and central unit for cooperating in this research, and to all those concerned at the Central Power Laboratory for their help with the experiments.
1.
2.
3.
4.
5.
REFERENCES
T. Sekine (ed.). Central Manual of Power Distri- bution Technology. Ohm Publ., 1991. Fudou. A General Automation System for Distri- bution at Kansai Electric Power Co., Inc. Denki Hyoron, Vol. 77, No. 10, Oct. 1992. Wada, Fudou, Egawa, Ishizuka, Ishikawa and Ito. Rare-earth iron garnet crystal for an optical current sensor. Trans. I.E.E., Japan, C, Vol. 1 12, 793-797, Dec. 1992. Wada. Fudou. Matsuda, Ishizuka and Fukui. Devel- opment of a Distribution Line State Monitoring Sensor. National Conference of the IEEJ Industrial Applications Society, 199 1. Wada, Fudou, Egawa, Abe and Matsumura. Devel- opment of a Distribution Line State Monitoring
30

Sensor. Proceedings of the Fourth Annual Conference of the IEEJ Power & Electric Society, No. 299, 1993. Fudou, Wade, Egawa, Ishikawa and Toda. Devel- opment of an Improved Distribution Line State Monitoring Sensor. IEEJ Research Conference on Power Technology, PE-92-2 1, 1992. Wada, Fudou, Asakura, Hayashi, Kishirh and
6.
7.
Jinma. Development of a Distribution Line Carrier Type Failure Scanning Slave. Proceedings of the Fourth Annual Conference of the IEEJ Power & Energy Society, No. 328, 1993. Mizutani, Kawasaki, Atake, Abe, Matsumura and Shimizu. Examples of Local Detection for a Distribution Line Optic Sensor. National Conference of the IEEJ, No. 1392, 1994.
8.
AUTHORS (from left to right)
Hiroydci Fudou. Education: Hyogo Technical Institute, B.S., 1966; Kyoto University, external student, 197 1- 1973. Industry positions: Kansai Electric Power Company, Ltd., 1966 (now a staff scientist, Technology Research Laboratories). Research interests: power delivery systems operating quality enhancement. Recognitions: Ohm Technology Award, 1989; I.E.E., Japan Distinguished Paper Prize, 1994.
Yukio Kawasaki. Education: Kyoto University, G.S., 1982. Industry positions: Kansai Electric Power Company, Ltd., 1982 (now assistant chief of Okyaku Network Technology Group). Research interests: power delivery system automation.
Susumu Egawa. Education: Wakayama Technical Institute, B.S., 1981. industry positions: Kansai Electric Power Company, Ltd., 1981 (now in Okyaku Network Technology Group). Research interests: power delivery system automation. Recognitions: I.E.E., Japan Distinguished Paper Prize, 1994.
Kouichi Shinozaki. Education: Akashi Technical Institute, B.S., 1977. Industry positions: Kansai Electric Power Company, Ltd., 1977 (now Assistant Chief Scientist, T d i c Equipment Division, Technology Research Laboratories). Research interests: power delivery system automation.
Norio Abe. Education: Kyoto University, M.S., 1975. Industry positions: Sumitomo Electric Industries, Ltd., 1975 (now Chief of Electrical Machinery Division). Research interests: cable and sensor development.
Kazuro Toda. Education: Tsukuba University, B.S., 1982. Industry positions: Matsusita Electric Industrial Company, Ltd., 1982 (now a chief technician, Network Advancement Group). Research interests: optical sensor development.
31