Embed Size (px)
Citation preview

8/9/2019 Development of a Decision Support System in Determining Optimum Number of Server for Nnpc Mega Petroleum S…
http://slidepdf.com/reader/full/development-of-a-decision-support-system-in-determining-optimum-number-of-server 1/4

8/9/2019 Development of a Decision Support System in Determining Optimum Number of Server for Nnpc Mega Petroleum S…
http://slidepdf.com/reader/full/development-of-a-decision-support-system-in-determining-optimum-number-of-server 2/4
INTERNATIONAL JOURNAL OF SCIENTIFIC & TECHNOLOGY RESEARCH VOLUME 3, ISSUE 12, December 2014 ISSN 2277-8616
208IJSTR©2014www.ijstr.org
server queuing existing model to analyze the queuingsystem of First Bank Nigeria PLC. In their work, theysuggested a need to increase the number of servers inorder to serve customers better in the case studyorganization. Ohaneme et al, (2011) proposed the singleline multi-server queuing system which they simulatedusing c-programming to be adopted at the Nigerian NationalPetroleum Corporation (NNPC) Mega petroleum station in
Awka, Anambra State in order to avoid congestion anddelay of customers. Here, the queue performance at NNPCmega petroleum station Enugu and Owerri at peak demandperiod were evaluated, establishing a decision supportsystem for operation management in the Mega petroleumstations.
3. Characteristics of Queuing SystemThe mechanism of the queuing process is very simple.Customers (not necessarily human customers) are arrivingfor service, waiting for service if it is not immediate, andleaving the system as soon as they are served. There aresix basic characteristics of queuing processes whichprovide an adequate description of a queuing system: (1)
arrival pattern of customers, (2) service pattern of servers,(3) number of service channels, (4) system capacity and (5)queue discipline. In usual queuing systems the arrivalpattern of customers is stochastic. Queue discipline refersto the manner in which customers are selected for servicewhen a queue has formed. The most common discipline isfirst come, first served (FCFS), but there are many otherslike last come, first served (LCFS) which is applicable inmany inventory systems as it is easier to reach the nearestitem; randomly selecting for service (RSS) independent ofthe arrival time of the customer; and a variety of priorityschemes, the customers with higher priority being servedahead of the lower priority customers regardless of theorder in which they arrived to the system.
4 Types of Queuing SystemsThere are four major types of queuing system. Lapin (1981)broadly categorized queuing system structures into thefollowing.
a. Single-server, Single-phase system:This is a situation in which single queue of customers are tobe served by a single service facility (server) one after theother. An example is bottles or cans of minerals or beer tobe cocked in a production process. Diagrammatically it isdepicted in figure 1
b. Single-server, Multiple-phases System:In this situation, there’s still a single queue but customersreceive more than one kind of service before departing thequeuing system as shown in figure 2. For example, in theuniversity, students first arrive at the registration desk, getthe registration done and then wait in a queue for theirforms to be signed, after signing; they join another queuefor submission. Students have to join queue at each phaseof the system.
c. Multiple-servers, Single-phase System:This is a queuing system characterized by a situationwhereby there is a more than one service facility (servers)providing identical service but drawn on a single waiting
line. An example is a petroleum service station. Asillustrated by figure 3.
d. Multiple servers, Multiple-phases System:According to Singh (2007), this type of system hasnumerous queues and a complex network of multiplephases of services involved as can be seen in figure 4. Thistype of service is typically seen in a hospital setting, multi
specialty outpatient clinics, patient first form the queue forregistration, and then he/she is triage for assessment, thenfor diagnostics, review, treatment, intervention oprescription and finally exits from the system or triage todifferent provider.
Arrivals Queue service facility Departures
Figur e 1.: Single-server, Single phase System.Source: Adopted from Obamiro (2003)
Figure 2 : Single-server, multiple phases SystemSource: Adopted from Obamiro (2003)
Figure 3: Multiple-servers, Single phase SystemSource: Adopted from Obamiro (2003)
Figure 4: Multiple-servers, Multiple-phase System
Source: Adopted from Obamiro (2003)
5 Performance Evaluation of QueuingSystemsHillier and Lieberman, (2005) put forth the followingperformance parameters in a queuing system:a. System Utilization (p): System Utilization is the most
important measure of a queuing system. It is the ratioof system capacity used to available capacity. Itmeasures the average time the system is busy. Systemutilization of zero means that there is nobody in thesystem. On the other hand, a system utilization of oneor more signifies that there is infinite number of people
8/9/2019 Development of a Decision Support System in Determining Optimum Number of Server for Nnpc Mega Petroleum S…
http://slidepdf.com/reader/full/development-of-a-decision-support-system-in-determining-optimum-number-of-server 3/4
INTERNATIONAL JOURNAL OF SCIENTIFIC & TECHNOLOGY RESEARCH VOLUME 3, ISSUE 12, December 2014 ISSN 2277-8616
209IJSTR©2014www.ijstr.org
on the waiting line. This means that the availableservers cannot cope with the arriving demand. Thussomething has to be done on the service facility(Egolum, 2001). Based on Egolum (2001), SystemUtilization should be greater than 0 but less than 0.8.
b. Mean Number in the system (Ls): Mean number in thesystem is the average number of system users(entities) in the system; it includes those in the queue
and those being served by the server(s).c. Mean Number in Queue (Lq): Mean number in the
queue is the average or expected number of systemusers in the queue (waiting line), waiting for their turn tobe served.
d. The average waiting time for an arrival not immediatelyserved (Wa)
e. Mean Time in System (Ws): Mean time in the system isthe expected value or average waiting time an entitywill spend in the queuing system. It includes theaverage time waiting for service to begin and theaverage service time.
f. Mean Time in Queue (Wq): Mean time in the queue isthe expected value or average time an entity will spend
in the queue, waiting for service to begin.g. Probability of zero customers in the system (PO )h. Probability of waiting (Pw): This is the probability that
an arrival will have to wait for its service to begin.
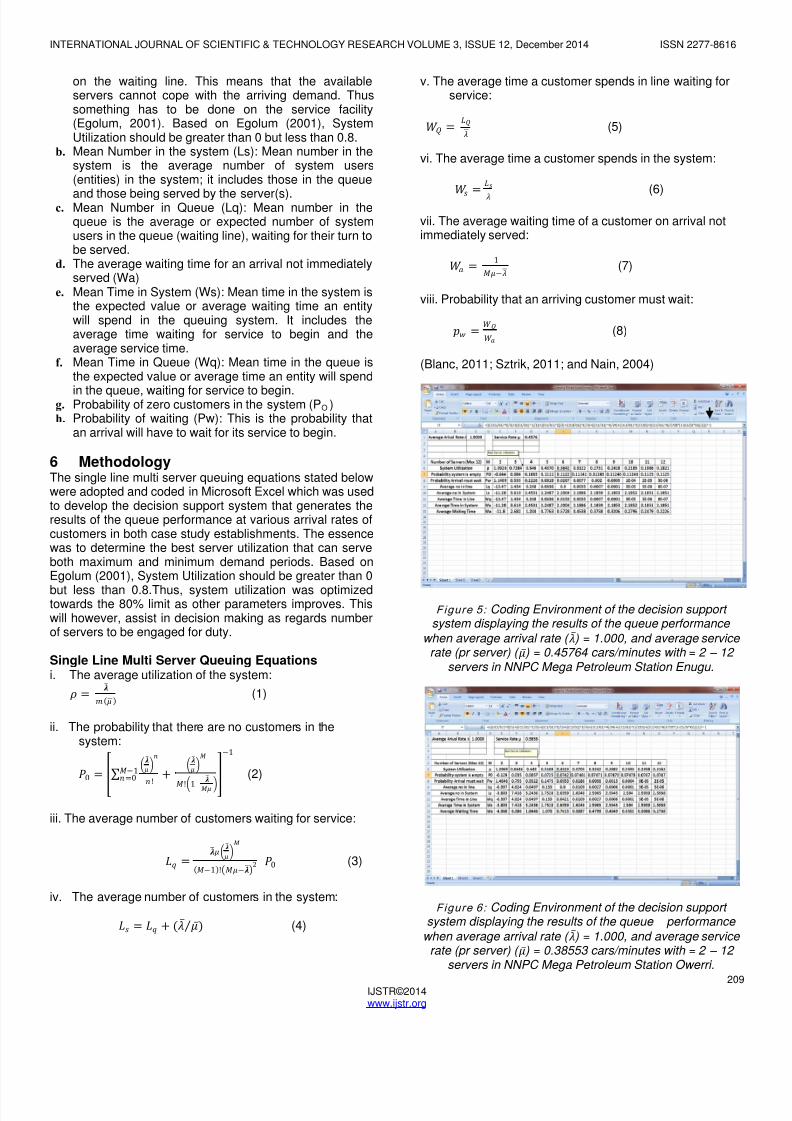
6 MethodologyThe single line multi server queuing equations stated belowwere adopted and coded in Microsoft Excel which was usedto develop the decision support system that generates theresults of the queue performance at various arrival rates ofcustomers in both case study establishments. The essencewas to determine the best server utilization that can serveboth maximum and minimum demand periods. Based onEgolum (2001), System Utilization should be greater than 0
but less than 0.8.Thus, system utilization was optimizedtowards the 80% limit as other parameters improves. Thiswill however, assist in decision making as regards numberof servers to be engaged for duty.
Single Line Multi Server Queuing Equationsi. The average utilization of the system: =
(1)
ii. The probability that there are no customers in thesystem:
0 =
!−1
=0 +
!1−
−1 (2)
iii. The average number of customers waiting for service:
= −1!−2 0 (3)
iv. The average number of customers in the system:
= + ( ) (4)
v. The average time a customer spends in line waiting forservice:
= (5)
vi. The average time a customer spends in the system:
=
(6)
vii. The average waiting time of a customer on arrival notimmediately served:
=1− (7)
viii. Probability that an arriving customer must wait:
= (8)
(Blanc, 2011; Sztrik, 2011; and Nain, 2004)
Figure 5: Coding Environment of the decision supportsystem displaying the results of the queue performance
when average arrival rate ( ) = 1.000, and average servicerate (pr server) ( ) = 0.45764 cars/minutes with = 2 – 12
servers in NNPC Mega Petroleum Station Enugu.
Figure 6: Coding Environment of the decision supportsystem displaying the results of the queue performance
when average arrival rate ( ) = 1.000, and average servicerate (pr server) ( ) = 0.38553 cars/minutes with = 2 – 12
servers in NNPC Mega Petroleum Station Owerri.

8/9/2019 Development of a Decision Support System in Determining Optimum Number of Server for Nnpc Mega Petroleum S…
http://slidepdf.com/reader/full/development-of-a-decision-support-system-in-determining-optimum-number-of-server 4/4
INTERNATIONAL JOURNAL OF SCIENTIFIC & TECHNOLOGY RESEARCH VOLUME 3, ISSUE 12, December 2014 ISSN 2277-8616
210IJSTR©2014www.ijstr.org
7. Simulation Results of various Arrival Rateof Customers/Mins
/Mins Best No.
Servers
1 3
1.1 4
1.2 4
1.3 4
1.4 4
1.5 5
1.6 5
1.7 5
1.8 5
1.9 6
2 6
2.1 6
2.2 7
2.3 7
2.4 7
2.5 7
2.6 7
2.7 8
Summary of Simulation Results at various Average Arrival Rates of Customer/Mins at
NNPC Mega Petroleum Station Enugu
y = 7.213x5 -67.07x4 +242.9x3 -427.5x2 +367.5x -120.0
R² =0.964
0
1
2
3
4
5
6
7
8
9
0 0.5 1 1.5 2 2.5 3
N u m b e r o f S e r v e r s ( M )
Average ArrivalRate/Minutes
M vs ʎ/Mins
M
Poly.(M)
Figure 4.47: Scatter Plot of Number of Servers (M) vs. Average
Arrival Rate/Minutes
The Recommended Best Number of Servers is given by:
M = 7.213 5 - 67.07 4 + 242.9 3 - 427.5 2 + 367.5 -120.0
Figure 7: Summary of Simulation Results at various Average Arrival Rates of Customer/Mins at NNPC Mega
Petroleum Station Enugu
/Mins Best Server
Utilization
1 4
1.1 4
1.2 4
1.3 5
1.4 5
1.5 5
1.6 6
1.7 6
1.8 6
1.9 7
2 7
2.1 7
2.2 8
2.3 8
Summary of Simulation Results of various Average Arrival Rates of Customer/Mins at
NNPC Mega Petroleum Station Owerri
y= -9.228x5 +79.09x4 -266.5x3 +440.9x2 -354.6x +114.2
R² =0.966
0
1
2
3
4
5
6
7
8
9
0 0.5 1 1.5 2 2.5
N u m b e r o f S e r v e r s ( M )
AverageArrival Rates/Minutes
M vs ʎ/Mins
M
Poly.(M)
Figure 4.48: Scatter Plot of Number of Servers (M) vs. Average
Arrival Rate/Minutes
The Recommended Best Number of Servers is given by:
M = -9.228 5 + 79.09 4 - 2 66.5 3 + 440.9 2 - 354.6 + 114.2
Figure 8: Summary of Simulation Results at various Average Arrival Rates of Customer/Mins at NNPC Mega
Petroleum Station Owerri.
8. ConclusionThe evaluation of queuing system in an establishment isvery essential for the betterment of the establishment. Mostestablishments are not aware on the significance of
evaluating their queue performance. The implication of thisis that they are not able to tell the minimum number ofservers that can service their customers at peak periods.This results to customers spending longer time thannecessary before receiving service. In respect of this, adecision support system has been developed using theapplication of Microsoft Excel which can be used inevaluating queue performance. The simulation of averagearrival rates of customers in NNPC Mega Station Enuguand Owerri respectively using the developed decisionsupport system gives the best server utilization at variousarrival rates. This will assist in determining the best numberof server that can serve both maximum and minimumdemand periods. The developed support system can be
adopted in any establishments but only applicable to wheresingle line multi-server queues exist.
9. Reference[1] Blanc, J.P.C. (2011). Queueing Models: Analytica
and Numerical Methods (Course 35M2C8)Department of Econometrics and OperationsResearch Tilburg University, pp 30-57.
[2] Chinwuko E.C and Nwosu M.C (2014), Analysis oa Queuing System in an Organization (A CaseStudy of First Bank PLC). 2014 NationaConference on Engineering for SustainableDevelopment, Nnamdi Azikiwe University AwkaAnambra State Nigeria: Paper F29, pp 256-267Manufacturing and Industrial Infrastructure Issues.
[3] Egolum C.C (2001), Quantitative Technique foManagement Decisions. Nnamdi AzikiweUniversity Awka, Anambra State. Pp 91-131.
[4] Hiller S.F and Lieberman J.G. (2005) Introduction
to Operations Research, Boston: McGraw HillEight Edition.
[5] Lapin L.L. (1981), Quantitative Methods foBusiness Decision, Harcourt: B. Jouanaurch, 2
n
Edition. pp 182 – 201.
[6] Mgbemena C.E., 2010. Modeling of the QueuingSystem for Improved Customer Service in NigerianBanks, M.Eng Thesis, Nnamdi Azikiwe UniversityAwka, Nigeria.
[7] Nain P. (2004). Basic Elements of Queuing TheoryApplication to the Modeling of Computer Systems
(Lecture notes), Pp 16-31
[8] Obamiro, J.K.,(2003) ―Application of QueuingModel in Determining the Optimum Number oService Facilities in Nigerian Hospitals‖, M. ScProject Submitted to Department BusinessAdministration, University of Ilorin.
[9] Ohaneme C.O, Ohaneme L.C, Eneh I.L andNwosu A.W (2011) ―Performance Evaluation oQueuing in an Established Petroleum DispensarySystem Using Simulation Technique‖ InternationaJournal of Computer Networks and WirelessCommunications (IJCNWC), Vol.2, No.2, Apri
2012.
[10] Singh V., (2007) ―Use of Queuing Models in HealthCare‖, Department of Health Policy andManagement, University of Arkansas for MedicalsSciences.
[11] Sztrik, J. (2011). Basic Queuing Theory, Universityof Debrecen, Faculty of Informatics, pp 17-57.
[12] Takagi, H (1991) ―Queuing Analysis, A Foundationof Performance Evaluation‖, Vacation and PrioritySystems, 1, 10-19.


![NNPC Reforms under the Petroleum Industry Bill 2012 [petroleumindustrybill.com]](https://img.dokumen.tips/doc/110x75/577ce6511a28abf103929714/nnpc-reforms-under-the-petroleum-industry-bill-2012-petroleumindustrybillcom.jpg)


