Embed Size (px)
Citation preview
DEVELOPMENT OF A CRYSTAL GROWTH INHIBITION BASED METHOD FOR THE EVALUATION OF KINETIC HYDRATE
INHIBITORS
Ross Anderson1,2, Houra Mozaffar1 and Bahman Tohidi1,2
1. Centre for Gas Hydrate Research, Institute of Petroleum Engineering Heriot-Watt University, Edinburgh, EH14 4AS
UNITED KINGDOM
2. Hydrafact Ltd. Heriot-Watt University Research Park, Edinburgh, EH14 4AP
UNITED KINGDOM
ABSTRACT Over the past decade, low dosage hydrate inhibitors (LDHIs) which include anti-agglomerants (AAs) and kinetic hydrate inhibitors (KHIs) have seen increasing use as a cost effective technology for gas hydrate control in the oil and gas industry, offering significant CAPEX/OPEX advantages when compared with traditional thermodynamic inhibitors (e.g. methanol, glycols). While AAs prevent agglomeration/plugging, KHIs are primarily understood to be nucleation inhibitors, inducing an extended ‘induction time’ at a specific subcooled condition before hydrate nucleation can proceed to growth. The best known KHIs are water soluble poly-n-vinylamides such as poly-n-vinylcaprolactam (PVCap), poly-n-vinylpyrrolidone (PVP) and related polymers. As KHIs are seen primarily as ‘nucleation delayers’, evaluation is typically undertaken through measurement of induction times as a function of various parameters at the conditions of interest. However, as nucleation is stochastic by nature, obtaining repeatable/transferrable data is often highly problematic and time-consuming, making robust evaluation difficult. Here, we demonstrate that less well investigated aspect of KHI polymers their ability to inhibit crystal growth is considerably simpler to quantify than nucleation inhibition. Beginning at low aqueous concentrations (e.g. > 0.1 mass% aqueous), PVCap and other KHI polymers induce a number of highly repeatable, well-defined hydrate crystal growth inhibition (CGI) regions as a function of subcooling. Discernible by step changes in relative growth rates − commonly by an order of magnitude − CGI regions range from complete inhibition (even hydrate dissociation), through severely to moderately reduced growth rates, ultimately to final rapid/catastrophic growth as subcooling increases. Closely related to induction time data, CGI regions are readily measureable using conventional hydrate laboratory equipment, with subcooling extents − which it is speculated are polymer crystal surface absorption related phenomena providing a means to assess KHIs more rapidly and reliably, while giving a increased confidence in performance under worst case scenario (hydrate present) field conditions.
Keywords: gas hydrates, KHI, methane, natural gas, experimental data, crystal growth, inhibition
Corresponding author: Phone: +44 (0)131 451 3798 Fax +44 (0)131 451 3127 E-mail: [email protected]
Proceedings of the 7th International Conference on Gas Hydrates (ICGH 2011), Edinburgh, Scotland, United Kingdom, July 17-21, 2011.
NOMENCLATURE Ts-I Temperature difference from s-I hydrate
phase boundary [°C] Ts-II Temperature difference from s-II hydrate
phase boundary [°C] Ph Change in pressure due to hydrate
formation [bar] CIR Complete (hydrate) Inhibition Region CGI Crystal Growth Inhibition KHI Kinetic Hydrate Inhibitor PVCap Poly-n-vinylcaprolactam PVP Poly-n-vinylpyrrolidone RFR Rapid (KHI) Failure Region RGR Reduced (hydrate) Growth (rate) Region SDR Slow (abnormally, hydrate) Dissociation
Region SG Second Germination (KHI test method) ti Hydrate nucleation induction time [hrs]
INTRODUCTION Low dosage Kinetic Hydrate Inhibitors (KHIs) have seen increasing use as a cost effective technology for gas hydrate control in the oil and gas industry, offering significant CAPEX/OPEX advantages over traditional thermodynamic inhibitors (e.g. methanol, glycols) [1-3]. The widespread understanding within the industry and academia is that KHI polymers (e.g. PVCap, poly-n-vinylcaprolactam) delay/slow down/interfere with the process of hydrate nucleation by surface adsorption on nuclei [4-7], forcing in an increased ‘induction’ or ‘hold’ time, ti; the time that passes at a specific subcooling (T from the hydrate phase boundary at pressure, P) within the hydrate stability zone (HSZ) before critical nuclei are achieved and hydrate nucleation to proceeds to growth. In theory, if the KHI-induced induction time, ti, at T,P is greater than the pipeline fluid residence time at that condition, then the KHI should be able to prevent hydrate nucleation / growth, whereby avoiding plugging. As KHIs are primarily considered ‘nucleation inhibitors’, they are generally developed and tested through laboratory induction/hold time studies [1-3]. The same applies for determining the effects of various parameters including pressure, presence of synergists, salts, liquid hydrocarbons (condensate, oil) and other oilfield chemicals (e.g. corrosion and scale inhibitors). However, there is an inherent problem induction time measurements; nucleation is very sensitive and probabilistic by
nature, meaning test results are often highly stochastic and poorly transferable [1-3,8-10]. Furthermore, this tendency to focus on KHIs as nucleation inhibitors often leads to the mistaken impression that the moment a hydrate crystal appears in a KHI inhibited system, the inhibitor has failed. These issues have resulted in low operator confidence in KHIs, restricting uptake by the industry, even though they are now being used successfully in the field [1,2]. To overcome the problem of poor reproducibility of KHI tests, TOTAL developed and used for a number of years a specific procedure in their semi-industrial hydrate flow loops they termed the “second germination” (SG) method. This proved to be very efficient in their hydrodynamic, through tubing flowing test conditions [8]. The procedure was subsequently applied in 2006 to autoclave cells with respect to tackling the ongoing problem of stochasticity in laboratory KHI data [9]. In Duchateau et al. [10,11] (University of Pau in conjunction with TOTAL) this new SG test protocol was reported; with results supporting significant improvements over traditional approaches in terms of repeatability and transferability of KHI test results. In summary, the SG method involves forming first forming hydrate at high subcooling, then dissociating this hydrate before then re-cooling to measure ti and/or the subcooling of hydrate formation at constant cooling rate. By maintaining the temperature close to the hydrate phase boundary during the dissociation step, it was concluded that ‘nuclei’ of some form – related to the phenomenon of ‘hydrate history’ – were preserved, and that these aided more consistent nucleation/growth patterns when re-cooling to form hydrate (i.e. the ‘second germination’), resulting in much more repeatable data. Beginning in late 2008, within the context of an ongoing Joint Industry Project (JIP), work began at Heriot-Watt University, UK, to develop a new crystal growth inhibition (CGI) based method for KHI evaluation. The goal of development was to circumvent the inherent problem of stochasticity in induction time data, and, building on the basic principles of the SG technique, to provide a more reliable means for KHI assessment. This work has proved very successful, yielding a novel, rapid and reliable means for KHI assessment in addition to

providing new insights into KHI inhibition mechanisms. In the companion paper to this work [12], we report the application of this new CGI method to evaluate the relative hydrate inhibition performance of a number of commercial KHI + corrosion inhibitor (CI) formulations for a gas condensate system; the aim being to assess its suitability for KHI field evaluation studies. Here, the basis of the CGI approach and its development as a method for KHI evaluation is summarised. BACKGROUND TO THE CGI METHOD As noted, the primary goal of CGI method development was to bypass the stochasticity inherent to nucleation processes (thus induction time measurements) and instead focus on KHI inhibition properties that were more consistent (i.e. repeatable) / more readily quantifiable as a means for evaluation. Certainly, literature studies strongly suggested that such properties existed; the following three findings being particularly significant:
1. Observations from single crystal studies that KHI polymers can apparently completely inhibit hydrate crystal growth under certain PTX / subcooled conditions [13-15]
2. Reports that KHIs can induce abnormally slow dissociation / metastability of gas hydrates outside the thermodynamic stability region [16,17]
3. Demonstration that in systems where the aqueous phase has been ‘seeded’ with nuclei of some sort (hydrate history, i.e. SG method), KHIs can still significantly inhibit hydrate nucleation(?) and/or growth [8-11]
While individually each of these findings have their own specific implications as discussed below clearly, taken together they provide very strong evidence that KHI inhibition properties extend well beyond the nucleation phase, influencing hydrate behaviour throughout the entire growthdissociation cycle. Following on from this, presuming heat/mass transfer in systems was not significantly limited, then observations support a strong thermodynamic component to KHI controls on hydrate phase behaviour. Given that adsorption of polymers on hydrate crystal surfaces is generally accepted as the primary mechanism of KHI inhibition, and surface
adsorption is thermodynamic process, it follows that such behaviour should not be unexpected. In terms of specific implications of each finding, with respect to (1), it can be readily concluded that if KHI polymers can completely inhibit the growth of hydrates in water soluble organic liquid hydrate forming systems, then the same should likely apply in more ‘realistic’ hydrocarbon gaseous (e.g. methane, natural gas) hydrate forming systems; a highly desirable property should this be the case. Finding (2) indicates that hydrate formed in KHI systems may not be structurally/compositionally identical to that formed in KHI-free systems; abnormally slow dissociation equates to metastability which implies a ‘more stable than normal’ solid clathrate type phase, e.g. a polymer-hydrate complex. Certainly, if KHI polymers do strongly absorb on hydrate surfaces in a regular fashion, this seems perfectly plausible. Finally, finding (3) suggests that if ‘hydrate history’ does represent hydrate ‘nuclei’ of some form, then this could potentially be construed as KHIs strongly inhibiting after nucleation, adding further support to (1). Based on the above considerations, as part of method development, it seemed logical to examine in more detail the ability of KHIs to inhibit hydrate growth in gaseous hydrocarbon systems when viable crystals were actually present; i.e. taking the SG method one step further and testing under ‘worst case scenario’ conditions. To do this, instead of allowing all hydrate to dissociate leaving only hydrate history as per the SG method, a small, but measurable fraction of hydrate could be retained (typically > 0.5% of aqueous phase as hydrate) following the first growth-dissociation cycle, ahead of cooling back into the hydrate region to observe growth patterns. In this sense, all primary ‘nucleation’ processes would be circumvented, with hydrate growth patterns solely representing the ability of the KHI polymer to inhibit further development of existing, viable crystals. Upon undertaking such studies, it was found that, far from the KHI having ‘failed’ in the sense that crystals were present, instead, at low hydrate fractions (typically > 0.5% of water converted)
KHI polymers (PVCap, PVP, commercial polymers) were found to be able to completely inhibit growth (in agreement with findings for THF systems at atmospheric pressure) and/or induce hydrate dissociation within the normal thermodynamic stability region to significant subcoolings. Furthermore, this powerful crystal growth inhibition property extend to higher subcoolings, manifesting as severe to increasingly reducing growth rate suppression before hydrate growth patterns finally reverted to those for KHI-free systems. Significantly, in the majority of cases, the boundaries between different inhibition regions were found to be clearly definable, typically by order of magnitude step changes in growth rates as they were crossed, facilitating mapping of relative boundary subcooling positions for comparative performance evaluation purposes. While it is outwith the context of this work to discuss in detail the origins of these crystal growth inhibition ‘regions’, it is currently understood that they result from variable polymer interference namely by adsorption on those faces favoured for crystal development, as originally observed in single crystal literature studies [13-15] in the normal process of hydrate crystal growth as a function of subcooling/driving force. Whatever the exact mechanisms responsible for the observed behaviour are investigations are ongoing regions are clearly discernible and have been defined internally (within the JIP research project) as follows: Complete Inhibition Region (CIR) Hydrate growth, even when crystals are present (in small fractions) is inhibited indefinitely and hydrates initially formed at high subcoolings may dissociate if taken into this region even though they would be expected to be thermodynamically stable. Reduced Growth rate Region (RGR) Hydrate growth is consistent, but growth rates clearly are inhibited by the polymer. Variability in degree of inhibition is high, ranging from severe (growth rates a number of orders of magnitude less than for a KHI-free system) to limited as subcooling increases. This region may be further subdivided based on clear changes in growth rates within it (e.g. very slow, slow, moderate).
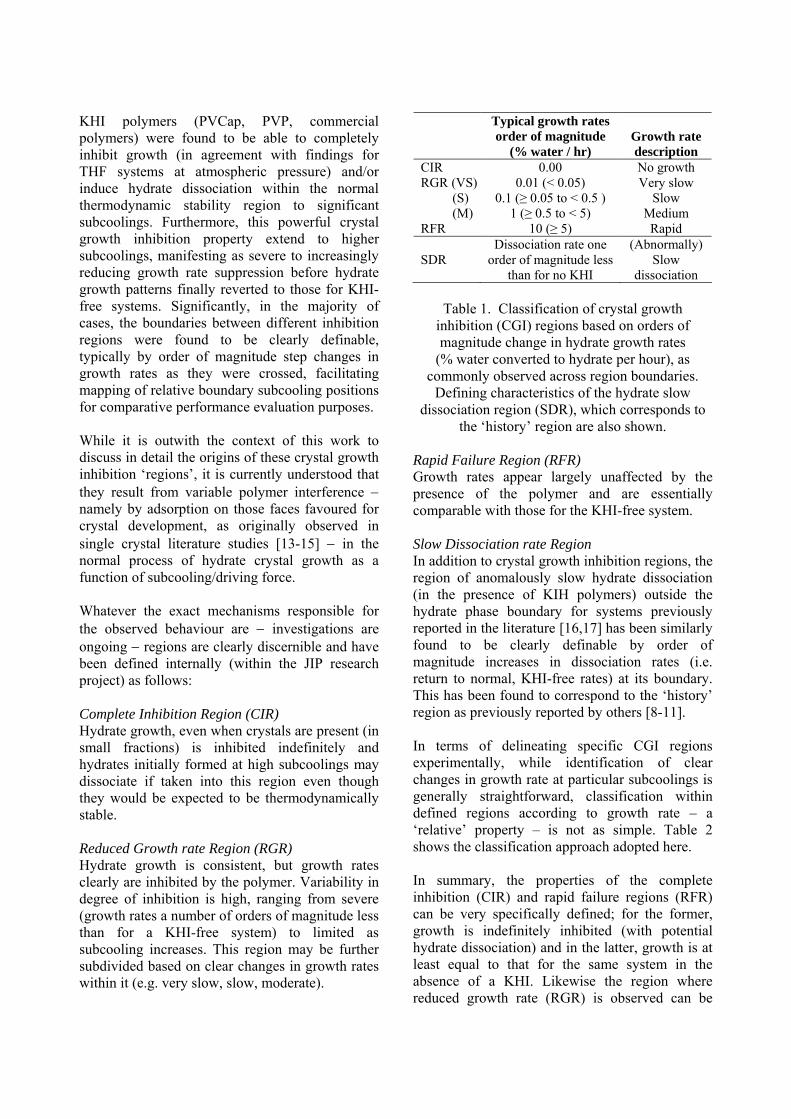
Typical growth rates order of magnitude
(% water / hr) Growth rate description
CIR 0.00 No growth RGR (VS) 0.01 (< 0.05) Very slow
(S) 0.1 (≥ 0.05 to < 0.5 ) Slow (M) 1 (≥ 0.5 to < 5) Medium
RFR 10 (≥ 5) Rapid
SDR Dissociation rate one
order of magnitude less than for no KHI
(Abnormally) Slow
dissociation
Table 1. Classification of crystal growth inhibition (CGI) regions based on orders of magnitude change in hydrate growth rates
(% water converted to hydrate per hour), as commonly observed across region boundaries.
Defining characteristics of the hydrate slow dissociation region (SDR), which corresponds to
the ‘history’ region are also shown. Rapid Failure Region (RFR) Growth rates appear largely unaffected by the presence of the polymer and are essentially comparable with those for the KHI-free system. Slow Dissociation rate Region In addition to crystal growth inhibition regions, the region of anomalously slow hydrate dissociation (in the presence of KIH polymers) outside the hydrate phase boundary for systems previously reported in the literature [16,17] has been similarly found to be clearly definable by order of magnitude increases in dissociation rates (i.e. return to normal, KHI-free rates) at its boundary. This has been found to correspond to the ‘history’ region as previously reported by others [8-11]. In terms of delineating specific CGI regions experimentally, while identification of clear changes in growth rate at particular subcoolings is generally straightforward, classification within defined regions according to growth rate – a ‘relative’ property – is not as simple. Table 2 shows the classification approach adopted here. In summary, the properties of the complete inhibition (CIR) and rapid failure regions (RFR) can be very specifically defined; for the former, growth is indefinitely inhibited (with potential hydrate dissociation) and in the latter, growth is at least equal to that for the same system in the absence of a KHI. Likewise the region where reduced growth rate (RGR) is observed can be

simply defined as ‘growth being slower than the KHI-free system’ for the same PTX conditions. However, subdivision of the RGR which has proven important given the wide range of inhibited growth rates observed requires some specification of actual/relative growth rates. For simplicity, a growth rate order of magnitude classification has been adopted, which is deemed appropriate based on results to date and the obvious apparent relationship between CGI regions and exponential-like induction time trends, as discussed later in this manuscript. As an example, a growth rate of 0.03% water converted per hour would be classed as ‘very slow’ (VS), 0.07% / hr would be slow (S) and 0.6% / hr would be medium (M), so long as the value is less than that for the no KHI case. If the value is equal to that for no KHI, behaviour is classed as RFR (rapid failure), i.e. the KHI is failing to appreciably inhibit hydrate growth. EXPERIMENTAL Equipment and Materials Over the past 2.5 years, tests using the CGI method have been carried out on a wide range of gasaqueous and gasaqueousliquid hydrocarbon systems in the presence of KHI polymers, as listed in Table 3. Here, example results are reported for methanewater and standard North Sea natural gas (NG)water systems with PVCap aqueous. Tests described here were carried out by constant volume methods (although constant pressure gas consumption tests have yielded identical results); i.e. hydrate detection was by change in pressure due to gas consumption. Tests were conducted on in-house (Hydrafact / Heriot-Watt University) designed / built 280 ml volume high pressure (max 410 bar) stainless steel or titanium (salt compatible) autoclave cells, as illustrated in Figure 1 (tests have also been repeated successfully in rocking cells, confirming transferability). For these set-ups, cell temperature is controlled by circulating coolant from a programmable cryostat through a jacket surrounding cells. Temperature is determined by platinum resistance thermometers (PRT, ± 0.1 °C), with pressure measured by either strain standard gauge (± 0.07 bar) or precision Quartzdyne (± 0.0007 bar) transducers; these being regularly calibrated against a dead weight tester. Cell
pressure and temperature are continually monitored and recoded by computer. The PVCap used in experiments was Luvicap-EG base polymer (average molecular weight / AMW = ~7000) with the ethylene glycol solvent removed by vacuum oven drying (supplied by BASF). Methane, supplied by BOC, was 99.995% pure. The composition of the natural gas used (also supplied by BOC) is given in Table 2. Deionised water was used in all tests, with aqueous PVCap solutions prepared gravimetrically.
Pressuretransducer
Magnetic motor
PRT
Impeller
Inlet/outlet
Coolantjacket
Figure 1. Schematic illustration of the 280 ml high pressure (max 410 bar) autoclave cells used in
experiments.
Table 2. Composition of the standard North Sea natural gas (NG) used in experiments.
Component Mole% Methane 89.41 Ethane 5.08 Propane 1.45 i-Butane 0.18 n-Butane 0.26 i-Pentane 0.06 CO2 1.55 Nitrogen 1.93 n-Pentane 0.06 n-Hexane 0.02 Total 100.0
Cell aqueous liquids volume fractions were typically 0.80-0.85. The reason for using quite high liquid volume fractions was twofold: (1) to give high sensitivity for detection of hydrate (the smaller the gas head/moles of gas, the greater the pressure change due hydrate formation) and (2) to minimise dead volume / aqueous phase unwetted internal cell surfaces where hydrate might be able to grow slowly from polymer-free condensed water (e.g. a disequilibrium ‘top of line hydrates’ type scenario). To aid further in the latter and ensure mass transfer/reaction rates were maximised, impeller speed was typically set at 750 rpm, giving good shearing/co-mingling of aqueous and gaseous phases. CGI Experimental Procedure In the companion paper to this work [12], a standardised CGI experimental procedure (e.g. for commercial formulation assessment) is described. Tests described here followed the same general methodology, albeit with some variations (e.g. in heating cooling rates, hydrate fraction present) as systems were explored in detail from a more specific R&D perspective. In summary, the general methods used were as follows:
1. Following gas charging to initial pressure at a temperature outside the hydrate region, the system was first cooled rapidly to a high subcooling to induce hydrate formation
2. Following initial rapid hydrate formation, the system was then warmed in steps to dissociate most of the hydrate formed, leaving only a small fraction remaining (typically < 0.5% of water converted), while assessing the extent of any anomalously slow dissociation behaviour
3. Cell temperature was then reduced again at a constant cooling rate (typically 1.0 °C / hr, but both slower and faster rates were commonly employed as part of investigations) to observe clear changes in growth rate as a function of subcooling
4. Steps 2-3 were repeated a number of times to examine repeatability
5. Finally, following a repeat of Step 2, the system was step-cooled with a small fraction of hydrate present to confirm the extent of the complete inhibition and very slow growth regions where appropriate
From PT data generated using the above procedure, changes in relative growth rates were
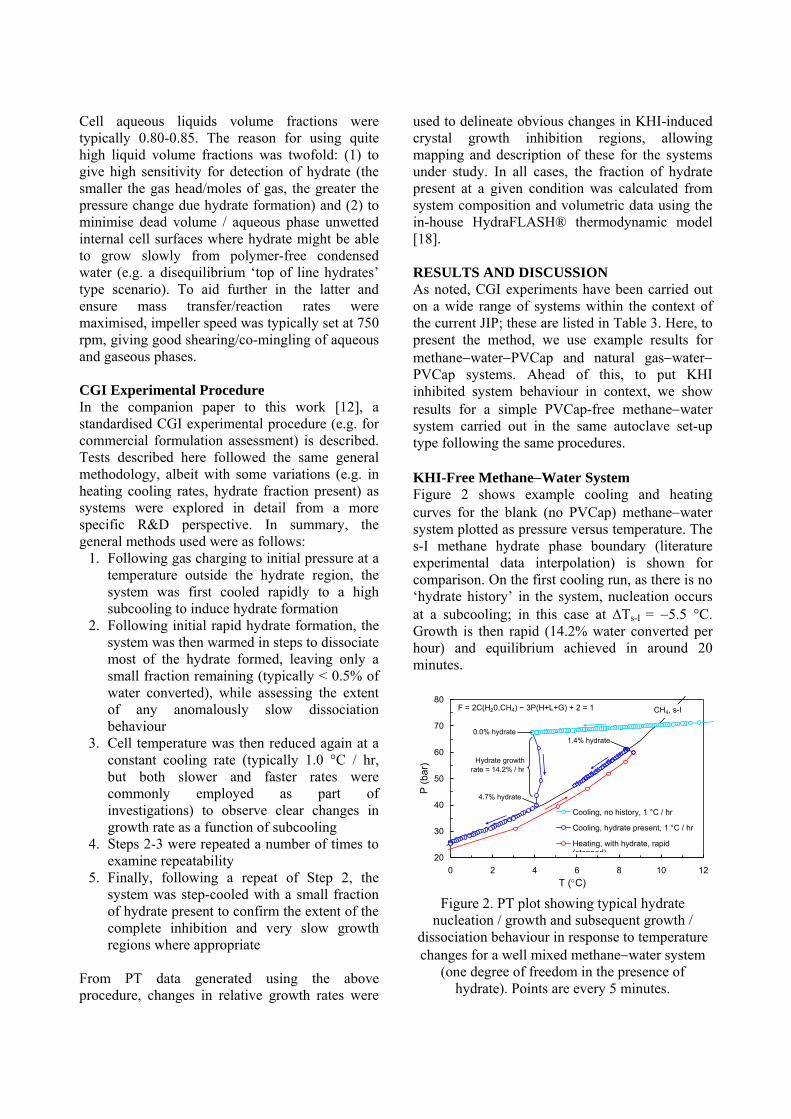
used to delineate obvious changes in KHI-induced crystal growth inhibition regions, allowing mapping and description of these for the systems under study. In all cases, the fraction of hydrate present at a given condition was calculated from system composition and volumetric data using the in-house HydraFLASH® thermodynamic model [18]. RESULTS AND DISCUSSION As noted, CGI experiments have been carried out on a wide range of systems within the context of the current JIP; these are listed in Table 3. Here, to present the method, we use example results for methanewaterPVCap and natural gaswater PVCap systems. Ahead of this, to put KHI inhibited system behaviour in context, we show results for a simple PVCap-free methanewater system carried out in the same autoclave set-up type following the same procedures. KHI-Free MethaneWater System Figure 2 shows example cooling and heating curves for the blank (no PVCap) methanewater system plotted as pressure versus temperature. The s-I methane hydrate phase boundary (literature experimental data interpolation) is shown for comparison. On the first cooling run, as there is no ‘hydrate history’ in the system, nucleation occurs at a subcooling; in this case at Ts-I = 5.5 °C. Growth is then rapid (14.2% water converted per hour) and equilibrium achieved in around 20 minutes.
20
30
40
50
60
70
80
0 2 4 6 8 10 12
T (C)
P (
bar
)
Cooling, no history, 1 °C / hr
Cooling, hydrate present, 1 °C / hr
Heating, with hydrate, rapid(stepped)
F = 2C(H20,CH4) − 3P(H+L+G) + 2 = 1 CH4, s-I
4.7% hydrate
0.0% hydrate
Hydrate growthrate = 14.2% / hr
1.4% hydrate
Figure 2. PT plot showing typical hydrate
nucleation / growth and subsequent growth / dissociation behaviour in response to temperature changes for a well mixed methanewater system
(one degree of freedom in the presence of hydrate). Points are every 5 minutes.

As the system is two component (C), if three phases (P) are present (Hydrate + Liquid + Gas) there is one degree of freedom (F), meaning PT conditions will follow the hydrate phase boundary (unless the system is component, heat or mass transfer limited). As can be seen, this is what occurs upon hydrate growth; PT conditions follow the phase boundary upon further cooling. When heated rapidly, hydrate dissociation occurs rapidly in response as the system attempts to regain equilibrium. When heating is stopped and re-cooling initiated with a small fraction of hydrate present (1.4% of water), hydrate growth begins again the instant PT conditions enter the stability region and subsequently follow the phase boundary as expected. Example Results: Methane with PVCap As part of the ongoing JIP project, hydrate growth and dissociation patterns in the presence of PVCap have been studied for a range of concentrations from 0.1 to 5.0 mass% aqueous. Here, example data for 0.25 and 0.50 mass% PVCap aqueous are presented. Figure 3 shows example experimental cooling and heating curves for methanewaterPVCap (0.25 mass% aqueous) plotted as pressure versus temperature. The s-I methane hydrate phase boundary is shown for comparison. On the first cooling run with no history (1.0 °C / hr) nucleation eventually occurs some six hours after PT conditions entered the hydrate region at Ts-I = 5.6 °C; a similar subcooling / pressure to the KHI free case presented in Figure 2. However, in contrast to the KHI-free case, subsequent hydrate growth is not rapid, but rather is slow and controlled, with PT conditions apparently closely following a ‘boundary’ which parallels the hydrate phase boundary for the system at a generally fixed subcooling of ~5.2 °C. This pattern continues until more than 3% of water is converted to hydrate, at which point the cell temperature was heated rapidly to dissociate the hydrate present. Upon heating, dissociation only becomes marked at a temperature some 3.5 °C higher than the phase boundary. When cooled to give Ts-I = <+3.5 °C, the dissociation rate reduces abruptly. Following the above, the temperature of the system was then cooled back into the hydrate
region and held there in preparation for a cooling run with a small fraction of hydrate present. However, as can bee seen in Figure 3, even though PT conditions were within the thermodynamic hydrate stability region for the system, dissociation continued, albeit at a very slow rate. When cooling was subsequently initiated (0.2 °C / hr) with a small fraction (~0.15% water as hydrate) of hydrate present, no growth was observed until Ts-I = 2.6 °C, at which point Ph began to increase again, but only slowly. When Ts-I reached 5.2 °C, growth rates picked up in earnest and again PT conditions steadily followed the ‘boundary’ which previously became apparent in the first run. Thus we can conclude from this data we apparently have at least 4 clear regions of KHI-induced growth/dissociation behaviour: (1) a region where no growth/dissociation is observed (2) a region where slow growth is observed, (3) a region where moderate growth is observed and (4) a region where slow dissociation is observed. These patterns can be observed over many repeat runs and regions are the CIR, RGR(S), RGR(M) and SDR respectively, as previously discussed. Clearly, in the CIR, PVCap-induced complete hydrate growth inhibition is supported by the fact that hydrate was actually observed to dissociate. This is common to this region, but alone this behaviour at a single subcooling cannot be used to determine the total extent of the CIR.
30
40
50
60
70
80
-2 0 2 4 6 8 10 12 14 16
T (C)
P (
bar
)
Cooling, no history, 1.0 °C/hrCooling, with hydrate, 0.2 °C/hrCooling, with history, 5.0 °C/hrHeating
CIRRGR(S ) SDRRFR RGR(M-R )
3.2% hydrate
0.6% hydrate
CH4, s-I
Figure 3. PT plot showing typical hydrate
nucleation / growth and subsequent growth / dissociation behaviour in response to temperature changes for a well mixed methanewater system
with 0.25 mass% PVCap aqueous. Points are every 5 minutes.

-10
-5
0
5
0 20 40 60 80 100
t (hrs)
P
h (b
ar)
-10
-5
0
5
T
s-I (
°C)
Series2Series1
CIR
RGR
RFR
VS-S
M-R
Ph
Ts-I
SDRGrowth rate = 0.02% / hr
Growth rate = 0.00% / hr 0.02% / hr
Hydrate = 0.38% / hr
Figure 4. Pressure drop due to hydrate formation (Ph) and subcooling from the s-I hydrate phase
boundary (Ts-I) data for the step cooling run with hydrate present for the 0.25% PVCap aqueous
with methane example system at ~70 bar plotted as a function of time.
In the CGI procedure, this is typically done by step-cooling with a small fraction of hydrate present. Figure 4 shows pressure drop due to hydrate formation (Ph) and temperature difference from the s-I hydrate phase boundary (Ts-I) data for a step cooling run with hydrate present for the 0.25% PVCap aqueous with methane example system at ~70 bar plotted as a function of time. As can be seen, from 5 hours onwards, at a subcooling of 4.4 °C, growth is steady at 0.02% water converted per hour, indicating RGR(VS) conditions. Cooling to Ts-I = 5.3 °C results in a sudden increase in Ph as hydrate begins to grow a moderate pace, supporting constant cooling runs which defined the subcooling boundary for this as Ts-I = 5.2 °C. Subsequent heating to a temperature just outside the hydrate region at t = 30 hrs results in very slow dissociation (SDR) conditions. Recooling to a subcooling of 2.3 °C with 0.38% water present as hydrate at t = 57 hours results in no growth observed for 15 hours. Only when cooled further to Ts-I = 2.7 °C is very slow growth finally observed, confirming the extent of the CIR and supporting previous observations from constant cooling runs. Clearly, the ability of PVCap at 0.25% to inhibit hydrate growth is limited beyond the RGR(S)/M boundary where PT conditions follow this boundary upon further cooling. However, rapid cooling runs indicate that some CGI properties are
retained up until a subcooling of ~8 °C where for ‘seeded’ (history or hydrate present) conditions, growth typically immediately commences at a rapid rate; an example run being shown in Figure 3. Figures 5 and 6 shows example CGI method cooling/heating curves for 0.5 mass% PVCap with methane where the same crystal growth inhibition behaviour can be observed. In Figure 5, PVCap induced hydrate dissociation is strongly evident; upon heating following initial hydrate formation (‘no history’ run), almost all hydrate which formed dissociates upon heating into the CIR even though PT conditions are within the hydrate stability region. This occurs to a significant extent again following a second cooling (‘with hydrate run’) / hydrate formation / heating into the CIR cycle, even though the temperature is over 4 °C within the hydrate region.
60
65
70
75
80
85
90
-2 0 2 4 6 8 10 12 14
T (C)
P (
ba
r)
1. Cooling, no history, 15 °C/hr2. Heating, stepped3. Cooling, with hydrate, 15 °C/hr4. Heating, stepped
1.91%hydrate
2.22%hydrate
0.09%hydrate
0.73%hydrate
S CIR
RFR
RGR R-M
CH4, s-I
Figure 5. PT plot showing example CGI method
cooling / heating curves for a methanewater system with 0.5 mass% PVCap aqueous. Points
are every 5 minutes.
70
90
110
130
150
170
0 4 8 12 16 20
T (C)
P (
bar)
Cooling, no history, 20 °C/hrCooling, with hydrate, 1 °C/hrCooling, with hydrate, 20 °C/hrHeating, stepped
S
CIRRFR
RGR
R-M
SDR
CH4, s-I
5.5% hydrate
0.4% hydrate
1.5% hydrate
Figure 6. PT plot showing example CGI method
cooling / heating curves for a methanewater system with 0.5 mass% PVCap aqueous. Points
are every 5 minutes.
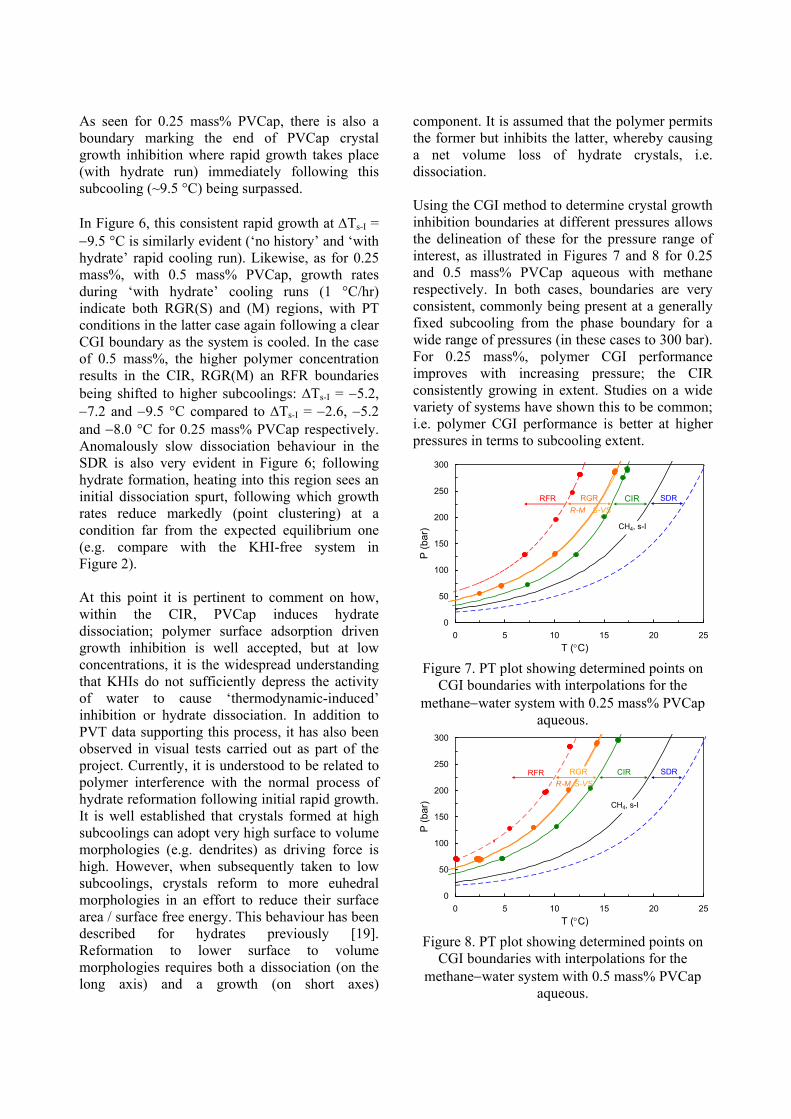
As seen for 0.25 mass% PVCap, there is also a boundary marking the end of PVCap crystal growth inhibition where rapid growth takes place (with hydrate run) immediately following this subcooling (~9.5 °C) being surpassed. In Figure 6, this consistent rapid growth at Ts-I = 9.5 °C is similarly evident (‘no history’ and ‘with hydrate’ rapid cooling run). Likewise, as for 0.25 mass%, with 0.5 mass% PVCap, growth rates during ‘with hydrate’ cooling runs (1 °C/hr) indicate both RGR(S) and (M) regions, with PT conditions in the latter case again following a clear CGI boundary as the system is cooled. In the case of 0.5 mass%, the higher polymer concentration results in the CIR, RGR(M) an RFR boundaries being shifted to higher subcoolings: Ts-I = 5.2, 7.2 and 9.5 °C compared to Ts-I = 2.6, 5.2 and 8.0 °C for 0.25 mass% PVCap respectively. Anomalously slow dissociation behaviour in the SDR is also very evident in Figure 6; following hydrate formation, heating into this region sees an initial dissociation spurt, following which growth rates reduce markedly (point clustering) at a condition far from the expected equilibrium one (e.g. compare with the KHI-free system in Figure 2). At this point it is pertinent to comment on how, within the CIR, PVCap induces hydrate dissociation; polymer surface adsorption driven growth inhibition is well accepted, but at low concentrations, it is the widespread understanding that KHIs do not sufficiently depress the activity of water to cause ‘thermodynamic-induced’ inhibition or hydrate dissociation. In addition to PVT data supporting this process, it has also been observed in visual tests carried out as part of the project. Currently, it is understood to be related to polymer interference with the normal process of hydrate reformation following initial rapid growth. It is well established that crystals formed at high subcoolings can adopt very high surface to volume morphologies (e.g. dendrites) as driving force is high. However, when subsequently taken to low subcoolings, crystals reform to more euhedral morphologies in an effort to reduce their surface area / surface free energy. This behaviour has been described for hydrates previously [19]. Reformation to lower surface to volume morphologies requires both a dissociation (on the long axis) and a growth (on short axes)
component. It is assumed that the polymer permits the former but inhibits the latter, whereby causing a net volume loss of hydrate crystals, i.e. dissociation. Using the CGI method to determine crystal growth inhibition boundaries at different pressures allows the delineation of these for the pressure range of interest, as illustrated in Figures 7 and 8 for 0.25 and 0.5 mass% PVCap aqueous with methane respectively. In both cases, boundaries are very consistent, commonly being present at a generally fixed subcooling from the phase boundary for a wide range of pressures (in these cases to 300 bar). For 0.25 mass%, polymer CGI performance improves with increasing pressure; the CIR consistently growing in extent. Studies on a wide variety of systems have shown this to be common; i.e. polymer CGI performance is better at higher pressures in terms to subcooling extent.
0
50
100
150
200
250
300
0 5 10 15 20 25
T (C)
P (
bar)
CIRRGR
R-M
RFR SDR
S-VS
CH4, s-I
Figure 7. PT plot showing determined points on
CGI boundaries with interpolations for the methanewater system with 0.25 mass% PVCap
aqueous.
0
50
100
150
200
250
300
0 5 10 15 20 25
T (C)
P (
bar
)
CIRRGR
S-VSR-MRFR SDR
CH4, s-I
Figure 8. PT plot showing determined points on
CGI boundaries with interpolations for the methanewater system with 0.5 mass% PVCap
aqueous.

The same CGI measurement methodology can of course be readily applied to more complex multicomponent gas systems, including those containing liquid hydrocarbons (e.g. condensate), e.g. as detailed in the companion paper to this work [12]. As an example, CGI method results for a multicomponent North Sea natural gas with 0.5 mass% PVCap aqueous are shown in Figures 9-12. As can be seen in Figure 9, constant rate ‘with hydrate’ present cooling curves (< 0.5% of water present as hydrate initially) show the same type of behaviour seen for pure methane systems, with no growth at low subcoolings, followed by slow growth then moderate growth with PT conditions then following a clear ‘CGI’ boundary at fixed subcooling as cooling/growth progresses. This data shows how consistent/repeatable this CGI behaviour is. In Figure 10, which shows various cooling/heat run types, this repeatability is particularly evident in cooling runs ‘with hydrate’ present at 1 °C/hr; there are two runs plotted which directly overly each other; i.e. growth patterns were identical in repeat runs. Data for the step-cooling ‘with hydrate’ run to assess the extent of the CIR are shown in Figures 10 and 11. In Figure 11, it can be seen that at the first step where the subcooling was 7.7 °C, no growth (increasing Ph) was observed for approaching 30 hours. When subcooling was increased to 8.1 C, Ph was seen to reduce, i.e. hydrate was dissociating, confirming complete inhibition (CIR) conditions. Only when the subcooling was increased further to 8.5 °C subcooling was very slow growth (RGR(S) 0.004% / hr) observed. When subcooling was increased to 10.2 °C, slow grow was observed, confirming initial observations from constant cooling runs. This behaviour is testament to the powerful crystal growth inhibition properties of PVCap; it was able to prevent any hydrate growth at subcoolings up to 8.1 °C for up to 50 hours, even inducing dissociation at this condition, with total active CGI extent exceeding 14 °C subcooling at pressures below 100 bar. A significant finding of CGI studies is that region boundaries in binary and multicomponent s-II (most stable structure) forming systems typically (PVCap and various commercial polymers) parallel the s-I phase boundary for that gas, as shown in Figures 12 and 13.
50
100
150
200
250
300
350
0 5 10 15 20 25 30
T (°C)
P (
bar
)
s-II
s-I
Cooling curves = hydrate present 1 C / hr
Figure 9. Example CGI cooling with hydrate
present (< 0.5%) curves for a North Sea natural gas (NG) water system with 0.5 mass% PVCap aqueous. Points are every five minutes. s-I/s-II
phase boundaries are shown for reference.
130
180
230
280
330
5 10 15 20 25 30
T (°C)
P (
ba
r)
Cooling, with history, rapidHeating, steppedCooling, with hydrate, 1C/hrStepped cooling, 24hrs/step
Step cooling final points
s-II
s-I
RGR VSS
SDR
CIR
M
RFR s-I + s-II
s-II
5.6% hydrate
0.3% hydrate
Figure 10. Example CGI cooling/heating curves
for the North Sea natural gas (NG) water system with 0.5 mass% PVCap aqueous. Points are every
five minutes. s-I/s-II phase boundaries and determined CGI regions are shown for reference.
-20
-15
-10
-5
0
0 20 40 60 80 100 120 140
time (hrs)
P
h (b
ar)
-12
-10
-8
-6
-4
-2
0
Ts-
II (°
C)
Series4
Series1
s-I
RGR
VS
CIRs-I+s-II
Ph
Ts-II
CIR s-II
S
0.28% hydrate
0.15% hydrate
0.45% hydrate
Rate = 0.004% / hr
Rate = 0.23% / hr
Figure 11. Ph and Ts-II data for a step cooling run with hydrate present for the 0.5% PVCap
aqueous with natural gas example system at ~270 bar plotted as a function of time. s-I and CGI
region boundaries relative to PT conditions are shown for comparison.

50
100
150
200
250
300
0 5 10 15 20 25 30
T (°C)
P (
ba
r)
SDR
s-II
s-I
CIR
RGR
VSSM
RFR
Ts-I = 9.7 °C
Ts-I = 9.5 °C
Ts-II = 13.5 °C
Ts-II = 10.7 °C
Figure 12. PT plot showing determined points on CGI boundaries with interpolations for the natural
gaswater system with 0.5 mass% PVCap aqueous.
-12 -8 -4 0 4 8 12 16
0.25% CH4
0.50% CH4
0.50% NG
0.25% CH4
0.50% CH4
0.50% NG
Ts-I (°C)
RFRRGR(M)RGR(S)RGR(VS)CIR (s-I)CIR (s-II)SDR
P = 100 bar
P = 250 bar
Aqueous PVCap
Figure 13. Experimentally determined subcooling
extents of PVCap-induced gas hydrate crystal growth inhibition (CGI) regions relative to the s-I
phase boundary for 0.25 mass% PVCap with methane and 0.5 mass% PVCap with methane and
with the standard North Sea natural gas (NG) at 100 and 250 bar pressures.
This strongly suggests that the reason for KHI failure may be due the initial formation of s-I hydrates. This is supported by the widespread understanding that PVCap and similar polymers inhibit s-II hydrates better than s-I and agrees with tests carried out in this laboratory which show initial increases in propane content of the gas phase upon initial hydrate growth in PVCap inhibited methanepropane binary gas systems. Certainly, in Figure 15, what does tie results for the different systems together is that many share common CGI boundary positions as function of subcooling, e.g. at Ts-I = ~ 5.2, 5.7 and 9.5 °C, although the nature of regions that these boundaries separate (CIR, RGR, RFR etc) varies.
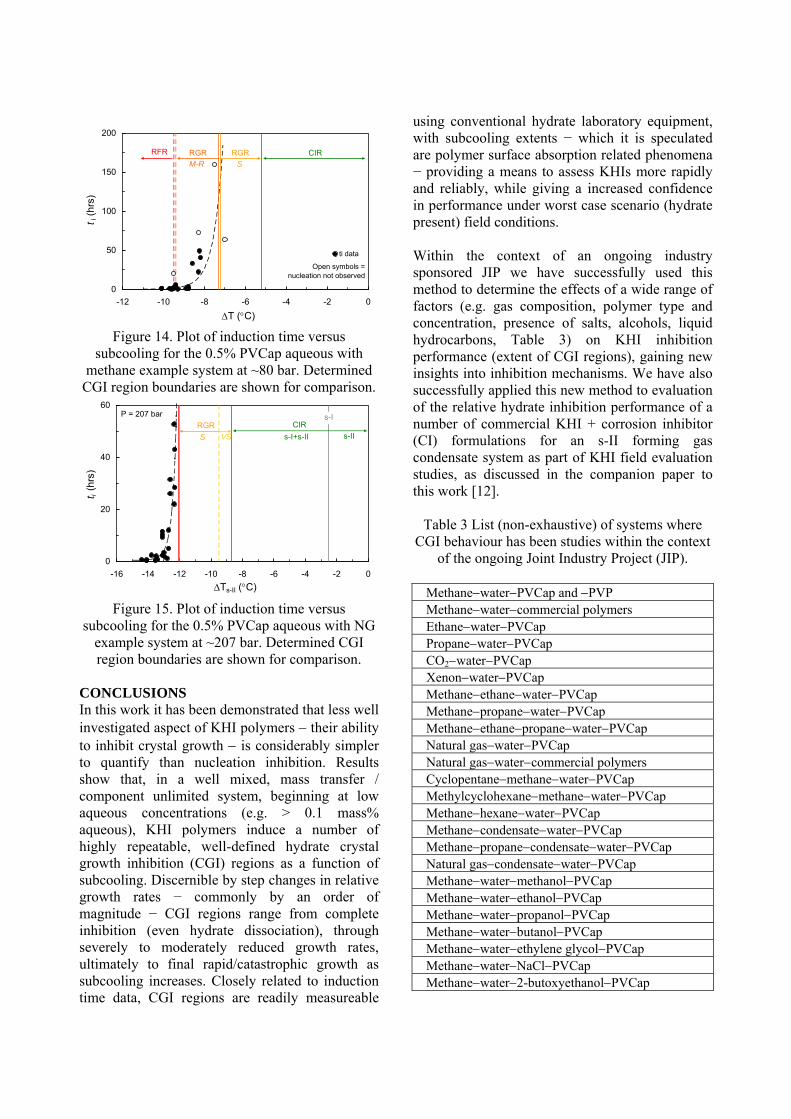
This similarity in positioning of CGI boundaries as a function of subcooling suggests KHI crystal growth inhibition strength presumably related to the strength of adsorption on specific crystal faces is related to underlying changes in natural crystal growth patterns as a function of subcooling (e.g. favoured growth faces, morphologies). CGI Region Relationship to Induction Times As KHI induced induction times are currently the primary factor in determining suitability for field use, as part of the JIP project, the relationship between ti and CGI regions was investigated early on. Figures 14 and 15 show example plots of measured ti data for the 0.5 mass% PVCap aqueous with methane and with the natural gas systems respectively. CGI region boundaries are shown for comparison. In both cases, ti measurements were made following CGI tests. To measure ti, systems were heated to at least 15 °C higher than the phase boundary (although hydrate ‘history’ disappears rapidly outside the SDR region) and kept there for 2 hours before cooling rapidly to set point temperature. The induction time was taken as the time between cell temperature reaching within 0.2 °C of the set point temperature and the time when hydrate growth was first observed from pressure drop. As can be seen, without knowledge of CGI region boundaries, ti data would seem very scattered in that a very wide range of ti values is observed for a narrow range of subcoolings (over 23 °C), as often observed in such tests. However, when CGI region boundaries are taken into account the reasons for this are clear; as growth rates increase in an order of magnitude type pattern from the CIR (zero growth even if hydrate present) to the RFR (rapid growth/as for KHI free), so induction times exponentially reduce from infinite in the CIR (never nucleates) through very long in the RGR to very short in the RFR, with this CGI region transition often occurring over a relatively small subcooling range. This pattern has so far been found to be ubiquitous in KHI systems (including commercial formulations with real gases, condensates, oils) and means CGI data can be used to assess likely ti patterns ahead of making such measurements, increasing efficiency/eliminating needless runs (e.g. where PT conditions fall within the CIR there is no need for a long ti measurement as nucleation will not occur).
0
50
100
150
200
-12 -10 -8 -6 -4 -2 0
T (C)
ti (
hrs
)
ti data
RGR S
CIRRFR RGR M-R
Open symbols =nucleation not observed
Figure 14. Plot of induction time versus
subcooling for the 0.5% PVCap aqueous with methane example system at ~80 bar. Determined
CGI region boundaries are shown for comparison.
0
20
40
60
-16 -14 -12 -10 -8 -6 -4 -2 0
Ts-II (C)
t i (h
rs)
CIRP = 207 bar s-I
RGR
S VS s-I+s-II s-II
Figure 15. Plot of induction time versus
subcooling for the 0.5% PVCap aqueous with NG example system at ~207 bar. Determined CGI region boundaries are shown for comparison.
CONCLUSIONS In this work it has been demonstrated that less well investigated aspect of KHI polymers their ability to inhibit crystal growth is considerably simpler to quantify than nucleation inhibition. Results show that, in a well mixed, mass transfer / component unlimited system, beginning at low aqueous concentrations (e.g. > 0.1 mass% aqueous), KHI polymers induce a number of highly repeatable, well-defined hydrate crystal growth inhibition (CGI) regions as a function of subcooling. Discernible by step changes in relative growth rates − commonly by an order of magnitude − CGI regions range from complete inhibition (even hydrate dissociation), through severely to moderately reduced growth rates, ultimately to final rapid/catastrophic growth as subcooling increases. Closely related to induction time data, CGI regions are readily measureable
using conventional hydrate laboratory equipment, with subcooling extents − which it is speculated are polymer surface absorption related phenomena − providing a means to assess KHIs more rapidly and reliably, while giving a increased confidence in performance under worst case scenario (hydrate present) field conditions. Within the context of an ongoing industry sponsored JIP we have successfully used this method to determine the effects of a wide range of factors (e.g. gas composition, polymer type and concentration, presence of salts, alcohols, liquid hydrocarbons, Table 3) on KHI inhibition performance (extent of CGI regions), gaining new insights into inhibition mechanisms. We have also successfully applied this new method to evaluation of the relative hydrate inhibition performance of a number of commercial KHI + corrosion inhibitor (CI) formulations for an s-II forming gas condensate system as part of KHI field evaluation studies, as discussed in the companion paper to this work [12].
Table 3 List (non-exhaustive) of systems where CGI behaviour has been studies within the context
of the ongoing Joint Industry Project (JIP).
MethanewaterPVCap and PVP Methanewatercommercial polymers EthanewaterPVCap PropanewaterPVCap CO2waterPVCap XenonwaterPVCap MethaneethanewaterPVCap MethanepropanewaterPVCap MethaneethanepropanewaterPVCap Natural gaswaterPVCap Natural gaswatercommercial polymers CyclopentanemethanewaterPVCap MethylcyclohexanemethanewaterPVCap MethanehexanewaterPVCap MethanecondensatewaterPVCap MethanepropanecondensatewaterPVCap Natural gascondensatewaterPVCap MethanewatermethanolPVCap MethanewaterethanolPVCap MethanewaterpropanolPVCap MethanewaterbutanolPVCap Methanewaterethylene glycolPVCap MethanewaterNaClPVCap Methanewater2-butoxyethanolPVCap

REFERENCES [1] Kelland MA. History of the development of
low dosage hydrate inhibitors. Energy and Fuels 2006;20:825-847.
[2] Klomp U. The world of LDHI: From conception to development to implementation. Proceedings of the 6th International Conference on Gas hydrates, Vancouver, Canada, 2008:5409.
[3] Sloan ED, Koh CA. Clathrate Hydrates of Natural Gases (3rd ed.). Taylor & Francis / CRC Press, Boca Raton, FL, 2008.
[4] Freer EM, Sloan ED. An engineering approach to kinetic inhibitor design using molecular dynamics simulations. Annals of the New York Academy of Sciences, 2000;912:651-657.
[5] Makogon YM, Sloan ED. Mechanism of kinetic hydrate inhibitors. Proceedings of the 4th International Conference on Gas Hydrates, Yokohama, Japan 2002:498-503.
[6] Anderson BJ, Tester JW, Borghi GP, Trout B L. Properties of inhibitors of methane hydrate formation via molecular dynamics simulations. Journal of the American Chemical Society, 2005; 127:17852-17862.
[7] Kvamme B, Kuznetsova T, Aasoldsen K. Molecular dynamics simulations for selection of kinetic hydrate inhibitors. Journal of Molecular Graphics and Modelling 2005;23:524-536.
[8] Peytavy J-L, Glénat P, Bourg P. Qualification of low dose hydrate inhibitors (LDHIs): field cases studies demonstrate the good reproducibility of the results obtained from flow loops. Proceedings of the 6th International Conference on Gas hydrates, Vancouver, Canada, 2008:5499
[9] Duchateau C, Dicharry C, Peytavy J-L, Glénat P, Pou T-E, Hidaldo E. Laboratory evaluation of kinetic hydrate inhibitors: a new procedure for improving the reproducibility of measurements. Proceedings of the 6th International Conference on Gas hydrates, Vancouver, Canada, 2008:5582
[10] Duchateau C, Peytavy J-L, Glénat P, Pou T-E, Hidalgo M, Dicharry C. Laboratory evaluation of kinetic hydrate inhibitors: A procedure for enhancing the repeatability of test results. Energy and Fuels 2009;23(2):962-966.
[11] Duchateau C, Glénat P, Pou, T-E, Hidalgo M, Dicharry C. Hydrate precursor test method
for the laboratory evaluation of kinetic hydrate inhibitors. Energy Fuels 2010;24:616–623.
[12] Glénat P, Anderson R, Mozaffar H, Tohidi B. Application of a new crystal growth inhibition based KHI evaluation method to commercial formulation assessment. Proceedings of the 7th International Conference on Gas hydrates, Edinburgh, Scotland, UK, 2011.
[13] Makogon TY, Larsen R, Knight CA, Sloan ED. Melt growth of tetrahydrofuran clathrate hydrate and its inhibition: Method and first results. Journal of Crystal Growth 1997;179:258-262.
[14] Larsen R, Knight CA, Sloan ED. Clathrate hydrate growth and inhibition. Fluid Phase Equilibria 1998;150-151:353-360.
[15] Larsen R, Knight CA, Rider KT, Sloan ED. Melt growth and inhibition of ethylene oxide clathrate hydrate. Journal of Crystal Growth 1999;204:376-381.
[16] Habetinova E, Lund A, Larsen R. Hydrate dissociation under the influence of low-dosage kinetic inhibitors. Proceedings of the 4th International Conference on Gas Hydrates, Yokohama, Japan, 2002.
[17] Svartaas TM, Gulbrandsen AC, Huseboe SBR, Sandved O. An experimental study on “un-normal” dissociation properties of structure II hydrates formed in presence of PVCAP at pressures in the region 30 to 175 bars – dissociation by temperature increase. Proceedings of the 6th International Conference on Gas Hydrates, Vancouver, Canada, 2008:5696.
[18] HydraFLASH® Model V2.2. Hydrafact Ltd: Edinburgh, UK, 2011. www.hydrafact.com.
[19] Tohidi B, Anderson R, Clennell MB, Burgass RW, Biderkab AB. Visual observation of gas-hydrate formation and dissociation in synthetic porous media by means of glass micromodels. Geology 2001; 29(9):867-870
ACKNOWLEDGEMENTS This work was undertaken as part of a Joint Industry Project (JIP) at Heriot-Watt University, Scotland, UK, currently supported by Baker Hughes, Champion Technologies, Clariant Oil Services, DONG Energy, OMV, Petronas, Shell/NAM, Statoil and Total, whose support is gratefully acknowledged. Authors would like to thank Rod Burgass, Antonin Chapoy and Roghieh Azarinezhad for their valuable contributions to the

project, and Jim Allison for manufacture and maintenance of experimental equipment.