Embed Size (px)
Citation preview

Development of a continuous flow reactor for aerobic
granular sludge
By
Tanner Ryan Devlin
A thesis submitted to the Faculty of Graduate Studies
of the University of Manitoba in partial fulfilment
of the requirements for the degree of
DOCTOR OF PHILOSOPHY
Department of Civil Engineering
University of Manitoba
Winnipeg
© Tanner Ryan Devlin 2019

ii
To my family and friends.
Thank you
Merci beaucoup
Grazie mille
Wielkie dzięki
感谢
.خیلی ممنون
Salamat

iii
Acknowledgements
Dr. Oleszkiewicz for being the lead architect of my professional and personal development. You
have carefully crafted and firmly cemented my ethos and values as a mentor, teacher, and friend.
Dr. Sparling for encouraging me to look beyond the stereomicroscope and down the Francisella
tularensis hole. Also, for the raw materials to develop my applied microbiological skills. Prost!
Dr. Sears for providing exhaustive experience as a leading consultant in the field. As well, for
reviewing documents more dry than an EAP report.
Doug and Lucy Devlin for patiently supporting me through my studies and life itself. None of
this would have been possible without you and your unconditional love.
Charlene Urfano for always being supportive from one adventure to the next.
Micah Devlin for reminding me of my embarrassments and keeping me humble. Also, for the
company during late-night study sessions.
Towarzyszy broni, Alessandro di Biase and Maciej Kowalski, for being the best of friends and
colleagues. You were always able to deal with my cazzate, and you made our office a casa. I
could not have asked for better fratelli.
Kevin Sagan and Marc de Rocquigny, thanks for being the best of friends and a welcome
distraction from studies. You have been with me since the beginning.
Dr. Kruk and Dr. Jabari for paving the way before me and being role models. Dr. Wei and Dr.
Yuan for always being open for discussion and warmly welcoming me to the University of
Manitoba. Thanks to all who have been, are, and will be in the Environmental Laboratory.

iv
Abstract
Aerobic granular sludge is an advanced biological process that provides sustainable
wastewater treatment. Compared to conventional wastewater treatment processes, aerobic
granular sludge exhibits better settling, higher volumetric loading, reduced chemical and
electrical requirements, and less biosolids production. Currently, aerobic granular sludge is only
available as a sequencing batch reactor process. Sequencing batch reactors, however, would not
be suitable for retrofit at most existing wastewater treatment facilities. Therefore, many facilities
would not be able to realize the benefits of aerobic granular sludge unless significant changes to
existing infrastructure were made. A more compatible technology, being a continuous flow
reactor, would facilitate the implementation of aerobic granular sludge into existing facilities that
would otherwise struggle with sequencing batch reactors.
Thus, the goal of these studies was to develop a continuous flow reactor for aerobic
granular sludge that would be suitable for retrofit into existing wastewater treatment facilities. To
attain the goal, several items had to be addressed, including: 1) the suitability of aerobic granular
sludge to treat low-strength, municipal wastewater; 2) the importance of hydrodynamic shear
force for aerobic granular sludge stability; 3) the role of organic loading rate on aerobic granular
sludge stability and performance; 4) the impact of selective wasting on granulation in continuous
flow; and 5) the impact of reactor configuration on granulation in continuous flow. For more
general items, such as suitability for low-strength wastewater and the role of hydrodynamic shear
force, lab-scale sequencing batch reactors were used. The remaining tests were carried out in lab-
and pilot-scale continuous flow reactors. Based on the results, design and operational parameters
for an aerobic granular sludge-continuous flow reactor were developed and confirmed to be
feasible for the treatment of low-strength, municipal wastewater.

v
Table of contents
Acknowledgements ........................................................................................................................ iii
Abstract .......................................................................................................................................... iv
Table of contents ............................................................................................................................. v
List of equations ........................................................................................................................... xiii
List of figures ............................................................................................................................... xiv
List of tables ................................................................................................................................. xix
Nomenclature ............................................................................................................................... xxi
Executive summary ................................................................................................................... xxvii
Chapter 1: Introduction ................................................................................................................... 1
Current and future trends in wastewater treatment ..................................................................... 1
Conventional wastewater treatment processes ........................................................................ 1
Commercially available options for upgrading existing treatment capacity .......................... 2
Case study: AquaNereda® sequencing batch reactor .............................................................. 6
Emerging energy efficient and sustainable nutrient removal technologies ............................ 8
Characteristics of AGS ............................................................................................................... 9
Physical characteristics ........................................................................................................... 9
Extracellular polymeric substances ....................................................................................... 11
Ion exchange and biologically induced precipitation ........................................................... 13

vi
Microbial community and nutrient removal capabilities ...................................................... 15
Surface layer of granular sludge ........................................................................................... 19
Factors affecting granule formation and stability ..................................................................... 20
Alternating “feast” and “famine” conditions ........................................................................ 20
Hydrodynamic shear forces .................................................................................................. 22
Influent distribution .............................................................................................................. 23
Selective wasting .................................................................................................................. 26
Organic loading rate .............................................................................................................. 27
Other environmental factors ................................................................................................. 28
Design considerations and control strategies ........................................................................ 30
Application of AGS to municipal wastewater .......................................................................... 33
Municipal wastewater characteristics ................................................................................... 33
Optional and required pre-treatment of municipal wastewaters ........................................... 35
Operational considerations for municipal wastewater treatment .......................................... 38
Application of AGS to industrial wastewaters .......................................................................... 42
Agro-food wastewater ........................................................................................................... 42
Petrochemical and oily wastewater ....................................................................................... 46
Landfill leachate .................................................................................................................... 48
Wastewater contaminated by emerging micro-pollutants ..................................................... 49
AGS in a CFR ........................................................................................................................... 50
vii
General considerations .......................................................................................................... 50
Objectives ............................................................................................................................. 53
Bibliography ............................................................................................................................. 54
Chapter 2: AGS-SBR treating low-strength wastewater at low hydrodynamic shear force ......... 74
Introduction ............................................................................................................................... 74
Methods..................................................................................................................................... 75
Reactor design and operation ................................................................................................ 75
Analytical methods ............................................................................................................... 77
Results ....................................................................................................................................... 80
Biomass characteristics and quantities .................................................................................. 80
Biomass growth characteristics............................................................................................. 84
Phosphorus removal .............................................................................................................. 86
Nitrogen removal .................................................................................................................. 87
Relationship between nutrient removal and biomass characteristics .................................... 89
Summary ............................................................................................................................... 92
Bibliography ............................................................................................................................. 93
Chapter 3: Impact of OLR on an AGS-SBR at low hydrodynamic shear force ........................... 96
Introduction ............................................................................................................................... 96
Methods..................................................................................................................................... 98
Reactor design ....................................................................................................................... 98

viii
Feed characteristics ............................................................................................................... 99
Analytical methods ............................................................................................................. 100
Results ..................................................................................................................................... 101
General performance ........................................................................................................... 101
Biomass quantities and growth parameters ......................................................................... 103
Physical appearance and microscopic analysis ................................................................... 104
Specific removal rates and nutrient profiles ....................................................................... 107
Summary ............................................................................................................................. 113
Bibliography ........................................................................................................................... 114
Chapter 4: Controlled SRT stabilizes AGS-SBR under high OLR and low hydrodynamic shear
force ............................................................................................................................................ 117
Introduction ............................................................................................................................. 117
Methods................................................................................................................................... 119
Reactor design and operation .............................................................................................. 119
Analytical methods ............................................................................................................. 120
Results ..................................................................................................................................... 122
Reactor performance with SRT .......................................................................................... 122
Characteristics and morphology of biomass with SRT ...................................................... 126
Impact of stopping SRT ...................................................................................................... 129
Summary ............................................................................................................................. 133

ix
Bibliography ........................................................................................................................... 134
Chapter 5: Comparison of Hydrodynamic Shear Force and Granular Sludge Wasting as Methods
to Stabilize AGS Biomass ........................................................................................................... 138
Hydrodynamic shear force ...................................................................................................... 138
Controlled wasting of AGS ..................................................................................................... 142
Bibliography ........................................................................................................................... 144
Chapter 6: Description of the AGS-CFR .................................................................................... 145
Introduction ............................................................................................................................. 145
Description of the reactor ........................................................................................................ 146
Description of the process ....................................................................................................... 149
Description of potential modifications .................................................................................... 151
Bibliography ........................................................................................................................... 153
Chapter 7: Influence of selective pressure in an AGS-CFR ....................................................... 156
Introduction ............................................................................................................................. 156
Methods................................................................................................................................... 157
Reactor configuration.......................................................................................................... 157
Source of inoculum ............................................................................................................. 159
Wastewater characteristics .................................................................................................. 160
Analytical methods ............................................................................................................. 160
Results ..................................................................................................................................... 161

x
Biomass quantities and characteristics ................................................................................ 161
Effluent characteristics ........................................................................................................ 165
Metabolic characteristics and biomass yields ..................................................................... 166
Summary ............................................................................................................................. 173
Bibliography ........................................................................................................................... 174
Chapter 8: Impact of feast to famine ratios in an AGS-CFR ...................................................... 177
Introduction ............................................................................................................................. 177
Methods................................................................................................................................... 179
Reactor configuration and operation ................................................................................... 179
Source of inoculum ............................................................................................................. 181
Wastewater characteristics .................................................................................................. 182
Analytical methods and calculations .................................................................................. 184
Results ..................................................................................................................................... 185
Reactor performance ........................................................................................................... 185
Nitrogen and phosphorus profiles ....................................................................................... 189
Biomass characteristics and morphology ............................................................................ 193
Summary ............................................................................................................................. 200
Bibliography ........................................................................................................................... 201
Chapter 9: Modelling the AGS-CFR with BioWinTM................................................................. 204
Introduction ............................................................................................................................. 204

xi
Methods................................................................................................................................... 204
Results ..................................................................................................................................... 205
Bibliography ........................................................................................................................... 209
Chapter 10: Engineering Significance ........................................................................................ 210
Overview of conclusions ......................................................................................................... 210
Engineering significance ......................................................................................................... 210
Low-strength wastewater .................................................................................................... 210
Hydrodynamic shear force .................................................................................................. 212
Solids retention time control at high organic loading rates ................................................ 213
Selective wasting in continuous flow reactors .................................................................... 214
Feast and famine conditions in continuous flow reactors ................................................... 216
Summary of findings........................................................................................................... 217
Recommendations for future studies ...................................................................................... 220
Bibliography ........................................................................................................................... 222
Appendix A ................................................................................................................................. 223
Determination of DF and DS .................................................................................................... 223
Appendix B ................................................................................................................................. 229
One-way ANOVA .................................................................................................................. 229
Appendix C ................................................................................................................................. 233
Determination of rmax .............................................................................................................. 233

xii
Appendix D ................................................................................................................................. 235
BioWinTM model of the AGS-CFR ......................................................................................... 235
Appendix E ................................................................................................................................. 249
Hydrodynamic shear force versus airflow .............................................................................. 249

xiii
List of equations
Equation 1 ..................................................................................................................................... 79
Equation 2 ..................................................................................................................................... 79
Equation 3 ..................................................................................................................................... 79
Equation 4 ..................................................................................................................................... 79
Equation 5 ..................................................................................................................................... 79
Equation 6 ................................................................................................................................... 101
Equation 7 ................................................................................................................................... 101
Equation 8 ................................................................................................................................... 121
Equation 9 ................................................................................................................................... 121
Equation 10 ................................................................................................................................. 121
Equation 11 ................................................................................................................................. 121
Equation 12 ................................................................................................................................. 121
Equation 13 ................................................................................................................................. 121
Equation 14 ................................................................................................................................. 161
Equation 15 ................................................................................................................................. 183
Equation 16 ................................................................................................................................. 183
Equation 17 ................................................................................................................................. 183
Equation 18 ................................................................................................................................. 185
Equation 19 ................................................................................................................................. 185
Equation 20 ................................................................................................................................. 185

xiv
List of figures
Figure 1 Depiction of feast and famine phases by OUR profiles in a continuously aerated CAS-
SBR (left) and continuously aerated AGS-SBR (right) with and without extended feast
conditions due to high pCOD in the influent. The endogenous respiration phase in OUR profiles
can be used to monitor the development and duration of the famine phase. ................................ 20
Figure 2 Estimated PAO to OHO ratio for a modelled biological treatment facility with
increasing SRT and various configurations at a 12 h HRT. All models had typical primary
influent characteristics of 500 mg-COD/L, 40 mg-TN/L, and 10 mg-TP/L as input. Fermentation
was modelled at a 3 d SRT receiving primary sludge from a clarifier removing 70% of influent
TSS. ............................................................................................................................................... 21
Figure 3 Steady-state MLSS and MLVSS in R1-R3. Error bars represent one standard deviation.
....................................................................................................................................................... 80
Figure 4 Steady-state TSS and VSS in the effluents of R1-R3. Error bars represent one standard
deviation. ....................................................................................................................................... 81
Figure 5 Average diameter of granules from R1-R3. Error bars represent one standard deviation.
....................................................................................................................................................... 84
Figure 6 Left – steady-state whole sludge SRT in R1-R3; Right – steady-state Ynet. Errors bars
represent one standard deviation. .................................................................................................. 85
Figure 7 Left – steady-state rate of OP release.; Right – steady-state rate of OP uptake.. Errors
bars represent one standard deviation. .......................................................................................... 87
Figure 8 Left – steady-state rmax, NOx-N prod. in R1-R3; Right – average TN removal, and the
removal mechanisms, during steady-state. Error bars represent one standard deviation. ............ 88
xv
Figure 9 Steady-state SND as a function of: MLVSS (top left); whole sludge SRT (top right);
Ynet (bottom left); and Rmax, OP rel. (bottom right). Errors bars represent one standard deviation. . 91
Figure 10 MLVSS for all AGS-SBRs over the entire study. ...................................................... 103
Figure 11 Specific COD, TN, and TP removal rates for each AGS-SBR during the last month of
operation (i.e., steady-state). Error bars represent one standard deviation. ................................ 109
Figure 12 Percent sCOD utilized during the anaerobic influent distribution phase during a single
reactor cycle. Negative values represent an increase in sCOD during the anaerobic feeding phase.
..................................................................................................................................................... 111
Figure 13 Mass of OP in solution for a single operational cycle on day 76. Anaerobic influent
distribution occurred from 0-60 min and aeration was applied from 60-170 min. Initial values
(i.e., t = 0 min) included the entire mass of OP supplied during the anaerobic influent distribution
phase. Error bars represent one standard deviation. ................................................................... 112
Figure 14 Effluent COD, sCOD, TN, and TP in R1-R3. Error bars represent one standard
deviation. ..................................................................................................................................... 122
Figure 15 sCOD profile during steady-state for R1-R3 over regular operational cycles. Error bars
represent one standard deviation. ................................................................................................ 124
Figure 16 Nitrite/nitrate concentrations at the beginning and end of anaerobic influent
distribution during steady-state for R1-R3. Error bars represent one standard deviation. ......... 126
Figure 17 Steady-state net observed yields shown with the nitrogen and phosphorus content of
MLVSS. Error bars represent one standard deviation. ............................................................... 128
Figure 18 Stereoscopic images of biomass from R1-R3 during SRT control and seven days after
SRT control was stopped. ........................................................................................................... 131

xvi
Figure 19 Top – Difference in COD, sCOD, TN, and TP removals in R1-R3 with and without
SRT control (i.e., mixed liquor wasting); Bottom – Removal ratios (RR) for COD, sCOD, TN,
and TP as a function of OLR. ..................................................................................................... 132
Figure 20 Visual representation of filamentous microorganisms coating AGS under low
hydrodynamic shear force. An increase in filamentous microorganisms coating AGS
corresponded with the quantity of anaerobic COD uptake decreasing. ...................................... 139
Figure 21 Cases of successful and unsuccessful granulation plotted with the OLR and USAV
used in the respective study. ....................................................................................................... 140
Figure 22. AUSAV/ANit. and AUSAV/AHet. as a function of SWL (top) and DO (bottom). ............. 141
Figure 23 Successful granulation with SRT control shown with the OLR limit without SRT
control and the potential OLR limit with SRT control. It should be noted that OLR above 4.5 kg-
COD/(m3•d) were not examined, and therefore the OLR limit with SRT control may be higher
than presented. ............................................................................................................................ 143
Figure 24 Visual representation of AGS stability with increasing OLR with and without SRT
control at low hydrodynamic shear force. ................................................................................... 143
Figure 25 Simplified schematic of the AGS-CFR in one of its embodiments. ........................... 146
Figure 26 Steady-state MLSS and the ratio of MLVSS/MLSS with increasing selective pressure
(i.e., rotational speed of the impeller in the clarifier). Error bars represent a single standard
deviation. ..................................................................................................................................... 162
Figure 27 Average DF and DS of granules in the AGS-CFR with increasing selective pressure.
Error bars represent a single standard deviation. ........................................................................ 164

xvii
Figure 28 Steady-state effluent characteristics for the AGS CFR under different selective wasting
pressures. Higher selective wasting pressures were applied at higher rotational speeds of the
impeller in the clarifier. Error bars represent one standard deviation. ........................................ 165
Figure 29 Steady-state concentrations of sCOD in the first and second aerobic compartment of
the AGS-CFR under different rotational speeds for selective wasting. Error bars represent one
standard deviation. ...................................................................................................................... 167
Figure 30 Steady-state anaerobic utilization of sCOD in the AGS-CFR under different rotational
speeds for selective wasting. Error bars represent one standard deviation. ................................ 169
Figure 31 Ynet under different rotational speeds for selective wasting. ...................................... 171
Figure 32 Effluent TSS and VSS, and whole sludge SRT under different rotational speeds for
selective wasting. Error bars represent one standard deviation. ................................................. 172
Figure 33 Steady-state reactor nutrient profiles for configuration 1 and 2 without selective
wasting. Error bars represent one standard deviation. ................................................................ 190
Figure 34 Top – steady-state SVI of configuration 1 and 2 without selective wasting (SW) and
configuration 2 with selective wasting compared to inoculum. Error bars represented one
standard deviation; Bottom – trend in SVI with the introduction of selective wasting to
configuration 2. ........................................................................................................................... 196
Figure 35 Top – particle size analysis for configuration 1, configuration 2 without selective
wasting, and configuration 2 with selective wasting; Bottom – total nitrogen removal for
configuration 1 (i.e., steady state), configuration 2 without selective wasting (i.e., steady state),
and configuration 2 with selective wasting (i.e., 12-48 d after selective wasting was started).
Error bars represented one standard deviation. ........................................................................... 199

xviii
Figure 36 Comparison of nutrient profiles between actual measured data and an optimized and
unoptimized BioWinTM model. ................................................................................................... 206
Figure 37 Relative abundance of select microbial guilds from the optimized BioWinTM model.
..................................................................................................................................................... 208
Figure 38 Visual representation of granulation as a function of selective pressure in CFRs. .... 214
Figure 39 Representation of existing activated sludge models (left) versus what components
could be integrated with further studies into EPS production and modification in AGS (right). 221

xix
List of tables
Table 1 Conventional technologies for increasing nutrient removal at existing CAS WWTPs [5].
......................................................................................................................................................... 2
Table 2 Conventional technologies for increasing nutrient removal at existing CAS WWTPs [5].
......................................................................................................................................................... 3
Table 3 Summary of expected MLSS concentrations with commercially available technologies
for upgrading the capacity of CAS [9], [10], [12]–[14]. ................................................................. 4
Table 4 Emerging process options for installing BNR within existing CAS footprints. ................ 9
Table 5 Summary of the main operating conditions affecting aerobic granulation. ..................... 30
Table 6 Summary of AGS-SBR pre-treatment configurations based on municipal wastewater
characteristics. ............................................................................................................................... 36
Table 7 Comparison of continuously-aerated AGS-SBRs to AGS-SBRs with anaerobic influent
distribution. ................................................................................................................................... 41
Table 8 Summary of design parameters for the AGS-CFR. ....................................................... 148
Table 9 Measured/estimated characteristics of equalized primary effluent from a full-scale
domestic wastewater treatment plant. Values shown for steady-state operation of configuration 1
and configuration 2 with one standard deviation. Measured/estimated values were compared to
default values in conventional modelling software [13]. ............................................................ 184
Table 10 Average steady-state effluent characteristics for configuration 1 and 2 shown with one
standard deviation. ...................................................................................................................... 187
Table 11 Summary of steady-state operational parameters for configuration 1 and 2 shown with
one standard deviation. Target values indicated the planned values while estimated values
indicated estimations from operational data. .............................................................................. 194

xx
Table 12 Comparison of select parameters between actual measured data and an unoptimized and
optimized BioWinTM model. ....................................................................................................... 205
Table 13 Summary of default and optimized BioWinTM parameters. ........................................ 207
Table 14 Summary of operational parameters for AGS treating low-strength wastewater. ....... 211

xxi
Nomenclature
AAO – anaerobic ammonium oxidizers
A/A – airflow to airflow ratio
AGS – aerobic granular sludge
AHet. – airflow required to satisfy wastewater treatment without nitrification
ANit. – airflow required to satisfy wastewater treatment with nitrification
AOB – ammonium oxidizing bacteria
AUSAV – airflow required to satisfy the upflow superficial air velocity
bCOD – biodegradable chemical oxygen demand
BOD – biochemical oxygen demand
CAS – conventional activated sludge
CEPT – chemically enhanced primary treatment
CFR – continuous flow reactor
CMR – completely-mixed reactor
COD – chemical oxygen demand
DAMOA – denitrifying anaerobic methane oxidizing archaea
DAMOB – denitrifying anaerobic methane oxidizing bacteria
DF – Feret’s diameter

xxii
DGAO – denitrifying glycogen accumulating organisms
DO – dissolved oxygen
DPAO – denitrifying phosphorus accumulating organisms
DS – Diameter of equivalent sphere
EBPR – enhanced biological phosphorus removal
EPS – extracellular polymeric substances
EPS – extracellular polymeric substances
F/M – food to microorganism ratio
ffCOD – flocculated and filtered COD
GAO – glycogen accumulating organisms
HRT – hydraulic retention time
HSR – high-strength reactor
IFAS – integrated fixed film activated sludge
LOT – limit of technology
LSR – low-strength reactor
MBfR – membrane biofilm reactor
MBR – membrane bioreactor
MEC – microbial electrolysis cell

xxiii
MFC – microbial fuel cell
MLSS – mixed liquor suspended solids
MLVSS – mixed liquor volatile suspended solids
MSR – medium-strength reactor
NMLVSS – nitrogen content of mixed liquor volatile suspended solids
NOB – nitrite oxidizing bacteria
OHO – ordinary heterotrophic organisms
OLR – organic loading rate
OP – orthophosphate
ORP – oxidation reduction potential
OUR – oxygen uptake rate
PAO – phosphorus accumulating organisms
pCOD – particulate chemical oxygen demand
PFR – plug-flow reactor
PHA – polyhydroxyalkanoate
PMLVSS – phosphorus content of mixed liquor volatile suspended solids
PNA – partial nitritation with anammox
R – recycle ratio

xxiv
RAS – return activated sludge
rCOD – specific chemical oxygen demand removal
Re – Reynolds number
rmax, NOx prod. – maximum specific nitrite/nitrate production rate
Rmax, OP rel. – maximum orthophosphate release rate
rmax, OP rel. – maximum specific orthophosphate release rate
rmax, OP up. – maximum specific orthophosphate uptake rate
RR – removal ratio
rTN – specific TN removal
rTP – specific TP removal
rWAS – specific wasting rate
S – concentration of substrate
SBR – sequencing batch reactor
sCOD – soluble chemical oxygen demand
SND – simultaneous nitrification-denitrification
SOUR – specific oxygen uptake rate
SRT – solids retention time
SRTAGS – solids retention time of aerobic granular sludge

xxv
SRTSW – solids retention time of selectively wasted biomass
SS – sidestream
sTN – soluble total nitrogen
sTP – soluble total phosphorus
SVI – sludge volume index
SWL – surface water level
TAN – total ammonia nitrogen
TIN – total inorganic nitrogen
TN – total nitrogen
TP – total phosphorus
TSS – total suspended solids
USAV – upflow superficial air velocity
vcritical – critical settling velocity
VER – volumetric exchange ratio
VFA – volatile fatty acid
VSS – volatile suspended solids
WAS – waste activated sludge
X – concentration of solids

xxvi
Ynet – net observed yield

xxvii
Executive summary
The goal of these studies was to develop a continuous flow reactor for aerobic granular
sludge that would be suitable for retrofit into existing wastewater treatment facilities. Several
objectives were addressed to achieve the goal:
Suitability for low-strength wastewater. The suitability of AGS to treat low-strength
wastewater was first examined on synthetic proteinaceous medium. With average influent of
340±30 mg/L COD, 42±5 mg/L TN, and 7±1 mg/L TP, an aerobic granular sludge-sequencing
batch reactor achieved effluent orthophosphate of 0.2±0.4 mg-P/L and effluent total inorganic
nitrogen of 17 mg-N/L. Aerobic granular sludge formed and matured, from conventional
activated sludge inoculum, within 40 d while treating the synthetic proteinaceous medium. The
aerobic granular sludge remained stable for the remaining 120 d experimentation period. Low-
strength wastewater was used in all but one of the subsequent studies, and each of the studies
successfully cultivated aerobic granular sludge whether it was on synthetic proteinaceous
medium or primary effluent from a full-scale domestic wastewater treatment facility. The full-
scale primary effluent averaged 310±60 mg/L COD, 48±9 mg/L TN, and 5.7±0.9 mg/L TP.
Stable aerobic granular sludge did not loose performance despite chemical oxygen demand as
low as 269 mg/L. Thus, granulation was both possible and stable while treating low-strength
wastewaters such as primary effluent from domestic wastewater treatment facilities.
Importance of hydrodynamic shear force. The influence of increasing organic loading
rate on aerobic granular sludge-sequencing batch reactor operation under low hydrodynamic
shear force was examined. Specifically, upflow superficial air velocity was 0.41 cm/s while
organic loading rate increased from 1.36 kg-COD/(m3•d) to 2.52 kg-COD/(m3•d) to 5.20 kg-
COD/(m3•d). At 0.41 cm/s and 1.36 kg-COD/(m3•d), a mature aerobic granular sludge developed

xxviii
within 40 d. At organic loading rate of 2.52 kg-COD/(m3•d) a mature aerobic granular sludge
developed within a month, but filamentous microorganisms were detected on granule surfaces
approximately 15 d after mature-aerobic granular sludge development. Granules at organic
loading rate of 2.52 kg-COD/(m3•d) were fully coated by a filamentous surface layer within two
months from inoculation. At organic loading rate of 5.20 kg-COD/(m3•d) large granules
developed rapidly, within two days, but then quickly destabilized. For the remaining four months
of experimentation, biomass in the sequencing batch reactor with organic loading rate of 5.20 kg-
COD/(m3•d) appeared as filaments joined together by a white, viscous substance that was likely
a mixture of EPS and some cells. Thus, hydrodynamic shear force became more important as the
organic loading rate increased, particularly when the organic load exceeded the capacity for
anaerobic utilization. It was therefore concluded that high hydrodynamic shear force was not a
requirement for granulation, but higher shear may be beneficial at higher OLR.
Solids retention time as a control mechanism at high OLR. An alternative method for
stabilizing AGS, compared to high hydrodynamic shear force, was examined while treating
brewery wastewater. Specifically, the controlled wasting of aerobic granular sludge, in addition
to the selective wasting of slowly-settling biomass, was examined at organic loading rates from
1.5-4.5 kg-COD/(m3•d) and low upflow superficial air velocity of 0.51 cm/s. The measured
whole sludge solids retention time was approximately 7 d under all organic loading rates.
Previously, a minimum upflow superficial air velocity of 0.2 cm/s per kg-COD/(m3•d) was
recommended to maintain stable aerobic granular sludge. Thus, at 4.5 kg-COD/(m3•d) the
upflow superficial air velocity should have been 0.9 cm/s to generate stable aerobic granular
sludge. However, it was demonstrated that controlled wasting of aerobic granular sludge helped
maintain stable granules under lower than recommended upflow superficial air velocity. Thus,

xxix
controlling the solids retention time of aerobic granular sludge was effective at stabilizing the
biomass at high organic loading rates and could potentially be used instead of hydrodynamic
shear force.
Impact of selective wasting. The formation of aerobic granular sludge in a continuous
flow reactor treating low-strength, proteinaceous wastewater (i.e., chemical oxygen demand =
370±30 mg/L; total nitrogen = 43±7 mg/L; and total phosphorus = 10±2 mg/L) under increasing
selective pressure at organic loading rate of 1.5 kg-COD/(m3•d) was studied. A continuously-
stirred clarifier was used to out-select the light fraction of biomass at 20 °C by operating at Re
between 1500-5000. Successful granulation was observed, although below Re of 3000 a
flocculent-granular biomass was developed and above Re of 4000 large granules with a
filamentous population formed. Although mixed liquor suspended solids was low at Re number
of 4000, granules had good characteristics (i.e., smooth surface, low filamentous
microorganisms) and average diameter ranged from 0.21-0.67 mm. Average diameter at Re of
3000 only ranged from 0.21-0.23 mm. Thus, the optimal selective pressure was a Re between
3000-4000. Therefore, selective wasting enhanced granulation in continuous flow, although too
high a selective pressure could result in destabilization and undesirable biomass characteristics.
Reactor configuration. The ratio of feast to famine conditions was examined in a
continuous flow reactor consisting of multiple completely-mixed reactors in series. Two feast to
famine ratios were examined: 1) 0.47 v/v; and 2) 0.1 v/v. Primary effluent from a full-scale
municipal wastewater treatment plant was supplied to the aerobic granular sludge-continuous
flow reactor and the organic loading rate was 0.7-0.8 g-COD/(m3•d). At lower feast to famine
ratio, granulation was enhanced. Sludge volume index was 110±20 mL/g-VSS at feast to famine
ratio of 0.47 while sludge volume was 86±8 mL/g-VSS at feast to famine ratio of 0.1. Granules

xxx
were also larger at lower feast to famine ratio. Average diameter ranged from 0.20-0.36 mm at
0.47 v/v, while average diameter ranged from 0.20-0.92 mm at 0.1 v/v. Selective wasting with
critical settling velocity of 3.1 cm/min was integrated with the 0.1 v/v configuration. The SVI
improved to 61±5 mL/g-MLSS and 50% of the granules were between 0.28-0.64 mm with
selective wasting. It was concluded that properly balanced feast and famine conditions
enhanced the potential for granulation.
Based on the results it could be concluded that aerobic granular sludge was suitable for
continuous flow reactors. In fact, a full set of design parameters were developed and examined,
demonstrating that an aerobic granular sludge-continuous flow reactor could treat low-strength,
municipal wastewater to high effluent quality of <10 mg/L TIN and <1 mg/L TP.

1
Chapter 1: Introduction
Current and future trends in wastewater treatment
Conventional wastewater treatment processes
Water management is tied directly to the well-being of global populations and must be
critically reviewed as municipalities improve infrastructure to meet future demand. By 2050 the
world will contain nearly 10 billion people, of which a vast majority will reside in urban areas
and experience an elevated standard of living [1], [2]. This will place severe strain on
infrastructure and public resources, warranting the development and implementation of more
sustainable practices to decrease the costs of incorporating advanced wastewater treatment
processes. Currently, a majority of WWTP employ CAS to remove organic pollutants from
wastewater with some nitrogen and phosphorus removed by biomass growth.
Slightly more of the influent TN and TP load can be removed by employing SS nitrogen
and phosphorus removal technologies – Table 1. In most cases suitable effluent quality can be
obtained by incorporating BNR into the existing CAS facility, simply by adding additional
anoxic and anaerobic compartments. In environmentally sensitive areas, however, costly
chemical addition and filtration technologies are required to meet the LOT [3], [4]. This results
in high greenhouse gas emissions and large carbon footprints [5]. Thus, municipalities require
processes that accomplish nutrient removal with minimal social and environmental impacts, as
well as low financial burden — a “triple bottom line” approach [6]–[8].

2
Table 1 Conventional technologies for increasing nutrient removal at existing CAS WWTPs [5].
Technology Process diagram of mainstream Effluent quality Relative Capex+Opex20 yr
CAS + SS-BNR
TP <3 mg/L TN <25 mg/L
1 (base case)
CAS-BNR
TP <1 mg/L TN <15 mg/L
10
CAS-BNR LOT
TP <0.05 mg/L TN <2 mg/L
20
Commercially available options for upgrading existing treatment capacity
Municipalities that are expanding often lack the footprint to install conventional nutrient
removal technologies. Additional anoxic and anaerobic tanks, as well as the extended aeration
capacity for ammonium oxidation, cannot be easily incorporated within existing footprints. Thus,
new process options that retain more biomass in the existing system, thus achieving higher
removal rates per unit volume, have gained popularity. There are several commercially available
technologies that can increase the capacity of new and existing WWTPs – Table 2 and Table 3.
Conventional systems that employ IFAS allow for increased capacity by decoupling SRT
between the existing suspended growth culture and a newly integrated attached growth culture.
Slower growing microorganisms, such as nitrifying AOB and NOB or AAO, become established
in a dense biofilm on synthetic carrier material. This allows the suspended culture to be designed
for faster growing heterotrophic processes such as carbon oxidation, facultative denitrification,
and EBPR via PAO [9]. Without the addition of synthetic carrier material faster growing
microorganisms would outcompete slower growing AOB and NOB, resulting in decreased
treatment capacity of CAS at lower OLR than IFAS.

3
Table 2 Conventional technologies for increasing nutrient removal at existing CAS WWTPs [5].
Technology Process diagram Description
IFAS
Synthetic carrier materials cultivate a dense biofilm of slow growing microorganisms, such as AOB and NOB, and are typically placed in the aerobic zone.
BioMagTM
Magnetite (i.e., SG = 5.2) combines with flocculent biomass, increasing the density of flocs and bolstering sedimentation of the entire system.
MBR
Membranes replace clarifiers, thereby ensuring effluent TSS of near 0 mg/L and a significant reduction in effluent particulate TN and TP.
Nereda®
AGS is cultivated in a SBR with simultaneous influent distribution and effluent discharge, generating a dense biomass capable of EBPR and SND.
Synthetic carrier material is typically applied to the aerobic compartments of IFAS
systems, although it has been applied in pre-anoxic compartments to increase capacity of
denitrification. Carrier material has also been used in post-anoxic zones where the addition of
external carbon source, such as methanol, was used for denitrification with low sludge yields
[10]. The suspended growth culture may also be completely removed from the IFAS process by
eliminating the RAS line and using more synthetic carriers, up to 67% of the reactor volume.
Without RAS the IFAS system becomes a MBBR and the removal of contaminants is performed
by the attached growth culture [11]. One disadvantage of commercially available MBBR systems
is that phosphorus must be removed chemically since the carrier material cannot, yet, be cycled
through an anaerobic phase. Since IFAS utilizes a “mobile” suspended culture that travels
through different zones, a culture of PAO for EBPR can be selected for with the simple addition
of an anaerobic compartment receiving raw wastewater, or primary fermentate rich in VFAs.

4
Table 3 Summary of expected MLSS concentrations with commercially available technologies for upgrading the capacity of CAS [9], [10], [12]–[14].
Technology MLSS Carrier material Solids separation CAS 2-4 kg/m3 - clarifier IFAS 1-2 kg/m3 * synthetic media clarifier BioMagTM 5-10 kg/m3 magnetite clarifier MBR 4-10 kg/m3 - membrane Nereda® 4-15 kg/m3 - settling period * additional concentration of attached biomass integrated into existing CAS systems.
Ballasted sludge processes, such as BioMagTM, are like IFAS and MBBR systems since
they utilize a ballast to enhance capacity. Magnetite, a dense ferromagnetic material (i.e., SG =
5.2), is used in the BioMagTM process to promote a good settling biomass, consequently allowing
for higher solids concentrations and smaller reactor sizes [12]. The overall increase in MLSS is
slightly higher for BioMagTM than it is for IFAS due to the smaller volumetric requirements of
magnetite compared to the low-density carrier material employed in IFAS. Furthermore, the
hybrid magnetite-floc particles in BioMagTM move freely throughout the bioreactor and are not
localized to specific reactor compartments like the carrier material applied in IFAS. Thus, the
capacity of the entire microbial community, and not just specific microbial processes such as
nitrification, are enhanced by BioMagTM. However, the dense nature of magnetite also means
that the mixing energy required for BioMagTM is higher than CAS, IFAS, or MBBR systems.
The magnetite is also not fully recovered from WAS, thus replacement costs for virgin magnetite
are incurred during operation.

5
Alternatively, MBRs use enhanced physical separation through membranes to allow for
an increase in MLSS rather than utilizing carrier material for higher concentrations of attached
biomass [13]. The excellent solids separation achieved by MBRs allow for increased capacity
and improved effluent quality within existing footprints, as well as the potential for wastewater
reuse applications [15]. Furthermore, MBRs can have lower capital costs than CAS systems
when permits start to approach the LOT [16]. However, operational, maintenance, and
replacement costs for MBRs are much higher than that of CAS systems, resulting in higher costs
over time [17].
The Nereda® AGS process is a SBR based technology that has the potential to provide
good quality effluent (i.e., TN < 5 mg/L; TP < 0.3 mg/L) within a significantly reduced footprint
compared to CAS systems [18]. Most of the space reduction achieved by the Nereda® process is
the result of energy efficient nutrient removal pathways occurring within a dense granular
biomass [14]. Overall, with a higher capacity due to dense biomass and the lack of secondary
clarifiers, AGS systems like the Nereda® process allow for up to 75% reduction in overall plant
footprint [14]. Although IFAS, BioMagTM, and MBRs provide potential to increase system
capacity in confined spaces, their complexity brings along additional consequences. For
example, compared to CAS systems IFAS, BioMagTM, and MBR systems require more energy
for aeration and BioMagTM can require up to three times more energy for mixing [19]. On the
other hand, the Nereda® AGS technology has shown to achieve 30% savings in electricity for
aeration alone when run in parallel with CAS systems [18]. The SBR operation of Nereda®
simplifies the treatment process and does not require complex mechanical equipment for mixing,
pumping, or solids separation.

6
Case study: AquaNereda® sequencing batch reactor
Research on AGS began at Delft University of Technology in 1993. The technology
matured as an outcome of Dutch concerted research and development [20]. The final product
was Royal HaskoningDHV’s Nereda® process, the first and only commercially available AGS
technology. Installations of Nereda® have demonstrated significant improvements with regard to
process stability, effluent quality (i.e., TN <5 mg/L; TP <0.3 mg/L), and energy savings (i.e.,
30% to 60%) compared to traditional activated sludge processes [18]. Other advantages of the
technology included lower capital and operational expenses, and a small physical footprint [21].
The first full-scale application of Nereda® began in 2005 with a retrofitted milk storage
tank treating 250 m3/d of cheese factory waste in Ede, Netherlands [22]. The technology was
scaled up for municipal wastewater treatment in 2008 with a 5,000 m3/d demonstration facility at
the Gansbaai sewage treatment plant in South Africa [23]. Although only required to attain TN
less than 15 mg/L and TP less than 10 mg/L, the Gansbaai installation reliably achieved effluent
TN of 10 mg/L and TP of 3.2 mg/L [18]. Success at the Ede and Gansbaai facilities proved that
AGS technology was feasible for full-scale applications of both industrial and municipal wastes.
The Gansbaai demonstration in particular allowed applications of Nereda® to expand, starting
with the design and construction of Epe WWTP, Netherlands in 2010-2011 [14].
The Epe WWTP has been operational since September 2011 and consists of inlet works
with screens and grit removal, followed by three Nereda® reactors and effluent polishing via
gravity sand filters [23]. At an average flow of 8,000 m3/d the facility has been able to achieve
effluent TN of 4 mg/L and TP of 0.3 mg/L with only 60% of the original energy requirements
(i.e., 3,500 kWh/d to 2,000-2,500 kWh/d after installation; Niermans et al., 2014).

7
Nereda® installations continue to push their own limits, and the largest operating design
to date was commissioned in 2013 at the 100,000 m3/d Garmerwolde WWTP, Netherlands. The
additional capacity gained from two 9,500 m3 Nereda® reactors is 30,000 m3/day, and the tank
sizes are similar to the world’s largest SBR tanks. The Garmerwolde WWTP has passed the one-
year performance test period to validate that combined effluent meets the target of less than 7
mg/L of TN and less than 1 mg/L of TP. Energy consumption of the Nereda® reactors has shown
to be 50 to 60% more energy efficient than the existing AB-system that was commissioned in
2005 [18]. A retrofit currently underway in Ringsend WWTP, Dublin, Ireland will soon exceed
the capacity of Garmerwolde and become the world’s largest Nereda® installation at 600,000
m3/d. This was no small feat as the Ringsend WWTP already boosts the world’s largest two-
story SBR system.
The Nereda® technology has also shown potential for retrofitting existing continuous
sludge systems after a successful demonstration at the 70,000 m3/d Frielas WWTP in Lisbon,
Portugal [18]. The demonstration SBR was setup in one of the six existing CAS bioreactors and
operated in parallel with the remaining CAS bioreactors [14]. Data from 2012 has indicated a
30% energy savings for aeration alone when compared with the existing system [24]. Combining
this with the energy savings that granules bring by not using settling tanks, sludge recirculation
pumps, and post-filtration units, the overall electricity demand was expected to be 50% of the
existing CAS process [18]. However, the Nereda® technology cannot fully convert plug-flow
based CFR into completely granular sludge-based processes.

8
Emerging energy efficient and sustainable nutrient removal technologies
Several promising technologies are under development for energy efficient and
sustainable nutrient removal from wastewater. These include AGS-CFR, PNA, MBfR, and MEC
based systems – Table 4. The development of an AGS-CFR would generate an option for
municipalities with existing plug-flow, CAS systems to double or triple the hydraulic capacity of
their existing process while also incorporating nutrient removal to <5 mg-TN/L and <0.3 mg-
TP/L.
Anammox based systems, such as PNA, are an attractive option for mainstream nitrogen
removal since they are near carbon independent and require significantly less energy for aeration
[25], [26]. However, there are still significant issues with anammox cultures working effectively
at temperatures below 10 °C, as well as competition for nitrite by NOB. A more mature
technology that is just know gaining attention is MBfRs [27], [28]. Instead of relying on gas
transfer kinetics through the mixed liquor, air or other gases are supplied directly through a
membrane to an attached growth culture. In doing so, the energy losses associated with pumping
air into solution to obtain a DO setpoint are removed. However, there remain problems with
controlling biofilm growth, so much so that 80% of the energy saved from conventional aeration
is put back into biofilm maintenance systems (e.g., scraping).
One of the least studied technologies for nutrient removal is the integration of MECs into
CAS [29], [30]. By using MECs, electrically active biofilms cultivate the electrode material and
exchange electrons directly with the electrical system. It is anticipated that by applying a small,
alternating voltage gradient that the biofilm community could simultaneously oxidize ammonium
and then remove nitrate hydrogenotrophically. However, this technology is the least studied out
of the four presented and the concept has not yet been demonstrated.

9
Table 4 Emerging process options for installing BNR within existing CAS footprints.
Technology Process diagram Description
PF AGS
AGS is cultivated in PL conditions by selective wasting and metabolic management or maximizing anaerobic carbon utilization. Organics, TN, and TP are removed without internal recycle lines required for CAS-BNR.
Anammox
An anammox based system removes TN from wastewater with low carbon to nitrogen ratios. When combined with CEPT, readily bioavailable substrate could be used for denitrification of residual nitrate in a pre-anoxic zone.
MBfR
An MBfR utilizes membrane diffusion to supply air, pure oxygen, or hydrogen gas directly to a biofilm. If air/oxygen and hydrogen gas were supplied to the membranes TN removal would occur in the biofilm while a PAO culture could be developed in suspension.
MEC
Like the MBfR, but in the complete absence of oxygen, a MEC could be used for SND with alternating current. At the anode ammonium would be oxidized while at the cathode hydrogen gas generated by electrolysis would be used for denitrification. PAO could be in suspension.
Characteristics of AGS
Physical characteristics
The compact, tightly aggregated characteristics of AGS are responsible for most of the
benefits AGS processes exhibit over conventional systems. For instance, an AGS-SBR can
obtain comparable treatment to conventional CAS within 70% of the footprint [31]. Furthermore,
a 60% reduction in energy requirements has been demonstrated at a full-scale AGS plant in the
Netherlands. Average diameter of AGS has been reported between 0.2 and 5 mm, although
granules as large as 23 mm have been observed in lab-scale SBRs [32]–[36]. The large size and
high density of AGS allows for excellent settling properties and low SVI from 20-80 mL/g [37].
Values for specific gravity from 1.004 to 1.1 have been reported for AGS, further demonstrating
that granules are denser than flocs, which typically have specific gravities from 1.002 to 1.006
[37]–[39].

10
Like any physical system, in situ settling velocities are affected by temperature, viscosity,
and geometric properties. Large granules (i.e., average diameter = 2.3 ± 0.5 mm) from a lab-
scale reactor had settling velocities of 84 m/h at 5 °C and 145 m/h at 40 °C while small granules
(i.e., average diameter = 1.5 ± 0.3 mm) had settling velocities of 35 m/h at 5 °C and 63 m/h at 40
°C [40]. Specific gravity and settling velocities of aerobic granular sludge are both higher than
conventional activated sludge systems. Granules settle rapidly and as discrete particles, resulting
in a complete overhaul of clarification principles applied to flocculent sludge used in
conventional treatment. Analysis of full-scale granular biomass indicated that PAO had a higher
density than GAO leading to significantly higher settling velocities for PAO dominated granules
[41].
Granules can be highly porous, allowing for sufficient mass transfer through the
microorganism-EPS complex. Because of porosity, concentration gradients form and
stratification of aerobic, anoxic, and anaerobic layers develop throughout granule depth and
cycle time. This in turn leads to microbial diversity across granule depth, and thus stratification
of nutrient removal pathways [42]. Mass transfer in AGS can be disrupted by an overgrowth of
filamentous bacteria on the outer surface layer of granules when readily available substrate is
present under aerobic conditions [43]. Particulate matter can also contribute to granule surface
“fouling” by acting as a constant source of biodegradable substrate to microorganisms in the
surface layer under aerobic conditions [44]. Furthermore, overproduction of EPS in highly
loaded granular sludge reactors can result in reduced pore space and reduced mass transfer
leading to continuous breakage of granules [45]. Any detriment to AGS porosity will directly
affect overall performance since mass transfer to localized areas containing specialized
microorganisms would be compromised.

11
Extracellular polymeric substances
EPS has been recognized as a key element that shapes and provides structural support for
biofilms [46]. It has also been suggested that the EPS can act as a buffer layer for cells against
harsh external environments, and that components of EPS are used as carbon and energy sources
during starvation periods [47]. Gel-forming exopolysaccharides, in particular, were observed as
major structural materials in AGS [48]. Specifically, granulan and alginate-like
exopolysaccharide, both producing gel-like structures, have been proposed as the gel forming
constituents of the granules.
The distribution of EPS (i.e., as proteins, polysaccharides, and lipids) and cells (i.e., both
live and dead) has been studied in AGS [49]. The authors found that in acetate-fed granules
protein and β-D-glucopyranose polysaccharides formed the core whereas the cells and α-D-
glucopyranose polysaccharides accumulated in the granule outer layers. The role of individual
EPS components for structural stability of phenol-fed aerobic granules has also been examined
[50]. Selective enzymatic hydrolysis of proteins, lipids, and α-polysaccharides had a minimal
effect upon the three-dimensional structural integrity of the granules. Conversely, selective
hydrolysis of β-polysaccharides fragmented the granules. The β-polysaccharides were expected
to form the backbone of a network-like outer layer with embedded proteins, lipids, α-
polysaccharides, and cells to support the mechanical stability of granules.

12
Alginate-like exopolysaccharides in AGS were observed to have significantly higher
poly-guluronic acid blocks than mannuronic acid blocks, while alginate-like exopolysaccharides
from flocculent sludge had equal amounts of both chemical blocks [51]. These differences
encouraged a continuous network structure via crosslinks of guluronic acid blocks in AGS.
Consequently, the guluronic acid blocks were demonstrated to promote higher resistance of
aerobic granules, compared to flocculent biomass, to breakage when subjected to deformation.
The broad role of proteins and polysaccharides in maintaining the structural stability of
the aerobic granules has been investigated [52]. Hydrolysis of extracellular proteins in the EPS
matrix of aerobic granules led to collapse of the EPS matrix, and subsequent disintegration of
aerobic granules. These observations suggested that extracellular proteins would be essential for
maintaining structural stability of AGS, more so than polysaccharides. A reduction in the protein
to polysaccharide ratio in the EPS matrix has commonly been considered a sign of weakening
AGS structure [53], [54]. Indeed, because of their simple molecular structure, polysaccharides
are more sensitive to biological and chemical degradation than proteins. Therefore, granules with
low protein to polysaccharide ratios have a matrix consisting of weak structural components.
Different components of EPS were correlated with various granular sludge properties in
an anaerobic sulfidogenic granular sludge reactor [55]. The protein to polysaccharide ratio
correlated positively with the loosely-bound EPS to tightly-bound EPS ratio. As the relative
amount of proteins and loosely-bound EPS increased so did the hydrophobicity. However, the
mean particle size decreased with increases in the relative amount of proteins and
polysaccharides. Thus, an increase in the protein content of AGS particles may lead to enhanced
microbial adhesion and more compact granule particles characterized by a dense EPS structure.

13
The role of individual components of the EPS matrix on AGS stability has still not been
clarified. One of the reasons for this could be the extraction method. For instance, complete and
representative extraction of EPS from AGS could be difficult due to the compact structure of
granules [56]. Several extraction methods have been proposed including high-speed
centrifugation, ultrasound-formamide-NaOH, or thermal, either individually or in combination.
Due to the high variability of extraction methods, it has been suggested that there could also be
great variability for the value of EPS obtained. Therefore, misrepresentation may occur if the
role of EPS is assessed simply by these measured values.
Ion exchange and biologically induced precipitation
Initiating microbial adhesion is a critical step in attaining the compact structure of aerobic
granules. Initiating microbial adhesion can be thermodynamically unfavourable in some cases
since the electric repulsion of negatively charged, natural surfaces such as cells and certain EPS
molecules may be greater than the attractive forces [57]. For this reason, anionic and cationic
compounds must interact with one another to hold microorganisms and other EPS components
together. Divalent cations (e.g., Ca2+, Mg2+) help stabilize the microorganism-EPS complex via
divalent cation binding [51]. On the other hand, monovalent cations (e.g., Na+, K+, NH4+) could
exchange with divalent cations in the granular sludge complex, thereby replacing divalent
cations and destabilizing the microorganism-EPS complex [58]. In general, monovalent to
divalent cation ratios above 2 can lead to poor aggregation properties. However, compared to
CAS and AAO-dominated granules, AGS particles had 4-9 times higher ammonium adsorption
capabilities at an equilibrium ammonium concentration of 30 mg-N/L [59].

14
Other chemical exchange mechanisms, such as the exchange of potassium from
potassium magnesium phosphate (i.e., K-struvite) in the granular sludge complex with
ammonium in bulk solution, have been observed and contributed to the overall removal of
nitrogen and phosphorus [60]. It has been suggested that small increases in the fraction of
precipitates, as low as 1% to 5% of total granule volume, would significantly increase the density
of aerobic granules and thereby their settling velocity [41]. Phosphorus precipitates, such as
biologically induced hydroxyl-apatite (i.e., Ca5(PO4)3(OH)), have been repeatedly detected in the
core of aerobic granules [61], [62]. Other studies have observed elevated levels of other calcium
precipitates, such as aragonite, and thereby suggested that elevated calcium levels in the
wastewater may help induce granulation [63]–[65].
Components of the EPS matrix of aerobic granules have also induced the formation of
struvite, another phosphorus precipitate commonly found in aerobic granules [60]. Alginate-like
exopolysaccharides specifically, which are characteristic of aerobic granules, were found to
induce the formation of potassium/ammonium magnesium phosphates (i.e., struvite). High
concentrations of calcium precipitates specifically have been reported within the cores of
granular sludge. It has been shown that concentrations of iron, magnesium, and aluminium
remained constant in the granules during start-up whereas calcium increased [66], [67]. It was
also observed that granules containing calcium precipitates had stronger structures and larger
diameters, associated with a negative impact on bioactivity based on specific oxygen uptake rates
[66], [68]. Larger granules, specifically greater than 0.45 mm, have also been shown to have
slower denitrification rates than granules between 0.28-0.45 mm [69].

15
Microbial community and nutrient removal capabilities
Arguably, the most interesting aspect of aerobic granular sludge is the layering and
interactions of different microorganisms throughout granule depth. All granules are characterized
by a concentric multi-layered structure, which must contain channels and pores for the transport
of oxygen and substrates [70]. With proper mass transfer conditions in place, aerobic, anoxic,
and anaerobic zones characterized by a DO gradient across granule depth [71], [72]. This
differentiation allows for simultaneous carbon, nitrogen, and phosphorus removal by a suite of
microorganisms in one granule [73].
Typically, granules consist of an outer, 0.1-0.2 mm aerobic layer overtop
anoxic/anaerobic layers. Aerobic microorganisms such as heterotrophs, AOB, NOB, PAO, and
GAO grow in the outer layer while deeper layers contain facultative denitrifiers, denitrifying
DPAO, and DGAO [50], [74]–[76]. Various other specialty microbes such as AAO, DAMOA,
DAMOB, and methanogens have been observed within AGS [72], [77]. Nitrite/nitrate generated
by AOB and NOB penetrates the anoxic layer, which acts as a nitrite/nitrate sink. The oxidized
inorganic nitrogen is removed by conversion to nitrogen gas through denitrification, thereby
creating a nutrient gradient where nitrite/nitrate travels from the aerobic to the anoxic layer.
Denitrification and phosphorus removal pathways can be coupled through DPAO. It was
observed that DGAO were the main microorganisms responsible for nitrate reduction in AGS
reactors operated at 20°C and 30 °C [72]. It was also observed that a significant fraction of the
nitrite was reduced to nitrogen gas via DPAO, specifically Clade II Candidatus accumulibacter
phosphatis.

16
If AAO develop within the anoxic layer, nitrite can also be utilized to oxidize residual
ammonium to nitrogen gas with approximately 10% residual nitrate [25]. The nitrate produced
by AAO can be utilized by any of the facultative microorganisms to oxidize organic matter to
carbon dioxide. Encouraging establishment of AAO within aerobic granules has been
characterized by higher ammonium effluent concentrations (e.g., >1 mg/L) and low (e.g., 0.5 g-
COD/g-N) carbon to nitrogen ratios [77], [78]. Furthermore, the ratio of NOB to AOB in AGS
systems has been observed to be higher than in CAS systems, which does not benefit AAO
establishment since they compete directly with NOB for nitrite [79]. These results demonstrated
that there is complex nutrient cycling within AGS particles, where some NOB are either growing
mixotrophically using organics for nitrate reduction or denitrifiers are reducing nitrate to nitrite
within AGS particles and thereby supplying additional nitrite for NOB without the additional
ammonium for AOB.
The diverse microbial community of aerobic granular sludge, coupled with its ability to
generate nutrient gradients, allows it to perform complete nutrient removal in a single tank
simply by switching airflow on or off. Completely aerobic granular sludge processes, those that
do not implement an anaerobic influent distribution phase, have demonstrated excellent organic
carbon and nitrogen removal capabilities. Processes that do have an anaerobic contact phase,
however, have also exhibited EBPR. Thus, AGS becomes an ideal process for removal of
carbon, nitrogen, and phosphorus from wastewaters. Furthermore, the slow growth of
microorganisms in stable granular sludge systems as well as the constant recycling of organic
and inorganic compounds for oxidation and reduction processes throughout the granule
contribute to lower sludge yield and reduced dependency on external carbon and/or metal salt
addition to meet stringent nutrient limits compared to conventional activated sludge systems.

17
Dead cells and precipitates can also exist under anaerobic conditions near the core of
aerobic granules [80]. Being an active microbial community, AGS is constantly growing and
therefore increasing in diameter, unless mechanically broken apart first. As granular sludge
diameter increases the extent to which oxygen, nitrite, and nitrate penetrate decreases, resulting
in the development of anaerobic conditions in the interior of granular sludge particles [72].
Depending on the sludge age of the anaerobic core, it is possible that microorganisms capable of
degrading EPS in the granular sludge matrix become established. It has yet to be demonstrated
whether this is a common mechanism for self-maintenance of individual granular sludge
particles or a mechanism that induces instability, ultimately leading to the breakdown of larger
granular sludge particles.
Since the aerobic layer does not usually exceed more than 0.2 mm, the diversity of the
microbial community should increase as average granule diameter surpasses 0.4 mm.
Furthermore, as bulk DO concentrations decrease, the aerobic layer is expected to decrease in
size, thereby leading to more diverse microbial communities in smaller granules (i.e., <0.4 mm).
Microbial diversity as well as community structure would directly influence the performance of
aerobic granules. For instance, analysis of full-scale granular biomass indicated that PAO had a
higher density than GAO, leading to significantly higher settling velocities for PAO dominated
granules [41]. Thus, out-selection of GAO could improve AGS performance. Furthermore, the
kinetic rates and stoichiometry of individual metabolic pathways would govern granule stability.

18
The higher the microbial community yield, the more quickly the control volume (i.e., the
granule volume) would be “replaced” by new biomass. Higher microbial community yields
would therefore make granules more susceptible to mass transfer limitations due to excessive
growth of microorganisms and their byproducts, such as EPS [11], [43]. Thus, continuously
aerated AGS systems at high DO would be less stable than AGS systems with anaerobic influent
distribution operated at low DO. The elimination of aerobic/anoxic substrate utilization by
heterotrophic microorganisms would be desired, while anoxic utilization of substrate by PAO
and GAO would be preferred.
It was demonstrated, on a molecular level, that AGS communities are much more
efficient than flocculent communities at utilizing nutrients [81]. Based on the number of
significantly enriched proteins assigned to Clusters of Orthologous Groups, it was shown that the
AGS metagenome had significantly higher transport and metabolism related proteins (i.e., for
carbohydrates, amino-acids, coenzymes, lipids, and inorganic ions) while flocculent
communities had more proteins related to translation, ribosomal structure, biogenesis, energy
production, and conversion. In general, this means that the flocculent community was actively
growing without expending too much energy on substrate utilization while the AGS community
had to invest energy into adenosine triphosphate consuming transport mechanisms for substrates
with low energy return [82].

19
Surface layer of granular sludge
Contrary to common depictions, AGS is not always made up of uniform spherical
particles with smooth surfaces. The structure of granular sludge, including the microorganisms in
the outer surface layer, is dependent on both wastewater characteristics and operational
strategies. For instance, uneven granule surfaces can develop when AGS is used to treat
wastewater with high slowly-biodegradable, particulate organic loads [44]. This is because
slowly-biodegradable particulates sorb to the surface of granules and gradually release
bioavailable organic matter via hydrolysis. The hydrolyzed organic matter is then used within the
vicinity of the original particulate organic matter that had sorbed to the granule, resulting in a
microcosm of heterotrophic activity. At steady-state an equilibrium would be obtained between
new slowly-biodegradable, particulate matter attaching to the surface of granular sludge and
older particulate matter being utilized by the aerobic heterotrophs surrounding it.
When the load of slowly-biodegradable, particulate matter is low, there would be no
significant effect on granule surface structure and the outer layer may appear smooth and
compact, if other operating parameters are within bounds. As the quantity of slowly-
biodegradable, particulate matter increases, however, the rate of degradation by aerobic
heterotrophs will be lower than the rate of attachment, resulting in the retention of particulate
organic matter to the outer surface and the appearance of an uneven granular structure [83]. The
excessive substrate sorbed to granule surfaces may also encourage the development of
filamentous microorganisms feeding off the aerobically hydrolyzed substrate. Furthermore, the
presence of septic wastewater could also encourage the growth of filamentous microorganisms
on granule surfaces [43], [84]. The presence of filamentous microorganisms would increase the
drag force of AGS and decrease settling velocity of granules, resulting in poor-quality effluent.

20
Factors affecting granule formation and stability
Alternating “feast” and “famine” conditions
Biomass with high internal substrate storage response, such as PAO and GAO, are
thought to benefit from alternating conditions of excess substrate (i.e., feast phase) and lack of
substrate (i.e., famine phase) – Figure 1. It has been suggested that this is because rapidly
growing heterotrophic microorganisms experience higher decay under extended aerobic
conditions, or the famine phase. Thus, growth of microorganisms capable of PHA storage during
the feast phase would be favoured, especially since PHA storing microorganisms usually have
lower decay rates. It is unlikely that PHA storing microorganisms would be selected for in a
continuously aerated AGS-SBR.
Figure 1 Depiction of feast and famine phases by OUR profiles in a continuously aerated CAS-SBR (left) and continuously aerated AGS-SBR (right) with and without extended feast conditions due to high pCOD in the influent. The endogenous respiration phase in OUR profiles can be used to monitor the development and duration of the famine phase.

21
Simulations using BioWinTM software of a completely aerobic plug-flow system (i.e.,
five equally sized bioreactors in series) demonstrated that the ratio of PAO to OHO would be
<<1% – Figure 2 [86]. Rather, selection of PHA storing microorganisms would depend on
maximizing the availability of VFA to PAO and GAO under anaerobic conditions. It should be
noted that wastewaters deficient in nitrogen, phosphorus, or other elements for cellular growth
could also encourage PHA storage [85]. In municipal wastewater, there is typically not enough
bCOD to fully remove TN or TP. If the ratio of bCOD to TN to TP is above 100:5:1 there should
be no nitrogen or phosphorus deficiency. However, if AGS was applied to wastewaters with
excess COD and low TN and TP, such as brewery wastewaters, PHA may be encouraged under
completely aerobic conditions [11].
Figure 2 Estimated PAO to OHO ratio for a modelled biological treatment facility with increasing SRT and various configurations at a 12 h HRT. All models had typical primary influent characteristics of 500 mg-COD/L, 40 mg-TN/L, and 10 mg-TP/L as input. Fermentation was modelled at a 3 d SRT receiving primary sludge from a clarifier removing 70% of influent TSS.

22
The development of a famine phase depends on wastewater characteristics and OLR [87].
For instance, the presence of slowly-biodegradable, particulate matter may extend the duration of
the feast phase by supplying a constant source of readily biodegradable organics. Furthermore,
treatment plants that are nearing design capacity may also lack the required quantity of biomass
and contact time required to rapidly reduce the concentration of bioavailable substrate, leading to
shorter starvation periods and potentially higher process instability. An imbalance in the feast
and famine duration, with prolonged feast phase at the expense of a short famine phase, led to
granule disintegration in an AGS-SBR with anaerobic influent distribution [88]. To maintain
stable AGS, it was suggested that the feast period should not exceed 25% of cycle length.
Hydrodynamic shear forces
Hydrodynamic shear forces may be defined as forces generated due to the friction
between the bulk liquid and granules surface. The hydrodynamic shear force has typically been
quantified by USAV in lab-scale systems. This parameter is calculated as the airflow divided by
the cross sectional area of the aerated zone [43]. The exact value for USAV varies in the
literature. For instance, some did not observe granulation when USAV were less than 1.2 cm/s
[89]. Others found that unstable granules developed when USAV was less than 2.4 cm/s [90]. It
has also been observed that AGS was not stable at USAV below 1 cm/s [91]. The authors stated
that low aeration rates resulted in oxygen limitation during aeration, thereby increasing the
duration of the feast period and shortening the famine period. However, most of the studies
linking hydrodynamic shear force to granulation potential were completed in continuously
aerated AGS systems.

23
More recently, it was demonstrated that high hydrodynamic shear forces are not always a
necessity for granulation, although they may benefit AGS stability in some cases [43].
Specifically, high shear may remove fast growing heterotrophic microorganisms, while also
preventing the accumulation of particulates originating from the influent or of microbial origin,
on granule surfaces. At higher OLR the potential for fast-growing, heterotrophic microorganisms
to grow in bulk solution or on the surface of granules is higher. Thus, at higher OLR, higher
hydrodynamic shear forces would displace detrimental matter from granule surfaces and prevent
the formation of a loose outer structure that could lead to poor settling properties and therefore
AGS instability. At lower OLR, successful granulation has been observed at USAV below 0.5
cm/s [43].
Influent distribution
In general, AGS-SBR systems may be categorized into one of two types of influent
distribution: 1) continuously-aerated; and 2) anaerobic influent distribution. The method of
influent distribution would influence the morphology and microbial community of aerobic
granules. It was observed that a long feeding time, up to 50 min, through a settled bed of
granules was favourable over a short feeding time during mixing [92]. The two most important
reasons were that the application of a long, influent distribution period at large-scale treatment
plants simplified SBR scheduling, while also selecting for PAO and GAO due to the alternating
aerobic and anaerobic phases. Granulation from CAS inoculum was successful under a 20 min
anaerobic-40 min aerobic split feed strategy, although the granules exhibited poor phosphorus
removal [93]. It is generally agreed that the basic principle of stable granulation is the selection
of slower growing bacteria, and distributing substrates throughout the granule during anaerobic
influent distribution encourages the selection of slow-growing microorganisms [94].

24
In the case of wastewater rich in easily biodegradable soluble substrates, when influent
was distributed anaerobically with a plug-flow regime, the substrates are taken up by PAO or
GAO and converted to internal storage polymers, such as PHA, that are used for growth at a
relatively slow rate in subsequent aerobic/anoxic phases [92]. At the beginning of the cycle, PAO
and GAO near the granule surface take up easily biodegradable substrates. As anaerobic feeding
continues, the PAO and GAO near the surface become saturated with internally stored polymer
and the easily biodegradable substrates penetrate further into the granule. Thus, substrate reaches
PAO and GAO deeper within the granule. This leads to uniform biomass production throughout
the granule, thereby stabilizing the granule structure. Since oxygen will not penetrate into the
deeper regions of granules, even during vigorous aeration, storage polymers can be oxidized by
other electron acceptors such as nitrate, ensuring optimal phosphate and nitrogen removal [95].
Conversely, an aerated influent distribution strategy could lead to diffusion limitations,
commonly characterized by a surface layer of filamentous microorganisms. During the feast
phase, when bulk liquid substrate concentration is high, the substrate would be rapidly utilized
for growth limited to the outer aerobic layer of the granule [96]. Furthermore, the rapid, aerobic
consumption of septic substrates in the presence of oxygen is well known to encourage the
formation of filamentous microorganisms, which could foul the surface of granules [84].
Filamentous growth will have detrimental effects on the settling properties of AGS, and thus
negatively impact effluent quality [94], [97]. In these cases, increased hydrodynamic shear may
be required to ensure smooth and stable granulation. Significant surface fouling, due to the
proliferation of filamentous microorganisms, was observed when organic loads exceeded the
capacity for anaerobic uptake, even with pure acetate as substrate [43]. Overall, granules formed
under an aerobic influent distribution are more prone to degranulation [96].

25
Particulate substrates, often present in high quantities in industrial wastewaters, also
impact AGS formation and stability. Once granules have developed, particulate substrates can be
hydrolysed at the granule surface [83]. The porous structure of granular sludge acts as a filter,
retaining particles larger than the pore at the granule surface. Hydrolysis products created during
anaerobic influent distribution will be converted into storage polymers, thereby selecting for
PAO and GAO. However, depending on the anaerobic hydrolysis rate as well as the quantity of
particulate matter, aerobic hydrolysis will also occur. Aerobic hydrolysis will supply a steady
source of biodegradable matter and extend the duration of the feast phase. Aerobic hydrolysis
product will then be used for growth by heterotrophic organisms at the surface of granules,
causing limitations in substrate diffusion [98]. Limitations in substrate diffusion could induce
filamentous outgrowth, result in less stable AGS, or produce higher suspended solids in the
effluent. In this respect, it was noted that extended famine regimes, by decreasing OLR, could
enhance AGS stability [45], [88].
Lastly, if easily biodegradable substrates are slowly supplied to a mixed aerobic
environment, severe limitations in substrate diffusion may develop and filamentous
microorganisms could develop. That is because high, biodegradable substrate availability in bulk
solution during aeration is favourable for the growth of fast-growing, heterotrophic
microorganisms. Filamentous growth will have a detrimental impact on the settling properties of
AGS, and thus negatively impact effluent quality [94], [97]. Thus, maximizing anaerobic
utilization of biodegradable substrate prevents the proliferation of fast-growing, aerobic
heterotrophs and encourages uniform granules with smooth and compact surfaces.

26
Selective wasting
In most AGS studies the selection pressure was related to the settling time. Several
studies have demonstrated that shorter settling times enhance aerobic granulation [99], [100]. A
higher initial washout of biomass induces the production of excess EPS, secreted by functional
strains, without a strong challenge for substrate by competing strains that have been washed out.
However, some studies have suggested that very short settling times lead to premature washout
of certain non-flocculated strains, thereby yielding low biodiversity of granules [101]. It was also
observed that too rapid a decrease in settling time leads to washout of desired bacterial guilds
such as PAO, AOB, and NOB [102]. It has been suggested, as an option to avoid excessive
biomass loss during start-up, that the settling time be linked directly to the observed washout, as
well as to recirculate sludge from a secondary clarifier in case of a massive washout [103].
Although short settling times cause the washout of poorly-settling, free-living
microorganisms while retaining fast settling particles, short settling times discharge the
selectively wasted light fraction of biomass with the effluent [104]. This can result in high
effluent solids concentrations, more than discharge limits. A better method of granulation would
be to employ a discrete selective wasting regime apart from effluent discharge [105]–[107]. For
instance, it was demonstrated via FISH that more dense granules located at the bottom of the
settled sludge bed contained considerably more PAO compared to the lighter granules on top
which were dominated by GAO [107]. By selectively wasting biomass exclusively from the top
of the settled sludge bed TP removal efficiency increased from 71% to near 100%. By separating
selective wasting from the effluent discharge, treated wastewater solids can be less than 5 mg/L
and higher removal efficiencies can be obtained [18].

27
Organic loading rate
OLR is defined as the ratio between organic substrate load, calculated as the product of
flow and substrate concentration, and volume of the reactor receiving the substrate. The F/M
takes the volumetric representation of OLR and converts it to the ratio of organic substrate load
and “active” biomass, usually as MLVSS. In continuously aerated AGS systems, where the
entire cycle, including the influent distribution, is under aerated conditions, OLR and F/M
seemed to be important for aerobic granulation. In one instance it was determined that the
optimum OLR for granule formation was around 2.5 kg-COD/(m3•d) [108]. In another case, the
formation of AGS in SBRs supplied glucose-based substrate determined that higher F/M, up to
1.1 kg-COD/(kg-VSS•d), promoted faster formation of granules with larger average diameter
[109]. Similarly, another study analyzed the granulation process at OLRs between 1.5-4.5 kg-
COD/(m3•d) [110]. It was observed that higher OLR resulted in faster formation of larger and
looser granules, while a lower loading rate resulted in slower formation of smaller and more
dense granules. It was even observed that granulation could not be achieved at an OLR lower
than 2 kg-COD/(m3•d) for continuously-aerated SBRs [89]. In contrast, another study
successfully cultivated granules at an OLR of 1-1.7 kg-COD/(m3•d) in a continuously-aerated
SBR, however almost one year was needed to obtain mature granules [111].
The role of OLR and F/M appeared to be reduced with the introduction of an anaerobic
influent distribution phase. With anaerobic influent distribution, it was demonstrated that stable
AGS has been generated at lower OLR than continuously-aerated SBRs. Full-scale Nereda®
reactors operate with OLR ranging from 0.65-0.85 kg-COD/(m3•d) [31]. Similarly, stable AGS
was cultivated on proteinaceous substrate within a month at an OLR of 1.4 kg-COD/(m3•d) [43].
Stable AGS was also cultivated within three weeks at an OLR of 1.4 kg-COD/m3ꞏd while

28
treating brewery wastewater [88]. Based on the reported studies, it can be concluded that OLR
and F/M are not crucial parameters for aerobic granulation. However, the impact of high OLRs
and F/M is more significant in continuously-aerated AGS systems. These results clearly indicate
that there are more important factors influencing aerobic granulation than the OLR.
Other environmental factors
The main environmental factors affecting biological processes, including AGS, are DO,
ORP, pH, and temperature. So far, the literature has suggested that DO was not a dominating
factor for granulation despite a single claim that DO, instead of hydrodynamic shear stress,
governed the granulation process [112]. Instead, DO was suggested to have an impact on the
layering and stratification of microbial communities. Since an oxygen gradient develops across
the depth of granular sludge particles, anaerobic, anoxic, as well as aerobic layers could coexist
within a single granule at any given time.
Stratification clearly impacts nutrient removal processes due to the simultaneous presence
of varying ORP conditions and therefore the capacity for SND. The aerobic layer of granules
was demonstrated to be strictly related to bulk DO concentrations. It was demonstrated, for
granules of equal diameter, that oxygen penetrated further into the granule when bulk DO
concentrations were higher. Thus, if DO in the bulk liquid was too high the development of
anoxic or anaerobic layers could be inhibited, especially for smaller granules. Similarly, it was
observed that reduction of DO to 40% saturation during the aeration phase significantly
improved TN removal efficiency [95].

29
Some authors found that acidic and neutral solutions in AGS reactors had a significant
impact on granulation [113]. Concerning pH, it was observed that fungi dominated aerobic
granules at a pH of 4, and that the granules were as large as 7 mm. Fungi resulted in faster
granulation by providing a filamentous matrix for the microbial community to grow upon.
However, if the fungal growth was not controlled, their irregular patterns could lead to system
instability. At pH higher than 8, granules were dominated by bacteria and granule size only
reached 4.8 mm. Neutral medium and bacterial dominance resulted in granules that had a more
compact structure. Other studies have observed that alkaline pH induced granule disintegration
and resulted in increased effluent solids, as well as a significant decrease in the size of AGS
[114]. The same study suggested that acidic pH did not have a significant impact on AGS
stability. Changes in chemical structure and composition of the EPS matrix were suggested as
the main factors inducing granule instability under high pH.
Temperature, in addition to affecting bacterial growth kinetics, also influences the
settling velocity because of changes in the viscosity of bulk solution. It was observed that, in an
SBR operated at 8 °C, granules with irregular shape and excessive filamentous bacteria
developed which caused unstable operation by severe biomass washout [87]. The authors
concluded that aerobic granulation at low temperatures was not practically feasible. In general,
microbial processes are slower at lower temperatures, and the slower rates could have limited
granulation at lower temperature [115]. Another study demonstrated that granule settling
velocities are also significantly reduced at lower temperatures [40]. On the other hand, operating
at high temperature (e.g., >30 °C) could also inhibit granulation by preventing agglomeration of
EPS and increasing the solubility of chemical species (e.g., iron, magnesium, phosphorus) that
have been detected in the core of AGS [116].

30
Design considerations and control strategies
Aerobic granulation can occur in a wide range of scenarios with different operating
parameters. However, certain variables do seem to be more significant for aerobic granulation
and long-term granule stability. Based on the literature, several operating parameters were
compiled according to their importance for granulation – Table 5. Among these, anaerobic
influent distribution was almost unanimously considered essential for the formation of stable
AGS [92], [94]. Duration of the anaerobic influent distribution phase will depend on the OLR
and wastewater characteristics. Anaerobic influent distribution should be designed to maximize
the conversion of organic matter in the influent to intracellular polymeric substances, such as
PHA. Fifty minutes to one hour is typically enough for the anaerobic influent distribution phase
when treating municipal wastewater.
Table 5 Summary of the main operating conditions affecting aerobic granulation.
Operating parameter and other factors
Impact on the process
Comments
Anaerobic influent distribution
Improves AGS stability and allows for nutrient removal.
Selective wasting Retains AGS, washes-out undesirable biomass.
Famine conditions Allows for EPS modification, washes-out biomass with high decay rates.
Feast conditions Diverts carbon from growth to EPS production. Hydraulic shear forces Stabilizes AGS at high OLR.
SRT Prevents excessive aging of granules, stabilizes AGS at high OLR.
DO Not too low to prevent the core weakening, not too high to favour a proper layered structure.
Organic loading rate Higher OLRs can accelerate start-up. pH Alkaline pH shock may destabilize AGS. Temperature Low temperature delays the granulation process. Substrate composition AGS developed with several organic substrates.
Legend: = Fundamental; = very important; = important; = not crucial; = not relevant.

31
It was observed that high OLR encouraged proliferation of filamentous microorganisms,
initially favouring a rapid increase in the size of the granules due to the ability to use filaments as
structural components [50], [117]. The filamentous microorganisms, however, also resulted in
granules with loose structures and therefore lower settling velocities. In this respect, it was
suggested that the selection of slow-growing organisms (e.g., PAO and GAO) could enhance
granule stability [92]. The same authors suggested that a long feeding time through a settled
sludge bed appeared feasible and was favourable over a short feeding time.
It has been hypothesized that a certain “critical” granule size will be achieved at steady-
state under certain operational conditions [118]. Due to the consequences of particle collision
and structural weaknesses, granules larger than the critical size are expected to break apart until
reduced to less than or equal to the critical size. Conversely, the growth of small granules in
steady-state AGS reactors equals the rate at which large granules are being reduced by breakage
or attrition. This cycle of granulation and degranulation becomes a dynamic process that is
constantly evolving. Similarly, it was demonstrated that a SRT of granular sludge longer than 14
days leads to granule deterioration [119]. To mitigate the disintegration of older granules, it was
suggested that selective discharge of old, and therefore large, granules from the bottom of the
reactors (e.g., wasting 5% of the settled bed daily) be performed [120].
The reason for larger granules weakening is partly due to mass transfer limitations
leading to a weakened inner core of the granule. It had been suggested that mass transfer
limitations of large granules could produce an anaerobic core and thereby stimulate the activities
of anaerobic strains, hence breaking apart large granules [121]. One study claimed that the
breaking of mature granules was due to the clogging of pores and channels in the granules, hence
hindering nutrient intake by the microorganisms [122]. In this context, it has been demonstrated

32
that excessive EPS production contributed to the clogging of pore space in the granules, causing
their breakage in the long run [45]. An extended famine period encouraged greater EPS
consumption by bacteria, thus limiting the clogging of pores, and allowed for the long-term
operation of stable aerobic granules. It has also been noted that granule disintegration at very
high OLR (i.e., >21.3 kg-COD/(m3•d)) is the result of microorganisms losing their capacity to
produce proteins or polysaccharides at the applied OLR [117].
Particulate organic matter and other slowly-biodegradable organic substrates can offset
the benefits of anaerobic influent distribution. Due to slow anaerobic hydrolysis rates, slowly-
biodegradable substrates may not be fully converted to PHA during anaerobic influent
distribution. Therefore, the slowly-biodegradable substrates would contribute to a continuous
supply of bioavailable substrate via aerobic hydrolysis during aeration [83]. The growth of
aerobic heterotrophs would thereby be promoted in a confined location since particulate and
colloidal substrates would be concentrated in the bulk solution or near the granule surface.
Overgrowth at the granule surface could lead to mass transfer limitations and the loss of nutrient
removal [43].
Two approaches have been suggested to prevent the proliferation of microorganisms on
the surface of granules that feed off aerobically hydrolyzed substrate. The first approach is to
apply an extended famine phase by increasing the duration of the aerobic period. The feast
phase, the period of time in which hydrolysis is occurring and substrate is available near the
granule surface, should not be more than 20% of the aerobic period [88], [123]. The second
approach would be to increase the applied hydrodynamic shear force in order to detach
filamentous overgrowth at the granule surface [43]. From a design point of view, the first

33
approach implies an increase in capital cost due to larger reactor volumes while the second
implies an increase in operating costs for electricity to power blowers or mixers.
The last crucial parameter for aerobic granulation is selective wasting. It is considered a
fundamental parameter because it allows for the out-selection of slowly settling flocculent
biomass and the retention of rapidly settling AGS. Typically, a critical settling velocity is applied
such that only particles with higher settling velocities will be retained within the reactor. The
settling velocity applied for selective wasting can be as high as 8 cm/min whereas conventional
clarification following BNR activated sludge are designed with settling velocities of 1.7-2.2
cm/min [10].
Application of AGS to municipal wastewater
Municipal wastewater characteristics
Municipal wastewater is made up of both soluble and particulate, organic and inorganic
matter. Proteins, carbohydrates, lipids, and fibers contribute to the particulate organic fraction,
while readily available soluble organic matter is comprised of VFA, alcohols, and other simple
carbohydrates [10]. Depending on the configuration of sewer systems municipal wastewater can
contain low or high quantities of bioavailable substrates. Larger sewersheds located on relatively
flat terrain in warmer climates will generally yield septic wastewater with lower biodegradable
fractions, having already been utilized within the sewer system [5]. On the other hand,
municipalities in mountainous regions with steep terrain and lower temperatures will provide
treatment facilities with fresh, unaltered wastewater.

34
The fraction of soluble biodegradable substrate in the wastewater is particularly
important for AGS processes. The higher the fraction of soluble biodegradable substrate, the
more likely the AGS process is to be stable. This is because fresh wastewater can be introduced
into an anaerobic contact phase where readily bioavailable substrate is taken up and converted to
internal storage product by accumulating bacteria. Thus, there will be less residual organic
matter in bulk solution passing through to aerobic conditions if more of the substrate is soluble
biodegradable. By diverting a majority of the initial organic matter to internal storage products, it
is less likely that a fast-growing, aerobic heterotrophic culture will develop on granule surfaces,
resulting in mass transfer limitations and process instability [43], [92].
Furthermore, municipal wastewater can be classified as low-, medium-, or high-strength
depending on how water conservative municipalities are, as well as how much inflow and
infiltration is experienced. Municipalities that use less water and have separate sewers tend to
have stronger wastewater that contains higher concentrations of organic and inorganic matter. It
has been speculated that AGS, which derives benefits from the development of nutrient gradients
across granule depth, performs better on high-strength wastewaters than low-strength, diluted
wastewaters [120]. Higher concentrations facilitate diffusion and therefore promote more rapid
uptake and utilization of nutrients by aerobic granular sludge

35
Optional and required pre-treatment of municipal wastewaters
The extent of municipal wastewater pre-treatment is still largely debated in literature and
practice. Personal communication with leading environmental consultants has yielded
contradictory responses. Some swear by removing as much solid content as possible up front
through primary treatment while others have argued that AGS only works on primary influent.
These claims are based on individual experiences with demonstration facilities likely confounded
by site-specific variables that have not been accounted for in design and operation of the
demonstration facilities. Full-scale Nereda® installations have worked successfully for many
years on primary influent, demonstrating that the AGS-SBR process is a robust technology
capable of handling the additional particulate loads and variability associated with primary
influent [14], [31].
It is expected that the only necessary pre-treatment before any AGS process would be
screening and grit removal. Due to the nature of AGS processes, which select dense particles, the
breakthrough of grit from pre-treatment could result in significant accumulation of undesirable
inert material. Thus, it is very important that good grit removal with enough redundancy be
designed for AGS processes. Optional pre-treatment for AGS processes includes the removal of
particulate organics from the wastewater. A summary of the pre-treatment options and their
applications is provided in Table 6.
.

36
Table 6 Summary of AGS-SBR pre-treatment configurations based on municipal wastewater characteristics.
Pre-treatment Process diagram Comments
Screening + Grit removal
For municipal wastewater with TSS and VSS capable of adsorption and degradation by AGS without disrupting process stability.
Screening + Grit removal + Sedimentation
For municipal wastewater with TSS and VSS exceeding the capacity of AGS, having adequate residual COD to TN ratio for nutrient removal.
Screening + Grit removal + Sedimentation + Fermentation
For municipal wastewater with TSS and VSS exceeding the capacity of AGS, as well as COD deficiency for nutrient removal.
The removal of additional influent solids, besides grit, before aerobic granular sludge
reactors has many plausible arguments both for and against it. Reasons for good solids removal
up front include the separation of slowly-biodegradable matter, which can lead to uneven surface
structure, and the removal of dense, inert particles that could accumulate in granular sludge
reactors. Diversion of settleable organics away from mainstream processes has been practiced for
increased mainstream capacity and beneficial reuse in the side-stream [5]. On the other hand, it
has been argued that higher wastewater solids content can help initiate, or is even necessary for,
granulation. High density, unbiodegradable inert particles found in primary influent, which
mostly settle out during primary treatment (i.e., 50-70% removal), may contribute to more
rapidly settling granular sludge particles if the inert particles become associated with the granular
sludge matrix.

37
It has also been suggested that allowing more slowly biodegradable particulate organic
matter through to the granular sludge process can alleviate problems associated with low-
strength wastewaters. Nevertheless, with properly designed cycles that account for the peak
organic load in the design year, AGS-SBRs can adequately treat primary influent with particulate
organic substrates to exceptional effluent quality [45], [124]. Thus, the application of properly
balanced feast and famine phases allows for additional organics in the primary influent to be
beneficially used for nutrient removal without the particulate load negatively influencing the
AGS process.
Generally, particulate substrates are hydrolysed at the surface of granules during steady
state in properly designed AGS-SBRs. Municipal wastewater with abnormally high particulate
substrate can negatively impact AGS stability [83]. The porous structure of granular sludge acts
as a filter, retaining particles larger than the pore size at the granule surface. Hydrolysis products
during anaerobic influent distribution would be converted into storage polymers, thereby
selecting for PAO and GAO. However, depending on anaerobic hydrolysis rates as well as the
quantity of particulate matter, aerobic hydrolysis will also occur. Aerobic hydrolysis would
supply a steady stream of biodegradable matter that would be used by heterotrophic organisms at
the surface of granules [43], [98]. This has induced filamentous outgrowth, resulted in less stable
granules, and generated higher suspended solids in the liquid phase. If wastewater
characterization determined that influent wastewater was high in particulate matter, primary
treatment should be considered.

38
Primary treatment could include sedimentation, micro-screening, or CEPT. The removal
of organic matter may result in low carbon to nitrogen ratios, and therefore poor nutrient removal
even with SND. If the wastewater was determined to be high in particulate matter, as well as
carbon deficient after primary treatment, fermentation of primary solids could be used to increase
the amount of readily available substrate sent to the AGS process [125]. Fermentation products,
such as acetate and propionate, are easily utilized by AGS and contribute to their stability [126],
[127].
Operational considerations for municipal wastewater treatment
An efficient, stable AGS-SBR process treating municipal wastewater must consider a few
design factors. The following discussion will include operational considerations for municipal
wastewater treatment with AGS as it pertains to: 1) cycle configuration; 2) OLR; 3) selective
wasting; and 4) anaerobic influent distribution. Cycle timing must be designed to provide
adequate oxidation of soluble and particulate organic compounds within diurnal flow and load
variation. If higher loads of organics exceed the anaerobic uptake capacity of biomass during a
single cycle, the residual organics in bulk solution would pass on to the aerated react phase
and/or subsequent cycles. Under these conditions residual organics could promote the growth of
fast-growing, aerobic heterotrophs, ultimately destabilizing the process if they are allowed to
proliferate further [94]. Thus, AGS cycles should be designed with flexibility in order to address
variable influent loads.

39
Depending on the degree of flow, load, and temperature variation observed, different
design considerations can be made. These could include equalization and flow balancing, DO
control strategies to ensure adequate “famine” conditions develop at higher observed loads,
multiple draw points for selective wasting by a pump with variable frequency drive (i.e., remove
more or less biomass considered to be part of the light fraction and therefore not desirable), and
swing-capabilities allowing portions of the anaerobic influent distribution phase to be aerated
[93], [124].
The literature varies in terms of recommended OLRs. For instance, the reported range on
municipal wastewater has been from 0.6-1.4 kg-COD/(m3•d) [31], [43]. Most of the reported
data from full-scale Nereda® facilities may not represent the design OLR, since most of their
installations are relatively recent (i.e., first installation in 2012). Rather than a set OLR, AGS
processes for municipal wastewater treatment should be designed and operated based on F/M.
The flow and load of wastewater will continue to increase for municipalities experiencing
population growth. Thus, the OLR will always be increasing. For this reason, operators of AGS
facilities must understand the optimal biomass concentrations, relative to the incoming load, that
will provide adequate nutrient removal and energy efficiency. In general, F/M ratios from 0.3-1.1
kg-COD/(kg-VSS•d) have been adequate for AGS operation [109]. However, operating above 1
kg-COD/(kg-VSS•d) may not be suitable as the risk for hydrous bulking increases.

40
Another important consideration includes selective wasting and the decoupling of
granular solids retention time from free-living microorganisms. Ideally, the SRT of free-living
microorganisms would be designed to be less than their minimum SRT. By doing so, the
proliferation of fast-growing heterotrophs would ideally never occur. Given the inherent
variability and characteristics of municipal wastewater, some substrate will always be available
under aerobic conditions, thereby promoting the growth of free-living microorganisms and the
development of a persistent light fraction of biomass. For this reason, selective wasting is
important in order to manage, rather than completely out-select, the light fraction of biomass
[128]. Designers and operators should consider that the more aggressive the selective wasting
strategy (i.e., lower applied SRT), the higher the yield of the light fraction of biomass. Thus,
selective wasting should be optimized to aid in the diversion of substrate to anaerobic utilization
by microorganisms within AGS particles. The only way to decrease the yield of biomass, and
therefore improve the performance of AGS, is to divert substrate away from direct aerobic
utilization and towards anaerobic uptake [43], [94].
To effectively limit the growth of fast-growing, aerobic heterotrophs, AGS-SBRs should
be designed to divert as much carbon as possible to internal storage product during the anaerobic
influent distribution phase. In general, an anaerobic contact time of 50 min has been suggested as
sufficient for anaerobic substrate conversion while treating municipal wastewaters [92].
However, more dilute wastewaters in areas with higher degrees of inflow, infiltration, and wet
weather may require less anaerobic contact time [93]. Arguably, one of the most important
factors is the configuration of influent distributors in AGS-SBRs with anaerobic influent
distribution. Without proper hydraulic design, short-circuiting could occur and thereby disrupt
optimal conditions for anaerobic uptake of substrate in the settled sludge bed.

41
Short-circuiting is detrimental since anaerobic diversion of organic carbon to internal
storage product is desired [43], [129]. It is well known that the breakthrough of organic substrate
in bulk solution to aerobic conditions negatively affects AGS stability in SBR. This could be due
to many reasons, including the overgrowth of filamentous organism on the surface of granules or
an accumulation of particulate matter. Both cases lead to mass transfer limitations and therefore
increase the potential for granule disintegration. For municipal wastewater treatment, where
stringent discharge limits must be achieved (e.g., TSS <5 mg/L, BOD5 <5 mg/L, TN <5 mg/L,
and TP < 0.5 mg/L), an AGS-SBR configuration with anaerobic influent distribution would be
preferred – Table 7.
Table 7 Comparison of continuously-aerated AGS-SBRs to AGS-SBRs with anaerobic influent distribution.
Configuration Process diagram Comments
Continuously aerated
Influent is supplied over a very short period (i.e., <5 min) during aeration. The settling time is also short (i.e., <10 min) and selectively wasted biomass is discharged with the effluent. Feed and discharge occur separately.
Anaerobic influent distribution
Influent is supplied gradually over an extended period (i.e., 50 min) under anaerobic conditions. Discharge occurs with feed. After influent distribution feed, the selectively wasted biomass is removed, separating the light solids from the effluent.

42
Application of AGS to industrial wastewaters
Agro-food wastewater
Agro-food industries generate large volumes of wastewater from both the production line
and cleaning practices. Some of these industries generate high salinity wastewater (i.e., fish-
canning), wastewater with high suspended solids, as well as wastewater with high organic
substrate concentrations. High-throughput treatment system are therefore required to comply
with discharge limits (e.g., into the municipal sewer or direct discharge to surface water) or to
obtain an effluent that is suitable for reuse within the industry or other nearby sites.
Brewery wastewater
Wastewater produced by breweries are characterized by high concentrations of bCOD
derived from organic components (e.g., yeast, sugars, soluble starch, etc.). Nitrogen and
phosphorus concentrations are typically dependent on the amount of yeast in the effluent [130].
Thus, brewery wastewater can be nitrogen and phosphorus deficient. AGS has been successfully
cultivated on brewery wastewater [131]. After granulation, high and stable removal efficiencies
(i.e., >88%) for organic carbon and nitrogen were achieved at the volumetric exchange ratio of
50% and cycle duration of 6 h. In another study, a 16 h HRT was necessary to provide an
adequate starvation phase that benefitted granule stability [88]. Granules were compact with high
settling velocities. Nevertheless, further investigations are necessary to focus on decreasing the
volumetric exchange ratio or extending the total duration of the SBR cycle in the treatment of
high-strength wastewater.

43
Dairy wastewater
Dairy wastewater is characterized by high concentrations of TSS and particulate
substrates such as pieces of cheese, coagulated milk, curd fines, milk film, flavouring agents, and
other impurities, such as soil and sand, that enter the sewer system during washing or packaging.
High removal efficiencies in terms of COD and nitrogen were obtained at steady-state with
mature AGS [132]. However, it was noted that in certain operating conditions, the amount of
TSS in the effluent significantly increased. The presence of TSS in the effluent was strongly
affected by either the length of the withdrawal period or by the particulate COD applied to
biomass ratio. Effluent TSS improved when the withdrawal time was decreased and the pCOD
applied to MLVSS ratio was decreased.
One study observed that the maximum OLR was 4 kg-COD/(m3•d) for stable granulation
[133]. It was also observed that process efficiency, in terms of VER and cycle duration, was
limited by the development of adequate feast and famine conditions [134]. The presence of
slowly-biodegradable, organic carbon led to extended feast phases since endogenous respiration
rates were not observed during a single SBR cycle. Thus, granules always showed structural
deficiencies at high OLR due to filamentous outgrowths on aerobically hydrolyzed organic
matter. Decreasing the VER, extending the total duration of the SBR cycle, as well as
incorporating an anaerobic hydrolysis period prior the AGS reactor could therefore enhance
process efficiency of high TSS wastewaters.

44
Fish-canning wastewater
Wastewater generated by fish-canning industries are characterized by high salinity (i.e.,
up to 150 g-NaCl/L), high COD, and TN loads, as well as by a large amount of TSS. Biological
treatment of fish-canning wastewater must therefore resist osmotic pressures, generated by high
salinity, on cellular membranes that could cause plasmolysis. It has been suggested that shortcut
nitrification-denitrification could be the most effective solution for nitrogen removal in saline
wastewater. The operational approaches that are generally implemented to inhibit the NOB
activity, including high temperature, low DO, decoupled SRT, and high free ammonia
concentration are not necessary since salt concentration higher than 20 g-NaCl/L is enough for
NOB inhibition [135].
In one instance AGS was used to treat fish-canning wastewater with up to 30 g-NaCl/L
[135]. The AGS withstood saline conditions and achieved complete organic matter removal with
the presence of nitritation-denitritation activities. The ammonia was mainly oxidized to nitrite
and the efficiency of denitritation process was limited to values between 20% and 55%. Another
study successfully achieved halotolerant AGS by increasing the salinity in the influent
wastewater stepwise [136]. High salt concentrations (i.e., >20 g-NaCl/L) lead to the
accumulation of nitrite, most likely due to the inhibition of NOB. The same study reported that
simultaneous nitritation-denitritation was successfully sustained at salinities up to 50 g-NaCl/L.
The TN concentration in the effluent was less than 10 mg/L at salinities up to 50 g-NaCl/L,
revealing a removal efficiency over 95%. However, nitritation efficiency collapsed above 50 g-
NaCl/L, likely because oxygen diffusion within the bulk liquid was limited by salt concentration.
In contrast, organic matter removal was not affected by salinity, but rather by the OLR.

45
Both COD and BOD removal efficiencies were over 90%, and specific analyses carried
out on the treated wastewater revealed that aerobic granules were able to remove more than 95%
of the particulate organic matter. Salinity does, however, significantly influence the physical
properties of the aerobic granules [137]. Particularly, with increasing salinity the EPS structure
was gradually modified. The fraction of EPS that was not-bound increased with salinity, while
the amount of proteinaceous EPS decreased. The modification of the physical structure was more
noticeable at salinity above 50 g-NaCl/L, when the granules irreparably lost their stability.
Palm oil wastewater
Palm oil production has increased rapidly because of its multiple uses in both food and
other industries, especially in the South-East Asia. Direct discharge of palm oil mill effluent into
the environment is forbidden due to the high COD concentrations of up to 50,000 mg/L,
typically with 50% as BOD. AGS was successfully cultivated at different OLRs ranging between
1.5-3.5 kg-COD/(m3•d) [138]. Different volumetric loading rates led to differences in
morphology and structural features of the AGS, in which higher loading rates promoted the
formation of larger and looser granules. An interesting observation was that low bacterial
speciation was observed in the reactor with high OLR. The bacterial population in the AGS
moved away from its initial population representing a permanent change. The authors stated that
the shift in microbial population was strictly related to operating conditions. Indeed, it is likely
that at high organic loads, the greatest demand for electron acceptors is such that fast-growing,
heterotrophic microorganisms have many competitive advantages over slower-growing,
autotrophic aerobes.

46
Winery wastewater
Winery wastewater has been treated in an AGS-SBR [124]. Winery wastewater is
characterized by high variability of its organic content. To take into account the fluctuations in
organic load, a system to automatically control the HRT based on the anticipated organic load
was developed. The relationship between the slope of ORP and DO profiles was used to apply a
proper ratio of feast to famine conditions by changing the HRT. At higher loads, a longer HRT
was applied to develop an adequate famine phase for the longer feast phase applied. Optimal
conditions were achieved when the famine phase was twice as long as the feast phase (i.e.,
famine phase of 67% the aerated period). Under such operating conditions, the AGS-SBR
reached 95% removal of organic matter under a wide range of organic matter concentrations
(i.e., 1 to 8 g-COD/L). Furthermore, the AGS-SBR showed high stability and a rapid response to
sudden changes in the COD influent concentration.
Petrochemical and oily wastewater
Petrochemical and oily wastewaters are characterized by poor biodegradability due to the
presence of hydrocarbons, metal salts, sulphides, phenol, and other substances. Aerobic granules,
previously cultivated on synthetic wastewater, were gradually adapted to petrochemical
wastewater by gradually increasing the proportion of petrochemical wastewater in the influent
[53]. Following the addition of petrochemical wastewater, granule settleability became poor and
the EPS matrix began to weaken. When petrochemical wastewater was 100% of the influent,
granule settleability and the removal of pollutants deteriorated sharply. The authors observed that
adding additional co-metabolites (e.g., propionate) to stimulate the degradation pathways was an
effective way to ensure effective removal of nutrients and maintain compact structure of aerobic
granules.

47
It was observed that biomass fed with saline, oily wastewater generated from the washing
of oil tankers (i.e., slop) granulated faster compared with conventional synthetic wastewater [54].
However, the granules appeared slightly unstable and more susceptible to breaking. The
combined effect of salinity and hydrocarbons caused the inhibition of the autotrophic biomass,
with the consequence that nitrification was absent. Hydrocarbons were removed by a physical-
biological mechanism, involving an initial adsorption stage followed by the biological
degradation of adsorbed hydrocarbons. The adsorption of hydrocarbons within the pores of
granules provided longer contact time between microorganisms and pollutant, thereby ensuring
the degradation of recalcitrant compounds. Total petroleum hydrocarbons were successfully
removed at steady state with removal of over 90%.
The feasibility of treating petrochemical wastewater characterized by high TOC and
ammonium nitrogen concentrations (i.e., up to 490 and 630 mg/L, respectively) was evaluated
[126]. It was observed that aerobic granules cultivated from non-acclimated biomass irreversibly
deteriorated when the percentage of petrochemical wastewater in the influent was raised to 30%.
More stable granulation was observed when biomass acclimated to toxic substances was used as
inoculum. The same authors stated that due to higher USAV, and to the different sludges used as
inoculum, the aerobic granules exhibited a better physical structure, as well as a higher removal
efficiency in terms of nitrogen and total organic carbon. In a recent study, two different reactor
configurations to treat petrochemical wastewater by means of AGS were evaluated [139].
Particularly, a continuously-aerated SBR with a feast/famine regime and a SBR operated with an
anaerobic feast/aerobic famine strategy were examined. The authors observed that cultivation of
aerobic granules with petrochemical wastewater was possible, confirming what was previously
observed [54]. Furthermore, the feeding regime did not affect the granule formation.

48
Landfill leachate
Landfill leachate is one of the most significant contamination problems at landfill sites.
Leachate contains salts, heavy metals, organic matters, and xenobiotic organic compounds [140].
In addition to xenobiotic organic compounds, landfill leachate is characterized by high
ammonium nitrogen loads [141]. An AGS-SBR was studied for landfill leachate treatment
[142]. The results demonstrated that COD removal rates decreased as the influent ammonium
concentration increased. Concerning nitrogen, it was found that the removal mechanism
depended on the influent concentration. When the TAN concentration in the landfill leachate was
366 mg-NH4-N/L, the dominant nitrogen removal process in the AGS-SBR was SND. Under
ammonium concentrations of 788 mg-NH4-N/L, nitrite accumulation occurred, and the
accumulated nitrite was reduced to nitrogen gas by the shortcut denitrification process.
When the influent TAN increased to 1105 mg-NH4-N/L, accumulation of nitrite and
nitrate persisted throughout the cycle, and the removal efficiencies of ammonium decreased to
40%. Similar results were also obtained by another study, which pointed out the decisive role of
ammonium concentration in TN removal [143]. The organic and nitrogen removal efficiencies
decreased when ammonium concentration increased. For this reason, a specific ammonium pre-
treatment must be applied before AGS application. Furthermore, it was emphasized that the start-
up phase impacts granulation. It was suggested that the initial cultivation of granules should be
carried out with small increments of leachate, in order to optimize the bacteria acclimation and
specification. Others have demonstrated that AGS was able to treat a mixture of wastewater with
landfill leachate at high ammonium concentration of 900 mg-NH4-N/L [144]. The COD removal
was highly dependent on the ammonium concentration in the influent and on the
biodegradability of the organic matter.

49
Wastewater contaminated by emerging micro-pollutants
Many chemicals used in everyday pharmaceutical and personal care products are among
the most commonly detected compounds in surface waters throughout the world. Such
compounds may have significant biological effects, such as enzyme inhibitors, modifiers of cell
to cell communication, disrupters of membrane transport, and processes for energy generation
[145]. Continued exposure to antibiotics can enhance the selection of resistant bacterial strains in
the environment [146]. AGS was successfully used for the treatment of aqueous streams
containing antibiotics and several pharmaceutical and personal care products. It was
demonstrated that conventional AGS was not able to remove 2-fluorophenols [145].
Applying bio-augmentation with a specialized bacterial strain, a strain that was able to
degrade 2-fluorophenols, resulted in full degradation of the compound by the AGS. Overall, the
AGS-SBR was proven to be robust, exhibiting a high performance after bio-augmentation with
the 2-fluorophenols degrading strain. The performances of an AGS reactor treating synthetic
wastewater containing fluoroquinolones, a class of antibiotics, was also studied. No evidence of
fluoroquinolones biodegradation was observed, but the compound did adsorb to the AGS and
was gradually released into the medium in successive cycles after fluoroquinolones were
removed from the influent. Overall, neither COD nor ammonium removal were affected during
the shock loadings of fluoroquinolones.

50
The effects of fluoxetine on an AGS reactor were investigated, and it was noted that
fluoxetine adsorption/desorption to granules continuously occurred [147]. Fluoxetine shock loads
did not show a significant effect on the removal of COD or ammonium, whereas a significant
decrease in denitrification removal efficiency was observed. Moreover, a shift in microbial
community occurred probably due to fluoxetine exposure, which induced
adaptation/restructuring of the microbial population. Similarly, changes in the microbial profiles
with time in response to the presence of pharmaceuticals and personal care products were noted
[148]. Initially, pharmaceutical and personal care products addition negatively affected granular
quality, but after microbial adaptation, the system recovered and effectively removed certain
pharmaceutical and personal care products.
AGS in a CFR
General considerations
Operational considerations for an AGS-CFR are essentially the same as considerations
for operation in SBR. There should be enough anaerobic contact of fresh wastewater with
biomass, promoting as much anaerobic uptake of soluble organics as possible. For the same
reason, pre-treatment methods to remove particulate organic matter, should be considered such
that the characteristics of wastewater supplied to the AGS-CFR are able to be converted to
readily bioavailable substrate and then to internal storage products by accumulating
microorganisms.
Granulation of biomass in continuous flow would require representation of what is
known from granulation in SBRs, as well as from the full-scale Nereda® process. It has widely
been suggested that SBRs, which cycle from high to low substrate concentrations over time,
benefit the formation of AGS [31]. Due to the nature of plug-flow CFRs, where a mass of mixed

51
liquor travels along the length of the reactor, the changing substrate gradients with reactor length
would be representative of SBR operation. However, conventional plug-flow BNR processes
have numerous recycle lines (i.e., at least one internal recycle and return activated sludge) which
dilute substrate concentrations and therefore repress the substrate gradient experienced by the
biomass. It would therefore be important to minimize the number of recycle lines as well as the
quantity of flow recycled (i.e., no internal recycle, and return activated sludge no more than
100% of the influent flow).
It is well known that the breakthrough of organic substrate in bulk solution to aerobic
conditions negatively impacts AGS stability in SBRs. This could be due to many reasons,
including the overgrowth of filamentous microorganisms on the surface of granules or an
accumulation of particulate matter. Both cases lead to mass transfer limitations and therefore
increase the potential for granule disintegration [44], [83]. Thus, it would be important to
consider designing the plug-flow CFR configuration such that maximum anaerobic utilization of
substrate occurred. This could be done by increasing the volume of the anaerobic zone to account
for up to one third of the reactor volume. Under such conditions the hydrolysis of complex,
biodegradable influent substrate, as well any residual particulate matter carried over from the
return activated sludge line, would be enhanced leading to more anaerobic substrate utilization.
Overall, anaerobic substrate utilization promotes uniform growth across the granule and
contributes to lower sludge yields.

52
Allowing for transition from an anaerobic contact phase to an aerobic zone with high
oxygen uptake rate, and then a second aerobic zone with low oxygen uptake rate, should promote
granulation, if a bulk of the organic carbon is converted to internal storage product in the
anaerobic zone. The purpose would be to prevent conditions where fast-growing, aerobic
heterotrophs would be allowed to proliferate in bulk solution, which could lead to operational
problems. As well, the transition from a high-rate aerobic zone to a low-rate aerobic zone allows
for the microbial community to cycle through a phase of EPS production followed by EPS
consumption. Therefore, CMR conditions should be avoided in the design of CFRs. Rather,
plug-flow or a series of at least two aerobic tanks would be desired.
To move from a hybrid-AGS system (i.e., flocculent biomass and granules) to a
completely granular system there must be some degree of selective wasting. Essentially, the SRT
of the light biomass fractions (i.e., free-living cells, flocculent biomass) must be decoupled from
the SRT of granules and controlled at completely different ends of the spectrum. At 20 °C the
minimum SRT for aerobic heterotrophic microorganisms approaches 9 h [86]. Thus, to
effectively out-select all free-living, heterotrophic microorganisms in suspension the aerobic
SRT of the light biomass fraction would have to be 9 h at 20 °C. In practice, this may be too
aggressive an SRT and it is more likely that the range of SRT for the selectively wasted light
fraction of biomass would be 1-6 d. On the other hand, previous lab-scale results as well as
modelling estimations have demonstrated that the optimum SRT of granules should be controlled
at 20 to 50 d. At long granule SRT, desirable metabolic pathways with low yields are selected
for, as well as a higher fraction of PAO to OHO [43], [94].

53
The selective wasting device should be designed with flexibility to allow for diurnal
variation in flow, as well as changing flows as population in the sewer catchment increases. For
this reason, hydrocyclones are not the most desirable device since the selection pressure in a
single hydrocyclone would change with flow. Likewise, physical screening (i.e., 0.2-0.5 mm) is
unlikely to provide a robust solution since granules may be subjected to breakage and not
necessarily complete disintegration. A much better selective wasting device would decouple the
selective wasting criteria from flowrate such that additional operational parameters could be
controlled to add system flexibility.
The final consideration for AGS in continuous plug-flow would be the degree of
variability allowed. Wastewater varies with season as well as time of day. In fact, in smaller
communities the peak hour flow can be three times the average daily flow. With variable flow
also comes variable load. Since AGS is sensitive to the breakthrough of organic substrate to the
aerobic zone, design should consider minimizing the risk of extended “feast” phases [45].
Objectives
The goal was to develop a continuous flow reactor for aerobic granular sludge that would
be suitable for retrofit into existing wastewater treatment facilities where sequencing batch
reactors could not be implemented. To attain the goal, several items had to be addressed,
including: 1) the suitability of aerobic granular sludge to treat low-strength, municipal
wastewater; 2) the importance of hydrodynamic shear force for aerobic granular sludge stability;
3) the role of organic loading rate on aerobic granular sludge stability and performance; 4) the
impact of selective wasting on granulation in continuous flow; and 5) the impact of reactor
configuration on granulation in continuous flow. Thus, the objectives were to address these items
before elucidating design and operational parameters for an AGS-CFR.

54
Bibliography
[1] G. T. Daigger, “A vision for urban water and wastewater management in 2050,” in
Towards a Sustainable Water Future, 2012, pp. 166–174.
[2] National Research Council, Cities transformed: demographic change and its implications
in the developing world, Washington. The National Academy Press, 2003.
[3] M. W. Falk, D. J. Reardon, and J. Neethling, “Striking a balance between nutrient removal
and sustainability,” in Nutrient Recovery and Management 2011, 2011, pp. 617–637.
[4] S. Chen, X. Chen, Y. Peng, and K. Peng, “A mathematical model of the effect of nitrogen
and phosphorus on the growth of blue-green algae population,” Appl. Math. Model., vol.
33, no. 2, pp. 1097–1106, Feb. 2009.
[5] J. A. Oleszkiewicz, D. J. Kruk, and T. R. Devlin, “Options for improved nutrient removal
and recovery from municipal wastewater in the Canadian context,” 2015.
[6] D. Clark, G. Hunt, M. Kasch, P. Lemonds, G. Moen, and J. B. Neethling, “Nutrient
Management: Regulatory Approaches to Protect Water Quality Volume I – Review of
Existing Practices,” 2010.
[7] C. Bott and D. Parker, “Nutrient Management Volume II: Removal Technology
Performance & Reliability,” 2011.
[8] B. Stinson et al., “Roadmap toward energy neutrality & chemical optimization at
enhanced nutrient removal facilities,” in WEF/IWA Nutrient Removal and Recovery 2013,
2013.
[9] D. Rosso et al., “Oxygen transfer and uptake, nutrient removal, and energy footprint of
55
parallel full-scale IFAS and activated sludge processes.,” Water Res., vol. 45, no. 18, pp.
5987–5996, Dec. 2011.
[10] Metcalf & Eddy, Wastewater Engineering: Treatment and Resource Recovery, 5th ed.
McGraw-Hill, 2014.
[11] A. di Biase, T. R. Devlin, M. S. Kowalski, and J. A. Oleszkiewicz, “Performance and
design considerations for an anaerobic moving bed biofilm reactor treating brewery
wastewater: Impact of surface area loading rate and temperature,” J. Environ. Manage.,
2017.
[12] T. A. Young, S. E. Smoot, J. M. Vernooy, J. O. Revette, and B. Woods, “Design
Considerations for magnetite-ballasted activated sludge facilities,” in WEFTEC 2014,
2014, no. 2007, pp. 1370–1392.
[13] Water Environment Federation, Membrane Bioreactors. McGraw Hill, 2012.
[14] A. Giesen, M. C. M. van Loosdrecht, B. de Bruin, H. van der Roest, and M. Pronk, “Full-
scale experiences with aerobic granular biomass technology for treatment of urban and
industrial wastewater,” in International Water Week, 2013.
[15] M. Benisch, J. B. Neethling, D. Clark, C. Fisher, and D. Keil, “Tertiary MBR for
nitrification and low level phosphorus removal,” in WEF/IWA Nutrient Removal and
Recovery: Trends in Resource Recovery and Use., 2013.
[16] T. Young, M. Muftugil, S. Smoot, and J. Peeters, “Capital and operating cost evaluation of
cas vs . mbr treatment,” pp. 4087–4097, 2012.
[17] T. Young, S. Smoot, J. Peeters, and P. Côté, “Cost-effectiveness of MBR treatment

56
system for low-level phosphorus reduction from municipal wastewater,” in WEF/IWA
Nutrient Removal and Recovery: Trends in Resource Recovery and Use., 2013.
[18] R. Niermans, A. Giesen, M. C. M. Van Loosdrecht, and B. De Buin, “Full-scale
Experiences with Aerobic Granular Biomass Technology for Treatment of Urban and
Industrial Wastewater,” in WEFTEC 2014, 2014, pp. 2347–2357.
[19] D. Dursun, J. Jimenez, and A. Briggs, “Comparison of process alternatives for enhanced
nutrient removal: perspectives on energy requirements and costs,” in WEFTEC 2012,
2012, pp. 529–540.
[20] E. Morgenroth, T. Sherden, M. C. M. van Loosedrecht, J. Heijnen, and P. Wilderer,
“Aerobic granular sludge in a sequencing batch reactor,” Water Res., 1997.
[21] L. M. M. de Bruin, M. K. de Kreuk, H. F. R. van der Roest, C. Uijterlinde, and M. C. M.
van Loosdrecht, “Aerobic granular sludge technology: An alternative to activated
sludge?,” Water Sci. Technol., vol. 49, no. 11–12, pp. 1–7, 2004.
[22] A. Giesen, L. M. M. de Bruin, R. P. Niermans, and H. F. ven der Roest, “Advancements
in the application of aerobic granular biomass technology for sustainable treatment of
wastewater,” Water Pract. Technol., vol. 8, no. 1, pp. 47–54, 2013.
[23] A. Giesen and A. Thompson, “Aerobic granular biomass for cost-effective, energy
efficient and sustainable wastewater treatment,” in European Waste Water Management
Conference, 2013.
[24] P. Inocêncio, F. Coelho, M. C. M. van Loosdrecht, and A. Giesen, “The future of sewage
treatment: Nereda technology exceeds high expectations,” Water21, vol. 15, no. 2, pp. 28–

57
29, 2013.
[25] Y. Cao, M. C. M. van Loosdrecht, and G. T. Daigger, “Mainstream partial nitritation–
anammox in municipal wastewater treatment: status, bottlenecks, and further studies,”
Appl. Microbiol. Biotechnol., vol. 101, no. 4, pp. 1365–1383, 2017.
[26] T. Lotti et al., “Pilot-scale evaluation of anammox-based mainstream nitrogen removal
from municipal wastewater.,” Environ. Technol., vol. 36, no. 9–12, pp. 1167–77, 2014.
[27] D. Celmer, J. A. Oleszkiewicz, and N. Cicek, “Impact of shear force on the biofilm
structure and performance of a membrane biofilm reactor for tertiary hydrogen-driven
denitrification of municipal wastewater,” Water Res., vol. 42, no. 12, pp. 3057–3065,
2008.
[28] K. J. Martin and R. Nerenberg, “The membrane biofilm reactor (MBfR) for water and
wastewater treatment: Principles, applications, and recent developments,” Bioresour.
Technol., vol. 122, pp. 83–94, 2012.
[29] P. T. Kelly and Z. He, “Nutrients removal and recovery in bioelectrochemical systems: A
review,” Bioresour. Technol., vol. 153, pp. 351–360, 2014.
[30] B. Virdis, K. Rabaey, R. A. Rozendal, Z. Yuan, Y. Mu, and J. Keller, “Simultaneous
nitrification and denitrification (SND) at amicrobial fuel cell (MFC) Biocathode,” J.
Biotechnol., vol. 150, pp. 153–154, 2010.
[31] M. Pronk, M. K. de Kreuk, B. de Bruin, P. Kamminga, R. Kleerebezem, and M. C. M. van
Loosdrecht, “Full scale performance of the aerobic granular sludge process for sewage
treatment,” Water Res., vol. 84, pp. 207–217, 2015.

58
[32] P. Dangcong, N. Bernet, J. P. Delgenes, and R. Moletta, “Aerobic granular sludge-a case
report,” Water Res., vol. 33, no. 3, pp. 890–893, 1999.
[33] J. H. Tay, Q. S. Liu, and Y. Liu, “Microscopic observation of aerobic granulation in
sequential aerobic sludge blanket reactor,” J. Appl. Microbiol., vol. 91, no. 1, pp. 168–
175, 2001.
[34] J. H. Tay, Q. S. Liu, and Y. Liu, “The effects of shear force on the formation, structure
and metabolism of aerobic granules,” Appl. Microbiol. Biotechnol., vol. 57, no. 1–2, pp.
227–233, 2001.
[35] J. Zhu and P. A. Wilderer, “Effect of extended idle conditions on structure and activity of
granular activated sludge,” Water Res., vol. 37, no. 9, pp. 2013–2018, 2003.
[36] M. Torregrossa, G. Di Bella, G. Viviani, and A. Gnoffo, “Performances of a granular
sequencing batch reactor (GSBR),” Water Sci. Technol., vol. 55, no. 8–9, pp. 125–133,
2007.
[37] B. Su, X. Cui, and J. Zhu, “Optimal cultivation and characteristics of aerobic granules
with typical domestic sewage in an alternating anaerobic/aerobic sequencing batch
reactor,” Bioresour. Technol., vol. 10, pp. 125–129, 2012.
[38] X. M. Li et al., “Enhanced aerobic sludge granulation in sequencing batch reactor by Mg2+
augmentation,” Bioresour. Technol., vol. 100, no. 1, pp. 64–67, 2009.
[39] X. Y. Shi, H. Q. Yu, Y. J. Sun, and X. Huang, “Characteristics of aerobic granules rich in
autotrophic ammonium-oxidizing bacteria in a sequencing batch reactor,” Chem. Eng. J.,
vol. 147, no. 2, pp. 102–109, 2009.

59
[40] M.-K. H. Winkler, J. P. Bassin, R. Kleerebezem, R. G. J. M. van der Lans, and M. C. M.
van Loosdrecht, “Temperature and salt effects on settling velocity in granular sludge
technology,” Water Res., vol. 46, no. 12, pp. 3897–3902, 2012.
[41] M.-K. H. Winkler, R. Kleerebezem, M. Strous, K. Chandran, and M. C. M. van
Loosdrecht, “Factors influencing the density of aerobic granular sludge,” Appl. Microbiol.
Biotechnol., vol. 97, no. 16, pp. 7459–7468, 2013.
[42] M.-K. H. Winkler et al., “Microbial diversity differences within aerobic granular sludge
and activated sludge flocs,” Appl. Microbiol. Biotechnol., vol. 97, no. 16, pp. 7447–7458,
2013.
[43] T. R. Devlin, A. di Biase, M. S. Kowalski, and J. A. Oleszkiewicz, “Granulation of
activated sludge under low hydrodynamic shear and different wastewater characteristics,”
Bioresour. Technol., vol. 224, 2017.
[44] J. Wagner, D. G. Weissbrodt, V. Manguin, R. H. Ribeiro da Costa, E. Morgenroth, and N.
Derlon, “Effect of particulate organic substrate on aerobic granulation and operating
conditions of sequencing batch reactors,” Water Res., vol. 85, pp. 158–166, 2015.
[45] S. F. Corsino, M. Capodici, M. Torregrossa, and G. Viviani, “Fate of aerobic granular
sludge in the long-term: The role of EPSs on the clogging of granular sludge porosity,” J.
Environ. Manage., vol. 183, pp. 541–550, 2016.
[46] H. C. Flemming and J. Wingender, “Extracellular Polymeric Substances (EPS): Structural,
ecological and technical aspects,” in Encyclopedia of Environmental Microbiology, 2003.
[47] Z. W. Wang, Y. Li, J. Q. Zhou, and Y. Liu, “The influence of short-term starvation on

60
aerobic granules,” Process Biochem., vol. 41, pp. 2373–2378, 2006.
[48] T. Seviour, Z. Yuan, M. C. M. van Loosdrecht, and Y. Lin, “Aerobic sludge granulation:
A tale of two polysaccharides?,” Water Res., vol. 46, no. 15, pp. 4803–4813, 2012.
[49] M. Y. Chen, D. J. Lee, and J. H. Tay, “Distribution of extracellular polymeric substances
in aerobic granules,” Appl. Microbiol. Biotechnol., vol. 73, no. 6, pp. 1463–1469, 2007.
[50] S. S. Adav, D.-J. Lee, and J.-H. Tay, “Extracellular polymeric substances and structural
stability of aerobic granule,” Water Res., vol. 42, no. 6–7, pp. 1644–1650, 2008.
[51] Y. M. Lin, P. K. Sharma, and M. C. M. van Loosdrecht, “The chemical and mechanical
differences between alginate-like exopolysaccharides isolated from aerobic flocculent
sludge and aerobic granular sludge,” Water Res., vol. 47, no. 1, pp. 57–65, 2013.
[52] Y. Xiong and Y. Liu, “Importance of extracellular proteins in maintaining structural
integrity of aerobic granules,” Colloids Surfaces B Biointerfaces, vol. 112, pp. 435–440,
2013.
[53] H. Zhang, Y. He, T. Jiang, and F. Yang, “Research on characteristics of aerobic granules
treating petrochemical wastewater by acclimation and co-metabolism methods,”
Desalination, vol. 279, no. 1–3, pp. 69–74, 2011.
[54] S. F. Corsino, R. Campo, G. Di, and M. Torregrossa, “Cultivation of granular sludge with
hypersaline oily wastewater,” Int. Biodeterior. Biodegradation, vol. 105, pp. 192–202,
2015.
[55] B. Wang, D. Wu, G. A. Ekama, H. Huang, H. Lu, and G. H. Chen, “Optimizing mixing
mode and intensity to prevent sludge flotation in sulfidogenic anaerobic sludge bed

61
reactors,” Water Res., vol. 122, pp. 481–491, 2017.
[56] S. S. Adav and D. J. Lee, “Extraction of extracellular polymeric substances from aerobic
granule with compact interior structure,” J. Hazard. Mater., vol. 154, no. 1–3, pp. 1120–
1126, 2008.
[57] A. T. Poortinga, R. Bos, W. Norde, and H. J. Busscher, “Electric double layer interactions
in bacterial adhesion to surfaces,” Surf. Sci. Rep., vol. 47, no. 1, pp. 1–32, 2002.
[58] D. C. Sobeck and M. J. Higgins, “Examination of three theories for mechanisms of cation-
induced bioflocculation,” Water Res., vol. 36, no. 3, pp. 527–538, 2002.
[59] J. P. Bassin, M. Pronk, R. Kraan, R. Kleerebezem, and M. C. M. van Loosdrecht,
“Ammonium adsorption in aerobic granular sludge, activated sludge and anammox
granules,” Water Res., vol. 45, no. 16, pp. 5257–5265, 2011.
[60] Y. M. Lin, J. P. Bassin, and M. C. M. van Loosdrecht, “The contribution of
exopolysaccharides induced struvites accumulation to ammonium adsorption in aerobic
granular sludge,” Water Res., vol. 46, no. 4, pp. 986–992, 2012.
[61] M. Angela, B. Béatrice, and S. Mathieu, “Biologically induced phosphorus precipitation
in aerobic granular sludge process,” Water Res., vol. 45, no. 12, pp. 3776–3786, 2011.
[62] W. Huang et al., “Species and distribution of inorganic and organic phosphorus in
enhanced phosphorus removal aerobic granular sludge,” Bioresour. Technol., vol. 193, pp.
549–552, 2015.
[63] X. Li, J. Luo, G. Guo, H. R. Mackey, T. Hao, and G. Chen, “Seawater-based wastewater
accelerates development of aerobic granular sludge: A laboratory proof-of-concept,”

62
Water Res., vol. 115, pp. 210–219, 2017.
[64] Y. Q. Liu, G. H. Lan, and P. Zeng, “Excessive precipitation of CaCO3 as aragonite in a
continuous aerobic granular sludge reactor,” Appl. Microbiol. Biotechnol., vol. 99, no. 19,
pp. 8225–8234, 2015.
[65] Y. C. Juang, S. S. Adav, D. J. Lee, and J. H. Tay, “Stable aerobic granules for continuous-
flow reactors: Precipitating calcium and iron salts in granular interiors,” Bioresour.
Technol., vol. 101, no. 21, pp. 8051–8057, 2010.
[66] L. Qin, Y. Liu, and J. H. Tay, “Effect of settling time on aerobic granulation in sequencing
batch reactor,” Biochem. Eng. J., vol. 21, no. 1, pp. 57–52, 2004.
[67] Y. Liu and J. H. Tay, “State of the art of biogranulation technology for wastewater
treatment,” Biotechnol. Adv., vol. 22, no. 533, p. 563, 2004.
[68] T. T. Ren et al., “Calcium spatial distribution in aerobic granules and its effects on granule
structure, strength and bioactivity,” Water Res., vol. 42, no. 13, pp. 3343–3352, 2008.
[69] Z.-H. Li, Y.-M. Zhu, Y.-L. Zhang, Y.-R. Zhang, C.-B. He, and C.-J. Yang,
“Characterization of aerobic granular sludge of different sizes for nitrogen and phosphorus
removal,” Environ. Technol., vol. 0, no. 0, pp. 1–10, 2018.
[70] E. Paul and Y. Liu, Biological Sludge Minimization and Biomaterials/Bioenergy Recovery
Technologies. 2012.
[71] J. P. Bassin, R. Kleerebezem, M. Dezotti, and M. C. M. van Loosdrecht, “Measuring
biomass specific ammonium, nitrite and phosphate uptake rates in aerobic granular
sludge.,” Chemosphere, vol. 89, no. 10, pp. 1161–8, Nov. 2012.

63
[72] J. P. Bassin, R. Kleerebezem, M. Dezotti, and M. C. M. van Loosdrecht, “Simultaneous
nitrogen and phosphate removal in aerobic granular sludge reactors operated at different
temperatures.,” Water Res., vol. 46, no. 12, pp. 3805–16, Aug. 2012.
[73] F. Wang, S. Lu, Y. Wei, and M. Ji, “Characteristics of aerobic granule and nitrogen and
phosphorus removal in a SBR,” J. Hazard. Mater., vol. 164, no. 2–3, pp. 77–86, 2009.
[74] S. T. Tay, V. Ivanov, S. Yi, and J. H. Tay, “Presence of anaerobic bacterioudes in
aerobically grown microbial granules,” Microb. Ecol., vol. 44, no. 3, pp. 278–285, 2002.
[75] S. S. Adav and D. J. Lee, “Extraction of extracellular polymeric substances from aerobic
granule with compact interior structure,” J. Hazard. Mater., vol. 154, no. 1–3, pp. 1120–
1126, 2008.
[76] S. S. Adav, D. J. Lee, and J. Y. Lai, “Effects of aeration intensity on formation of phenol-
fed aerobic granules and extracellular polymeric substances,” Appl. Microb. Biotechnol.,
vol. 77, no. 1, pp. 175–182, 2007.
[77] M.-K. H. Winkler, R. Kleerebezem, and M. C. M. van Loosdrecht, “Integration of
anammox into the aerobic granular sludge process for main stream wastewater treatment
at ambient temperatures,” Water Res., vol. 46, no. 1, pp. 136–144, 2012.
[78] E. Isanta, C. Reino, J. Carrera, and J. Pérez, “Stable partial nitritation for low-strength
wastewater at low temperature in an aerobic granular reactor,” Water Res., vol. 80, pp.
149–158, 2015.
[79] M. K. H. Winkler, J. P. Bassin, R. Kleerebezem, D. Y. Sorokin, and M. C. M. van
Loosdrecht, “Unravelling the reasons for disproportion in the ratio of AOB and NOB in

64
aerobic granular sludge,” Appl. Microbiol. Biotechnol., vol. 94, no. 6, pp. 1657–1666,
2012.
[80] M. K. De Kreuk, J. J. Heijnen, and M. C. M. van Loosdrecht, “Simultaneous COD,
nitrogen, and phosphate removal by aerobic granular sludge,” Biotechnol. Bioeng., vol.
90, no. 6, pp. 761–769, 2005.
[81] J. J. Barr et al., “Metagenomic and metaproteomic analyses of Accumulibacter
phosphatis-enriched flocculent and granular biofilm,” Environ. Microbiol., vol. 18, no. 1,
pp. 273–287, 2016.
[82] A. H. F. Hosie and P. S. Poole, “Bacterial ABC transporters of amino acids,” Res.
Microbiol., vol. 152, no. 3–4, pp. 259–270, 2001.
[83] M. K. de Kreuk, N. Kishida, S. Tsuneda, and M. C. M. van Loosdrecht, “Behavior of
polymeric substrates in an aerobic granular sludge system,” Water Res., vol. 44, no. 20,
pp. 5929–5938, 2010.
[84] P. F. Strom and D. Jenkins, “Identification and significance of filamentous
microorganisms in activated sludge,” Water Pollut. Control Fed., vol. 56, no. 5, pp. 449–
459, 1984.
[85] Z. Ding et al., “Role of extracellular polymeric substances (EPS) production in
bioaggregation: application to wastewater treatment,” Appl. Microbiol. Biotechnol., vol.
99, no. 23, pp. 9883–9905, 2015.
[86] Envirosim, “BioWin 5.0.” 2017.
[87] M. K. de Kreuk, M. Pronk, and M. C. M. van Loosdrecht, “Formation of aerobic granules

65
and conversion processes in an aerobic granular sludge reactor at moderate and low
temperatures,” Water Res., vol. 39, no. 18, pp. 4476–4484, 2005.
[88] S. F. Corsino, A. di Biase, T. R. Devlin, G. Munz, M. Torregrossa, and J. A.
Oleszkiewicz, “Effect of Extended Famine Conditions on Aerobic Granular Sludge
Stability in the Treatment of Brewery Wastewater,” Bioresour. Technol., 2016.
[89] Y. Liu and J. H. Tay, “The essential role of hydrodynamic shear force in the formation of
biofilm and granular sludge,” Water Research, vol. 36, no. 7. pp. 1653–1665, 2002.
[90] Y. Chen, W. Jiang, D. T. Liang, and J. H. Tay, “Structure and stability of aerobic granules
cultivated under different shear force in sequencing batch reactors,” Appl. Microbiol.
Biotechnol., vol. 76, no. 5, pp. 1199–1208, 2007.
[91] B. S. McSwain, R. L. Irvine, and P. A. Wilderer, “The influence of settling time on the
formation of aerobic granules,” Water Sci. Technol., vol. 50, no. 10, pp. 195–202, 2004.
[92] M. K. de Kreuk and M. C. M. van Loosdrecht, “Selection of slow growing organisms as a
means for improving aerobic granular sludge stability,” Water Sci. Technol., vol. 49, no.
11–12, pp. 9–17, 2004.
[93] B. J. Thwaites, P. Reeve, N. Dinesh, M. D. Short, and B. van den Akker, “Comparison of
an anaerobic feed and split anaerobic-aerobic feed on granular sludge development,
performance and ecology,” Chemosphere, vol. 172, pp. 408–417, 2017.
[94] M. Pronk, B. Abbas, S. H. K. Al-zuhairy, R. Kraan, R. Kleerebezem, and M. C. M. van
Loosdrecht, “Effect and behaviour of different substrates in relation to the formation of
aerobic granular sludge,” Appl. Microbiol. Biotechnol., vol. 99, no. 12, pp. 5257–5268,

66
2015.
[95] M. K. De Kreuk, B. S. McSwain, S. Bathe, S. T. L. Tay, and N. Schwarzenbech, “Aerobic
granular sludge,” pp. 1–14, 2005.
[96] J. J. Beun, M. C. M. van Loosdrecht, and J. J. Heijnen, “Aerobic granulation in a
sequencing batch airlift reactor,” Water Res., vol. 36, no. 3, pp. 702–712, 2002.
[97] A. M. P. Martins, Ö. Karahan, and M. C. M. van Loosdrecht, “Effect of polymeric
substrate on sludge settleability,” Water Res., vol. 45, no. 1, pp. 263–273, 2011.
[98] A. Mosquera-Corral, M. K. de Kreuk, J. J. Heijnen, and M. C. M. van Loosdrecht,
“Effects of oxygen concentration on N-removal in an aerobic granular sludge reactor.,”
Water Res., vol. 39, no. 12, pp. 2676–86, 2005.
[99] H. L. Jiang, J. H. Tay, and S. T. L. Tay, “Aggregation of immobilized activated sludge
cells into aerobically grown microbial granules for the aerobic biodegradation of phenol,”
Lett. Appl. Microbiol., vol. 35, no. 5, pp. 439–445, 2002.
[100] Z. Hu, R. A. Ferraina, J. F. Ericson, A. A. MacKay, and B. F. Smets, “Biomass
characteristics in three sequencing batch reactors treating a wastewater containing
synthetic organic chemicals,” Water Res., vol. 39, no. 4, pp. 710–720, 2005.
[101] S. S. Adav, D.-J. Lee, and J.-Y. Lai, “Aerobic granulation in sequencing batch reactors at
different settling times,” Bioresour. Technol., vol. 100, no. 21, pp. 5359–5361, 2009.
[102] D. G. Weissbrodt, G. S. Schneiter, J. M. Fürbringer, and C. Holliger, “Identification of
trigger factors selecting for polyphosphate- and glycogen-accumulating organisms in
aerobic granular sludge sequencing batch reactors,” Water Res., vol. 47, no. 19, pp. 7006–

67
7018, 2013.
[103] S. Lochmatter and C. Holliger, “Optimization of operation conditions for the startup of
aerobic granular sludge reactors biologically removing carbon, nitrogen, and
phosphorous.,” Water Res., vol. 59, pp. 58–70, Aug. 2014.
[104] L. Qin, Y. Liu, and J. H. Tay, “Effect of settling time on aerobic granulation in sequencing
batch reactor,” Biochem. Eng. J., vol. 21, no. 1, pp. 47–52, 2004.
[105] J. P. Bassin, M.-K. H. Winkler, R. Kleerebezem, M. Dezotti, and M. C. M. van
Loosdrecht, “Improved Phosphate Removal by Selective Sludge Discharge in Aerobic
Granular Sludge Reactors,” Biotechnol. Bioeng., vol. 109, pp. 1919–1928, 2012.
[106] O. Henriet, C. Meunier, P. Henry, and J. Mahillon, “Improving phosphorus removal in
aerobic granular sludge processes through selective microbial management,” Bioresour.
Technol., vol. 211, pp. 298–306, 2016.
[107] M.-K. H. Winkler, J. P. Bassin, R. Kleerebezem, L. M. M. de Bruin, T. P. H. van den
Brand, and M. C. M. van Loosdrecht, “Selective sludge removal in a segregated aerobic
granular biomass system as a strategy to control PAO–GAO competition at high
temperatures,” Water Res., vol. 45, no. 11, pp. 3291–3299, 2011.
[108] I. S. Kim, S. M. Kim, and A. Jang, “Characterization of aerobic granules by microbial
density at different COD loading rates,” Bioresour. Technol., vol. 99, no. 1, pp. 18–25,
2008.
[109] A. J. Li, X. Y. Li, and H. Q. Yu, “Effect of the food-to-microorganism (F/M) ratio on the
formation and size of aerobic sludge granules,” Process Biochem., vol. 46, no. 12, pp.

68
2269–2276, 2011.
[110] A. Li, S. Yang, X. Li, and J. Gu, “Microbial population dynamics during aerobic sludge
granulation at different organic loading rates,” Water Res., vol. 42, no. 13, pp. 3552–3560,
2008.
[111] S.-G. Wang et al., “Aerobic granules for low-strength wastewater treatment: Formation,
structure, and microbial community,” J. Chem. Technol. Biotechnol., vol. 84, no. 7, pp.
1015–1020, 2009.
[112] E. Dulekgurgen, N. Artan, D. Orhon, and P. A. Wilderer, “How does shear affect
aggregation in granular sludge sequencing batch reactors? Relations between shear,
hydrophobicity, and extracellular polymeric substances,” Water Sci. Technol., vol. 58, no.
2, pp. 267–276, 2008.
[113] S. Rezasoltani, J. Shayegan, and S. Jalali, “Effect of pH on aerobic granulation and
treatment performance in sequencing batch reactors,” Chem. Eng. Technol., vol. 38, no. 5,
pp. 851–858, 2015.
[114] M. Lashkarizadeh, G. Munz, and J. A. Oleszkiewicz, “Impacts of variable pH on stability
and nutrient removal efficiency of aerobic granular sludge,” Water Sci. Technol., vol. 73,
no. 1, pp. 60–68, 2016.
[115] G. Lettinga, S. Rebac, and G. Zeeman, “Challenge of psychrophilic anaerobic wastewater
treatment,” Trends in Biotechnology, vol. 19, no. 9. pp. 363–370, 2001.
[116] M. H. Ab Halim, A. Nor Anuar, N. S. Abdul Jamal, S. I. Azmi, Z. Ujang, and M. M. Bob,
“Influence of high temperature on the performance of aerobic granular sludge in
69
biological treatment of wastewater,” J. Environ. Manage., vol. 184, pp. 271–280, 2016.
[117] S. S. Adav, D.-J. Lee, and J.-Y. Lai, “Potential cause of aerobic granular sludge
breakdown at high organic loading rates.,” Appl. Microbiol. Biotechnol., vol. 85, no. 5, pp.
1601–1610, 2010.
[118] M. Verawaty, S. Tait, M. Pijuan, Z. Yuan, and P. L. Bond, “Breakage and growth towards
a stable aerobic granule size during the treatment of wastewater.,” Water Res., vol. 47, no.
14, pp. 5338–49, 2013.
[119] L. Zhu, Y. Yu, X. Dai, X. Xu, and H. Qi, “Optimization of selective sludge discharge
mode for enhancing the stability of aerobic granular sludge process,” Chem. Eng. J., vol.
217, pp. 442–446, 2013.
[120] C. Zhang, H. Zhang, and F. Yang, “Diameter control and stability maintenance of aerobic
granular sludge in an A/O/A SBR,” Sep. Purif. Technol., vol. 149, pp. 362–369, 2015.
[121] Y. M. Zheng, H. Q. Yu, S. J. Liu, and X. Z. Liu, “Formation and instability of aerobic
granules under high organic loading conditions,” Chemosphere, vol. 63, no. 10, pp. 1791–
1800, 2006.
[122] R. Lemaire, R. I. Webb, and Z. Yuan, “Micro-scale observations of the structure of
aerobic microbial granules used for the treatment of nutrient-rich industrial wastewater,”
ISME J., vol. 2, no. 5, pp. 528–541, 2008.
[123] F. Valentino, A. A. Brusca, M. Beccari, A. Nuzzo, G. Zanaroli, and M. Majone, “Start up
of biological sequencing batch reactor (SBR) and short-term biomass acclimation for
polyhydroxyalkanoates production,” J. Chem. Technol. Biotechnol., vol. 88, no. 2, pp.

70
261–270, 2013.
[124] S. López-Palau, A. Pinto, N. Basset, J. Dosta, and J. Mata-Álvarez, “ORP slope and feast-
famine strategy as the basis of the control of a granular sequencing batch reactor treating
winery wastewater,” Biochem. Eng. J., vol. 68, pp. 190–198, 2012.
[125] J. Leong, B. Rezania, and D. S. Mavinic, “Aerobic granulation utilizing fermented
municipal wastewater under low pH and alkalinity conditions in a sequencing batch
reactor.,” Environ. Technol., vol. 37, no. 1, pp. 55–63, 2016.
[126] S. Milia, E. Malloci, and A. Carucci, “Aerobic granulation with petrochemical wastewater
in a sequencing batch reactor under different operating conditions,” Desalin. Water Treat.,
vol. 3994, no. September, pp. 1–10, 2016.
[127] L. Liu et al., “Cultivation of aerobic granular sludge with a mixed wastewater rich in toxic
organics,” Biochem. Eng. J., vol. 57, no. 1, pp. 7–12, 2011.
[128] N. Derlon, J. Wagner, R. H. R. da Costa, and E. Morgenroth, “Formation of aerobic
granules for the treatment of real and low-strength municipal wastewater using a
sequencing batch reactor operated at constant volume,” Water Res., vol. 105, pp. 341–350,
2016.
[129] Y. Liu, S.-F. Yang, and J.-H. Tay, “Improved stability of aerobic granules by selecting
slow-growing nitrifying bacteria,” J. Biotechnol., vol. 108, no. 2, pp. 161–169, 2004.
[130] L. Fillaudeau, P. Blanpain-Avet, and G. Daufin, “Water, wastewater and waste
management in brewing industries,” J. Clean. Prod., vol. 14, no. 5, pp. 463–471, 2006.
[131] S. G. Wang, X. W. Liu, W. X. Gong, B. Y. Gao, D. H. Zhang, and H. Q. Yu, “Aerobic

71
granulation with brewery wastewater in a sequencing batch reactor,” Bioresour. Technol.,
vol. 98, no. 11, pp. 2142–2147, 2007.
[132] B. Arrojo, A. Mosquera-Corral, J. M. Garrido, and R. Méndez, “Aerobic granulation with
industrial wastewater in sequencing batch reactors,” Water Res., vol. 38, no. 14–15, pp.
3389–3399, 2004.
[133] A. Val del Río et al., “Aerobic granular SBR systems applied to the treatment of industrial
effluents,” J. Environ. Manage., vol. 95, pp. S88–S92, 2012.
[134] N. Schwarzenbeck, R. Erley, and P. A. Wilderer, “Aerobic granular sludge in an SBR-
system treating wastewater rich in particulate matter,” Water Sci. Technol., vol. 49, no.
11–12, pp. 41–46, 2004.
[135] M. Figueroa, A. Mosquera-Corral, J. L. Campos, and R. Méndez, “Treatment of saline
wastewater in SBR aerobic granular reactors,” Water Sci. Technol., vol. 58, no. 2, p. 479,
2008.
[136] S. F. Corsino, M. Capodici, C. Morici, M. Torregrossa, and G. Viviani, “Simultaneous
nitritation–denitritation for the treatment of high-strength nitrogen in hypersaline
wastewater by aerobic granular sludge,” Water Res., vol. 88, pp. 329–336, 2016.
[137] S. F. Corsino, M. Capodici, M. Torregrossa, and G. Viviani, “Physical properties and
Extracellular Polymeric Substances pattern of aerobic granular sludge treating hypersaline
wastewater,” Bioresourse Technol., vol. 229, pp. 152–159, 2017.
[138] N. Abdullah, A. Yuzir, T. P. Curtis, A. Yahya, and Z. Ujang, “Characterization of aerobic
granular sludge treating high strength agro-based wastewater at different volumetric

72
loadings,” Bioresour. Technol., vol. 127, pp. 181–187, 2013.
[139] M. Caluwé et al., “Formation of aerobic granular sludge during the treatment of
petrochemical wastewater,” Bioresour. Technol., 2017.
[140] S. Renou, G. Givaudan, S. Poulain, F. Dirassouyan, and P. Moulin, “Landfill leachate
treatment: Review and opportunity,” J. Hazard. Mater., vol. 150, no. 3, pp. 468–493,
2008.
[141] G. Varank et al., “Migration behavior of landfill leachate contaminants through alternative
composite liners,” Sci. Total Environ., vol. 409, no. 17, pp. 3183–3196, 2011.
[142] Y. Wei, M. Ji, R. Li, and F. Qin, “Organic and nitrogen removal from landfill leachate in
aerobic granular sludge sequencing batch reactors,” Waste Manag., vol. 32, no. 3, pp.
448–455, 2012.
[143] G. Di and M. Torregrossa, “Aerobic granular sludge for leachate treatment,” vol. 38, pp.
493–498, 2014.
[144] Q. Yuan, H. Jia, and M. Poveda, “Study on the effect of landfill leachate on nutrient
removal from municipal wastewater,” J. Environ. Sci., vol. 43, pp. 153–158, 2016.
[145] A. F. Duque, V. S. Bessa, M. F. Carvalho, M. K. de Kreuk, M. C. M. van Loosdrecht, and
P. M. L. Castro, “2-Fluorophenol degradation by aerobic granular sludge in a sequencing
batch reactor,” Water Res., vol. 45, no. 20, pp. 6745–6752, 2011.
[146] K. Kümmerer, “Antibiotics in the aquatic environment – A review – Part I,”
Chemosphere, vol. 75, no. 4, pp. 417–434, 2009.
[147] I. S. Moreira et al., “Removal of fluoxetine and its effects in the performance of an

73
aerobic granular sludge sequential batch reactor,” J. Hazard. Mater., vol. 287, pp. 93–101,
2015.
[148] X. Zhao, Z. Chen, X. Wang, J. Li, J. Shen, and H. Xu, “Remediation of pharmaceuticals
and personal care products using an aerobic granular sludge sequencing bioreactor and
microbial community profiling using Solexa sequencing technology analysis,” Bioresour.
Technol., vol. 179, pp. 104–112, 2015.

74
Chapter 2: AGS-SBR treating low-strength wastewater at low
hydrodynamic shear force
Introduction
Aerobic granular sludge has been described as one of the most advanced biotechnologies
for wastewater treatment [1]. Lab-scale experiments achieved steady-state COD removal of 95%,
TIN removal of 94%, and TP removal of 98% [2]. Furthermore, several full-scale AGS-SBR
systems treating municipal and industrial wastewaters achieved low effluent nitrogen and
phosphorus with up to 60% reduction in energy consumption compared to conventional
processes [3], [4]. However, there remained marked scarcity of information regarding treatment
of low-strength wastewaters. Especially, drivers behind granule formation, granule stability, and
nutrient removal, especially simultaneous nitrification-denitrification SND, when treating low-
strength municipal wastewaters were not well described.
Suitability of AGS for low-strength wastewater was an extremely divisive topic in the
literature. Some studies suggested that granulation on low-strength wastewater was not possible,
while other studies have suggested that increased famine periods, which would suggest lower
OLR and therefore low-strength wastewaters, were beneficial for granule stability [5]–[7]. The
following summarized some of the findings regarding AGS treating low-strength wastewater. In
one case municipal wastewater was pre-fermented with supplemental sucrose addition, thereby
increasing the OLR from 1.4 kg-COD/(m3•d) to 2.5 kg-COD/(m3•d), in order to achieve
granulation [8]. Without pre-fermentation and sucrose addition granulation was not observed.
Another study successfully granulated on low-strength wastewater with 340 mg-COD/L at an
OLR of 1.4 kg-COD/(m3•d) [9].

75
However, that study used a synthetic wastewater which would have been more
biodegradable than municipal wastewater. Complete degranulation was observed by others when
substrate supplied to an AGS-SBR was switched from an acetate based solution with 1000 mg-
COD/L to municipal wastewater with an average COD concentration of 480 mg/L [10]. The
same study reported regranulation 30 d after degranulation, thereby suggesting that low-strength
wastewater could generate stable AGS after a period of acclimation. Lastly, another study
reported successful and stable granulation at various OLR, but indicated that removal efficiency
increased as cycle time decreased from 450 min to 200 min (i.e., OLR more than doubled) [11].
This contradiction within the literature regarding AGS treating low-strength wastewater
confounded potential applications for AGS processes. Thus, the objective of this study was to
examine the development and stability of AGS and measure kinetic rates of nutrient removal
while treating low-strength wastewater, without acetate or propionate source, at saturated DO.
High DO was used to represent the worst case for SND, as observed by other authors [12].
Biomass characteristics including observed yields, whole sludge SRT, and the diameter of AGS
particles were estimated.
Methods
Reactor design and operation
The AGS process was conducted in SBRs with working volume of 4 L at ambient
temperature (i.e., 20±1 °C). Three reactors were constructed from 4” (i.e., 10.16 cm) diameter
acrylic tube welded to square acrylic sheet base. Access ports were connected to 3/8” (i.e.,
0.9525 cm) ID tube at 1 L intervals. A 50% VER was maintained by discharging via the 2 L
access port. Thus, the top 2 L of supernatant were discharged in less than 5 min following a 3
min settling period. The HRT was 6 h. Influent was delivered from the bottom through a 3/32”

76
(i.e., 0.2382 cm) tube over a 1 h, anaerobic period without mixing. This resulted in upflow fluid
velocities of 0.41 cm/min relative to the perpendicular cross-sectional area of the reactors. The
remaining time was utilized for aerobic reaction, where air was supplied by magnetic piston
pumps at a controlled rate of 2 L/min. The air was delivered through three, 3 cm diameter
spherical stone diffusers located on the reactor floor. The resulting USAV was 0.41 cm/s.
Cycle duration was 3 h (i.e., 180 min) including 60 min anaerobic feeding, 110 aerobic
reaction, 3 min settling, 5 min discharging, and 2 min idling before the next cycle. Sludge was
selectively wasted during settling, with sludge not settling within the allotted 3 min having a
SRT equal to the 6 h HRT. Cycles were controlled via outlet timers (Traceable Digital Outlet
Controller, Fisher Scientific, CA). Dissolved oxygen concentrations in the reactors reached
saturation 5 min after aeration began and remained at saturation for the duration of the aerobic
period.
The pH was monitored (Eutech pH Controller, Thermo Scientific, USA) and maintained
at less than 7.30±0.05 during the aerobic reaction phase using sulfuric acid dosed by peristaltic
pumps (Masterflex, Cole-Parmer, CA). Dissolved oxygen concentrations reached saturation
within 5 min of aeration and were maintained at saturation during the entire aerobic phase.
Peristaltic pumps were also used for the influent and effluent. All reactors were seeded with full-
scale biological nutrient removal sludge from the West End Water Pollution Control Centre in
Winnipeg, CA, to an initial solids concentration of approximately 3 g-TSS/L. There was no
operational difference between the three reactors (i.e., R1, R2, and R3).

77
A low-strength proteinaceous synthetic wastewater composed of beef and yeast extracts
(Sigma Aldrich), ammonium chloride, and potassium phosphate dibasic was supplied to each of
the reactors from a common feed tank. Wastewater characteristics were 340±30 mg/L COD (n =
49), 42±5 mg/L TN (n = 48), and 7±1 mg/L TP (n = 48), on average. Wastewater supply lines
were disinfected regularly with diluted sodium hypochlorite solution (Javex) and wastewater was
stored for 3 d at 4 oC. A heat exchanger in the supply line raised wastewater temperature to 20 oC
before introduction to the SBR.
Analytical methods
Influent and effluent samples were analyzed for COD, sCOD, TN, and TP (TNTplus,
Hach, CA), TAN, nitrite, nitrate, and OP (Lachat QuikChem 8500, HACH, CA). Samples for
MLSS, MLVSS, and effluent TSS and VSS were analyzed according to Standard Methods [13].
Individual samples were quantified in triplicate to increase representation of analysis. Kinetic
tests examined sCOD, TAN, nitrite and nitrate nitrogen, and OP during regular operational
cycles. A SteREO Discovery (Zeiss, DE) was used for microscopic analysis. ImageJ software
was used to assess the cross-sectional area and DF of AGS (i.e.,

78
Appendix A). The cross-sectional area was used to compute DS. All samples that required
filtration were run through medium porosity Q5 filter paper (Fisher Scientific, CA). One-way
analysis of variance (VassarStats, USA) was used to determine if steady-state data was
significantly different (i.e., α = 0.05) between R1-R3 (i.e., Appendix B).

79
The OLR was calculated according to Equation 1. The F/M ratio was determined based
on Equation 2. Specific wasting rates were determined according to Equation 3. At steady-state
the whole sludge SRT was estimated by taking the inverse of RWAS – Equation 4. Estimates of
Ynet were determined according to Equation 5. Example calculations for rmax are presented in
Appendix C.
Equation 1
𝑂𝐿𝑅 𝑄 ∙ 𝐶𝑂𝐷
𝑉
Equation 2
𝐹/𝑀 𝑄 ∙ 𝐶𝑂𝐷𝑀𝐿𝑉𝑆𝑆 ∙ 𝑉
Equation 3
𝑟𝑀𝐿𝑆𝑆 ∙ 𝑉𝑄 ∙ 𝑇𝑆𝑆
Equation 4
𝑆𝑅𝑇 1
𝑟
Equation 5
𝑌𝑄 ∙ 𝑇𝑆𝑆𝑄 ∙ 𝐶𝑂𝐷

80
Results
Biomass characteristics and quantities
Biomass in R1-R3 increased from an inoculum concentration of 3 g-VSS/L to their
stabilized values. After 40 days of operation the MLVSS in R1-R3 stabilized and ranged from 4
g/L to 7 g/L – Figure 3. The highest MLVSS content was observed in R3 while R1 and R2 had
MLVSS ranging from 4-5 g/L. During steady-state the difference in MLVSS content between R1
and R3 (i.e., P = 0.0033), as well as R2 and R3 (i.e., P = 0.0141), were determined to be
significantly different even though operational conditions between R1-R3 were the same. The
steady-state MLVSS concentration was 4.2±0.8 g/L in R1, 5±1 g/L in R2, and 7±1 g/L in R3.
Figure 3 Steady-state MLSS and MLVSS in R1-R3. Error bars represent one standard deviation.

81
Effluent VSS in R1 during steady-state was 80±30 mg/L, while it was 60±20 mg/L in R2
and 50±10 mg/L in R3 – Figure 4. It should be noted that higher than usual effluent solids (i.e.,
usual being <25 mg/L with clarification) observed in R1-R3 were because selective wasting was
performed simultaneously with effluent discharge. Full-scale application would require an
independent selective wasting stage to avoid effluent solids that would exceed discharge
requirements. Typically, <25 mg/L of effluent TSS is specified for municipal wastewater
discharge. The difference in steady-state effluent VSS between R1-R3 was determined to be
significantly different (i.e., P = 0.0021).
Figure 4 Steady-state TSS and VSS in the effluents of R1-R3. Error bars represent one standard deviation.

82
The ratio of VSS to TSS in R1-R3 biomass was similar throughout the study. The
average VSS to TSS ratio in R1 was observed to be 0.78±0.03, while the VSS to RSS ratio in R2
and R3 were observed at 0.80±0.05 and 0.78±0.04, respectively, during steady-state. The
difference in VSS to TSS ratios between R1-R3 during steady-state was not significant (i.e., P =
0.4856). Interestingly, the ratio of VSS to TSS in the effluent of R1-R3 during steady-state was
observed to be higher than in the reactors. For instance, the VSS to TSS ratio in R1 effluent was
0.88±0.09, in R2 it was 0.92±0.08, and in R3 it was 0.89±0.09.
Although the difference in effluent VSS to TSS ratios was not significantly different
between R1-R3 (i.e., P = 0.5250), there was a significant difference in the VSS to TSS ratio
between the biomass in each reactor and the effluent solids from that reactor (i.e., P = 0.0195 for
R1; P = 0.0011 for R2; and P = 0.02 for R3). A higher fraction of inert material in the reactor
solids (i.e., lower VSS to TSS ratio) was expected in the MLSS since granular sludge was known
to accumulate inorganic precipitates [14] and also because inorganic particles settle faster and
would not be washed out by selective wasting. Furthermore, the fraction of selectively wasted
biomass would be expected to have high VSS to TSS ratios because the low SRT of 6 h applied
to slowly settling biomass would result in a more active fraction of slowly settling biomass since
less inert solids would accumulate [15].

83
A mature granular sludge had developed 40 d after inoculation with a suspended biomass
culture. The AGS remained stable for the entire 120 d of reactor operation, thereby
demonstrating that low-strength wastewater could promote the development and stability of
AGS. Previous studies observed degranulation at F/M below 0.4 g-COD/(g-VSS•d) with an
influent COD concentration, as yeast extract, of 400 mg/L [5]. Individual reactor F/Ms in this
study were 0.33 g g-COD/(g-VSS•d) in R1, 0.29 g g-COD/(g-VSS•d) in R2, and 0.18 g-COD/(g-
VSS•d) in R3 during steady-state with an influent COD concentration of 340 mg/L. All three
reactors maintained stable granular sludge below 0.4 g-COD/(g-VSS•d), thereby proving that
AGS could be operated at lower F/M without degranulation. These results agreed with other
studies that have recommended increased periods of famine to benefit AGS stability [6], [7].
There was a distinct increase in granule diameter for R1-R3 during start-up. Average DF
and DS were quantified for biomass in R1-R3 – Figure 5. During steady-state, average DF was
quantified as 1.3±0.3 mm in R1, 1.3±0.3 mm in R2, and 0.9±0.2 mm in R3. Similarly, average
DS were 1.0±0.2 mm in R1, 1.0±0.3 mm in R2, and 0.7±0.2 mm in R3. There was no significant
difference in the average diameters of granules in R1-R3 during steady-state. The ratio of DF to
DS was determined to be 1.3 in R1-R3. The larger was the ratio of DF to DS, the more irregular
were the particles. In general, granules appeared uniform with slight surface irregularities. These
results suggested that the degree of irregularity in R1-R3 was similar since the ratio of DF to DS
was determined to be the same.

84
Figure 5 Average diameter of granules from R1-R3. Error bars represent one standard deviation.
Biomass growth characteristics
Biomass growth kinetics were observed via rWAS and Ynet. All reactors experienced
similar trends in rWAS, with higher values and variability observed during start-up (i.e., the first
30 d from inoculation) and lower, less variable values for the remaining time and during steady-
state. Steady-state rWAS were determined to be 0.08±0.01 g-VSS/(g-VSS•d) in R1, 0.05±0.01 g-
VSS/(g-VSS•d) in R2, and 0.024±0.004 g-VSS/(g-VSS•d) in R3. Like MLSS in R1-R3 and TSS
in the effluent from R1-R3, rWAS was determined to be significantly different between R1-R3
during steady-state (i.e., P = 0.0003). However, the reason for this variation cannot be concluded
within the scope of the acquired data.

85
During steady-state the inverse of rWAS could be assumed as equal to the whole sludge
SRT. Although granules were not specifically wasted it was reasonable to assume that at steady-
state the decay material from microorganisms within the granule should have been in equilibrium
with the decay material in solution (i.e., selectively wasted material would have included decay
material from the granules at steady-state). Whole sludge SRT during steady-state was
determined to be 14±3 d for R1, while it was determined to be 20±4 d and 42±6 d for R2 and R3
respectively – Figure 6. Steady-state whole sludge SRT, like rWAS, were determined to be
significantly different between R1-R3 (i.e., P < 0.0001) even though there was no difference
between reactor operation. Steady-state Ynet for R1 was 0.25±0.06 g-VSS/g-COD while Ynet for
R2 and R3 were 0.20±0.06 g-VSS/g-COD and 0.13±0.03 g-VSS/g-COD, respectively. The
difference in steady-state Ynet between R1-R3 was determined to be significantly different (i.e., P
= 0.0175), although the reason for this difference cannot be determined from this dataset. As
expected, even if the significant difference between R1-R3 was not significant, Ynet decreased as
the whole sludge SRT increased.
Figure 6 Left – steady-state whole sludge SRT in R1-R3; Right – steady-state Ynet. Errors bars represent one standard deviation.

86
Phosphorus removal
Orthophosphate release and uptake rates were quantified during regular operational
cycles of R1-R3. Over time, from inoculation, similar trends were detected in specific rmax, OP rel.
and rmax, OP up.. Steady-state rmax, OP rel. and rmax, OP up. were closely related between reactors. The
steady-state specific rmax, OP rel. in R1 was observed to be 4±2 mg-P/(g-VSS•h), while in R2 and
R3 rmax, OP rel. was observed to be 5±2 mg-P/(g-VSS•h) and 4.2±0.9 mg-P/(g-VSS•h), respectively
– Figure 7. There was no significant difference between rmax, OP rel. in R1-R3 during this period
(i.e., P = 0.5309). Thus, unlike MLSS, effluent TSS, whole sludge SRT, and Ynet, the rmax, OP rel.
was not impacted by the factor causing significant differences in the other parameters. Other
parameters that were not significantly different between R1-R3 included DF and DS, and the ratio
of VSS to TSS in the reactors and in the effluent. Similarly, there was no significant difference in
rmax, OP up. (i.e., P = 0.6870). Steady-state rmax, OP up. were determined to be 5±1 mg-P/(g-VSS•h) in
R1, 4±1 mg-P/(g-VSS•h) in R2, and 4±1 mg-P/(g-VSS•h) in R3. By comparison, a study using
acetate as the sole carbon source obtained rmax, OP rel. of 14.7 mg-P/(g-VSS•h) and rmax, OP up. of 11
mg-P/(g-VSS•h) [10]. The use of less readily bioavailable yeast extract in this study, at a
COD:TP ratio of 48.6:1, could explain the lower phosphorus release and uptake rates compared
with the other study which used acetate at a COD:TP ratio of 68.8:1.

87
Figure 7 Left – steady-state rate of OP release.; Right – steady-state rate of OP uptake.. Errors bars represent one standard deviation.
Nitrogen removal
Ammonium utilization rates and nitrite/nitrate production rates were quantified during
regular operational cycles of R1-R3. The observed steady-state rmax, NOx prod. in R1 was 3.0±0.7
mg-N/(g-VSS•h), while it was 1.8±0.2 mg-N/(g-VSS•h) in R2, and 0.9±0.2 mg-N/(g-VSS•h) in
R3 – Figure 8. The difference in rmax, NOx prod. between R1-R3 was determined to be significantly
different (i.e., P = 0.0002). Thus, nitrite/nitrate production rates were added to the collective
group of parameters that were significantly different between R1-R3 despite operational
conditions being constant. Other significantly different parameters included whole sludge SRT
and Ynet.

88
Figure 8 Left – steady-state rmax, NOx-N prod. in R1-R3; Right – average TN removal, and the removal mechanisms, during steady-state. Error bars represent one standard deviation.
During steady-state effluent TAN was near or below the detection limit of 0.2 mg/L in
R1-R3. Furthermore, TAN in all three reactors during steady-state was near or below the
detection limit only 120 min into a single reactor cycle (i.e., aeration from 60-155 min of a single
reactor cycle). Thus, the lower rmax, NOx prod. observed were not due to less nitrification activity,
but instead due to the presence of SND (i.e., less nitrite/nitrate production was observed because
it was simultaneously being removed as nitrogen gas). The SND was quantified, relative to the
influent TN load, as 25±7% in R1 and 33±7% in R2, while it was 44±7% in R3. The observed
SND aligned with the decrease in nitrite/nitrate production rates. For instance, SND in R3 was
observed to be 1.8 times higher than R1 and the observed nitrite/nitrate production rate in R1
was observed to be 3.3 times higher than in R3.

89
Relationship between nutrient removal and biomass characteristics
These results demonstrated that AGS treating low-strength wastewater achieved low
effluent TP. During steady-state, effluent OP averaged 0.2±0.4 mg-P L-1. Furthermore, rmax, OP rel.
and rmax, OP up. between R1-R3 were similar despite significantly different steady-state MLSS
concentrations, whole sludge SRT, Ynet, and rmax, NOx prod.. It was interesting to note that despite
almost twice the MLSS in R3 compared to R1 that rmax, OP rel. and rmax, OP up. remained similar.
This suggested that the composition of MLSS, at least in terms of PAO, remained similar
between R1-R3 despite significant differences in other parameters. Also suggesting that the
composition of biomass between R1-R3 remained similar was the fact that VSS to TSS ratios of
biomass in R1-R3 were not significantly different.
However, there was a significant difference in rmax, NOx prod. even though reactors were
operated under the same conditions. It is important to note that despite significant differences in
rmax, NOx prod. and the observed SND that R1-R3 still removed a significant portion of TN. In fact,
TN removal was 57±6% in R1, 61±6% in R2, and 67±6% in R3. The differences in nitrification
kinetics and SND suggested that the composition of the biomass was significantly different
regarding nitrogen removal pathways. In general, nitrifying microorganisms make up a small
percentage of the microbial community in biological treatment systems [16]. The low percentage
of nitrifying microorganisms may have explained why other compositional parameters (i.e.,
phosphorus kinetics and VSS to TSS ratios) of the biomass in R1-R3 were not significantly
different, although this statement would only be true if the difference in rmax, NOx prod. was the
result of a shift in the nitrifying population. As previously discussed, however, the difference in
rmax, NOx prod. was most likely due to the onset of enhanced SND and not the result of differences
in nitrifying populations.

90
A difference in granule size could have influenced the amount of SND, and therefore rmax,
NOx prod., since larger granules may have provided more anoxic volume below the outer aerobic
layer for SND [17]. However, there was no significant difference in the steady-state average DF
or DS between R1-R3. Granules in R1 and R2 had average DF of 1.3±0.3 mm while the amount
of SND, relative to the influent TN load, was 25±7% in R1 and 33±7% in R2 while granules in
R3 were the smallest, with an average DF of 0.9±0.2 mm, and the amount of SND was the
highest at 44±7%. Thus, biomass with smaller average diameter had enhanced SND, which
contradicted the general theory that larger granules would have more anoxic volume and thereby
more SND. However, these results do agree with more recent studies that have demonstrated
limited denitrification rates in granules larger than 0.45 mm [18].
The observed relationships between SND and other significantly different parameters,
which included MLVSS concentrations, whole sludge SRT, and Ynet, alluded to some
justification behind the observed differences in nitrification kinetics and SND. It should be noted
that within the bounds of this study it was impossible to determine causation, and it could only
be concluded that the factor impacting SND between R1-R3 also impacted MLVSS, whole
sludge SRT, and Ynet. However, it was possible to speak to the relationship between the
parameters that were impacted. In general, there was strong correlation between these parameters
and SND – Figure 9. For instance, SND positively correlated with MLVSS (i.e., R2 = 0.9173)
and whole sludge SRT (i.e., R2 = 0.949), and negatively correlated with observed yield (i.e., R2 =
1).

91
Figure 9 Steady-state SND as a function of: MLVSS (top left); whole sludge SRT (top right); Ynet (bottom left); and Rmax, OP rel. (bottom right). Errors bars represent one standard deviation.
These relationships suggested that enhanced SND was associated with a larger quantity
of more slowly growing microorganisms (i.e., higher MLVSS and SRT, and lower Ynet). If these
interrelationships were coupled with the fact that rmax, OP rel. and rmax, OP up. were similar between
R1-R3, which meant that more mass, overall, of phosphorus was released/uptaken with

92
increasing MLVSS, it became apparent that SND positively correlated (i.e., R2 = 0.9973) with
Rmax, OP rel.. The apparent significance in difference between R1-R3’s Rmax, OP rel. was skewed by
the fact that Rmax, OP rel. was a combination of insignificantly different (i.e., rmax, OP rel.) and
significantly different (i.e., MLVSS) parameters. An interesting extension from this relationship,
where a higher mass of PAO was associated with enhanced SND, was that DPAO may have
contributed to the enhanced SND. Strictly by association, since there are no quantifiable
measures of their activity, it could also be suggested that more DGAO were present. These
suggestions would also be supported by the relationships between SND and whole sludge SRT
and Ynet since anoxic growth of microorganisms is known to occur at lower yields [19].
Summary
Overall, these results demonstrated the suitability of AGS to treat low-strength
wastewater (i.e., C/P <50) and assessed kinetics rates of nitrogen and phosphorus removal.
Effluent OP averaged 0.2±0.4 mg-P/L while effluent TIN averaged 17 mg-N/L. A mature
granular sludge formed within 40 d from inoculation with suspended biomass. The AGS
remained stable for the 120 d experimentation period, thereby contradicting previous studies that
suggested poor granulation and granule stability at low organic loads [5]. Granulation was stable
and successful at an average F/M of 0.25±0.08 g-COD/(g-VSS•d). Phosphorus kinetics were not
significantly different between R1-R3 but there was a significant difference in nitrification
kinetics and SND. Interestingly, TN removal was more sensitive than TP removal. Thus,
supplemental carbon may be required to achieve lower effluent nitrogen concentrations.

93
Bibliography
[1] N. Derlon, J. Wagner, R. H. R. da Costa, and E. Morgenroth, “Formation of aerobic
granules for the treatment of real and low-strength municipal wastewater using a
sequencing batch reactor operated at constant volume,” Water Res., vol. 105, pp. 341–350,
2016.
[2] Q. He, S. Zhang, Z. Zou, L. an Zheng, and H. Wang, “Unraveling characteristics of
simultaneous nitrification, denitrification and phosphorus removal (SNDPR) in an aerobic
granular sequencing batch reactor,” Bioresour. Technol., vol. 220, pp. 651–655, 2016.
[3] M. Pronk, M. K. de Kreuk, B. de Bruin, P. Kamminga, R. Kleerebezem, and M. C. M. van
Loosdrecht, “Full scale performance of the aerobic granular sludge process for sewage
treatment,” Water Res., vol. 84, pp. 207–217, 2015.
[4] S. Bengtsson, M. de Blois, B. M. Wilén, and D. Gustavsson, “A comparison of aerobic
granular sludge with conventional and compact biological treatment technologies,”
Environ. Technol. (United Kingdom), vol. 0, no. 0, pp. 1–10, 2018.
[5] A. Jafari Kang and Q. Yuan, “Long-term stability and nutrient removal efficiency of
aerobic granules at low organic loads,” Bioresour. Technol., vol. 234, pp. 336–342, 2017.
[6] S. F. Corsino, A. di Biase, T. R. Devlin, G. Munz, M. Torregrossa, and J. A.
Oleszkiewicz, “Effect of Extended Famine Conditions on Aerobic Granular Sludge
Stability in the Treatment of Brewery Wastewater,” Bioresour. Technol., 2016.
[7] G. Di Bella and M. Torregrossa, “Simultaneous nitrogen and organic carbon removal in
aerobic granular sludge reactors operated with high dissolved oxygen concentration,”
Bioresour. Technol., vol. 142, pp. 706–713, 2013.

94
[8] J. Leong, B. Rezania, and D. S. Mavinic, “Aerobic granulation utilizing fermented
municipal wastewater under low pH and alkalinity conditions in a sequencing batch
reactor.,” Environ. Technol., vol. 37, no. 1, pp. 55–63, 2016.
[9] T. R. Devlin, A. di Biase, M. S. Kowalski, and J. A. Oleszkiewicz, “Granulation of
activated sludge under low hydrodynamic shear and different wastewater characteristics,”
Bioresour. Technol., vol. 224, 2017.
[10] M. Lashkarizadeh, Q. Yuan, and J. A. Oleszkiewicz, “Influence of carbon source on
nutrient removal performance and physical-chemical characteristics of aerobic granular
sludge.,” Environ. Technol., vol. 36, no. 17, pp. 2161–2167, 2015.
[11] C. Zhang, H. Zhang, and F. Yang, “Optimal cultivation of simultaneous ammonium and
phosphorus removal aerobic granular sludge in A/O/A sequencing batch reactor and the
assessment of functional organisms,” Environ. Technol. (United Kingdom), vol. 35, no.
15, pp. 1979–1988, 2014.
[12] B. Peng, H. Liang, S. Wang, and D. Gao, “Effects of DO on N2O emission during
biological nitrogen removal using aerobic granular sludge via shortcut simultaneous
nitrification and denitrification,” Environ. Technol., vol. 3330, pp. 1–17, 2018.
[13] APHA, AWWA, and WEF, Standard Methods for the examination of water &
wastewater, 22nd ed. 2012.
[14] W. Huang et al., “Species and distribution of inorganic and organic phosphorus in
enhanced phosphorus removal aerobic granular sludge,” Bioresour. Technol., vol. 193, pp.
549–552, 2015.
95
[15] H. Ge, D. J. Batstone, M. Mouiche, S. Hu, and J. Keller, “Nutrient removal and energy
recovery from high-rate activated sludge processes – Impact of sludge age,” Bioresour.
Technol., vol. 245, no. August, pp. 1155–1161, 2017.
[16] S. D’Anteo et al., “Nitrifying biomass characterization and monitoring during
bioaugmentation in a membrane bioreactor,” Environ. Technol. (United Kingdom), vol.
36, no. 24, pp. 3159–3166, 2015.
[17] J. Zou, Y. Li, L. Zhang, R. Wang, and J. Sun, “Understanding the impact of influent
nitrogen concentration on granule size and microbial community in a granule-based
enhanced biological phosphorus removal system,” Bioresour. Technol., vol. 177, pp. 209–
216, 2015.
[18] Z.-H. Li, Y.-M. Zhu, Y.-L. Zhang, Y.-R. Zhang, C.-B. He, and C.-J. Yang,
“Characterization of aerobic granular sludge of different sizes for nitrogen and phosphorus
removal,” Environ. Technol., vol. 0, no. 0, pp. 1–10, 2018.
[19] X.-L. Wang, T.-H. Song, and X.-D. Yu, “The biomass fraction of phosphate-accumulating
organisms grown in anoxic environment in an enhanced biological phosphorus removal
(EBPR) system,” Desalin. Water Treat., vol. 56, no. 7, pp. 1877–1887, 2015.

96
Chapter 3: Impact of OLR on an AGS-SBR at low hydrodynamic shear
force
Introduction
The importance of hydrodynamic shear force, typically quantified by USAV, for AGS
processes has been popularized in the literature. Upflow superficial air velocity is simply the
airflow divided by the cross-sectional area, perpendicular to the airflow, of the reactor.
Consensus is that as shear force increases more compact and stable granules are produced. For
instance, granulation was not observed in an AGS-SBR treating acetate based substrate when
USAV was less than 1.2 cm/s, while the most dense and stable granules were cultivated at
USAV of 3.6 cm/s [1]. Similar results were reported in an AGS-SBR treating acetate based
substrate when subjected to USAV of 0.8, 1.6, 2.4, and 3.2 cm/s [2]. In that study, granules were
observed at 0.8-1.6 cm/s USAV but they were reported to be unstable, while the most stable and
dense granules were reported at USAV of 3.2 cm/s. Other studies have reported stable granules
at USAV of 2.1-2.8 cm/s in AGS-SBR [3], [4]. However, none of the studies have provided clear
justification as to why higher USAV, and therefore higher hydrodynamic shear force, was
beneficial for granulation.

97
Confounding the role of hydrodynamic shear force on AGS formation and stability are
studies that have reported stable granules without significant hydrodynamic shear forces. For
example, stable granules were observed in an AGS-SBR treating acetate based substrate when
USAV was 0.42 cm/s [5]. However, it should be noted that filamentous growth was observed in
the same study when carbon was not completely removed during the anaerobic influent
distribution phase. Another study varied hydrodynamic shear force in an AGS-SBR by
alternating aeration on and off to maintain DO >2 mg/L [6]. This study unintentionally
demonstrated that the importance of hydrodynamic shear force may be linked not only to
magnitude, but also to contact time. Based on dichotomy in the literature regarding the
importance of high hydrodynamic shear force for AGS, a unified theory on the role of
hydrodynamic shear force under different process conditions would benefit future AGS
applications and studies.
The mechanism through which high hydrodynamic shear force benefits AGS may be by
decoupling SRT of the fast-growing microorganisms that tend to accumulate on the surface of
granules from the slow-growing microorganisms fixed within the granular matrix. For example,
minimum SRT at 20 oC for OHO can be as low as 9 h when considering their net growth rate
under non-limiting conditions based on conventional activated sludge models [7]. Thus, there
would always be significant potential for free living, fast-growing microorganisms, to
accumulate in suspension and become associated with the surface of granules. This issue of fast-
growing microorganisms could even manifest itself when subjected to high washouts in low
HRT systems, such as AGS-SBR configurations [8], [9].

98
Therefore, when the potential for fast-growing microorganisms to propagate in the AGS-
SBR is high, which would be the case at higher substrate availability and therefore higher OLR,
more hydrodynamic shear force may be beneficial. By scouring fast-growing microorganisms
from granule surfaces, so that fast-growing microorganisms may be subsequently washed out via
selective wasting, higher hydrodynamic shear force may help stabilize AGS. For these reasons,
the objective of this study was to examine the impact of increasing wastewater strength, and
therefore the OLR, on granular sludge formation and stability at low hydrodynamic shear force.
Physical observations, microscopic analysis, effluent characteristics, and biomass kinetics were
recorded for each SBR over a period of three to four months. A mechanism for the role of shear
force in granulation was proposed and evaluated based on experimental results.
Methods
Reactor design
The experiment used AGS-SBRs with working volumes of 4 L. Five reactors were
constructed from 4” (i.e., 10.16 cm) diameter acrylic tube welded to square acrylic sheet base: 1)
low-strength 1 (i.e., LSR1); 2) low-strength 2 (i.e., LSR2); 3) low-strength 3 (i.e., LSR3); 4)
medium-strength (i.e., MSR); and 5) high-strength (i.e., HSR). A VER of 50% was maintained
by discharging via the 2 L access port. The top 2 L of supernatant was discharged in less than 5
min following a 3 min settling period. Upflow fluid velocities were 0.41 cm/min relative to the
perpendicular cross-sectional area of the reactors. The remaining time was utilized for aerobic
reaction, where air was supplied by magnetic piston pumps at a controlled rate of 2 L/min. Air
was delivered through three, 3 cm diameter spherical stone diffusers located on the reactor floor.
The resulting USAV was 0.41 cm/s. Aeration provided complete mixing and generated
conditions in which DO reached saturation.

99
Each reactor operated on a 3 h (i.e., 180 min) cycle which consisted of 60 min anaerobic
feeding, 110 min aerobic reaction, 3 min settling, 5 min discharging, and 2 min idling. Cycles
were controlled via outlet timers (Traceable Digital Outlet Controller, Fisher Scientific, CA).
The pH was monitored (Eutech pH Controller, Thermo Scientific, USA) and maintained at less
than 7.30±0.05 during the aerobic reaction phase using sulfuric acid dosed by peristaltic pumps
(Masterflex, Cole-Parmer, CA). Peristaltic pumps were also used for the influent and effluent.
All reactors were seeded with full-scale biological nutrient removal sludge from the West End
Water Pollution Control Centre in Winnipeg, CA, to an initial solids concentration of
approximately 3 g-TSS/L.
Feed characteristics
Three different synthetic wastewaters simulating low-, medium-, and high-strength
wastewaters were supplied to each of the reactors. Three of the reactors (i.e., LSR1-LSR3)
received low-strength wastewater composed of beef and yeast extracts (Sigma Aldrich),
ammonium chloride, and potassium phosphate dibasic. The low-strength wastewater
characteristics were 340±30 mg/L COD (n = 49), 320±30 mg/L sCOD (n = 49), 42±5 mg/L TN
(n = 48), and 7±1 mg/L TP (n = 48), on average. The OLR for LSR1-LSR3 was 1.4 kg-
COD/(m3•d).
MSR received medium-strength wastewater composed of sodium acetate anhydrous,
ammonium chloride, and potassium phosphate dibasic, which was representative of the substrate
employed in previous lab-scale AGS studies [3], [4], [10]. In those previous lab-scale studies,
granulation was successful on the synthetic wastewater at high USAV. Characteristics of the
medium-strength wastewater were 630±80 mg/L COD and sCOD (n = 37), 80±10 mg/L TN (n =
37), and 13±3 mg/L TP (n = 37). The OLR for MSR was 2.5 kg-COD/(m3•d).

100
HSR received high-strength wastewater composed of fermenter underflow from the Fort
Garry Brewing Company in Winnipeg, CA. The high-strength wastewater contained 1300±300
mg/L COD (n = 42), 1200±200 mg/L sCOD (n = 42), 50±20 mg/L TN (n = 40), and 6±2 mg/L
TP (n = 40), on average. The OLR for HSR was 5.2 kg-COD/(m3•d).
Every synthetic wastewater was supplemented with alkalinity as sodium bicarbonate and
trace elements [11]. Particulate matter was minimized in the synthetic wastewaters since it has
been demonstrated to affect AGS surface properties and would therefore confound results.
Specifically, it was observed that particulate matter sorbed to granule surfaces and slowly
hydrolysed during aeration, encouraging irregular bumps to form on the granule surface where
particulates had been enveloped [12].
Analytical methods
Influent and effluent samples were analyzed for COD, sCOD, TN, TP (TNTplus, Hach,
CA), TAN, nitrite nitrogen, nitrate nitrogen, and OP (Lachat QuikChem 8500, HACH, CA).
Samples for MLSS, MLVSS, and effluent TSS and VSS were analyzed according to Standard
Methods [13]. A SteREO Discovery (Zeiss, DE) was used for microscopic analysis. All samples
that required filtration were run through medium porosity Q5 filter paper (Fisher Scientific, CA).
Volatile fatty acids were determined by a Breeze 2 HPLC system (Waters, Milford, MA, USA)
equipped with an Aminex HPX-87H column using 5 mM H2SO4 as the mobile phase, calibrated
using a VFA standard 10 mM mixture (Supelco, Bellefonte, USA). Anaerobic sCOD utilization
was estimated according to Equation 6. Values for r were estimated according to Equation 7,
where S could be COD, TN, or TP.

101
Equation 6
𝐴𝑛𝑎𝑒𝑟𝑜𝑏𝑖𝑐 𝑠𝐶𝑂𝐷 𝑢𝑡𝑖𝑙𝑖𝑧𝑎𝑡𝑖𝑜𝑛 1𝑠𝐶𝑂𝐷 ∙ 𝑉
𝑠𝐶𝑂𝐷 ∙ 𝑉 𝑠𝐶𝑂𝐷 ∙ 𝑉∙ 100
Equation 7
𝑟𝑄 ∙ 𝑆 𝑆
𝑀𝐿𝑉𝑆𝑆 ∙ 𝑉
Results
General performance
Reactors LSR1-LSR3 maintained effluent sCOD concentrations below 50 mg/L
throughout the study. Soluble TN in the effluent consistently decreased during operation, as did
mixed liquor suspended solids increase. In LSR3, effluent sTN reached concentrations below 12
mg/L. Effluent sTP stabilized in 20 d for all three SBR receiving low-strength wastewater. There
were fluctuations above the average effluent sTP, especially for LSR2. Changes in effluent sTP,
as well as sTN and VSS, for LSR2 were attributed to two unique operational failures: 1) aeration
failed for at least 48 h on day 61; and 2) feed had stopped for 24 h on day 104. The first failure
resulted in decreased nitrification, and consequently decreased effluent nitrate and increased
effluent sTN. As nitrification recovered effluent sTN in LSR2 began to decrease and effluent
nitrate began to increase. By day 76 the transition back to full nitrification had upset phosphorus
removal, likely due to the return of nitrate in the effluent. Cultivation of PAO, as demonstrated
by low effluent sTP, correlated with the maturation of aerobic granules in all SBR receiving low-
strength wastewater. Effluent VSS stabilized after 40 d and VSS below 30 mg/L in the effluent
were only achieved in LSR3. High effluent TSS and VSS in all reactors can be attributed to
selective wasting occurring simultaneously with effluent discharge.
102
MS also achieved consistent effluent sCOD below 50 mg/L for the entire study. Effluent
sTN was observed to stabilize early on, with fluctuations in concentration matching the trend in
influent TN. Soluble TN in the effluent did not go below 40 mg/L, suggesting poor nitrogen
removal capabilities. Phosphorus removal had initially stabilized after 20 d, although effluent
sTP was observed to increase after 36 d. Effluent sTP decreased again after 66 d. The trend in
effluent sTP matched what was observed in effluent VSS. Effluent VSS peaked above 600 mg/L
after 40 d before dropping to 150 mg/L after 60 d. The initial cultivation of PAO matched the
appearance of granules in MSR, while the appearance of filamentous growth on the surface of
granules aligned with the increase in effluent sTP and VSS.
Effluent sCOD in HSR did not stabilize until day 30. Following stabilization, effluent
sCOD remained below 200 mg/L. Both sTN and sTP in the effluent of HSR correlated with TN
and TP in the feed. Total nitrogen and TP in the high-strength wastewater were low relative to
COD in the influent. Thus, removal of TN and TP in HSR were mainly attributed to assimilation
into new biomass. Effluent VSS fluctuated often and stabilized around 300 mg/L. Effluent VSS
also peaked after 70 d, reaching 900 mg/L. High effluent VSS in HSR suggested a highly
unstable biomass consisting of fast-growing microorganisms.
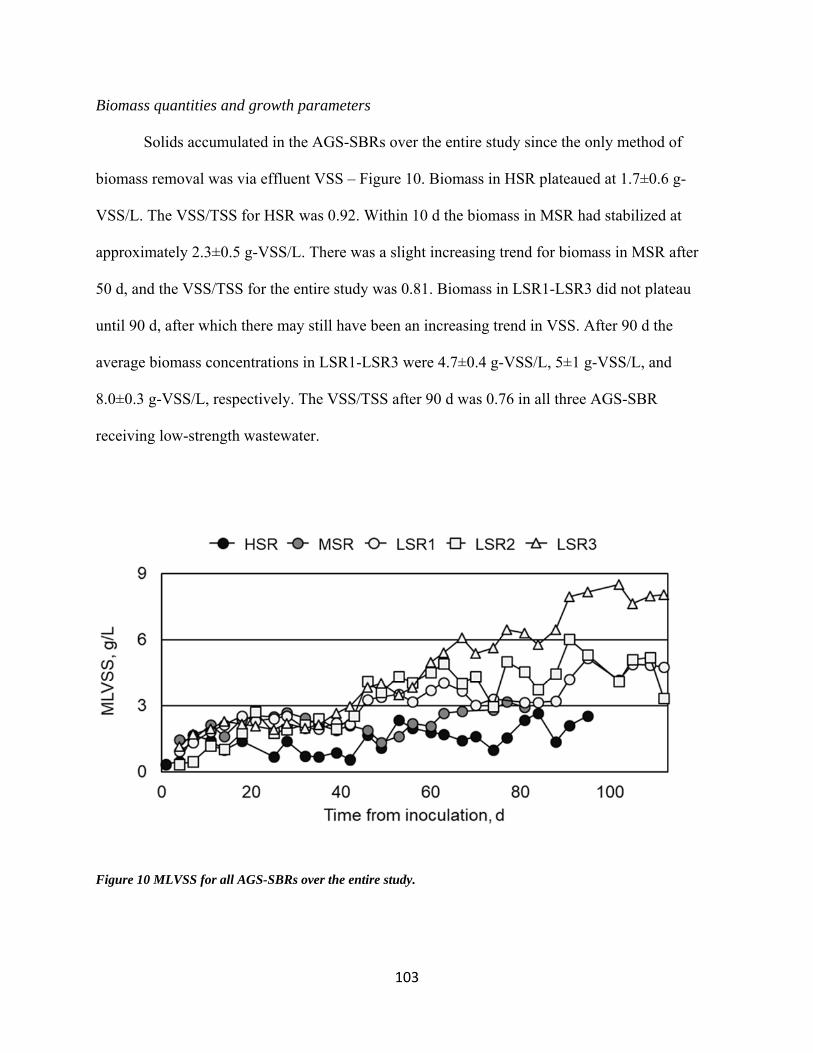
103
Biomass quantities and growth parameters
Solids accumulated in the AGS-SBRs over the entire study since the only method of
biomass removal was via effluent VSS – Figure 10. Biomass in HSR plateaued at 1.7±0.6 g-
VSS/L. The VSS/TSS for HSR was 0.92. Within 10 d the biomass in MSR had stabilized at
approximately 2.3±0.5 g-VSS/L. There was a slight increasing trend for biomass in MSR after
50 d, and the VSS/TSS for the entire study was 0.81. Biomass in LSR1-LSR3 did not plateau
until 90 d, after which there may still have been an increasing trend in VSS. After 90 d the
average biomass concentrations in LSR1-LSR3 were 4.7±0.4 g-VSS/L, 5±1 g-VSS/L, and
8.0±0.3 g-VSS/L, respectively. The VSS/TSS after 90 d was 0.76 in all three AGS-SBR
receiving low-strength wastewater.
Figure 10 MLVSS for all AGS-SBRs over the entire study.

104
In long SRT systems, such as AGS-SBR where granular sludge wasting does not occur,
biomass would be expected to accumulate as OLR increased. These results point to the opposite
for AGS cultivated in SBR and subjected to low USAV. This phenomenon was caused by the
selection pressure applied to select for dense, rapidly settling biomass typical of AGS processes.
Given the stochastic nature of solids separation during settling, compounded with USAV not
being high enough to sufficiently scour fast-growing microorganisms from granule surfaces, fast-
growing microorganisms were able to form a stable population in HSR and MSR despite low
HRT of 6 h and therefore 6 h SRTSW. The shift in kinetic nature of the biomass was best
demonstrated by rWAS. Values for rWAS were 1.04 g-VSS/(g-VSS-•d) and 0.28 g-VSS/(g-VSS•d)
during the last month of operation for HSR and MSR, respectively. Values for rWAS in LSR1-
LSR3 was 0.06 g-VSS/(g-VSS•d), 0.10 g-VSS/(g-VSS•d), and 0.02 g-VSS/(g-VSS•d),
respectively, for the last month of operation. At steady-state, a relationship between rWAS and
SRT could be assumed. Thus, the whole sludge SRT during the final month of operation was
0.96 d for HSR, 3.6 d for MSR, 17 d for LSR1, 10 d for LSR2, and 50 d for LSR3.
Physical appearance and microscopic analysis
Significant changes in biomass morphology were observed within as little as one week.
High solids washout was likely the most influential parameter governing initial changes in the
biomass community. Since wastewater characteristics were constant the initial solids washout
resulted in F/M peaked at 14 kg-COD/(kg-VSS-•d) in HSR and 2.4 kg-COD/(kg-VSS-•d) in
MSR. Food to microorganism ratios in LSR1-LSR3 peaked 1.4 kg-COD/(kg-VSS-•d), 3.9 kg-
COD/(kg-VSS-•d), and 1.2 kg-COD/(kg-VSS-•d), respectively. The F/M was higher in LSR2
because it experienced more solids washout initially. For instance, MLVSS was 0.9±0.2 g/L,
0.3±0.1 g/L, and 1.14±0.03 g/L in LSR1-LSR3, respectively, four days after inoculation.

105
Previous studies have suggested that high F/M benefits the conversion of flocculent
biomass to granules [10]. High F/M during granulation may have allowed for the accumulation
of EPS since there would have been less EPS consumption during the aerobic period [14].
Extracellular polymeric substances are known to be an important component of AGS structure.
Accumulation of biomass in the AGS-SBR caused F/M to decrease with time, potentially
resulting in lower net production of EPS due to aerobic consumption. Lowest observed F/M in
HSR and MSR was 1.8 kg-COD/(kg-VSS-•d) and 0.76 kg-COD/(kg-VSS-•d), respectively. In
LSR1-LSR3 the lowest F/M observed were 0.23 kg-COD/(kg-VSS-•d), 0.23 kg-COD/(kg-VSS-
•d), and 0.15 kg-COD/(kg-VSS-•d), respectively.
Influent characteristics may have also played a significant role in the initial stages of
HSR. Growth was most likely limited by nitrogen and phosphorus concentrations even though
there was an abundance of organic carbon available for OHO to grow. Chemical oxygen demand
to nitrogen ratio and COD/TP for the high-strength wastewater averaged 50±20 and 300±80,
respectively, for the first 40 d. A ratio of 100 COD/10 TN/1 TP was reported to be ideal for AGS
treating brewery wastewater, suggesting that the COD/TN and COD/TP were much higher in this
study and therefore nitrogen and phosphorus may have been limiting [15]. Mature granulation
occurred within 40 d in all but HSR. The physical appearance of biomass, besides colour, was
almost indistinguishable between MSR and LSR1-LSR3. Granules in MSR appeared whitish-
brown while the low-strength wastewater generated yellowish-brown granules. Large granules
were observed in HSR after 2 d. However, after a month HSR was characterized by a viscous,
white substance with filamentous microorganisms. The material in HSR was most likely a
mixture of EPS and some active cells.

106
The characteristics of biomass in HSR did not improve for the remainder of the study.
Granules with diameters of 0.5-5 mm were observed in all other AGS-SBR, although granule
surface properties varied significantly between reactors receiving medium- and low-strength
wastewater. Granules in MSR maintained a filamentous surface layer, which was observed one
month after inoculation. On the other hand, granules in LSR1-LSR3 appeared smooth and highly
compact. On low-strength wastewater LSR3 had the best granules in terms of appearance, while
LSR2 had the worst. It should be recalled, however, that there were two distinct operational
failures for LSR2 that interfered with stabilization of granular sludge. Therefore, conclusions
cannot be directly drawn from the results of LSR2 versus LSR1 and LSR3.
Overall, physical and microscopic analysis of biomass in the five AGS-SBR confirmed
the suggested theory for the role of shear in granular sludge formation and stability. Smooth,
uniform granules were observed in all three AGS-SBR treating low-strength wastewater even
though the applied USAV was low. Granule appearance progressively degraded from LSR to
MSR and then to HSR, respectively. Surface fouling was observed in MSR, suggesting that the
applied hydrodynamic shear force was not enough to remove rapidly growing, filamentous
microorganisms from granule surfaces. These results demonstrated that high hydrodynamic shear
forces are not always a necessity for granulation, although they may benefit granular formation
and stability depending on wastewater characteristics, such as carbon content.

107
Specific removal rates and nutrient profiles
Removal of COD, TN, and TP were recorded to compare biomass activity at different
OLR. Based on effluent sCOD the HSR removed 62% of COD within the first month. Effluent
VSS increased consistently with influent COD load. Lowest effluent VSS and highest MLVSS
was observed in LSR3 while the worst effluent VSS and lowest MLVSS was recorded in HSR.
Organic carbon removal in HSR stabilized by the second month. Percent COD removal was
89%, 85%, and 85% in the second, third, and fourth month, respectively, based on effluent
sCOD. Removal of organic carbon in MSR stabilized quickly. Chemical oxygen demand
removal of 92%, 94%, and 94% was observed in the first, second, and third month, respectively,
based on effluent sCOD. Organic carbon removal also stabilized quickly in LSR1-LSR3. Percent
removal based on effluent sCOD ranged from 87% to 92% in all three low-strength AGS-SBR
during the four months of analysis.
Nitrogen and phosphorus removal in HSR were likely carried out entirely by
adsorption/assimilation. Biological phosphorous removal was observed in MSR but nitrification
was not. The mechanism of nitrogen removal in MSR was therefore entirely based on
assimilation, since particulate nitrogen was not present in the feed. Total phosphorous removal in
MSR increased consistently from 31% to 69% to 85% in the first, second, and third month,
respectively, while nitrogen removal beyond 35% was not observed.

108
Biological phosphorous removal, nitrification, and denitrification were observed in all
three AGS-SBR treating low-strength wastewater. Phosphorous removal during the first month
was 71%, 53%, and 87% in LSR1, LSR2, and LSR3, respectively. For the remaining three
months phosphorous removal ranged from 85% to 99% in all three AGS-SBR. This range
excluded the last month of data for LSR2 because of the operational failures discussed
previously. Nitrogen removals of 52%, 42%, and 52% were observed during the first month in
LSR1, LSR2, and LSR3, respectively. The range of nitrogen removal for all three AGS-SBR
treating low-strength wastewater during the last three months was 50% to 68%. Denitrification
was most significant in LSR3, with denitrification having carried out approximately 35% of TN
removal during the anaerobic feeding period.
Performance measures for the five AGS-SBR during granulation agreed with results from
microscopic analysis, and thus further strengthened the theory for the role of shear in granule
sludge formation and stability. Performance in HSR was poor, with undesirable biomass
characteristics and high effluent solids contributing to effluent COD. MSR performed better than
HSR, although the lack of nitrification in MSR indicated deficiencies in treatment capacity. The
layer of filamentous microorganisms on the surface of granules in MSR could have contributed
to mass transfer limitations and therefore preferential oxidation of carbon instead of ammonium
in the thin aerobic layer of the biofilm. The best performing SBR were LSR1-LSR3, with
significant organic carbon removal, nitrification, biological phosphorous removal, as well as
some denitrification. Performance measures further demonstrated that granulation does not
always require high hydrodynamic shear force, and rather that hydrodynamic shear force may
play a more important role in granule formation and stability in the presence of higher OLR to
the aerobic zone.

109
Figure 11 Specific COD, TN, and TP removal rates for each AGS-SBR during the last month of operation (i.e., steady-state). Error bars represent one standard deviation.

110
Specific COD, TN, and TP removal rates in HSR were highly variable – Figure 11. This
can be attributed to fluctuation in effluent VSS and therefore constantly fluctuating MLSS and
MLVSS quantities. Specific removal rates in all other AGS-SBR, besides HSR, were much more
stable. Removal rates for COD and TP were higher in MSR than in the three AGS-SBR
receiving low-strength wastewater. Specific TN removal rates were comparable between MSR
and the three AGS-SBR receiving low-strength wastewater. In terms of physical appearance,
LSR3 had the most smooth and uniform granules. In terms of performance LSR3 also had the
lowest rCOD of 0.16 kg-COD/(kg-VSS•d), rTN of 17 g-TN/(kg-VSS•d), and rTP of 3.1 g-TP/(kg-
VSS•d). Thus, it can be concluded that slower growing microorganisms with lower specific
removal rates contributed to more stable granulation.
Soluble COD in HSR increased during the anaerobic influent distribution phase by up to
25% from what would have been expected if the new feed and previous effluent were combined
without considering microbial activity (e.g., biodegradation or uptake of COD) – Figure 12. The
most likely explanation was that particulate matter, in the feed or leftover from the previous
cycle, hydrolyzed during the anaerobic influent distribution phase. Complete breakdown of
particulate organics in HSR during the aerobic phase was unlikely since F/M never dropped
below 1.8 kg-COD/(kg-VSS-•d). Thus, there could have been leftover particulate COD from the
previous cycle or organic products of microbial origin that were hydrolyzed during anaerobic
influent distribution. Furthermore, since there was no nitrification in HSR, COD would not have
been utilized for denitrification. Therefore, the anaerobic influent distribution phase of HSR
operated as a contact/fermentative period.
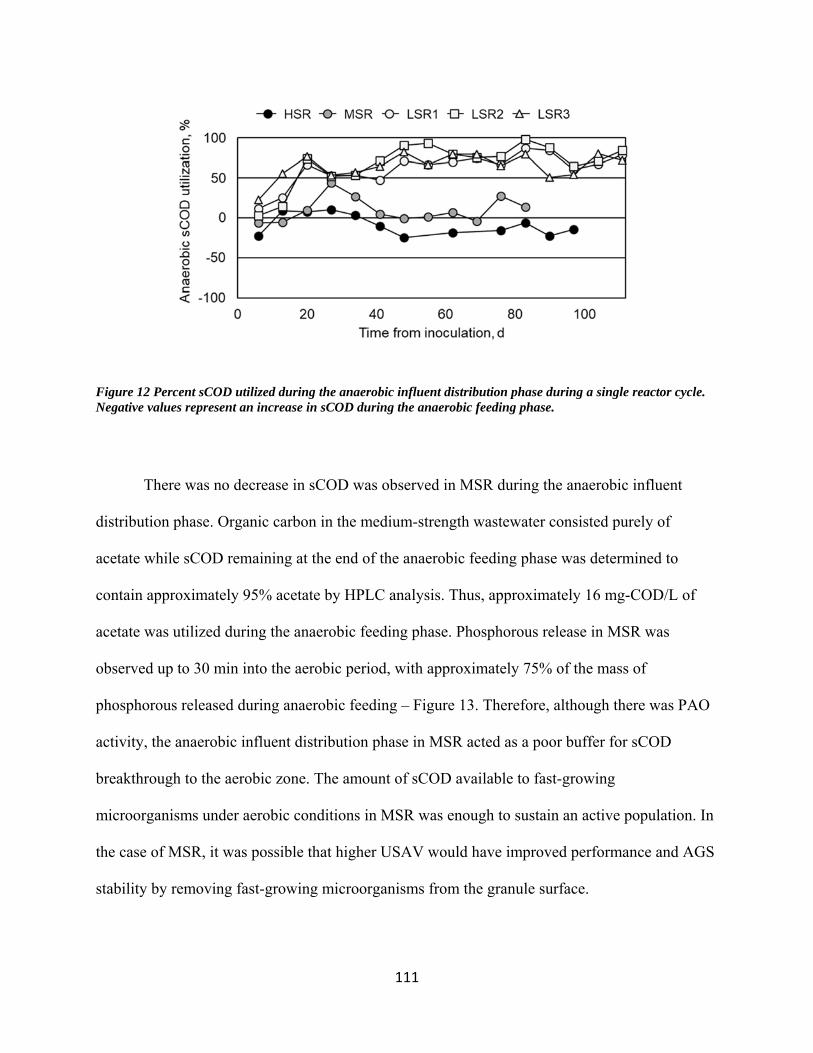
111
Figure 12 Percent sCOD utilized during the anaerobic influent distribution phase during a single reactor cycle. Negative values represent an increase in sCOD during the anaerobic feeding phase.
There was no decrease in sCOD was observed in MSR during the anaerobic influent
distribution phase. Organic carbon in the medium-strength wastewater consisted purely of
acetate while sCOD remaining at the end of the anaerobic feeding phase was determined to
contain approximately 95% acetate by HPLC analysis. Thus, approximately 16 mg-COD/L of
acetate was utilized during the anaerobic feeding phase. Phosphorous release in MSR was
observed up to 30 min into the aerobic period, with approximately 75% of the mass of
phosphorous released during anaerobic feeding – Figure 13. Therefore, although there was PAO
activity, the anaerobic influent distribution phase in MSR acted as a poor buffer for sCOD
breakthrough to the aerobic zone. The amount of sCOD available to fast-growing
microorganisms under aerobic conditions in MSR was enough to sustain an active population. In
the case of MSR, it was possible that higher USAV would have improved performance and AGS
stability by removing fast-growing microorganisms from the granule surface.

112
Figure 13 Mass of OP in solution for a single operational cycle on day 76. Anaerobic influent distribution occurred from 0-60 min and aeration was applied from 60-170 min. Initial values (i.e., t = 0 min) included the entire mass of OP supplied during the anaerobic influent distribution phase. Error bars represent one standard deviation.
Significant anaerobic sequestration of sCOD from bulk solution was observed in LSR1-
LSR3. Specifically, 55% to 70% of the incoming sCOD load was removed from bulk solution
during the anaerobic influent distribution. Some sCOD would have been utilized for
denitrification of residual nitrates and phosphorous release by PAO, while the remaining sCOD
could have diffused from bulk solution into the pore space of granules. Regardless of the
mechanism behind anaerobic carbon utilization, the load of carbon utilized in LSR1-LSR3 was
enough to prevent overgrowth of fast-growing microorganisms during aeration and therefore
maintain stable granules under low USAV. Therefore, high hydrodynamic shear force was not
required for stable granulation on the low-strength wastewater, while higher hydrodynamic shear
force would most likely have improved the quality of biomass in HSR and MSR.

113
Summary
It was demonstrated that high hydrodynamic shear force, characterized by high USAV,
was not required for granulation. Mature AGS developed within 40 d and was stable for the
entire 120 d experiment when an OLR of 1.4 kg-COD/(m3•d) was applied. At OLR of 2.5 kg-
COD/(m3•d) granulation was successful, although the granules were characterized by a
filamentous surface layer and no nitrification. Furthermore, at OLR of 5.2 kg-COD/(m3•d)
granules quickly disintegrated 2 d from inoculation and the biomass took on a white, viscous
appearance with filamentous microorganisms. Thus, higher hydrodynamic shear force would
likely benefit AGS processes with OLR of 2.5 kg-COD/(m3•d) and higher, since the shear force
would act to remove fast-growing, filamentous microorganisms from AGS surfaces. Lastly, it
was demonstrated that the most stable AGS had the lowest specific removal rates of COD, TN,
and TP. Therefore, it was important to consider that although AGS allows for process
intensification, the intensification is predicted by retention of a large quantity of slow-growing
microorganisms.

114
Bibliography
[1] H. Tay and S. Liu, “The effects of shear force on the formation, structure and metabolism
of aerobic granules,” pp. 227–233, 2001.
[2] Y. Chen, W. Jiang, D. T. Liang, and J. H. Tay, “Structure and stability of aerobic granules
cultivated under different shear force in sequencing batch reactors,” Appl. Microbiol.
Biotechnol., vol. 76, no. 5, pp. 1199–1208, 2007.
[3] S. Lochmatter, G. Gonzalez-Gil, and C. Holliger, “Optimized aeration strategies for
nitrogen and phosphorus removal with aerobic granular sludge,” Water Res., vol. 47, pp.
6187–6197, 2013.
[4] S. Lochmatter and C. Holliger, “Optimization of operation conditions for the startup of
aerobic granular sludge reactors biologically removing carbon, nitrogen, and
phosphorous.,” Water Res., vol. 59, pp. 58–70, Aug. 2014.
[5] O. Henriet, C. Meunier, P. Henry, and J. Mahillon, “Improving phosphorus removal in
aerobic granular sludge processes through selective microbial management,” Bioresour.
Technol., vol. 211, pp. 298–306, 2016.
[6] D. Wei, L. Shi, T. Yan, G. Zhang, Y. Wang, and B. Du, “Aerobic granules formation and
simultaneous nitrogen and phosphorus removal treating high strength ammonia
wastewater in sequencing batch reactor,” Bioresour. Technol., vol. 171, pp. 211–216,
2014.
[7] Envirosim, “BioWin 5.0.” 2017.
[8] M. Pronk, B. Abbas, S. H. K. Al-zuhairy, R. Kraan, R. Kleerebezem, and M. C. M. van

115
Loosdrecht, “Effect and behaviour of different substrates in relation to the formation of
aerobic granular sludge,” Appl. Microbiol. Biotechnol., vol. 99, no. 12, pp. 5257–5268,
2015.
[9] M. Pronk, M. K. de Kreuk, B. de Bruin, P. Kamminga, R. Kleerebezem, and M. C. M. van
Loosdrecht, “Full scale performance of the aerobic granular sludge process for sewage
treatment,” Water Res., vol. 84, pp. 207–217, 2015.
[10] Y. Liu and J. Tay, “Fast formation of aerobic granules by combining strong hydraulic
selection pressure with overstressed organic loading rate,” Water Res., vol. 80, pp. 256–
266, 2015.
[11] M. Lashkarizadeh, Q. Yuan, and J. A. Oleszkiewicz, “Influence of carbon source on
nutrient removal performance and physical-chemical characteristics of aerobic granular
sludge.,” Environ. Technol., vol. 36, no. 17, pp. 2161–2167, 2015.
[12] J. Wagner, D. G. Weissbrodt, V. Manguin, R. H. Ribeiro da Costa, E. Morgenroth, and N.
Derlon, “Effect of particulate organic substrate on aerobic granulation and operating
conditions of sequencing batch reactors,” Water Res., vol. 85, pp. 158–166, 2015.
[13] APHA, AWWA, and WEF, Standard Methods for the examination of water &
wastewater, 22nd ed. 2012.
[14] S. F. Corsino, R. Campo, G. Di Bella, M. Torregrossa, and G. Viviani, “Cultivation of
granular sludge with hypersaline oily wastewater,” Int. Biodeterior. Biodegradation, vol.
105, pp. 192–202, 2015.
[15] S. Wang, X.-W. Liu, W.-X. Gong, B.-Y. Gao, D.-H. Zhang, and H.-Q. Yu, “Aerobic

116
granulation with brewery wastewater in a sequencing batch reactor,” Bioresour. Technol.,
vol. 98, pp. 2142–2147, 2007.

117
Chapter 4: Controlled SRT stabilizes AGS-SBR under high OLR and
low hydrodynamic shear force
Introduction
AGS has provided treatment of wastewaters with up to 60% less energy than
conventional technologies [1]–[3]. The benefits of AGS processes result from self-immobilized,
spherical-shaped biofilms that allowed for process intensification as well as changes to the
metabolic capabilities of biomass [4]. As a result, carbon, nitrogen, and phosphorus can be
removed in a single tank with smaller footprint than conventional technologies [5]. Process
intensification provided by AGS means that higher OLR than conventional technologies can be
utilized. However, there was discrepancy in the literature regarding stability of AGS under high
OLR [6]. Furthermore, there appeared to be a lack of methods, beside high hydrodynamic shear
force, to provide for AGS stability under increasing OLR.
High OLR would not be an issue for AGS treating municipal wastewaters where the
lower range of OLR is actually the problem [7]–[9]. However, there are many industries that
produce high-strength, organic wastewaters [10], [11]. Pork (i.e., COD >4000 mg/L), poultry
(i.e., COD >1800 mg/L), and red meat (i.e., COD >5900 mg/L) processing plants all produce
high-strength, organic wastewaters [10]. Breweries produce many streams of high-strength
wastewater, including malting (i.e., COD >500 mg/L), saccharification/fermentation (i.e., COD
>6500 mg/L), and packaging (i.e., COD >1500 mg/L) [12]. Similarly, agricultural industries
such as piggeries (i.e., COD >950 mg/L) and sugar mills (i.e., COD >3500 mg/L) produce high-
strength wastewater [10], [12]. These examples clearly demonstrated potential applications for

118
AGS at high OLR. Based on the literature and previous lab-scale studies (i.e., Chapter 3), these
applications would require a method to maintain AGS stability.
Hydrodynamic shear force may be defined as the force generated due to the friction
between the bulk liquid and granules surface. The hydrodynamic shear force has typically been
quantified by the USAV, which is calculated as the airflow divided by the cross sectional area of
the aerated zone [13]. At high OLR most of the literature agreed that high hydrodynamic shear
force was required, although there was discrepancy as to the exact value [14]. For instance,
granulation was not observed when USAV was less than 2.4 cm/s at an OLR above 9 kg-
COD/(m3•d) while USAV of 3.2 cm/s allowed for OLR of 15 kg-COD/(m3•d) [15]. Similarly,
with OLR of 6 kg-COD/(m3•d) unstable granules developed when USAV was less than 2.4 cm/s
[16]. With low USAV of 0.41 cm/s AGS was observed to be stable at 1.4 kg-COD/(m3•d),
although at 2.5 kg-COD/(m3•d) AGS developed a filamentous surface layer after one month and
at 5 kg-COD/(m3•d) no AGS was observed [13]. All these examples demonstrated that although
AGS can be stable at low hydrodynamic shear forces, high shear was required to stabilize AGS
at high OLR.
The relationship between hydrodynamic shear force and OLR suggested that shear force
was required to reduce the quantity of fast-growing microorganisms that cultivated granule
surfaces at high substrate availability (i.e., high OLR) [13], [17]. Thus, if the mechanism of
hydrodynamic shear force was to selectively remove microorganisms, another mechanism of
encouraging granule stability would be to control the granular sludge solids retention time SRT.
The objective of this study was to examine the development and stability of AGS with controlled
SRT under different OLR, as well as to observe the impact of eliminating controlled wasting of
biomass on AGS morphology and performance. All reactors operated under low hydrodynamic

119
shear force. Reactor performance was quantified based on effluent parameters. Biomass
characteristics including net observed yields, nitrogen and phosphorus content of biomass, and
SRT were estimated.
Methods
Reactor design and operation
Experiments were carried out in 4 L sequencing batch reactors (i.e., R1-R3). Air was
supplied at 2.5 L/min resulting in upflow superficial air velocity of 0.51 cm/s. Cycle length was
6 h, consisting of 35 min anaerobic influent distribution, 310-312 min aeration, and 4.5 min, 3
min, and 1.5 min of settling in R1, R2, and R3 respectively, before 2 min of effluent discharge.
The settling time was different in each reactor to maintain constant critical settling velocity since
VER differed between R1-R3. For instance, R1 had 75% VER, R2 had 50% VER, and R3 had
25% VER. Therefore, 3 L, 2 L and 1 L of effluent was withdrawn from R1, R2, and R3,
respectively, at the end of each cycle. The critical settling velocity in R1-R3 was 8 cm/min. As a
result of different VER, the hydraulic retention time of R1 was 8 h, while it was 12 h for R2 and
24 h for R3. All reactors were seeded with full-scale biological nutrient removal sludge from the
West End Water Pollution Control Centre in Winnipeg, CA, to an initial solids concentration of
approximately 3 g-TSS/L.
The reactors were supplied with brewery wastewater collected from a local brewery. The
raw wastewater was pre-treated in an anaerobic moving bed biofilm reactor [11], and its effluent
was used as influent for the AGS reactors. Characteristics of the anaerobically pre-treated
brewery wastewater were 1500±200 mg-COD/L, 1300±200 mg-sCOD/L, 140±9 mg-TN/L, and
19.3±0.4 mg-TP/L. Thus, the OLRs for R1, R2, and R3, were 4.5±0.6 kg-COD/(m3•d), 3.0±0.4
kg-COD/(m3•d), and 1.5±0.2 kg-COD/(m3•d), respectively. 450 mL of mixed liquor was

120
removed from the reactors at the end of the aerobic phase 5 d a week. Therefore, the effective
flow of waste mixed liquor was approximately 320 mL/d. The reactors reached steady-state, in
terms of MLSS, COD removal, and granule size, within 30 d (i.e., approximately 3 times the
SRT) from inoculation and the steady-state period of analysis lasted 30 d.
Analytical methods
Influent and effluent samples were analyzed for COD, sCOD, TN, and TP (TNTplus,
Hach, CA), TAN, nitrite nitrogen, nitrate nitrogen, and OP (Lachat QuikChem 8500, HACH,
CA). Samples for MLSS, MLVSS, and effluent TSS and VSS were analyzed according to
Standard Methods [18]. Kinetic tests examined sCOD, TAN, nitrite and nitrate nitrogen, and OP
during normal operational cycles. A SteREO Discovery (Zeiss, DE) was used for microscopic
analysis. All samples that required filtration were run through medium porosity Q5 filter paper
(Fisher Scientific, CA). One-way analysis of variance (VassarStats, USA) was used to determine
if steady-state data was significantly different (i.e., α = 0.05) between R1-R3.
Organic loading rate was estimated based on Equation 1. The SRT was estimated
according to Equation 8. It should be noted that the SRT calculation was for the whole sludge
(i.e., wasted mixed liquor and effluent solids). The SRT of particles settling faster than the
critical settling velocity of 8 cm/min (i.e., SRTAGS) could be estimated purely on mixed liquor
wasting, which simplified to Equation 9. However, because there would have been some
exchange of decayed material from AGS into bulk solution, the true SRT of AGS likely existed
between the estimated SRT and SRTAGS. The Ynet was estimated according to Equation 10. The
NMLVSS and PMLVSS were estimated by Equation 11 and Equation 12, respectively. The RR was
used to assess reactor performance after mixed liquor wasting was stopped and it was determined
according to Equation 13.

121
Equation 8
𝑆𝑅𝑇𝑀𝐿𝑆𝑆 ∙ 𝑉
𝑄 ∙ 𝑀𝐿𝑆𝑆 𝑄 ∙ 𝑇𝑆𝑆
Equation 9
𝑆𝑅𝑇𝑉
𝑄
Equation 10
𝑌𝑄 ∙ 𝑀𝐿𝑆𝑆 𝑄 ∙ 𝑇𝑆𝑆
𝑄 ∙ 𝐶𝑂𝐷
Equation 11
𝑁𝑄 ∙ 𝑇𝑁 𝑇𝐼𝑁 𝑁
𝑄 ∙ 𝑀𝐿𝑉𝑆𝑆 𝑄 ∙ 𝑉𝑆𝑆
Equation 12
𝑃𝑄 ∙ 𝑇𝑃 𝑂𝑃
𝑄 ∙ 𝑀𝐿𝑉𝑆𝑆 𝑄 ∙ 𝑉𝑆𝑆
Equation 13
𝑅𝑅 𝑅𝑒𝑚𝑜𝑣𝑎𝑙
𝑅𝑒𝑚𝑜𝑣𝑎𝑙
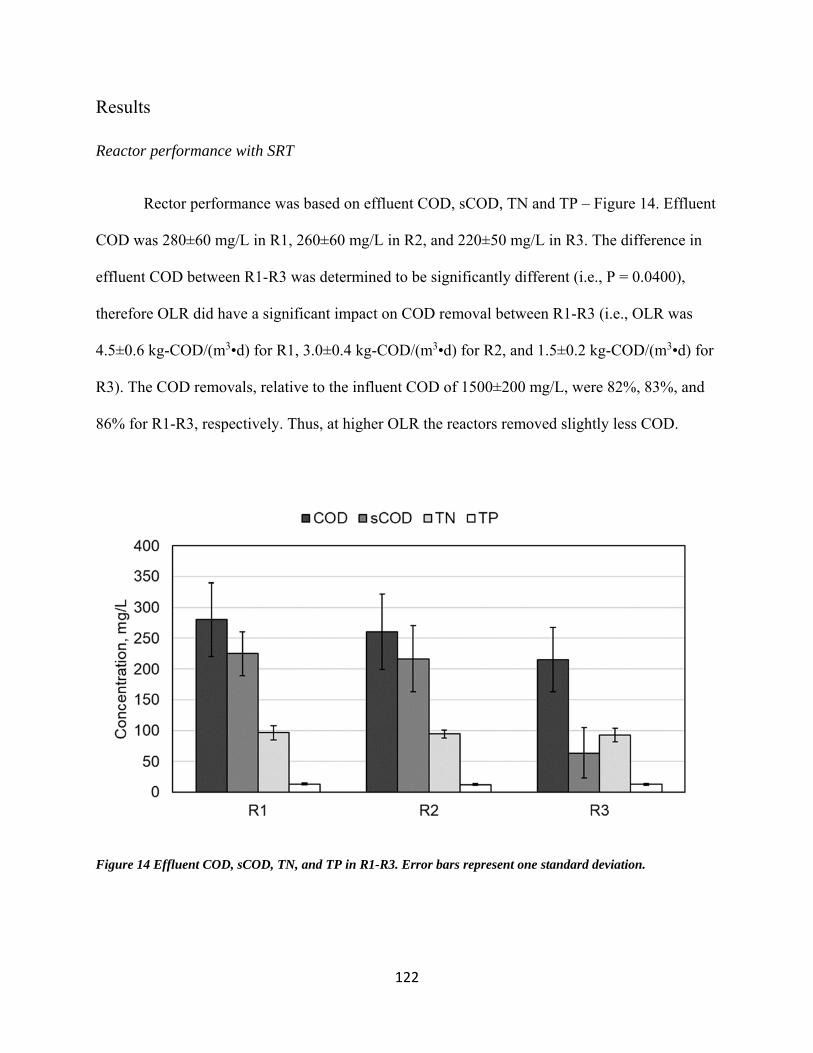
122
Results
Reactor performance with SRT
Rector performance was based on effluent COD, sCOD, TN and TP – Figure 14. Effluent
COD was 280±60 mg/L in R1, 260±60 mg/L in R2, and 220±50 mg/L in R3. The difference in
effluent COD between R1-R3 was determined to be significantly different (i.e., P = 0.0400),
therefore OLR did have a significant impact on COD removal between R1-R3 (i.e., OLR was
4.5±0.6 kg-COD/(m3•d) for R1, 3.0±0.4 kg-COD/(m3•d) for R2, and 1.5±0.2 kg-COD/(m3•d) for
R3). The COD removals, relative to the influent COD of 1500±200 mg/L, were 82%, 83%, and
86% for R1-R3, respectively. Thus, at higher OLR the reactors removed slightly less COD.
Figure 14 Effluent COD, sCOD, TN, and TP in R1-R3. Error bars represent one standard deviation.

123
Similarly, there was a significant difference in effluent sCOD between R1-R3 (i.e., P
<0.0001). Effluent sCOD was 230±40 mg/L in R1, 220±50 mg/L in R2, and 60±40 mg/L in R3.
Relative to influent sCOD of 1300±200 mg/L the sCOD removals were 78% in R1, 83% in R2,
and 95% in R3. Therefore, OLR also had an impact on the sCOD removal. There was no
significant difference in effluent TN (i.e., P = 0.9236) or effluent TP (i.e., P = 0.2874). Thus, the
OLR had no impact on TN or TP removals. Effluent TN was 100±10 mg/L in R1, 94±6 mg/L in
R2, and 90±10 mg/L in R3. Effluent TP was 14±1 mg/L in R1, 13±2 mg/L in R2, and 13±2 mg/L
in R3. Total nitrogen and TP removals were observed to range from 31-33% and 30-35%,
respectively, for R1-R3. Effluent TSS was observed to be 90±30 mg/L in R1, 100±100 mg/L in
R2, and 130±50 mg/L in R3. The difference in effluent TSS was not significantly different
between reactors (i.e., P = 0.38640), and therefore the OLR did not impact effluent TSS.
Trends in sCOD and nitrite/nitrate were monitored over regular operational cycles during
steady-state – Figure 15. It should be noted that the sCOD and nitrite/nitrate concentrations at
time zero were based on the load of substrate in the effluent from the previous cycle and the load
of substrate that would be supplied during the anaerobic influent distribution period. Soluble
COD concentrations at time zero were different for R1-R3 because of different VERs (i.e., R1
had 75% VER, R2 had 50% VER, and R3 had 25% VER). Therefore, R1 received more brewery
wastewater during anaerobic influent distribution resulting in higher sCOD concentrations than
R2 and R3. At time zero the sCOD concentrations were 900±200 mg/L in R1, 700±100 mg/L in
R2, and 430±90 mg/L in R3.

124
Figure 15 sCOD profile during steady-state for R1-R3 over regular operational cycles. Error bars represent one standard deviation.
Anaerobic influent distribution occurred from time 0-35 min. The 35 min sample had
600±200 mg/L sCOD in R1, 500±90 mg/L sCOD in R2, and 300±60 mg/L sCOD in R3.
Relative to the sCOD concentration at time zero, R1-R3 were able to utilize 23%, 23%, and 30%
of sCOD, respectively, under anaerobic conditions. The slope of sCOD residual versus
operational time changed when sCOD concentrations in the reactors was approximately 250
mg/L. Thus, it could be suggested that the more bioavailable fraction of sCOD was removed by
the time sCOD in the reactor reached 250 mg/L. In R1 the sCOD reached 250 mg/L after 75 min
(i.e., 40 min into aeration), while R2 reached 250 mg/L sCOD after 60 min (i.e., 25 min into
aeration), and R3 reached 250 mg/L sCOD after 45 min (i.e., 10 min into aeration).

125
The time which bioavailable substrate is present in bulk solution during aeration has been
referred to as the feast period [19]. The duration of the feast period in R1-R3 was estimated to be
40 min, 25 min, and 10 min, respectively. Thus, the ratio of feast conditions (i.e., time during
aeration with bioavailable substrate in bulk solution) to famine conditions (i.e., time during
aeration without bioavailable substrate in bulk solution) were 0.13 in R1, 0.08 in R2, and 0.03 in
R3. These ratios would be considered sufficient for generation of stable AGS [20]. The amount
of sCOD removed by R1-R3 during the feast period was 400±100 mg/L, 300±100 mg/L, and
100±100 mg/L, respectively. Based on the different feast to famine ratios and quantity of sCOD
available during the feast period, it could be concluded that the OLR had an impact on the feast
conditions in R1-R3, with regards to both the time of feast conditions and the quantity of
substrate available during feast conditions.
During steady-state operation, there was high variability in effluent nitrite and nitrate.
The variability was quantifiable through high standard deviations for nitrite and nitrate
concentrations depicted in Figure 16. Regardless, the presence of some nitrite and nitrate
suggested that denitrification may have been occurring during anaerobic influent distribution and
therefore prevented full anaerobic conditions from developing. Based on the nitrite/nitrate
concentrations at the beginning and end of the anaerobic influent distribution, it was determined
that R1 denitrified 11±14 mg-N/L, R2 denitrified 17±74 mg-N/L, and R3 denitrified 7±45 mg-
N/L. Assuming a ratio of 6.6 g-COD/g-N required for denitrification of nitrate [21], which was
conservative since not all the nitrite/nitrate was nitrate, the sCOD utilized for denitrification
would have been 70±90 mg/L in R1, 100±500 mg/L in R2, and 50±300 mg/L in R3. The percent
sCOD utilized for denitrification during anaerobic influent distribution was 35% in R1, 75% in
R2, and 37% in R3 of the total sCOD utilized during anaerobic influent distribution.

126
Figure 16 Nitrite/nitrate concentrations at the beginning and end of anaerobic influent distribution during steady-state for R1-R3. Error bars represent one standard deviation.
Characteristics and morphology of biomass with SRT
Steady-state MLVSS was 3.4±0.6 g/L in R1, 3.3±0.8 g/L in R2, and 1.8±0.2 g/L in R3.
The difference in MLVSS between R1-R3 was determined to be significantly different (i.e., P
<0.0001). Therefore, the OLR had a significant impact on steady-state MLVSS. The VSS/TSS of
mixed liquor solids was determined to be 0.9±0.2 in R1, 0.9±0.3 in R2, and 0.9±0.2 in R3.
Similarly, the VSS/TSS of effluent solids was determined to be 0.8±0.4, 0.8±0.5, and 0.9±0.5.
The VSS/TSS of mixed liquor was not significantly different from that of the effluent solids. The
actual SRT was estimated to be 7±2 d in R1, 7±3 d in R2, and 7±1 d in R3. The SRTAGS was
estimated to be 12.5 d. Even at low SRT it was possible for AGS to remain stable and obtain
>80% COD removal from the brewery wastewater.

127
Net observed yields were estimated to be 0.11±0.03 g-VSS/g-CODinfluent for R1,
0.16±0.04 g-VSS/g-COD for R2, and 0.18±0.04 g-VSS/g-COD for R3 – Figure 17. The net
observed yield increased as OLR decreased, suggesting that at high OLR (i.e., 4.5±0.6 kg-
COD/(m3•d)) the conversion of substrate to new biomass was limited. The nitrogen content of
MLVSS was determined to be 0.2±0.1 g-N/g-VSS in R1, 0.2±0.3 g-N/g-VSS in R2, and 0.2±0.2
g-N/g-VSS in R3. The nitrogen content of MLVSS was higher than what is typically observed
for pure biomass, which can range from 0.07-0.12 g-N/g-VSS, values that are commonly used in
conventional activated sludge models [21], [22]. The phosphorus content of MLVSS was
determined to be 0.04±0.01 g-P/g-VSS in R1, 0.030±0.008 g-P/g-VSS in R2, and 0.023±0.005 g-
P/g-VSS in R3. Typically, the phosphorus content of non-enhanced biological phosphorus
removal biomass is 0.015 g-P/g-VSS [22].
The higher nitrogen content of AGS in this study may have been due to multiple factors,
which cannot be concluded in this study. For instance, stable granular sludge has been observed
to have higher protein to polysaccharide content [19], thereby potentially increasing the nitrogen
content of solids. Furthermore, AGS has also been observed to act as an ion exchanger with
ammonium and other ions in bulk solution [23]. In this study, due to the short SRT applied, it is
possible that a higher quantity of nitrogen ions was being removed with the biomass during
mixed liquor wasting. Similarly, the ion exchange mechanism would explain the higher
phosphorus content of biomass, especially since enhanced biological phosphorus removal was
not observed in this study. Like ammonium, phosphate ions have also been observed to
accumulate in AGS [24].

128
Figure 17 Steady-state net observed yields shown with the nitrogen and phosphorus content of MLVSS. Error bars represent one standard deviation.
Based on the net observed yield, nitrogen content of MLVSS, and phosphorus content of
MLVSS, it was possible to determine the minimum COD:TN:TP ratio for biomass growth.
Previous studies have suggested a minimum ratio of 100 COD: 10 TN: 1 TP for brewery
wastewater [25]. However, it was determined that a range of 100 COD: 2.4-2.8 TN: 0.4-0.5 TP
would be enough for biomass growth in this study. Thus, nitrogen and phosphorus requirements
based on the literature may have been overestimated by as much as 3.6-4.2 times and 2.0-2.5
times, respectively. This was a significant finding for high-strength wastewaters that have low
nitrogen and phosphorus content, such as brewery wastewaters.

129
Impact of stopping SRT
After a month of steady-state operation, wastage of mixed liquor at an equivalent rate of
0.32 L/d was stopped. The AGS destabilized within several days, with what were originally large
and uniform granules (i.e., from 0.5-5 mm) rapidly transitioning to particles less than 0.2 mm –
Figure 18. Furthermore, the appearance of flocs and filamentous microorganisms was associated
with the stoppage of SRT control. Without SRT control it was clear that granules in all three
reactors, R1-R3, lost stability and rapidly disintegrated to smaller particles.
Destabilization of AGS, after mixed liquor wastage was stopped, was also associated
with decreased performance in R1-R3 – Figure 19. Removal of COD and sCOD decreased from
81% to 51% and 78% to 62%, respectively, in R1. In R2 removal of COD decreased from 83%
to 68% and sCOD removal decreased from 83% to 76%. COD and sCOD removal in R3
decreased from 86% to 76% and 95% to 92%, respectively. The associated RR for COD (i.e., R2
= 0.9234) and sCOD (i.e., R2 = 0.9646) correlated strongly with the OLR. The RRs for COD in
R1-R3 were 0.63, 0.83, and 0.86, respectively. The RRs for sCOD in R1-R3 were 0.80, 0.91, and
0.97, respectively. Therefore, in terms of COD and sCOD removal, there was a higher impact on
performance as OLR increased, suggesting that mixed liquor wasting was more important at
higher OLR.

130
It was interesting to note that TN removal was improved five days after mixed liquor
wasting was stopped. Total nitrogen removal in R1-R3 improved from 31%, 32%, and 33% to
36%, 45%, and 42%, respectively. This was likely due to the retention of more biomass,
resulting in the accumulation of more nitrifying microorganisms with the flocculent and
filamentous microorganisms that appeared. For instance, steady-state MLSS was 3.6 g/L in R1,
3.6 g/L in R2, and 1.9 g/L in R3. Five days after mixed liquor wasting was stopped, MLSS
increased to 4.8 g/L in R1 (i.e., 130% increase), 6.6 g/L in R2 (i.e., 185% increase), and 6.9 g/L
in R3 (i.e., 361% increase). As well, higher biomass concentrations may have also encouraged
simultaneous nitrification-denitrification, although kinetic tests were not performed after mixed
liquor wasting was stopped and therefore the onset of simultaneous nitrification-denitrification
cannot be concluded.
It was also interesting to note that TP removal increased at the highest OLR (i.e., R1),
while there was more TP in the effluent than in the influent at the lower OLRs (i.e., R2-R3).
Specifically, TP removal during steady-state was 30% in R1, 35% in R2, and 34% in R3. Five
days after mixed liquor wasting was stopped the TP removal in R1 was 43%, while it was -10%
in R2 and -28% in R3. The reason for TP release in R2-R3 at the time of sampling may have
been a result of phosphorus exchange between granules and solution, resulting in elevated
phosphorus concentrations in bulk solution. Since the VER was higher in R1 (i.e., higher flow),
the elevated phosphorus concentrations would have more quickly stabilized since the excess
phosphorus would have been more quickly washed out of the system.

131
Figure 18 Stereoscopic images of biomass from R1-R3 during SRT control and seven days after SRT control was stopped.

132
Figure 19 Top – Difference in COD, sCOD, TN, and TP removals in R1-R3 with and without SRT control (i.e., mixed liquor wasting); Bottom – Removal ratios (RR) for COD, sCOD, TN, and TP as a function of OLR.

133
Summary
It was demonstrated the suitability of using SRT control to maintain AGS stability at high
OLR and low hydrodynamic shear force (i.e., USAV = 0.51 cm/s). Granules were stable at OLR
from 1.5-4.5 kg-COD/(m3•d) when SRT was controlled. It was determined that a range of 100
COD: 2.4-2.8 TN: 0.4-0.5 TP would be enough for biomass growth in this study. Granules
quickly (i.e., within 5 d) lost their structural stability when mixed liquor wasting was stopped and
SRT was not controlled. The RR for COD was 0.63 at 4.5 kg-COD/(m3•d), 0.83 at 3 kg-
COD/(m3•d), and 0.86 at 1.5 kg-COD/(m3•d). The trend of RR with OLR suggested that mixed
liquor wasting, and therefore SRT control, was more crucial at higher OLR. Thus, SRT control
may be an adequate replacement for high hydrodynamic shear force to control AGS stability at
high OLR.

134
Bibliography
[1] Q. He, S. Zhang, Z. Zou, L. an Zheng, and H. Wang, “Unraveling characteristics of
simultaneous nitrification, denitrification and phosphorus removal (SNDPR) in an aerobic
granular sequencing batch reactor,” Bioresour. Technol., vol. 220, pp. 651–655, 2016.
[2] M. Pronk, M. K. de Kreuk, B. de Bruin, P. Kamminga, R. Kleerebezem, and M. C. M. van
Loosdrecht, “Full scale performance of the aerobic granular sludge process for sewage
treatment,” Water Res., vol. 84, pp. 207–217, 2015.
[3] S. Bengtsson, M. de Blois, B. M. Wilén, and D. Gustavsson, “A comparison of aerobic
granular sludge with conventional and compact biological treatment technologies,”
Environ. Technol. (United Kingdom), vol. 0, no. 0, pp. 1–10, 2018.
[4] M. H. Winkler, Q. H. Le, and E. I. P. Volcke, “Influence of Partial Denitrification and
Mixotrophic Growth of NOB on Microbial Distribution in Aerobic Granular Sludge,”
Environ. Sci. Technol., vol. 49, pp. 11003–11010, 2015.
[5] S. Lochmatter and C. Holliger, “Optimization of operation conditions for the startup of
aerobic granular sludge reactors biologically removing carbon, nitrogen, and
phosphorous.,” Water Res., vol. 59, pp. 58–70, Aug. 2014.
[6] S. S. Adav, D.-J. Lee, and J.-Y. Lai, “Potential cause of aerobic granular sludge
breakdown at high organic loading rates.,” Appl. Microbiol. Biotechnol., vol. 85, no. 5, pp.
1601–1610, 2010.
[7] A. Jafari Kang and Q. Yuan, “Long-term stability and nutrient removal efficiency of
aerobic granules at low organic loads,” Bioresour. Technol., vol. 234, pp. 336–342, 2017.

135
[8] T. R. Devlin, M. S. Kowalski, A. di Biase, and J. A. Oleszkiewicz, “Nitrogen and
phosphorus removal kinetics in aerobic granular sludge treating low-strength wastewater
at high dissolved oxygen concentrations,” Environ. Technol.
[9] J. Leong, B. Rezania, and D. S. Mavinic, “Aerobic granulation utilizing fermented
municipal wastewater under low pH and alkalinity conditions in a sequencing batch
reactor.,” Environ. Technol., vol. 37, no. 1, pp. 55–63, 2016.
[10] T. Hülsen, K. HSRieh, Y. Lu, S. Tait, and D. J. Batstone, “Simultaneous treatment and
single cell protein production from agri-industrial wastewaters using purple phototrophic
bacteria or microalgae – A comparison,” Bioresour. Technol., vol. 254, no. December
2017, pp. 214–223, 2018.
[11] A. di Biase, T. R. Devlin, M. S. Kowalski, and J. A. Oleszkiewicz, “Optimization of
surface area loading rate for an anaerobic moving bed biofilm reactor treating brewery
wastewater,” J. Clean. Prod., vol. 172, 2018.
[12] H. Zheng et al., “Balancing carbon/nitrogen ratio to improve nutrients removal and algal
biomass production in piggery and brewery wastewaters,” Bioresour. Technol., vol. 249,
no. August 2017, pp. 479–486, 2018.
[13] T. R. Devlin, A. di Biase, M. S. Kowalski, and J. A. Oleszkiewicz, “Granulation of
activated sludge under low hydrodynamic shear and different wastewater characteristics,”
Bioresour. Technol., vol. 224, 2017.
[14] Y. Liu and J. H. Tay, “The essential role of hydrodynamic shear force in the formation of
biofilm and granular sludge,” Water Research, vol. 36, no. 7. pp. 1653–1665, 2002.

136
[15] Y. Chen, W. Jiang, D. T. Liang, and J. H. Tay, “Aerobic granulation under the combined
hydraulic and loading selection pressures,” Bioresour. Technol., vol. 99, no. 16, pp. 7444–
7449, 2008.
[16] Y. Chen, W. Jiang, D. T. Liang, and J. H. Tay, “Structure and stability of aerobic granules
cultivated under different shear force in sequencing batch reactors,” Appl. Microbiol.
Biotechnol., vol. 76, no. 5, pp. 1199–1208, 2007.
[17] M. K. de Kreuk and M. C. M. van Loosdrecht, “Selection of slow growing organisms as a
means for improving aerobic granular sludge stability,” Water Sci. Technol., vol. 49, no.
11–12, pp. 9–17, 2004.
[18] APHA, AWWA, and WEF, Standard Methods for the examination of water &
wastewater, 22nd ed. 2012.
[19] S. F. Corsino, A. di Biase, T. R. Devlin, G. Munz, M. Torregrossa, and J. A.
Oleszkiewicz, “Effect of Extended Famine Conditions on Aerobic Granular Sludge
Stability in the Treatment of Brewery Wastewater,” Bioresour. Technol., 2016.
[20] S. F. Corsino, T. R. Devlin, J. A. Oleszkiewicz, and M. Torregrossa, “Aerobic granular
sludge: State of the art, applications, and new perspectives,” in Advances in Wastewater
Treatment, 2018.
[21] Metcalf & Eddy, Wastewater Engineering: Treatment and Resource Recovery, 5th ed.
McGraw-Hill, 2014.
[22] Envirosim, “BioWin 5.0.” 2017.
[23] J. P. Bassin, M. Pronk, R. Kraan, R. Kleerebezem, and M. C. M. van Loosdrecht,

137
“Ammonium adsorption in aerobic granular sludge, activated sludge and anammox
granules,” Water Res., vol. 45, no. 16, pp. 5257–5265, 2011.
[24] W. Huang et al., “Species and distribution of inorganic and organic phosphorus in
enhanced phosphorus removal aerobic granular sludge,” Bioresour. Technol., vol. 193, pp.
549–552, 2015.
[25] S. G. Wang, X. W. Liu, W. X. Gong, B. Y. Gao, D. H. Zhang, and H. Q. Yu, “Aerobic
granulation with brewery wastewater in a sequencing batch reactor,” Bioresour. Technol.,
vol. 98, no. 11, pp. 2142–2147, 2007.

138
Chapter 5: Comparison of Hydrodynamic Shear Force and Granular
Sludge Wasting as Methods to Stabilize AGS Biomass
Chapters 3 and 4 presented two methods for stabilizing AGS:
1. Hydrodynamic shear force; and
2. Controlled wasting of AGS.
Herein, the two methods for stabilizing AGS are described and discussed as they relate to
reactor operation.
Hydrodynamic shear force
Chapter 3 examined the influence of increasing OLR on AGS-SBR operation under low
hydrodynamic shear force. Specifically, USAV in the AGS-SBRs was 0.41 cm/s while OLR
increased from 1.36 kg-COD/(m3•d) to 2.52 kg-COD/(m3•d) to 5.20 kg-COD/(m3•d). At 0.41
cm/s and 1.36 kg-COD/(m3•d), a mature AGS developed within 40 d. At OLR of 2.52 kg-
COD/(m3•d) a mature AGS developed within a month, but filamentous microorganisms were
detected on granule surfaces approximately 15 d after mature AGS development – Figure 20.
Granules at OLR of 2.52 kg-COD/(m3•d) and USAV of 0.41 cm/s were fully coated by a
filamentous surface layer within two months from inoculation. At OLR of 5.20 kg-COD/(m3•d)
large granules developed rapidly, within two days, but then quickly destabilized. For the
remaining four months of experimentation, biomass in the SBR with OLR of 5.20 kg-
COD/(m3•d) and USAV of 0.41 cm/s appeared as filaments joined together by a white, viscous
substance that was likely a mixture of EPS and some cells.

139
Figure 20 Visual representation of filamentous microorganisms coating AGS under low hydrodynamic shear force. An increase in filamentous microorganisms coating AGS corresponded with the quantity of anaerobic COD uptake decreasing.
A review of the literature [1–5], combined with experimental results from Chapter 3,
produced a consistent relationship between the OLR and USAV – Figure 21. From this
relationship it was determined that approximately 0.2 cm/s of USAV was required per kg-
COD/(m3•d) of OLR. At USAV higher than 0.2 cm/s per kg-COD/(m3•d), AGS was determined
to be stable. However, any less than 0.2 cm/s per kg-COD/(m3•d) and AGS would risk the
development of a filamentous surface layer or complete degranulation. This relationship provides
a general estimate of aeration requirements to achieve stable granulation.

140
Figure 21 Cases of successful and unsuccessful granulation plotted with the OLR and USAV used in the respective study.
Based on 0.2 cm/s per kg-COD/(m3•d), AUSAV could be calculated (i.e., Appendix E).
Values for AUSAV could then be compared to values for ANit. and AHet.. The ratio of AUSAV to both
ANit. and AHet. (i.e., A/A) were then determined as a function of several operational and design
parameters – Figure 22. When A/A was greater than 1, more air would be required to achieve the
minimum USAV than the air supplied for wastewater treatment with or without nitrification. If
A/A was less than 1, the airflow supplied for wastewater treatment with or without nitrification
would provide USAV greater than the minimum required value. The results demonstrated that as
SWL increased, values for A/A slightly increased as well. The results also demonstrated that as
DO increased, values for A/A decreased significantly. It was also demonstrated that A/A was
independent of OLR and reactor diameter. Thus, at lower SWL or higher DO, the air supplied for
wastewater treatment with or without nitrification would approach or surpass the air required to
achieve the minimum USAV. Dissolved oxygen in particular had the greatest impact on A/A.

141
Figure 22. AUSAV/ANit. and AUSAV/AHet. as a function of SWL (top) and DO (bottom).
It was also demonstrated that wastewater treatment with nitrification would approach an
A/A of 1 sooner than wastewater treatment without nitrification. This was because nitrification
requires additional oxygen to biologically oxidize ammonium to nitrate. Overall, modelled
values for A/A demonstrated that AGS would be more suitable for treatment of wastewater that
required nitrification. Therefore, AGS would be ideal for municipal wastewater treatment
facilities where complete nutrient removal may be required. On the other hand, AGS may be less
ideal for high-strength, organic wastewater with nitrogen deficiency (i.e., where nitrification
would not be required). The reason being that additional aeration might be required to achieve
the minimum USAV to guarantee AGS stability.

142
Controlled wasting of AGS
An alternative method for stabilizing AGS, compared to high hydrodynamic shear force,
was examined in Chapter 4 while treating brewery wastewater. Specifically, the controlled
wasting of AGS, in addition to the selective wasting of slowly-settling biomass, was examined at
OLR from 1.5-4.5 kg-COD/(m3•d) and low USAV of 0.51 cm/s. The measured whole sludge
SRT was approximately 7 d under all OLR. Previously, in Chapter 3, a minimum USAV of 0.2
cm/s per kg-COD/(m3•d) was recommended to maintain stable AGS. Thus, at 4.5 kg-
COD/(m3•d) the USAV should have been 0.9 cm/s to generate stable AGS. However, it was
demonstrated that controlled wasting of AGS helped maintain stable AGS under lower USAV –
Figure 23.
Therefore, controlled wasting of AGS could allow for lower USAV, thereby reducing
aeration requirements. For municipal wastewater treatment, where nitrification was required, the
USAV could be achieved by the airflow required for wastewater treatment. However, additional
aeration would be required for purely heterotrophic processes, such as AGS for brewery
wastewater treatment. Thus, controlled wasting of AGS would be an effective strategy for
wastewaters with high organic content and low nitrogen content or for applications where
nitrification was not required. Figure 24 presents a visual representation of granulation with
increasing OLR with and without SRT control at low hydrodynamic shear force.

143
Figure 23 Successful granulation with SRT control shown with the OLR limit without SRT control and the potential OLR limit with SRT control. It should be noted that OLR above 4.5 kg-COD/(m3•d) were not examined, and therefore the OLR limit with SRT control may be higher than presented.
Figure 24 Visual representation of AGS stability with increasing OLR with and without SRT control at low hydrodynamic shear force.

144
Bibliography
[1] T.R. Devlin, A. di Biase, M. Kowalski, J.A. Oleszkiewicz, Granulation of activated sludge
under low hydrodynamic shear and different wastewater characteristics, Bioresour.
Technol. 224 (2017). doi:10.1016/j.biortech.2016.11.005.
[2] Y. Chen, W. Jiang, D.T. Liang, J.H. Tay, Aerobic granulation under the combined
hydraulic and loading selection pressures, Bioresour. Technol. 99 (2008) 7444–7449.
[3] Y. Chen, W. Jiang, D.T. Liang, J.H. Tay, Structure and stability of aerobic granules
cultivated under different shear force in sequencing batch reactors, Appl. Microbiol.
Biotechnol. 76 (2007) 1199–1208. doi:10.1007/s00253-007-1085-7.
[4] S. Lochmatter, C. Holliger, Optimization of operation conditions for the startup of aerobic
granular sludge reactors biologically removing carbon, nitrogen, and phosphorous., Water
Res. 59 (2014) 58–70. doi:10.1016/j.watres.2014.04.011.
[5] O. Henriet, C. Meunier, P. Henry, J. Mahillon, Improving phosphorus removal in aerobic
granular sludge processes through selective microbial management, Bioresour. Technol.
211 (2016) 298–306. doi:10.1016/j.biortech.2016.03.099.

145
Chapter 6: Description of the AGS-CFR
Introduction
AGS is an advanced biological process for energy efficient wastewater treatment in small
footprints [1,2]. AGS offers several advantages over CAS including excellent settling, high
biomass retention and therefore high volumetric loading, reduced oxygen demand, and lower
sludge yields [3,4]. Furthermore, due to the dense and compact structure of granules, AGS offers
higher resilience to drastic changes in operating conditions such as temperature, organic loads,
and toxic compounds.
SBRs have been the technology of choice for most AGS studies, as well as for the only
commercially available AGS process [5–7]. Sequencing batch reactors differ from most CAS
processes, which use CFR, because SBRs combine all the treatment steps into a single basin.
Instead of having multiple basins dedicated to different oxidation or reduction conditions, SBRs
change operational parameters over time (e.g., anaerobic influent addition aeration settling
effluent discharge repeat).
It was generally agreed upon that SBRs benefitted AGS and that granulation in CFRs
would not be stable. The one distinct advantage SBRs have over CFRs is the ability to distribute
influent through a settled bed of granules, thereby promoting anaerobic utilization of substrate.
However, recent studies have demonstrated the potential for successful and stable granulation in
CFRs [8]. These developments are important since most large WWTP practicing nutrient
removal and requiring increased capacity are large CFRs, such as plug-flow reactors or
completely-mixed reactors [9]. In these cases, existing infrastructure would not be suitable for
retrofit to SBRs and it would be uneconomical to implement AGS unless a CFR was developed.

146
Accordingly, it was desirable to develop suitable process design and operational
parameters for AGS-CFR, which could potentially enable high-levels of industrial and/or
municipal wastewater treatment (i.e., carbon, nitrogen, phosphorus, and solids removal) with a
smaller footprint and lower energy requirements than CAS processes.
Description of the reactor
The AGS-CFR comprises an anaerobic zone where influent is introduced to the AGS-
CFR, an aerobic zone situated downstream of anaerobic zone, and an anoxic zone situated
upstream of the anaerobic zone. A simplified schematic of the AGS-CFR is presented in Figure
25.
Figure 25 Simplified schematic of the AGS-CFR in one of its embodiments.
Relative to the influent COD load, the total aerobic volume is preferably designed based
on an OLR from 0.5-1.5 kg-COD/m3/d. The aerobic zone preferably includes at least one baffle
or structure that provided adequate separation between the first 10-30% of the aerobic zone and
the last 70-90%. The purpose of this separation would be to develop defined feast conditions
(i.e., high substrate availability for growth) in the first, smaller compartment or subzone of the
aerobic zone, while famine conditions (i.e., low substrate availability for growth) are developed
in the second, larger compartment or subzone of the aerobic zone. The presence of defined feast
and famine conditions, with approximately 20% or less, on average, of the aerobic volume

147
allocated for feast conditions, has been demonstrated to be beneficial for AGS stability as well as
the selection of PAO over GAO [10,11]. Additional baffles or structures for separation could be
applied in the aerobic zone to, likewise, create different compartments or subzones to facilitate
control strategies for strict effluent nitrogen limits (i.e., TN <5 mg/L).
In the illustrated example, all wastewater influent is supplied through an inlet to the
anaerobic zone, where readily available substrates are taken up by PAO and GAO, while more
complex substrates would be broken down to less complex substrates [12]. The purpose of the
anaerobic zone would be to encourage the development of PAO and GAO, reduce sludge yields
by anaerobically degrading complex organic substrates, and direct carbon towards simultaneous
nitrogen and phosphorus removing pathways. Wastewater with a readily bioavailable fraction of
COD from 0.2-0.25 would be adequately treated with an anaerobic zone approximately 15-30%
the volume of the aerobic zone. As the readily bioavailable fraction of COD increased, the
volume of the anaerobic zone could be reduced. Likewise, as the readily bioavailable fraction of
COD decreased the volume of the anaerobic zone may be increased to accommodate the
degradation of a more complex wastewater substrate. Supplemental carbon may be required to
treat wastewater with very low COD/TN.
A solids separation device, for example in the form of a secondary clarifier, resides
downstream of the aerobic zone. A return line has an inlet connected to a sludge drain of the
solids separation zone, and an outlet that opens into the anoxic zone at the upstream end of the
reactor, whereby the return line recycles a stream of RAS from the solids separation zone back
into the CFR. The anoxic zone would be designed based on endogenous respiration to
completely remove all nitrites/nitrates in the sludge recycle. Operating the anoxic zone off
endogenous material would act to extend famine conditions, with the intent of out-selecting

148
GAO [10,11]. However, at lower sludge recycle rates, and thereby lower nitrate return, the
anoxic zone may develop anaerobic conditions resulting in phosphorus release [13]. Therefore,
the anoxic zone may be equipped with diffusers such that air may be supplied if anaerobic
conditions are detected. This could be controlled by ORP.
As shown in Figure 25, WAS for selective wasting can be drawn from an elevated
location inside the aerobic zone to a selective wasting device installed in operable relation
thereto, while aerobic granular sludge can likewise be drawn from the aerobic zone from a lower
elevation therein through a lower removal port communicating therewith. Alternatively, the
selective wasting device and the removal port may be installed in cooperation with the return line
to draw the waste activated sludge, both for selective wasting and wasting of aerobic granular
sludge, from the return activated sludge RAS that is being recirculated through the return line.
Similarly, other alternative locations for the selective wasting port include any elevation of the
anoxic or anaerobic zones. A summary of design parameters for the AGS-CFR are presented in
Table 8.
Table 8 Summary of design parameters for the AGS-CFR.

149
Description of the process
Many individual control loops would contribute to the control system of a stable AGS-
CFR. The first control system would monitor DO and other parameters in the aerobic zone. The
simplest configuration, which would separate the aerobic zone into two discrete compartments or
subzones (i.e., feast and famine), would control DO in the first aerobic compartment/subzone via
a setpoint and DO in the second aerobic compartment/subzone via measured ammonium
concentrations. A lower DO limit, such as 0.05-0.5 mg/L, would be applied in the second aerobic
compartment/subzone to maintain an aerobic environment if the minimum ammonium
concentration was achieved. In the case of more stringent effluent nitrogen limits (i.e., TN <5
mg/L) and/or low carbon to nitrogen ratio in the influent, additional process controls could be
added. Keeping with the simplest configuration (i.e., two aerobic compartments/subzones),
online nitrite/nitrate monitoring could be implemented and linked to a carbon dosing system. If
the total nitrite/nitrate concentration exceeded requirements, methanol or another carbon source
providing low biomass yields could be dosed to the second aerobic compartment/subzone while
the lower DO limit was operated (i.e., 0.05-0.5 mg/L).
In these cases, the volume of the second aerobic compartment/subzone would have to be
extended to guarantee that ammonium would be within allowable concentrations while
denitrification on supplemental carbon source was occurring. Otherwise, a more complex
configuration with additional baffles or structures for flow separation within the second aerobic
compartment/subzone (i.e., famine conditions), as well as additional probes for the separated
compartments, could be employed with multiple carbon dosing locations. This would allow for
optimal control of nitrification, denitrification, carbon dosing, and famine conditions, thereby

150
providing the most robust control system to meet low effluent nitrogen concentrations (i.e., TN
of 3 mg/L).
The second control system, in its simplest form, would monitor ORP in the anoxic zone
and turn aeration on if the ORP registered anaerobic conditions. The anoxic zone would serve
two purposes, the first being a conventional purpose; preventing nitrite/nitrate carryover to the
anaerobic zone. The second, novel purpose would be to serve as extended famine conditions for
the AGS-CFR since the anoxic zone would be designed based on endogenous respiration. At low
sludge recycle rates, especially while the AGS-CFR was under design capacity, the ORP may
drop, resulting in anaerobic conditions. If this were to happen the anoxic zone would no longer
serve as extended famine conditions (i.e., lack of electron acceptors) and secondary phosphorus
release could occur [13]. Thus, it would be important to maintain ORP above anaerobic
conditions, through aeration, to benefit system stability.
The second control system could be built upon through the addition of a nitrite/nitrate
probe and carbon dosing system (i.e., methanol or equivalent). As the AGS CFR begins to reach
capacity, or if influent carbon to nitrogen ratio was low, endogenous respiration may not be
economical to completely reduce all nitrite/nitrate in the sludge recycle. Thus, a nitrite/nitrate
probe could be used to monitor oxidized nitrogen species in the anoxic zone and turn on carbon
dosing when nitrite/nitrate concentration exceeded desired values.
151
Description of potential modifications
In addition, or alternative to the above described features of the illustrated embodiment,
the system and operational process can be modified in numerous ways. For example, an aeration
grid can be added to all or part of the anoxic zone to make it an anoxic/aerobic swing zone
capable of preventing deep anaerobic conditions from developing and thereby mitigating
phosphate release that could be detrimental to biological phosphate removal [13,14]. Optionally
operating the anoxic zone as a swing zone would also allow for extended starvation/famine
conditions, which have been demonstrated to enhance granular sludge stability [10]. An aeration
grid could also be added to all or part of the anaerobic zone to make it an anaerobic/aerobic
swing zone capable. Operating all or part of the anaerobic zone as a swing zone would allow for
the anaerobic HRT to be decreased, for example at lower substrate load and/or higher
temperature, while still promoting the development of feast conditions.
A portion of the raw wastewater may be redirected from the main influent inlet through a
diversionary intake branch, or a supply of carbon from an external carbon source can be
introduced to the anoxic zone through an influent or carbon intake to accelerate denitrification
rates [15,16] when the nitrite/nitrate load in the return sludge stream is higher than the design
load. Likewise, a portion of the raw wastewater may be redirected from the main influent
through a divisionary intake branch, or a supply of carbon from an external carbon source can be
introduced to the anaerobic zone in multiple anaerobic compartments, whether multiple CMRs in
series or different locations along a PFR, to distribute the carbon source, internal or external,
throughout the anaerobic zone.

152
A portion of the raw wastewater may also be redirected from the main influent through a
divisionary intake branch, or a supply of carbon from an external carbon source can be
introduced to the portion of the aerobic zone, whether multiple CMRs in series or different
locations along a PFR, that is allocated for feast conditions. The portion of carbon, internal or
external, diverted to the aerobic zone allocated for feast conditions would maintain feast
conditions during periods of concern, such as low OLR. With regards to solids inventory, a
portion of the return activated sludge may be redirected from the main return activated sludge
inlet to the anoxic zone through a diversionary branch to an inlet to the aerobic zone. The
diversion of a portion of the return activated sludge to the aerobic zone could be utilized to
extend famine conditions and minimize the nitrite/nitrate load to the anoxic zone at higher return
activated sludge flows.

153
Bibliography
[1] D.-J. Lee, Y.-Y. Chen, K.-Y. Show, C.G. Whiteley, J.-H. Tay, Advances in aerobic
granule formation and granule stability in the course of storage and reactor operation,
Biotechnol. Adv. 28 (2010) 919–934. doi:10.1016/j.biotechadv.2010.08.007.
[2] A. Carucci, S. Milia, G. Cappai, A. Muntoni, A direct comparison amongst different
technologies (aerobic granular sludge, SBR and MBR) for the treatment of wastewater
contaminated by 4-chlorophenol, J. Hazard. Mater. 177 (2010) 1119–1125.
doi:10.1016/j.jhazmat.2010.01.037.
[3] B.-J. Ni, H.-Q. Yu, Mathematical modeling of aerobic granular sludge: A review,
Biotechnol. Adv. 28 (2010) 895–909. doi:10.1016/j.biotechadv.2010.08.004.
[4] M.K. de Kreuk, N. Kishida, S. Tsuneda, M.C.M. van Loosdrecht, Behavior of polymeric
substrates in an aerobic granular sludge system, Water Res. 44 (2010) 5929–5938.
doi:10.1016/j.watres.2010.07.033.
[5] J.J. Beun, A. Hendriks, M.C.M. Van Loosdrecht, E. Morgenroth, P.A. Wilderer, J.J.
Heijnen, Aerobic granulation in a sequencing batch reactor, Water Res. 33 (1999) 2283–
2290. doi:10.1016/S0043-1354(98)00463-1.
[6] B. Arrojo, A. Mosquera-Corral, J.M. Garrido, R. Méndez, Aerobic granulation with
industrial wastewater in sequencing batch reactors, Water Res. 38 (2004) 3389–3399.
doi:10.1016/j.watres.2004.05.002.
[7] J. Wagner, R.H.R. da Costa, Aerobic Granulation in a Sequencing Batch Reactor Using
Real Domestic Wastewater, J. Environ. Eng. 139 (2013) 1391–1396.
doi:10.1061/(ASCE)EE.1943-7870.0000760.

154
[8] T.R. Devlin, J.A. Oleszkiewicz, Cultivation of aerobic granular sludge in continuous flow
under various selective pressure, Bioresour. Technol. 253 (2018).
doi:10.1016/j.biortech.2018.01.056.
[9] J. Oleszkiewicz, D. Kruk, T. Devlin, Options for improved nutrient removal and recovery
from municipal wastewater in the Canadian context, 2015.
[10] S.F. Corsino, A. di Biase, T.R. Devlin, G. Munz, M. Torregrossa, J.A. Oleszkiewicz,
Effect of Extended Famine Conditions on Aerobic Granular Sludge Stability in the
Treatment of Brewery Wastewater, Bioresour. Technol. (2016).
doi:10.1016/j.biortech.2016.12.026.
[11] M. Carvalheira, A. Oehmen, G. Carvalho, M.A.M. Reis, Survival strategies of
polyphosphate accumulating organisms and glycogen accumulating organisms under
conditions of low organic loading, Bioresour. Technol. 172 (2014) 290–296.
doi:10.1016/j.biortech.2014.09.059.
[12] M. Pronk, B. Abbas, S.H.K. Al-zuhairy, R. Kraan, R. Kleerebezem, M.C.M. van
Loosdrecht, Effect and behaviour of different substrates in relation to the formation of
aerobic granular sludge, Appl. Microbiol. Biotechnol. 99 (2015) 5257–5268.
doi:10.1007/s00253-014-6358-3.
[13] A. Mikola, J. Rautianen, R. Vahala, Secondary clarifier conditions conducting to
secondary phosphorus release in a BNR plant, Water Sci. Technol. 60 (2009) 2413–2418.
doi:10.2166/wst.2009.601.
[14] P. Jabari, Q. Yuan, J.A. Oleszkiewicz, Overall effect of carbon production and nutrient
release in sludge holding tank on mainstream biological nutrient removal efficiency,

155
Environ. Technol. (United Kingdom). 0 (2017) 1–21.
doi:10.1080/09593330.2017.1355934.
[15] J. Chen, Y. Lee, J.A. Oleszkiewicz, Applicability of industrial wastewater as carbon
source for denitrification of a sludge dewatering liquor, Environ. Technol. (United
Kingdom). 34 (2013) 731–736. doi:10.1080/09593330.2012.715755.
[16] J. Makinia, K. Czerwionka, J. Oleszkiewicz, E. Kulbat, S. Fudala-Ksiazek, A distillery by-
product as an external carbon source for enhancing denitrification in mainstream and
sidestream treatment processes, Water Sci. Technol. 64 (2011) 2072–2079.
doi:10.2166/wst.2011.624.

156
Chapter 7: Influence of selective pressure in an AGS-CFR
Introduction
One of the key factors for successful and stable granulation, in SBR or CFR, is the
cultivation of beneficial microorganisms such as GAO and PAO [1], [2]. Accumulating
microorganisms allow for uniform utilization of organic substrate throughout granule depth,
thereby redirecting substrate from fast-growing aerobic microorganisms [3], [4]. Furthermore,
dense and rapidly settling granules have been observed to contain a higher proportion of PAO
than GAO [5], [6]. This is likely due to high concentrations of polyphosphates and other
inorganics in PAO dominated granules [7]. For these reasons, AGS-CFRs must consider
microbial selection pressures that favour the growth of PAO to achieve stable and rapidly settling
granules. Such considerations include dedicated anaerobic zones where readily available
substrate is utilized by accumulating microorganisms as well as selective wasting that separates
the light fractions of biomass from rapidly settling PAO aggregates.
It has also been demonstrated that extended famine conditions promote AGS stability [8].
Phosphorus accumulating organisms out-compete GAO at low organic loadings rates, or
extended periods of aerobic decay, known as famine conditions [9]. This was because PAO tend
to maintain a higher reserve of polyhydroxyalkanoate than GAO, thereby providing PAO with an
energy source for aerobic maintenance processes. Therefore, AGS-CFRs would benefit from
extended aerobic or anoxic conditions with regards to selection of PAO over GAO.
Hydrodynamic shear force was also suggested to influence granule stability, although that has
been refuted under low organic loading [3], [10]. Existing full-scale AGS-SBRs are operated at
OLR near 1 kg-COD/(m3•d) [11], although stable AGS under high hydrodynamic shear force
have been reported at organic loading rates up to 15 kg-COD/(m3•d) [12]. For municipal

157
wastewaters, which are typically low-strength, AGS-CFRs would not require high hydrodynamic
shear force. However, industrial wastewaters with high bCOD loads (e.g., brewery wastewater
[13]) may benefit from higher hydrodynamic shear force.
One of the first studies on an AGS-CFR demonstrated that the granular inoculum rapidly
lost its structural integrity, resulting in loose and fluffy aggregates, after being transferred to the
CFR [14]. A more recent study examined an AGS-CFR with two settling tanks in series,
although micropowder addition was required to enhance granulation [15]. Otherwise, there is a
distinct lack of knowledge in the literature about AGS-CFRs. The objective of this study was to
determine the impact of selective pressure, via selective wasting, on granulation of flocculent
biomass in a CFR designed for PAO cultivation. The goal was to demonstrate that aerobic
granulation was possible in a CFR, and that a biomass with high treatment capacity (i.e., HRT of
6 h) could be developed.
Methods
Reactor configuration
A modular CFR was constructed from HDPE containers of various working volumes
(i.e., 5-40 L) in series and operated at 20±1 °C. Each HDPE container represented a single CMR
and was mixed with 5” (i.e., 12.7 cm) right-handed propellers rotating clockwise. Rotational
speed of the propellers was adjusted to ensure adequate mixing in each CMR (i.e., 15 rpm for 5
L; 120 rpm for 40 L). A series of CMRs was configured using through-wall fittings centered 1”
(i.e., 2.54 cm) above the bottom of the container. Containers were connected with food-grade
plastic tubing with an inside diameter of 3/8” (i.e., 0.9525 cm).

158
Wastewater was supplied with peristaltic pumps at a total flow of 240 L/d and the HRT
was 6 h. The flow was distributed equally between the first three 5 L reactors (i.e., 80 L/d to each
reactor). The first 5 L reactor, which also received the sludge recycle (i.e., constant at 168 L/d
which was 70% total influent flow of 240 L/d) acted as the pre-anoxic zone while the following
two 5 L reactors operated as anaerobic zones. This “step-feed” approach was intended to
maximize the anaerobic HRT while mitigating issues associated with extended anaerobic
conditions in the presence of low substrate concentrations. Dissolved oxygen was monitored
with optical probes in both the 5 L and 40 L aerobic zones. A programmable logic controller
received input from the optical probes and relayed information to outlets controlling air pumps
on/off. Dissolved oxygen was maintained between 1.5-2.5 mg/L in both the 5 L and 40 L aerobic
tanks. The aerobic zone was split into a small (i.e., 5 L) and large (i.e., 40 L) compartment in
order to balance a short feast period in the first, small compartment followed by a long famine
period in the second, large compartment [8].
To simplify analysis and operation of the lab-scale AGS-CFR, selective wasting was
coupled with solid-liquid separation in the 5 L clarifier which had a surface area of ~573 cm2.
Scale-up of the process would require a discrete selective wasting device that diverted selectively
wasted solids away from the final effluent. Such a device could draw biomass for selective
wasting from any point in the reactor configuration. In the lab-scale AGS-CFR, selective wasting
was achieved with a 5” (i.e., 12.7 cm) right-handed propeller rotating clockwise in the clarifier.
Higher rotational speeds, with a maximum of 25 rpm, resulted in more turbulence during
settling, and therefore higher selective pressures for rapidly settling particles.
The shear force applied during selective wasting, or mixing in general, was not expected
to influence granulation since previous studies has demonstrated that high shear forces are not a

159
requirement for granulation [3]. Furthermore, the confounding influence of shear force applied
during selective wasting should have been minimized due to the small range of rotational speeds
examined (i.e., 7-25 rpm) for selective wasting, as well as due to much higher rotational speeds
(i.e., up to 120 rpm) being applied in the reactor compartments for mixing. Four distinct values
of selective wasting pressure were applied (i.e., 25, 20, 15, and 7 rpm). The first selective
wasting pressure examined was the maximum of 25 rpm since higher degrees of wasting would
have resulted in lower whole sludge SRT and therefore steady-state would have been attained
more rapidly. The CFR was disinfected and inoculated with flocculent biomass before a different
selective pressure was applied.
Source of inoculum
The AGS-CFR was inoculated with conventional activated sludge from a full-scale
biological nutrient removal municipal wastewater treatment plant located in Winnipeg, Canada.
The full-scale process operates in a Westbank configuration with organic matter oxidation,
nitrification of ammonium, denitrification for TN removal, and enhanced biological phosphorus
removal achieving effluent quality of <15 mg-TN/L and <1 mg-TP/L. Sludge volume index
typically varies from 120-160 mL/g. The full-scale process also utilizes primary clarifiers to
remove particulate organic matter prior to biological treatment. The primary solids from
clarification are fermented to yield volatile fatty acids, which are recycled to the anaerobic zone
of the Westbank process to assist the enhanced biological phosphorus removal. The inoculum,
which was RAS from the full-scale Westbank reactor, was introduced such that the original TSS
concentrations in the AGS-CFR was approximately 2 g/L. Whenever a new selective pressure in
the AGS-CFR was examined (i.e., rotational speeds of 7-25 rpm), the previous biomass was

160
removed, and the process was re-seeded with fresh biomass from the full-scale Westbank
reactor.
Wastewater characteristics
Wastewater was composed of beef and yeast extracts (Sigma Aldrich), ammonium
chloride, and potassium phosphate dibasic. Wastewater characteristics were determined on
samples from the inlet of the AGS-CFR. On average COD was 370±30 mg/L, TN was 43±7
mg/L, and TP was 10±2 mg/L. The fraction of COD that was soluble was 0.89, while the fraction
of TN that was TAN was 0.44 and the fraction of TP that was OP was 0.70. Based on steady-
state data from operation with the least amount of selective pressure applied, and therefore the
highest concentration of biomass, the fraction of nbsCOD in the wastewater was estimated to be
0.07±0.02. The ratio of COD to TN and COD to TP in the wastewater were 8.7±0.2 and
35.8±0.2, respectively. Approximately 220±50 mg/L of COD would be required to achieve
effluent concentrations of 15 mg-TIN/L and 1 mg-OP/L (i.e., assuming NOx-N = 0.8 TN, 10 g-
bCOD/g-P, and 6.6 g-bCOD/g-N).
Analytical methods
Influent and effluent samples were analyzed for COD, sCOD, TN, and TP
spectrophotometrically (TNTplus, Hach, CA). TAN, nitrite nitrogen, nitrate nitrogen, and OP
were also quantified spectrophotometrically (Lachat QuikChem 8500, HACH, CA). Samples for
MLSS, MLVSS, and effluent TSS and VSS were analyzed according to Standard Methods [16].
A SteREO Discovery (Zeiss, DE) was used for microscopic analysis. All samples that required
filtration were run through medium porosity Q5 filter paper (Fisher Scientific, CA). ImageJ was
utilized to assess DF and DS. A minimum cutoff of 0.2 mm on DF was used to assess average
diameter of granules [4]. The ratio of DF to DS therefore represented uniformity of granular

161
sludge particles, with higher ratios representing more irregular granular sludge particles. One-
way analysis of variance (VassarStats, USA) was used to determine if steady-state data at
different selective wasting pressures was significantly different (i.e., α = 0.05). Ynet was
estimated according to Equation 5 and anaerobic sCOD utilization was estimated according to
Equation 14.
Equation 14
𝐴𝑛𝑎𝑒𝑟𝑜𝑏𝑖𝑐 𝑠𝐶𝑂𝐷 𝑢𝑡𝑖𝑙𝑖𝑧𝑎𝑡𝑖𝑜𝑛 1𝑠𝐶𝑂𝐷 ∙ 𝑄 ∙ 1 𝑅
𝑠𝐶𝑂𝐷 ∙ 𝑄 ∙ 𝑅 𝑠𝐶𝑂𝐷 ∙ 𝑄∙ 100
Results
Biomass quantities and characteristics
The quantities and characteristics of mixed liquor in the AGS-CFR were determined
during steady-state operation at different selective wasting pressures – Figure 26. The degree of
selective wasting applied, represented by rotational speeds of the impeller from 7-25 rpm in the
clarifier, had a significant impact on MLSS (i.e., P <α = 0.05). At higher rotational speeds the
steady-state MLSS was lower, approaching 150 mg/L. This could be explained by higher degrees
of biomass washout as rotational speed increased, since the critical settling velocity in the
clarifier would have been higher. At the lowest rotational speed examined, which was 7 rpm, the
steady-state MLSS was observed to be >3000 mg/L. Furthermore, an impact on the VSS/TSS
ratio of the mixed liquor was also observed with selective wasting. In general, the VSS/TSS ratio
of the mixed liquor increased from 0.71 at a rotational speed of 15 rpm to 0.93 at a rotational
speed of 25 rpm.

162
Figure 26 Steady-state MLSS and the ratio of MLVSS/MLSS with increasing selective pressure (i.e., rotational speed of the impeller in the clarifier). Error bars represent a single standard deviation.
Since the higher rotational speeds would have resulted in higher degrees of biomass
washout, the accumulation of inorganic material in the mixed liquor would not have been as
significant when compared to lower degrees of biomass washout. For this reason, lower
rotational speeds would have resulted in the retention of more biomass and therefore allowed for
the accumulation of more inorganic material. In general, it has been observed that stable AGS
systems accumulated inorganic phosphate precipitates, such as calcium phosphate, in the granule
core [7]. Thus, in addition to having excellent effluent characteristics under the steady-state
sampling periods, rotational speeds ≤15 rpm also resulted in the accumulation of more inorganic
matter (i.e., lower VSS/TSS in the mixed liquor), suggesting greater potential for stable
granulation.
163
Based on the clarifier dimensions and impeller properties, the applied rotational speed
was converted to a Re and velocity gradient. At the lowest rotational speed applied of 7 rpm the
Re was 1434 and the estimated velocity gradient was 1 1/s. At the highest rotational speed
applied of 25 rpm the Re was 5120 and the estimated velocity gradient was 9 1/s. At Re from
1434-5120, the flow in the clarifier was neither laminar nor turbulent and existed in-between
those ranges. The Re and/or velocity gradient imparted by the impeller on the fluid in the
clarifier could be used as a translatable measure for upscaling the selective wasting process.
Based on observed steady-state MLSS, Re between 3000-4000 (i.e., 15-20 rpm), or velocity
gradients between 4-7 1/s, had the greatest influence on biomass quantities.
Morphology of the biomass was also significantly impacted by the applied selective
pressure. At all applied selective pressures there was a persistent flocculent fraction, which was
visibly the highest at 7 rpm. The largest granules were observed at >20 rpm, although a
significant fraction of filamentous microorganisms was visible at 25 rpm. Filaments were also
present at 20 rpm where they were mostly associated with the surface of granular sludge
particles. This was different than at 25 rpm where the filaments were also free-living and
separated from granular sludge particles. Granular sludge was observed at all rotational speeds,
although granules developed at 7 rpm did not meet the 0.2 mm minimum DF cutoff for
measurement – Figure 27.

164
Figure 27 Average DF and DS of granules in the AGS-CFR with increasing selective pressure. Error bars represent a single standard deviation.
At a rotational speed of 15 rpm granules had an average DF of 0.22±0.01 mm and average
DS of 0.11±0.02 mm. There was a visual reduction in the flocculent biomass fraction at 15 rpm
compared to 7 rpm. At 20 rpm the average DF and DS were 0.4±0.2 mm and 0.3±0.1 mm,
respectively. Similarly, at 25 rpm the average DF and DS were 0.31±0.09 mm and 0.18±0.08 mm,
respectively. The ratio of DF to DS increased as rotational speed of selective wasting increased,
suggesting that granules were more irregularly shaped at higher selective wasting pressures. The
ratio of DF to DS was 1.3, 2.4, and 3.3 at rotational speeds of 15 rpm, 20 rpm, and 25 rpm,
respectively. Overall, these results indicated that granulation under continuous flow is possible,
and that significant performance can be achieved with the appropriate applied selective pressure.
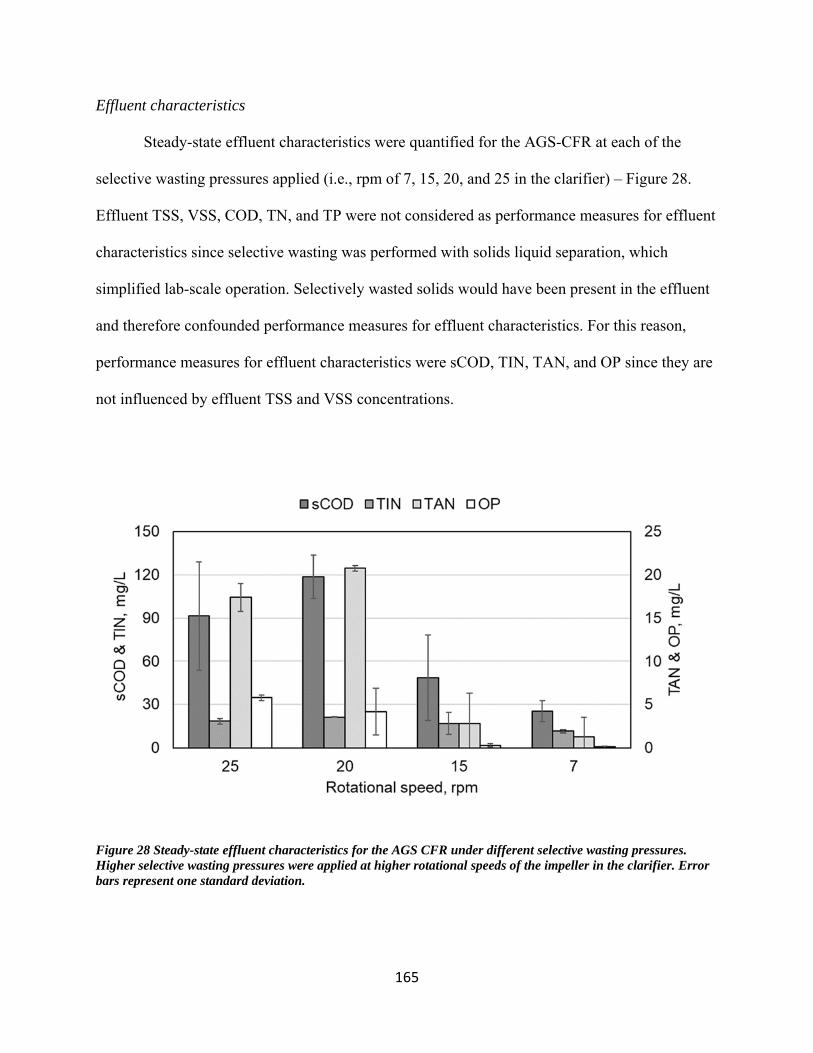
165
Effluent characteristics
Steady-state effluent characteristics were quantified for the AGS-CFR at each of the
selective wasting pressures applied (i.e., rpm of 7, 15, 20, and 25 in the clarifier) – Figure 28.
Effluent TSS, VSS, COD, TN, and TP were not considered as performance measures for effluent
characteristics since selective wasting was performed with solids liquid separation, which
simplified lab-scale operation. Selectively wasted solids would have been present in the effluent
and therefore confounded performance measures for effluent characteristics. For this reason,
performance measures for effluent characteristics were sCOD, TIN, TAN, and OP since they are
not influenced by effluent TSS and VSS concentrations.
Figure 28 Steady-state effluent characteristics for the AGS CFR under different selective wasting pressures. Higher selective wasting pressures were applied at higher rotational speeds of the impeller in the clarifier. Error bars represent one standard deviation.

166
In general, the performance of the AGS-CFR improved as the rotational speed decreased
from 25 rpm to 7 rpm. The difference in sCOD, TIN, TAN, and OP between rotational speeds of
7-15 rpm were not significant (i.e., P > ᵅ = 0.05). However, a significant difference in effluent
characteristics was observed for rotational speeds ≥20 rpm and those ≤15 rpm. Specifically, at
rotational speeds ≥20 rpm the steady-state sCOD was ≥90±40 mg/L, TIN was ≥18±2 mg/L and
OP was ≥4±3 mg/L. On the other hand, below 15 rpm the steady-state sCOD was ≤50±30 mg/L,
TIN was ≤17±8 mg/L and OP was ≤0.3±0.2 mg/L. Based on the observed effluent characteristics
for rotational speeds ≤15 rpm, which were determined from a month of steady-state operating
data, the AGS-CFR would be capable of meeting stringent effluent characteristics. In fact, at 7
rpm effluent sCOD was 25±7 mg/L, TIN was 11±1 mg/L, and OP was 0.1±0.1 mg/L.
These results demonstrated that AGS can be successfully cultivated in continuous flow
from a flocculent inoculum and achieve simultaneous COD, TN, and TP removal at a low
hydraulic retention time of 6 h. These results also suggested that conversion of full-scale
continuous flow facilities could be achieved by gradually increasing the selective pressure,
allowing for continuous performance while transitioning from a flocculent to granular sludge
process.
Metabolic characteristics and biomass yields
The first aspect of metabolism considered for assessing stable granulation was the
development of distinct feast and famine phases. Previous research has demonstrated that a
famine period of at least 80% the aerobic HRT cultivates a more stable aerobic granular sludge
(Corsino et al., 2016). The AGS-CFR examined in this study contained two aerobic
compartments with a total volume of 50 L. The first aerobic compartment, where feast conditions
would have developed, was sized at 5 L. Thus, the second aerobic compartment, which was 40

167
L, provided 90% of the total aerobic volume for famine conditions to develop. However, it was
observed that the actual development of famine conditions depended on the applied selective
wasting pressure – Figure 29.
Figure 29 Steady-state concentrations of sCOD in the first and second aerobic compartment of the AGS-CFR under different rotational speeds for selective wasting. Error bars represent one standard deviation.
Steady-state sCOD concentrations in the first and second aerobic compartment provided
quantifiable measures of feast and famine periods in the AGS-CFR. Thus, when sCOD in the
first aerobic compartment was similar to sCOD in the second aerobic compartment (i.e., ratio of
sCOD in first aerobic compartment to second aerobic compartment approaching 1) famine
conditions would have developed. This was the case for rotational speeds of 7-15 rpm, with
ratios of sCOD in the first to second aerobic compartments from 0.7±0.4-1.1±0.2. However,
when the rotational speed was ≥20 rpm, the ratio of sCOD in the first to second aerobic
compartment was greater than 1.6±1.

168
Based on measured sCOD concentrations, the second aerobic compartment was oxidizing
63-70 mg/L of sCOD on average, or 15.1-16.8 g/d of sCOD. Normalized to the 40 L volume of
the second aerobic compartment, volumetric sCOD utilization rates were anywhere from 0.34-
0.37 g/(L·d) for rotational speeds greater than 20 rpm. On the other hand, there was insignificant
oxidation of sCOD for rotational speeds of 15 rpm and below, demonstrating the development of
famine conditions in the second aerobic compartment. Thus, selective wasting pressures
imparted by rotational speeds of 20 rpm and above resulted in steady-state MLSS concentrations
that were not able to fully utilize the sCOD load in the first aerobic compartment. The lack of
sufficient biomass subsequently resulted in a breakthrough of sCOD to the second aerobic
compartment and a persistent feast phase that is associated with unstable granulation.
The second metabolic aspect considered to assess the stability of granular sludge was the
degree of anaerobic substrate utilization – Figure 30. It is generally agreed that higher degrees of
anaerobic substrate utilization result in more stable granulation due to reduced biomass yields
and a uniform growth of microorganisms across granule depth [4]. At rotational speeds of 20
rpm and above the amount of anaerobic sCOD utilized was insignificant. Specifically, only
9±4% of sCOD was anaerobically utilized at 20 rpm while 10±10% was anaerobically utilized at
25 rpm. Steady-state values for anaerobic utilization of sCOD were much higher at rotational
speeds of 15 rpm and lower. For instance, the AGS-CFR was able to utilize 45±3% of sCOD
anaerobically at a rpm of 15. At a rpm of 7 the AGS-CFR anaerobically utilized 59±2% of the
sCOD. Thus, in addition to disrupting adequate feast and famine regimes, rotational speeds of 20
rpm and above resulted in poor anaerobic utilization of sCOD, which could result in poor
granular sludge stability.

169
Figure 30 Steady-state anaerobic utilization of sCOD in the AGS-CFR under different rotational speeds for selective wasting. Error bars represent one standard deviation.
The reason that overall anaerobic sCOD utilization was lower at higher rpm is because of
the lower MLSS observed with increasing rotational speed of selective wasting. Higher
rotational speeds of selective wasting resulted in more aggressive biomass washout and lower
steady-state concentrations of MLSS. Thus, there was inadequate biomass quantity available to
contact and uptake the entire sCOD load during anaerobic conditions. However, it is interesting
to note that as rotational speed of selective wasting increased the specific anaerobic sCOD
utilization rate also increased. For instance, at 7 rpm the specific anaerobic sCOD utilization rate
was 16.7±0.5 mg-sCOD/(g-VSS·min), while at 15 rpm, 20 rpm, and 25 rpm the specific
anaerobic sCOD utilization rates were 16.9±0.8 mg-sCOD/(g-VSS·min), 60±20 mg-sCOD/(g-
VSS·min), and 70±70 mg-sCOD/(g-VSS·min), respectively.

170
Based on these observations it can be concluded that higher selective wasting pressures
resulted in a biomass with higher anaerobic sCOD utilization rates. Therefore, if the steady-state
MLSS concentrations had been higher at >20 pm, the overall anaerobic sCOD utilization would
have been improved. However, excessive washout of biomass at >20 rpm alluded that optimal
granulation would have occurred somewhere between 15 rpm (i.e., high overall anaerobic sCOD
utilization) and 20 rpm (i.e., high specific anaerobic sCOD utilization) in the AGS-CFR
examined.
Observed yields for the AGS-CFR were determined based on the total quantity of wasted
biomass and amount of COD removed – Figure 31. The simplified nature of the AGS-CFR
meant that solids in the effluent were equal to the total quantity of biomass wasted (i.e., selective
wasting was performed in the clarifier). Effluent VSS was lowest, at 23 mg/L, when rotational
speed was 15 rpm. Highest effluent VSS of 130 mg/L was generated by the highest rotational
speed of 25 rpm. This can be explained by higher critical settling velocities in the clarifier with
higher rotational velocities, thereby resulting in more biomass washout and the development of a
biomass with high-rate proprieties such as higher observed yields. However, at a rotational speed
of 7 rpm, effluent VSS of 70 mg/L was higher than effluent VSS at 15 rpm. Likewise, observed
yield increased from 0.08-0.44 g-VSS/g-COD as rotational speed increased from 15-25 rpm.
Interestingly, at a rotational speed of 7 rpm the observed yield of 0.19 g-VSS/g-COD was higher
than at 15 rpm.

171
Figure 31 Ynet under different rotational speeds for selective wasting.
Whole sludge SRT (i.e., considering total biomass and not the fraction of granules or
flocs) was also calculated from steady-state parameters – Figure 32. At rotational speeds of 20
rpm and above, the SRT was 6.5-10 h, which would be an extremely aggressive SRT
representative of a high-rate aerobic metabolism. At a rotational speed of 7 rpm the whole sludge
SRT was 8.6 d, while the highest whole sludge SRT of 18 d was observed at a rotational speed of
15 rpm. Under the conditions examined a rotational speed of 15 rpm provided optimal sludge
wasting and selected dense aggregates with good metabolic capabilities (i.e., not high-rate
aerobic metabolism with high observed yields) while preventing accumulation of the flocculent,
light fraction of biomass. At a rotational speed of 7 rpm the selective pressure was not significant
enough to remove the flocculent, light fraction of biomass. This allowed for the accumulation of
additional flocculent solids in the mixed liquor.

172
Figure 32 Effluent TSS and VSS, and whole sludge SRT under different rotational speeds for selective wasting. Error bars represent one standard deviation.
Since there was no other method of biomass wasting, other than with the effluent, the
flocculent, light fraction of biomass grew to the conditions provided at 7 rpm (i.e., biomass grew
until clarification capacity was not sufficient to handle the solids loading rate). This explained
why the effluent VSS and observed yield was higher at a rotational speed of 7 rpm than at a
rotational speed of 15 rpm. Out of the four rotational speeds examined in this study, 15 rpm
provided the optimal degree of selective wasting by selecting for granular sludge, minimizing the
flocculent, light fraction of biomass, and preventing the development of high-rate conditions.

173
Summary
Formation of aerobic granular sludge was examined in a novel continuous flow
configuration at 20±1 °C. Synthetic proteinaceous wastewater with municipal primary effluent
characteristics was used (i.e., COD = 370±30 mg/L; TN = 43±7 mg/L; and TP = 10±2 mg/L).
Various levels of selective pressure were applied after inoculation with flocculent sludge (i.e.,
estimated velocity gradients during settling between 1-9 1/s). Impeller rpm of 15 and below
generated flocculent-granular biomass, while 20 rpm and above generated large granules with a
filamentous population. Effluent soluble COD, TIN, and OP of 25±7 mg/L, 11±1 mg/L, and
0.1±0.1 mg/L, respectively, were obtained. Observed yields were as low as 0.08-0.19 g-VSS/g-
COD and whole sludge SRT was 18±1 d. Famine conditions developed for 90% of the total
aerobic volume and >45±3% anaerobic substrate utilization was recorded. Aerobic granulation
was demonstrated feasible under continuous flow providing adequate treatment with low
biomass yields.

174
Bibliography
[1] Q. He, J. Zhou, H. Wang, J. Zhang, and L. Wei, “Microbial population dynamics during
sludge granulation in an A/O/A sequencing batch reactor,” Bioresour. Technol., vol. 214,
pp. 1–8, 2016.
[2] B. A. Figdore, H. D. Stensel, and M.-K. H. Winkler, “Comparison of different aerobic
granular sludge types for activated sludge nitrification bioaugmentation potential,”
Bioresour. Technol., 2017.
[3] T. R. Devlin, A. di Biase, M. S. Kowalski, and J. A. Oleszkiewicz, “Granulation of
activated sludge under low hydrodynamic shear and different wastewater characteristics,”
Bioresour. Technol., vol. 224, 2017.
[4] M. K. de Kreuk and M. C. M. van Loosdrecht, “Selection of slow growing organisms as a
means for improving aerobic granular sludge stability,” Water Sci. Technol., vol. 49, no.
11–12, pp. 9–17, 2004.
[5] M.-K. H. Winkler, R. Kleerebezem, M. Strous, K. Chandran, and M. C. M. van
Loosdrecht, “Factors influencing the density of aerobic granular sludge,” Appl. Microbiol.
Biotechnol., vol. 97, no. 16, pp. 7459–7468, 2013.
[6] O. Henriet, C. Meunier, P. Henry, and J. Mahillon, “Improving phosphorus removal in
aerobic granular sludge processes through selective microbial management,” Bioresour.
Technol., vol. 211, pp. 298–306, 2016.
[7] W. Huang et al., “Species and distribution of inorganic and organic phosphorus in
enhanced phosphorus removal aerobic granular sludge,” Bioresour. Technol., vol. 193, pp.
549–552, 2015.

175
[8] S. F. Corsino, A. di Biase, T. R. Devlin, G. Munz, M. Torregrossa, and J. A.
Oleszkiewicz, “Effect of extended famine conditions on aerobic granular sludge stability
in the treatment of brewery wastewater,” Bioresour. Technol., 2016.
[9] M. Carvalheira, A. Oehmen, G. Carvalho, and M. A. M. Reis, “Survival strategies of
polyphosphate accumulating organisms and glycogen accumulating organisms under
conditions of low organic loading,” Bioresour. Technol., vol. 172, pp. 290–296, 2014.
[10] Y. Li, Y. Liu, and H. Xu, “Is sludge retention time a decisive factor for aerobic
granulation in SBR?,” Bioresour. Technol., vol. 99, no. 16, pp. 7672–7677, 2008.
[11] M. Pronk, M. K. de Kreuk, B. de Bruin, P. Kamminga, R. Kleerebezem, and M. C. M. van
Loosdrecht, “Full scale performance of the aerobic granular sludge process for sewage
treatment,” Water Res., vol. 84, pp. 207–217, 2015.
[12] B. Long et al., “Tolerance to organic loading rate by aerobic granular sludge in a cyclic
aerobic granular reactor,” Bioresour. Technol., vol. 182, pp. 314–322, 2015.
[13] A. di Biase, T. R. Devlin, M. S. Kowalski, and J. A. Oleszkiewicz, “Optimization of
surface area loading rate for an anaerobic moving bed biofilm reactor treating brewery
wastewater,” J. Clean. Prod., vol. 172, pp. 1121–1127, 2018.
[14] S. F. Corsino, R. Campo, G. Di Bella, M. Torregrossa, and G. Viviani, “Study of aerobic
granular sludge stability in a continuous-flow membrane bioreactor,” Bioresour. Technol.,
vol. 200, pp. 1055–1059, 2016.
[15] J. Zou, Y. Tao, J. Li, S. Wu, and Y. Ni, “Cultivating aerobic granular sludge in a
developed continuous-flow reactor with two-zone sedimentation tank treating real and

176
low-strength wastewater,” Bioresour. Technol., vol. 247, no. July 2017, pp. 776–783,
2018.
[16] APHA, AWWA, and WEF, Standard Methods for the examination of water &
wastewater, 22nd ed. 2012.

177
Chapter 8: Impact of feast to famine ratios in an AGS-CFR
Introduction
The benefits of AGS cannot be realized by all treatment facilities since SBRs are not
suitable for retrofitting continuous flow reactors that employ long, plug-flow concrete basins for
biological nutrient removal. Thus, there is a demonstrated need to assess AGS-SBR design
parameters and translate them to CFRs. Continuous flow reactors for AGS have seen moderate
success in lab-scale configurations. Aerobic granular sludge was successfully cultivated in a
CFR with two settling tanks in series, although micropowder addition was required to enhance
granulation [1]. Another study demonstrated that granular sludge inoculum rapidly lost its
structural integrity, resulting in loose and fluffy aggregates, when transferred to a membrane
bioreactor [2].
Granulation was successful in approximated plug-flow with secondary clarification on
synthetic low-strength wastewater [3]. In this case, granules were stable when famine conditions
developed over 90% of the total aerobic volume, although granules became large and fluffy
when feast conditions developed over 100% of the total aerobic volume. “Feast” conditions refer
to the time during aeration when substrate, typically organic based, in bulk solution is high while
“famine” conditions refer to the time during aeration when substrate in bulk solution is low [4].
Multiple AGS-SBR studies have also observed unstable granules when feast conditions are not
properly balanced by adequate famine conditions, thereby suggesting that properly balanced
feast and famine conditions are therefore important for both AGS-SBR and AGS-CFR
applications [5], [6].

178
Specifically, extended famine conditions (i.e., a lower ratio of feast to famine duration)
seemed to be important for the selection of PAO. Enrichment of PAO is important because dense
granules have been observed to have a higher proportion of Candidatus Accumulibacter
phosphatis; a commonly detected PAO [7]. Higher proportions of PAO have also been linked to
higher inorganic content of granules, which leads to increased settling velocity [8], [9]. During
famine conditions, PAO have been observed to maintain a higher reserve of PHA than GAO, and
thereby PAO out-competed GAO during extended famine conditions [10]. Furthermore, manual
removal of bulk substrate from solution before aeration (i.e., reduction of feast conditions)
resulted in increased PHA storage capacity of biomass; from 48% up to 70% of total biomass
weight [11]. Increased PHA content would be related to a higher quantity of PAO and/or GAO,
therefore adequate balancing of feast and famine conditions can lead to the enrichment of PAO
and better performing AGS.
The objectives of this study were to demonstrate the potential for granulation in a pilot-
scale CFR, without selective wasting, while treating low-strength, real domestic wastewater. The
impact of reactor of configuration, specifically the volume ratios of the first to second aerobic
zone, on AGS formation and stability was examined. A larger ratio of the first to second aerobic
zone represented longer feast conditions, while a smaller ratio represented longer famine
conditions. Selective wasting was then incorporated to the optimal reactor configuration to
examine the development of mature AGS under optimal conditions.

179
Methods
Reactor configuration and operation
A modular CFR was constructed out of multiple completely mixed reactors in series.
Thus, the CFR configuration could be changed by adding or removing individual completely
mixed reactors. The modular CFR was constructed from plastic tanks of various working
volumes (i.e., 30-300 L) in series. The tanks were connected via ¾” (i.e., ~1.91 cm) inside
diameter plastic tubing and flow through the CFR was driven by gravity. Wastewater from an
equalization tank was pumped into the first anaerobic zone. RAS was also pumped to the first
anaerobic zone from the pre-anoxic zone. The zones were aligned such that mixed liquor flowed
from the first anaerobic tank and through the second anaerobic tank, first aerobic tank, second
aerobic tank, and clarifier. Clarified effluent was discharged via overflow from the clarifier weirs
and RAS was conveyed by gravity to the pre-anoxic zone.
In configuration 1 the total volume was 740 L with a total anoxic volume of 100 L (i.e.,
13.5% total volume), a total anaerobic volume of 200 L (i.e., 27% total volume), and a total
aerobic volume of 440 L (i.e., 59.5% total volume). In configuration 2 the total volume was 650
L with a total anoxic volume of 120 L (i.e., 18.5% total volume), a total anaerobic volume of 200
L (i.e., 31% total volume), and a total aerobic volume of 330 L (i.e., 50.5% total volume). The
target HRT was 12 h for each configuration. Thus, the target anaerobic and aerobic HRTs in
configuration 1 were 3.2 h and 7 h, respectively. In configuration 2 the target anaerobic and
aerobic HRTs were 3.7 h and 6 h, respectively. The clarifier had a fixed volume of 100 L and
HRT of 1.6 h in configuration 1, and HRT of 1.8 h in configuration 2.

180
A 120 L sidestream selective wasting device was added to configuration 2, which was
determined to be the best performing configuration. The sidestream selective wasting device
drew mixed liquor from the 300 L aerobic tank and subjected biomass to a settling regime before
discharging the light fraction of biomass. The settled biomass in the sidestream selective wasting
device was resuspended and returned to the 300 L aerobic tank. The sidestream selective wasting
device operated on a 4 h cycle with 208-212 min aeration, 8-12 min settling, 10 min discharge of
selective waste, and 10 min idling. During aeration biomass was continuously pumped from the
300 L aerobic tank of configuration 2 to the sidestream selective wasting device. An overflow
from the sidestream selective wasting device, located at a height of 50 cm, allowed for mixed
liquor to be returned to the 300 L aerobic zone. The pump ran at 1.5 L/min, thereby allowing for
3 volume exchanges of the sidestream selective wasting device before each settling period. The
discharge port for selective waste was located at a height of 25 cm, thus the biomass had to travel
25 cm (i.e., 50 cm – 25 cm) within the allocated settling time to be retained in the reactor. At
settling times of 12, 10, and 8 min the respective critical settling velocities were approximately
2.1, 2.5, and 3.1 cm/min.
Each reactor tank was completely mixed with 5” (i.e., 12.7 cm) right-handed propellers
rotated clockwise by mechanical mixers. Aeration grids in the first and second aerobic zone were
constructed from ½” (i.e., ~0.197 cm) copper tubing with holes spaced every 2” (i.e., ~0.787
cm). Air was continuously supplied to the first aerobic zone by a blower and DO in the first
aerobic zone ranged from 2-4 mg/L. Air was intermittently supplied to the second aerobic zone
by a blower turned on at a lower DO limit of 0.5 mg/L and an upper DO limit of 2 mg/L (i.e., IQ
SensorNet 2020, Avensys Solutions Inc., CA). The clarifier had a scum scrapper rotating at 3
rpm to prevent accumulation of float solids. In both configurations, mixed liquor was wasted by

181
pumping from the second aerobic zone for SRT control. The target SRT, by wasting, in both
cases was 40 d. The actual SRT was lower than the target SRT in both cases because of effluent
solids (i.e., an additional point of wasting). The recycle ratio, R, of RAS was targeted to be 1
(i.e., 100% of influent flow).
Source of inoculum
The AGS-CFR was inoculated with conventional activated sludge from a full-scale
biological nutrient removal domestic wastewater treatment plant located in Winnipeg, Canada.
The full-scale process operates a Westbank-type configuration with organic matter oxidation,
nitrification of ammonium, denitrification for TN removal, and enhanced biological phosphorus
removal achieving effluent quality of <15 mg-TN/L and <1 mg-TP/L. The process utilizes
primary clarifiers for the capture of particulate organic matter prior to biological treatment.
Primary solids are fermented at the full-scale plant to yield volatile fatty acids, which are
conveyed to the anaerobic zone of the Westbank-type process to assist enhanced biological
phosphorus removal. It should be noted that the pilot AGS-CFR operated on primary effluent
without the addition of volatile fatty acids from primary solids fermentation. The inoculum was
introduced such that the original TSS concentrations in the AGS-CFR was at least 2 g/L, which
was deemed an adequate concentration for lab-scale AGS-CFR studies [3].

182
During maintenance periods in the full-scale plant (e.g., replacement of fine bubble air
diffusers) 35 mg/L of ferric chloride was added to the raw wastewater after bar screening for
chemically enhanced primary treatment. It should be noted that ferric chloride was added during
start-up of the AGS-CFR (i.e., days 40-100). However, the AGS-CFR was re-seeded with
inoculum before transition to configuration 1 and again re-seeded before transition to
configuration 2. An acclimation phase of 30-40 d after inoculation was allowed before steady
state analysis was considered.
Wastewater characteristics
Effluent from the full-scale plant’s primary clarifiers was supplied to the AGS-CFR. The
primary effluent was continuously gravity-fed to a 600 L equalization tank with hydraulic
circulation/mixing via a submersible pump. To mitigate fermentation the equalization tank was
emptied and cleaned 2-3 d per week. The equalization time provided was 2.5-6.5 h depending on
how much flow was being drawn for the AGS-CFR and other pilot processes. Characteristics of
the primary effluent were quantified on samples from the inlet of the AGS-CFR. The average
COD, TN, and TP were 340±90 mg/L, 55±5 mg/L, and 6.2±0.4 mg/L, respectively during the
operation of configuration 1. The average COD, TN, and TP were 400±100 mg/L, 51±7 mg/L,
and 6±1 mg/L, respectively during the operation of configuration 2.

183
Further characterization of the primary effluent was performed assuming that effluent
filtered-flocculated COD was representative of the influent nbsCOD – Equation 15. This
assumption was reasonable since the target and actual SRTs in both configurations were greater
than 30 d [12]. Thus, the influent bsCOD could be estimated – Equation 16. If the influent
nbpCOD was 0.08 for primary effluent, as typically assumed in conventional activated sludge
models [13], the influent bpCOD could also be estimated – Equation 17. The estimations of
nbsCOD and bsCOD were more reliable than for bpCOD, since bpCOD was not directly
measured and depended on an assumption for nbpCOD. A summary of COD fractions is
summarized in Table 9. Compared to typical fractions, the primary effluent supplied to the AGS-
CFR had lower rapidly biodegradable COD, but in general the wastewater appeared to be more
biodegradable overall (i.e., sum of bsCOD and bpCOD). Furthermore, the fraction of TN that
was TAN was on average 0.72. The fraction of total phosphorus as OP was on average 0.71.
Equation 15
𝑛𝑏𝑠𝐶𝑂𝐷 𝑓𝑓𝐶𝑂𝐷
𝐶𝑂𝐷
Equation 16
𝑏𝑠𝐶𝑂𝐷 𝑓𝑓𝐶𝑂𝐷 𝑓𝑓𝐶𝑂𝐷
𝐶𝑂𝐷
Equation 17
𝑏𝑝𝐶𝑂𝐷 1 𝑛𝑏𝑠𝐶𝑂𝐷 𝑏𝑠𝐶𝑂𝐷 0.08

184
Table 9 Measured/estimated characteristics of equalized primary effluent from a full-scale domestic wastewater treatment plant. Values shown for steady-state operation of configuration 1 and configuration 2 with one standard deviation. Measured/estimated values were compared to default values in conventional modelling software [13].
Analytical methods and calculations
Influent and effluent samples were analyzed for COD, ffCOD (i.e., after flocculation by
zinc sulphate, adjustment to pH 10.5, 15 min sedimentation, and then 0.45 µm filtration; Nalgene
syringe filter, Thermo Scientific, USA), TN, TP (TNTplus, Hach, CA), TAN, nitrite nitrogen,
nitrate nitrogen, and OP (Lachat QuikChem 8500, HACH, CA). Samples for soluble nutrient
analysis that required filtration were treated by medium porosity Q5 filter paper (Fisher
Scientific, CA). MLSS, MLVSS, effluent TSS and VSS, and SVI were analyzed according to
Standard Methods [14]. A SteREO Discovery (Zeiss, DE) was used for microscopic analysis.
ImageJ software was used to assess the cross-sectional area and DF of particles with a cross-
sectional area greater than or equal to 0.03 mm2 (i.e., minimum diameter of 0.2 mm). DF is the
ratio of particle perimeter and pi. The cross-sectional area was used to compute the diameter of a
sphere with the same cross-sectional area (i.e., Ds). One-way analysis of variance (VassarStats,
USA) was used to determine if steady-state data for configuration 1 was significantly different
than for configuration 2 (i.e., α = 0.05).

185
OLR was estimated based on Equation 1. It should be noted that the volume of the
clarifier was neglected in OLR estimations. The actual SRT was estimated according to Equation
18. It should be noted that the mass of solids in the clarifier was neglected for SRT estimations,
and therefore actual SRTs would be higher than estimated. The value for R was estimated
according to Equation 19. Ynet was estimated according to Equation 20.
Equation 18
𝑆𝑅𝑇𝑀𝐿𝑆𝑆 ∙ 𝑉 𝑀𝐿𝑆𝑆 ∙ 𝑉
𝑄 ∙ 𝑀𝐿𝑆𝑆 𝑄 ∙ 𝑇𝑆𝑆
Equation 19
𝑅 𝑀𝐿𝑆𝑆
𝑀𝐿𝑆𝑆 𝑀𝐿𝑆𝑆
Equation 20
𝑌𝑄 ∙ 𝑀𝐿𝑆𝑆 𝑄 ∙ 𝑇𝑆𝑆
𝑄 ∙ 𝐶𝑂𝐷
Results
Reactor performance
The AGS-CFR was inoculated in the summer (i.e., July 10, 2017) and data are presented
for 270 d of operation. Temperature ranged from 16-25 °C and averaged 20±2 °C. The first 100
d were used to adjust operational and design aspects associated with DO control, hydraulics,
overflows, aeration, and other parameters. As previously mentioned, ferric chloride was dosed to
the full-scale primary clarifiers from 40-100 d. During ferric chloride dosing both the full-scale
biological nutrient removal system and the AGS-CFR completely lost nitrification. This was
apparent by the increase in effluent TAN from 40-100 d. After ferric chloride dosing was
stopped, the AGS-CFR was setup in configuration 1 and re-seeded. Nitrification quickly

186
recovered, although on day 110 there was an aeration failure in the second aerobic tank that left
the second aerobic tank without air for 3 d. Consequently, nitrification was impacted and did not
fully recover until 140 d.
Interestingly, OP removal was not influenced by the aeration failure on day 110. In fact,
only nitrification was significantly impacted by the aeration failure. Instead, OP removal was
impacted by the accumulation of solids in the clarifier. During the beginning of the experiment
(i.e., 0-100 d), when the AGS-CFR was being tested for operational issues, the clarifier weirs
frequently clogged. The clarifier was successfully adjusted by day 40, which resulted in an
immediate drop in effluent OP concentrations. For the remaining 230 d of operation (i.e., 40-270
d), there were only a few instances where a scum layer accumulated in the clarifier and caused
increased effluent OP concentrations. Two of these instances occurred between 160-180 d and
resulted in approximately 0.5 mg-P/L effluent OP. Another two instances occurred between 200-
220 d and resulted in close to 1 mg-P/L effluent OP.
For configuration 1, steady-state was observed over 140-180 d. The aeration failure on
110 d delayed the onset of steady-state conditions for configuration 1. The time from 180-210 d
was not considered to contribute to steady-state for configuration 1 since the flow, and therefore
OLR, was increased to test process limits (i.e., not a part of the objectives for this paper). This
resulted in the HRT changing from 12 h to 6 h. However, nitrification was completely lost at the
6 h HRT and recovery of nitrification was not detected during the 30 d period at 6 h HRT. It was
then decided to stop operation in configuration 1, change to configuration 2, and re-seed. The
HRT was increased back to 12 h such that configuration 1 and 2 could be more accurately
compared. The steady-state period for configuration 2 was observed over 240-270 d.

187
Table 10 summarized effluent quality during steady-state operation for configuration 1
and configuration 2. In general, the performance of both configurations was good considering
low-strength primary effluent was treated. Near complete removal of TAN was recorded and
effluent OP averaged 0.2±0.2 mg-P/L in both configurations despite effluent TIN of 22±2 mg/L
in configuration 1 and 17±2 mg/L in configuration 2. Configuration 1 produced higher effluent
TSS and VSS, which were 23±20 mg/L and 20±20 mg/L respectively (i.e., VSS/TSS of 0.87),
than configuration 2. Effluent TSS and VSS in configuration 2 averaged 16±9 mg/L and 14±8
mg/L, respectively (i.e., VSS/TSS of 0.88). Higher effluent VSS in configuration 1 negatively
influenced effluent TP, which averaged 1.4±0.9 mg/L. Effluent TP in configuration 2 was only
0.7±0.2 mg/L. Based on effluent OP and TP concentrations, it was determined that effluent
solids in configuration 1 contained 6% phosphorus (i.e., effluent particulate phosphorus divided
by effluent VSS). Effluent solids in configuration 2 contained 3.6% phosphorus.
Table 10 Average steady-state effluent characteristics for configuration 1 and 2 shown with one standard deviation.

188
Effluent TSS and VSS were most likely higher in configuration 1 due to higher MLSS
and MLVSS concentrations. The MLVSS in configuration 1 averaged 2.5±0.2 g/L while it
averaged 1.7±0.3 g/L in configuration 2. This would have resulted in higher solids loading rate to
the clarifier when configuration 1 was operated. Furthermore, the flow of primary effluent to
configuration 1 was higher than to configuration 2 (i.e., configuration 1 had a larger total volume
than configuration 2, but the same HRT of 12 h was maintained). The solids loading rate to the
clarifier while configuration 1 was operated averaged 1 kg-TSS/(m2•d), while it averaged 0.5 kg-
TSS/(m2•d) for configuration 2. It is interesting to note that the VSS/TSS of reactor biomass in
configuration 1 was 0.81 and 0.77 in configuration 2. In both cases the reactor biomass had
significantly lower VSS/TSS than effluent solids. Comparable results have been recorded in lab-
scale reactors [3].
Due to similar general arrangement of configuration 1 and 2, which was to supply all
primary effluent to a protected anaerobic zone (i.e., the pre-anoxic zone removed nitrites/nitrates
via endogenous respiration), most of the influent carbon was utilized for enhanced biological
phosphorus removal. Thus, TN removal depended completely upon endogenous denitrification in
the pre-anoxic zone and simultaneous nitrification-denitrification in the aerobic zones. The
COD/TN of primary effluent supplied to configuration 1 ranged from 5.3-8.0 (i.e., average of
6.4±0.8), while for configuration 2 it ranged from 4.4-11.5 (i.e., average of 8±2). Although the
COD/TN between configurations did not vary significantly (i.e., P = 0.0572), the lower average
COD/TN for configuration 1 may partially explain the 5 mg/L difference in effluent TIN
between configuration 1 and 2. As well, it should be noted that influent TN averaged 54.5 mg/L
for configuration 1 and 50.8 mg/L for configuration 2, which differed by 3.7 mg-N/L. However,
the difference in primary effluent TN concentration supplied to configuration 1 and 2 was not

189
determined to be significantly different (i.e., P = 0.1067). Thus, difference in average COD/TN
and average TN of the primary influent may not have explained the statistically significant
difference in effluent TIN between configurations (i.e., P <0.0001).
Nitrogen and phosphorus profiles
Steady-state concentrations of nitrogen and phosphorus species were monitored in each
reactor zone – Figure 33. In general, trends were similar between configuration 1 and
configuration 2. Primary effluent and RAS were pumped to the first anaerobic zone. A majority
of the total phosphorus released occurred in the first anaerobic zone. The average OP
concentration in the first anaerobic zone of configuration 1 was 31±6 mg-P/L (i.e., 91% of total
phosphorus release) and 32±3 mg-P/L (i.e., 73% of total phosphorus release) in configuration 2.
The OP concentration in the second anaerobic zone was 34±8 mg-P/L in configuration 1 and
44±3 mg-P/L in configuration 2. Nitrite and nitrate in both the first and second anaerobic zones
was not detected in either configuration. As well, the concentration of TAN in both the first and
second anaerobic zones was stable in either configuration, ranging from 20-22 mg/L on average.

190
Figure 33 Steady-state reactor nutrient profiles for configuration 1 and 2 without selective wasting. Error bars represent one standard deviation.
191
In the first aerobic zone, which was the biggest difference between configuration 1 and 2
(i.e., the first aerobic zone in configuration 1 was 140 L while it was only 30 L in configuration
2), there was a significant difference in nutrient profiles. For instance, in configuration 1 the
TAN was 10±3 mg/L and nitrate was 9±6 mg-N/L, while nitrite was only 0.8±0.2 mg-N/L. The
OP was also significantly removed in the first aerobic zone of configuration 1, averaging 2±3
mg-P/L. However, in configuration 2 there was significantly higher TAN in the first aerobic
zone, which averaged 17±1 mg/L. Furthermore, there was less nitrate, at 0.6±0.5 mg-N/L, and
more nitrite, at 2.6±0.4 mg-N/L, in the first aerobic zone of configuration 2. There was also less
phosphorus uptake in the first aerobic zone of configuration 2, with OP averaging 24±4 mg-P/L.
In general, these results indicated that the metabolic rates, and potentially metabolic pathways, in
the first aerobic zone of configuration 1 and 2 were significantly different.
In the second aerobic zone and the final clarifier there was less of a difference between
configuration 1 and configuration 2. The TAN in the second aerobic zone averaged 0.2±mg/L for
configuration 1 and 0.2±0.2 mg/L for configuration 2. Similarly, TAN in the clarifier of
configuration 1 averaged 0.3±0.4 mg/L while it averaged 0.3±0.2 mg/L for configuration 2. The
average OP for both the second aerobic zone and clarifier, for both configurations, ranged from
0.1-0.2 mg-P/L and the maximum standard deviation was 0.2 mg-P/L. There was a significant
difference in the nitrite, nitrate, and TIN concentrations between configurations 1 and 2. Nitrite
averaged 0.4±0.2 mg-N/L and 0.5±0.1 mg-N/L in the second aerobic zone and clarifier,
respectively, of configuration 1. In configuration 2 the nitrite was much higher, averaging
3.3±0.5 mg-N/L in the second aerobic zone and 3.4±0.5 mg-N/L in the clarifier. For this reason,
the nitrate concentration in the second aerobic zone and clarifier of configuration 2. For instance,

192
nitrate was 20±3 mg-N/L in both the second aerobic zone and clarifier of configuration 1 while
nitrate was 13±2 mg-N/L in both the second aerobic zone and clarifier of configuration 2.
Interestingly, there was a significant difference in TIN concentration (i.e., P <0.0001) for
the second aerobic zone and clarifier between configuration 1 and 2. The TIN averaged 20±3
mg-N/L in the second aerobic zone and clarifier of configuration 1, while in the second aerobic
zone and clarifier of configuration 2 TIN averaged 17±2 mg-N/L and 16±2 mg-N/L,
respectively. The lower TIN in configuration 2 suggested that nitrogen removal was enhanced in
configuration 2 compared to configuration 1. Furthermore, examination of the TIN profile for
configuration 2 (i.e., Figure 1) clearly depicted a drop in TIN from the second anaerobic zone
(i.e., 22±2 mg-N/L) to the clarifier (i.e., 16±2 mg-N/L). In configuration 1 there was no
significant decrease in TIN from the second anaerobic zone (i.e., 20±1mg-N/L) to the clarifier
(i.e., 20±3 mg-N/L). Therefore, it can be concluded that configuration 2 had experienced
simultaneous nitrification-denitrification while configuration 1 did not. As previously discussed,
differences in average COD/TN and average TN of the primary influent supplied to
configurations 1 and 2 were not significantly different, thus the significant drop of TIN across
the aerobic zones in configuration 2 suggested that simultaneous nitrification-denitrification was
the driving factor behind lower TIN in the effluent of configuration 2.
Lastly, there was also a significant difference between configuration 1 and 2 regarding
nutrient concentrations in the pre-anoxic zone. Specifically, the difference was significant for
nitrate and OP concentrations in the pre-anoxic zone. For example, nitrate in the pre-anoxic zone
of configuration 1 averaged 9±3 mg-N/L, while it averaged below detection (i.e., detection limit
of 0.2 mg-N/L) for configuration 2. The OP concentration in the pre-anoxic zone averaged
0.2±0.1 mg-P/L for configuration 1 and 3±3 mg-P/L for configuration 2. The inability of the pre-

193
anoxic zone in configuration 1 to fully remove nitrate versus the complete removal of nitrate in
configuration 2 demonstrated that both residual carbon sources (e.g., polyhydroxyalkanoate) and
the contact time for endogenous respiration were insufficient for full denitrification. Recalling
that the pre-anoxic zone of configuration 1 was 100 L and configuration 2 was 120 L, the anoxic
HRT of configuration 1 was 1.6 h while the anoxic HRT of configuration 2 was 2.2 h. On the
other hand, the full removal of nitrate in the pre-anoxic zone of configuration 2 demonstrated
that contact time and residual carbon sources were sufficient for full denitrification and
fermentation, either to volatile fatty acid used by conventional PAO [15] or glucose used by
species such as Tetrasphaera [16], which resulted in the release of OP.
Biomass characteristics and morphology
A summary of steady state operational parameters is displayed in Table 11. The MLSS in
the second aerobic zone of configuration 1 stabilized at 3.1±0.3 g/L while in configuration 2 the
MLSS stabilized at 2.2±0.4 g/L. Based on MLSS of the second aerobic zone alone, configuration
2 was 71% of the biomass in configuration 1. However, the MLSS of RAS, which was also the
MLSS in the pre-anoxic zone, was 5.7±0.8 g/L in configuration 1 and 5.2±0.7 g/L in
configuration 2. The difference in MLSS of RAS meant that the actual R was different between
configurations. The target R was 1 in both cases, but the measured R was 1.3±0.2 in
configuration 1 and 0.8±0.2 in configuration 2. Considering the respective volumes of individual
zones, the overall mass of MLSS was 2.45±0.08 kg in configuration 1 and 1.9±0.1 kg in
configuration 2. Thus, the biomass in configuration 2 was 78% of the biomass in configuration 1.
The VSS/TSS in configuration 1 was 0.8±0.1, while it was 0.8±0.2 in configuration 2.

194
Table 11 Summary of steady-state operational parameters for configuration 1 and 2 shown with one standard deviation. Target values indicated the planned values while estimated values indicated estimations from operational data.
The 22% (i.e., 100% minus 78%) difference in weight of biomass between configuration
1 and 2 was not the result of changing the total volume between configuration 1 and
configuration 2 because HRT of 12 h was targeted in both cases. Thus, the steady state OLR was
similar between configuration 1, at 0.73±0.05 kg-COD/(m3•d), and configuration 2, at 0.8±0.2
kg-COD/(m3•d). Furthermore, there was no significant difference detected in the estimated SRT,
which was 31 d in configuration 1 and 32 d in configuration 2. A reasonable explanation for the
22% difference in weight of biomass between configurations was that the ratio of anoxic,
anaerobic, and aerobic volumes was significantly different between configurations, therefore
resulting in different metabolisms. For instance, it is well known that anaerobic and anoxic yields
are lower than aerobic yields [13]. Interestingly, Ynet was estimated to be 0.15±0.08 kg-TSS/kg-
COD in configuration 1 and 0.12±0.04 kg-TSS/kg-COD in configuration 2. Thus, Ynet in
configuration 2 was also less than in configuration 1 (i.e., 20% lower). However, the difference
in Ynet between configurations was not determined to be significantly different (i.e., P = 0.3695).
195
Steady state SVI in configuration 1 was 110±20 mL/g-MLSS (i.e., n = 13), while SVI in
configuration 2 was 84±9 mL/g-MLSS (i.e., n = 11) – Figure 34. The difference in SVI between
configurations was determined to be significantly different (i.e., P = 0.0006). Both configurations
had significantly lower SVI than the control, which was 400±100 mL/g-MLSS (i.e., n = 3). Thus,
both configuration 1 and configuration 2 significantly improved settleability of the inoculum,
which was expected of an AGS process. Steady-state Ds of granular sludge in configuration 1
was 0.24±0.03 mm and the DF/DS was 1.9±0.4 (i.e., n = 74). In configuration 2 the steady-state
DS of granular sludge was 0.3±0.1 mm and the DF/DS was 1.8±0.3 (i.e., n = 109). Values for
DF/DS greater than 1 demonstrated that the granules in configuration 1 and 2 were slightly
irregular.
The SVI of biomass in configuration 2 decreased significantly with the introduction of
selective wasting (i.e., P <0.0001). Within 30 d the SVI decreased to <60 mL/g-MLSS, which is
indicative of a well settling sludge. The maximum size of granules did not significantly change
with selective wasting (i.e., max Ds in configuration 2 without selective wasting was 0.92 mm
while it was 0.64 mm with selective wasting), but the presence of larger granules was much
higher. Average Ds of granular sludge in configuration 2 with selective wasting, 12-48 d after
the introduction of selective wasting, was 0.4±0.1 mm and the Df/Ds was 1.4±0.2. The lower
Df/Ds value with selective wasting indicated that selective wasting resulted in more uniform and
regularly shaped granules.

196
Figure 34 Top – steady-state SVI of configuration 1 and 2 without selective wasting (SW) and configuration 2 with selective wasting compared to inoculum. Error bars represented one standard deviation; Bottom – trend in SVI with the introduction of selective wasting to configuration 2.

197
Although the average DS in configuration 1 and 2 seemed similar, they were determined
to be significantly different (i.e., P = 0.0011). The difference in average DS between
configuration was due to the wider range of particle sizes in configuration 2 – Figure 35. For
instance, the minimum, first quartile, median, third quartile, and maximum DS in configuration 1
were 0.20 mm, 0.21 mm, 0.24 mm, 0.26 mm, and 0.36 mm, respectively. In configuration 2 the
minimum, first quartile, median, third quartile, and maximum DS were 0.20 mm, 0.23 mm, 0.25
mm, 0.29 mm, and 0.92 mm, respectively. Thus, 25% of granular sludge particles were between
0.26-0.36 mm in configuration 1, while 25% of granular sludge particles were between 0.29-0.92
mm in configuration 2.
Larger granules in configuration 2 may also be related to the simultaneous nitrification-
denitrification observed in configuration 2. In fact, a recent study had suggested that the optimal
range of DS for nutrient removal by AGS was 0.28-0.45 mm [17]. In configuration 2, 29% of
granular sludge particles fell within the optimal range while only 14% of the granular sludge
particles in configuration 1 fell within the optimal range. Furthermore, considering that particles
larger than 0.45 mm would also have contributed to simultaneous nitrification-denitrification,
although not at the optimal rate [17], configuration 2 could have had 38% of the granular sludge
particles contributing to simultaneous nitrification-denitrification.

198
The higher percentage of granules in the optimal range for simultaneous nitrification-
denitrification may have explained why configuration 2 had better TIN removal resulting from a
reduction of TIN across the aerobic zones. This would have also explained why configuration 2
with selective wasting had the best TN removal overall, since it had the highest proportion of
large granules and therefore potentially the most simultaneous nitrification-denitrification -
Figure 35. With selective wasting, the proportion of granules in the optimal range for
simultaneous nitrification-denitrification was even higher. The minimum, first quartile, median,
third quartile, and maximum Ds in configuration 2 with selective wasting were 0.22 mm, 0.26
mm, 0.28 mm, 0.42 mm, and 0.64 mm, respectively, 12-48 d after selective wasting was
initiated. With selective wasting in configuration 2, 39% of the granules fell within the optimal
range for simultaneous nitrification-denitrification while 56% of the granules could have been
contributing to simultaneous nitrification-denitrification in general.

199
Figure 35 Top – particle size analysis for configuration 1, configuration 2 without selective wasting, and configuration 2 with selective wasting; Bottom – total nitrogen removal for configuration 1 (i.e., steady state), configuration 2 without selective wasting (i.e., steady state), and configuration 2 with selective wasting (i.e., 12-48 d after selective wasting was started). Error bars represented one standard deviation.

200
Summary
A mature aerobic granular sludge was cultivated within 40 d in a continuous flow reactor
treating real primary effluent without VFA addition. Effluent OP was <0.2 mg/L and effluent
TIN was <10 mg/L with 0.4±0.1 mm granules and a SVI <60 mL/g-MLVSS. Total nitrogen
removal improved with the appearance and higher proportion of larger granules. Selective
wasting was required to accumulate larger granules and wash-out the light, flocculent fraction of
biomass. The pilot-scale AGS-CFR showed a high degree of performance and demonstrated that
aerobic granular sludge is suitable for continuous flow applications involving low-strength,
domestic wastewater following primary treatment. These results create the possibility for AGS
technology to be applied to existing plug-flow type bioreactors.

201
Bibliography
[1] J. Zou, Y. Tao, J. Li, S. Wu, and Y. Ni, “Cultivating aerobic granular sludge in a
developed continuous-flow reactor with two-zone sedimentation tank treating real and
low-strength wastewater,” Bioresour. Technol., vol. 247, no. July 2017, pp. 776–783,
2018.
[2] S. F. Corsino, R. Campo, G. Di Bella, M. Torregrossa, and G. Viviani, “Study of aerobic
granular sludge stability in a continuous-flow membrane bioreactor,” Bioresour. Technol.,
vol. 200, pp. 1055–1059, 2016.
[3] T. R. Devlin and J. A. Oleszkiewicz, “Cultivation of aerobic granular sludge in continuous
flow under various selective pressure,” Bioresour. Technol., vol. 253, 2018.
[4] T. Vjayan and V. M. Vadivelu, “Effect of famine-phase reduced aeration on
polyhydroxyalkanoate accumulation in aerobic granules,” Bioresour. Technol., vol. 245,
no. July, pp. 970–976, 2017.
[5] S. F. Corsino, M. Capodici, M. Torregrossa, and G. Viviani, “Fate of aerobic granular
sludge in the long-term: The role of EPSs on the clogging of granular sludge porosity,” J.
Environ. Manage., vol. 183, pp. 541–550, 2016.
[6] S. F. Corsino, A. di Biase, T. R. Devlin, G. Munz, M. Torregrossa, and J. A.
Oleszkiewicz, “Effect of extended famine conditions on aerobic granular sludge stability
in the treatment of brewery wastewater,” Bioresour. Technol., 2016.
[7] O. Henriet, C. Meunier, P. Henry, and J. Mahillon, “Improving phosphorus removal in
aerobic granular sludge processes through selective microbial management,” Bioresour.
Technol., vol. 211, pp. 298–306, 2016.

202
[8] W. Huang et al., “Species and distribution of inorganic and organic phosphorus in
enhanced phosphorus removal aerobic granular sludge,” Bioresour. Technol., vol. 193, pp.
549–552, 2015.
[9] M.-K. H. Winkler, R. Kleerebezem, M. Strous, K. Chandran, and M. C. M. van
Loosdrecht, “Factors influencing the density of aerobic granular sludge,” Appl. Microbiol.
Biotechnol., vol. 97, no. 16, pp. 7459–7468, 2013.
[10] M. Carvalheira, A. Oehmen, G. Carvalho, and M. A. M. Reis, “Survival strategies of
polyphosphate accumulating organisms and glycogen accumulating organisms under
conditions of low organic loading,” Bioresour. Technol., vol. 172, pp. 290–296, 2014.
[11] E. Korkakaki, M. C. M. van Loosdrecht, and R. Kleerebezem, “Survival of the fastest:
Selective removal of the side population for enhanced PHA production in a mixed
substrate enrichment,” Bioresour. Technol., vol. 216, pp. 1022–1029, 2016.
[12] H. Melcer et al., Methods for wastewater characterization in activated sludge modeling.
Water Environment Research Foundation, 2003.
[13] Envirosim, “BioWin 5.0.” 2017.
[14] APHA, AWWA, and WEF, Standard Methods for the examination of water &
wastewater, 22nd ed. 2012.
[15] P. Jabari, Q. Yuan, and J. A. Oleszkiewicz, “Overall effect of carbon production and
nutrient release in sludge holding tank on mainstream biological nutrient removal
efficiency,” Environ. Technol. (United Kingdom), vol. 0, no. 0, pp. 1–21, 2017.
[16] R. Kristiansen et al., “A metabolic model for members of the genus Tetrasphaera involved

203
in enhanced biological phosphorus removal,” ISME J., vol. 7, no. 3, pp. 543–554, 2013.
[17] Z.-H. Li, Y.-M. Zhu, Y.-L. Zhang, Y.-R. Zhang, C.-B. He, and C.-J. Yang,
“Characterization of aerobic granular sludge of different sizes for nitrogen and phosphorus
removal,” Environ. Technol., vol. 0, no. 0, pp. 1–10, 2018.

204
Chapter 9: Modelling the AGS-CFR with BioWinTM
Introduction
Although significant progress on AGS-CFRs for low-strength wastewater was made,
there are still many future studies that could be performed. One of the most important would be
to study the microbiome during and after granulation, as well as throughout seasonal operation.
Analysis of the microbiome would be important to assess which microorganisms were present
before and after granulation, and whether those microorganisms were quickly or gradually
washed out, or if new microorganisms appeared rapidly or slowly. Information on the
microbiome could be used to develop optimized start-up strategies that would result in efficient
transition from flocculent to granular biomass. The information could also be used to re-evaluate
existing activated sludge models such as BioWinTM. The objective of this study was to see if the
results from Chapter 8, without selective wasting, could be estimated by BioWinTM. As well,
parameters significantly impacting the modelled results were determined and described.
Methods
Results from Chapter 8 were first modelled with default BioWinTM kinetic and
stoichiometric parameters (i.e., Appendix D). Default BioWinTM parameters were then modified
to best match simulated results with the actual measured data from Chapter 6.
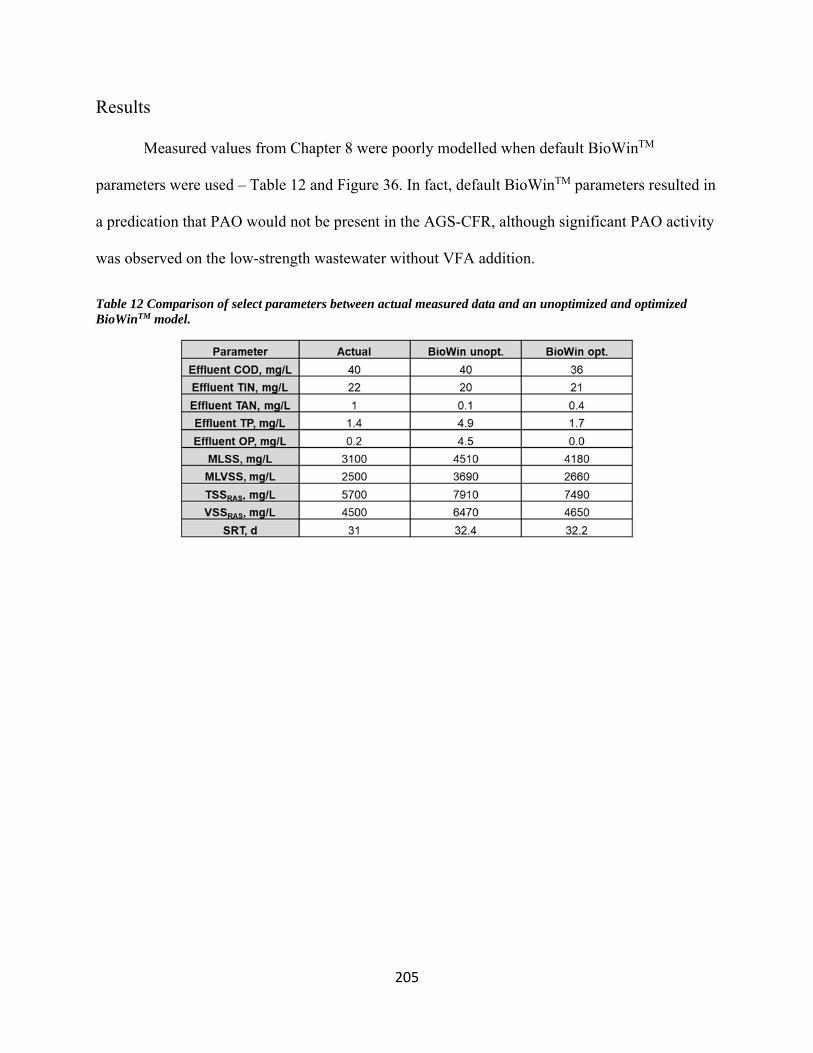
205
Results
Measured values from Chapter 8 were poorly modelled when default BioWinTM
parameters were used – Table 12 and Figure 36. In fact, default BioWinTM parameters resulted in
a predication that PAO would not be present in the AGS-CFR, although significant PAO activity
was observed on the low-strength wastewater without VFA addition.
Table 12 Comparison of select parameters between actual measured data and an unoptimized and optimized BioWinTM model.

206
Figure 36 Comparison of nutrient profiles between actual measured data and an optimized and unoptimized BioWinTM model.
Iterative optimization uncovered multiple default BioWinTM parameters that did not
represent the kinetics or stoichiometry of the AGS-CFR in Chapter 8. The set of optimized
parameters clearly demonstrated that the differences between the actual measured data and
BioWinTM default parameters converged on a few elements: 1) hydrolysis; 2) nitrifiers; 3) OHO;
and 4) PAO – Table 13. For instance, the optimized parameters mostly regarded hydrolysis rates,
fermentation kinetics, PAO kinetics, and the yields of OHO and PAO. It was expected that
hydrolysis rates and fermentation kinetics were both changed, since hydrolysis and fermentation
process both act to reduce complex COD to readily bioavailable compounds that are utilized by
PAO.

207
Table 13 Summary of default and optimized BioWinTM parameters.
Furthermore, it was not that surprising that both OHO and PAO parameters had to be
changed, since more recent studies have alluded to a PAO that can ferment more complex COD
itself [1]. For instance, members of the Tetrasphaera genus are known to ferment glucose before
using it for glycogen storage. A single species performing the work of both fermentative OHO
and PAO would explain why the yields of OHO and PAO had to be reduced by more than half of
the default values, since a single species may perform the reaction in a single step (i.e., therefore
approximately half the yield of OHO and PAO performing the same steps in series). BioWinTM
does not account for a self-fermenting PAO, and thus OHO and PAO end up being of equal
abundance in the optimized model (i.e., Figure 37), while instead it may only be one group of
microorganisms. These results clearly demonstrated why metagenomic studies would be
important to improve existing activated sludge models, such as by incorporating self-fermenting
PAO.

208
Figure 37 Relative abundance of select microbial guilds from the optimized BioWinTM model.
209
Bibliography
[1] R. Kristiansen, H.T.T. Nguyen, A.M. Saunders, J.L. Nielsen, R. Wimmer, V.Q. Le, S.J.
McIlroy, S. Petrovski, R.J. Seviour, A. Calteau, K.L. Nielsen, P.H. Nielsen, A metabolic
model for members of the genus Tetrasphaera involved in enhanced biological phosphorus
removal, ISME J. 7 (2013) 543–554. doi:10.1038/ismej.2012.136.

210
Chapter 10: Engineering Significance
Overview of conclusions
Several conclusions were drawn from the research items contributing to this thesis. The
following list is a brief overview of the major conclusions impacting engineering decisions:
1. Granulation occurred with low-strength substrate (i.e., COD <300 mg/L; COD:TP <50);
2. Hydrodynamic shear force, in excess of shear provided by aeration, was not required;
3. A minimum USAV of 0.2 cm/s per kg-COD/(m3•d) was recommended;
4. Wasting of granules stabilized AGS at high OLR and lower USAV;
5. Granulation was possible in CFRs with low-strength substrate;
6. F/M should not exceed 1.2 kg-COD/(kg-VSS•d) during granulation;
7. Selective wasting enhanced AGS structure, and frequency of granules, in a CFR; and
8. Properly balanced “feast” and “famine” conditions enhanced granulation in a CFR.
Engineering significance
Low-strength wastewater
With average influent of 340±30 mg/L COD, 42±5 mg/L TN, and 7±1 mg/L TP an AGS-
SBR achieved effluent OP of 0.2±0.4 mg-P/L and effluent TIN of 17 mg-N/L. Aerobic granular
sludge formed and matured, from conventional activated sludge inoculum, within 40 d while
treating the synthetic proteinaceous medium. The AGS remained stable for the remaining 120 d
experimentation period with an average F/M of 0.25±0.08 g-COD/(g-VSS•d). These results
clearly demonstrated that properly designed AGS processes could overcome the barriers others
have experienced with low-strength wastewater [1,2].

211
Low-strength wastewater was used in all studies besides that presented in Chapter 4,
which examined high-strength brewery wastewater instead. All studies successfully cultivated
AGS whether it was on synthetic proteinaceous medium or primary effluent from a full-scale
domestic wastewater treatment facility. The full-scale primary effluent averaged 310±60 mg/L
COD, 48±9 mg/L TN, and 5.7±0.9 mg/L TP and stable AGS did not lose performance despite
COD as low as 269 mg/L and ffCOD as low as 44 mg/L. Thus, in addition to the Chapter 2
confirming the suitability of AGS to treat low-strength wastewater, it was repeatedly
demonstrated that granulation could be achieved on different sources of low-strength wastewater.
These results are important because they provided repeatable instances of successful granulation
on low-strength wastewater. Therefore, these results should provide confidence to those
interested in using AGS to treat low-strength wastewaters, such as municipal wastewaters in
North America. A summary of operational parameters for AGS treating low-strength wastewater
is presented in Table 14.
Table 14 Summary of operational parameters for AGS treating low-strength wastewater.

212
Hydrodynamic shear force
Chapter 3 examined the influence of increasing OLR on AGS-SBR operation under low
hydrodynamic shear force. Specifically, USAV in the AGS-SBRs was 0.41 cm/s while OLR
increased from 1.36 kg-COD/(m3•d) to 2.52 kg-COD/(m3•d) to 5.20 kg-COD/(m3•d). At 0.41
cm/s and 1.36 kg-COD/(m3•d), a mature AGS developed within 40 d. At OLR of 2.52 kg-
COD/(m3•d) a mature AGS developed within a month, but filamentous microorganisms were
detected on granule surfaces approximately 15 d after mature AGS development. Granules at
OLR of 2.52 kg-COD/(m3•d) and USAV of 0.41 cm/s were fully coated by a filamentous surface
layer within two months from inoculation. At OLR of 5.20 kg-COD/(m3•d) large granules
developed rapidly, within two days, but then quickly destabilized. For the remaining four months
of experimentation, biomass in the SBR with OLR of 5.20 kg-COD/(m3•d) and USAV of 0.41
cm/s appeared as filaments joined together by a white, viscous substance that was likely a
mixture of EPS and some cells.
It was also demonstrated in Chapter 5 that wastewater treatment with nitrification would
approach an A/A of 1 sooner than wastewater treatment without nitrification. This was because
nitrification requires additional oxygen to biologically oxidize ammonium to nitrate. Therefore,
USAV may not be an important parameter for AGS at municipal wastewater treatment facilities
where complete nutrient removal was required. On the other hand, AGS may be less ideal for
high-strength, organic wastewater with nitrogen deficiency (i.e., where nitrification would not be
required). The reason being that additional aeration might be required to achieve the minimum
USAV to guarantee AGS stability. However, it is possible that shear could be provided via
different means, for example at high intensity for shorter duration, to minimize energy demand.

213
Solids retention time control at high organic loading rates
An alternative method for stabilizing AGS, compared to high hydrodynamic shear force,
was examined in Chapter 4 while treating brewery wastewater. Specifically, the controlled
wasting of AGS, in addition to the selective wasting of slowly-settling biomass, was examined at
OLR from 1.5-4.5 kg-COD/(m3•d) and low USAV of 0.51 cm/s. The measured whole sludge
SRT was approximately 7 d under all OLR. Previously, in Chapter 3, a minimum USAV of 0.2
cm/s per kg-COD/(m3•d) was recommended to maintain stable AGS. Thus, at 4.5 kg-
COD/(m3•d) the USAV should have been 0.9 cm/s to generate stable AGS. However, it was
demonstrated that controlled wasting of AGS helped maintain stable AGS under lower USAV.
Therefore, controlled wasting of AGS could allow for lower USAV, thereby reducing
aeration requirements. For municipal wastewater treatment, where nitrification was required, the
USAV could be achieved by the airflow required for wastewater treatment. However, additional
aeration would be required for purely heterotrophic processes, such as AGS for brewery
wastewater treatment. Thus, controlled wasting of AGS would be an effective strategy for
wastewaters with high organic content and low nitrogen content, or for applications where
nitrification was not required.

214
Selective wasting in continuous flow reactors
Chapter 7 examined the formation of AGS in a CFR treating low-strength, proteinaceous
wastewater (i.e., COD = 370±30 mg/L; TN = 43±7 mg/L; and TP = 10±2 mg/L) under increasing
selective pressure at OLR of 1.5 kg-COD/(m3•d). A continuously-stirred clarifier was used to
out-select the light fraction of biomass at 20 °C by operating at Re between 1500-5000 (i.e., 7-25
rpm with a 5” propeller). Successful granulation was observed, although below 15 rpm a
flocculent-granular biomass was developed and above 20 rpm large granules with a filamentous
population formed. A visual representation of the granulation process as a function of selective
pressure (i.e., low = 7 rpm, high = 25 rpm) is presented in Figure 38.
Figure 38 Visual representation of granulation as a function of selective pressure in CFRs.
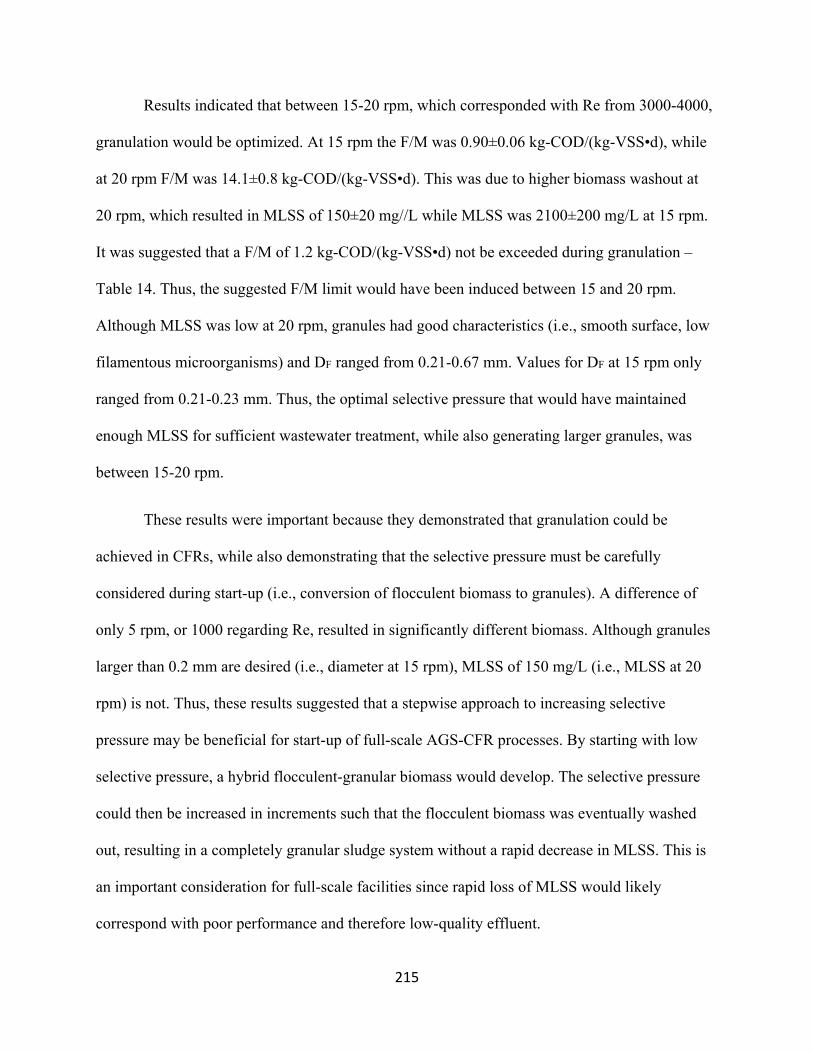
215
Results indicated that between 15-20 rpm, which corresponded with Re from 3000-4000,
granulation would be optimized. At 15 rpm the F/M was 0.90±0.06 kg-COD/(kg-VSS•d), while
at 20 rpm F/M was 14.1±0.8 kg-COD/(kg-VSS•d). This was due to higher biomass washout at
20 rpm, which resulted in MLSS of 150±20 mg//L while MLSS was 2100±200 mg/L at 15 rpm.
It was suggested that a F/M of 1.2 kg-COD/(kg-VSS•d) not be exceeded during granulation –
Table 14. Thus, the suggested F/M limit would have been induced between 15 and 20 rpm.
Although MLSS was low at 20 rpm, granules had good characteristics (i.e., smooth surface, low
filamentous microorganisms) and DF ranged from 0.21-0.67 mm. Values for DF at 15 rpm only
ranged from 0.21-0.23 mm. Thus, the optimal selective pressure that would have maintained
enough MLSS for sufficient wastewater treatment, while also generating larger granules, was
between 15-20 rpm.
These results were important because they demonstrated that granulation could be
achieved in CFRs, while also demonstrating that the selective pressure must be carefully
considered during start-up (i.e., conversion of flocculent biomass to granules). A difference of
only 5 rpm, or 1000 regarding Re, resulted in significantly different biomass. Although granules
larger than 0.2 mm are desired (i.e., diameter at 15 rpm), MLSS of 150 mg/L (i.e., MLSS at 20
rpm) is not. Thus, these results suggested that a stepwise approach to increasing selective
pressure may be beneficial for start-up of full-scale AGS-CFR processes. By starting with low
selective pressure, a hybrid flocculent-granular biomass would develop. The selective pressure
could then be increased in increments such that the flocculent biomass was eventually washed
out, resulting in a completely granular sludge system without a rapid decrease in MLSS. This is
an important consideration for full-scale facilities since rapid loss of MLSS would likely
correspond with poor performance and therefore low-quality effluent.

216
Feast and famine conditions in continuous flow reactors
The ratio of feast to famine conditions was studied in Chapter 8. An AGS-CFR was
operated without selective wasting and two feast to famine ratios: 1) 0.47 v/v; and 2) 0.1 v/v.
Primary effluent from a full-scale municipal wastewater treatment plant was supplied to the
AGS-CFR. The OLR was 0.7-0.8 g-COD/(m3•d). At lower feast to famine ratio, granulation was
enhanced. For instance, SVI was 110±20 mL/g-VSS at feast to famine ratio of 0.47 while SVI
was 86±8 mL/g-VSS at feast to famine ratio of 0.1. Both feast to famine ratios had significantly
better SVI than the inoculum, which was 400±100 mL/g-VSS. This could be attributed to the
overall reactor configuration, operated as anoxic/extended anaerobic/aerobic, versus the
mainstream reactor, operated as anoxic/anaerobic/anoxic/aerobic with VFA supplement, where
the inoculum originated. As well, granules were larger at lower feast to famine ratio. Values for
DS ranged from 0.20-0.36 mm at feast to famine ratio of 0.47, while Ds ranged from 0.20-0.92
mm at feast to famine ratio of 0.1. Therefore, it could be concluded that a short feast period
followed by extended famine conditions benefited granulation in CFRs.
These results were important because they demonstrated design criteria for reactor
configuration. Specifically, these results suggested that lower feast to famine ratios are beneficial
for granulation, and therefore full-scale AGS-CFR facilities should be designed to ensure the
development and transition from feast to famine conditions. In plug-flow reactors there will be a
gradual transition, over reactor length, from feast to famine conditions. Defined barriers between
feast and famine conditions in existing plug-flow reactors could be installed via baffles.
Similarly, existing CMRs could be retrofitted by splitting existing basins into two or more
basins, either by installing baffles or new tank walls.

217
Summary of findings
Experimental data clearly demonstrated that granulation, both in SBR and CFR, could be
attained on low-strength wastewater. In fact, granulation was enhanced by extended famine
conditions. Therefore low-strength wastewater may even improve granulation as long as
adequate feast conditions develop. However, precautions should be taken to ensure that feast and
famine conditions are properly balanced, thereby enhancing the granulation process. Feast and
famine conditions represent a necessary, dynamic relationship between substrate concentrations
and microorganisms required for successful and stable granulation. During feast conditions,
organic substrate concentrations are high, representing a surplus of available energy compared to
what would be required for biomass growth. As a result, the system, under feast conditions,
favours the growth of EPS producing microbial strains, which invest a significant portion of the
energy they capture into EPS production. The EPS may help initiate and mature microbial
adhesion, whether through EPS mediated tethering or by increasing the attractive force between
cells, AGS aggregates, and/or other organic material that may otherwise be hydrophilic.
Therefore, feast conditions represent a necessary step towards the development of strong and
stable biofilms, including AGS.
Extended famine conditions are also important and are required to balance the EPS
production phase during feast conditions. During famine conditions, organic substrate
concentrations are low, representing energy-limited conditions and therefore low availability of
energy for growth. During famine conditions, microorganisms may consume some fractions of
the EPS produced during the feast phase. As a result, the EPS matrix is modified, potentially
increasing porosity of the EPS matrix which subsequently enhances diffusion rates. Adequate
diffusion is required for anaerobic substrate utilization, thus extended famine conditions may,

218
indirectly, improve anaerobic substrate utilization. Extended famine conditions may also help
slow-growing microorganisms out-compete fast-growing microorganisms through endogenous
respiration mediated selective pressures. During extended famine conditions, microorganisms
must rely on internal storage product to perform basic cellular maintenance functions. Fast-
growing microorganisms, which are typically associated with higher decay rates, would be
negatively impacted during extended famine conditions and their viable population would be
significantly reduced. Slow-growing microorganisms, especially slow-growing microorganism
capable of maintaining enough internal storage product reserves such as PAO, would be able to
keep basic cellular maintenance functions active during extended famine conditions. Therefore,
their population would not be significantly impacted by extended famine conditions. Extended
famine conditions are a necessary step towards stable AGS, both structurally and for maintaining
a desirable microbial community.
It was demonstrated that selective pressure also plays a role in the success of granulation
for CFRs. During the conversion of existing, flocculent CFR processes to AGS, the selective
pressure should be gradually increased, thereby maintaining high concentrations of active
biomass leading to high effluent quality. This would allow for the gradual development of
granules, ultimately resulting in AGS replacing flocculent biomass. The selective wasting
process could be any physical process capable of separating AGS from flocculent biomass, as
well as other low-density, undesirable matter. For instance, selective wasting can be induced by
differential settling, such as in gravity settlers or hydrocyclones, or by size exclusion, such as
sieves. It would be desirable for the selective wasting process be as flexible as possible, allowing
for different selective pressures and wasting regimes to be employed.

219
For this reason, size exclusion based on sieve size may be the least appealing. Similarly,
hydrocyclones would have a narrow range of operating conditions. Therefore, gravity settling in
batch mode may be the most attractive. Batch methods allow for flexibility by changing the
number of wasting cycles per day, as well as the volume wasted per cycle. Batch gravity settling
would also provide flexibility in terms of the selective pressure applied. For instance, the time
allocated for settling could be adjusted based on real-time process parameters. If a higher
proportion of granules was desired, the settling time could be shortened and/or the frequency of
wasting cycles increased, thereby increasing the selective pressure applied. On the other hand, if
excessive washout was observed, the settling time could be increased and/or the frequency of
wasting cycles decreased. The well-engineered use of selective wasting, coupled with adequately
balanced feast and famine conditions, has great potential for integrating AGS into CFRs.
Lastly, it was demonstrated that high hydrodynamic shear force was not a requirement for
granulation, and that the airflow provided for nitrification facilities would be enough to maintain
AGS stability based on USAV. If additional attrition was required to stabilize AGS, it could be a
process, aeration or otherwise, that provided shear at high intensity for a shorter duration
immediately before the selective wasting process. As long as the shear was of sufficient time-
intensity to provide the necessary attrition for scouring of undesirable matter from the surface of
AGS. Thereby, AGS particles would be scoured of undesirable surface coatings immediately
before selective wasting, allowing for the undesirable materials, whether particulate organic
matter or filamentous microorganisms, to be removed with the selective waste. Furthermore, it
was demonstrated that lower airflow, and therefore USAV, could be used if controlled wasting of
AGS was employed. This could represent significant savings in electricity requirements for
aeration at industrial facilities.

220
Recommendations for future studies
Although significant progress on AGS-CFRs for low-strength wastewater was made,
there are still many future studies that can be performed. The most pertinent are discussed below:
1. Study microbiome during and after granulation
It would be important to study the microbiome during and after granulation to assess
which microorganisms were present before and after granulation, and whether those
microorganisms were quickly or gradually washed out, or if new microorganisms appeared
rapidly or slowly. That information could then be used to develop optimized start-up strategies
that would result in efficient transition from flocculent to granular biomass. The information
could also be used to improve existing activated sludge models. Chapter 9 clearly demonstrated
that default kinetic and stoichiometric parameters in BioWinTM did not adequately represent the
AGS-CFR from Chapter 8.
2. Study EPS fractions and incorporate into activated sludge models
Another critical factor to the formation and stability of AGS is the development and
maintenance of an EPS matrix. As of now, many mainstream activated sludge models, including
BioWinTM, do not consider the formation and breakdown of EPS components. However, some
do consider the formation of storage compounds and the generation of microbial product from
endogenous respiration – Figure 39. The examination of EPS production and modification in
AGS could lead to modelled parameters that track the generation of AGS, and even biofilm,
processes. Furthermore, the integration of EPS production and modification mechanisms into
activated sludge models could result in more accurate predictions of AGS particle size, as well as
biofilm thickness.

221
Figure 39 Representation of existing activated sludge models (left) versus what components could be integrated with further studies into EPS production and modification in AGS (right).
3. Develop and optimize a control system
Lastly, it was demonstrated that successful implementation of an AGS-CFR would
require the development and maintenance of defined feast and famine conditions. Thus, a control
system should be developed that can track feast and famine conditions in real-time, as well as
relay online measurements to operational parameters such as the variable frequency drive on
blowers, to standby blowers of swing zones, to the RAS pump, and other parameters. Stable
granulation depends on the constant formation and maintenance of new and old AGS, thus
control systems that monitor system performance in these regards are critical to both SBR and
CFR applications of AGS.

222
Bibliography
[1] A. Jafari Kang, Q. Yuan, Long-term stability and nutrient removal efficiency of aerobic
granules at low organic loads, Bioresour. Technol. 234 (2017) 336–342.
doi:10.1016/j.biortech.2017.03.057.
[2] J. Leong, B. Rezania, D.S. Mavinic, Aerobic granulation utilizing fermented municipal
wastewater under low pH and alkalinity conditions in a sequencing batch reactor.,
Environ. Technol. 37 (2016) 55–63. doi:10.1080/09593330.2015.1063704.

223
Appendix A
Determination of DF and DS
ImageJ is a free program package for image processing that can be downloaded from
http://rsb.info.nih.gov/ij/download.html. ImageJ can be used to assess particle size distribution.
The following steps were taken to obtain reliable results:
1. Set scale – A scale must be provided to obtain measurements in units other than pixels.
Go to Analyze > Set Scale. Input the known distance, which is used to convert between
pixels and the desired unit. The known distance can be determined from a reference item,
such as the scale bar on microscopic images.
2. Remove the background – In most cases the background can interfere with ImageJ’s
capability to differentiate between discrete particles and noise. In the case of granular
sludge, the particles are granules and background noise can originate from flocculent or
filamentous biomass. The noise can be reduced by removing the background. Go to
Image > Duplicate. On the duplicated image go to Process > Filters > Gaussian Blurr
and apply a value for radius between 20-50 pixels (i.e., value may change depending on
substrate, lighting conditions, etc.). The Gaussian blurr converts the duplicate image to an
image of just the background, which can then be removed from the original image. Go to
Process > Image Calculator and subtract the duplicated image from the original image.
The resulting image should clearly show the granules with reduced background noise.
3. Adjust the brightness – Go to Image > Adjust > Brightness/Contrast and select
automatic. Manually adjust the brightness afterwards such that the brightness/contrast
between granules and the background is optimized.

224
4. Convert to 8-bit – Go to Image > Type > 8-bit. This converts the image to greyscale,
which is required for the next step.
5. Find a threshold for the image – Go to Image > Adjust > Threshold. The sliders must be
adjusted in such a way that the granules appear as dark spots in the black and white
mode.
6. Remove scale, fill in particles, remove “bad” particles – The image should now appear
completely in black and white. Therefore, the paintbrush and paint-can icons can be used
to remove the scale bar, fill in particles, and remove “bad” particles. To remove the scale
bar, convert it to white. Particles can be filled in black with the paintbrush or paint-can.
“Bad” particles, which mostly refers to particles existing on the border (i.e., total area
cannot be measured, and their inclusion will skew results) can be removed by converting
them to white.
7. Reduce surface irregularities and make sure particles are discrete – Go to Process >
Binary > Erode. The erode function can be used to remove surface irregularities, such as
filamentous microorganisms. However, use of the erode function may also require some
back filling of the particles (i.e., paintbrush or paint-can black). Lastly, overlapping
granules should be adjusted such that each particle is discrete, and therefore can be
measured as a single particle. Use the white paintbrush with a thin line to separate
particles.
8. Analyze the particles – Go to Analyze > Set Measurements and select Area and Feret’s
diameter. Go to Analyze > Analyze Particles. Set the lower limit of Size to the cutoff
diameter (i.e., if the cutoff diameter is 0.2 mm, the cutoff size is the corresponding area
of 0.0314 mm2) and select ok.

225
A sample analysis for granular sludge, according to the described steps, is presented below:
Step 1.
Scale bar of 1 mm was determined to be 150 pixels.
Step 2.
minus equals

226
Step 3.
Step 4.

227
Step 5.
Step 6.

228
Step 7.
Step 8.

229
Appendix B
One-way ANOVA
One-way analysis of variance (ANOVA) tests the null hypothesis (i.e., H0 = there is no
relationship between two or more measured phenomena) by analyzing the differences among
group means in a sample. It assumes independence, normality, and homoscedasticity.
“VassarStats: Website for Statistical Computation” was used to perform one-way ANOVA (i.e.,
http://www.vassarstats.net). Sample calculations are provided for a scenario where three parallel
bioreactors, which were identical besides the pH (i.e., pH controlled at 7, 8, and 9), were treating
the same wastewater and effluent nitrite was quantified (i.e., H0 = there is no relationship
between pH and effluent nitrite). Steady-state data is presented below:
Day of steady-state pH = 7 pH = 8 pH = 9
1 0.2 0.6 4.3
3 0.2 0.5 5.2
5 0.3 0.6 4.8
8 0.2 0.4 4.9
10 0.4 0.7 5.0
12 0.2 0.5 5.2
15 0.2 0.6 4.7
P was <0.0001 (i.e., α = 0.05), therefore H0 was rejected and there is a significant relationship
between reactor pH and effluent nitrite. A print-out of the analysis is presented on the following
pages.

230

231

232

233
Appendix C
Determination of rmax
Values for rmax were determined from the maximum slope of concentration for the respective
nutrient (i.e., orthophosphate or nitrite/nitrate) and mixed liquor volatile suspended solids in the
reactor during kinetic tests, according to the following equation:
𝑟𝑚 ,
𝑀𝐿𝑉𝑆𝑆
The following discussion will provide examples for the determination of rmax, NOx-N prod.. During
start-up (i.e., first month), NOx-N was produced at a constant rate throughout aeration:
Therefore, the maximum slope was 0.1337 mg-N/L per min. Converting to hours, the slope
became approximately 8 mg-N/L per h. At that point in time, the mixed liquor volatile suspended
solids were 2.3 g/L. Therefore, rmax, NOx-N prod. was equal to 8 divided by 2.3, or approximately 3.5
mg-N/(g-VSS•h).

234
As the reactors began to approach steady-state, the NOx-N concentration would plateau about 60
min into aeration:
Thus, the maximum slope was calculated by linear regression only for points contributing to the
maximum recorded slope. In this example, the maximum slope was 0.2143 mg-N/L per min, or
approximately 13 mg-N/L per h. At that point in time, the mixed liquor volatile suspended solids
were 4.5 g/L. Therefore, rmax, NOx-N prod. was equal to 13 divided by 4.5, or approximately 3 mg-
N/(g-VSS•h).

235
Appendix D
BioWinTM model of the AGS-CFR
The AGS-CFR configuration was first set-up in BioWinTM:
Next, the appropriate reactor volumes were incorporated, along with operational parameters
(e.g., dissolved oxygen values, recycle ratios, waste activated sludge flows). The influent
element was adjusted to steady-state concentrations and fractions for the full-scale primary
effluent. Steady-state simulations were run, and a single kinetic or stoichiometric parameter was
changed until the optimal output (i.e., closest matching to measured data) was obtained. A report
of the optimized BioWinTM is provided on the following pages.
Influent Anaerobic 1 Anaerobic 2 Aerobic 1 Aerobic 2
Pre-anoxic
Effluent
Sludge

236
BioWin user and configuration data
Project details
Project name: AGS-CFR simulation Project ref.: PhD AF
Plant name: UoM User name: TRD
Created: 17/08/2018 Saved: 29/08/2018
Steady state solution
Total SRT: 32.25 days
Temperature: 20.0°C
Flowsheet
Influent Anaerobic 1 Anaerobic 2 Aerobic 1 Aerobic 2
Pre-anoxic
Effluent
Sludge

237
BioWin Album
Album page – Reactor profile
Ammonia N Nitrite N Nitrate N Total inorganic N Soluble PO4-P
Pre-anoxic Anaerobic 1 Anaerobic 2 Aerobic 1 Aerobic 2
Concentration (mg/L)
26
25
24
23
22
21
20
19
18
17
16
15
14
13
12
11
10
9
8
7
6
5
4
3
2
1
0
0.7
19.9
21.3
9.0
0.40.1 0.0 0.0
0.90.1
9.1
0.70.0
11.2
20.9
9.9
20.721.3 21.1 21.4
3.2
10.6
25.2
0.80.0

238
Album page – Influent concentrations
Album page – Mixed liquor
Album page – Effluent concentrations
Total suspended solids Volatile suspended solids Total COD Total NAmmonia N Total P Soluble PO4-P
InfluentConcentration (mg/L
400
300
200
100
0
60.2 49.9
340.0
54.0 40.56.2 4.7
Total suspended solids Volatile suspended solids
Aerobic 2 Pre-anoxic
Concentration (mg/L)
8,000
6,000
4,000
2,000
0
4,282.3
7,488.3
2,661.0
4,648.8
Total suspended solids Volatile suspended solids Total COD Total inorganic NAmmonia N Total P Soluble PO4-P
EffluentConcentration (mg/L
40
30
20
10
0
19.8
12.3
36.4
21.4
0.4 1.7 0.0

239
Album page – Microorganisms
Global Parameters
Common
Name Default Value
Hydrolysis rate [1/d] 2.1000 0.5000 1.0290
Hydrolysis half sat. [-] 0.0600 0.0600 1.0000
Anoxic hydrolysis factor [-] 0.2800 3.0000 1.0000
Anaerobic hydrolysis factor (AS) [-] 0.0400 3.0000 1.0000
Anaerobic hydrolysis factor (AD) [-] 0.5000 0.5000 1.0000
Adsorption rate of colloids [L/(mgCOD d)] 0.1500 0.1500 1.0290
Ammonification rate [L/(mgCOD d)] 0.0800 0.0800 1.0290
Assimilative nitrate/nitrite reduction rate [1/d] 0.5000 0.5000 1.0000
Endogenous products decay rate [1/d] 0 0 1.0000
Ammonia oxidizing biomass (AOB) Nitrite oxidizing biomass (NOB)Ordinary heterotrophic organisms (OHO) Polyphosphate accumulating organisms (PAO)
Aerobic 2
Concentration (mg/L)
560
540
520
500
480
460
440
420
400
380
360
340
320
300
280
260
240
220
200
180
160
140
120
100
80
60
40
20
0
86.1
53.1
514.1531.8

240
AOB
Name Default Value
Max. spec. growth rate [1/d] 0.9000 0.6000 1.0720
Substrate (NH4) half sat. [mgN/L] 0.7000 0.7000 1.0000
Byproduct NH4 logistic slope [-] 50.0000 50.0000 1.0000
Byproduct NH4 inflection point [mgN/L] 1.4000 1.4000 1.0000
AOB denite DO half sat. [mg/L] 0.1000 0.1000 1.0000
AOB denite HNO2 half sat. [mgN/L] 5.000E-6 5.000E-6 1.0000
Aerobic decay rate [1/d] 0.1700 0.1700 1.0290
Anoxic/anaerobic decay rate [1/d] 0.0800 0.0800 1.0290
KiHNO2 [mmol/L] 0.0050 0.0050 1.0000
NOB
Name Default Value
Max. spec. growth rate [1/d] 0.7000 0.6000 1.0600
Substrate (NO2) half sat. [mgN/L] 0.1000 0.1000 1.0000
Aerobic decay rate [1/d] 0.1700 0.1700 1.0290
Anoxic/anaerobic decay rate [1/d] 0.0800 0.0800 1.0290
KiNH3 [mmol/L] 0.0750 0.0750 1.0000
AAO
Name Default Value
Max. spec. growth rate [1/d] 0.2000 0.2000 1.1000
Substrate (NH4) half sat. [mgN/L] 2.0000 2.0000 1.0000
Substrate (NO2) half sat. [mgN/L] 1.0000 1.0000 1.0000
Aerobic decay rate [1/d] 0.0190 0.0190 1.0290
Anoxic/anaerobic decay rate [1/d] 0.0095 0.0095 1.0290
Ki Nitrite [mgN/L] 1000.0000 1000.0000 1.0000
Nitrite sensitivity constant [L / (d mgN) ] 0.0160 0.0160 1.0000

241
OHO
Name Default Value
Max. spec. growth rate [1/d] 3.2000 3.2000 1.0290
Substrate half sat. [mgCOD/L] 5.0000 5.0000 1.0000
Anoxic growth factor [-] 0.5000 0.5000 1.0000
Denite N2 producers (NO3 or NO2) [-] 0.5000 0.5000 1.0000
Aerobic decay rate [1/d] 0.6200 0.6200 1.0290
Anoxic decay rate [1/d] 0.2330 0.2330 1.0290
Anaerobic decay rate [1/d] 0.1310 0.1310 1.0290
Fermentation rate [1/d] 1.6000 3.0000 1.0290
Fermentation half sat. [mgCOD/L] 5.0000 0.0100 1.0000
Fermentation growth factor (AS) [-] 0.2500 0.2500 1.0000
Free nitrous acid inhibition [mol/L] 1.000E-7 1.000E-7 1.0000
Methylotrophs
Name Default Value
Max. spec. growth rate [1/d] 1.3000 1.3000 1.0720
Methanol half sat. [mgCOD/L] 0.5000 0.5000 1.0000
Denite N2 producers (NO3 or NO2) [-] 0.5000 0.5000 1.0000
Aerobic decay rate [1/d] 0.0400 0.0400 1.0290
Anoxic/anaerobic decay rate [1/d] 0.0300 0.0300 1.0290
Free nitrous acid inhibition [mmol/L] 1.000E-7 1.000E-7 1.0000
PAO
Name Default Value
Max. spec. growth rate [1/d] 0.9500 1.9000 1.0000
Max. spec. growth rate, P-limited [1/d] 0.4200 0.4200 1.0000
Substrate half sat. [mgCOD(PHB)/mgCOD(Zbp)] 0.1000 0.1000 1.0000
Substrate half sat., P-limited [mgCOD(PHB)/mgCOD(Zbp)] 0.0500 0.0500 1.0000

242
Magnesium half sat. [mgMg/L] 0.1000 0.1000 1.0000
Cation half sat. [mmol/L] 0.1000 0.1000 1.0000
Calcium half sat. [mgCa/L] 0.1000 0.1000 1.0000
Aerobic/anoxic decay rate [1/d] 0.1000 0.1000 1.0000
Aerobic/anoxic maintenance rate [1/d] 0 0 1.0000
Anaerobic decay rate [1/d] 0.0400 0.0400 1.0000
Anaerobic maintenance rate [1/d] 0 0 1.0000
Sequestration rate [1/d] 4.5000 4.5000 1.0000
Anoxic growth factor [-] 0.3300 0.3300 1.0000
Acetogens
Name Default Value
Max. spec. growth rate [1/d] 0.2500 0.2500 1.0290
Substrate half sat. [mgCOD/L] 10.0000 10.0000 1.0000
Acetate inhibition [mgCOD/L] 10000.0000 10000.0000 1.0000
Anaerobic decay rate [1/d] 0.0500 0.0500 1.0290
Aerobic/anoxic decay rate [1/d] 0.5200 0.5200 1.0290
Methanogens
Name Default Value
Acetoclastic max. spec. growth rate [1/d] 0.3000 0.3000 1.0290
H2-utilizing max. spec. growth rate [1/d] 1.4000 1.4000 1.0290
Acetoclastic substrate half sat. [mgCOD/L] 100.0000 100.0000 1.0000
Acetoclastic methanol half sat. [mgCOD/L] 0.5000 0.5000 1.0000
H2-utilizing CO2 half sat. [mmol/L] 0.1000 0.1000 1.0000
H2-utilizing substrate half sat. [mgCOD/L] 1.0000 1.0000 1.0000
H2-utilizing methanol half sat. [mgCOD/L] 0.5000 0.5000 1.0000
Acetoclastic propionic inhibition [mgCOD/L] 10000.0000 10000.0000 1.0000
Acetoclastic anaerobic decay rate [1/d] 0.1300 0.1300 1.0290

243
Acetoclastic aerobic/anoxic decay rate [1/d] 0.6000 0.6000 1.0290
H2-utilizing anaerobic decay rate [1/d] 0.1300 0.1300 1.0290
H2-utilizing aerobic/anoxic decay rate [1/d] 2.8000 2.8000 1.0290
pH
Name Default Value
OHO low pH limit [-] 4.0000 4.0000
OHO high pH limit [-] 10.0000 10.0000
Methylotrophs low pH limit [-] 4.0000 4.0000
Methylotrophs high pH limit [-] 10.0000 10.0000
Autotrophs low pH limit [-] 5.5000 5.5000
Autotrophs high pH limit [-] 9.5000 9.5000
PAO low pH limit [-] 4.0000 4.0000
PAO high pH limit [-] 10.0000 10.0000
OHO low pH limit (anaerobic) [-] 5.5000 5.5000
OHO high pH limit (anaerobic) [-] 8.5000 8.5000
Propionic acetogens low pH limit [-] 4.0000 4.0000
Propionic acetogens high pH limit [-] 10.0000 10.0000
Acetoclastic methanogens low pH limit [-] 5.0000 5.0000
Acetoclastic methanogens high pH limit [-] 9.0000 9.0000
H2-utilizing methanogens low pH limit [-] 5.0000 5.0000
H2-utilizing methanogens high pH limit [-] 9.0000 9.0000
Switches
Name Default Value
OHO DO half sat. [mgO2/L] 0.0500 0.0500
PAO DO half sat. [mgO2/L] 0.0500 0.0500
Anoxic/anaerobic NOx half sat. [mgN/L] 0.1500 0.1500
AOB DO half sat. [mgO2/L] 0.2500 0.2500

244
NOB DO half sat. [mgO2/L] 0.5000 0.5000
AAO DO half sat. [mgO2/L] 0.0100 0.0100
Anoxic NO3(->NO2) half sat. [mgN/L] 0.1000 0.1000
Anoxic NO3(->N2) half sat. [mgN/L] 0.0500 0.0500
Anoxic NO2(->N2) half sat. (mgN/L) 0.0100 0.0100
NH3 nutrient half sat. [mgN/L] 0.0050 0.0050
PolyP half sat. [mgP/mgCOD] 0.0100 0.0100
VFA sequestration half sat. [mgCOD/L] 5.0000 0.0100
P uptake half sat. [mgP/L] 0.1500 0.1500
P nutrient half sat. [mgP/L] 0.0010 0.0010
Autotroph CO2 half sat. [mmol/L] 0.1000 0.1000
H2 low/high half sat. [mgCOD/L] 1.0000 1.0000
Propionic acetogens H2 inhibition [mgCOD/L] 5.0000 5.0000
Synthesis anion/cation half sat. [meq/L] 0.0100 0.0100
Common
Name Default Value
Biomass volatile fraction (VSS/TSS) 0.9200 0.9200
Endogenous residue volatile fraction (VSS/TSS) 0.9200 0.9200
N in endogenous residue [mgN/mgCOD] 0.0700 0.0700
P in endogenous residue [mgP/mgCOD] 0.0220 0.0220
Endogenous residue COD:VSS ratio [mgCOD/mgVSS] 1.4200 1.4200
Particulate substrate COD:VSS ratio [mgCOD/mgVSS] 1.6000 1.6000
Particulate inert COD:VSS ratio [mgCOD/mgVSS] 1.6000 1.6000
Molecular weight of other anions [mg/mmol] 35.5000 35.5000
Molecular weight of other cations [mg/mmol] 39.1000 39.1000

245
AOB
Name Default Value
Yield [mgCOD/mgN] 0.1500 0.1500
AOB denite NO2 fraction as TEA [-] 0.5000 0.5000
Byproduct NH4 fraction to N2O [-] 0.0025 0.0025
N in biomass [mgN/mgCOD] 0.0700 0.0700
P in biomass [mgP/mgCOD] 0.0220 0.0220
Fraction to endogenous residue [-] 0.0800 0.0800
COD:VSS ratio [mgCOD/mgVSS] 1.4200 1.4200
NOB
Name Default Value
Yield [mgCOD/mgN] 0.0900 0.0900
N in biomass [mgN/mgCOD] 0.0700 0.0700
P in biomass [mgP/mgCOD] 0.0220 0.0220
Fraction to endogenous residue [-] 0.0800 0.0800
COD:VSS ratio [mgCOD/mgVSS] 1.4200 1.4200
AAO
Name Default Value
Yield [mgCOD/mgN] 0.1140 0.1140
Nitrate production [mgN/mgBiomassCOD] 2.2800 2.2800
N in biomass [mgN/mgCOD] 0.0700 0.0700
P in biomass [mgP/mgCOD] 0.0220 0.0220
Fraction to endogenous residue [-] 0.0800 0.0800
COD:VSS ratio [mgCOD/mgVSS] 1.4200 1.4200

246
OHO
Name Default Value
Yield (aerobic) [-] 0.6660 0.3000
Yield (fermentation, low H2) [-] 0.1000 0.1000
Yield (fermentation, high H2) [-] 0.1000 0.1000
H2 yield (fermentation low H2) [-] 0.3500 0.3500
H2 yield (fermentation high H2) [-] 0 0
Propionate yield (fermentation, low H2) [-] 0 0
Propionate yield (fermentation, high H2) [-] 0.7000 0.7000
CO2 yield (fermentation, low H2) [-] 0.7000 0.7000
CO2 yield (fermentation, high H2) [-] 0 0
N in biomass [mgN/mgCOD] 0.0700 0.0700
P in biomass [mgP/mgCOD] 0.0220 0.0220
Endogenous fraction - aerobic [-] 0.0800 0.0800
Endogenous fraction - anoxic [-] 0.1030 0.1030
Endogenous fraction - anaerobic [-] 0.1840 0.1840
COD:VSS ratio [mgCOD/mgVSS] 1.4200 1.4200
Yield (anoxic) [-] 0.5400 0.5400
Yield propionic (aerobic) [-] 0.6400 0.6400
Yield propionic (anoxic) [-] 0.4600 0.4600
Yield acetic (aerobic) [-] 0.6000 0.6000
Yield acetic (anoxic) [-] 0.4300 0.4300
Yield methanol (aerobic) [-] 0.5000 0.5000
Adsorp. max. [-] 1.0000 1.0000
Max fraction to N2O at high FNA over nitrate [-] 0.0500 0.0500
Max fraction to N2O at high FNA over nitrite [-] 0.1000 0.1000

247
Methylotrophs
Name Default Value
Yield (anoxic) [-] 0.4000 0.4000
N in biomass [mgN/mgCOD] 0.0700 0.0700
P in biomass [mgP/mgCOD] 0.0220 0.0220
Fraction to endogenous residue [-] 0.0800 0.0800
COD:VSS ratio [mgCOD/mgVSS] 1.4200 1.4200
Max fraction to N2O at high FNA over nitrate [-] 0.1000 0.1000
Max fraction to N2O at high FNA over nitrite [-] 0.1500 0.1500
PAO
Name Default Value
Yield (aerobic) [-] 0.6390 0.3000
Yield (anoxic) [-] 0.5200 0.5200
Aerobic P/PHA uptake [mgP/mgCOD] 0.9300 1.0500
Anoxic P/PHA uptake [mgP/mgCOD] 0.3500 0.3500
Yield of PHA on sequestration [-] 0.8890 0.9900
N in biomass [mgN/mgCOD] 0.0700 0.0700
N in sol. inert [mgN/mgCOD] 0.0700 0.0700
P in biomass [mgP/mgCOD] 0.0220 0.0220
Fraction to endogenous part. [-] 0.2500 0.2500
Inert fraction of endogenous sol. [-] 0.2000 0.2000
P/Ac release ratio [mgP/mgCOD] 0.5100 0.5100
COD:VSS ratio [mgCOD/mgVSS] 1.4200 1.4200
Yield of low PP [-] 0.9400 0.9400
Mg to P mole ratio in polyphosphate [mmolMg/mmolP] 0.3000 0.3000
Cation to P mole ratio in polyphosphate [meq/mmolP] 0.1500 0.1500
Ca to P mole ratio in polyphosphate [mmolCa/mmolP] 0.0500 0.0500
Cation to P mole ratio in organic phosphate [meq/mmolP] 0.0100 0.0100

248
Acetogens
Name Default Value
Yield [-] 0.1000 0.1000
H2 yield [-] 0.4000 0.4000
CO2 yield [-] 1.0000 1.0000
N in biomass [mgN/mgCOD] 0.0700 0.0700
P in biomass [mgP/mgCOD] 0.0220 0.0220
Fraction to endogenous residue [-] 0.0800 0.0800
COD:VSS ratio [mgCOD/mgVSS] 1.4200 1.4200
Methanogens
Name Default Value
Acetoclastic yield [-] 0.1000 0.1000
Methanol acetoclastic yield [-] 0.1000 0.1000
H2-utilizing yield [-] 0.1000 0.1000
Methanol H2-utilizing yield [-] 0.1000 0.1000
N in acetoclastic biomass [mgN/mgCOD] 0.0700 0.0700
N in H2-utilizing biomass [mgN/mgCOD] 0.0700 0.0700
P in acetoclastic biomass [mgP/mgCOD] 0.0220 0.0220
P in H2-utilizing biomass [mgP/mgCOD] 0.0220 0.0220
Acetoclastic fraction to endog. residue [-] 0.0800 0.0800
H2-utilizing fraction to endog. residue [-] 0.0800 0.0800
Acetoclastic COD:VSS ratio [mgCOD/mgVSS] 1.4200 1.4200
H2-utilizing COD:VSS ratio [mgCOD/mgVSS] 1.4200 1.4200

249
Appendix E
Hydrodynamic shear force versus airflow
Airflow requirements were compared for a reactor with the following dimensions and dissolved
oxygen:
SWL V D DO
m m3 m mg/L
5 1571 20 6
The dimensions and dissolved oxygen were changed to see the sensitivity of airflow to design
and operational parameters. Three airflows were calculated as a function of organic loading rate:
1) the airflow to achieve a minimum upflow superficial air velocity (i.e., hydrodynamic shear
force); 2) the airflow for a heterotrophic reactor (i.e., no nitrification); and 3) the airflow for a
nitrification reactor. The following equations were used to calculate the airflows.
For hydrodynamic shear force:
𝑈𝑆𝐴𝑉 𝑂𝐿𝑅
5
𝐴𝑖𝑟𝑓𝑙𝑜𝑤 𝑈𝑆𝐴𝑉 ∙ 𝐴
For the heterotrophic reactor (i.e., assuming 0.5 BOD/COD and 1.6 bCOD/BOD):
𝑃 , 𝑌 ∙ 1.6 ∙ 0.5 ∙ 𝑂𝐿𝑅 ∙ 𝑉 ∙1 𝑓 ∙ 𝑏 ∙ 𝑆𝑅𝑇
1 𝑏 ∙ 𝑆𝑅𝑇
𝑅 1.6 ∙ 0.5 ∙ 𝑂𝐿𝑅 ∙ 𝑉 1.42 ∙ 𝑃 ,
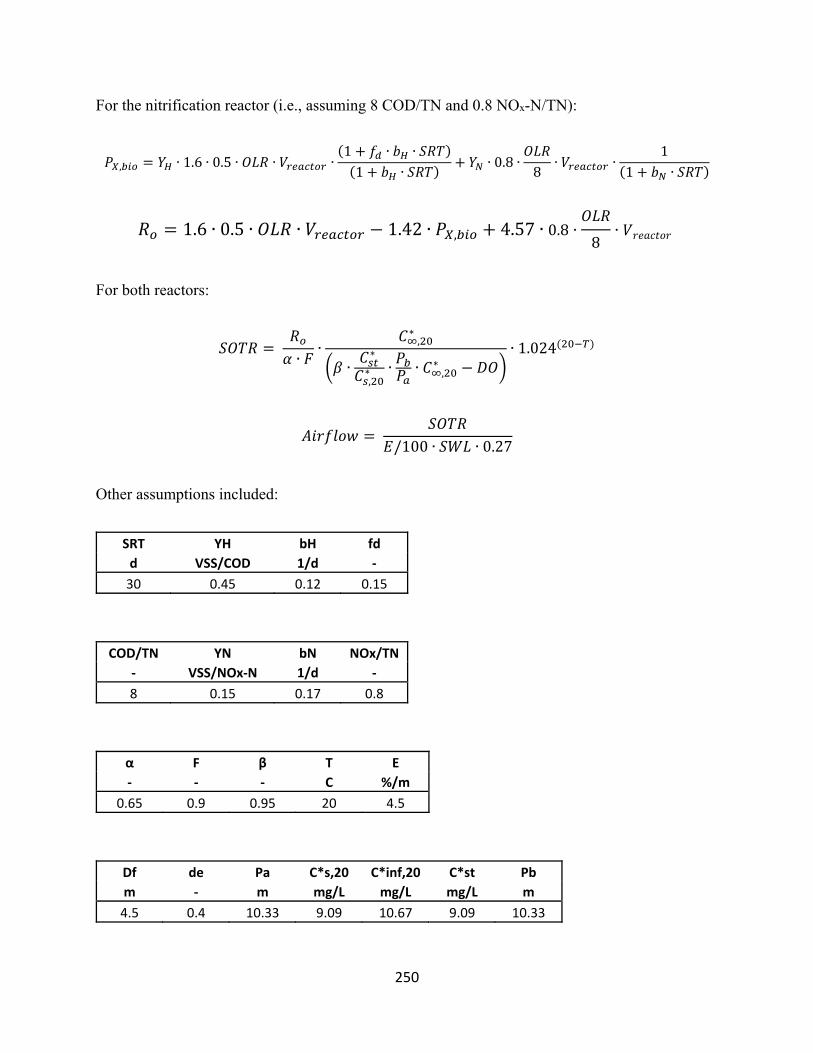
250
For the nitrification reactor (i.e., assuming 8 COD/TN and 0.8 NOx-N/TN):
𝑃 , 𝑌 ∙ 1.6 ∙ 0.5 ∙ 𝑂𝐿𝑅 ∙ 𝑉 ∙1 𝑓 ∙ 𝑏 ∙ 𝑆𝑅𝑇
1 𝑏 ∙ 𝑆𝑅𝑇𝑌 ∙ 0.8 ∙
𝑂𝐿𝑅8
∙ 𝑉 ∙1
1 𝑏 ∙ 𝑆𝑅𝑇
𝑅 1.6 ∙ 0.5 ∙ 𝑂𝐿𝑅 ∙ 𝑉 1.42 ∙ 𝑃 , 4.57 ∙ 0.8 ∙𝑂𝐿𝑅
8∙ 𝑉𝑟𝑒𝑎𝑐𝑡𝑜𝑟
For both reactors:
𝑆𝑂𝑇𝑅 𝑅
𝛼 ∙ 𝐹∙
𝐶 ,∗
𝛽 ∙𝐶∗
𝐶 ,∗ ∙
𝑃𝑃 ∙ 𝐶 ,
∗ 𝐷𝑂∙ 1.024
𝐴𝑖𝑟𝑓𝑙𝑜𝑤 𝑆𝑂𝑇𝑅
𝐸/100 ∙ 𝑆𝑊𝐿 ∙ 0.27
Other assumptions included:
SRT YH bH fd
d VSS/COD 1/d ‐
30 0.45 0.12 0.15
COD/TN YN bN NOx/TN
‐ VSS/NOx‐N 1/d ‐
8 0.15 0.17 0.8
α F β T E
‐ ‐ ‐ C %/m
0.65 0.9 0.95 20 4.5
Df de Pa C*s,20 C*inf,20 C*st Pb
m ‐ m mg/L mg/L mg/L m
4.5 0.4 10.33 9.09 10.67 9.09 10.33

251
The following table depicts the results of airflow for all three cases (i.e., for the design and
operational parameters presented at the beginning of the Appendix):
Case USAV HET AUT
OLR Airflow Airflow Airflow
kg‐COD/(m3∙d) m3/min m3/min m3/min
0.0 0 0 0
0.5 19 25 43
1.0 38 50 86
1.5 57 75 128
2.0 75 100 171
2.5 94 124 214
3.0 113 149 257
3.5 132 174 300
4.0 151 199 343
4.5 170 224 385
5.0 188 249 428
5.5 207 274 471
6.0 226 299 514
6.5 245 323 557
7.0 264 348 600
7.5 283 373 642
8.0 302 398 685
8.5 320 423 728
9.0 339 448 771
9.5 358 473 814
10.0 377 498 857
10.5 396 523 899
11.0 415 547 942
11.5 434 572 985
12.0 452 597 1028
12.5 471 622 1071
13.0 490 647 1113
13.5 509 672 1156
14.0 528 697 1199
14.5 547 722 1242
15.0 565 746 1285
15.5 584 771 1328
16.0 603 796 1370
16.5 622 821 1413
17.0 641 846 1456
17.5 660 871 1499
18.0 679 896 1542
18.5 697 921 1585
19.0 716 946 1627
19.5 735 970 1670
20.0 754 995 1713


![Original Research The Formation and Stabilization of Aerobic … Formation and.pdf · due to the unique granular structure and high biomass concentration in the reactor [5]. Aerobic](https://img.dokumen.tips/doc/110x75/60f6af1be8de276226291041/original-research-the-formation-and-stabilization-of-aerobic-formation-andpdf.jpg)