Embed Size (px)
Citation preview

HAL Id: halshs-01875902https://halshs.archives-ouvertes.fr/halshs-01875902
Submitted on 18 Sep 2018
HAL is a multi-disciplinary open accessarchive for the deposit and dissemination of sci-entific research documents, whether they are pub-lished or not. The documents may come fromteaching and research institutions in France orabroad, or from public or private research centers.
L’archive ouverte pluridisciplinaire HAL, estdestinée au dépôt et à la diffusion de documentsscientifiques de niveau recherche, publiés ou non,émanant des établissements d’enseignement et derecherche français ou étrangers, des laboratoirespublics ou privés.
Development gaps in the ASEAN process ofregionalisation: mid-term prospects for their reduction.
Paper presented at the SASE conference: GlobalReordering: Prospects for Equality, Democracy and
Bruno Jetin, Pascal Petit
To cite this version:Bruno Jetin, Pascal Petit. Development gaps in the ASEAN process of regionalisation: mid-termprospects for their reduction. Paper presented at the SASE conference: Global Reordering: Prospectsfor Equality, Democracy and. SASE conference: Global Reordering: Prospects for Equality, Democ-racy and Justice, 23-25 June 2018, Doshisha University, Kyoto, Japan., Jun 2018, Kyoto, Japan.�halshs-01875902�

1
Development gaps in the ASEAN process of regionalisation: mid-term prospects for their
reduction.
By Bruno Jetin1 and Pascal Petit2
Paper presented at the SASE conference: Global Reordering: Prospects for Equality, Democracy and
Justice, 23-25 June 2018, Doshisha University, Kyoto, Japan.
Abstract
The ASEAN region, with its 10-member states, as it stood at the beginning of the 21st century,
presented huge gaps between levels of development of member states. Over the last two decades
one observes a relative convergence in countries’ levels (even if the gap is still quite important) but
an increase in inequalities within countries. Even if this dual movement can be found in many groups
of trade partners, and in first instance in the EU, the replication of this dual movement may be
surprising in a set of countries with such differences in development levels. The paper will try to
investigate whether this dual evolution is likely to persist or recede in the medium term and to what
extent a regionalisation process, mainly based on trade liberalisation, is the main factor at work. An
assessment of the contribution to this dual dynamic of the various sectors, whether agriculture, raw
materials or manufacturing, will be attempted as it may hint at specific trade policies to limit rises in
within- country inequalities which run the risk at the end to ruin the benefits of the regionalisation
process.
Historical specificities of Europe and ASEAN regional integration
Regional integration is supposed to foster convergence of living standards on the long run as it
creates catching-up opportunities for less developed member states. Better access to an enlarged
market, attraction of foreign direct investment, transfer of technologies, improved infrastructure and
connectivity are the economic drivers of the process of convergence. These economic factors
combine with institutional and socio-political drivers such as political agreements on common policy
objectives, adoption of common regulatory framework, procedures and norms regarding production,
trade, skills, migration and sometimes, education and social rights.
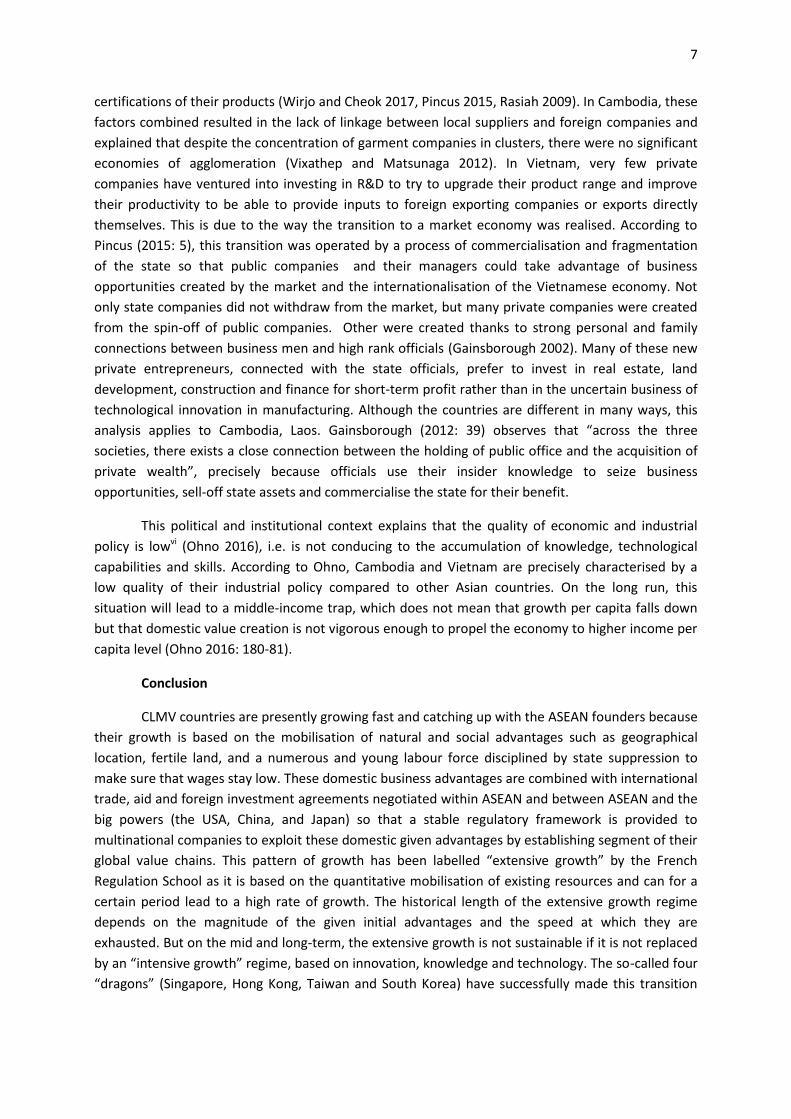
In the case of Europe, the process of convergence is very clear. Over the long period (1970-2014), the
Theil entropy index which measures between-country inequality of the EU 15 Member States (EMS)
fell rapidly to very low levels (see Figure 1).
Figure 1 here
The same convergence can be observed among the 28 EMS states after the successive waves of
enlargement (Figure 2).
Figure 2 here
1 University of Brunei Darussalam. [email protected]
2 CEPN University of Paris North
2
This remarkable achievement, which is documented by many publications, does not mean that all
EMS have the same average income (or expenditure) per capita but that their share of regional
income is proportionate to their share in the regional population. In other terms, the regional
integration has not led some countries to get a much higher regional income share than their share
in the regional population. The reason is that the EU founders were more or less on an equal footing
in terms of level of development although some (Belgium, Luxemburg, The Netherlands) were much
smaller than the larger ones (France, Germany, Italy). The various waves of enlargement did not
revert this general rule even if some latecomers were much poorer than the founder states.
The regional integration of Southeast Asian countries prompted by ASEAN since 1967 differ from the
European integration in several significant ways.
While the EU was very active before and after its official foundation in 1957, ASEAN was a
rather dormant association until at least 1977, with just an annual meeting of heads of states and
ministers of foreign affairs (Jones 2016a, Weatherbee 2014). Priority was given to the creation of
nation states, to the establishment of borders and control of national territory, to national
development and the forging of a national identity. The newly born Southeast Asian nation states
were headed by strong men eager to ascertain their power by the diffusion of a nationalistic ideology
based on the support of military and police forces (Jetin 2016a). Regional integration was not the
priority, not even economic integration and ASEAN annual summits were more confined to security
and peace issues.
To the contrary of Western Europe, which was emerging from the Second World War and
wanted to create a European Community to firmly establish a long-lasting peace, Southeast Asia was
still at war in the 1960s and 1970s. The Cold War was not “cold” in Southeast Asia like in Europe.
Among ASEAN founders, the fight against communism in Indonesia, Malaysia, Thailand and the
Philippines implied military operations that left long-lasting consequences such as the absence of
liberal democracy in the region which is at the core of the European integration. More, it is only after
the end of the “Vietnam War”, which also ravaged Cambodia and Laos, and the final suppression of
the Khmer rouge remnants in the 1990s, that the region was definitely at peace. This explains why
economic development became a factor of regional integration only in the end of the 1980s when
American and Japanese multinational companies started to push for a more common regional
framework to facilitate the organisation of a regional division of labour among their subsidiaries in
Southeast Asia (Mottet and Jetin 2016).
But the creation of a free trade zone among ASEAN Member States (AMS) was a long and
tortuous process as it was fiercely resisted by local companies. In the EU, European multinational
companies were long-established and could rely on their states and the existence of a national
system of scientific research supported by a national system of education. Their priorities were the
creation of a European common market to increase their sales in Europe and be in a better position
to compete with American multinational companies which were investing heavily at the time in
Europe. The major European enterprises supported the European economic integration and
overcame resistance of small and medium enterprises which were more protectionist (Van
Apeldoorn 2000). In Southeast Asia, they were no private national champions at the start and the
domestic private companies wanted to reserve the national market for themselves, which the state
was willing to do. The other option was to create a joint venture with a foreign company to either tap
3
the national market or export to the USA or Europe and much less frequently to neighbour countries.
The largest local companies were usually state companies whose priorities were also the national
market. Because many private companies were created by the state, or the richest families which
owned the largest existing private companies and had strong links with the state, the demand for
protectionism was satisfied by the state during most of the existence of ASEAN (Jones 2016b). It is
interesting to observe that this applies to the formally capitalist economy of the ASEAN founders or
to the officially socialist countries (Cambodia, Laos, Myanmar and Vietnam) which joined ASEAN in
the nineties.
The creation of a free trade zone among AMS, started only in 1992 with the establishment of
the Common Effective Preferential Tariff (CEPT) which later became the ASEAN Free Trade Area
(AFTA). It was only completed 23 years later with the launch of the ASEAN Economic Community
(AEC) in 2015 (Jetin and Mikic 2016). The removal of the last tariff barriers means that ASEAN can
now attempt to reduce non-tariff barriers which still impede the existence of a “real single market
and production base”. This very gradual reduction of protectionism was finally made possible
because on top of foreign multinational companies (American, European, Japanese and recently
Chinese), emerging multinational companies from Southeast Asia have now an interest in developing
their activities in a regional market.
One last striking difference between the EU and ASEAN is the greatest heterogeneity among
the member states in the latter case (see Table 1).
Table 1 here
In 2016, Indonesia, the country with the largest economy (41% of ASEAN GDP) and the
largest population (41% of ASEAN population), has a rather low GDP per capita (US$ 10,765 PPP)
which ranks fifth among the 10 countries of the association. It accessed durably the lower segment of
the middle-income countries of the World Bank income category in 2003 only, after it slowly
recovered from the 1997-98 Asian crisis. Table 1 shows that its rate of growth, which has been
moderately high during the nineties (5.5% in 1991-96), experienced a prolonged slump after the
Asian crisis of 1997-98 (3.3% in 1999-2008) and has only started to accelerate at a moderate pace
after the Great recession of 2008-2009 (4.2% in 2010-2016). Indonesia is also a country where
protectionism is still solidly entrenched. It means that the largest economy of the association, which
is also a member of the G20, has not the financial means to play a leader role in the economic,
political and security areas and to contest the hegemonic views of China in Southeast Asia. At the
other extreme, Singapore is a rich country, with a high GDP per capita (US$ 80,305 PPP), and very
open to free trade and investment, but its absolute share in the regional GDP (7% in 2014) and
population (1%) is too small to make it an engine of regional growth. In Europe, the four largest
economies (German, France, the United Kingdom and Italy) have among the highest GDP per capita
of the region and were a driving force of the union, in particular, the French-German partnership.
Table 1 shows that ASEAN may be divided into two groups with Thailand playing an
intermediate role due to the size of its economy, its population and level of development. The first
group includes the richest AMS, Brunei, Malaysia and Singapore. Brunei is very dependent on oil. It
has been affected by the recent decrease of oil prices and is trying to diversify its economy (Jetin and
Chaisse 2018). Singapore has completed its structural change from developing country to a rich
economy specialised in services and notably financial services. Malaysia is aspiring to become soon a

4
high-income economy relying on natural resources, manufacturing and services. All three economies
have reached a stage of development when growth deceleratei compared to the early stage of
development.
The second group comprises the lower-middle income AMS, some being founders of ASEAN,
like Indonesia and the Philippines, others the latecomers, Cambodia, Laos, Myanmar and Vietnam.
The so-called CLMV group has accessed very recently to the status of lower-middle income country.
This second group is still growing fast and is catching up with the group of more advanced countries,
especially with Thailand whose rate of growth per capita is decelerating. This process of catching up
explains the decrease of between-country inequality in ASEAN at work since 2005, which nonetheless
remains higher than the average level observed before the Asian crisis of 1997-98 (Figure 3).
Figure 3 here.
The rise of income inequality within ASEAN member countries.
The process of convergence is also rather slow because Indonesia has not experienced a prolonged
period of very high growth like the one registered by China or even India (see Table 1). If, for
instance, Thailand and Indonesia maintain the same average rate of growth observed over the period
2010-2016, respectively 3.2 and 4.2%, Indonesia would reach the Thai GDP per capita in 2055 only.
Among many assumptions, this would imply that within-country income inequality remains the same.
The problem is that they are on the rise in many ASM. B. Jetin (2016b) found that, in 2012, within-
country inequality explains 73.5% of the Theil index of income inequality in ASEAN, up from 66.5% in
2002, while between-country inequality decreased to 26.5%, down from 33.5%. Several other
publications have confirmed this dual trend of between-country decline and within-country
inequality rise in Southeast Asia and other Asian countries (ADB 2007, ADB 2012, Kanbur et al. 2014).
One important consequence of the growing within-country inequality is that the process of regional
convergence does not benefit as much as it could the poor and the low-income earners in general.
Many factors contribute to this rise of inequality. Structural change, land grabbing and marketisation
of agriculture, technological change, lack of access to education and health services, wage
repression, absence of progressive taxation and redistribution of income combine to make growth
non-inclusive in several AMS. The next section review some of these arguments with a special focus
on the CLMV.
Structural change and income inequality within ASEAN.
Structural change leads spontaneously to growing income inequality within developing countries if
they are not corrected by public policies. The well-known Kuznets hypothesis (Kuznets 1955) posits
that the labour transition from rural (agriculture) to urban sectors (industry and services) leads to
rising income differences between sectors that are compounded by growing income differences
within sectors. This hypothesis has never always been verified, usually rejected by cross-sectional
data and validated in recent time series data for some fast-growing developing countries (Baymul
and Sen 2017, Sumner 2016). This is explained by the specificities of each national development
trajectories. Rural-urban inequalities and within sectors inequalities can vary considerably across
countries (Kanbur et al. 2014), state intervention to correct or to worsen them being one among key
factors.
5
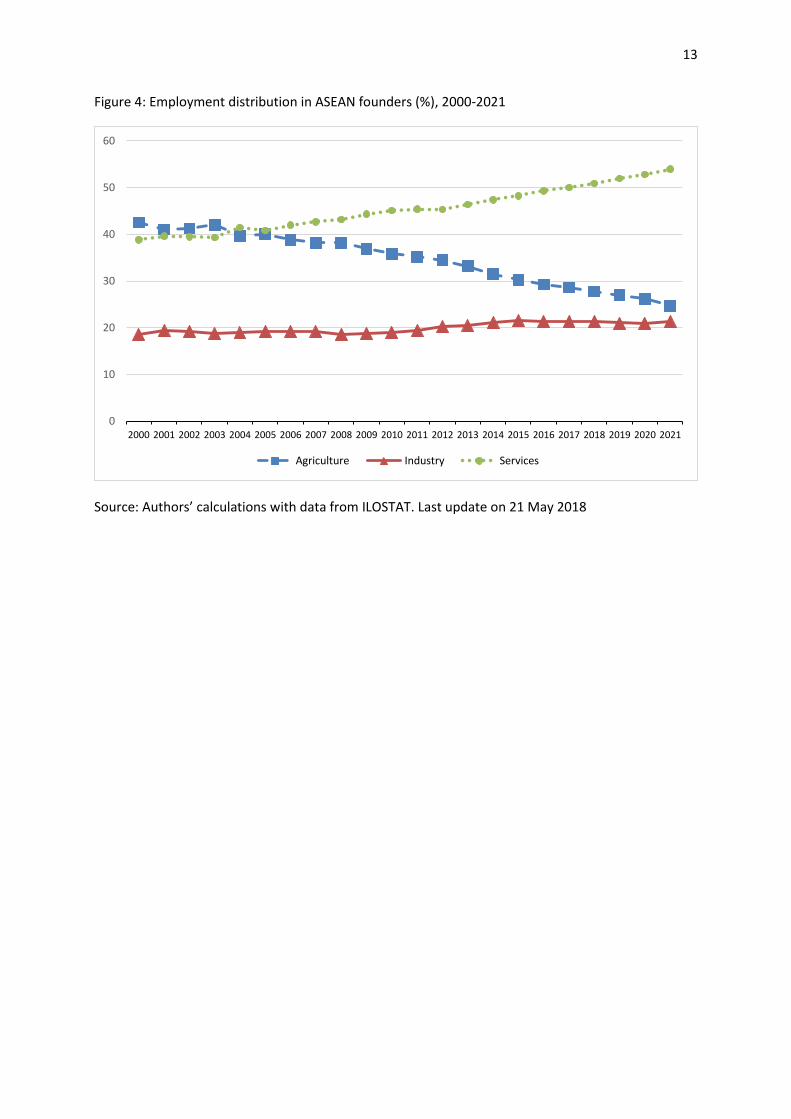
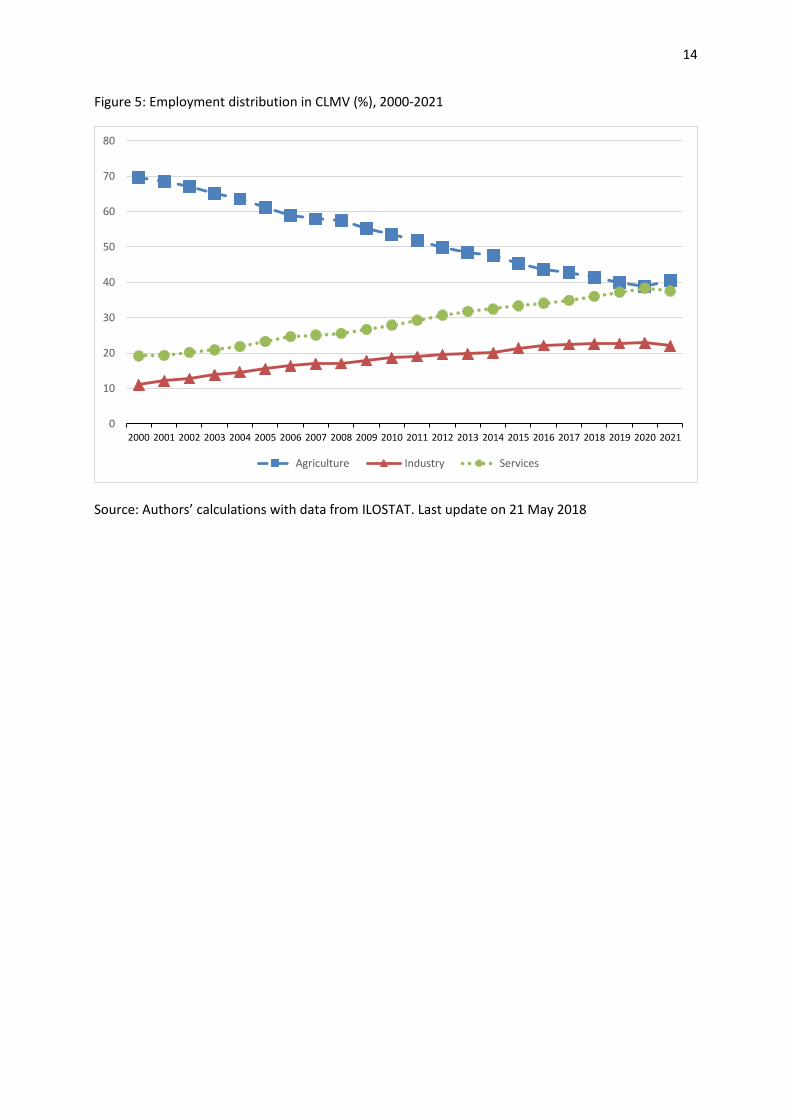
Structural change in ASEAN is already far advanced. Figure 4 and 5 displays the evolution of
employment at sector level in ASEAN foundersii and in CLMV according to ILO projectionsiii. In ASEAN
founders, agriculture is projected to decline to 25% of total employment in 2021 down from 43% in
2000. In CLMV countries, agricultural employment would also dramatically decrease to around 40%
in 2021, down from 70% in 2000. Both figures show that the majority of workers leaving agriculture
find a job in services as industry plateaus at around 20%. Contrary to the experience of the industrial
revolution in Europe, which saw industrial employment peaking in some countries at around 40% of
employment at the end of the 19th century (Huber et al. 1993), which was repeated one century later
in South Korea and Taiwan (Burris 1992), industrialisation in Southeast Asia has a more limited
impact. One may argue that ASEAN founders are affected by a premature deindustrialisation (Tan
2014) (Rodrik 2016). This sheds light on the development of services that is observed in both ASEAN
founders and CLMV. The lack of industrial deepening and upgrading in most AMS (Jetin 2010), with
the exception of Singapore, which can be observed in the paucity of world-class domestic industrial
firms, means that most of the services correspond to traditional activities which do not imply a high
level of skills and knowledge (Tham 2017).
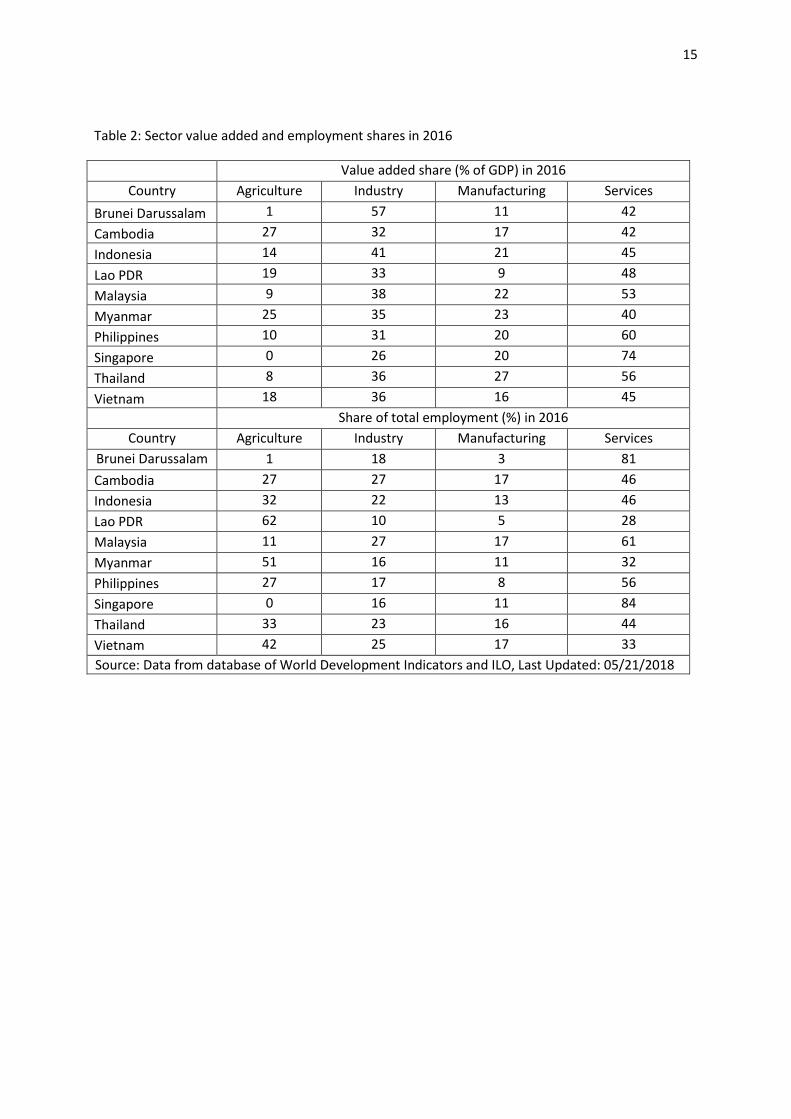
For the year 2016, Table 2 shows that the share of agriculture in GDP is inferior to 10% in the richest
AMS (Brunei Darussalam, Malaysia, Singapore and Thailand) and equal or close to 10% in the
Philippines and Indonesia. This compares to a share of 7% for upper middle countries and 8.5% in
China (source: World Bank and ILO). In the CLMV countries, agriculture’s value-added share ranges
between 18% (Vietnam) to 27% (Cambodia), which is above the average of lower middle-income
countries (16.5%). Clearly, structural change is still under way and this is even more so in terms of
employment. Agriculture employs 42% of Vietnamese, 51% of Burmese and 62% of Laotian labour
force which is above the average of lower middle-income countries (39%). This reflects the low
productivity of agriculture in these countries and the potential for internal migration of rural workers
looking for a better job in industry or services. Agricultural employment remains also high in
Indonesia, the Philippines and even Thailand although structural change has started decades ago in
these countries. This shows that structural change is a very long process that does not always lead to
a sharp decline of agriculture because of the resilience of the rural society. For instance, in Thailand,
although millions of rural dwellers have migrated to cities and in particular Bangkok, many have also
decided to stay in the back country, where agriculture has diversified, and households’ members
have off-farm jobs. A small middle class has even emerged in rural areas (Walker 2007) with a
changing lifestyle and political aspirations (Phatharathananunth 2016). Cambodia, which has the
lowest GDP per capita of the region in PPP terms (see Table 1), stands as an exception. Agricultural
employment is the lowest of the CLMV countries because industry, and in particular manufacturing,
has developed quickly in terms of value added and employment. Apparel, which is highly labour
intensive, accounts for around 25% of manufacturing production and 55% of manufacturing
employment and is highly dependent on the low level of wages (ADB 2014). This kind of
industrialisation has a small ripple effect on the rest of the economy and does not greatly improve
living standards. Laos, Myanmar and Vietnam have also a value-added share in industry which
accounts for at least one third of GDP, but the share of manufacturing is much lower. This is
especially the case in Laos where manufacturing share accounts for only 9% of GDP and 5% of
employment. This reflects more the importance taken by the production of energy, mining and
quarrying, which depends on the abundance of natural resources, while manufacturing remains
small. Regional integration tends to reinforce this trend and to transform Laos in an energy producer
6
and a country crossed by high-speed railways, roads and electricity grids. Not only China with its Belt
and Road initiative (Jetin 2018), but also Thailand, favour the development of dams to produce
hydroelectricity that Laos sell to its neighbours. This leads to land grabbing and the displacement of
population to the expense of agriculture without much benefits for the local people (Fau 2016).
Vietnam’s manufacturing is more diversified but still depends on labour intensive and processing
industries such as food and beverages, leather, apparel, textile and electronics, which together
amount to around 35% of manufacturing production in 2011 and rank among the top five exports
products (Anh et al. 2014). The apparel sector by itself accounted for 31% of manufacturing
employment in 2012 (El Achkar Hilal 2014: 7). This light industry highly depends on the imports of
parts and components from abroad, mainly China (Dinh 2014: 6). In Myanmar, the share of industry
in GDP has quadrupled between 1995 and 2013 and the share of manufacturing alone has tripled
(Gelb et al. 2017). Production focuses on low-value-added sectors including textiles, apparel,
processed foods, beverages, wood products, and minerals. The labour cost is among the lowest in
the region. The average wage of a Myanmar factory worker is about $3 a day, compared with $4 in
Indonesia, $5 in Vietnam, and $18 in China and Thailand, but productivity is also about 70% below
the Asian average (Institute 2013). On the whole, unit labour costs are much lower in Myanmar than
in China because the wage gap is higher than the productivity gap. Foreign companies in the garment
industry are overwhelmingly Chinese and their main motivation for producing in Myanmar is
precisely the low labour cost and the possibility to export to OECD countries since the easing of
sanctions since 2012. Production comprises almost exclusively cut-make-package (CMP) production
operations using fabric imported free of taxes from China (Gelb et al. 2017: 40). This leaves no room
for increasing local value-added in Myanmar as everything is decided by the original equipment
manufacturer located in China which receives its order from big Western brands.
It is quite normal that the CLMV countries start their industrialisation process with low-value
added and labour-intensive industries. Magacho and McCombie (2017) have shown that these
sectors exhibit the highest increasing returns at the first stage of development. At later stages, it
becomes more advantageous to move up to more capital and technology- intensive industries, which
have higher increasing return to scale leading to fastest productivity gains and potentially higher
wages. This is precisely the issue of industrial upgrading, which raises questions about the capacity of
CLMV to catch up AMS founders and ASEAN as a whole to make further progress in the process of
development. Industrialisation is stagnating in CLMV and in ASEAN founders and because most of
local manufacturing consists now of segments of global value chains, the capacity of industrial
upgrading and its spill over effects on skilled services, is constrained. This, we believe is one of the
key reasons for the so-called middle-income trap.
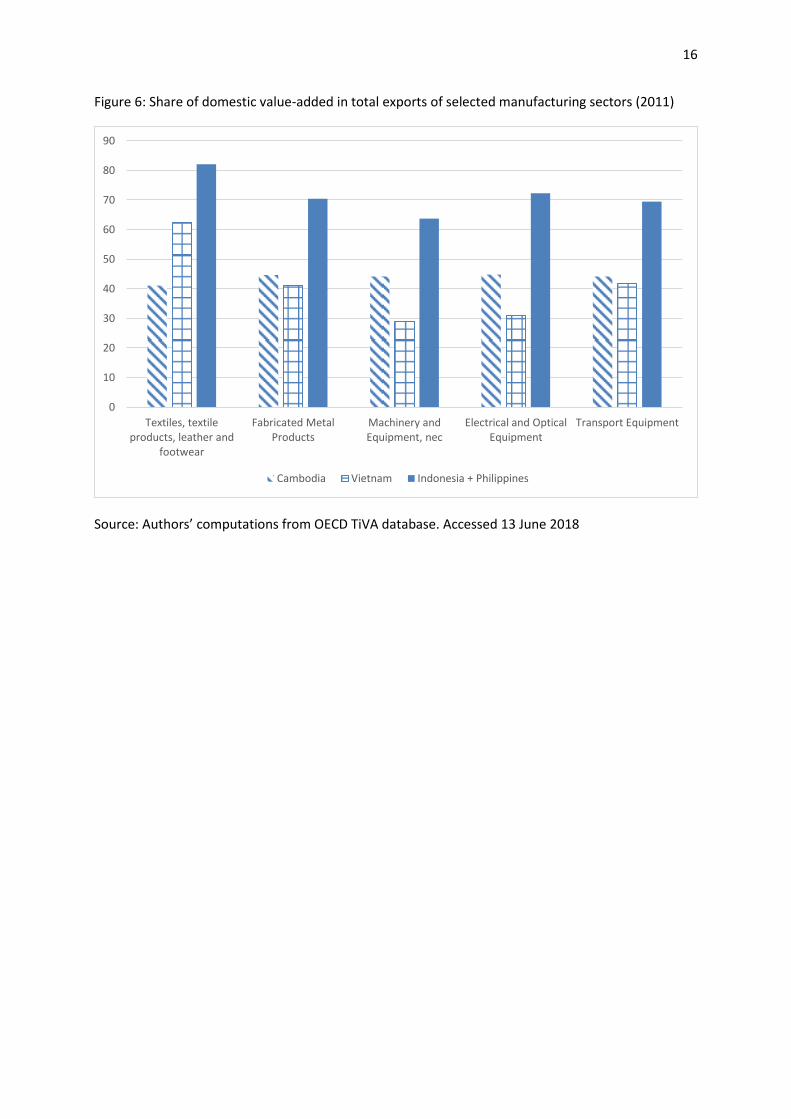
Figure 6 shows that in selected manufacturing sectors, the share of domestic value addediv in
exports is much lower in Cambodia and Vietnam than in Indonesia and the Philippinesv. These latter
are taken collectively as a benchmark as they are the closest to CLMV in terms of GDP per capita. For
textiles, textile products, leather and footwear, Cambodia’s share of domestic value-added (41%) is
half the value of Indonesia and the Philippines (82%). For electrical and optical equipment, Vietnam’s
share is 31% versus 72%. One may argue that the low level of local content reflects the reality of
today’s manufacturing with the prevalence of global value chains which leaves just a small segment
of productive tasks to each country. Nonetheless, several authors have stressed the weak capacity of
Cambodian and Vietnamese companies to supply goods and services to exporting foreign
multinational companies due to poor governance, lack of technical capabilities, human skills and
7
certifications of their products (Wirjo and Cheok 2017, Pincus 2015, Rasiah 2009). In Cambodia, these
factors combined resulted in the lack of linkage between local suppliers and foreign companies and
explained that despite the concentration of garment companies in clusters, there were no significant
economies of agglomeration (Vixathep and Matsunaga 2012). In Vietnam, very few private
companies have ventured into investing in R&D to try to upgrade their product range and improve
their productivity to be able to provide inputs to foreign exporting companies or exports directly
themselves. This is due to the way the transition to a market economy was realised. According to
Pincus (2015: 5), this transition was operated by a process of commercialisation and fragmentation
of the state so that public companies and their managers could take advantage of business
opportunities created by the market and the internationalisation of the Vietnamese economy. Not
only state companies did not withdraw from the market, but many private companies were created
from the spin-off of public companies. Other were created thanks to strong personal and family
connections between business men and high rank officials (Gainsborough 2002). Many of these new
private entrepreneurs, connected with the state officials, prefer to invest in real estate, land
development, construction and finance for short-term profit rather than in the uncertain business of
technological innovation in manufacturing. Although the countries are different in many ways, this
analysis applies to Cambodia, Laos. Gainsborough (2012: 39) observes that “across the three
societies, there exists a close connection between the holding of public office and the acquisition of
private wealth”, precisely because officials use their insider knowledge to seize business
opportunities, sell-off state assets and commercialise the state for their benefit.
This political and institutional context explains that the quality of economic and industrial
policy is lowvi (Ohno 2016), i.e. is not conducing to the accumulation of knowledge, technological
capabilities and skills. According to Ohno, Cambodia and Vietnam are precisely characterised by a
low quality of their industrial policy compared to other Asian countries. On the long run, this
situation will lead to a middle-income trap, which does not mean that growth per capita falls down
but that domestic value creation is not vigorous enough to propel the economy to higher income per
capita level (Ohno 2016: 180-81).
Conclusion
CLMV countries are presently growing fast and catching up with the ASEAN founders because
their growth is based on the mobilisation of natural and social advantages such as geographical
location, fertile land, and a numerous and young labour force disciplined by state suppression to
make sure that wages stay low. These domestic business advantages are combined with international
trade, aid and foreign investment agreements negotiated within ASEAN and between ASEAN and the
big powers (the USA, China, and Japan) so that a stable regulatory framework is provided to
multinational companies to exploit these domestic given advantages by establishing segment of their
global value chains. This pattern of growth has been labelled “extensive growth” by the French
Regulation School as it is based on the quantitative mobilisation of existing resources and can for a
certain period lead to a high rate of growth. The historical length of the extensive growth regime
depends on the magnitude of the given initial advantages and the speed at which they are
exhausted. But on the mid and long-term, the extensive growth is not sustainable if it is not replaced
by an “intensive growth” regime, based on innovation, knowledge and technology. The so-called four
“dragons” (Singapore, Hong Kong, Taiwan and South Korea) have successfully made this transition
8
from an extensive to an intensive growth regime and this explains why they are high-income
countries now.
In the case of the CLMV countries, there are reasons to believe that the extensive growth
period and the catching up process with ASEAN founders will not be sustained for a long time. Firstly,
the natural resources are depleted rapidly. Deforestation, land grabbing, the mismanagement of the
Mekong river due to the multiplication of dam constructions, and excessive fish farming at a time of
global warming, do not bode well for the sustainability of development on the long-term, in
particular of agriculture and fishing. Secondly, industrialisation led by low wages and without
technological and knowledge accumulation is fragile. Multinational companies are locating some
segments of their value chains in CLMV because wages are much lower than in neighbouring China
and the rest of ASEAN. The domestic market of CLMV is small and does not justify by himself their
presence. When real wages will start to grow, these multinational companies will easily offshore
their plants to other countries where wages are lower. Thirdly, the international context, and in
particular China’s rise and its hegemony in Southeast Asia will shorten the length of extensive
growth. The Chinese Belt and Road Initiative will accelerate the depletion of CLMV natural resources
because it will make their import by China easier and less costly, and because the infrastructure
projects do not take the environmental cost into consideration. Additionally, the BRI will facilitate the
off-shoring of Chinese manufacturing companies to new countries where wages are lower. Finally,
the BRI comes with huge investment projects in real estate which include luxury closed-gate
condominiums, Macmansions and gigantic shopping centres. These projects will not be all profitable
and will fragilise the CLMV countries as it makes their economies more prone to financial speculation
and the heavy short-term debts that come with it. The Asian crisis of 1997-98 is an example of such
excesses still vivid in Southeast Asia.
9
Figures and tables
Figure 1: Between-country inequality of EU 15-member states, 1950-2014
Theil index of Expenditure-side real GDP at chained PPPs (in mil.2011 US$). Source: Authors’
calculations with data from Penn World Tables version 9
0,000
0,010
0,020
0,030
0,040
0,050
0,060
0,070
19
50
19
52
19
54
19
56
19
58
19
60
19
62
19
64
19
66
19
68
19
70
19
72
19
74
19
76
19
78
19
80
19
82
19
84
19
86
19
88
19
90
19
92
19
94
19
96
19
98
20
00
20
02
20
04
20
06
20
08
20
10
20
12
20
14

10
Figure 2: Between-country inequality of EU 15 and EU28-member states, 1990-2014
Theil index of Expenditure-side real GDP at chained PPPs (in mil.2011 US$). Source: Authors’
calculations with data from Penn World Tables version 9
0,000
0,010
0,020
0,030
0,040
0,050
0,060
0,070
0,080
EU 28 EU 15

11
Table 1: Main characteristics of ASEAN member states, China and India.
2016 Income
category
GDP, millions of PPP 2011 $
Population (thousands)
GDP per capita
Average rate of growth of GDP per capita
Country 1991-1996
1999-2008
2010-2016
Brunei Darussalam
H 32 828 423 71 789 0,3 0,1 -1,4
Cambodia LM 59 018 15 762 3 463 7,5 5,3
Indonesia LM 3 037 181 261 115 10 765 5,5 3,3 4,2
Lao PDR LM 41 877 6 758 5 735 3,6 5,1 6,4
Malaysia UM 865 021 31 187 25 660 6,8 3,6 3,6
Myanmar LM 303 156 52 885 5 352 4,6 11,4 6,6
Philippines LM 807 894 103 320 7 236 0,4 2,6 4,6
Singapore H 493 458 5 607 81 443 5,1 3,7 3,6
Thailand UM 1 166 975 68 864 15 682 6,7 4,0 3,2
Vietnam LM 596 524 92 701 5 955 6,6 5,3 4,9
China UM 21 450 968 1 378 665 14 401 10,6 9,5 7,6
India LM 8 717 513 1 324 171 6 093 3,4 5,2 6,0
Note: L = Low, LM = Lower Middle, UM = Upper Middle, H = High income. GDP and GDP
per capita in PPP 2011$. Source: Authors’ calculations with data from World Development
Indicators 2018, World Bank.

12
Figure 3: Between-country inequality of ASEAN founders and ASEAN 10-member states, 1960-2014
Theil index of Expenditure-side real GDP at chained PPPs (in mil.2011 US$). Source: Authors’
calculations with data from Penn World Tables version 9
0,00
0,05
0,10
0,15
0,20
0,25
0,30
ASEAN FOUNDERS ASEAN
1967: ASEAN Foundation
1984: Brunei
1995: Vietnam
1997: Laos and Myanmar
1999: Cambodia
2010: AFTA completed
1992: CEPT
13
Figure 4: Employment distribution in ASEAN founders (%), 2000-2021
Source: Authors’ calculations with data from ILOSTAT. Last update on 21 May 2018
0
10
20
30
40
50
60
2000 2001 2002 2003 2004 2005 2006 2007 2008 2009 2010 2011 2012 2013 2014 2015 2016 2017 2018 2019 2020 2021
Agriculture Industry Services
14
Figure 5: Employment distribution in CLMV (%), 2000-2021
Source: Authors’ calculations with data from ILOSTAT. Last update on 21 May 2018
0
10
20
30
40
50
60
70
80
2000 2001 2002 2003 2004 2005 2006 2007 2008 2009 2010 2011 2012 2013 2014 2015 2016 2017 2018 2019 2020 2021
Agriculture Industry Services
15
Table 2: Sector value added and employment shares in 2016
Value added share (% of GDP) in 2016
Country Agriculture Industry Manufacturing Services
Brunei Darussalam 1 57 11 42
Cambodia 27 32 17 42
Indonesia 14 41 21 45
Lao PDR 19 33 9 48
Malaysia 9 38 22 53
Myanmar 25 35 23 40
Philippines 10 31 20 60
Singapore 0 26 20 74
Thailand 8 36 27 56
Vietnam 18 36 16 45
Share of total employment (%) in 2016
Country Agriculture Industry Manufacturing Services
Brunei Darussalam 1 18 3 81
Cambodia 27 27 17 46
Indonesia 32 22 13 46
Lao PDR 62 10 5 28
Malaysia 11 27 17 61
Myanmar 51 16 11 32
Philippines 27 17 8 56
Singapore 0 16 11 84
Thailand 33 23 16 44
Vietnam 42 25 17 33
Source: Data from database of World Development Indicators and ILO, Last Updated: 05/21/2018
16
Figure 6: Share of domestic value-added in total exports of selected manufacturing sectors (2011)
Source: Authors’ computations from OECD TiVA database. Accessed 13 June 2018
0
10
20
30
40
50
60
70
80
90
Textiles, textile products, leather and
footwear
Fabricated Metal Products
Machinery and Equipment, nec
Electrical and Optical Equipment
Transport Equipment
Cambodia Vietnam Indonesia + Philippines
17
References
ADB (2007) 'Inequality in Asia: Special chapter of "Key Indicators of Developing Asian and Pacific Countries 2007"', in Key Indicators of Developing Asian and Pacific Countries, (Manila: Asian Development Bank)
ADB (2012) 'Economic Outlook 2012: Confronting Rising Inequality in Asia', in Economic Outlook, (Manilla: Asian Development Bank)
ADB (2014) 'Cambodia Country Poverty Analysis 2014', (Manila: Asian Development Bank) Anh, N. T. T., L. M. Duc & T. D. Chieu (2014) 'The evolution of Vietnamese industry', Learning to
Compete, AGI-Brookings, 19, 235 Baymul, C. & K. Sen (2017) 'What do we know about the relationship between structural change,
inequality and poverty in developing countries', ESRC GPID Research Network Working Paper. London: King’s College London,
Burris, V. (1992) 'Late Industrialization and Class Formation in East Asia', Research in Political Economy, 13, 245-83
Dinh, H. T. (2014) Light manufacturing in Vietnam: creating jobs and prosperity in a middle-income economy, (Washington DC: World Bank Publications)
El Achkar Hilal, S. (2014) 'The impact of ASEAN economic integration on occupational outlooks and skills demand', ILO Asia- Pacific Working Paper Series, October
Fau, N. (2016) 'Investment in Infrastructure and Regional Integration: Will Connectivity Reduce Inequalities?', in ASEAN Economic Community, eds. B. Jetin and M. Mikic (New York: Springer)
Gainsborough, M. (2002) 'Political change in Vietnam: In search of the middle-class challenge to the state', Asian Survey, 42, 694-707
Gainsborough, M. (2012) 'Elites vs. reform in Laos, Cambodia, and Vietnam', Journal of Democracy, 23, 34-46
Gelb, S., L. Calabrese & X. Tang (2017) 'Foreign direct investment and economic transformation in Myanmar', in ODI’s Supporting Economic Transformation programme:
Huber, E., D. Rueschemeyer & J. D. Stephens (1993) 'The Impact of Economic Development on Democracy', Journal of Economic Perspectives, 7, 71-86
Institute, M. G. (2013) 'Myanmar’s moment: Unique opportunities, major challenges': Jetin, B. (2010) 'Industrial upgrading and Educational upgrading: two critical issues for Thailand', in
Sustainability of Thailand's Competitiveness: The Policy Challenges, eds. Y. Lecler and I. Patarapong (Singapore: ISEAS Press)
Jetin, B. (2016a) 'Can ASEAN transform Southeast Asia into an integrated region? (In French).', in L’Asie du Sud-Est 2016 Bilan, enjeux et perspectives, ed. A. Pesses (Paris et Bangkok: IRASEC, Les Indes savantes)
Jetin, B. (2016b) 'Reduction of Absolute Poverty, Increase of Relative Poverty, and Growing Inequalities: A Threat to Social Cohesion', in ASEAN Economic Community, eds. B. Jetin and M. Mikic (Basingtoke and New York: Palgrave Macmillan)
Jetin, B. (2018) '‘One Belt-One Road Initiative’and ASEAN Connectivity: Synergy Issues and Potentialities', in China's Global Rebalancing and the New Silk Road, ed. B. R. Deepak (Singapore: Springer)
Jetin, B. & J. Chaisse (2018) 'International Investment Policy for Small States: The case of Brunei', in International Investment Treaties and Arbitration Across Asia, eds. J. Chaisse and L. Nottage (Leiden, Boston: Brill Nijhoff)
Jetin, B. & M. Mikic (2016) ASEAN Economic Community: A Model for Asia-wide Regional Integration?, (Basingtoke and New York: Palgrave Macmillan)
Jones, D. M. (2016a) 'ASEAN’s imitation economic community: the primacy of domestic political economy', in ASEAN Economic Community, eds. B. Jetin and M. Mikic (Houndmills and New York: Palgrave Macmillan)
18
Jones, L. (2016b) 'Explaining the failure of the ASEAN economic community: the primacy of domestic political economy', The Pacific Review, 29, 647-70
Kanbur, R., C. Rhee & J. Zhuang (2014) Inequality in Asia and the Pacific: Trends, Drivers, and Policy Implications: Routledge)
Kuznets, S. (1955) 'Economic Growth and Income Inquality', American Economic Review, 65, 1-28 Magacho, G. R. & J. S. L. McCombie (2017) 'A sectoral explanation of per capita income convergence
and divergence: estimating Verdoorn’s law for countries at different stages of development', Cambridge Journal of Economics, bex064-bex64
Mottet, E. & B. Jetin (2016) 'L’Asie du Sud-Est et les chaīnes de valeur', in Christophe Colomb découvre enfin l'Asie: Intégration économique, chaînes de valeur et recomposition transpacifique, eds. E. Boulanger and M. Arès (Montreal, Canada: Athéna)
Ohno, K. (2016) 'The Quality of Industrial Policy as a Determinant of Middle Income Traps', VNU Journal of Science, 32, 179-89
Phatharathananunth, S. (2016) 'Rural Transformations and Democracy in Northeast Thailand', Journal of Contemporary Asia, 46, 504-19
Pincus, J. (2015) 'Why Doesn't Vietnam Grow Faster?: State Fragmentation and the Limits of Vent for Surplus Growth', Journal of Southeast Asian Economies (JSEAE), 32, 26-51
Rasiah, R. (2009) 'Garment manufacturing in Cambodia and Laos', Journal of the Asia Pacific Economy, 14, 150-61
Rodrik, D. (2016) 'Premature deindustrialization', Journal of Economic Growth, 21, 1-33 Sumner, A. (2016) Global poverty: Deprivation, distribution, and development since the cold War:
Oxford University Press) Tan, J. (2014) 'Running out of steam? Manufacturing in Malaysia', Cambridge Journal of Economics,
38, 153-80 Tham, S. Y. (2017) 'Examining the Shift to Services: Malaysia and China Compared', Journal of
Contemporary Asia, 1-24 Van Apeldoorn, B. (2000) 'Transnational class agency and European governance: The case of the
European Round Table of Industrialists', New political economy, 5, 157-81 Vixathep, S. & N. Matsunaga (2012) 'Firm Efficiency in Cambodia's Garment Industry on the Eve of
the Multi-Fiber Arrangement Termination', Asian Economic Journal, 26, 359-80 Walker, A. (2007) 'The rural constitution and the everyday politics of elections in Northern Thailand',
Journal of Contemporary Asia, 38, 84-105 Weatherbee, D. E. (2014) International relations in Southeast Asia: the struggle for autonomy:
Rowman & Littlefield) Wirjo, A. & D. Cheok (2017) 'Supporting Industry Promotion Policies in APEC – Case Study on Viet
Nam', in APEC Policy Support Unit, (Singapore: APEC)
i And even turn negative in the case of Brunei. ii Indonesia, Malaysia, Philippines, Singapore, Thailand. We have also included Brunei Darussalam in this group
also it joined ASEAN in 1984. iii Downloaded from ILOSTAT. Last update on 21MAY18
iv These figures are exhaustive as they include the contribution of services sectors such as logistics and
telecommunications to manufacturing. v No data is available for Lao PDR and Myanmar but we expect that the situation must not be very different.
vi The quality of industrial policy is calculated as the average of ten criteria.