Embed Size (px)
Citation preview

CITY OF CORNWALL
DEVELOPMENT FEES REVIEW STUDY
SEPTEMBER 28, 2012
Watson & Associates Economists Ltd. H:\Cornwall\DAAP Fees\Development Fees Report.docx
CONTENTS Page
1. INTRODUCTION 1.1 Introduction 1-1 1.2 Legislative Context for User Fees Review 1-1
2. ACTIVITY BASED COSTING USER FEE METHODOLOGY 2.1 Activity Based Costing Methodology 2-1 2.2 Application Category Definition 2-2 2.3 Application Processing Effort Cost Allocation 2-4 2.4 Direct Cost Business Units 2-5 2.5 Indirect Cost Functions and Cost Drivers 2-5 2.6 Capital Costs 2-6 2.7 Building Code Act Reserve Fund Policy 2-7
3. DEVELOPMENT FEES REVIEW 3.1 Development Fees Costing Results 3-1 3.2 Planning Application Fees 3-2 3.3 Building Permit Fees 3-6 3.4 Development Industry Stakeholder Consultation 3-8
4. IMPACT ANALYSIS OF FEE STRUCTURE RECOMMENDATIONS 4.1 Impact Analysis of Fee Structure Recommendations 4-1
Appendix A - Development Industry Stakeholder Consultation - March 29, 2012 (Presentation and Meeting Notes)

Watson & Associates Economists Ltd. H:\Cornwall\DAAP Fees\Development Fees Report.docx
1. INTRODUCTION

1-1
Watson & Associates Economists Ltd. H:\Cornwall\DAAP Fees\Development Fees Report.docx
1. INTRODUCTION
1.1 Introduction
Watson & Associates Economists Ltd. (Watson) was retained by the City of Cornwall to
undertake a comprehensive financial review of its development fees. The focus of the review
included quantifying the full costs of processing activities related to planning application fees
and building permit fees, assessing the sufficiency of current development fees to recover these
costs and recommended full cost recovery development fees. The results of this analysis and
proposed full cost recovery fees were presented to a development industry stakeholders group
for their input. Recommended fees were adjusted to account for the input provided by the
stakeholder group.
This technical report summarizes the legislative context for the fees review, provides in detail
the methodology utilized to assess the full costs of processing activities, summarizes the full
cost recovery fees and changes made to the development fee recommendations arising from
the development stakeholder consultation process and presents the financial implications of
recommended development fees.
1.2 Legislative Context for Development Fees Review
Municipal development fees are governed by multiple statutes, each with specific requirements
for imposing fees. The City’s statutory authority for imposing planning application fees is
provided under Section 69 of the Planning Act. Building permit fees are governed by the
provisions of Section 7 under the Ontario Building Code Act. For municipal services where
specific statutory authority is not provided, municipalities have the ability to impose fees and
charges under Part XII (s. 391) of the Municipal Act. The following summarizes the provisions
of the statutes as they pertain to fees and charges.
1-2
Watson & Associates Economists Ltd. H:\Cornwall\DAAP Fees\Development Fees Report.docx
Planning Act, 1990
Section 69 of the Planning Act, allows municipalities to impose fees through by-laws for the
purposes of recovering processing costs related to planning applications. In determining the
associated fees, the Act requires that:
“The council of a municipality, by by-law, and a planning board, by resolution,
may establish a tariff of fees for the processing of applications made in respect
of planning matters, which tariff shall be designed to meet only the anticipated
cost to the municipality or to a committee of adjustment or land division
committee constituted by the council of the municipality or to the planning board
in respect of the processing of each type of application provided for in the tariff.”
Section 69 establishes many cost recovery requirements that municipalities must consider when
undertaking a full cost recovery fee design study. The Act specifies that municipalities may
impose fees through by-law and that the anticipated costs of such fees must be cost justified by
application type as defined in the tariff of fees (e.g. Subdivision, Zoning Bylaw Amendment,
etc.). Given the cost justification requirements by application type, this would suggest that
cross-subsidization of planning fee revenues across application types is not permissible. For
instance, if Minor Variance application fees were set at levels below full cost recovery for policy
purposes this discount could not be funded by Subdivision application fees set at levels higher
than full cost recovery. Our interpretation of the Section 69 is that any fee discount must be
funded from other general revenue sources such as property taxes. In comparison to the cost
justification requirements of the Building Code Act, where the justification point is set at the
aggregate level of the Act, the requirements of the Planning Act are more stringent in this
regard.
The legislation further indicates that the fees may be designed to recover the “anticipated cost”
of processing each type of application, reflecting the estimated costs of processing activities for
an application type. This reference to anticipated costs represents a further costing requirement
for a municipality. It is noted that the statutory requirement is not the actual processing costs
related to any one specific application. As such, actual time docketing of staff processing effort
against application categories or specific applications does not appear to be a requirement of
the Act for compliance purposes. As such our methodology which is based on staff estimates of
application processing effort meets with the requirements of the Act and is in our opinion a
reasonable approach in determining anticipated costs.

1-3
Watson & Associates Economists Ltd. H:\Cornwall\DAAP Fees\Development Fees Report.docx
The Act does not specifically define the scope of eligible processing activities and there are no
explicit restrictions to direct costs as previously witnessed in other statutes. Moreover, recent
amendments to the fee provisions of the Municipal Act and Building Code Act are providing for
broader recognition of indirect costs. Acknowledging that staff effort from multiple business
units is involved in processing planning applications, it is our opinion that such fees may include
direct costs, capital-related costs, support function costs directly related to the service provided,
and general corporate overhead costs apportioned to the service provided.
The payment of Planning Act fees can be made under protest with appeal to the Ontario
Municipal Board (OMB) if the applicant believes the fees were inappropriately charged or are
unreasonable. The OMB will hear such an appeal and determine if the appeal should be
dismissed or direct the municipality to refund payment in such amount as determined by the
Board. These provisions confirm that fees imposed under the Planning Act are always
susceptible to appeal. Unlike other fees and charges (e.g. Development Charges) there is no
legislated appeal period related to the timing of by-law passage, mandatory review period or
public process requirements.
Building Code Act, 1992
Section 7 of the Building Code Act provides municipalities with general powers to impose fees
through passage of a by-law. The Act provides that:
“The council of a municipality…may pass by-laws
(c) Requiring the payment of fees on applications for and issuance of permits and
prescribing the amounts thereof;
(d) Providing for refunds of fees under such circumstances as prescribed;”
The Building Code Statute Law Amendment Act imposed additional requirements on
municipalities in establishing fees under the Act, in that:
“The total amount of the fees authorized under clause (1)(c) must not exceed the anticipated
reasonable cost of the principal authority to administer and enforce this Act in its area of
jurisdiction.”
In addition, the amendments also require municipalities to:

1-4
Watson & Associates Economists Ltd. H:\Cornwall\DAAP Fees\Development Fees Report.docx
Reduce fees to reflect the portion of service performed by a Registered Code Agency;
Prepare and make available to the public annual reports with respect to the fees
imposed under the Act and associated costs; and
Undertake a public process, including notice and public meeting requirements, when a
change in the fee is proposed.
O.Reg. 305/03 is the associated regulation arising from the Building Code Statute Law
Amendment Act, 2002. The regulation provides further details on the contents of the annual
report and the public process requirements for the imposition or change in fees. With respect to
the annual report, it must contain the total amount of fees collected, the direct and indirect costs
of delivering the services related to administration and enforcement of the Act, and the amount
of any reserve fund established for the purposes of administration and enforcement of the Act.
The regulation also requires that notice of the preparation of the annual report be given to any
person or organization that has requested such notice.
Relating to the public process requirements for the imposition or change in fees, the regulations
require municipalities to hold at least one public meeting and that at least 21-days notice be
provided via regular mail to all interested parties. Moreover, the regulations require that such
notice include, or be made available upon request to the public, an estimate of the costs of
administering and enforcing the Act, the amount of the fee or change in existing fee and the
rationale for imposing or changing the fee.
The Act specifically requires that fees “must not exceed the anticipated reasonable costs” of
providing the service and establishes the cost justification test at the global Building Code Act
level. As the requirements of the Act do not limit municipalities to the costs directly related to
the service, Building Code Act fees can include corporate management costs related to the
provision of service (e.g. Governance, Chief Administrative Officer, Finance, etc.). Moreover,
the recognition of anticipated costs also suggests that municipalities could include costs related
to future compliance requirements or fee stabilization reserve fund contributions. As a result,
Building Code Act fees modeled in this exercise include direct costs, capital-related costs,
indirect support function costs directly consumed by the service provided, and corporate
management costs related to the service provided, as well as provisions for future anticipated
costs.

1-5
Watson & Associates Economists Ltd. H:\Cornwall\DAAP Fees\Development Fees Report.docx
Municipal Act, 2001
Part XII of the Municipal Act provides municipalities with broad powers to impose fees and
charges via passage of a by-law. These powers, as presented in s.391 (1), include imposing
fees or charge for:
Services or activities provided or done by or on behalf of it;
Costs payable by it for services or activities provided or done by or on behalf of any
other municipality or local board; and
Use of its property including property under its control.
Fees and charges permissible under the authority of the Municipal Act would include
engineering review and inspection fees relating to the development process that are not
specifically provided for under the statutes identified above.
In contrast to cost justification requirements under other legislation, the Municipal Act does not
impose explicit requirements for cost justification when establishing fees for municipal services.
However, in setting fees and charges for these services, municipalities should have regard for
legal precedents and the reasonableness of fees and charges. The statute does not provide for
appeal of fees and charges to the Ontario Municipal Board, however, fees and charges may be
appealed to the courts if municipalities are acting outside of their statutory authority.
Furthermore, no public process or mandatory term for fees and charges by-laws is required
under the Act. There is, however, a requirement that municipal procedural bylaws provide for
transparency with respect to the imposition of fees and charges.
Watson & Associates Economists Ltd. H:\Cornwall\DAAP Fees\Development Fees Report.docx
2. ACTIVITY BASED COSTING USER FEE METHODOLOGY

2-1
Watson & Associates Economists Ltd. H:\Cornwall\DAAP Fees\Development Fees Report.docx
2. ACTIVITY BASED COSTING USER FEE METHODOLOGY
2.1 Activity Based Costing Methodology
An activity based costing (ABC) methodology, as it pertains to municipal governments, assigns
an organization's resource costs through activities to the services provided to the public. One of
the service channels provided by municipalities is the development review process.
Conventional municipal accounting structures are typically not well suited to the costing
challenges associated with development processing activities, as these accounting structures
are business unit focussed and thereby inadequate for fully costing services with involvement
from multiple business units. An ABC approach better identifies the costs associated with the
processing activities for specific application types and thus is an ideal method for determining
full cost recovery development fees.
As illustrated in Figure 2-1, an ABC methodology attributes processing effort and associated
costs from all participating municipal business units to the appropriate development fee service
categories. The resource costs attributed to processing activities and application categories
include direct operating costs, indirect support costs, and capital costs. Indirect support function
and corporate overhead costs are allocated to direct business units according to operational
cost drivers (e.g. information technology costs allocated based on the relative share of
departmental personal computers supported). Once support costs have been allocated
amongst direct business units, the accumulated costs (i.e. indirect, direct and capital costs) are
then distributed across the various development fee service categories (and other non-
development City services), based on the business unit’s direct involvement in development
review process activities. The assessment of each business unit’s direct involvement in
development review process activities is accomplished by tracking the relative shares of staff
processing effort across each development fee category’s sequence of mapped process steps.
The results of employing this costing methodology provides municipalities with a better
recognition of the costs utilized in delivering development review processes, as it acknowledges
not only the direct costs of resources deployed but also the operating and capital support
required by those resources to provide services.
The following sections of this chapter review each component of the ABC methodology as it
pertains to the City’s development review process fees review.

2-2
Watson & Associates Economists Ltd. H:\Cornwall\DAAP Fees\Development Fees Report.docx
Figure 2-1
Activity Based Costing Conceptual Cost Flow Diagram
2.2 Application Category Definition
A critical component of the full cost user fees review is the selection of development fee costing
categories. This is an important first step as the process design, effort estimation and
subsequent costing is based on these categorization decisions. It is also important from a
compliance stand point where, as noted previously, the Planning Act requires user fees to be
cost justified by application type consistent with the categorization contained within the City’s
tariff of fees. Moreover, it is equally important in costing building permit fees to understand the
cost/revenue relationships within the City’s Bylaw, beyond the statutory cost justification for fees
established at the administration and enforcement under the authority of the Building Code.
The fee categorization process for development fees occurred at the project initiation stage of
the study process and through subsequent discussions with City Project Team members.
Planning application characteristics for major costing category were provided by City Planning
Department staff for input into the fee structure design. City Building Department staff provided
input from the City’s building permit reporting system into the various permit costing categories.
Activity Based Costing Development Fees Model
A
Support Functions
Public Works
& Engineering
Planning
B
“A” Drivers
“A” Drivers
Corporate Overhead Functions
“B” Drivers
“B” Drivers
“B” Drivers
Development Review Divisions(Examples)
Development Fee Categories
% EffortTimeDrivers
Fire Prevention
Building
Site Plan
OPA/Rezoning
Res. Building Permits
ICI BuildingPermits
Minor Variance

2-3
Watson & Associates Economists Ltd. H:\Cornwall\DAAP Fees\Development Fees Report.docx
Tables 2-1 and 2-2 summarize the development fee costing categories for various development
fees included in the activity based costing model and later used to rationalize the
recommendations to the City’s development fee structure.
Table 2-1
Planning Application Fee Type/Costing Categories
Planning Application Type/ Costing Category
Site Plan Approval
Minor Variance
Consent for Severance
Official Plan Amendment
Plan of Subdivision
Subdivision Amendment for Prior Plan Approval
Condominium – Standard
Condominium Conversion
Zoning Bylaw Amendment
Lifting of Holding Symbol
Heritage Designation
Zoning Compliance
ESA Phase I
Work Order Report
Encroachment Agreement
Table 2-2
Building Permit Fee Types and Costing Categories
Application Type Application Costing Category
Group A - Assembly New
Addition/Repair/Alteration
Group B - Institutional New
Addition/Repair/Alteration
Group C - Residential
Single Detached - New
Single Detached - Addition/Repair/Alteration
Doubles (Duplex, Semi-Detached) – New
Doubles (Duplex, Semi-Detached) – Addition/Repair/Alteration Multiples - New
Multiples - Addition/Repair/Alteration
Accessory Buildings
Group D & E – Business Personal Service and Mercantile
New
Addition/Repair/Alteration

2-4
Watson & Associates Economists Ltd. H:\Cornwall\DAAP Fees\Development Fees Report.docx
Table 2-2 (cont’d)
Building Permit Fee Types and Costing Categories
Group F - Industrial New
Addition/Repair/Alteration
Other
Demolition Permits
Change of Use/Location/No Construction
Temporary Buildings
Fence Permits
Conditional Permits
2.3 Application Processing Effort Cost Allocation
To capture each participating City staff member’s relative level of effort in processing
development applications, process map templates were prepared for each of the above
referenced costing categories. These process map templates outline the typical process steps
undertaken for each development fee costing category identified previously. The process maps
utilized were developed to reflect the City’s current processing activities and participants. The
finalized process templates were circulated to members of the City Project Team and initial
effort estimates were provided through internal business unit discussions.
The effort estimates received were applied against average annual application volumes for the
period 2008-2010 to assess the average annual processing time per position spent on each
development fee category. Annual processing effort per staff position was measured against
available processing capacity to determine overall service levels. The results of the initial
capacity analysis were reviewed with the City Project Team. Effort estimates were
subsequently refined by the City Project Team in consultation with the participating business
units to better reflect current staff utilization levels. These refinements provided for the
recognition of efforts within the development fees review processes ancillary to direct
processing tasks, i.e. application oversight activities by departmental senior management and
administration and enforcement activities under the authority of the Building Code.
The processing effort review produced the following results regarding staff resource utilization.
The Planning Department expends approximately 55% of available staff resources annually
processing development applications. The balance of Planning Department staff time is
devoted to long-range planning, administration, pre-consultation on development, program
implementation, and other corporate initiatives. The majority of annual staff resources attributed

2-5
Watson & Associates Economists Ltd. H:\Cornwall\DAAP Fees\Development Fees Report.docx
to planning applications is spent on Minor Variance, Consent, Official Plan Amendment, Zoning
Bylaw Amendment and Site Plan applications. Minor amounts of time from the Infrastructure
and Municipal Works/Engineering Division relate to development processing activities for Site
Plan, Minor Variance and Consent applications. The Building By-law Department expends
approximately 70% of staff processing effort on administering and enforcing the Building Code
Act, with the remaining 30% attributable to by-law enforcement matters and non-permit related
general administrative activities. Approximately 2/3 of annual processing capacity is
attributable to residential building permit processes.
2.4 Direct Cost Business Units
The following City business units that are directly involved in processing the development fees
included in the review:
Planning Services;
Building Services; and
Infrastructure and Municipal Works/Engineering Division
Based on the results of the resource capacity analysis summarized above, the proportionate
share of each individual’s direct costs is allocated to the respective development fee categories.
The City’s 2011 Operating Budget was used to generate the direct cost allocations within the
model and include the cost components such as:
Salary and Benefits;
Purchase of Goods;
Services & Rent; and
Financial Expenditures (e.g. insurance premiums)
2.5 Indirect Cost Functions and Cost Drivers
An activity based costing review includes not only the direct service cost of providing service
activities but also the indirect support costs that allow direct service business units to perform
these functions. The method of allocation employed in this analysis is referred to as a step
costing approach. Under this approach, support function and general corporate overhead
2-6
Watson & Associates Economists Ltd. H:\Cornwall\DAAP Fees\Development Fees Report.docx
functions are classified separate from direct service delivery departments. These indirect cost
functions are then allocated to direct service delivery departments based on a set of cost
drivers, which subsequently flow to development fee categories according to staff effort
estimates. Cost drivers are a unit of service that best represent the consumption patterns of
indirect support and corporate overhead services by direct service delivery business units. As
such, the relative share of a cost driver (units of service consumed) for a direct department
determines the relative share of support/corporate overhead costs attributed to that direct
service department. An example of a cost driver commonly used to allocate information
technology support costs would be a business unit’s share of supported personal computers.
Cost drivers are used for allocation purposes acknowledging that these business units do not
typically participate directly in the development review process, but that their efforts facilitate
services being provided by the City’s direct business units.
The indirect costs provided for in the development fees analysis were provided by the City
Finance Department. The City currently allocates corporate costs to each City department as
part of the budget process. These costs are determined based on a step costing methodology
and are contained within the “Financial” expenditures component of departmental budgets.
These corporate costs include annual expenditure provisions for A/P Support, Accounting
Support, Auditing, Building Maintenance, Budget Support, CAO Support, Courier, Finance
Support, HR Support, IT Support, Insurance, Payroll Support, Printing, Purchasing Support and
Retiree Benefits.
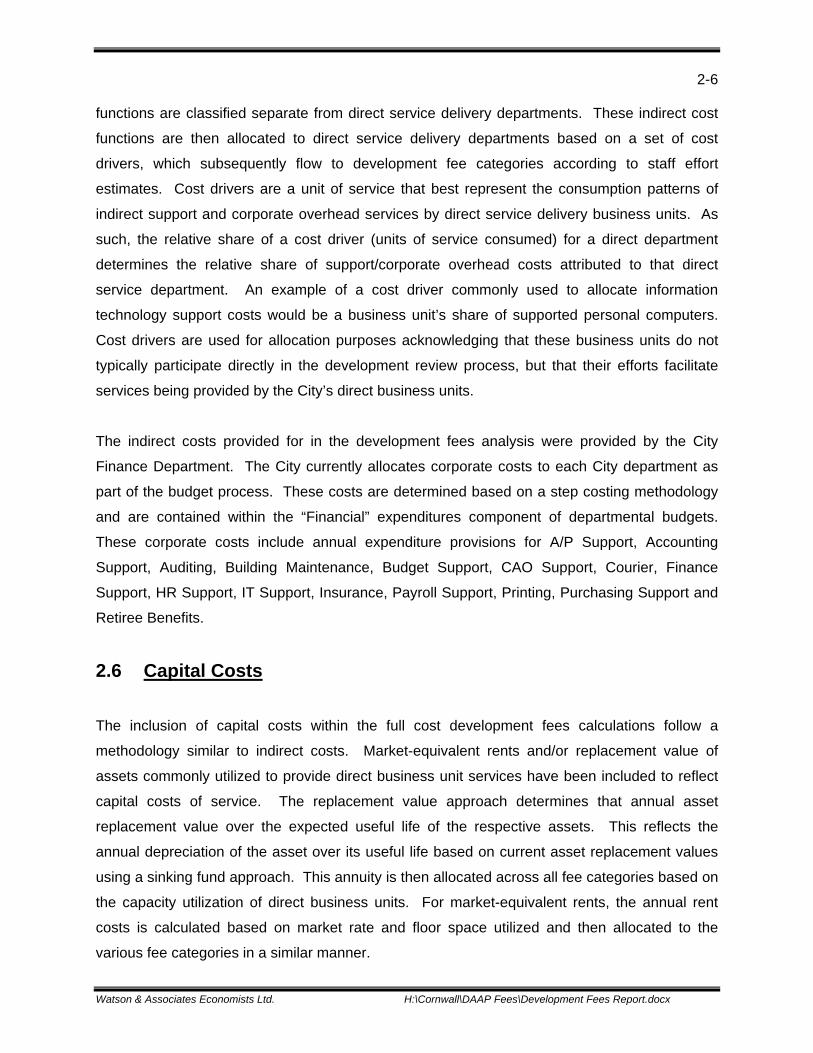
2.6 Capital Costs
The inclusion of capital costs within the full cost development fees calculations follow a
methodology similar to indirect costs. Market-equivalent rents and/or replacement value of
assets commonly utilized to provide direct business unit services have been included to reflect
capital costs of service. The replacement value approach determines that annual asset
replacement value over the expected useful life of the respective assets. This reflects the
annual depreciation of the asset over its useful life based on current asset replacement values
using a sinking fund approach. This annuity is then allocated across all fee categories based on
the capacity utilization of direct business units. For market-equivalent rents, the annual rent
costs is calculated based on market rate and floor space utilized and then allocated to the
various fee categories in a similar manner.

2-7
Watson & Associates Economists Ltd. H:\Cornwall\DAAP Fees\Development Fees Report.docx
Similar to indirect costs, the City’s budgets reflect capital cost allocations for each department in
the form of transfers to reserves and capital. These budgeted amounts have been included in
the full cost assessment and allocated to the respective fee categories based on the staff
resource capacity utilization.
2.7 Building Code Act Reserve Fund Policy
The Building Code Statute Law Amendment Act imposed municipal financial reporting
regulations that recognize the legitimacy of creating a municipal reserve fund to manage
Building Code Act responsibilities. However, the Act and its regulations are silent on the
design/rationale of reserve funds. Some latitude therefore exists around rationale, along with an
obligation to quantify reserve fund target balances.
It is recognized that a Building Code Act Fee Stabilization Reserve Fund (FSRF) has been
created by the City specifically for smoothing out any revenue shortfalls associated with
temporary declines in permit activity. Moreover, any funds accumulated for this purpose would
not be available to fund any other municipal financial priorities. The rationale for a FSRF is to
reduce the staffing and budgetary challenges associated with an economic downturn and
legislative service level compliance. Without such a reserve fund, reduced growth and permit
volumes during a downturn could result in severe budgetary pressures and the loss of certified
Building Department staff, which would be difficult to replace during the subsequent economic
recovery. Establishing a reserve fund will provide the City with the ability to retain a sustainable
portion of the qualified staff across a temporary downturn in activity, while recognizing the City’s
obligation to manage resources during these periods.
Based on a review of building permit activity within the City over the previous 15 years, a
reserve fund target of 1.7x annual direct costs should be considered as the target balance. This
reflects the anticipated revenue loss associated with declines in building permit activity during
this period, relative to the long-term average. Once this target has been achieved the City
would be required to review its building permit fees and adjust them accordingly as to not
provide for revenues exceeding anticipated costs of administration and enforcement under the
Building Code Act. The financial impact associated with this reserve fund policy is addressed in
subsequent chapters of this report.
Watson & Associates Economists Ltd. H:\Cornwall\DAAP Fees\Development Fees Report.docx
3. DEVELOPMENT FEES REVIEW
3-1
Watson & Associates Economists Ltd. H:\Cornwall\DAAP Fees\Development Fees Report.docx
3. DEVELOPMENT FEES REVIEW
3.1 Development Fees Costing Results
Table 3-1 documents the City’s annual costs of providing development fee services by cost
component. The annual costs reflect the organizational direct, indirect and capital costs
associated with processing activities at average historic volumes levels for the period 2008-
2010. These costs are based on 2011 budget estimates and are compared with revenues
derived from current development fee schedules applied to average application/permit volumes
and charging parameters. The charging parameters for these applications/permits were
provided by the City Project Team from development applications and reporting systems.
As summarized in the table below, the development fee processes account for $1.27 million
annually. The City’s fee schedules currently recover $0.58 million annually or 46% of full cost.
Direct costs of processing represent the largest component of annual costs at $1.16 million or
92% of full costs. These costs are derived from the capacity analysis generated based on the
processing estimates for each application/permit type. Indirect support and corporate overhead
costs and capital costs represent 8% of total processing costs, or $0.10 million annually.
Planning application fees are generally recovering 14% of annual costs of processing, with
current fee structures recovering approximately $73,000 annually compared with costs of
processing totalling approximately $526,000 annually. As a result of these under-recovering
planning application fees, approximately $453,000 in City expenditures occupied by processing
activities are being subsidized by other revenue sources, e.g. general levy.
Building permit fees currently recover 67% of the annual full costs of processing. Current
annual expenditures total approximately $746,000 annually, with current fee structures
producing $503,000 annually on average. As a result, approximately $242,000 annually is
being funded from the City’s reserve fund, established to sustain operations. This reserve fund
has been accumulated from excess revenues provided from large non-residential applications,
periodically and infrequently over the last 5 years. Given the underperforming recoveries of
fees currently the City’s reserve fund is depleting and unsustainable.

3-2
Watson & Associates Economists Ltd. H:\Cornwall\DAAP Fees\Development Fees Report.docx
Table 3-1
Consolidated Development Fees Impacts
(2011$)
Planning
Application Fees Building Permit
Fees Total
Annual Expenditures - Direct Costs 475,870 688,739 1,164,609- Indirect Costs 50,384 56,805 107,190Total Annual Expenditures 526,255 745,544 1,271,799Annual Development Fee Revenues 73,000 503,100 576,100
Net Surplus/(Deficit) (453,255) (242,444) (695,699)
3.2 Planning Application Fees
The focus of this assignment is to develop full cost recovery fee structure recommendations that
would achieve legislative compliance, maximize revenue certainty and generally recognize
marginal cost attributes of development applications. Table 3-2 expands upon the aggregate
cost/revenue presentation for planning application fees provided above and identifies the
average cost and revenue impacts by planning application fee type.
Table 3-2
Annual Planning Fees Full Cost Impacts by Fee Type
(2011$)
Planning Application Type Annual Costs (2011$) Annual Net % CostDirect Indirect Total Revenues Position Recovery
Site Plan Control 104,710 13,186 117,896 6,300 (111,596) 5%Minor Variance 146,094 14,749 160,843 19,305 (141,538) 12%Consent for Severance 45,312 4,702 50,014 9,100 (40,914) 18%OPA 14,085 1,322 15,407 4,000 (11,407) 26%Subdivision 16,269 1,632 17,901 990 (16,911) 6%Subdivision Amendment for Prior Plan Approval 11,324 1,176 12,500 - (12,500) 0%Condo Standard 5,278 594 5,872 640 (5,232) 11%Condo Conversion 7,061 736 7,797 640 (7,157) 8%ZBA 73,463 6,778 80,241 12,000 (68,241) 15%Lifting of Hold Symbol 2,079 230 2,309 700 (1,609) 30%Heritage Designation 45 4 49 - (49) 0%Zoning Compliance 13,009 1,357 14,366 1,100 (13,266) 8%ESA Phase I 2,211 210 2,421 375 (2,046) 15%Work Order Report 34,588 3,676 38,264 17,650 (20,614) 46%Encroachment Agreement 341 32 373 200 (173) 54%TOTAL 475,870 50,384 526,255 73,000 (453,255) 14%
Total Allocation 90% 10% 100%

3-3
Watson & Associates Economists Ltd. H:\Cornwall\DAAP Fees\Development Fees Report.docx
Table 3-3 summarizes the annual processing costs and revenues provided in the previous table
on a per application basis. Based on the results presented in Table 3-3 the following
summarizes the fee structure analysis by planning application type to achieve full cost recovery.
The recommended fee structures are based on the activity based costing model and average
application characteristics underlying planning applications during the 2008-2010 period.
Table 3-3
Planning Application Fees Full Cost Impacts
(2011$)
Site Plan Control
The City currently imposes a fee of $350 for site plan approval and a fee of $300 for a site plan
agreement amendment. The average cost of processing a site plan application is $6,550. No
recommendation is provided for Site Plan Amendment Approval as it was not included in the
costing assessment.
Full Cost Recovery Fee Recommendation
o Site Plan Approval - $6,550
Minor Variance and Consent
Currently the City imposes a flat rate fees for minor variance and consents/severances. The
current fees are as follows:
Average Average Full Cost FeePlanning Application Type Cost per Revenue per Adjustment
Application Application %
Site Plan Control 6,550 350 1771%Minor Variance 2,062 248 733%Consent for Severance 1,786 325 450%OPA 7,704 2,000 285%Subdivision 17,901 990 1708%Subdivision Amendment for Prior Plan Approval 12,500 n/c n/aCondo Standard 5,872 640 817%Condo Conversion 7,797 640 1118%ZBA 10,030 1,500 569%Lifting of Hold Symbol 2,309 700 230%Heritage Designation 49 n/a n/aZoning Compliance 653 50 1206%ESA Phase I 161 25 546%Work Order Report 108 50 117%Encroachment Agreement 373 200 86%

3-4
Watson & Associates Economists Ltd. H:\Cornwall\DAAP Fees\Development Fees Report.docx
Minor Variance
Signage & Fencing - $225
Zoning/Land Use - $270
Consent/Severance
Severance (New Lot) - $350
Correction to Title; Severance (semi-detached or addition to a lot or right-of-
way/easement); Consent (a lease) - $300
Stamping of Deeds for Consent - $100
Minor Variance applications are recovering $248 per application compared to processing costs
of $2,062. Consent applications are recovering $325 per application compared to processing
costs of $1,786.
Full Cost Recovery Fee Recommendation
o Minor Variance - Signage & Fencing - $1,875
o Minor Variance - Zoning/Land Use - $2,250
o Severance (New Lot) - $1,925
o Correction to Title; Severance (semi-detached or addition to a lot or right-of-
way/easement); Consent (a lease) - $1,650
o Stamping of Deeds for Consent - $550
Official Plan Amendment (OPA)
Currently the City imposes a flat rate fee for OPA applications of $2,500. The City’s costs of
processing an OPA total $7,700 on average.
Full Cost Recovery Fee Recommendation
o Official Plan Amendment - $7,700
Plan of Subdivision
The City currently imposes of base charge of $240 and a per hectare fee of $30. Based on this
fee structure the City is recovering $990 per application on average. The full cost fees
associated with processing this type of application is approximately $17,900. Maintaining the
current fee structure the City would have to increase the base charge fee to $4,340 and the per
hectare charge to $542. This fee structure places a significant amount of cost recovery on the
per hectare component of the process, which does not reflect the significant amount of fixed
processing costs inherent therein. Moreover, City staff indicated that amendments to a Plan of
Subdivision that has received prior approval constitute a significant amount of processing effort,

3-5
Watson & Associates Economists Ltd. H:\Cornwall\DAAP Fees\Development Fees Report.docx
similar to a new plan of subdivision. Currently the City does not impose fees for these
amendments which cost the City $12,500 per application on average.
Full Cost Recovery Fee Recommendation
o Subdivision Base Charge - 9,150
o Subdivision per Hectare Charge - $350
o Subdivision Amendment - $12,500
Condominium
The City imposes charges for a Draft Plan of Condominium application including a base charge
of $240 and $20 per condominium unit. The City’s fee structure currently recovers $640 per
application on average. This compares with costs of processing condominium applications of
$5,870 for a standard application and $7,800 for a condominium conversion application.
Full Cost Recovery Fee Recommendation
o Condominium Standard Base Charge - $2,200
o Condominium Conversion Base Charge - $4,125
o Condominium per Unit Charge - $180
Zoning By-law Amendment
Currently the City imposes a flat rate fee for a Zoning Bylaw Amendment application of $1,500.
The City’s cost of processing a Zoning Bylaw Amendment application totals $10,030 on
average. Removal of a Holding Category application fee is currently $700, compared with
average processing costs per application of $2,300.
Full Cost Recovery Fee Recommendation
o Zoning Bylaw Amendment - $10,030
o Lifting an ‘H’ Holding Symbol – $2,300
3-6
Watson & Associates Economists Ltd. H:\Cornwall\DAAP Fees\Development Fees Report.docx
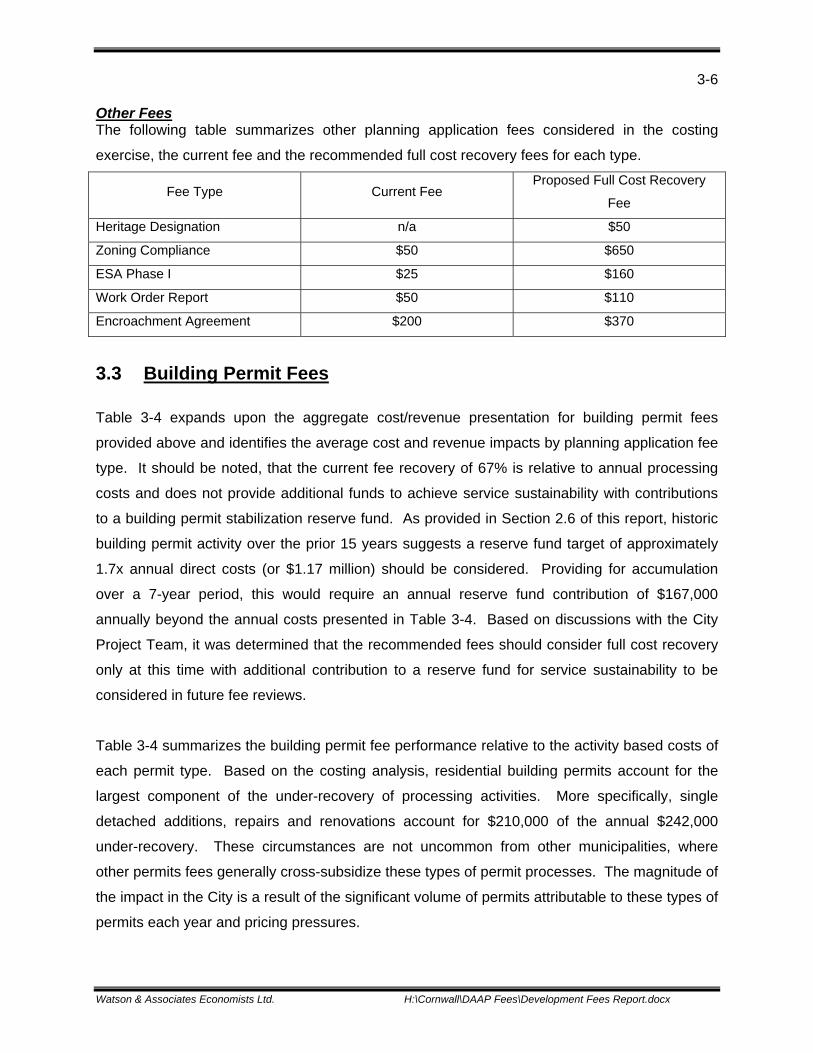
Other Fees The following table summarizes other planning application fees considered in the costing
exercise, the current fee and the recommended full cost recovery fees for each type.
Fee Type Current Fee Proposed Full Cost Recovery
Fee
Heritage Designation n/a $50
Zoning Compliance $50 $650
ESA Phase I $25 $160
Work Order Report $50 $110
Encroachment Agreement $200 $370
3.3 Building Permit Fees
Table 3-4 expands upon the aggregate cost/revenue presentation for building permit fees
provided above and identifies the average cost and revenue impacts by planning application fee
type. It should be noted, that the current fee recovery of 67% is relative to annual processing
costs and does not provide additional funds to achieve service sustainability with contributions
to a building permit stabilization reserve fund. As provided in Section 2.6 of this report, historic
building permit activity over the prior 15 years suggests a reserve fund target of approximately
1.7x annual direct costs (or $1.17 million) should be considered. Providing for accumulation
over a 7-year period, this would require an annual reserve fund contribution of $167,000
annually beyond the annual costs presented in Table 3-4. Based on discussions with the City
Project Team, it was determined that the recommended fees should consider full cost recovery
only at this time with additional contribution to a reserve fund for service sustainability to be
considered in future fee reviews.
Table 3-4 summarizes the building permit fee performance relative to the activity based costs of
each permit type. Based on the costing analysis, residential building permits account for the
largest component of the under-recovery of processing activities. More specifically, single
detached additions, repairs and renovations account for $210,000 of the annual $242,000
under-recovery. These circumstances are not uncommon from other municipalities, where
other permits fees generally cross-subsidize these types of permit processes. The magnitude of
the impact in the City is a result of the significant volume of permits attributable to these types of
permits each year and pricing pressures.

3-7
Watson & Associates Economists Ltd. H:\Cornwall\DAAP Fees\Development Fees Report.docx
Table 3-4
Annual Building Permit Fees Full Cost Impacts by Fee Type
(2011$)
Based on discussions with the City Project Team and consideration for market comparators,
increasing the current building permit fees from $9.00/$1,000 of construction value to
$12.50/$1,000 of construction value would result in overall cost recovery performance of
approximately 95%. The proposed full cost recovery permit fees would generate an additional
$195,000 annually based on underlying permit activity levels. Table 3-5 summarizes the per
permit fee comparison associated with the fee increase by permit type.
Building Permit Category Annual Costs (2011$) Annual Net % CostDirect Indirect Total Revenues Position Recovery
Group A - AssemblyNew 20,961 1,680 22,641 49,612 26,971 219%Group A - AssemblyAddition/ Repair/Renovation 43,185 3,412 46,597 59,145 12,548 127%Group B - InstitutionalNew 1,661 133 1,794 1,794 - 100%Group B - InstitutionalAddition/ Repair/Renovation 12,894 1,018 13,912 25,387 11,475 182%Group C - Residential - SingleNew 64,858 5,292 70,150 51,698 (18,452) 74%Group C - Residential - SingleAddition/ Repair/Renovation 209,325 16,727 226,052 15,727 (210,325) 7%Group C - Residential - Doubles - (Duplex, Semi)New 37,054 3,036 40,091 20,898 (19,193) 52%Group C - Residential - Doubles - (Duplex, Semi)Addition/ Repair/Renovat 38,352 3,103 41,454 1,974 (39,480) 5%Group C - Residential - MultiplesNew 12,658 1,009 13,667 47,188 33,520 345%Group C - Residential - MultiplesAddition/ Repair/Renovation 39,664 3,140 42,803 6,667 (36,137) 16%Group C - Residential - Accessory Buildings 44,419 3,708 48,127 7,393 (40,734) 15%Group D & E - Office/ Personal Service/ MercantileNew 8,521 683 9,204 28,249 19,045 307%Group D & E - Office/ Personal Service/ MercantileAddition/ Repair/Renova 54,081 4,311 58,393 28,192 (30,201) 48%Group F - IndustrialNew 3,549 283 3,832 94,696 90,864 2471%Group F - IndustrialAddition/ Repair/Renovation 11,868 946 12,814 19,290 6,475 151%Demolition Permits 12,366 1,154 13,520 2,900 (10,620) 21%Change of Use/Location/No Construction 3,310 283 3,593 1,500 (2,093) 42%Temporary Building 4,007 362 4,369 800 (3,569) 18%Fence Permit 42,604 4,685 47,289 7,550 (39,739) 16%Conditional Permits 23,402 1,839 25,241 32,443 7,201 129%
TOTAL 688,739 56,805 745,544 503,100 (242,445) 67%
Total Allocation 92% 8% 100%

3-8
Watson & Associates Economists Ltd. H:\Cornwall\DAAP Fees\Development Fees Report.docx
Table 3-5
Current and Proposed Full Cost Recovery Building Permit Fees by Fee Type (2011$)
3.4 Development Industry Stakeholder Consultation
The City hosted a consultation meeting with various developments industry stakeholders on
March 29, 2012. A presentation of preliminary study findings and full cost recovery fee
recommendations were provided to the stakeholder group for their consideration and input. The
presentation covered the purpose of the review, statutory authority for imposing development
user fees, activity based costing methodology and annual cost impacts, full cost recovery fees
with a provision for phase-in to 2013, and development fee impacts and municipal fee
comparisons. Appendix A of this report contains the presentation document and notes arising
from the meeting. There were a number of items discussed at the meeting including:
The inclusion of surcharges for applications requiring additional processing effort (e.g.
incomplete applications, multiple submissions, etc.);
Municipal development fee comparators should be limited to municipalities within the
surrounding area;
Support for increases for larger industrial and commercial applications, as well as Minor
Variance applications deemed to require significant amounts of planning staff resources;
Little support for increases on residential or smaller residential applications; and
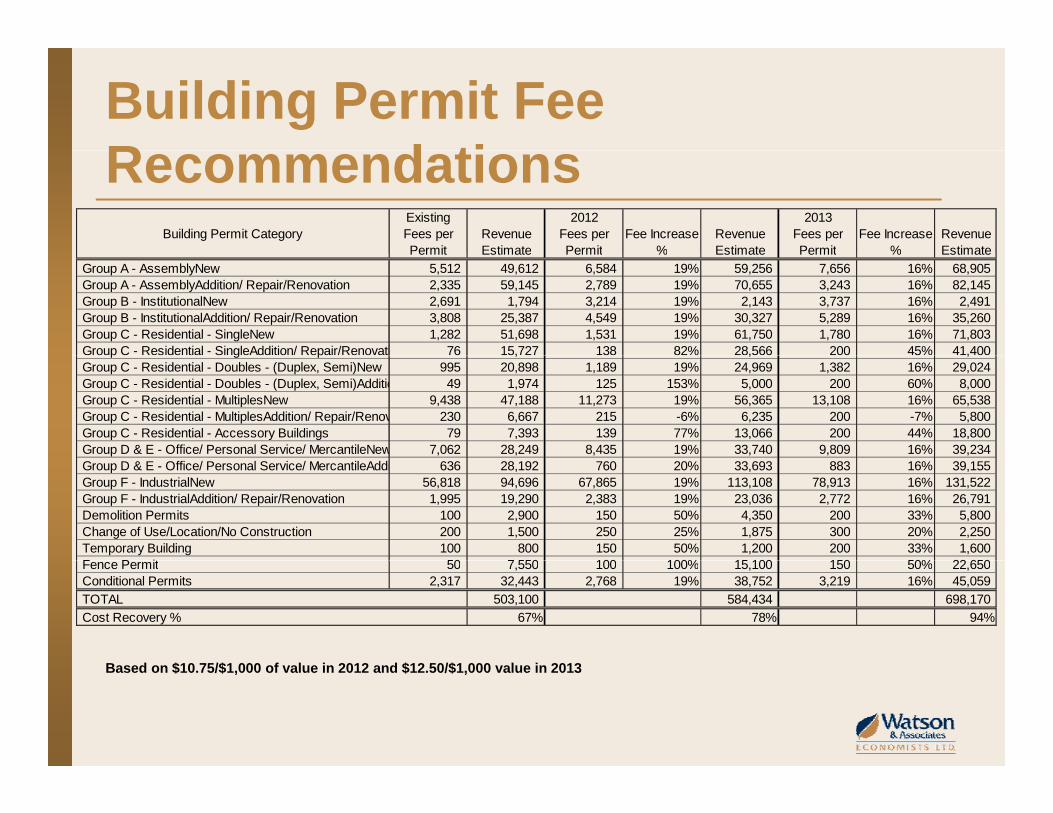
Existing ProposedBuilding Permit Category Fees per Revenue Fees per Fee Increase Revenue
Permit Estimate Permit % Estimate
Group A - AssemblyNew 5,512 49,612 7,656 16% 68,905 Group A - AssemblyAddition/ Repair/Renovation 2,335 59,145 3,243 16% 82,145 Group B - InstitutionalNew 2,691 1,794 3,737 16% 2,491 Group B - InstitutionalAddition/ Repair/Renovation 3,808 25,387 5,289 16% 35,260 Group C - Residential - SingleNew 1,282 51,698 1,780 16% 71,803 Group C - Residential - SingleAddition/ Repair/Renovation 76 15,727 200 45% 41,400 Group C - Residential - Doubles - (Duplex, Semi)New 995 20,898 1,382 16% 29,024 Group C - Residential - Doubles - (Duplex, Semi)Addition/ Repair/Re 49 1,974 200 60% 8,000 Group C - Residential - MultiplesNew 9,438 47,188 13,108 16% 65,538 Group C - Residential - MultiplesAddition/ Repair/Renovation 230 6,667 200 -7% 5,800 Group C - Residential - Accessory Buildings 79 7,393 200 44% 18,800 Group D & E - Office/ Personal Service/ MercantileNew 7,062 28,249 9,809 16% 39,234 Group D & E - Office/ Personal Service/ MercantileAddition/ Repair/R 636 28,192 883 16% 39,155 Group F - IndustrialNew 56,818 94,696 78,913 16% 131,522 Group F - IndustrialAddition/ Repair/Renovation 1,995 19,290 2,772 16% 26,791 Demolition Permits 100 2,900 200 33% 5,800 Change of Use/Location/No Construction 200 1,500 300 20% 2,250 Temporary Building 100 800 200 33% 1,600 Fence Permit 50 7,550 150 50% 22,650 Conditional Permits 2,317 32,443 3,219 16% 45,059
TOTAL 503,100 698,170
Cost Recovery % 67% 94%
3-9
Watson & Associates Economists Ltd. H:\Cornwall\DAAP Fees\Development Fees Report.docx
Comments outside of the scope of this review, including regionalization of services
across municipalities and taxation policy.
At the conclusion of the meeting the City requested that the development industry stakeholders
provide written comments on the proposed development fee increases. Mr. Guy Menard of
Menard Bros. & Associates Ltd. offered to provide written comments to the City on the matter.
On May 25, 2012, the City received the following comments from Mr. Menard in this regard.
1) “Permits and planning fees must be seen as a combination of investment (in our tax
base) and municipal expense.
2) The planning/permits department is unique because if directly affects municipal tax base
growth: this is the investment component that should be reflected in rate changes.
3) A major municipal strategic plan would great help to add direction to this exercise.
4) Fairness: different situations warrant different treatments.
Further category breakdowns should be added.
5) Some fees should have a fixed cost component and a variable component. This allows
for sufficient fees for smaller yet time consuming applications. At the same time, it does
not penalize the larger projects.
6) Please keep in mind that our true competition comes from neighbouring townships and
not necessarily other Ontario municipalities. Cornwall rates must remain competitive
with township rates. Consultation with township planning departments could yield a
more even playing field. Regional planning services could also be an alternative.
7) Increases should be phased in over a few years. Timing is critical as Cornwall is
currently re-inventing itself.
8) User fees should be strongly considered to the many time consuming services given to
the general public.”
Based on the feedback provided the City asked that the full cost fee structure be reconsidered
and that the municipal comparisons only include the surrounding Townships. In this regard, the
planning applications fees structure for major development applications currently imposed on a
flat fee basis have been revised to include both a base charge component and a variable fee
component (i.e. per unit/sq.mt. of GFA). It should be noted that no empirical data was provided
relating to the historic size characteristics of applications, thus full cost recovery is difficult to
predict for these fee structure changes. Also for minor variance and consent applications, the
3-10
Watson & Associates Economists Ltd. H:\Cornwall\DAAP Fees\Development Fees Report.docx
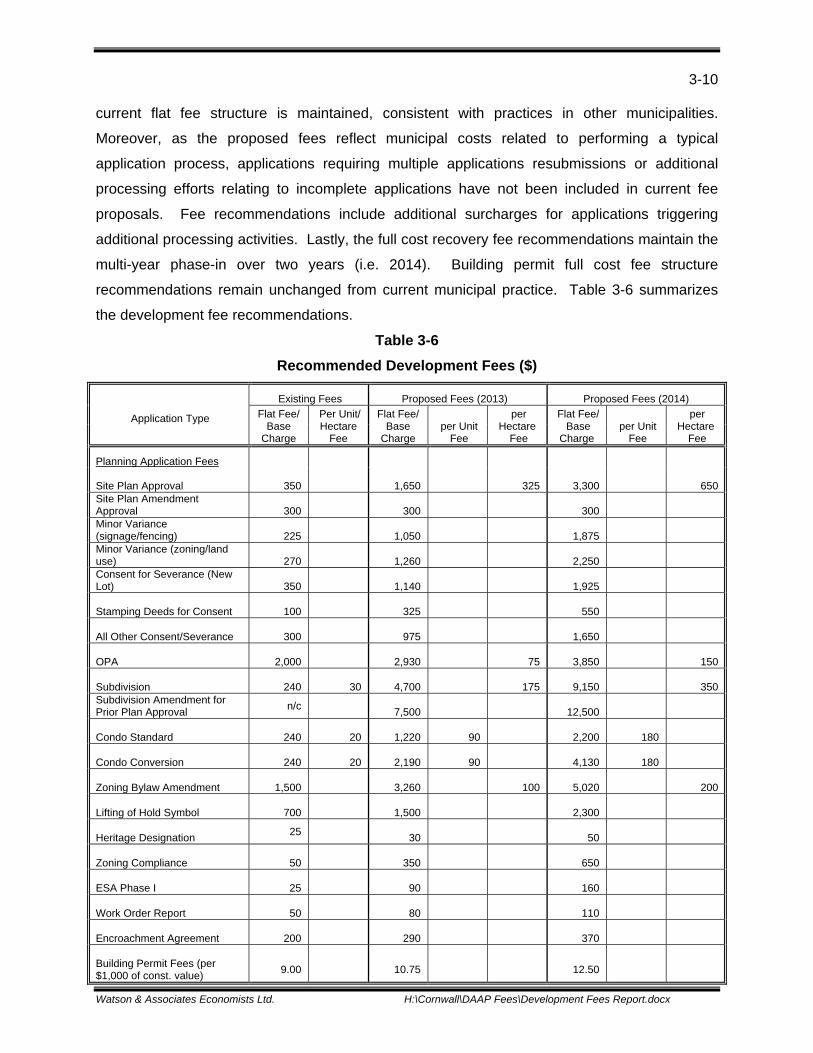
current flat fee structure is maintained, consistent with practices in other municipalities.
Moreover, as the proposed fees reflect municipal costs related to performing a typical
application process, applications requiring multiple applications resubmissions or additional
processing efforts relating to incomplete applications have not been included in current fee
proposals. Fee recommendations include additional surcharges for applications triggering
additional processing activities. Lastly, the full cost recovery fee recommendations maintain the
multi-year phase-in over two years (i.e. 2014). Building permit full cost fee structure
recommendations remain unchanged from current municipal practice. Table 3-6 summarizes
the development fee recommendations.
Table 3-6
Recommended Development Fees ($)
Existing Fees Proposed Fees (2013) Proposed Fees (2014)
Application Type Flat Fee/ Base
Charge
Per Unit/ Hectare
Fee
Flat Fee/ Base
Charge per Unit
Fee
per Hectare
Fee
Flat Fee/ Base
Charge per Unit
Fee
per Hectare
Fee
Planning Application Fees
Site Plan Approval
350
1,650
325
3,300
650
Site Plan Amendment Approval
300
300
300
Minor Variance (signage/fencing)
225
1,050
1,875
Minor Variance (zoning/land use)
270
1,260
2,250
Consent for Severance (New Lot)
350
1,140
1,925
Stamping Deeds for Consent
100
325
550
All Other Consent/Severance
300
975
1,650
OPA
2,000
2,930
75
3,850
150
Subdivision
240
30
4,700
175
9,150
350 Subdivision Amendment for Prior Plan Approval
n/c
7,500
12,500
Condo Standard
240
20
1,220
90
2,200
180
Condo Conversion
240
20
2,190
90
4,130
180
Zoning Bylaw Amendment
1,500
3,260
100
5,020
200
Lifting of Hold Symbol
700
1,500
2,300
Heritage Designation 25
30
50
Zoning Compliance
50
350
650
ESA Phase I
25
90
160
Work Order Report
50
80
110
Encroachment Agreement
200
290
370
Building Permit Fees (per $1,000 of const. value)
9.00
10.75
12.50

3-11
Watson & Associates Economists Ltd. H:\Cornwall\DAAP Fees\Development Fees Report.docx
Surcharges for major applications equivalent to 25% of total application fee would be applicable
where multiple submissions are required or if applications are deemed to be incomplete
requiring significant staff processing effort.

Watson & Associates Economists Ltd. H:\Cornwall\DAAP Fees\Development Fees Report.docx
4. IMPACT ANALYSIS OF FEE STRUCTURE
RECOMMENDATIONS
4-1
Watson & Associates Economists Ltd. H:\Cornwall\DAAP Fees\Development Fees Report.docx
4. IMPACT ANALYSIS OF FEE STRUCTURE
RECOMMENDATIONS
4.1 Impact Analysis of Fee Structure Recommendations
In order to understand the impacts of the proposed full cost recovery development user fees an
impact analysis for sample developments has been prepared. The development user fee
comparison includes planning application fees, building permit fees and development charges
for each development sample. The comparison illustrates the impacts of the recommended
development user fees in the context of the total development fees payable to provide a broader
context for the fee considerations. In addition to providing the fee impacts for the City of
Cornwall, Figures 4-1 through 4-3 provide development fee comparisons for select
municipalities within the area. The municipal comparator group has been refined to focus on
the neighbouring Townships, however the City of Ottawa and Kingston have been provided for a
more thorough comparison.
The three development samples analyzed include:
Residential subdivision application of 50 single detached units (Figure 4-1);
Site plan control application for a retail building of 1,000 square meters (Figure 4-2); and
Minor variance application (Figure 4-3).
Residential subdivision application of 50 single detached units (Figure 4-1)
The City’s current development fees imposed on a 50 unit single detached residential
subdivision include plan of subdivision application fees and building permit fees imposed by the
City. On a per unit basis these fees total $1,464. These development user fees on a per unit
basis comprise, planning application fees of $6 per unit and building permit fees of $1,458 per
unit. The 2013 recommended development user fees would increase the total fees payable by
$380 per unit ($97 planning fees and $284 building fees) or an increase of 26% in total
development costs. The 2014 recommended development user fees would subsequently
increase the total fees payable by an additional 21% or $380 per unit.
In comparison to the neighbouring Township’s, South Glengarry currently imposes fees for this
type of application totalling $1,416/unit ($24 planning and $1,392 building). The Township of
4-2
Watson & Associates Economists Ltd. H:\Cornwall\DAAP Fees\Development Fees Report.docx
South Stormont imposes fees for this type of application totalling $791/unit ($30 planning and
$761 building).
Comparable fees imposed in the City’s of Ottawa and Kingston are significantly higher than
those imposed in the City and neighbouring Township’s, principally due to the imposition of
development charges in these jurisdictions. Development fees in Ottawa total $27,892/unit, with
development fees accounting for $3,099/unit (or 11% of total fees) and development charges
providing for $24,793/unit (or 89% of total fees). Development fees in Kingston total
$17,293/unit, with development fees accounting for $2,551/unit (or 15% of total fees) and
development charges providing for $ $14,742/unit (or 85% of total fees).
The narrative above shows the City of Cornwall compared to the Townships of South Glengarry
and South Stormont, and the Cities of Kingston and Ottawa. Appendix “A” includes a survey
that includes a more complete comparison to urban centres. Typically, the City of Kingston and
others are a better representation of development fees in urban centres for comparison to the
City of Cornwall than the Township comparators.
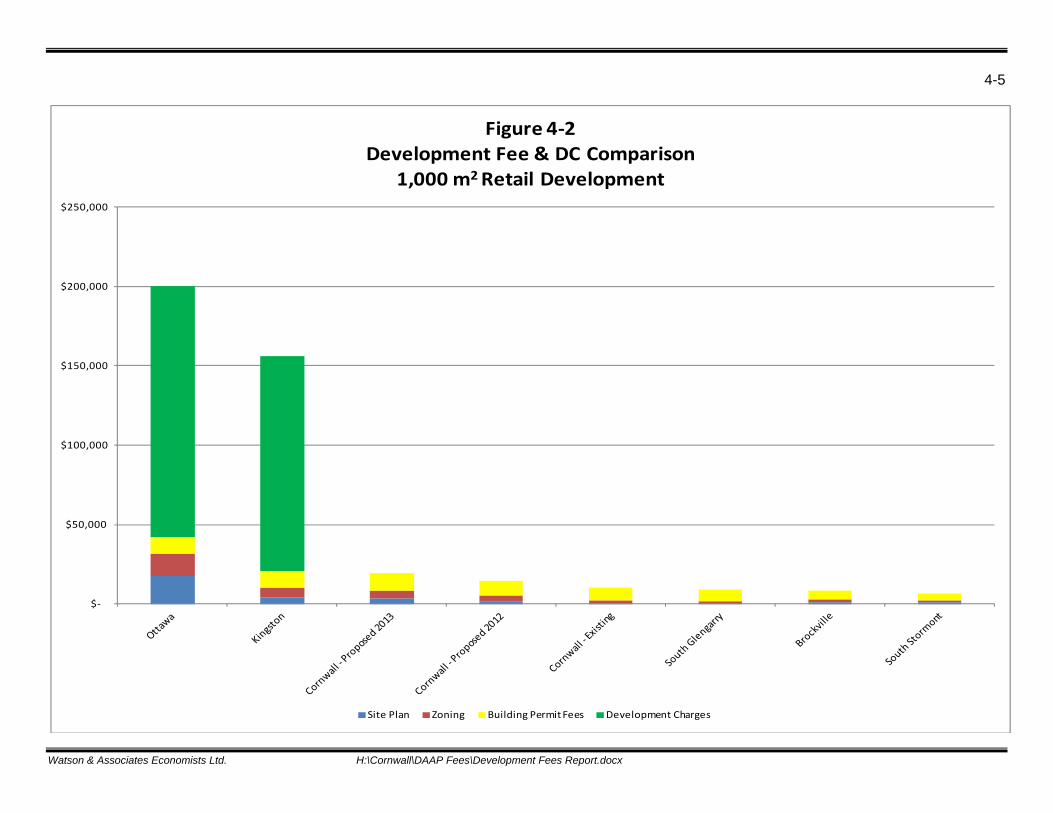
Site plan approval application for a retail building of 1,000 square metres (Figure 4-2)
The City’s current development fees imposed on a 1,000 square metre retail development
include site plan application fees, zoning bylaw amendment application fees and building permit
fees imposed by the City. In total, the fees imposed would be $10,043 comprising, planning
application fees of $2,150 and building permit fees of $7,893. The 2013 recommended
development user fees would increase the total fees payable by $4,416 ($2,882 planning fees
and $1,535 building fees) or an increase of 44% in total development costs. The 2014
recommended development user fees would subsequently increase the total fees payable by an
additional 35% or $5,066 per unit.
In comparison to the neighbouring Township’s, South Glengarry currently imposes fees for this
type of application totalling $9,077 ($1,500 planning and $7,577 building). The Township of
South Stormont imposes fees for this type of application totalling $6,749 ($2,200 planning and
$4,549 building).
Similar to the residential subdivision application comparison, development fees imposed in the
City’s of Ottawa and Kingston are significantly higher than those imposed in the City and
neighbouring Township’s, principally due to the imposition of development charges in these

4-3
Watson & Associates Economists Ltd. H:\Cornwall\DAAP Fees\Development Fees Report.docx
jurisdictions. Development fees in Ottawa total $200,174, with development fees accounting for
$41,836 (or 21% of total fees) and development charges providing for $158,338 (or 79% of total
fees). Development fees in Kingston total $156,047, with development fees accounting for
$20,421 (or 13% of total fees) and development charges providing for $135,626 (or 87% of total
fees).
Minor variance application (Figure 4-3)
Existing development fees imposed for this application type in the City of Cornwall would total
$270. These fees are currently the lowest of the comparator municipalities with fees imposed in
the neighbouring Township’s at $450 in the Township of South Stormont and $350 in the
Township of South Glengarry. Fees currently imposed in the City of Kingston represent the
highest fees in the comparator municipalities at $1,749, with fees imposed in the City of Ottawa
at $1,300.
Recommended full cost recovery fees would require a 2013 increase of $910 (160%) to a total
fee imposed of $1,260. The subsequent increase in 2014 would total $990 (79%) for a total fee
payable of $2,250.
In conclusion the City’s current development fees are comparable to those imposed in the
surrounding Township’s. By comparison with the broader market, the City’s existing fees and
recommended fees, with the exception of Minor Variance recommended fees, are significantly
lower. This is largely due to the additional costs of development imposed in these jurisdictions
for Development Charges. As provided in the appendix to this report, development charges
generally impose the largest cost burden to applicants. The absence of development charges
within the City effectively provide lower overall development costs for applicants, suggesting a
competitive advantage to these jurisdictions even at full cost recovery development fee levels.

4-4
Watson & Associates Economists Ltd. H:\Cornwall\DAAP Fees\Development Fees Report.docx
$‐
$5,000
$10,000
$15,000
$20,000
$25,000
$30,000
Figure 4‐1Development Fee & DC Comparison
50 Single Dwelling Unit Subdivision (cost per unit)
Subdivision Building Permit Fees Development Charges
4-5
Watson & Associates Economists Ltd. H:\Cornwall\DAAP Fees\Development Fees Report.docx
$‐
$50,000
$100,000
$150,000
$200,000
$250,000
Figure 4‐2Development Fee & DC Comparison
1,000 m2 Retail Development
Site Plan Zoning Building Permit Fees Development Charges

4-6
Watson & Associates Economists Ltd. H:\Cornwall\DAAP Fees\Development Fees Report.docx
$‐
$500
$1,000
$1,500
$2,000
$2,500
Cornwall ‐Proposed 2013
Kingston Ottawa Cornwall ‐Proposed 2012
Brockville South Stormont South Glengarry Cornwall ‐ Existing
Figure 4‐3Development Fee Comparison
Minor Variance
Minor Variance
Watson & Associates Economists Ltd. H:\Cornwall\DAAP Fees\Development Fees Report.docx
APPENDIX A DEVELOPMENT INDUSTRY STAKEHOLDER CONSULTATION - MARCH 29, 2012 (PRESENTATION AND MEETING NOTES)

City of Cornwall
Development Industry Stakeholder Consultation
March 29, 2012
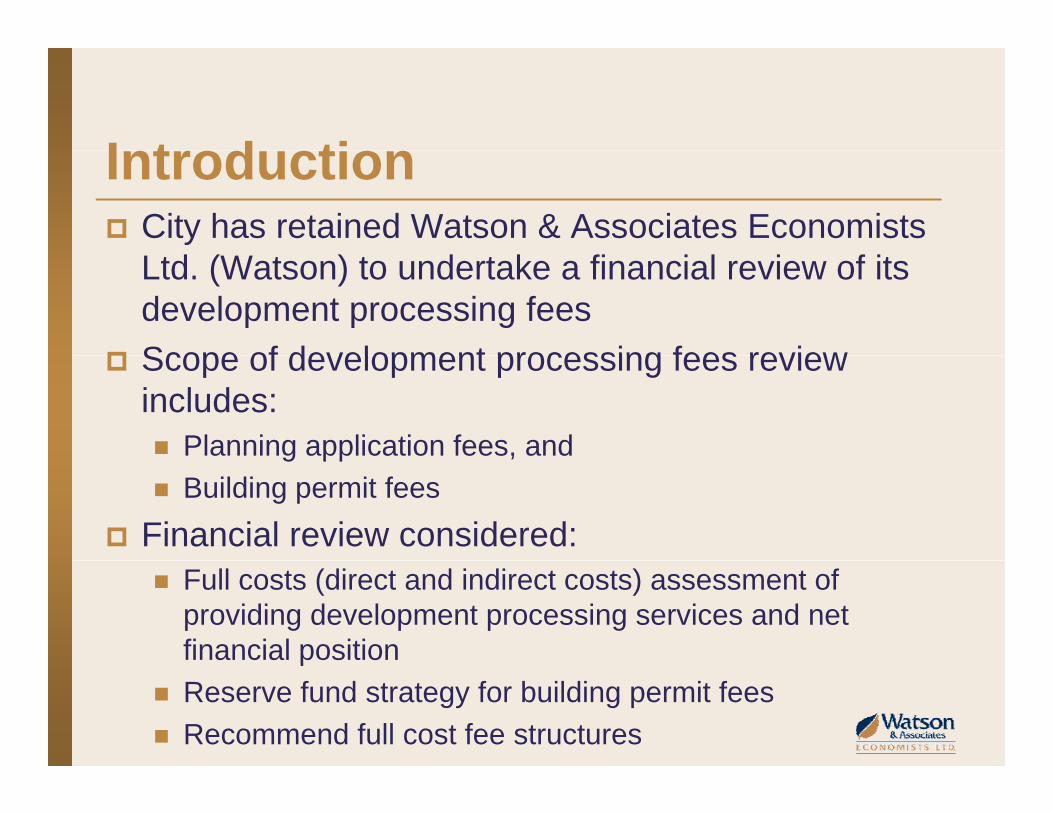
I t d tiIntroduction City has retained Watson & Associates Economists
Ltd. (Watson) to undertake a financial review of its development processing fees
Scope of development processing fees review Scope of development processing fees review includes: Planning application fees, andg pp ,
Building permit fees
Financial review considered: Full costs (direct and indirect costs) assessment of
providing development processing services and net financial positionp
Reserve fund strategy for building permit fees
Recommend full cost fee structures

L i l ti C t tLegislative Context Planning application fees Planning application fees
Governed by s.69 of the Planning Act
Recovery of anticipated costs of processing by type of application
No public process required in setting fees
F b id d d l d t th Fees may be paid under process and appealed to the OMB
Building permit fees Building permit fees Section 7 of the Building Code Act provides statutory
powers to impose fees
Total amount of fees must not exceed reasonable costs to administer and enforce the Act

L i l ti C t tLegislative Context Building permit fees (cont’d) Building permit fees (cont d)
Reasonable costs inferred from O.Reg. 305/03 may include direct and indirect costs
R f d d th A t itt d Reserve funds under the Act are permitted
Statutory public process for a change in fee and annual reporting

Activity Based Costing M th d lMethodology
INDIRECT COSTS DIRECT COSTS
Building
Overhead Function“Cost Drivers”
Development ApprovalsDivisions
Development User Fees
D l tSite Plan
Support
Support Function“Cost Drivers”
DevelopmentApprovalsDivisions Processing Effort
PlanningOverhead Function“Cost Drivers”
SubdivisonS pp
Functions
Engineering
OverheadFunctions
ResidentialBuilding Permits
Other
Overhead Function“Cost Drivers”Support Function
“Cost Drivers”
Building Permits
EngineeringInspectionsInspections

Development Approvals Di i i P i Eff tDivisions Processing Effort
DevelopmentApprovals Divisionstaff processing time X
Historical averageannual user fee =
Total annual processing time for each Development
estimates for each costing category/development userfee application
X annual user fee application volumes = p
Approvals Division staff position by costing category/ development user fee applicationfee application
Expressed percentage of total available processing capacityper Development Approvals Division staff positionper Development Approvals Division staff position

C it A l i R ltCapacity Analysis Results Development fee processing effort estimates appear g
reasonable when measured against available annual processing capacity
Pl i D t t Planning Department Approximately 55% of Planning Department available
processing capacity is allocated to planning applicationsp g p y p g pp
Majority of annual resourcing spent on Minor Variance/Consent, OPA/Rezoning, and Site Plan applicationsapplications
Does not include time related to planning policy, OMB hearings, general administrative time not related to
li tiapplications

C it A l i R ltCapacity Analysis Results Building Departmentg
approximately 70% of Building Department processing capacity is utilized administering and enforcing the Building Code ActBuilding Code Act
Majority of annual processing activity annually relates to residential permits (2/3 of processing activity)
D i l d i l d b l f Does not include time related to bylaw enforcement matters or non-permit general administrative time
Approximately 5% of annual effort from Approximately 5% of annual effort from Infrastructure & Municipal Works is related to development fee processing activities (Site Plan and Mi V i /C t)Minor Variance/Consent)
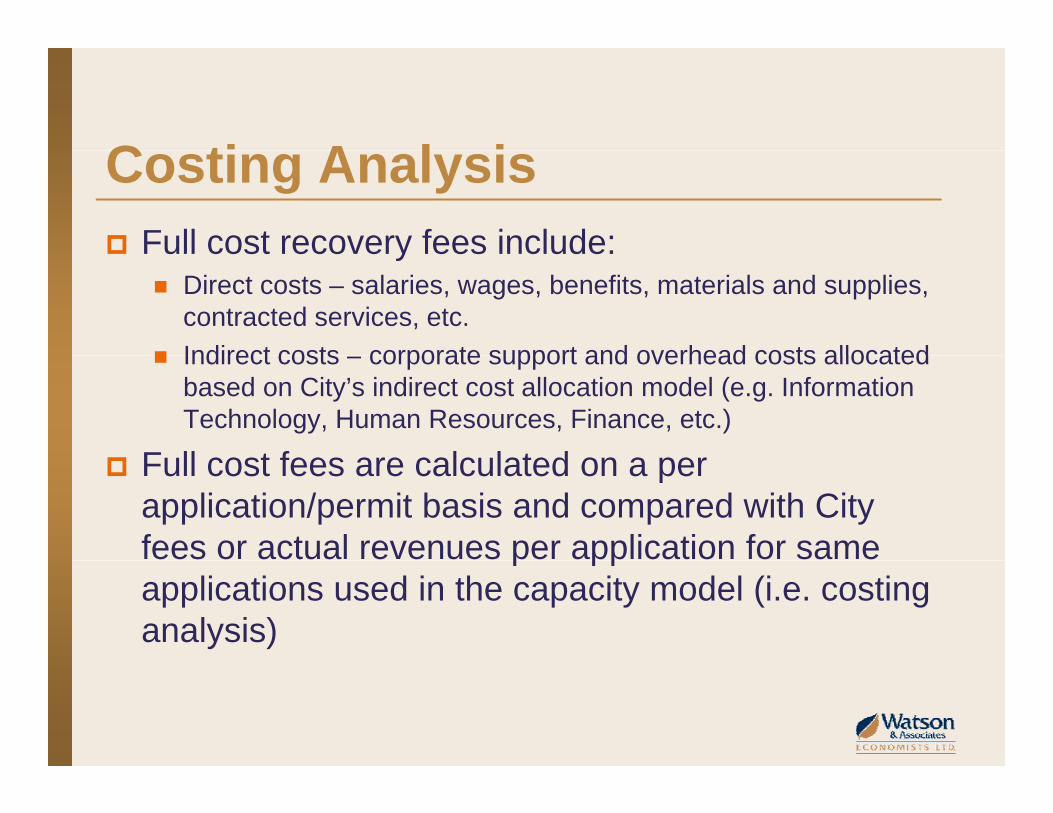
C ti A l iCosting Analysis Full cost recovery fees include: Full cost recovery fees include:
Direct costs – salaries, wages, benefits, materials and supplies, contracted services, etc.
Indirect costs corporate support and overhead costs allocated Indirect costs – corporate support and overhead costs allocated based on City’s indirect cost allocation model (e.g. Information Technology, Human Resources, Finance, etc.)
F ll cost fees are calc lated on a per Full cost fees are calculated on a per application/permit basis and compared with City fees or actual revenues per application for same p ppapplications used in the capacity model (i.e. costing analysis)

A l N t P iti I tAnnual Net Position Impacts Aggregate fiscal impacts Aggregate fiscal impacts
Planning and building permit applications account for $1.3 million in costs annually (92% direct costs and 8% indirect costs)
Revenue estimates suggest the City is recovering $582 100 Revenue estimates suggest the City is recovering $582,100 annually in revenue or 46% cost recovery
Planning applications are recovering 15% of costs
B ildi it f i 67% f t Building permit fees are recovering 67% of costs
SUMMARY ANNUAL NET POSITION Total Planning Building
Direct Costs 1,164,609 475,870 688,739
Indirect Costs 107,190 50,384 56,805
Full Cost 1,271,799 526,255 745,544
Existing Fee Revenues 582,063 78,963 503,100
Net Position (689 736) (447 292) (242 444)Net Position (689,736) (447,292) (242,444)

Planning Application Fees –F ll C t R P itiFull Cost Recovery Position
Annual Costs (2011$) Annual Net % CostDirect Indirect Total Revenues Position Recovery
Site Plan 104,710 13,186 117,896 11,700 (106,196) 10%Minor Variance 146,094 14,749 160,843 19,305 (141,538) 12%Consent for Severance 45,312 4,702 50,014 9,100 (40,914) 18%OPA 14,085 1,322 15,407 4,000 (11,407) 26%S bdi i i 16 269 1 632 17 901 990 (16 911) 6%Subdivision 16,269 1,632 17,901 990 (16,911) 6%Subdivision Amendment for Prior Plan Approv 11,324 1,176 12,500 - (12,500) 0%Condo Standard 5,278 594 5,872 640 (5,232) 11%Condo Conversion 7,061 736 7,797 640 (7,157) 8%ZBA 73,463 6,778 80,241 12,000 (68,241) 15%Lifting of Hold Symbol 2,079 230 2,309 700 (1,609) 30%Lifting of Hold Symbol 2,079 230 2,309 700 (1,609) 30%Heritage Designation 45 4 49 - (49) 0%Zoning Compliance 13,009 1,357 14,366 1,100 (13,266) 8%ESA Phase I 2,211 210 2,421 938 (1,484) 39%Work Order Report 34,588 3,676 38,264 17,650 (20,614) 46%Encroachment Agreement 341 32 373 200 (173) 54%
TOTAL 475,870 50,384 526,255 78,963 (447,292) 15%
Total Allocation 90% 10% 100%

Full Cost Recovery Planning A li ti FApplication Fees
Average Average Full Cost FeeCost per Revenue per Adjustmentp p j
Application Application %
Site Plan 6,550 650 1008%Minor Variance 2,062 248 833%Consent for Severance 1,786 325 550%OPA 7,704 2,000 385%Subdivision 17,901 990 1808%Subdivision Amendment for Prior Plan Approv 12,500 n/c n/cCondo Standard 5,872 640 917%Condo Conversion 7,797 640 1218%ZBA 10,030 1,500 669%Lifting of Hold Symbol 2 309 700 330%Lifting of Hold Symbol 2,309 700 330%Heritage Designation 49 n/a n/aZoning Compliance 653 50 1306%ESA Phase I 161 63 258%Work Order Report 108 50 2 Encroachment Agreement 373 200 186%

Building Permit Fees – Full C t R P itiCost Recovery Position
Building Permit Category Annual Costs (2011$) Annual Net % CostDirect Indirect Total Revenues Position RecoveryDirect Indirect Total Revenues Position Recovery
Group A - AssemblyNew 20,961 1,680 22,641 49,612 26,971 219%Group A - AssemblyAddition/ Repair/Renovation 43,185 3,412 46,597 59,145 12,548 127%Group B - InstitutionalNew 1,661 133 1,794 1,794 - 100%Group B - InstitutionalAddition/ Repair/Renovation 12,894 1,018 13,912 25,387 11,475 182%Group C - Residential - SingleNew 64,858 5,292 70,150 51,698 (18,452) 74%Group C - Residential - SingleAddition/ Repair/Renovation 209,325 16,727 226,052 15,727 (210,325) 7%Group C - Residential - Doubles - (Duplex, Semi)New 37,054 3,036 40,091 20,898 (19,193) 52%Group C - Residential - Doubles - (Duplex, Semi)Addition/ Repair/Renovati 38,352 3,103 41,454 1,974 (39,480) 5%Group C - Residential - MultiplesNew 12,658 1,009 13,667 47,188 33,520 345%Group C - Residential - MultiplesAddition/ Repair/Renovation 39,664 3,140 42,803 6,667 (36,137) 16%Group C - Residential - Accessory Buildings 44,419 3,708 48,127 7,393 (40,734) 15%Group C Residential Accessory Buildings 44,419 3,708 48,127 7,393 (40,734) 15%Group D & E - Office/ Personal Service/ MercantileNew 8,521 683 9,204 28,249 19,045 307%Group D & E - Office/ Personal Service/ MercantileAddition/ Repair/Renova 54,081 4,311 58,393 28,192 (30,201) 48%Group F - IndustrialNew 3,549 283 3,832 94,696 90,864 2471%Group F - IndustrialAddition/ Repair/Renovation 11,868 946 12,814 19,290 6,475 151%Demolition Permits 12,366 1,154 13,520 2,900 (10,620) 21%Change of Use/Location/No Construction 3 310 283 3 593 1 500 (2 093) 42%Change of Use/Location/No Construction 3,310 283 3,593 1,500 (2,093) 42%Temporary Building 4,007 362 4,369 800 (3,569) 18%Fence Permit 42,604 4,685 47,289 7,550 (39,739) 16%Conditional Permits 23,402 1,839 25,241 32,443 7,201 129%
TOTAL 688,739 56,805 745,544 503,100 (242,445) 67%
Total Allocation 92% 8% 100%

Full Cost Recovery Building P it FPermit Fees
Average Average Full Cost FeeBuilding Permit Category Cost per Revenue per Adjustment
Permit Permit %
Group A - AssemblyNew 2,516 5,512 -54%Group A - AssemblyAddition/ Repair/Renovation 1,839 2,335 -21%Group B - InstitutionalNew 2,691 - n/aGroup B - InstitutionalAddition/ Repair/Renovation 2,087 3,808 -45%G C R id ti l Si l N 1 739 1 282 36%Group C - Residential - SingleNew 1,739 1,282 36%Group C - Residential - SingleAddition/ Repair/Renovation 1,092 76 1337%Group C - Residential - Doubles - (Duplex, Semi)New 1,909 995 92%Group C - Residential - Doubles - (Duplex, Semi)Addition/ Repair/Renovat 1,036 49 2000%Group C - Residential - MultiplesNew 2,733 9,438 -71%Group C - Residential - MultiplesAddition/ Repair/Renovation 1,476 230 542%Group C Residential MultiplesAddition/ Repair/Renovation 1,476 230 542%Group C - Residential - Accessory Buildings 512 79 551%Group D & E - Office/ Personal Service/ MercantileNew 2,301 7,062 -67%Group D & E - Office/ Personal Service/ MercantileAddition/ Repair/Renova 1,317 636 107%Group F - IndustrialNew 2,299 56,818 -96%Group F - IndustrialAddition/ Repair/Renovation 1,326 1,995 -34%Demolition Permits 466 100 366%Change of Use/Location/No Construction 479 200 140%Temporary Building 546 100 446%Fence Permit 313 50 526%Conditional Permits 1,803 2,317 -22%

Building Permit Fees – Full C t R P itiCost Recovery Position This increase does not provide additional funds to This increase does not provide additional funds to
achieve service sustainability by the creation of a building permit stabilization reserve fund
Considering historic building permit activity over the prior 15 years, a reserve fund target of approximately 1 7x annual direct costs (or $1 17approximately 1.7x annual direct costs (or $1.17 million) should be considered
Providing for accumulation over a 7-year period, Providing for accumulation over a 7 year period, would require an annual reserve fund contribution of $167,000 annually
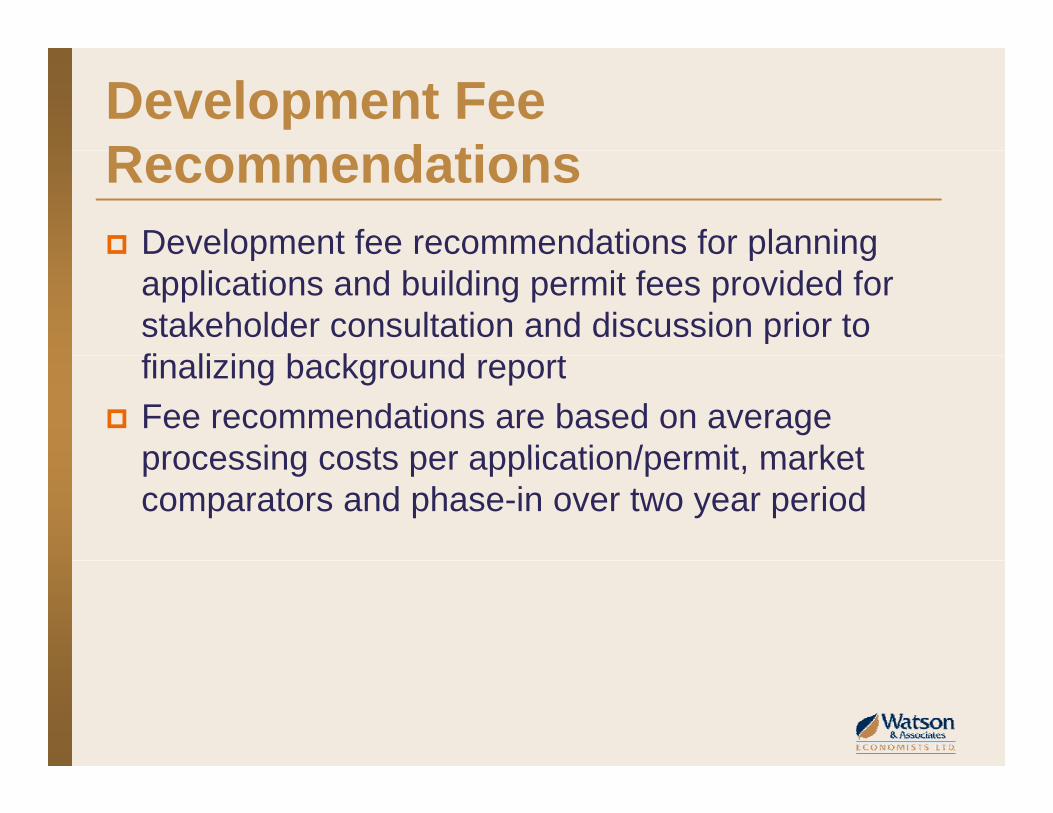
Development Fee R d tiRecommendations Development fee recommendations for planning Development fee recommendations for planning
applications and building permit fees provided for stakeholder consultation and discussion prior to fi li i b k d tfinalizing background report
Fee recommendations are based on average processing costs per application/permit marketprocessing costs per application/permit, market comparators and phase-in over two year period

Planning Application Fee R d tiRecommendations
Existing 2012 2013Application Type Fees per Revenue Fees per Revenue Fees per Revenue
Application Estimate Application Estimate Application Estimate
Site Plan 650 11,700 3,600 64,800 6,550 117,896 Minor Variance 248 19,305 970 75,660 1,700 132,600 Consent for Severance 325 9,100 1,010 28,280 1,700 47,600 OPA 2,000 4,000 4,850 9,700 7,700 15,400 S bdi i i 990 990 9 450 9 450 17 900 17 900Subdivision 990 990 9,450 9,450 17,900 17,900 Subdivision Amendment for Prior Plan Approval n/c - 6,250 6,250 12,500 12,500 Condo Standard 640 640 3,740 3,740 6,830 6,830 Condo Conversion 640 640 3,740 3,740 6,830 6,830 ZBA 1,500 12,000 5,750 46,000 10,000 80,000 Lifting of Hold Symbol 700 700 1,500 1,500 2,300 2,300Lifting of Hold Symbol 700 700 1,500 1,500 2,300 2,300 Heritage Designation n/a - 30 30 50 50 Zoning Compliance 50 1,100 350 7,700 650 14,300 ESA Phase I 63 938 110 1,650 160 2,400 Work Order Report 50 17,650 80 28,240 100 35,300 Encroachment Agreement 200 200 290 290 370 370
TOTAL 78,963 287,030 492,276
Cost Recovery % 15% 55% 94%
Building Permit Fee R d tiRecommendations
Existing 2012 2013Building Permit Category Fees per Revenue Fees per Fee Increase Revenue Fees per Fee Increase Revenue
Permit Estimate Permit % Estimate Permit % EstimatePermit Estimate Permit % Estimate Permit % Estimate
Group A - AssemblyNew 5,512 49,612 6,584 19% 59,256 7,656 16% 68,905 Group A - AssemblyAddition/ Repair/Renovation 2,335 59,145 2,789 19% 70,655 3,243 16% 82,145 Group B - InstitutionalNew 2,691 1,794 3,214 19% 2,143 3,737 16% 2,491 Group B - InstitutionalAddition/ Repair/Renovation 3,808 25,387 4,549 19% 30,327 5,289 16% 35,260 Group C - Residential - SingleNew 1,282 51,698 1,531 19% 61,750 1,780 16% 71,803 Group C - Residential - SingleAddition/ Repair/Renovati 76 15,727 138 82% 28,566 200 45% 41,400 p g p , , ,Group C - Residential - Doubles - (Duplex, Semi)New 995 20,898 1,189 19% 24,969 1,382 16% 29,024 Group C - Residential - Doubles - (Duplex, Semi)Additio 49 1,974 125 153% 5,000 200 60% 8,000 Group C - Residential - MultiplesNew 9,438 47,188 11,273 19% 56,365 13,108 16% 65,538 Group C - Residential - MultiplesAddition/ Repair/Renov 230 6,667 215 -6% 6,235 200 -7% 5,800 Group C - Residential - Accessory Buildings 79 7,393 139 77% 13,066 200 44% 18,800 Group D & E - Office/ Personal Service/ MercantileNew 7,062 28,249 8,435 19% 33,740 9,809 16% 39,234 Group D & E - Office/ Personal Service/ MercantileAddi 636 28,192 760 20% 33,693 883 16% 39,155 Group F - IndustrialNew 56,818 94,696 67,865 19% 113,108 78,913 16% 131,522 Group F - IndustrialAddition/ Repair/Renovation 1,995 19,290 2,383 19% 23,036 2,772 16% 26,791 Demolition Permits 100 2,900 150 50% 4,350 200 33% 5,800 Change of Use/Location/No Construction 200 1,500 250 25% 1,875 300 20% 2,250 Temporary Building 100 800 150 50% 1,200 200 33% 1,600 F P it 50 7 550 100 100% 15 100 150 50% 22 650Fence Permit 50 7,550 100 100% 15,100 150 50% 22,650 Conditional Permits 2,317 32,443 2,768 19% 38,752 3,219 16% 45,059
TOTAL 503,100 584,434 698,170
Cost Recovery % 67% 78% 94%
B d $10 75/$1 000 f l i 2012 d $12 50/$1 000 l i 2013Based on $10.75/$1,000 of value in 2012 and $12.50/$1,000 value in 2013

Municipal Development Fee Comparisonp p p(1,000 sq.mt. - Site Plan, Zoning Bylaw Amendment)
Development Fee Comparison1,000 m2 Retail Development
$35,000
$40,000
$45,000
, p
$20,000
$25,000
$30,000
$5,000
$10,000
$15,000
$‐
$5,000
Site Plan Zoning Building Permit Fees

Fee Comparison with Development Chargesp p g(1,000 sq.mt. - Site Plan, Zoning Bylaw Amendment)
Development Fee & DC Comparison1,000 m2 Retail Development
$250,000
$300,000
1,000 m Retail Development
$150,000
$200,000
$50,000
$100,000
$‐
Site Plan Zoning Building Permit Fees Development Charges
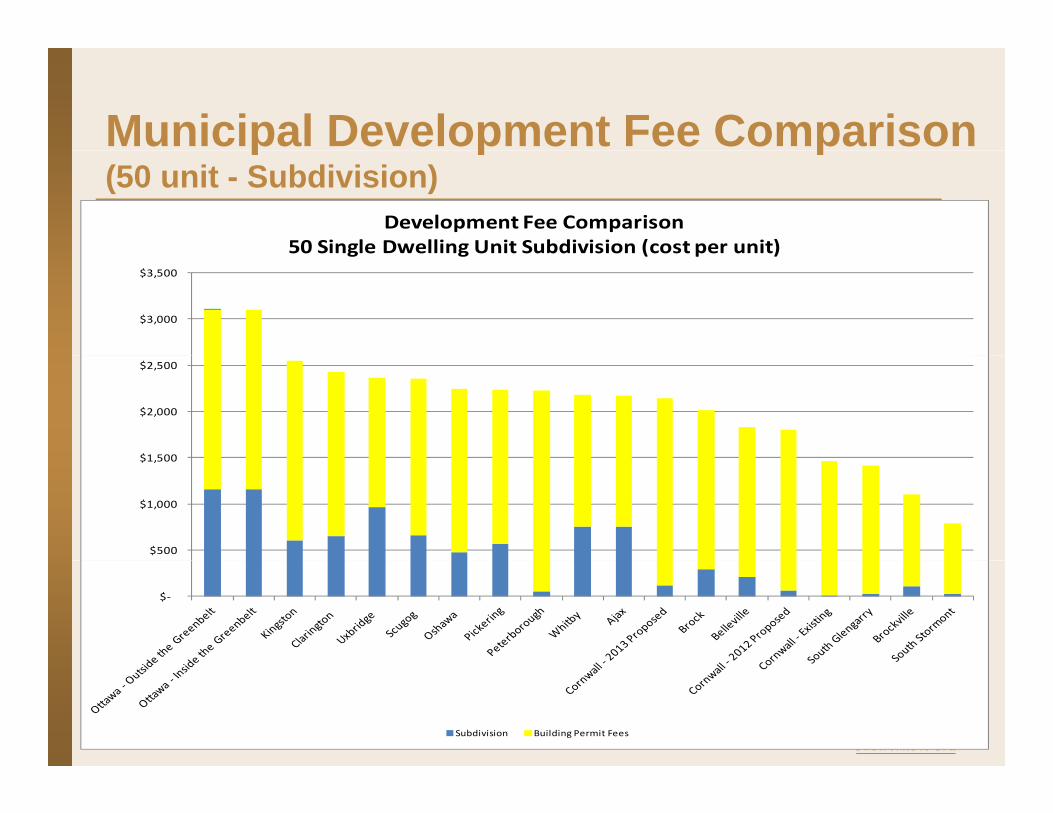
Municipal Development Fee Comparisonp p p(50 unit - Subdivision)
Development Fee Comparison50 Single Dwelling Unit Subdivision (cost per unit)
$3,000
$3,500
50 Single Dwelling Unit Subdivision (cost per unit)
$1 500
$2,000
$2,500
$500
$1,000
$1,500
$‐
Subdivision Building Permit Fees

Fee Comparison with Development Charges p p g(50 unit - Subdivision)
Development Fee & DC Comparison50 Single Dwelling Unit Subdivision (cost per unit)
$35,000
$40,000
$45,000
g g ( p )
$20,000
$25,000
$30,000
$5,000
$10,000
$15,000
$‐
Subdivision Building Permit Fees Development Charges

Municipal Development Fee Comparisonp p p(Minor Variance Application)
Development Fee ComparisonMinor Variance
$1,600
$1,800
$2,000
$800
$1,000
$1,200
$1,400
$200
$400
$600
$800
$‐
$
Minor Variance
N t StNext Steps Receive input from the Development Stakeholder Receive input from the Development Stakeholder
Group proposed fees
Prepare final report and fee recommendations to Council – April 10th
Statutory Public Meeting at PAC – May 22nd
Report to Council for adoption – June 11th
Implementation date – July 1st