Embed Size (px)
Citation preview

DEVELOPMENT, EVALUATION AND IMPLEMENTATION OF WHEELCHAIR SEAT CUSHION TESTING STANDARDS
by
Rohit P. Bafana
B.E., Maharashtra Institute of Technology, India, 2002
Submitted to the Graduate Faculty of
School of Engineering in partial fulfillment
of the requirements for the degree of
Masters of Science in Bioengineering
University of Pittsburgh
2005

UNIVERSITY OF PITTSBURGH
SCHOOL OF ENGINEERING
This thesis was presented
by
Rohit P. Bafana
It was defended on
April 6, 2005
and approved by
Rory A. Cooper, PhD, Distinguished Professor and FISA/PUA Chair, Rehabilitation Science and Technology
Professor, Bioengineering Department
Patricia Karg, MS, Research Instructor, Rehabilitation Science and Technology
David M. Brienza, PhD, Associate Professor, Rehabilitation Science and Technology Associate Professor, Department of Bioengineering
Associate Professor, McGowan Institue for Regenerative Medicine Thesis Advisor
ii

Copyright by Rohit P. Bafana 2005
iii

DEVELOPMENT, EVALUATION AND IMPLEMENTATION OF WHEELCHAIR SEAT CUSHION TESTING STANDARDS
Rohit P. Bafana, MS
University of Pittsburgh, 2005
The International Organization of Standardization (ISO) has developed test protocols that
quantify the physical and mechanical characteristics of wheelchair seat cushions that are
considered relevant to their influence on tissue integrity (ISO16840-2). The draft standard
contains a total of nine test methods, of which we have focused on four tests, namely recovery,
load-deflection and hysteresis, lateral and forward stiffness, loaded contour depth and overload
deflection.
The first goal of this study was development of the recovery test protocol. Recovery
characterizes the short-term (25sec) and long-term (20min) resilient tendencies of a cushion. The
test was repeated three times on three sets of eight cushions. The same sets of cushions were
tested by two other laboratories to verify protocol reproducibility. The test had high intra-lab
repeatability, but low inter-lab reproducibility. The reproducibility is affected mainly due to the
high sensitivity of the test. The results also suggested that the long-term recovery test be
converted to a pass or fail binary test.
The goal of the second part of the study was to implement these tests and to evaluate their
reliability by analyzing their repeatability and ability to differentiate between cushions. Each test
was run on a set of 21 commercially available cushions. Reliability and repeatability was
evaluated using the ICC (intra class correlation coefficient) and RC (repeatability coefficient).
The load-deflection and hysteresis characterizes the cushions’ hysteresis at 8N, 250N and 500N.
iv

The 250N value was the most reliable measure. The lateral and forward stiffness test measures
the peak and 60sec force required to displace the cushion indenter by 10mm. The test showed
high reliability. The loaded contour depth (LCD) and overload deflection test measures the
cushions’ depth of immersion in loaded (135N) and overloaded (180N) states. The LCD test was
also highly reliable. However, lack of variability for the overload test suggests that it be
converted into a binary test, to check if the cushion has bottomed out or not. The recovery test
displayed high intra-lab repeatability, but its reliability is questionable due to its poor ability to
distinguish between cushions. Overall, the test results suggest that the time interval between
replications should be increased to at least 30mins to reduce the potential of a systematic trend
between readings. The RC can be used as a precision statement for each test, thus giving us a
baseline for acceptable variations between its replications. In order to validate these tests
completely, we need to establish inter-lab reproducibility, conduct research to investigate the
clinical resolution for each test and clinically validate these test parameters.
v

TABLE OF CONTENTS 1.0 INTRODUCTION ..................................................................................................................1
1.1 OVERVIEW ...................................................................................................................... 1
1.2 ISO 16840-2....................................................................................................................... 4
1.3 OBJECTIVE ...................................................................................................................... 6
2.0 UNDERSTANDING CUSHION TECHNOLOGIES ............................................................7
2.1 TISSUE INTEGRITY........................................................................................................ 7
2.2 EXTRINSIC FACTORS THAT AFFECT TISSUE INTEGRITY ................................. 10
2.3 CUSHION CLASSIFICATION ...................................................................................... 15
2.4 LIST OF TEST CUSHIONS ........................................................................................... 20
3.0 DEVELOPMENT AND VALIDATION OF THE RECOVERY TEST .............................24
3.1 INTRODUCTION ........................................................................................................... 24
3.1.1 Rationale ................................................................................................................... 25
3.2 APPARATUS REQUIREMENTS .................................................................................. 27
3.2.1 Loading Rig .............................................................................................................. 27
3.2.2 Rigid Cushion Loading Indenter............................................................................... 27
3.2.3 Circular Foot Rig ...................................................................................................... 29
3.3 TEST CUSHION PRECONDITIONING AND SET UP................................................ 30
3.4 RECOVERY TEST PROTOCOL ................................................................................... 32
3.5 DEVELOPMENT AND VALIDATION PROCEDURE................................................ 35
3.6 DATA ANALYSIS.......................................................................................................... 38
3.7 RESULTS ........................................................................................................................ 39
3.8 DISCUSSION.................................................................................................................. 44
4.0 IMPLEMENTATION OF STANDARDIZED PROTOCOLS ............................................49
4.1 INTRODUCTION ........................................................................................................... 49
vi

4.2 LOAD-DEFLECTION AND HYSTERESIS TEST ....................................................... 50
4.2.1 Apparatus Requirements........................................................................................... 51
4.2.1.1 Loading Rig ....................................................................................................... 51
4.2.2 Load-Deflection and Hysteresis Test Protocol ......................................................... 51
4.2.3 Data Analysis ............................................................................................................ 54
4.2.4 Results....................................................................................................................... 55
4.2.5 Discussion................................................................................................................. 57
4.3 LATERAL AND FORWARD STIFFNESS ................................................................... 60
4.3.1 Apparatus Requirements........................................................................................... 61
4.3.1.1 Lateral and Forward Stiffness Rig ..................................................................... 61
4.3.2 Lateral and Forward Stiffness Test Protocol ............................................................ 63
4.3.3 Data Analysis ............................................................................................................ 64
4.3.4 Results....................................................................................................................... 65
4.3.5 Discussion................................................................................................................. 66
4.4 LOADED CONTOUR DEPTH AND OVERLOAD DEFLECTION............................. 68
4.4.1 Apparatus Requirements........................................................................................... 69
4.4.1.1 Contour Loading Jig (CLJ) ................................................................................ 69
4.4.1.2 Seat Cushion Thickness Measurement Rig........................................................ 70
4.4.2 Loaded Contour Depth and Overload Deflection Test Protocol............................... 72
4.4.3 Data Analysis ............................................................................................................ 74
4.4.4 Results....................................................................................................................... 75
4.4.5 Discussion................................................................................................................. 76
4.5 RECOVERY.................................................................................................................... 79
4.5.1 Data Analysis ............................................................................................................ 79
4.5.2 Results....................................................................................................................... 79
4.5.3 Discussion................................................................................................................. 81
5.0 CONCLUSION AND RECOMMENDATIONS .................................................................83
5.1 DEVELOPMENT AND VALIDATION OF THE RECOVERY TEST ........................ 83
5.2 IMPLEMENTATION OF STANDARDIZED PROTOCOLS ....................................... 85
vii

APPENDIX A: RIGID CUSHION LOADING INDENTER........................................................88
APPENDIX B: TEST SET-UP FOR RECOVERY.......................................................................90
APPENDIX C: TEST SET-UP FOR LOAD-DEFLECTION AND HYSTERESIS TEST..........97
APPENDIX D: TEST SET-UP FOR LATERAL AND FORWARD STIFFNESS......................98
APPENDIX E: TEST SET-UP FOR LOADED CONTOUR DEPTH AND OVERLOAD
DEFLECTION..................................................................................................101
BIBLIOGRAPHY........................................................................................................................103
viii

LIST OF TABLES TABLE 1: List Of Cushions ...................................................................................................... 21
TABLE 2: 3-Way ANOVA Results For Set*Test*Replication Interaction .............................. 39
TABLE 3: 3-Way ANOVA Results For Cushion*Test*Replication Interaction...................... 39
TABLE 4: Set A, Lab A readings for Recovery........................................................................ 40
TABLE 5: ICC results for Interlab Reproducibility .................................................................. 43
TABLE 6: Interlab Comparison................................................................................................. 43
TABLE 7: 25sec Thickness Comparison for Set B, Lab A, B .................................................. 47
TABLE 8: ICC and RC values for Load Deflection and Hysteresis ......................................... 55
TABLE 9: ICC and RC values for Forward Stiffness ............................................................... 65
TABLE 10: ICC and RC values for LD and OD (rounded data)................................................. 75
TABLE 11: ICC and RC values for LD and OD (unrounded data)............................................. 77
TABLE 12: ICC and RC values for Recovery............................................................................. 79
TABLE A1: Cones and Spheres dimensions for constructing the RCLI ..................................... 88
TABLE E1: Parts List for CLJ.................................................................................................... 101
ix

LIST OF FIGURES
FIGURE 1: 2-D drawing of the modified Staarink indenter (RCLI) ........................................ 28
FIGURE 2: Thickness Vs Cushion for set A, B, C tested in lab A ........................................... 40
FIGURE 3: 25sec Recovery Vs Cushion for set A, B, C tested in lab A .................................. 41
FIGURE 4: 20min Recovery Vs Cushion for set A, B, C tested in lab A ................................. 42
FIGURE 5: Avg. Thickness Vs Cushion for diff. reps (Lab A, Set A, B, C)............................ 45
FIGURE 6: Variation of the 8N HI within and between cushions ............................................ 55
FIGURE 7: Variation of the 250N HI within and between cushions ........................................ 56
FIGURE 8: Variation of the 500N HI within and between cushions ........................................ 57
FIGURE 9: Comparison of the 8N, 250N, 500N HI averages .................................................. 59
FIGURE 10: Apparatus to measure Lateral and Forward Stiffness ............................................ 62
FIGURE 11: Comparison of the avg. peak and 60sec force averages......................................... 66
FIGURE 12: Details of the Contour Loading Jig ........................................................................ 71
FIGURE 13: Measurement method for concave and convex seat cushion ................................. 73
FIGURE 14: Thickness, LD and OD medians for each cushion (rounded data)......................... 76
FIGURE 15: Comparison between Load-def loaded depth at 500N and LD .............................. 78
FIGURE 16: 25sec and 20min recovery averages for each cushion ........................................... 80
FIGURE 17: Recovery Thickness replications............................................................................ 81
FIGURE A1: Assembly of components for RCLI ....................................................................... 89
FIGURE A2: RCLI ....................................................................................................................... 89
FIGURE B1: MTS Base Plate (in inches) .................................................................................... 91
FIGURE B2: MTS-RCLI Adapter (in inches).............................................................................. 93
FIGURE B3: Circular Loading Rig Assembly ............................................................................. 94
FIGURE B4: Circular Loading Rig (Automated Set-up) ............................................................. 95
FIGURE B5: Manual Set Up for Recovery .................................................................................. 96
x

FIGURE C1: Set Up for Load-Deflection .................................................................................... 97
FIGURE D1: Set Up for Lateral and Forward Stiffness............................................................... 99
FIGURE D2: (i) Cylinder assembly (ii) Displacement & Force Gauge assembly (iii) Linear
Bearing assembly ................................................................................................ 100
FIGURE E1: CLJ with Force and Displacement Gauge ............................................................ 102
xi

1.0 INTRODUCTION
1.1 OVERVIEW
The wheelchair seating system may be composed of a back support, upper and lower extremity
supports, lateral pelvic and/or trunk supports, headrest and a cushion.[18] Its purpose is to
provide comfort, postural support, biomechanical alignment, skin protection, spasticity
reduction, and maximal function.[18] The cushion is the seat support surface’s most crucial
component directly affecting the user’s health, function, quality of life, employment, community
participation, and social integration.[21] Cushions typically have three seating goals: to provide
comfort, to enhance/correct postural alignment, and to prevent skin breakdown & tissue damage.
Hundreds of cushions are commercially available in the market today, which makes the process
of cushion selection a daunting task. Cushions differ in shape (contour), sizes and materials,
thereby giving them different properties. The properties of a cushion determine how well the
cushion will conform to the needs of the patient. No single cushion can provide an optimal
solution for all types of patient, i.e. no single cushion can be used as a “universal cushion”. Each
cushion will have a set of attributes, depending on which the therapist will have to make a
choice. A trade-off may necessarily exist between advantages of one specific attribute of a
particular cushion over a more important attribute of another cushion. Trade-offs between
advantages and disadvantages like weight, comfort, maintenance required, cover materials
available, temperature and pressure sensitivity, durability, etc exist in the case of every
patient.[18] It is imperative to match the specific properties of the cushion with the unique needs
of the patient. “Proper cushion selection is a dynamic process that requires in-depth assessment
1

and individualized treatment.”[12] Therapists have to first identify the patient’s physical,
medical, psycho-social & environmental needs and then match it with the specific properties of
the cushion, making the range of cushion choices more manageable.[19] For this purpose they
need access to information that would quantify the properties of the cushions and have
standardized interpretations without which it is almost impossible to state which cushion is
superior for which purpose. Choosing the right cushion is a factor of understanding the user’s
needs and the technology specific properties of the cushion. Diagnosis that help in defining the
user needs are: comfort, sensation, skin integrity & history of skin breakdown, positioning needs,
functional & activity level, type of wheelchair used, client preferences, continence, cognition,
environment-of-use, etc.[18,34] These individual needs of the patient provide the guidelines for
choosing the optimal wheelchair cushions.[18,34]
In order to choose the right cushion, based on these guidelines, therapists need to be able to
compare the performance characteristics of cushions and understand their clinical
implications.[52] However, lack of standardized measurement tools for quantifying cushion
performance characteristics makes objective comparison and evaluation of wheelchair seat
cushions difficult. A vast pool of information is available through numerous studies and
experience, but correlation of these studies is complex due to the variability’s that exist owing to
lack of standardization.[42,50] Thus, the development of international standards for wheelchair
seating will help us adopt a scientific approach towards cushion selection and procurement.
Further, this will help in creating a common knowledge base which helps in faster technological
advancements in cushion technologies and in various other studies, like pressure ulcer
development, that are related to wheelchair seating.
Cochran and Slater made seminal contributions towards the realization of cushion standards.[56]
Their study on cushion testing was used by Cochran and Palmeri to develop test methods to test
and evaluate seat cushions.[57] In another study, Krouskop and Rijswik developed a set of
performance-based criteria, identifying it as a first step towards standardization.[52]
Unlike wheelchairs, standards do not exist for wheelchair seat cushions. Cushion manufacturers
do not need approval from the US Food and Drug Administration (FDA) and hence have little
2

incentive to fund cushion evaluations or develop criterion for cushion selection.[29,50] In an
effort to overcome these short-comings, the International Organization for Standardization (ISO)
is currently developing ISO 16840 – Wheelchair Seating. In the United States, the American
National Standards Institute (ANSI) and the Rehabilitation Engineering and Assistive
Technology Society of North America (RESNA) support this activity.
The standards development will benefit varied segments of the population. The assistive
technology (AT) service delivery model involves mainly five parties: the consumer, the
clinician/therapist, the vendor, the manufacturer, and the funding source that pays for the
technology; but the ultimate impact is on the user alone.[20] Consumers and clinicians would
have pertinent clinical product information to assist in selecting the appropriate cushion. The
vendors and manufacturers gain superior understanding of the product’s performance, which can
then be used to enhance the efficiency of their products. The data can also be used to enhance the
validity of products recommended to third-party funding agencies. Finally, the user is provided
with reliable products that ensure enhanced functions, quality of life and overall well-being.
The subsequent sections contain details of the ISO 16840-2 and the objective of this paper.
3

1.2 ISO 16840-2
ISO is a non-governmental organization having a member body of about 146 countries.[28] Its
main goal is to develop international standards that “provide a reference framework, or a
common technological language, between suppliers and their customers - which facilitates trade
and the transfer of technology.”[28] Technical committees are formed within the organization
that are primarily responsible to prepare these International Standards. Draft standards are
developed, that must go through several voting and revision stages before a Final Draft
International Standard (FDIS) is developed. For a final standard to be published, at least 75%
approval from member bodies is required.
ISO 16840 consists of the following parts, under the general title “Wheelchair seating”:
• Part 1: Definitions of body and seat measures
• Part 2: Test methods for determining the physical and mechanical characteristics of
devices intended to manage tissue integrity – Seat Cushions
• Part 3: Postural Support Devices – Test methods for static, impact, and repeated load
strength
• Part 4: Seating Devices for use in motor vehicles.
The scope of this study is limited to Part 2 of the ISO 16840. The ISO16840-2 contains test
methods that quantify the physical and mechanical characteristics of wheelchair seat cushions
that are considered relevant to their influence on tissue integrity. However, it does not include
methods for quantifying their pressure distributing characteristics. On October 1998, the ISO
TC173/SC1 first approved wheelchair-seating standards as a work item and formed a new
working group, WG11 for its development. Technical committee, TC173, has been assigned for
standardization in the field of assistive products for persons with disability; subcommittee, SC1,
for wheelchairs; and working group, WG11, for wheelchair seating.[28] The first Committee
Draft (CD) was completed and put out for voting on July 21, 2001. Although the draft was
further developed based on responses and comments from the groups involved in this process,
several of the test methods had not been fully implemented or validated. The validation and
4

further development work was undertaken by six laboratories, namely: Beneficial Designs (BD),
E.C. Service, Inc. (EC), Georgia Institute of Technology (Georgia Tech), Institut de Biomecanica
de Valencia (IBV), University College London (UCL), and University of Pittsburgh (Pitt). The
latest version of ISO 16840-2 is a DIS (Draft International Standard) that is currently being
revised by the working group based upon voting comments received after the December 2004
closing date. The validation work is being coordinated and funded by the RERC on Wheeled
Mobility at the University of Pittsburgh (NIDRR grant #H133E990001).
The standard encompasses a total of nine test methods, namely: Load-deflection and Hysteresis,
Lateral and Forward Stiffness, Sliding Resistance, Impact Damping, Recovery, Loaded Contour
Depth and Overload Deflection, Frictional Properties, Water Spillage and Requirement for
Biocompatibility. It specifies the apparatus, test procedures, and disclosure requirements for
wheelchair seat cushions intended to maintain tissue integrity.
The validation work involves the first six test methods, as the last three are parts of existing
standards. The document can also be applied to other support surface devices or cushions used
independent of wheelchairs that are intended for tissue integrity management.
It is noteworthy that these performance characteristics measured by the standards cannot yet be
directly matched with the user needs because their clinical relevance has not been established.
But knowledge obtained through this work would help in establishing “multifactorial models to
address the effects of forces on soft tissue and how these forces are mediated by mechanical,
physiological and biochemical responses.”[21] This thesis is a step towards establishing clinical
efficacy.
5

1.3 OBJECTIVE
The first goal of this thesis project was to develop the recovery test protocol included in the ISO
16840-2. This involved finalizing/optimizing the draft protocol, fabricating test fixtures and
evaluating the intra-lab repeatability. The inter-lab reproducibility was validated with the help of
two other laboratories involved in the development process.
The second goal was to implement the following four test protocols included in the standard: -
• Load-deflection and Hysteresis
• Lateral and Forward Stiffness
• Recovery
• Loaded Contour Depth and Overload Deflection
Each of the four tests were run on a set of 21 commercially available cushions having varied
cushion technologies. The results aid in establishing the protocols’ applicability to a variety of
cushion technologies and in identifying technology specific limitations of the protocols. The
reliability of these protocols were evaluated by analyzing their ability to differentiate between
cushions.
6

2.0 UNDERSTANDING CUSHION TECHNOLOGIES
This chapter lists the different types of cushion materials/technologies that are used to promote
tissue integrity. It introduces the concept of tissue integrity and discusses the factors that affect it.
This will help in understanding how different materials and their combinations can be used to
achieve optimum force management. Finally, the different types of cushions that are tested, are
listed along with descriptions of the technologies they use.
2.1 TISSUE INTEGRITY
Tissue integrity is of paramount importance for a wheelchair user. Sliding on the support surface,
stretching of blood vessels, skin maceration, ischemia, etc can compromise tissue integrity. Of
all the types of tissue wounds/tissue injuries, pressure ulcers are most significant. They are
alternatively called as decubitus ulcer, pressure sores, dermal ulcers or bedsores.[43] NPUAP
(National Pressure Ulcer Advisory Panel) defines pressure ulcers as localized areas of tissue
necrosis that develop when soft tissue is compressed between a bony prominence and an external
surface for a prolonged period of time.[43] Though prolonged and unrelieved pressure have been
identified as the primary and direct cause of pressure ulcers [46,47], it is not possible to assess
the risks of this complex injury by a single variable.[47,50] Majority of the studies investigating
the causes of pressure ulcers have focused on pressure alone, but there are factors other than
mechanics that affect pressure ulcers.[50] Factors like nutrition, shear, moisture, heat, and age
reduce the tissue tolerance towards pressure, making the skin more susceptible to ulcers. We
7

classify these interrelated factors as intrinsic and extrinsic. Extrinsic factors can be defined as
those that influence tissue integrity on the skin surface by interactions between the skin and the
support surface, while intrinsic factors are defined as those that influence tissue integrity on the
underlying skin/tissue support structures.[36]
Load transfer in a seated posture is generally through the ischial tuberosities (IT’s), coccyx,
trochanters and the posterior thigh.[45,26] Major portion of these loads will be encountered at
the IT’s since they lie inferior to all other regions. Hence most studies on pressure ulcers are
generally done at or around the IT’s. Cushions support the human body through mechanical
equilibrium between the weight of the body and the reactive forces of the support surfaces. The
total force on the buttocks is equal to the weight of the body minus the reactive forces from the
backrest and footrest.[34] The relative amounts of this force, however, depends mainly on both
the cushion properties and the amount of deformation required until an equilibrium is
reached.[35]
Due to the load on the buttocks, the blood vessels below the skin deform thereby depriving the
tissues of nutrients. If this continues for a prolonged period, the underlying tissue dies and a
pressure ulcer is formed.[44] Studies have shown that blood flow occlusion occurs more readily
in paraplegics and seated geriatric patients than the normal.[48,49] Blood flow occlusion can
also occur due to stretching and twisting of blood vessels during sliding. But tissue necrosis can
be caused due to factors other than impaired blood flow. Krouskop et al. hypothesized that
occlusion of lymphatic system could also cause tissue necrosis.[65] The lymphatic system
transports excess fluid away from the interstitial spaces between tissues. Occlusion of the
lymphatic system causes accumulation of waste products in the interstitial spaces, leading to
necrosis. In another analysis, Reddy and Cochran also suggested the role of inhibited flow of the
interstitial fluid in pressure ulcer formation.[66]
Any person confined to a bed or wheelchair due to illness or injury can develop pressure ulcers.
Healthcare expenditures estimated in billions of dollars are annually incurred for the treatment of
pressure ulcers alone.[38,39] In a study conducted by Garber et al on veterans with spinal cord
injury, the average number of hospitalization days for pressure ulcer treatment was reported to be
8
150 and the average treatment cost was $150,000 per hospitalized patient.[32] Lyder suggested
care deficiency on part of US hospitals and physicians for pressure ulcer prediction and
prevention.[37]. There are thousands of lawsuits related to pressure ulcers. Besides the financial
aspect, the additional suffering that the patient, family and the caregiver go through, compounds
their frustrations and misery. Thus the prevention of pressure ulcers and improvement in its
treatment is of utmost importance. Choosing an apt support surface for the user can significantly
reduce operating costs and minimize exposure to litigation, negative surveys, and reputation.[27]
There are many components of having a successful pressure ulcer prevention/treatment program.
The approach of force management is one of them and also the focus of our study.
9

2.2 EXTRINSIC FACTORS THAT AFFECT TISSUE INTEGRITY
Cushions are intended to protect the skin from damage. They are made up of many different
materials or combinations of these materials. These have negative and positive performance
characteristics which directly affect/influence tissue integrity. Tissue integrity management can
be defined as maintenance or promotion of tissue viability.[11] It can be maintained not only by
reducing pressures near bony prominences, but also by accounting for well-acknowledged
extrinsic factors like heat, moisture, shear and friction that have been identified as contributing
agents.
Pressure: -
Pressure has been identified as the principal factor responsible for pressure ulcer formation. It is
defined as the force (normal load) per unit area (contact area on the support surface). Higher
interface pressures have been associated with higher incidence of pressure ulcer risk [53] and
hence for long have been one of the primary considerations in cushion selection. When the
maximum blood capillary pressure is exceeded, blood cannot carry nutrients to the cell and waste
products cannot be transported away from the cell.[13,45] Wheelchair users have shown to have
interface pressures in the range of 50-150mm of Hg.[47] Hence it is imperative that the foremost
goal of a wheelchair support surface should be to reduce these interface pressures.
Nevertheless, the total force acting on the support surface cannot be reduced. But through proper
pressure distribution across the seating surface, the magnitude of the interface pressure can be
reduced. Optimal pressure distribution is very important for seating comfort and prevention of
pressure ulcers as it minimizes the pressure gradients across the surface. Pressure distribution
depends on: the relative fit between the body and cushion, the mechanical properties of the
cushion and the body weight distribution over the cushion.
But the ill effects of pressure depend not only on its intensity but also on its duration. The
pressure-time relationship is a significant determinant in the formation of pressure ulcers. Studies
have shown that intermittent interface pressures of higher magnitudes are less harmful than
10

lower interface pressures applied for longer durations; an inverse relationship was established
between the interface pressure and time.[58] Hence, efforts should be put in to get continual
pressure redistribution. Pressure can only be relieved in one area by transferring it to another, i.e.
to relieve pressure under the left buttock, the person may lean briefly to the right, creating a high
pressure area momentarily under the right side.[14] This is termed as pressure redistribution and
if done periodically, it can also act as a pump and aid in the nutrient/waste product
circulation.[45]
Besides measuring the interface pressures, sometimes, pressure is also quantified in terms of
“Peak pressure measurement”. It is the highest average pressure over a small area of interface.
Generally, for wheelchair seat cushions this interface is approximated to be around one inch
square area about the IT’s.[1] Knowledge of the peak pressure areas helps in identifying areas
where the positioning of the bony prominences should be avoided. Good pressure distribution
will not only reduce such areas on the support surface but also reduce its magnitude. Also, high-
pressure gradients, across the cushion surface, should be avoided. Pressure gradient is defined as
the differential pressure across a given surface. Mathematically, it is the slope of pressure plotted
across the surface. A high gradient leads to flow of the tissue’s fluid elements from high-pressure
areas to lower pressure areas, thus increasing the risk of tissue breakdown.
Shear and Friction: -
The total mechanical load acting on the cushion/tissues is the resultant of two forces, normal
(pressure) and tangential (shear/friction). Though pressure is considered the primary cause of
blood occlusion, the role of shear/friction cannot be underestimated. Goosens et al. showed that
lower pressure was required, in presence of shear, to reduce the skin oxygen supply to a level
that could cause ischemia.[54] Bennett et al found the combination of pressure and shear to
promote blood flow occlusion.[55] In separate studies, Bennett et al. showed that higher shear is
encountered, around the IT regions, in paraplegics and seated geriatric patients as compared to
young healthy individuals.[48,49]
11

Friction is seen in both static and dynamic conditions and is quantified in terms of frictional
force. Static friction causes occlusion of blood flow, thus promoting tissue necrosis, while
dynamic friction causes skin abrasions/blisters.[24] Even though friction can have some
damaging effects on the skin, some friction is desired to prevent the patient from slipping off the
support surface. Preferably this should be made available in areas less susceptible to pressure
ulcers. Another term related to friction is the coefficient of friction (COF). It is a common
misconception that the COF determines the magnitude of the frictional force. It only determines
the upper limit of the lateral force that can be sustained after which the bottom will start to
slide.[24] However, support surfaces with higher COF have potential for higher shear.[1]
Shear is generally quantified in terms of shear strain and shear stress. Tangential deformation of
the cushion gives rise to shear stress in the skin and the underlying tissue, while shear strain can
be thought of as movement of soft tissues, from a neutral position, with respect to the bony
landmarks.[24] Shear is thought to result in twisted, stretched and/or distorted blood vessels
which may occlude the blood flow or increase the susceptibility of blood occlusion through
pressure thus leading to tissue ischemia and necrosis.
There is lot of confusion surrounding the differentiation of friction and shear in their role as
causative factors for pressure ulcers. Static frictional force can be thought of as a component of
shear stress in the sense that it is one of the tangential forces causing the stress but not the only
tangential force. For example, when a person is seated on a contoured frictionless surface, even
though the frictional forces would be zero, there can still be reactive tangential loads due to the
surface contour that may prevent the buttock from slipping. Hence we can have shear stress in
absence of friction, but the reverse is not true. You cannot have friction and not have shear.
Heat: -
Increase in tissue temperature increases cellular metabolism. This increases the tissues need for
oxygen. Tissues have restricted blood circulation when the body is in the seated posture. Hence
this increase in metabolic rate can considerably increase the rate of tissue damage. There are two
main mechanisms that elevate the body heat/temperatures. The first one is due to the cushion-
12

skin interaction. This mainly depends on the heat transfer properties of the cushion. Studies have
shown increase in skin temperatures by about 2-4°C within an hour while seated on certain
wheelchair cushions.[59,60] Since increase of one degree Celsius in skin temperature increases
the metabolic rate by 10%,[6] a 2-4°C increase would increase the metabolic rate by 20-40%,
thereby drastically increasing the rate of tissue damage. The second mechanism is that of
reactive hyperemia, a phenomenon which is the body’s natural response to a slight amount of
tissue damage.[45,62] Studies by Mohanty et al. showed higher values of temperature rise
associated with application of pressure of higher magnitude and duration.[62] An additional
effect of increase in temperature is that it leads to increased perspiration, the detrimental effects
of which are discussed below.
Temperature characteristics like heat flux, heat transfer rate and specific heat are used to predict
the ability of the support surfaces to control temperatures.[1] Heat flux is the amount of heat
flow via convection, conduction or radiation; heat transfer rate is the rate at which the heat flows
through a given distance; and specific heat is the amount of heat in calories required to raise the
temperature of one gram of a material by one degree Celsius.
Moisture: -
Moisture accumulation at the seat-buttock interface occurs due to perspiration, urine
incontinence or secretion from wounds.[13] Its effect on the skin depends on the nature of the
moisture itself.[45] Studies have shown increase in relative humidity of the skin-cushion
interface between 10-20% within an hour.[59] This is mainly due to sweating and is aggravated
due to lack of or insufficient airflow at the interface. Air with low humidity will increase
evaporation thus reducing moisture and temperature at the interface.[63] Moisture makes the
skin softer and deteriorates the skin condition. Maceration, which is the softening of the stratum
corneum, is the most common skin injury due to moisture. Studies by Wildnauer et al. on
extracted human stratum corneum have shown to reduce their tensile strength by almost 80%
with increase in the RH levels from 0-100%.[64] Moisture accumulation due to
incontinence/wound secretion can cause skin rashes and infections due to skin contact with
bodily fluids. Moist skin increases the coefficient of friction that in turn increases the chances of
13

tissue damage due to friction and shear. Hence a cushion should minimize damp areas near the
skin.
14

2.3 CUSHION CLASSIFICATION
Support surface technologies can be classified in numerous ways. For my research, I have
adopted the Brienza and Geyer system of classification.[1] The classification of the support
surfaces is based on their mechanical characteristics or unique therapeutic function. In practice
most surfaces are made up of combinations of these materials and technologies. The surfaces
have been classified as elastic, viscoelastic, fluid filled, and alternating pressure support surfaces.
Although support surfaces have a broader implication, we restrict our scope to wheelchair seat
cushions.
1. Elastic Foam: - Elastic materials deform proportional to their applied load. This elastic
response is not time dependent. Foam support surfaces are very light and can be divided into
two categories – open cell and closed cell.[1] Unlike open cell foams, closed cell foams do
not allow for passage of air/fluid amongst them. This makes the closed cell foams denser and
harder than open cell foams. Foams are said to have “memory” due to their ability to return
to their original shape and size. However, excessive resilience will cause poor pressure relief.
Ideally, their elastic response characteristics should be such that they can fully support the
load (avoid bottoming out) without providing a high reactive force (memory) which would
result in low interface pressures.[1] Due to the cell like structure of the foam, they entrap air
in their cellular matrix.[1] This causes an increase in the skin temperature since air is a poor
conductor of heat. Also, the sponge-like tendency of the open cell foams make them more
susceptible to damage due to light and moisture than closed cell foams. High shear and
frictional forces are encountered in foams but they have good stability and dampening
properties.[22]
The mechanical properties of the foams mainly depend on its stiffness and density. Softer
foams will envelop better but would be in danger of “bottoming out” and hence would have
to be thicker. Foams used in wheelchair cushions have medium stiffness in the range of 40 to
60 IFD.[15] Precontouring of foam or combination of foams with varying densities can give
better pressure distributions. Precontouring stiffer foams would increase its immersion and
15

envelopment properties. To improve their properties, foam products are generally made up of
foam layers of varying densities or used in combination with other materials like gel, air
cells, fluid-filled bladders, etc. These hybrid cushions, however, do not have “memory” since
only the foam portion of the support surface will recover to its original size and shape.[1]
One of the main disadvantages of the foams is its life span. They tend to loose their
mechanical properties within a year.[10] As the foam ages, it degrades and looses stiffness,
which in turn increases interface pressures. Low-density foams will age faster than higher
density foams.[22] They are however very light weight and virtually maintenance free.
A relatively new type of material called honeycomb also exhibits elastic properties. It can be
thought of as elastic foam with better airflow characteristics. They are extremely light and
“are made of a meshwork of polymer ribbons connected in a hexagonal pattern.”[16] It looks
like a beehive and hence the name. This cell structure allows the body to immerse generously
into the cushion and envelops the body in contact, giving it a more uniform pressure
distribution.[25] It is this beehive structure that gives the cushions a unique ventilation
system, thus giving them excellent temperature and moisture control characteristics.[12] Due
to the property of the cells to flex under load, it enhances the cushions impact dampening
properties, offers low friction and shear, and gives superior pressure relief around the bony
prominences. Another advantage of these cushions is that they can be machine-washed and
hence can be cleaned very easily.
2. Viscoelastic Foam: - Elastic foams that have time dependent properties are called
viscoelastic foams. In addition to the elastic response, these foams are characterized by a
viscous response, which is responsible for the load distribution. They behave like self-
contouring surfaces since their elastic response to loads diminishes over time.[1] These are
generally open cell foams.[1] Viscoelasticity can be characterized by performance based
time-dependent behaviors like stress relaxation, creep, and hysteresis.[20] Creep can be
defined as change in shape of a material under constant force while stress relaxation is the
change in stress under constant strain. Hysteresis on the other hand is the amount of energy
absorbed, during a cycle of loading or unloading. These are also temperature dependent
16

properties. Viscoelastic foams generally become softer at operating temperatures near body
temperature, due to which the top layer of the seating surface gives improved pressure
distribution.[1] One disadvantage of the temperature and time-sensitive response is that the
desirable effects may not be realized when the ambient temperature is too low.[1]
These cushions, being open cell foams, possess good moisture dissipation properties.
However the type of cover used influences these properties. Viscoelastic foams encounter
high shear and frictional forces. When the rate of load application is high, their initial
response will be that of resistance followed by slow immersion, thus giving these cushions
good envelopment and bad impact dampening properties.[22]
Solid gel products respond similarly to viscoelastic foam products and are included in this
category. Gel products are good conductors of heat but have bad moisture dissipating
properties.[59] Gel being a high-density material, make their cushions heavier than most.
Gels conform to the body shape to give good pressure distribution.[14] However, due their
incompressible nature, gel cushions often use a contoured foam base, thereby increasing its
stability.[14,15]
3. Fluid-filled: - Fluid-filled products may consist of single or multiple chambers filled with
air, water, or other viscous fluid materials such as silicon, silicon elastomer, or polyvinyl.[1]
Being incompressible fluids, they have a tendency to deflect under relatively low loads, thus
giving excellent pressure distribution through high envelopment and immersion. These
cushion generally require periodic set-ups/adjustments and are high on maintenance. Air
cushions must have the right amount of inflation while the viscous fluids often need to be
nudged back to areas under the bony prominences. Failure to do so may result in “bottoming
out” of the cushion. The impact dampening properties of the cushion depends mainly on the
viscosity of the fluid in use; air cushions have better dampening properties than viscoelastic
foam.[22] However, the properties of the fluid-filled cushions are greatly influenced by the
type of cushion cover used. Their thermal characteristics depend on the specific heat of the
cushion fluid.[1] The higher the specific heat and heat flux of the fluid, the better the heat
17

dissipation properties. Air is a poor conductor of heat, but water and gel have the tendency to
decrease skin temperature at the cushion-buttock interface.[59] Their moisture control
characteristics also depend mainly on the type of cover used, but water and gel cushions have
shown to increase the relative humidity levels due to perspiration.[59] Air cushions are
generally light but viscous fluid cushions are quite heavy.
4. Alternating Pressure: - The notion of alternating pressure seat surfaces germinated from the
concept of pressure redistribution. They work on the principal of “distributing the pressure by
shifting the body weight to different areas on the cushion rather than the general principal of
pressure distribution through envelopment or immersion.”[1] These cushions have air/fluid
pumped into its chambers or cylinders in a periodic pattern. The periodic nature of the
cushion inflation and deflation facilitates pressure redistribution at fixed intervals by
continuously changing the pressure over a given area. This may result in higher-pressure
at/around those areas. But studies show pressure and time have an inverse relationship; high
intermittent pressures are better than lower pressures applied for longer durations.[58]
Pressure redistribution is achieved when the user moves his pelvis; he does so either because
he feels some discomfort or because a clinician has instructed him to do so. But it is very
demanding for the user to do this periodically. In case of alternating pressure cushions, they
do all the work for you. Hence the user need not worry about pressure redistribution.
However, Brienza points towards the lack of sufficient study on tissue responses to
alternating pressure devices. These cushions are not commonly used as there are many
unanswered questions regarding their support surface characteristics and characteristics of its
alternating cycle.[1]
Alternating cushions depend on either an external power source or battery power to provide
the alternating pressure. Their temperature and moisture control characteristics are essentially
similar to that of fluid-filled cushions.
18

It is not possible to talk about cushions and not talk about cushion covers. As seen from the
discussion above, the type of cushion cover used significantly influences the cushion properties.
Cushion covers are used to protect cushions from wear and contamination, but they can seriously
compromise its properties. The presence of a cover has shown to increase the force required to
produce a given deflection on segmented foams.[66] If the cover is tight and non-stretch, the
cushions ability to envelop is significantly hampered. This increases the surface tension, which
may lead to increase in shear and friction. This is called the “hammocking effect”.[66] However,
covers can also be used to improve cushion properties. They should be designed such that they
minimize surface effects and maintain/enhance the cushion function, protect the cushion against
light, abrasion and moisture, and finally increase the cushion stability.
19

2.4 LIST OF TEST CUSHIONS
We selected commercial cushions having varied technologies in terms of material, construction
and overall performance. All cushions are 16”×16”. The HR45 foam, which is high resilience
foam with stiffness 45 ILD, and the action pilot flotation pad, which is a 25mm thick viscoelastic
gel cushion, are considered reference materials. Following is the list of cushions along with their
construct and CMS codes. The Center for Medicare and Medicaid Services (CMS) is a Federal
agency within the U.S. Department of Health and Human Services. It has recently established
new K-codes/E-codes for wheelchair cushions. These codes are used to categorize cushions for
reimbursement for Medicare/Medicaid patients. The cushion codes mentioned below are
provided by SADMERC (Statistical Analysis Durable Medical Equipment Regional Carrier).[70]
They can be interpreted as follows:
• E2607 – Skin protection & positioning cushions (4 cushions)
• E2605 – Positioning cushions (2 cushions)
• E2603 – Skin Protection cushions (3 cushions)
• E2601 – General use cushions (4 cushions)
• K0108 – Adjustable skin protection cushions (temporary) (3 cushions)
• K0108/ – Adjustable skin protection & positioning cushions (temporary) (3 cushions)
For the first part of this study, we tested on three sets of 8 cushions (first eight), while for the
second part of the study, we tested on all 21 cushions:
20

TABLE 1: List Of Cushions
CUSHION
MANUFACTURER
DESCRIPTION
CMS CODING
HR45 Foam
3” Urethane Foam With 45 IFD (no cover)
Ref material
Action Pilot Flotation Pad
(Gel)
25mm Thick Gel (Urethane Viscoelastic Polymer)
Ref material
Saddle – Zero Elevation*
The Comfort Company
2-Density Contoured HR Foam, Quadra 3D Gel (Polyurethane
Bladder) Pack
E2607
Xact Classic Contour
Action Products Inc AKTON (Urethane Viscoelastic Polymer) Polymer Cube Pad,
Contoured Urethane Foam
E2605***
Stimulite Contoured
Supracor Inc Contoured, Multilayered Polyurethane Honeycomb
E2607
TempurMed – 3” High Density
Tempur-Pedic Viscoelastic Polyurethane Foam E2601***
Roho – High Profile
The Roho Group 4” High Interconnected Aircells, Single Chamber
K0108
Infinity – Flow Gel/Viscous
Foam** - Gentle Contour
Invacare Corporation
Viscoelastic Foam Insert And Pelvic Support Layer Combined With Gently Contoured Molded
Foam Base
E2603
Cloud
Otto Bock Three Different Sizes Of Floam™ (Polymeric Gels) Cells,
Foam Base
K0108/
Contur Gel Otto Bock Convoluted Foam With A Top Layer Of Gel
E2603***
Cubic Foam
Otto Bock Thin Cubic-Shaped Polyurethane Foam
E2601***
21

TABLE 1 (continued)
CUSHION MANUFACTURER
DESCRIPTION
CMS CODING
Combi Foam
Otto Bock Thin Layers Of Multi-Density Polyurethane Foams
E2601***
Stimulite Classic
Supracor Inc Three Layers Of Polyurethane Honeycomb —Each A Different
Stiffness
E2603
Roho Quadtro – High Profile
The Roho Group 4 Quadrants Of 4” High Interconnected Aircells
K0108/
PR1600
Metalcraft Industries Contoured Viscoelastic Foam, Multilayer Of Polyurethane
Foams
E2607
Jay2 (Deep) Jay/Sunrise Medical Contoured Polyethylene Foam Base With Jay Flow Fluid Pad (Combination Of Polyurethane
Foam And Gel)
K0108/
Cross-Cut Span-America
Cubic Shaped Urethane Foam E2601
Zoid PSV
Varilite Contoured, Self Inflating Air and Foam Cushion
K0108
Evolution PSV
Varilite Contoured, Self Inflating Air and Foam Cushion
K0108
Synergy Spectrum
Quantum Rehab, Pride Mobility Products Corp
Contoured, Form-Retaining Viscoelastic Foam, Deep Twin-Cell Gel Insert, Wrap-And-Lift
High-Density Foam
E2605
Synergy Solution
Quantum Rehab, Pride Mobility Products Corp
Contoured, Form-Retaining Viscoelastic Foam, Twin-Cell
Gel Inserts, Wrap-And-Lift High-Density Foam
E2607
* The Saddle tested was 18”× 16” in size.
** For Recovery, we have tested on viscous foam inserts. For all other (three) methods we tested on flow gel inserts.
*** These cushions have not been coded by SADMERC. Codes listed have been established by our lab based on the
CMS classification.
22

23

3.0 DEVELOPMENT AND VALIDATION OF THE RECOVERY TEST
3.1 INTRODUCTION
The first part of the thesis is structured around the development and validation of the recovery
test protocol. There are multiple stages in development of a test method. First a test draft is
finalized; responses from other laboratories involved in the development process are taken and
finally, data is collected by implementing the test on a given set of cushions. The effectiveness of
any test can be determined by analyzing its within and between test repeatability and
reproducibility. The test can be said to be statistically valid (effective) on three counts: It needs
to have high repeatability within replications of each test; it should have high repeatability
between tests and anybody should be able to reproduce the test completely from the test draft and
get comparable results.
A complete test draft entails the following: apparatus requirements, cushion set-up, step-by-step
test procedure, and disclosure requirements. This chapter gives a detailed account of the final
recovery test draft included in the ISO-DIS version dated 2003-10-30, the rationale behind the
test, and the multiple stages involved in test development and validation. The test draft may have
been modified for clarity and simplicity. This is followed by data analysis, results and
discussions.
24

3.1.1 Rationale
Cochran et. al. were the first to realize the importance of cushion recovery. They primarily
associated the recovery characteristics of a cushion with its resilience,[56] i.e. its tendency to
return to its original size and shape when unloaded after a period of time.[40] Resilience can be
both a positive and a negative characteristic. The resilience of a cushion can be said to be
inversely proportionate to its pressure relieving abilities. Due to its resilience, the cushion tends
to push back on the user continuously, thereby not giving sufficient pressure redistribution. This
not only causes prolonged tissue compression but also increases the interface pressure at the
IT’s, thus contributing to the pressure ulcer risk. In this sense, cushion resilience is a negative
characteristic. The resilient properties of a cushion are sometimes compromised, as in the case of
viscoelastic cushions, to reduce the interface pressures by molding the cushion to the user shape.
Resilience can also affect the postural support of the cushion.[23] During activities like leaning
and stretching, a cushion with low resilience will not provide sufficient postural support since it
will not recover rapidly after it has been compressed, thus causing an oblique posture.[23] But in
the case of a resilient cushion, its buoyancy will assist the user in these day-to-day activities due
to which the magnitude of interface pressure (during the activity) is reduced. For example, when
the user is trying to lean towards the right hand side, a resilient cushion will recover faster and
thus will provide more support on the left IT, so that the entire body weight will not have to be
taken up by the right IT. Also, the “buoyancy effect” as a result of cushion resilience, facilitates
the person in returning to an erect posture. It is important for the user to be familiar with this
feature since it would require him/her to overcorrect briefly to nudge the non-resilient or slower
recovering material back in place.[23] By measuring the short-term recovery of the cushion, its
resilience characteristics can be established.
When a cushion fails to recover over a long period of time, it tells us that either the cushion
needs to be readjusted periodically or every morning before the user gets on to the wheelchair, or
that it is fatigued.[23] The scope of this test can be increased by using it as a measure of fatigue.
Fatigued cushions are susceptible to loss of cushion stiffness and thickness. Karg and Sprigle
have shown that it is very difficult to establish a relationship between time for which a foam
25

cushion is compressed and loss of its thickness mainly due to the variability in
measurements.[30] For cushions subjected to repeated loading, long-term recovery measurement
can also be an indication of cushion fatigue.[40]
Information on the resilience characteristics of the cushion can help us differentiate between
foam, fluid or viscoelastic cushions. Generally, foam and air cushions are found to be more
resilient than viscoelastic or viscous fluid cushions. Also, the need for periodic re-adjustments is
generally seen in viscous fluid cushions but not in viscoelastic foams. In this test, recovery is
characterized in terms of cushion thickness ratios.
26

3.2 APPARATUS REQUIREMENTS
A loading rig, rigid cushion loading indenter and a circular foot rig are required to perform the
recovery test. Following are the ISO specification for these apparatus. Details of test fixtures
developed by our lab based on these requirements can be found in the Appendix B.
3.2.1 Loading Rig
A means to apply a vertical load of up to 830N to a seat cushion with the help of a Rigid Cushion
Loading Indenter (Section 3.2.2):
a. So that the RCLI is mounted 127mm forward of its rear edge and on its centerline;
b. So that the RCLI can apply the required loads of 500N and 830N such that its IT’s are
aligned with the IT reference line (section 3.4, step 3) on the cushion;
c. So that the load can be applied on the mid-line of the reference plane surface of the RCLI
and remains normal to its reference plane surface throughout the test;
d. So that the seat cushion can be supported on a rigid horizontal surface parallel to the
reference plane surface such that base of the cushion does not flex during loading;
e. So that the RCLI can apply the required load on the cushion within 5-10secs and unload
within 25secs.
3.2.2 Rigid Cushion Loading Indenter A means of loading a cushion using a rigid device that meets the following specifications:
a. Manufactured from a rigid material such as wood or fibreglass;
b. Produced according to Figure 1;
c. Surface finish to be high gloss.
27

Note: Detailed construction/assembly information for the RCLI can be found in Appendix A. The
given dimensions are intended to be used for 16" wide cushions. Dimensions can be scaled for
larger cushions.
FIGURE 1: 2-D drawing of the modified Staarink indenter (RCLI) [40]
28

3.2.3 Circular Foot Rig
A rig used to measure the thickness of a cushion at a defined location using a circular foot and
meets the following specifications:
a. Contains a 50mm diameter circular foot, attached to rig with a rigid coupling;
b. Provides a means to vertically displace the circular foot and measure this displacement to
± 1mm accuracy;
c. Can apply a 3N ± 1N vertical load to the cushion; and
d. Can be adjusted to be positioned over the test cushion such that contact of the circular
foot can measure cushion thickness at the defined location.
29

3.3 TEST CUSHION PRECONDITIONING AND SET UP
It is often experienced that cushions when not used over period of time have a tendency to
become stiffer than usual. But they soften up once stressed for a small period of time. This trend
has the potential to create significant differences between multiple test readings. By
preconditioning the cushion prior to testing, we attempt to minimize variability in measurements.
1. Preconditioning: - Perform the following prior to the first test performed on an unused
test cushion and thereafter when the cushion has not been tested for 12 hours:
a. Condition cushion unloaded in test environment for at least 12 hours (23 ± 2ºC
ambient temperature and 50 ± 5% relative humidity);
b. If provided, ensure cushion cover is oriented as specified by the manufacturer;
c. If needed, adjust cushion to accommodate an 830N load applied using the RCLI;
d. Apply 830 ± 10N using the RCLI for a minimum of 120 ± 5s to a maximum of 180 ±
5s;
e. Unload and reload within 120 ± 5s;
f. Remove load after 120 ± 5s to 180 ± 5s;
g. Allow cushion to recover 5 to 60 minutes.
Note: Recovery time will vary depending on cushion type. Recovery times shall be
determined by each lab independently and recorded. For the purpose of our study, we
limited recovery time to 15mins.
Cushions often require some form of set-up (e.g. Roho) or adjustments (e.g. Jay2) prior to sitting
on them. To reduce variability between test readings, norms regarding the same are laid down.
2. Set up: - Perform the following, as necessary, prior to performing a test method on a
cushion (Not necessary to perform between the three repeated measures within any one-
30

test method unless specified by the manufacturer. But it must be performed between test
repetitions.):
a. If indicated by the manufacturer, adjust cushion to accommodate a 500 ± 10N load
applied using the RCLI;
b. If cushion contains a viscous fluid, reset the cushion by flattening or kneading;
c. If the manufacturer specifies adjusting the cushion to the shape of the user, adjust
cushion using the intended indenter to accommodate the intended test load;
d. Allow the cushion to recover 5 to 60 minutes.
Note: Recovery time will vary depending on cushion type. Recovery times shall be
determined by each lab independently and recorded. For the purpose of our study, we
limited recovery time to 15mins.
31

3.4 RECOVERY TEST PROTOCOL
This includes details of the test step-by-step procedure, disclosure requirements and the
environment for testing: Step-by-step Procedure:
1. Precondition and setup the cushion as specified in section 3.3;
2. Place the Rigid Cushion Loading Indenter (RCLI) in the Static Loading Rig;
3. On the test cushion, mark the IT-line, which corresponds with the anterior-posterior (A-
P) location of the ischial tuberostities (IT’s) of the RCLI defined such that the IT’s of the
RCLI are aligned with the analogous portion of the cushion. If no IT location is clearly
defined by the cushion’s contour/manufacturer, place the IT-line 125 ± 2mm from the
rear edge of the cushion;
4. On the test cushion, mark an IT-reference-point defined by the intersection of the IT-line,
defined in Step 3, and a line parallel to the centerline and located at half the distance of
the IT spacing of the RCLI;
Note: For a 360mm wide RCLI, used in the validation testing, half the distance of the IT
spacing is 55mm.
5. Without the cushion in place, bring the circular foot of the Circular Foot Rig in contact
with the horizontal plane with a contact load of 3 ± 1N and record the vertical distance to
the nearest 1mm from a reference plane (measurement A);
6. Place the cushion in the Circular Foot Rig;
7. Bring the circular foot in contact with the cushion such that it is centered within a 2mm
radius of the IT-reference-point marked on the cushion. Apply a 3 ± 1N contact load and
record the vertical distance to the nearest 1mm from the reference plane (measurement
B);
32

8. Place the cushion in the Static Loading Rig such that the IT’s of the RCLI are aligned
with the IT-line on the cushion and the centerlines of the RCLI and cushion are aligned
(±2mm);
9. Apply a load of 500 ± 10N with the RCLI within 5-10sec and hold for 1200 ± 60sec;
10. Remove the load;
11. At 25 ± 2sec bring the circular foot in contact with the cushion such that it is centered
within a 2mm radius of the IT reference point; apply a 3 ± 1N contact load and record the
vertical distance to the nearest 1mm from the reference plane (measurement C);
Note: It is desirable that the Circular Foot Rig can be inserted and removed from the Static
Loading Rig such that the test cushion is not moved during testing. However, if removal of
the cushion for measurement with the Circular Foot Rig is necessary, this should be noted in
the test report and all effort should be made to reduce the disturbance to the cushion during
movement (e.g., place cushion on a rigid board during testing and use the rigid board to
move the cushion.)
12. Remove the circular foot;
13. At 1200 ± 60sec bring the circular foot in contact with the cushion such that it is centered
within a 2mm radius of the IT reference point; apply a 3 ± 1N contact load and record the
vertical distance to the nearest 1mm from the reference plane (measurement D);
14. Repeat steps 5-13 two times, for a total of three repetitions allowing 300 ± 10sec between
repetitions.
Test Report:
The test report should include the following for each cushion tested:
1. The model type and nominal size that uniquely describes the cushion;
2. The cover used;
3. Location of the point on the cushion where the foot is located;
4. Note if the cushion was moved during testing to make measurements with the circular
foot;
33

5. The average original thickness of the cushion at the IT location |B-A|;
6. The average ratio of the 25sec recovery thickness to the original thickness at the IT
location (25sec / original) = (C-A)/(B-A)
7. The average ratio of the 1200 s recovery thickness to the original thickness at the IT
location (1200sec / original) = (D-A)/(B-A)
Test environment
An environment with ambient temperature of 23 ± 2°C and relative humidity 50% ± 5%, which
can be determined as specified in ISO 554-1976(E), should be maintained.
Note: Loading is based upon 110% of the worldwide average mass of 70kg. Ten percent is added
to accommodate variability. Therefore, a 77kg person is being represented. The upper body
imparts the primary load on a cushion and represents approximately 66% of body weight or
51kg. A model or indenter loaded with 51kg represents full loading. A model or indenter loaded
with 25kg represents partial loading (50%).[20]
34

3.5 DEVELOPMENT AND VALIDATION PROCEDURE
University of Pittsburgh developed an inter-laboratory validation plan for the ISO 16840-2. The
plan was developed based upon the testing resources and time frame available. For the
development and validation of each test protocol, a primary and two secondary laboratories were
assigned. The primary/lead laboratory was responsible for development and optimization of the
test procedures. They performed initial testing on a set of wheelchair cushions. The secondary
labs then repeated the test on the same set of cushions. For the Recovery test, Pitt was the lead
lab, IBV and EC the secondary labs.
Following steps were followed for the purpose of development and validation of the recovery
test protocol: -
1. We used the existing Recovery draft protocol contained in ISO-CD 16840-2 that was
distributed in October of 2002 (dated version 2002.10.20),[33] made necessary revisions and
created a new draft which specified the following:
• Requirements of the test equipment to be used
• A step by step protocol created based upon ISO-CD 16840-2
• The number of significant digits to record
In this draft of the Recovery test, the cushion thickness was to be measured by the RCLI
using a 5N contact load. We envisaged a few problems with this approach. As discussed
previously, there is high variability in cushion materials and construction. Different portions
of the cushions are often constructed of different materials that may have varying recovery
rates. Identifying the RCLI contact point on the cushion (during thickness measurements)
would be difficult if the cushion has any surface contours. This would get more complicated
while measuring the cushion thickness to determine cushion recovery, after loading, since
certain portions of the cushion may recover faster than other portions. Hence we could have
original cushion thickness measured at an arbitrary point A and have cushion recovery
thickness measured at a totally different point B. Further there is a high probability that point
A and point B keep changing for each repeated test. This would introduce too much
variability, making it very difficult to get repeatable results.
35

We thought it would be more meaningful to be able to determine cushion recovery at specific
points on the cushion rather than have general recovery measurements. At the same time we
still wanted to load the cushion with the RCLI to get proportionate deflection at various
portions of the cushion and have a close representation of the cushion-buttock interface. To
facilitate this, we needed to change the instrumentation requirements for the test. Initially, the
test required only a Loading Rig and the RCLI. We decided to introduce a Circular Foot Rig,
details of which are given in section 3.2.3. A load of 3N was considered adequate to ensure
contact between the circular bob and the cushion. There are a couple of advantages of using
this approach. The most significant one being that we can be confident that measurements
before and after loading are taken at the same point on the cushion. In addition, we can place
the circular foot on any portion of the cushion. This increases the scope of the test
enormously. We can now get recovery measurements not only in the IT-region, but also in
other regions of the cushion (e.g. thigh). In the initial set-up, the RCLI contact load for
thickness measurement was only 5N. Since the RCLI weighs much more than that we would
have to preload it, which would involve complicated fixtures. This is mainly a problem for
manual set-ups. With the introduction of the Circular Foot Rig, instrumentation for manual
set-ups becomes less complex.
We were keen to have a protocol that could test a cushion with both an automated and
manual set-up. This would increase its applicability and simplicity, thus making it more
accessible. To further understand the issues/difficulties related with the test protocol, we
decided to do some preliminary tests on the seat cushions with both manual and automated
set-ups. (The manual and automated set-ups used by our laboratory is explained in details in
the Appendix B.) This helped us further refine the test protocol, by ensuring that the
requirements and steps for the test instrumentation and procedure are clearly and
simplistically defined. We recognized the need for the following: Firstly, we realized that
although it is desirable that the Circular Loading Rig be inserted and removed from the
loading rig such that the test cushion is not moved during testing, it would require complex
fixtures; and secondly, we found that we could pull the cushion out from the Loading Rig, for
measurement with the Circular Foot Rig, and push it back in when it is to be loaded as long
36

as we don’t physically touch the cushion. Every effort should be made to reduce the
disturbance to the cushion during this movement. For example, the cushion can be placed on
a rigid board during testing and can be used to move the cushion. In the initial test draft, the
short-term recovery was measured at 10 seconds after removal of the load. We found that it
was very difficult to do so while using the Circular Foot Rig. With the manual set-up, we
could manage to do it in 15-20 seconds. But with our automated set-up, we found that
although measurements for a 4-inch cushion could be done in 20 seconds, a 6-inch cushion
would require more time. Even though this varies for different set-ups, our aim was to design
a protocol that was easily implemental by all manufacturers and laboratories. Hence we
increased the short-term recovery time to 25 seconds.
2. The protocol changes were then circulated to the secondary labs for review. We received
positive responses from both labs. We now had the final draft of the recovery test protocol
that we would use for validation testing.
3. For the validation testing, we (lead lab) tested three sets of test cushions (set A, set B, set C).
Each set consists of eight cushions (section 2.4). Each test was repeated a total of 3 times on
each of the cushions (total of 9 measurements per cushion). Testing on three sets would
enable us to analyze the sample-to-sample variation between cushions and the intra-lab
repeatability of the test protocol.
4. The cushions were then sent to the secondary labs for further testing, set B to IBV and set C
to EC. They repeated the tests a total of 3 times on their respective sets. This allowed us to
test the inter-lab repeatability of the protocol.
5. Finally, we compiled the results from the three labs and analyzed the data to check if there
was a general agreement or a need to revisit the protocol design.
37

3.6 DATA ANALYSIS
The statistical analysis is split into two parts: Part A checks for protocol repeatability by
performing a three-way ANOVA (analysis of variance), with a 95% significance level, using
one between-subject factor and two within-subject factors. The Huynh-Feldt correction factor
was applied to account for the sphericity assumption. In all there are four factors: sets (3),
cushions (8), replications (3), tests (3). The ANOVA was performed between cushions,
replications & test; and between sets, replications & test for each of the response parameters,
namely thickness, 25sec recovery and 20min recovery. The cushions and sets were treated as the
between-subject factors while replications and tests were treated as within-subject factors.
In Part B we check for protocol reproducibility and reliability by computing the Intraclass
Correlation Coefficient (ICC) for the three response parameters. For the ICC we used a two-way
mixed effects model under the Absolute agreement definition. This was calculated using the
mean square values of between-subject and within-subject factors from the ANOVA results. The
ICC analysis gives us two values: single rater ICC (S) and average raters ICC (A) (in this case
‘test’ is the rater). The single rater ICC verifies reliability of the test if it were performed once
(only one measure). The average rater ICC verifies test reliability when average of the three
measures is reported as the final result. The ICC is calculated for three cases:
1. Lab-Lab Variation: Test averages for the same set of cushions tested in different
laboratories were compared.
2. Cushion-Cushion Variation: Test averages for different set of cushions tested in the same
laboratory were compared.
3. Total Variation: Test averages for different set of cushions tested in different laboratories
were compared.
Note: Due to time restrictions, we could not get data from Lab C. Only Lab A and Lab B data
are analyzed.
38

3.7 RESULTS
Part A: Summary of the results from the ANOVA can be seen below in table 2 and table 3. A
non-significant (NS) result implies that there are no significant differences between readings for
that factor and its interactions. For the ANOVA of Set*Test*Replication, we get a ‘NS’ for all
factors and their interactions with the exception of replication for the thickness parameter. For
Cushion*Test*Replication, we get significance (S) for replication, cushion and their interaction
for all three parameters and ‘NS’ for the rest.
TABLE 2: 3-Way ANOVA Results For Set*Test*Replication Interaction
PARAMETER TEST TEST*SET REP REP*SET TEST*REP TEST*REP*SET SET
THICKNESS NS NS S NS NS NS NS 25 SEC NS NS NS NS NS NS NS 20 MIN NS NS NS NS NS NS NS
TABLE 3: 3-Way ANOVA Results For Cushion*Test*Replication Interaction
PARAMETER TEST TEST*CUS
HION
REP REP*CUS
HION
TEST*REP TEST*REP*CUS
HION
CUSHI
ON
THICKNESS NS NS S S NS NS S 25 SEC NS NS S S NS NS S 20 MIN NS NS S S NS NS S
Table 4 lists the averages for each parameter along with their standard deviation for the three
tests performed on set A by lab A (Pitt). Variation across sets of cushions tested by our lab (lab
A) for each parameter can be seen in figures 2,3 and 4.
39

TABLE 4: Set A, Lab A readings for Recovery
CUSHION # THICKNESS (mm) 25 SEC RECOVERY 20 MIN RECOVERY avg std dev. avg std dev. avg std dev.
1 79.00 0.00 0.99 0.00 1.00 0.00 2 28.22 0.44 0.96 0.00 0.99 0.02 3 67.33 0.87 0.95 0.01 0.99 0.01 4 85.78 5.19 0.88 0.05 0.97 0.04 5 82.11 0.33 0.98 0.01 0.99 0.01 6 67.56 0.88 0.91 0.02 0.99 0.01 7 67.67 0.50 0.92 0.01 1.00 0.01 8 61.00 0.00 0.97 0.01 1.00 0.00
0.00
10.00
20.00
30.00
40.00
50.00
60.00
70.00
80.00
90.00
100.00
1 2 3 4 5 6 7 8
Cushion #
THICKNESS, LAB A, SETTHICKNESS, LAB A, SETTHICKNESS, LAB A, SET
FIGURE 2: Thickness Vs Cushion for set A, B, C tested in lab A
40

0.80
0.82
0.84
0.86
0.88
0.90
0.92
0.94
0.96
0.98
1.00
1 2 3 4 5 6 7 8
Cushion
25SEC, LAB A, SE25SEC, LAB A, SE25SEC, LAB A, SE
FIGURE 3: 25sec Recovery Vs Cushion for set A, B, C tested in lab A
41

0.8
0.82
0.84
0.86
0.88
0.9
0.92
0.94
0.96
0.98
1
1 2 3 4 5 6 7 8
Cushion#
20MIN, LAB A, SET A20MIN, LAB A, SET B20MIN, LAB A, SET C
FIGURE 4: 20min Recovery Vs Cushion for set A, B, C tested in lab A
Part B: Table 5 lists the single and average rater ICC for all the three parameters and the three
cases mentioned previously (section 3.6). The ICC’s for the thickness for all three cases are very
high. For the Cushion-Cushion variation, the ICC for 25sec recovery is very high but not as high
for the 20min recovery. For the remaining cases, the ICC’s are significantly low. Table 6 lists the
average test results of labs A and B on sets A and B for all three parameters for all three cases.
The differences between the readings have been computed and listed. The ICC’s indicate low
reproducibility. Although, when you look at the differences between the results for the three
cases, the variation seems to be very low.
42

TABLE 5: ICC results for Interlab Reproducibility
PARAMETER CUSHION-CUSHION VARIATION
LAB-LAB VARIATION
TOTAL VARIATION
S A S A S A THICKNESS (mm) .9862 .9953 .9554 .9772 .9941 .9970
25 SEC RECOVERY .9347 .9773 .4524 .6276 .4817 .6502 20 MIN RECOVERY .7233 .8870 .4899 .6576 .2911 .4509
TABLE 6: Interlab Comparison
PAR. C # CUSHION-CUSHION LAB-LAB TOTAL AA* AB DIFF AB BB DIFF AA BB DIFF
TH 1 79 78 1 78 78 0 79 78 1 (mm) 2 28 28 0 28 27 1 28 27 1
3 67 68 -1 68 67 1 67 67 0 4 86 76 10 76 91 -15 86 91 -5 5 82 83 -1 83 81 2 82 81 1 6 68 68 0 68 68 -1 68 68 -1 7 68 69 -1 69 66 2 68 66 1 8 61 57 4 57 60 -2 61 60 1
25SEC 1 0.99 0.99 0 0.99 0.98 0.01 0.99 0.98 0.01 2 0.96 0.96 0 0.96 0.99 -0.03 0.96 0.99 -0.03 3 0.95 0.94 0.01 0.94 0.94 0 0.95 0.94 0.01 4 0.88 0.90 -0.02 0.90 0.95 -0.05 0.88 0.95 -0.07 5 0.98 0.96 0.02 0.96 0.97 -0.01 0.98 0.97 0.01 6 0.91 0.91 0 0.91 0.95 -0.04 0.91 0.95 -0.04 7 0.92 0.88 0.04 0.88 0.95 -0.07 0.92 0.95 -0.03 8 0.97 0.98 -0.01 0.98 0.98 0 0.97 0.98 -0.01
20MIN 1 1.00 1.00 0 1.00 0.99 0.01 1.00 0.99 0.01 2 0.99 1.00 -0.01 1.00 1.01 -0.01 0.99 1.01 -0.02 3 0.99 1.00 -0.01 1.00 0.99 0.01 0.99 0.99 0 4 0.97 0.97 0 0.97 0.98 -0.01 0.97 0.98 -0.01 5 0.99 1.00 -0.01 1.00 1.00 0 0.99 1.00 -0.01 6 0.99 0.99 0 0.99 0.99 0 0.99 0.99 0 7 1.00 1.00 0 1.00 0.99 0.01 1.00 0.99 0.01 8 1.00 1.00 0 1.00 0.98 0.02 1.00 0.98 0.02
*The first letter stands for the ‘lab’ and the second one for the ‘set’.
** Thickness variations above 3mm and the recovery variations above 0.05 have been highlighted.
43

3.8 DISCUSSION
For Part A, non-significance (NS) for both the ANOVA’s for all three parameters for the ‘test’
factor and its interactions with other factors imply that we get repeatable measurements at 95%
significance level. NS for ‘set’ and its interactions means that there are no differences between
the three sets of cushions used for testing. This can also be seen in figures 2, 3 and 4. The
variation between test measurements for different sets across different types of cushions is very
low. The only two factors that we get significance for is ‘replication’, ‘cushion’ and their
interaction.
Significance for ‘cushion’ implies that the measurements for all three parameters for each type of
cushion are different. This does not mean that no two cushions can have similar measurements.
This simply tells us that the protocol can distinguish between cushions, meaning that at least two
cushions have different results.
However, significance for ‘replication’ and its interaction with ‘cushion’ is a cause of concern. It
can be seen in figure 5 (which is a plot of avg. cushion thickness across cushions for different
replications) that cushion# 4 has high variation between its three replications. This is due to the
fact that it requires being set-up and adjusted before testing. The way the protocol is defined, we
cannot perform these set-ups and adjustments between replications and hence this variability.
Secondly, there is a fixed trend in the thickness measurements between the three replications for
all cushion types. Meaning, replication 1 is consistently higher than replication 2, which is
consistently higher than replication 3. This is due to the fact that the cushions are not given
enough time to recover between replications. The way the ANOVA works is that it considers
these systematic differences between measurements as an indication that the values are not true
replicates. For reliable results, it requires the variation between measurements to be randomly
distributed. So we randomly distributed the measurements in a way that this trend was
eliminated. We also omitted cushion# 4 from our new calculations. The ANOVA results now
give ‘NS’ for all factors and their interactions except for ‘cushion’. Thus we can say that the test
protocol will give repeatable results when tested within the same lab. However, we must allow
44

adjustments or resetting of the cushions between replications and give at least 30 munutes
recovery time between replications.
We cannot assume that the results of this test will be the same when performed in a different
testing facility. The main aim behind standardizing a test protocol is to be able to get repeatable
and reproducible results when performed by any testing facility on their own test set-up, built
based on the requirements defined in the protocol.
CUSHION #
8 .007 .006 .005 .004 .003 .002 .001 .00
1 00
9 0
8 0
7 0
6 0
5 0
4 0
3 0
2 0
1 0
0
REP
1
2
3
FIGURE 5: Avg. Thickness Vs Cushion for diff. reps (Lab A, Set A, B, C)
45

For Part B, we account for the test variability due to – testing on different set of cushions in the
same laboratory; testing in different laboratories but on the same set of cushions; testing on
different set of cushions in different laboratories. As seen from table 5, the single rater ICC is
always less than the avg. rater ICC. For these cases, we will be mainly referring to the single
rater ICC since, as mentioned in the preceding paragraph, we want to be able to say that anyone
can test any cushion once and get a reliable result.
For Cushion-Cushion variation, we have very high ICC’s for thickness and 25sec recovery, but
for the 20min recovery the ICC is comparatively low (0.7233). On the other hand, if you look at
the differences between the measurements for the two sets of cushions for the 20min recovery
(table 6), the maximum difference is 0.1. Moreover, the cushion recovery has a range of only
0.97-1.0. All cushions recover almost completely. The reason for a lower ICC is not repeatability
but the closeness of the measurements between cushions. The variation between cushions is very
low. If you look at the differences for thickness measurements, you notice a difference of almost
10mm for cushion# 4. Still the ICC for thickness is very high. This is due to two reasons. Firstly
this is only a single occurrence; rest of the measurements don’t differ by much. Secondly, the
cushion thickness varies from approx 25mm to 85mm. The way the ICC works is that it checks
for variability in measurements between cushions and within cushions to set a base with which it
decides if the within cushion variation is acceptable or not. Hence even though the 20min
recovery measurements seem to be repeatable, we get a low ICC. The low ICC (in this case)
does not imply lack of repeatability of this test, but points towards the tests poor ability to
distinguish between cushions. The long-term recovery test can be used for two purposes: To
check for need for periodic adjustments or to check for cushion fatigue. Hence we can convert
this test into a binary test, which tells us if the cushion recovers or not. Any measure below 0.95
can be considered as cushions’ failure to recover.
For the same reasons mentioned above, in case of Lab-Lab variation, the thickness ICC is high
despite having a variation of almost 15mm for one of its cushions and the 20min recovery ICC is
low despite having a maximum difference of 0.02. This is further illustrated with the 25sec
recovery result, which unlike the previous case is very low. Its range of measurements is 0.88-
0.99 for lab A and 0.94-0.99 for lab B. The lab A range is almost double of lab B. The maximum
46
difference is around 0.07. Hence it seems like these measurements are not reproducible when
measured in different labs.
Table 7 shows a comparison chart for the original thickness, 25sec thickness (used to compute
the 25sec recovery), 25sec recovery (in mm) and the differences in these measurements for labs
A and B for set B. 25sec recovery (in mm) is the amount the cushion is deflected after 25
seconds of load removal. If we compare the differences in original cushion thickness with
differences in the 25sec cushion thickness (A-B THK and A-B 25S THK), we find that both of
them have similar range of variations. Further, the ICC for the 25sec thickness (0.9272), between
both the labs (A - 25SEC THK & B - 25SEC THK) is almost as high as the thickness ICC
(0.9554). Hence we can conclude that the reproducibility is mainly being affected due to
sensitivity.
TABLE 7: 25sec Thickness Comparison for Set B, Lab A, B
C #
A - THK
A - 25SEC THK
A - 25S RECOV
(mm)
B - THK
B - 25SEC THK
B - 25S RECOV
(mm)
A – B THK
A – B 25S
THK
A – B 25S RECOV
(mm)
A – B 25S
RECOV 1 78 78 1 78 76 2 0 1 -1 .01 2 28 27 1 27 27 0 1 0 1 .02 3 68 64 4 67 63 4 1 1 0 .00 4 76 68 8 91 86 4 15 18 3 .05 5 83 79 3 81 78 2 2 1 1 .01 6 68 62 6 68 65 3 1 3 2 .04 7 69 61 8 66 63 3 2 3 5 .07 8 57 56 1 60 58 2 2 1 -1 .01
(Note: All readings are in mm, except the last column, which is unit less.)
The range of differences between the 25sec recovery (mm) for the two labs (A-B 25S RECOV
(mm)) is about 0-5mm or 0-7%. These variations can be for a number of reasons. The tolerance
for the circular foot rig measurement rule itself is ±1mm. Thus the maximum error due to this
could be 2mm. Also, thickness measurements for contoured cushions have high probability of
error. This can be explained as follows: The IT-reference point defined in section 3.4 could be
chosen at different locations in different labs. The maximum error tolerance for this is a radius of
2mm. Further, once the point is defined, the circular bob has to be placed within a 2mm radius
47

during every measurement. In total the point at which thickness is being measured could be off
by a radius of 4mm. Hence, the cushion thickness and 25sec thickness may be measured (in
different labs) at points that are almost 8mm apart. This has the potential to create differences in
contoured cushion thickness measurements between labs. The probability of this error is further
increased if the circular foot rig is inserted and removed manually. This line of reasoning is
supported by the fact that flat cushion thickness and recovery measurement differences are
within 2mm and that of contoured cushions vary by about 5mm.
For the total variation case, we see that the ICC is again high for thickness but low for the other
two parameters. The same reasoning applies here too. Further, through the ANOVA results in
part 1A and the ICC results for the cushion-cushion variation, we have successfully shown that
there are no significant differences between similar types of cushions. Hence we can say that
these high variations are due to differences in labs and not due to cushions. This is supported by
the fact that these results are similar to results of the Lab-Lab variation case.
Another thing to note, and this would be true for all three cases, is that the maximum variations
are generally seen for cushions needing periodic set-ups. Cushions that require complicated set-
up procedures are bound to show some variation.
48

4.0 IMPLEMENTATION OF STANDARDIZED PROTOCOLS
4.1 INTRODUCTION
For this section, we chose three additional optimized tests (total four) from the ISO draft and
implemented them on a set of 21 cushions listed in section 2.4. As mentioned in the preceding
section, for the development and validation purpose, each test has one lead and two secondary
labs. We were the lead lab for Recovery, and secondary lab for Load-deflection and Hysteresis,
Loaded Contour Depth and Overload Deflection, Lateral and Forward Stiffness and hence the
selection. We thought it would be interesting to supplement the work by implementing these
tests on a larger variety of cushions. These tests have so far been optimized based on results from
a set of 8 cushions out of which two of them are reference cushions. Testing them on a larger
group of commercially available cushions helps us identify technology specific limitations of the
protocols. Certain tests may require modifications based on testing difficulties or inconsistent
test readings. Further, the protocol reliability is evaluated by analyzing their ability to
differentiate between cushions.
This chapter analyzes each test separately, puts forth the final test draft for the four tests included
in the ISO DIS dated version 2003-10-30, and explains the test rationales for each.[40] The test
draft may have been modified for clarity and simplicity. The data analysis, results and
discussions are done separately for each of the tests.
49

4.2 LOAD-DEFLECTION AND HYSTERESIS TEST
This test provides information about cushion resilience and cushion hysteresis at multiple loads.
Hysteresis can be defined as the amount of energy lost during a cycle of loading and
unloading.[40] Cushions with high hysteresis will tend to absorb more energy. This cushion
attribute is desirable when used on rough surfaces or when dropping down steps as this would
prevent vibrations or impact loads from being completely transferred to the user’s tissues; thus it
could be related to impact dampening.[40] On the other hand the energy lost during the cycle of
loading and unloading, will in most cases, be converted into heat thus causing an increase in
temperature. It will be interesting to find out if the increase in temperature is clinically
significant. We have already discussed the positives and negatives of cushion resilience (section
3.1) while talking about the recovery test. We defined resilience as the cushions ability to
recover. Alternately, resilience can also be defined as the ratio of energy spent in trying to
recover from deformation to the energy required to cause this deformation.[41] In this respect,
resilience and hysteresis are interdependent.
The load deflection test measures cushion deflection and cushion thickness at multiple loads
when the cushion is loaded and unloaded. Hysteresis is quantified in terms of a hysteresis index
(H.I.), which at a specific load can be defined as the ratio of the difference between the loaded
cushion thickness and the unloaded cushion thickness by the loaded cushion thickness. Unlike
the recovery test that thought of cushion recovery as a measure of cushion resilience, this test
considers the H.I. as an estimate of cushion resilience. A higher H.I. for a cushion would imply
better hysteresis properties and thus would mean low resilience. This test may better define the
characteristics of cushions that respond rapidly to load changes when performed in a continuous
loading-unloading environment.[40]
50

4.2.1 Apparatus Requirements
This test requires only a loading rig and a RCLI (section 3.2.2). Following are the ISO
specification for these apparatus. Details of test fixtures developed by our lab based on these
requirements can be found in the Appendix C.
4.2.1.1 Loading Rig A means to apply a vertical load of up to 830N to a seat cushion with the help of a Rigid Cushion
Loading Indenter (Section 3.2.2):
a. So that the RCLI is mounted 127mm forward of its rear edge and on its centerline;
b. So that the RCLI can apply loads in the range of 0 to 830N such that its IT’s are aligned
with the IT reference line (section 3.4, step 3) on the cushion;
c. So that the load can be applied on the mid-line of the reference plane surface of the RCLI
and remains normal to its reference plane surface throughout the test;
d. So that the seat cushion can be supported on a rigid horizontal surface parallel to the
reference plane surface such that base of the cushion does not flex during loading;
e. So that the RCLI be able to apply the required load on the cushion within 10secs and
unload within 10secs;
f. So that the cushion deflection can be measured with the help of the RCLI.
4.2.2 Load-Deflection and Hysteresis Test Protocol
This includes details of the test step-by-step procedure, disclosure requirements and the
environment for testing:
Step-by-step Procedure:
1. Precondition and setup the cushion as specified in section 3.3;
2. Bring the RCLI into contact with the test surface used to support the seat cushion. Zero
the height gauge or otherwise compensate for the height of the indenter portion of the
fixture;
51

3. Place the RCLI in contact with the cushion so that the ischial tuberosities of the indenter
are 125 ± 25mm forward of the rear edge of the cushion or are aligned with the analogous
part of the cushion;
4. Apply a starting vertical load of 8 ± 3N for 120 ± 10 seconds;
5. Record height of the cushion at the RCLI / cushion interface as “8N Compression” (8NC);
6. Apply a load of 250 ± 5N within 10 second loading period, so that the total load is 250 ±
5N;
7. Wait 120 ± 10 seconds and record the height of the cushion at the RCLI / cushion
interface as “250N Compression” (250NC);
8. Increase the total load to 500 ± 10N with in a 10 second loading period;
9. Wait 120 ± 10 seconds and record the height of the cushion at the RCLI / cushion
interface as “500N Compression” (500NC);
10. Increase the load to 750 ± 15N within a 10 second loading period;
11. Wait 120 ± 10 seconds and record the height of the cushion at the RCLI / cushion
interface as “750N compression” (750NC);
12. Remove the last applied loading increment within a 10 second unloading period, so that
the total load on the cushion is 500 ± 10N;
13. Wait 120 ± 10 seconds and record the height of the cushion at the RCLI / cushion
interface as “500N Unload” (500NU);
14. Remove load with in a 10 second unloading period so that the total load on the cushion is
250 ± 5N;
15. Wait 120 ± 10 seconds and record the cushion height at the RCLI / cushion interface as
“250N Unload” (250NU);
16. Remove load with in a 10 second unloading period so that the total load on the cushion is
8 ± 3N;
17. Wait 120 ± 10 seconds and record the cushion height at the RCLI / cushion interface as
“8N Unload” (8NU);
18. Repeat steps 2 to 17, for a total of three measurement sets allowing 300 ± 10sec between
measurements.
52

Test Report
1. The model type and nominal size that uniquely describes the cushion;
2. The cover used;
3. The mean value for the 3 data sets for each of the parameters measured while performing
the test, namely, 8NC , 250NC , 500NC , 750NC , 500NU , 250NU , 8NU ;
4. The average compressive deflection at:
i) ( )CN250 N250 XthicknessunloadedXatdeflectionecompressivX −=
ii) ( )CN500 N500 XthicknessunloadedXatdeflectionecompressivX −=
iii) ( )CN507 N750 XthicknessunloadedXatdeflectionecompressivX −=
5. The average unloading deflection at:
i) ( )CN500 N500 unloading XthicknessunloadedXatdeflectionX −=
ii) ( )CN502 N502 unloading XthicknessunloadedXatdeflectionX −=
iii) X unloading deflection at 8N = X unloaded thickness − X 8NC( )
6. The hysteresis or resilience index at:
i) hysteresis at 8N = 1−X 8NU
X unloaded thickness⎛
⎝ ⎜
⎞
⎠ ⎟
ii) ⎟⎟⎠
⎞⎜⎜⎝
⎛−=
C
U
250N 250N 1250N
XXathysteresis
iii) ⎟⎟⎠
⎞⎜⎜⎝
⎛−=
C
U
500N 500N 1500N
XXathysteresis
Test environment
An environment with ambient temperature of 23 ± 2°C and relative humidity 50% ± 5%, which
can be determined as specified in ISO 554-1976(E), should be maintained.
53

Note:
(1) Loading is based upon 110% of the worldwide average mass of 70kg. Ten percent is added to
accommodate variability. Therefore, a 77kg person is being represented. The upper body
imparts the primary load on a cushion and represents approximately 66% of body weight or
51kg. A model or indenter loaded with 51kg represents full loading. A model or indenter loaded
with 25kg represents partial loading (50%).[20]
(2) For the purpose of this study, we have done analysis only on part 6 of the test report.
4.2.3 Data Analysis
The protocols’ ability to reliably differentiate between cushions is evaluated by calculating the
Intraclass Correlation Coefficient (ICC) and the Repeatability Coefficient (RC) for the three
response parameters: hysteresis at 8N (8N_HI), 250N (250N_HI), 500N (500N_HI). For the
ICC, we used a two-way mixed effects model under the Absolute agreement definition. This is
calculated using the mean square values of between-subject and within-subject factors from a
one-way ANOVA (analysis of variance) of the three replications. The ICC analysis gives us two
values: single rater ICC and average raters ICC (in this case ‘replication’ is the rater). The single
rater ICC tells you how reliable your reading would be if you performed only one replication.
The average rater ICC tells you how reliable all your readings are.
The repeatability coefficient gives you the limits within which we expect the differences between
two measurements by the same method to lie for a 95% confidence interval. [61] It is defined by
Bland and Altman as:
RC = 1.96 * sqrt2 * sW
where, sW is the within subject standard deviation from the square root of the residual mean
square, calculated from the one way ANOVA.
54

4.2.4 Results
The three measures of the Hysteresis Index and the variation between their replications can be
observed in figures 6, 7 and 8. The ICC’s for these parameters are very high (table 8). The RC
could not be calculated, as there is a systematic trend between replications. This is discussed in
more details in the following section.
TABLE 8: ICC and RC values for Load Deflection and Hysteresis
8N_HI 250N_HI 500N_HI
Single rater ICC .9153 .9782 .9082
Average rater ICC .9701 .9926 .9674
RC - - -
0
0.05
0.1
0.15
0.2
0.25
0.3
0.35
1 2 3 4 5 6 7 8 9 10 11 12 13 14 15 16 17 18 19 20 21
Cushion#
Rep1Rep2Rep3
FIGURE 6: Variation of the 8N HI within and between cushions
55

0
0.05
0.1
0.15
0.2
0.25
0.3
0.35
1 2 3 4 5 6 7 8 9 10 11 12 13 14 15 16 17 18 19 20 21
Cushion#
Rep1Rep2Rep3
FIGURE 7: Variation of the 250N HI within and between cushions
56

0
0.05
0.1
0.15
0.2
0.25
0.3
0.35
1 2 3 4 5 6 7 8 9 10 11 12 13 14 15 16 17 18 19 20 21
Cushion#
Rep1Rep2Rep3
FIGURE 8: Variation of the 500N HI within and between cushions
4.2.5 Discussion
The high ICC’s attests to the repeatability of the protocol. The closeness between the replications
can also be seen in figures 6, 7 and 8. But the three figures display a trend between replications
of the same cushion. Replication 1 is invariably higher than replication 2, which is invariably
higher than replication 3. Due to this trend the RC value will not be a true indication of the tests’
repeatability. If readings are systematically different from each other, the RC does not consider
them to be true replicates. Although this trend does not mean that the test-retest repeatability is
low, it does indicate that the cushions do not get enough time to recover. Presently, we give
cushions a 5 min interval between replications of each test.
57

Since the single rater ICC is high for all parameters, this test could be performed only once (one
replication instead of three) to get accurate results. But if the test consists of only one replication,
an error reading can go unnoticed. Hence we should still test the cushion thrice and then report
their average as the final test result, but we must increase the time between replications to at least
30mins. We must also reset the cushions between testing. Cushions get displaced when loaded
and often fail to recover in the allocated time (especially viscous gel & fluid-filled cushions).
This has the potential to affect the subsequent measures. Hence by increasing the recovery time
and resetting the cushion between replications, the likelihood of this trend decreases.
Individual plots for the three HI’s, for each cushion (figure 6, 7 and 8), show high variability
between cushions for the 250N_HI (range of 0.02 - 0.31), low variability for 500N_HI (range of
0.02 - 0.21 with only 4 cushions above 0.1), and very low variability for the 8N_HI (range of
0.01 - 0.17 with only 3 cushions above 0.1). Owing to high repeatability between replications,
the lack of variability does not affect the ICC. But this may create problems for test
reproducibility between laboratories. Hence we can conclude that the 250N_HI test can reliably
distinguish between cushions. Further, a plot of the three HI’s for each cushion (figure 9)
illustrates the variability in hysteresis for the same cushion at different loads. The load-hysteresis
relationship is not linear. Higher hysteresis is generally encountered at a load of 250N than at
500N. Hysteresis at 8N is generally the lowest. We thought it to be interesting to check for any
correlations between the three indices. On performing the ‘Pearson Correlation’, we found that
there was an extremely strong interdependence (a value of 0.910) between 250N_HI and
500N_HI. The 8N load is only a contact load and thus it was expected that the 8N_HI would not
have a strong correlation with the other two indices. Consequently, it may not be necessary to
measure the hysteresis at 250N and 500N. We could measure only the 250N_HI to get the
required information.
58

0
0.05
0.1
0.15
0.2
0.25
0.3
0.35
1 2 3 4 5 6 7 8 9 10 11 12 13 14 15 16 17 18 19 20 21
Cushion#
8N_HI250N_HI500N_HI
FIGURE 9: Comparison of the 8N, 250N, 500N HI averages
The implementation of this protocol was fairly simple, probably the simplest among the four.
This was mainly due to the fact that we used a completely automated system, details of which
can be found in the Appendix C. However, a manual set-up may be more complex. The most
demanding issue was increasing the load from 8N to 250N and vise-versa in the allotted time of
10secs. This was mainly a problem for air cushions, few viscoelastic cushions and cushions with
taut covers. Overall the protocol seems to be reliable when performed within the same testing
facility.
59

4.3 LATERAL AND FORWARD STIFFNESS
Horizontal stiffness or more specifically lateral or forward stiffness of a cushion characterize the
cushion-user interaction at the cushion-buttock interface following changes in horizontal
forces.[40] The horizontal forces caused due to slight body movements are believed to severely
affect tissue integrity. They subject the soft tissues to shearing and deformation. A surface that
resists horizontal movement due to its horizontal stiffness characteristics, increases the shear
forces on the tissues. Cochran et al. developed tests to characterize the shear of the surface and
concluded that low stability is a result of low horizontal resistance whereas magnitude of shear
forces are higher when horizontal resistance is high.[56]. However, the stiffness of the cushion
can affect tissue integrity regardless of the pelvis movement.[40] When a person is seated, there
are two types of tissue deformations, vertical and horizontal. Uniform pressure distribution is
achieved during vertical loading through vertical deformation of cushion. Similarly, tangential
deformation will give a more uniform distribution of shear stress thus reducing its
magnitude.[67] Lower the stiffness, more will be the deformation. Hence cushions should strive
to allow for tissue movement and relaxation.[40] As an extension to the Cochran tests, Sprigle
and Karg developed a horizontal stiffness test for foam mattress overlays by pulling on a flat
loaded board pressed against the mattress; they concluded that horizontal stiffness is significantly
affected by surface geometries and stressed on need for simulation of a cushion-buttock
interface.[31] The horizontal stiffness of the cushion will depend on the material, surface
geometry and type of cover used.
The present Horizontal Stiffness test can be thought of as an extension of these tests. This
method tests the cushion’s ability to deform in response to changes in horizontal forces. The
force required to maintain a fixed displacement is recorded as a measure of horizontal stiffness.
The horizontal stiffness of the cushion characterizes both the horizontal resistance and stability.
60

4.3.1 Apparatus Requirements
This test is performed using the lateral and forward stiffness rig, and a RCLI (section 3.2.2).
Following are the ISO specification for these apparatus. Details of test fixtures developed by our
lab based on these requirements can be found in the Appendix D.
4.3.1.1 Lateral and Forward Stiffness Rig A means to support the RCLI at the end of a rigid shaft allowing the RCLI to move in the lateral
and forward direction on the seat cushion in one plane and with the following:
a. A mounting system to attach the RCLI 127mm forward of the rear edge of the RCLI on
the centerline of the indenter;
b. Uses a pivoting rigid member capable of swinging in an arc with a radius of 750mm and
free to move vertically in a linear bearing as shown in Figure 10;
c. A restraint system to locate the cushion under the RCLI;
d. Has the capability of applying 500 ± 10N vertical load to the RCLI on the mid-line of the
reference plane surface of the RCLI;
e. Has the capability of applying a force perpendicular to the vertical member, acting in the
plane of the cushion in both the forward and lateral directions and generating an indenter
displacement of 10 ± 1mm at a rate of 2mm/second;
f. Has the capability of measuring the force applied to the indenter;
g. Has the capability to accurately measuring indenter displacement upto 10 ± 1mm.
61

FIGURE 10: Apparatus to measure Lateral and Forward Stiffness[40]
62

4.3.2 Lateral and Forward Stiffness Test Protocol
This includes details of the test step-by-step procedure, disclosure requirements and the
environment for testing:
Step-by-step Procedure:
1. Precondition and setup the cushion as specified in section 3.3;
2. Set up the RCLI as illustrated in Figure 10;
3. Apply a vertical load of 500N +/-10N to the RCLI 125 ± 25mm forward of the rear of the
cushion at the midline;
4. Apply a preload of 10 ± 1N to the RCLI (perpendicular to the vertical member);
5. Adjust the height of the cushion from the linear block, such that it is equal to 750mm
(Figure 10);
Note: Steps 4 and 5 have to be done within 60seconds of loading.
6. Apply a displacement of 10 ± 1mm to the RCLI (after 60sec) in the lateral direction,
relative to manufacturers suggested cushion orientation, at the rate of 2mm/s;
7. Hold the displacement for 60 ± 5sec and then return the RCLI to the neutral position;
8. Record the peak force and the force measured 60 ± 5sec after commencement of loading;
9. Repeat Steps 2-8 two times, for a total of three measurements allowing 300 ± 10sec
between measurements;
10. Reposition the cushion and the RCLI to allow for a displacement of 10 ± 1mm in the
forward direction, relative to manufacturers suggested cushion orientation;
11. Repeat Steps 2-9 for this forward-direction orientation.
63

Test Report
1. The model type and nominal size that uniquely describes the cushion;
2. The cover used;
3. The Peak Force for Lateral pull;
4. The 60sec Force for Lateral pull;
5. The Peak Force for Forward pull;
6. The 60sec Force for Forward pull.
Test environment
An environment with ambient temperature of 23 ± 2°C and relative humidity 50% ± 5%, which
can be determined as specified in ISO 554-1976(E), should be maintained.
Note:
(1) Loading is based upon 110% of the worldwide average mass of 70kg. Ten percent is added to
accommodate variability. Therefore, a 77kg person is being represented. The upper body
imparts the primary load on a cushion and represents approximately 66% of body weight or
51kg. A model or indenter loaded with 51kg represents full loading. A model or indenter loaded
with 25kg represents partial loading (50%).[20]
(2) For the purpose of this study, only the Forward pull test was done.
4.3.3 Data Analysis
The data analysis is similar to that done in section 4.2.3. The response parameters in this case are
the peak force and the 60sec force.
64
4.3.4 Results
Figure 11 displays the average measures for the two response parameters and table 9 lists their
ICC and RC values. The ICC’s are extremely high and almost equal to 1. No trend of systematic
differences was found between replications of the test. The RC value for the peak force is lower
than that for the 60sec force. The peak force test is more precise than the 60sec force test.
TABLE 9: ICC and RC values for Forward Stiffness
Peak Force 60S Force
Single rater ICC .9992 .9935
Average rater ICC .9997 .9990
RC 5.66N 13.67N
65

-400
-350
-300
-250
-200
-150
-100
-50
01 2 3 4 5 6 7 8 9 10 11 12 13 14 15 16 17 18 19 20 21
Cushion#
PK FORCE60S FORCE
FIGURE 11: Comparison of the avg. peak and 60sec force averages
4.3.5 Discussion
The protocol displays very high reliability and repeatability. The peak force had lesser variations
within cushions than the 60sec force. This is apparent by the fact that the RC for the peak force
(5.7N) is less than half of the RC for the 60sec force (13.7N). Intuitively, we would have
expected otherwise. The variability between cushions is also large. The peak force measurements
vary between 95N – 375N while the 60sec force vary between 80N – 325N. Further this
variability between cushions is similar for both the parameters. This shows that both these tests
can differentiate between cushions equally well. Keeping this in mind and the fact that the peak
force RC is lower than that of 60sec force, we can concur that the peak force test is more precise
than the 60sec force test. Another utility of the RC is that if the variability in the cushion
66

measurements is considerably more than the limits set by the RC values of the tests, then it can
be assumed that there may have been an error in taking those measurements.
The peak force is generally observed at end of the 10mm displacement. Again, intuitively one
would think that the peak force would be observed when movement is first seen. Also, the peak
force and displacement have a positive linear relationship. As observed in figure 11, the stress
relaxation between the peak force and 60sec force varies cushion to cushion, from 10N – 82N,
indicating that both these measures may have clinical usage. The amount of stress relaxation may
however depend on the magnitude of the peak force. We performed a ‘Pearson Correlation’ on
the two parameters to check for any interdependence. They had a very strong correlation (value
of 0.985) indicating that one parameter could predict the other.
The implementation of this test was most complex. Fabrication of the test apparatus was
extremely intricate and convoluted (Appendix D). Further, there seems to be too many sources of
errors in measurements, which are bound to surface when performed with different set-ups. The
main source of error is the difference in the overall elasticity modulus of the configuration. The
magnitudes of forces invariably differ with differences in the elasticity modulus due to
differences in stress relaxation properties. To make the test more universal, there needs to be
some standards for apparatus characterization. Once the apparatus is set-up the test is simple to
implement on all the cushions.
67

4.4 LOADED CONTOUR DEPTH AND OVERLOAD DEFLECTION
As discussed previously, maximum loads are generally encountered at and around the IT’s.
These loads can be reduced if the cushions can diffuse them across the trochanters and other
femoral components around the IT’s.[26] This can be achieved through envelopment of the
cushion around the pelvis which would not only provide better pressure distribution but also
reduce the magnitudes of load. Envelopment is the ability of the support surface to deform
around irregularities like creases in seat covers or protrusions of bony prominences without
causing substantial increase in pressure.[1] This test focuses on the cushion’s ability to envelop
and immerse. Immersion can be thought of as the vertical displacement of the IT’s from the top-
most portion of the cushion. Immersion facilitates maximal weight distribution over the surface,
thus reducing areas of high-localized pressures around the bony prominences.[1] The potential
for immersion depends on the force-deformation characteristics of the support surface. Softer
surfaces tend to have better immersion properties. However, care must be taken that the cushion
is not “bottoming out”, i.e. the bony prominences are not coming in contact with the cushion
base.
Immersion without envelopment and envelopment without immersion will not give satisfactory
pressure distribution. For example, when a person is sitting on a cushion with low immersion
there will be limited envelopment around the pelvis due to lack of sufficient immersion; if he is
sitting on a cushion with good immersion properties but limited envelopment, in trying to
immerse in the cushion the IT’s will encounter higher reaction loads. Immersion and
envelopment greatly depend not only on the stiffness and compressive behavior of the cushion
materials, but also on the cushion construction. High envelopment is generally achieved on
cushions with low immersion properties by precontouring it. The loaded contour depth test
characterizes these two cushion abilities by measuring the loaded depth of the cushion contour,
taking into account the initial cushion contour and contour produced after loading.
The overload depth test, which constitutes the second part of this method, checks the cushion for
an overload condition, during which there is always the danger of it being bottomed-out. A
68

bottomed-out cushion significantly increases the magnitude of load on the pelvis. A cushion is
often overloaded when a user is leaning, transferring, reaching or performing other day-to-day
activities due to which it is important to maintain a margin of safety in cushioning effect.[40]
This test identifies an overload condition by measuring the amount of deflection resulting from
an increase in load of 33% over the loaded contour test. The cushion is said to be in an overload
condition when an increase in load does not produce a commensurate increase in deflection that
is more than 5mm.[40] This test can also be seen as protection or precaution against cushion
fatigue. If a cushion does not bottom-out in an overloaded state, it will be able to retain its
cushioning properties, at least in the early stages of fatigue.[26] This can also be interpreted as a
test for longevity in cushion endurance.
4.4.1 Apparatus Requirements
A Contour Loading Jig (CLJ), Seat Cushion Thickness Measurement Rig, Force Application
Rig, and a Displacement Gauge are required to perform this test. Following are the ISO
specification for these apparatus. Details of test fixtures developed by our lab based on these
requirements can be found in the Appendix E.
4.4.1.1 Contour Loading Jig (CLJ) A means to load cushions with an indenter representing the ischial tuberosities and trochanters as
follows (Figure 12):
a. Two 50 ± 2mm diameter indenters, centers spaced 120 ± 5mm apart, representing ischial
tuberosities;
b. Two 25 ± 1mm diameter indenters, centers spaced 380 ±10mm apart, representing the
trochanters;
c. A rigid bar 25 ± 1mm wide and 400 ± 20mm long thickness of 10 ± 0.2mm;
d. A 50 ± 2mm wide strap as specified in ECEREG 16FMvSS 209 attached to the bar at 395
± 10mm from the center, using threaded mounting bolts to sandwich the belt between the
25 ± 1mm diameter indenters and the bar. The belt is secured to the bar so that it runs
over 50mm indenters and under the 25mm indenters;
69

e. A Force Application Rig: Means to apply load in the range of 0-180 ± 5N;
f. A Displacement Gauge: Means to measure the displacement of the top surface of the CLI
during loading to an accuracy of ±1mm in the range 0-200mm.
4.4.1.2 Seat Cushion Thickness Measurement Rig
a. A means to measure the thickness of a cushion at a defined location as follows:
employing a 50 ± 2mm diameter circular platen (foot), attached to the Displacement
Gauge mounted on the Force Application Rig with a rigid coupling;
b. Allows vertical displacement of the circular platen;
c. Capable of applying 3 ± 1N vertical load to the cushion;
d. Can be positioned over the test cushion, located 125 ± 2mm forward of the rear edge of
the seat cushion and 55 ± 2mm lateral to the midline;
Note: It may be desirable to design this rig so that the circular platen can be placed at other
points on the top surface of the seat cushion.
70

FIGURE 12: Details of the Contour Loading Jig[40]
71

4.4.2 Loaded Contour Depth and Overload Deflection Test Protocol
This includes details of the test step-by-step procedure, disclosure requirements and the
environment for testing:
Step-by-step Procedure:
1. Precondition and setup the cushion as specified in section 3.3;
Note: If Loaded Contour Depth is the only test being performed, preconditioning for this test
may be done using the LCJ by preconditioning as specified in section 3.3.
2. Place test cushion on a flat, horizontal surface;
3. Measure the cushion thickness in relation to the horizontal supporting surface to the
nearest 1mm at a location 127 ± 25mm from the rear border of the cushion while
applying 3 ± 1N using the Seat Cushion Thickness Measurement rig; contoured cushions
are measured at the lateral edge and convex or flat cushions are measured at midline;
4. Repeat step 3 a further two times and determine the median of the cushion thickness
(Lth) to the nearest 1mm;
Note: A rigid sheet of material of known thickness may be used to insure a consistent
thickness measurement without material deflection; this plank thickness must be subtracted
before recording cushion thickness. Figure 13 illustrates locations of measurement as
described.
5. Place the LCJ in contact with the cushion so that its ischial tuberosities are positioned at
the location intended by the manufacturer;
Note: On flat cushions, the position of the ischial tuberosities of the LCJ is125 ± 25mm
forward of the back edge of the cushion
6. Apply a vertical load of 135N ± 5N;
72

7. Measure the vertical distance from the horizontal supporting surface to the inferior
surface of the LCJ after 300sec to the nearest 1mm (L135);
8. Increase load on LCJ to 180N ± 5N;
9. Re-measure vertical distance from the horizontal supporting surface to the inferior
surface of the LCJ to the nearest 1mm (L180), 60 ± 5sec after the increased load is
applied.
10. Repeat Steps 2-9 two times, for a total of three measurement sets allowing 300 ± 10sec
between measurements.
FIGURE 13: Measurement method for concave and convex seat cushion[40]
73

Test Report
1. The model type and nominal size that uniquely describes the cushion;
2. The cover used;
3. The median of cushion thickness (Lth);
4. The median of the Loaded Contour Depth (LCD) calculated as (Lth – L135) and record
to the nearest 5mm;
5. The median of the Overload Depth (OD) calculated as (L135– L180) and record to the
nearest 5mm.
Test environment
An environment with ambient temperature of 23 ± 2°C and relative humidity 50% ± 5%, which
can be determined as specified in ISO 554-1976(E), should be maintained.
Note: Loading is based upon 110% of the worldwide average mass of 70kg. Ten percent is added
to accommodate variability. Therefore, a 77kg person is being represented. The upper body
imparts the primary load on a cushion and represents approximately 66% of body weight or
51kg. A model or indenter loaded with 51kg represents full loading. A model or indenter loaded
with 25kg represents partial loading (50%).[20] The load of 13.8kg (135N) used in this test is
scaled to represent the portion of the body modeled by the indenter.[26] The 18.3kg (180N) load
used for the overload test is a 33% increase from the loaded depth load (as defined for an
overload condition).
4.4.3 Data Analysis
The data analysis is similar to that done in section 4.2.3. The response parameters in this case are
the cushion thickness, loaded contour depth and the overload depth.
74

4.4.4 Results
Test results for the three parameters are plotted for each cushion in figure 14. The ICC’s for
thickness and loaded depth (LD) are extremely high (table 10), but low for the overload
deflection (OD) test. The RC for the loaded depth and for the overload depth (OD) is within the
resolution of the test (5mm).
TABLE 10: ICC and RC values for LD and OD (rounded data)
Thickness Loaded Depth Overload Deflection
Single rater ICC .9998 .9987 .6660
Average rater ICC .9999 .9996 .8568
RC .71mm 1.75mm 4.77mm
75

0
20
40
60
80
100
120
140
1 2 3 4 5 6 7 8 9 10 11 12 13 14 15 16 17 18 19 20 21
Cushion#
ThicknessLDOD
FIGURE 14: Thickness, LD and OD medians for each cushion (rounded data)
4.4.5 Discussion
The reliability and repeatability of the loaded depth test is very high. As observed in figure 14,
the variations between cushions are very high and vary from 10 – 85mm. The high ICC is an
indication of the same. This test can reliably distinguish between cushions, but the same cannot
be said about the overload test. Its ICC is comparatively lower. There is very little variability
between the measures for this test. They read 0, 5 or 10mm. The low ICC is due to lack of
variability and not lack of repeatability. Hence this test will not be able to distinguish between
cushions efficiently. The primary information we need from this test is if the cushion is
bottoming out in the overload condition. Therefore this test can be constructed to be a binary test,
i.e. a pass or fail test.
76

Both, the loaded depth test and the overload deflection test are extremely precise. Their RC is
1.75mm and 4.77mm respectively, which is lower than the resolution of the test (5mm). To delve
into the rationale behind rounding the data, we calculated and compared the ICC and the RC for
the unrounded data (table 11) with the rounded data (table 10). The loaded depth test gives
similar ICC and RC values for both cases, but the unrounded data display higher repeatability
and precision than the rounded data. For overload deflection, the RC for the unrounded data is
almost one-third the rounded data RC. Even though this will be a non-issue if we convert this
into a binary test, we fail to see the rationale behind rounding the data, especially since it is not
increasing the test accuracy in any way. Even if 5mm could be clinically insignificant with
respect to loaded depth of a cushion, measuring cushion loaded depth to an accuracy of 1mm is
simple and can be easily achieved.
TABLE 11: ICC and RC values for LD and OD (unrounded data)
Thickness Loaded Depth Overload Deflection
Single rater ICC .9998 .9980 .8942
Average rater ICC .9999 .9993 .9621
RC .71mm 1.9mm 1.7mm
Sprigle and Press (2003) did a similar analysis to demonstrate the reliability of the LCD test.[26]
They too displayed high repeatability (rounded data) with the ICC and RC of 0.98 and 2.1mm
respectively for loaded depth and a RC of 1.5mm for the overload depth. This is in agreement
with our loaded depth results. The RC’s for the overload depth test do not match but both are
within the resolution of the test and hence can be deemed acceptable. This encourages the idea of
using RC as a precision statement for each test. This would give the laboratories or
manufacturers an idea of the estimated test precision.
This protocol is unique in a number of ways. The most significant difference is the use of a
different load indenter (figure 12). The main advantage of this indenter lies in its ease of
fabrication. However it has a smaller area of contact as compared to the buttock model, and thus
77

creates acute and complex curvatures on the cushion. Other differences are taking medians of
their results instead of averages, applying different loads and rounding up the measures to the
closest 5mm. Overall this test is straightforward and uncomplicated.
The load deflection test measures cushion deflection at 500N. If we add cushion contour depth
(cushion thickness from LCD test – 8N thickness from load def. test) to this measure, we can
compare the results to the loaded depth test results (figure 15). If these results are similar and/or
are clinically valid then we can do without the loaded depth test. We calculated the ICC to be 0.9
(unrounded data). Further, the two tests had a strong correlation (value of 0.905) between them.
Another thought could be that we can try to perform the load deflection and hysteresis test with
the loaded depth test set-up and check if the results are clinically valid. The basic aim behind
such an investigation is not only to try and get as much information from each test as possible,
but also to try to use similar set ups for different tests.
0
10
20
30
40
50
60
70
80
90
100
1 2 3 4 5 6 7 8 9 10 11 12 13 14 15 16 17 18 19 20 21
(mm)
Load-def_LDLD
FIGURE 15: Comparison between Load-def loaded depth at 500N and LD
78

4.5 RECOVERY
This test has been discussed in details in chapter 3. Following are the data analysis, results and
discussion.
4.5.1 Data Analysis
The data analysis is similar to that done in section 4.2.3. The response parameters in this case are
the cushion thickness (at IT’s), 25sec recovery and 20min recovery.
4.5.2 Results
The test results for 25sec and 20min recovery are plotted in figure 16 and for the thickness in
figure 17. The ICC’s and RC’s are noted in table 12. ICC for thickness and 25sec recovery is
very high. No ICC was calculated for the 20min recovery due to lack of variability in its
measures. The RC for thickness was not calculated due to a systematic trend within its measures.
TABLE 12: ICC and RC values for Recovery
Thickness 25sec recovery 20min recovery
Single rater ICC .9915 .9053 -
Average rater ICC .9971 .9663 -
RC - 0.04 0.06
79

0.8
0.85
0.9
0.95
1
1.05
1 2 3 4 5 6 7 8 9 10 11 12 13 14 15 16 17 18 19 20 21
Cushion#
25sec20min
FIGURE 16: 25sec and 20min recovery averages for each cushion
80

0
10
20
30
40
50
60
70
80
90
100
1 2 3 4 5 6 7 8 9 10 11 12 13 14 15 16 17 18 19 20 21
Cushion#
Rep1Rep2Rep3
FIGURE 17: Recovery Thickness replications
4.5.3 Discussion
We have already discussed the pros and cons of this test in section 3.8. Those findings are only
reiterated when tested on a larger group of cushions. The repeatability of the test is still very high
when tested within the same lab. The 20min recovery measures ranges from 0.97-1.1, with most
measures reading either 0.99 or 1.0. Hence we did not calculate its ICC. These findings support
our previous recommendation for converting this into a binary test. The thickness replication
measures also show the same trend observed previously.
The RC for the 20min recovery test is approximately 0.06, which is greater than the range of
measurements. Hence this test cannot distinguish between cushions. The 25sec recovery
however can reliably test cushions with a precision of 0.04 between its replications. The 25sec
81

recovery ranges from only 0.84 - 0.99, with most measures lying in the range of 0.9 – 0.99. More
specifically, 1 cushion between 0.8 - 0.85, 3 cushions between 0.85 - 0.9, 6 cushions between 0.9
- 0.95 and 11 cushions between .95 - 1.0. Hence, though this test can distinguish between
cushions, most cushions seem to be similar with respect to their short-term recovery.
There were no additional testing issues. This test can be reliably performed on all types of
cushions.
82

5.0 CONCLUSION AND RECOMMENDATIONS
5.1 DEVELOPMENT AND VALIDATION OF THE RECOVERY TEST
Recovery is a very time consuming test. It is easy to set-up and fairly simple to implement. The
loading rig used for preconditioning, can be used to load/unload the cushion. The only new jig
needed is the Circular Loading Rig. The introduction of the CLR has widened the scope of this
test by giving it the ability to measure cushion recovery at any portion of the cushion. The most
critical step in this test is the placement of the circular platen on the cushion. Care must be taken
to ensure that it is accurately placed on the same point on the cushion for all its thickness
measurements. The other two laboratories involved in data collection, did not face any
difficulties in interpreting and implementing the test from the final protocol. The protocol is
precise and well-defined.
Most cushions recover between 90-100% within 25 seconds. But it’s inapt to comment on the
tests’ ability to differentiate between cushions when only 8 cushions have been tested. To
analyze this objectively, we need to test on a lager set of cushions, with varied technologies.
The test has high intra-lab repeatability, but low inter-lab reproducibility. Its reproducibility is
affected due to its sensitivity. It is very difficult to separate the two statistically. But a test can be
clinically significant even though we do not have statistical significance. Statistically, a 5mm
difference in the recovery measurement (which for a 50-70mm cushion is translated into 8-10%
difference in recovery) between labs is not acceptable; but if clinically a 5mm difference is
acceptable, this test could be valid. It will be very difficult to keep cushion recovery thickness
83

variations within 5mm between laboratories. Variation in placement of the circular platen can
create high differences in thickness and recovery measurements. This is particularly true in case
of contoured cushions.
The 20 min recovery test should be converted into a binary test. We have proposed 0.97-1.0 as
the benchmark for cushion recovery. This figure can be re-affirmed through clinical validation.
In conclusion, the test reliability is in question due to lack of reproducibility and variability
between cushions. We cannot think of any major modifications that could make this test less
sensitive. We could try to reduce the time interval for the recovery measurement to 15 seconds,
but this still won’t reduce the variations seen between labs. Before we make such modifications
or draw conclusions about the utility of this test, it is vital to validate its clinical implications. We
must know of it makes a difference that a cushion has recovered 92% instead of 97%. In order to
validate or invalidate this test, we must identify the least meaningful difference that could affect
tissue integrity.
84

5.2 IMPLEMENTATION OF STANDARDIZED PROTOCOLS
The Load-deflection and Hysteresis test displayed high repeatability. The 250N_HI and
500N_HI parameters have a very strong correlation between them. Also the 250N_HI is most
effective, among the three parameters, in its ability to distinguish between cushions. Hence we
can get the required information by calculating only the 250N_HI. There was a systematic trend
between replications. We must increase the recovery time between replications to at least 30mins
to reduce its likelihood.
The set-up for the Lateral and Forward Stiffness test was most complex. We need some
standards for apparatus characterization to avoid inconsistent results between laboratories.
However, the intra-lab repeatability and reliability was very high. There was a strong correlation
between its parameters, with the peak force test more accurate than the 60sec force test.
The Loaded Contour Depth and Overload Deflection test has very simple and well-defined
instrumentation. The loaded contour depth test displays high repeatability and reliability and the
overload deflection test should be converted into a binary one. The unique instrumentation of
this test needs to be clinically validated. If the use of CLJ is clinically acceptable, we can
investigate if it can be used to measure other test parameters like recovery and hysteresis.
Among all the tests in the ISO16840-2, Recovery is the most time consuming one. Even though
this test has high intra-lab repeatability, its reliability is in question due to its poor ability to
distinguish between cushions. We continue to see a trend in the thickness measures. Hence time
interval between tests should be increased to at least 30mins. The long-term recovery test should
be made a binary test.
The RC values calculated for each parameter can be used as a baseline for acceptable variations
between replications. It can be considered as a precision statement for each test. This would help
other laboratories to realize if their instrumentation is being able to achieve the estimated test
precision. We can finalize the RC for each test by comparing the RC’s of each laboratory
85

involved in the development process, and then choosing the apt value. The RC can also help
recognize errors between repeated measures.
We must try to get as much information from each test as possible. Correlations between the
various parameters need to be investigated to avoid redundant information. We can also try to
use the same set up and have different test procedures to measure various cushion parameters.
Before declaring a test reliable and valid, it needs to be verified on five counts:
1. Test implementation
2. Repeatability and reproducibility
3. Ability to distinguish between cushions
4. Clinical resolution
5. Clinical validation
In this study, we have verified test implementation, test repeatability and their ability to
distinguish between cushions. We have high within-lab repeatability for all tests, but inter-lab
reproducibility needs to be established. We have already spoken about reproducibility with
respect to recovery (in the first part of the thesis); we expect similar problems to arise for the
load deflection and hysteresis test. We can define clinical resolution for a particular parameter as
the least meaningful difference between its measures that could affect tissue integrity. So far we
have commented on the tests ability to distinguish between cushions based on statistical results.
But if the clinical resolution for a parameter were low, then even if the parameter can
differentiate between cushions statistically, it may not be clinically significant. For example the
250N_HI has a range of 0.02 - 0.31; if its clinical resolution is 0.15, then we would have to
conclude that its ability to distinguish between cushions is poor. Also we can compare the
clinical resolution to the RC. As long as the RC is lower, we can accept the test repeatability
level. At the same time this does not mean that its clinical utility is being challenged. A
parameter can have very poor ability to distinguish between cushions but can still have clinical
usage. But the clinical utility of every parameter needs to be validated. This can be done by
associating/correlating our test results with clinical outcomes.
86

We can increase the scope of this ISO document by using it to test on older and fatigued
cushions. Identifying the proper time to replace or repair a cushion can have a positive impact on
clinical outcomes. Each cushion has a specific life span. The cushion responses can be expected
to change as they age. However, the effects of aging are different for every cushion. For example
a cushion may have become less resilient with time and use, but may have still retained its
loaded contour depth characteristics. Depending on the patients need, we may or may not have to
replace the cushion. This document can thus help in identifying the cushion life span.
87
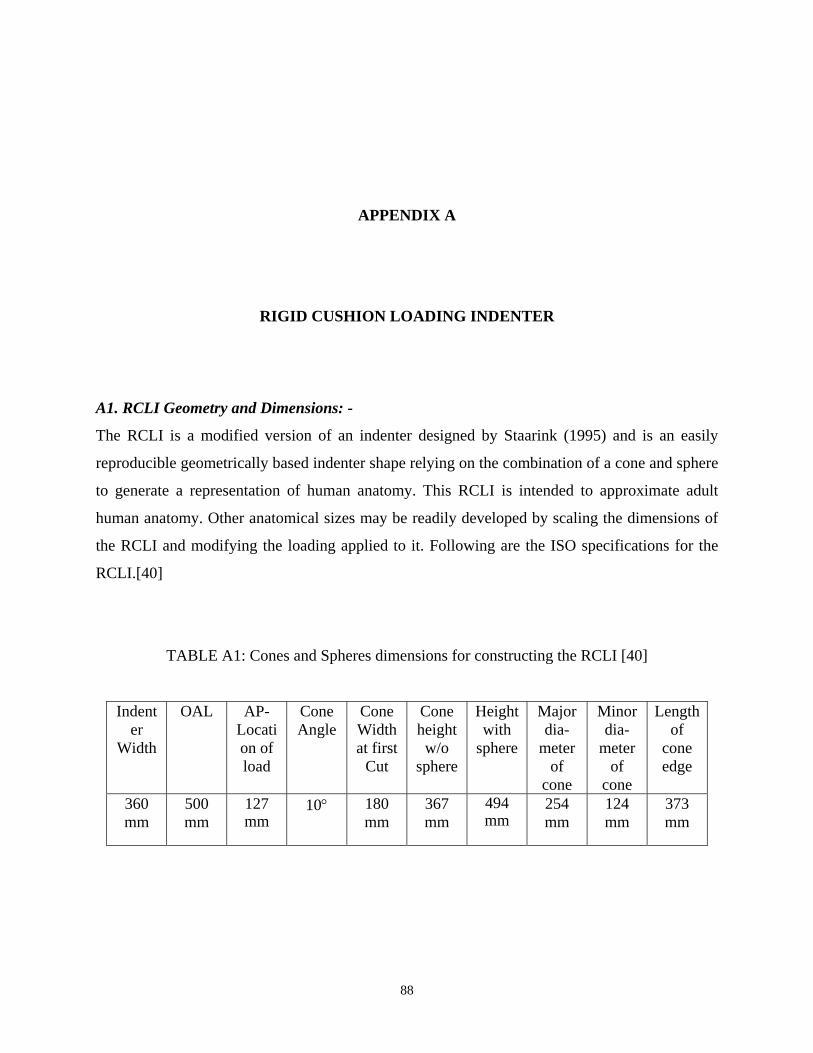
APPENDIX A
RIGID CUSHION LOADING INDENTER A1. RCLI Geometry and Dimensions: -
The RCLI is a modified version of an indenter designed by Staarink (1995) and is an easily
reproducible geometrically based indenter shape relying on the combination of a cone and sphere
to generate a representation of human anatomy. This RCLI is intended to approximate adult
human anatomy. Other anatomical sizes may be readily developed by scaling the dimensions of
the RCLI and modifying the loading applied to it. Following are the ISO specifications for the
RCLI.[40]
TABLE A1: Cones and Spheres dimensions for constructing the RCLI [40]
Indenter
Width
OAL AP-Location of load
Cone Angle
Cone Width at first
Cut
Cone height w/o
sphere
Height with
sphere
Major dia-
meter of
cone
Minor dia-
meter of
cone
Length of
cone edge
360 mm
500 mm
127 mm
10° 180 mm
367 mm
494 mm
254 mm
124 mm
373 mm
88

FIGURE A1: Assembly of components for RCLI [40]
FIGURE A2: RCLI
89

APPENDIX B
TEST SET-UP FOR RECOVERY
B1. Loading Rig: -
We used an Alliance RF/100 MTS (Material Testing System) with a 2000N load cell
(4501011/B) for loading and unloading the cushion. To accommodate the cushion, the circular
loading rig and other attachments, we mounted on it a 25×28”, 1020 carbon steel plate (1” thick).
An adapter made of aluminum alloy 2024 was fabricated to mount the RCLI on the MTS load
cell.
90

FIGURE B1: MTS Base Plate (in inches)
91

(Fig. Continued on next page)
92

FIGURE B2: MTS-RCLI Adapter (in inches)
B2. Circular Loading Rig: -
We fabricated the CLR for measuring the cushion thickness such that it can be placed on the
cushion (without moving it) during testing. It consists of two inverted L-shaped stands on which
the displacement gauge can be rested and removed, without disturbing the cushion. The stands
are mounted on the MTS base plate with the help of C-clamps.
93

Assembly # Manufacturer Description Part#
1 McMASTER-CARR I-Beam clamps 88715T719
2 - L-shaped stand -
3 80/20 Inc. 10 Series extrusion 1” * 1” * 31” not tapped 1010
4 80/20 Inc. 10 Series 1” single shaft base 5050 5 - Bearing made from Delrin (polymer) -
6 - Adhesive backed rule on a slotted 0.75” *
10” solid aluminum rod (1/4 * 20 hole tapped on one end)
-
7 MTS base plate Figure B1 8 - L-shaped stand - 9 - Aluminum C-clamp -
10 - 50mm circular platen with a 1/4 * 20 hole in the center; 0.75” thick -
FIGURE B3: Circular Loading Rig Assembly
94

FIGURE B4: Circular Loading Rig (Automated Set-up)
B3. Manual Set up for Recovery: -
The manual set-up was only a temporary one and was used to investigate the possible difficulties
during testing. We used the lateral and forward stiffness rig as the loading rig (Appendix D) and
the contour loading jig (Appendix E) as the CLR. The cushion was placed on a wooden board
during testing. This board was used to remove the cushion from the loading rig, and could slide
under the CLR for thickness measurements.
95

FIGURE B5: Manual Set Up for Recovery
96

APPENDIX C
TEST SET-UP FOR LOAD-DEFLECTION AND HYSTERESIS TEST C1. Loading Rig: -
We used the same loading rig (MTS) described in Appendix B1. We used the MTS itself to
measure the RCLI displacement. The MTS uses software called test works 4. It was programmed
to perform the entire test without any intervention from the test-operator.
FIGURE C1: Set Up for Load-Deflection
97

APPENDIX D
TEST SET-UP FOR LATERAL AND FORWARD STIFFNESS D1. Lateral And Forward Stiffness Rig: -
The lateral and forward stiffness rig can be divided into four parts:
i. The Cylinder assembly: The air cylinder is used to apply and remove the load off the
cushion by lowering and lifting the RCLI. It is powered by an air cylinder and can be
controlled with the help of a switch.
ii. The Displacement & Force Gauge assembly: A digital dial indicator is used to measure the
RCLI displacement. The cushion is placed on a wooded board, which is placed on a
weighing scale used to verify the load applied on it.
iii. Linear Bearing assembly: The linear bearing assembly consists of: a precision rod that has
the RCLI mounted on one of its end and the other end connected to the cylinder; and a
linear bearing and its housing that has the ability to move linearly in the vertical direction
and pivot about its centre.
iv. Force Transducer assembly: The MTS (Appendix B) is used to pull the RCLI in the
forward direction. The RCLI and the MTS load cell are connected with a rope, which can
be maneuvered with the help of a pulley. The height of the pulley can be adjusted.
98

FIGURE D1: Set Up for Lateral and Forward Stiffness
99

FIGURE D2: (i) Cylinder assembly (ii) Displacement & Force Gauge assembly (iii) Linear Bearing assembly
100

APPENDIX E
TEST SET-UP FOR LOADED CONTOUR DEPTH AND OVERLOAD DEFLECTION E1. Contour Loading Jig: -
Details of the CLJ can be seen in figure 12. In addition, it also requires a force application rig
and a displacement gauge. A slotted aluminum bar is screwed to the CLJ at one end and a flat
aluminum plate on the other end. An adhesive backed rule is stuck onto the slot and the flat plate
is used for loading purpose. The aluminum bar moves vertically through a double flange linear
bearing. Its motion is restricted with the help of a knob. Details of the parts used can be seen
below in table.
TABLE E1: Parts List for CLJ
Qty. Manufacturer Description Part# 4 80/20 10 Series extrusion 1"x1"x11" tapped 1 end 1010 2 80/20 10 Series extrusion 1"x1"x11" not tapped 1010 2 80/20 10 Series extrusion 1"x1"xlong tapped both ends 1010 2 80/20 10 Series extrusion 1"x1"xshort tapped both ends 1010 4 80/20 10 Series square tri-corner connectors 4042 12 1/4-20 x 1" LHSCS 80/20 - 3017* 4 80/20 Connector Bolts 1/4-20x1" 3393 4 80/20 10 Series 5 hole 90º joining plate 4151 20 80/20 1/4-20x1/2" Flanged BHSCS and Econ T-Nut 3321 4 80/20 10 Series Push in Fastener (red/yellow) 3272RED/YEL
101

TABLE E1 (contd)
4 80/20 1010 End cap (blue/gray/red/yellow) 2015BLU/GRA/RED/YEL
1 80/20 10 Series 1" single shaft base 5050 2 80/20 10 Series short double flange linear bearing 6725 1 Slotted solid aluminum rod – 3/4"diam x 16" 1 1/4-20 x 1 1/2" Knob with threaded stud 1 Delrin for bearing and knob 1 Oregon Rule Centimeter Narrow Series adhesive backed rule CN-Y001VU-
TC
FIGURE E1: CLJ with Force and Displacement Gauge
102

BIBLIOGRAPHY
1. Brienza, D. M., & Geyer, M. J. (2000). Understanding support surface technologies. Adv Skin Wound Care, 13(5), 237-244.
2. ECE Regulation 16 FMVSS209.
3. Sprigle, S. (2000). Prescribing pressure ulcer treatment. Rehab Manag, 13(5), 72-77.
4. Sprigle, S. (2004). Categorizing cushions. Rehab Manag, 17(3), 28-30, 32.
5. ISO 554, 1976 Standard atmospheres for conditioning and testing – specifications.
6. Kosiak, M. (1991). Prevention and rehabilitation of pressure ulcers. Decubitus, 4(2), 60-62, 64, 66 passim.
7. EPUAP.Pressure Ulcer Treatment Guidelines. Retrieved September 6, 2004, from http://www.epuap.org/gltreatment.html
8. Yarkony, G. M. (1994). Pressure ulcers: a review. Arch Phys Med Rehabil, 75(8), 908-917.
9. Bayliss, C., & Maugham, L. (2001). Cushion Selection And Prescription For Clients With Spinal Cord Injury. Retrieved NOVEMBER 6, 2004, from http://www.health.qld.gov.au/qscis/PDF/Equipment/Cushion_Selection.pdf
10. Ferguson-Pell, M. W., Wilkie, I. C., Reswick, J. B., & Barbenel, J. C. (1980). Pressure sore prevention for the wheelchair-bound spinal injury patient. Paraplegia, 18(1), 42-51.
11. NPUAP.Tissue Integrity Group (TIG). Retrieved September 12, 2004, from http://www.npuap.org/PDF/research_priorities.pdf
12. Kurfuerst, S., & Chew, F. (2003). Cushion conclusions. Rehab Manag, 16(7), 52-56.
13. Dharmarajan TS, U. J. (2002). Pressure ulcers in older adults: clinical features and management. Hospital Physician, 38(3), 64-71.
14. DLF Factsheet Choosing pressure relief equipment. Retrieved Sep 7, 2004, from http://www.dlf.org.uk/factsheets/pdf/Choosing_pressure_relief_equipment.pdf
103

15. Sprigle, S. (2000). How and Why Wheelchair Cushions Differ. Retrieved September 6, 2004, from http://www.spinlife.com/spintips/spintipsdetails.cfm?typeid=172&artid=107
16. The Importance of Cushions. Retrieved September 6, 2004, from http://www.spinlife.com/advisor/advisorcuArt.cfm
17. Patel, S., Knapp, C. F., Donofrio, J. C., & Salcido, R. (1999). Temperature effects on surface pressure-induced changes in rat skin perfusion: implications in pressure ulcer development. J Rehabil Res Dev, 36(3), 189-201.
18. Stockton, L. (2000). Guide to choosing the right pressure-reducing cushion. Community Nurse, 6(2), 33-34.
19. Choosing The Right Cushion. Retrieved September 6, 2004, from http://www.varilite.com/seats/choosing_seating.htm
20. Sprigle, S., Press, L., & Davis, K. (2001). Development of uniform terminology and procedures to describe wheelchair cushion characteristics. J Rehabil Res Dev, 38(4), 449-461.
21. Geyer, M. J., Brienza, D. M., Bertocci, G. E., Crane, B., Hobson, D., Karg, P., et al. (2003). Wheelchair seating: a state of the science report. Assist Technol, 15(2), 120-128.
22. Sprigle, S. (1992). The Match Game: Material characteristics of wheelchair cushions are as varied as the needs of wheelchair riders. TeamRehab Report, 20-21.
23. Sprigle, S. (2003). [seat pressure] recovery. In [email protected] (Ed.).
24. Wheelchair Seating — Part 2: Tissue Integrity Management Devices; Commentary on friction and shear (Goosens and Bain); pp 15-20. (2000). Retrieved October 1, 2004, from http://www.wheelchairstandards.pitt.edu/WCS_S/WCS_S_ISO/WCS_S_ISO_WG11/WCS_S_ISO_WG11_pdf/WCS_S_ISO_WG11_Stds_pdf/DraftPM_Stockholm.pdf
25. Greenberg, B. (2003). A Look at Wheelchair Cushions. QUEST, 10(4).
26. Sprigle, S., & Press, L. (2003). Reliability of the ISO wheelchair cushion test for loaded contour depth. Assist Technol, 15(2), 145-150.
27. Matthews, D., & Roberts, D. (2002). Support surfaces. A strategic approach to investing in prevention and treatment support surfaces. Director, 10(4), 113-114.
28. ISO, Retrieved October 6, 2004, from http://www.iso.org/iso/en/aboutiso/introduction/index.html
29. Fitzgerald, S. G., Thorman, T., Cooper, R., & Cooper, R. A. (2001). Evaluating Wheelchair Cushions. Rehab Manag.
104

30. Karg, P., & Sprigle, S. (1991). Static fatigue of compression packaging. University of Virginia REC, Technical Report No. UVA-REC 101-191.
31. Karg, P., & Sprigle, S. (1991). Shear characteristics of foam mattress overlays. University of Virginia REC, Technical Report No. UVA-REC 102-191.
32. Garber, S. L., & Rintala, D. H. (2003). Pressure ulcers in veterans with spinal cord injury: a retrospective study. J Rehabil Res Dev, 40(5), 433-441.
33. ISO-CD -16840-2, Wheelchair Seating — Part 2: Test methods for determining the physical and mechanical characteristics of devices intended to manage tissue integrity – Seat Cushions. (2002). Retrieved April 30, 2003, from http://www.wheelchairstandards.pitt.edu/WCS_S/WCS_S_ISO/WCS_S_ISO_WG11/WCS_S_ISO_WG11_pdf/WCS_S_ISO_WG11_Stds_pdf/16840-2_ver2002-10-20.pdf
34. Ferguson-Pell, M. W. (1990). Seat cushion selection. J Rehabil Res Dev Clin Suppl(2), 49-73.
35. Sprigle, S. (1990). Testing segmented polyurethane wheelchair cushions. University of Virginia REC.
36. Braden, B., & Bergstrom, N. (1987). A conceptual schema for the study of the etiology of pressure sores. Rehabil Nurs, 12(1), 8-12.
37. Lyder, C. H., Preston, J., Grady, J. N., Scinto, J., Allman, R., Bergstrom, N., et al. (2001). Quality of care for hospitalized medicare patients at risk for pressure ulcers. Arch Intern Med, 161(12), 1549-1554.
38. Susan Bulger, M., RN, PHN, AXIS Healthcare. (2002). Developing a Skin Integrity Quality Program for Person with Physical Disabilities. Center for Health Care Strategies, Inc.
39. Marwick, C. (1992). Recommendations seek to prevent pressure sores. Jama, 268(6), 700-701.
40. ISO/DIS -16840-2, Test methods for determining the physical and mechanical characteristics of devices intended to manage tissue integrity –Part 2 Seat Cushions. (2003). Retrieved November 3, 2003, from http://www.wheelchairstandards.pitt.edu/WCS_S/WCS_S_ISO/WCS_S_ISO_WG11/WCS_S_ISO_WG11_pdf/WCS_S_ISO_WG11_Stds_pdf/ISO_16840_2_DIS.pdf
41. Design & Application guide, Resilience. Retrieved 11/1/2004, 2004, from http://www.moldeddimensions.com/resilience.htm
42. Allman, R. M. (1997). Pressure ulcer prevalence, incidence, risk factors, and impact. Clin Geriatr Med, 13(3), 421-436.
43. NPUAP.Statement on Pressure Ulcer Prevention. Retrieved February, 2005, from http://www.npuap.org/positn1.html
105

44. Rogers, D., & Francis, P. (2003, July). Pressure Ulcer Prevention and Management Guidelines. Retrieved September 2, 2004, from http://www.whittington.nhs.uk/clickthrough.asp?c=1799
45. Carison, J. M., Payette, M. J., & Vervena, L. P. (1995). Seating Orthosis Design for Prevention of Decubitus Ulcers. JPO, 7(2), 51-60.
46. Crenshaw, R. P., & Vistnes, L. M. (1989). A decade of pressure sore research: 1977-1987. J Rehabil Res Dev, 26(1), 63-74.
47. Bar, C. A. (1991). Evaluation of cushions using dynamic pressure measurement. Prosthet Orthot Int, 15(3), 232-240.
48. Bennett, L., Kavner, D., Lee, B. Y., Trainor, F. S., & Lewis, J. M. (1984). Skin stress and blood flow in sitting paraplegic patients. Arch Phys Med Rehabil, 65(4), 186-190.
49. Bennett, L., Kavner, D., Lee, B. Y., Trainor, F. S., & Lewis, J. M. (1981). Skin blood flow in seated geriatric patients. Arch Phys Med Rehabil, 62(8), 392-398.
50. Brienza, D. M., Geyer, M. J., & Karg, P. (2001). White Paper on Pressure Management. Retrieved September 5, 2004, from http://www.rercwm.pitt.edu/RERCWM_PDF/Pressure.pdf
51. Kaye, H. S., Kang, T., & LaPlante, M. P. (2000). Disability Statistics Report – Mobility Device Use in the United States. Washington, DC: US Dept. of Education, National Institute of Disability and Rehabilitation Research.
52. Krouskop, T., & van Rijswijk, L. (1995). Standardizing performance-based criteria for support surfaces. Ostomy Wound Manage, 41(1), 34-36, 38, 40-35.
53. Brienza, D., Karg, P., Geyer, M. J., Kelsey, S., & Trefler, E. (2001). The relationship between pressure ulcer incidence and buttock-seat cushion interface pressure in at-risk elderly wheelchair users. Arch Phys Med Rehabil 2001, 82(4), 529-533.
54. Goossens, R. H., Zegers, R., Hoek van Dijke, G. A., & Snijders, C. J. (1994). Influence of shear on skin oxygen tension. Clin Physiol, 14(1), 111-118.
55. Bennett, L., Kavner, D., Lee, B. K., & Trainor, F. A. (1979). Shear vs pressure as causative factors in skin blood flow occlusion. Arch Phys Med Rehabil, 60(7), 309-314.
56. Cochran, G., & Slater, G. (1973). Experimental evaluation of wheelchair cushions: report of a pilot study. Bull Prost Res Fall, 10(20), 29-61.
57. Cochran, G. V., & Palmieri, V. (1980). Development of test methods for evaluation of wheelchair cushions. Bull Prosthet Res, 10-33, 9-30.
58. Kosiak, M. (1961). Etiology of decubitus ulcers. Arch Phys Med Rehabil, 42, 19-29.
106

59. Stewart, S. F., Palmieri, V., & Cochran, G. V. (1980). Wheelchair cushion effect on skin temperature, heat flux, and relative humidity. Arch Phys Med Rehabil, 61(5), 229-233.
60. Fisher, S. V., Szymke, T. E., Apte, S. Y., & Kosiak, M. (1978). Wheelchair cushion effect on skin temperature. Arch Phys Med Rehabil, 59(2), 68-72.
61. Bland, J. M., & Altman, D. G. (1999). Measuring agreement in method comparison studies. Stat Methods Med Res, 8(2), 135-160.
62. Mahanty, S. D., Roemer, R. B., & Meisel, H. (1981). Thermal response of paraplegic skin to the application of localized pressure. Arch Phys Med Rehabil, 62(12), 608-611.
63. Reger, S. I., Adams, T. C., Maklebust, J. A., & Sahgal, V. (2001). Validation test for climate control on air-loss supports. Arch Phys Med Rehabil, 82(5), 597-603.
64. Wildnauer, R. H., Bothwell, J. W., & Douglass, A. B. (1971). Stratum corneum biomechanical properties. I. Influence of relative humidity on normal and extracted human stratum corneum. J Invest Dermatol, 56(1), 72-78.
65. Krouskop, T. A., Reddy, N. P., Spencer, W. A., & Secor, J. W. (1978). Mechanisms of decubitus ulcer formation--an hypothesis. Med Hypotheses, 4(1), 37-39.
66. Reddy, N. P., & Cochran, G. V. (1981). Interstitial fluid flow as a factor in decubitus ulcer formation. J Biomech, 14(12), 879-881.
67. Sprigle, S. (1991). Effect of cover on segmented cushion deflection. University of Virginia REC.
68. Reddy, N. P., Patel, H., Cochran, G. V., & Brunski, J. B. (1982). Model experiments to study the stress distributions in a seated buttock. J Biomech, 15(7), 493-504.
69. Sprigle, S., Wheelchair cushions: Tests for Horizontal stiffness and Sliding Tendency. Retrieved September 23, 2004, from http://www.wheelchairstandards.pitt.edu/WCS_S/WCS_S_RESNA/WCS_S_RESNA_WG_PM/WCS_S_RESNA_WG_PM_pdf/WCS_S_RESNA_WG_PM_RefDoc_pdf/sliding%26horizstiffness%20doc.pdf
70. Wheelchair Cushions (Reviewed for New E Codes) Product Classification List. Retrieved March 21, 2005, from http://www2.palmettogba.com/classifications/wheelchair%20cushions%20new%20k%20codes.pdf
107