Embed Size (px)
Citation preview

EPA 440/1-75/042a
Group L Phase II
Development Document for
Effluent Limitations Guidelines and
New Source Performance Standards
for the
FORMULATED FERTILIZER
Segment of the
FERTILIZER MANUFACTURING
Point Source Category
llNITED STATES ENVIRONMENTAL PROTECTION AGENCY
JANUARY 1975
DEVELOPMENT DOCUMENT
for
EFFLUENT LIMITATIONS GUIDELINES
and
NEW SOURCB PERFORMANCE STANDARDS
for the
FORMULATED FERTILIZER SEGMENT of the
FERTILIZER MANUFACTURING POINT SOURCE CATEGORY
Russell E. Train Administrator
James L. Agee Assistant Administrator for
Water and Hazardous Materials
Allen Cywin Director, Effluent Guidelines Division
Elwood E. Martin Project Officer
January, 1975
Effluent Guidelines Division Office of Water and Hazardous Materials
U.S. Environmental Protection Agency Washington, D.C. 20460
For BIiie b:, the Superintendent of DOCWDeDta, U.S. Government Printing Office, Washington, D.C. 200l'l. Price $1.40


ABSTRACT
This document presents the findings of an in-depth technical study (Phase II) conducted by Davy Powergas, Inc., on those fertilizer processes not included in the original (Phase I) study under Contract Number 68-01-1508, Mod. #1. The purpose was to determine industry control practices, water effluent treatment technologies, and cost data related to these items as information from which meaningful effluent guidelines could be developed to implement the Federal Water Pollution Control Act Amendments of 1972.
The fertilizer industry has seven distinctly separate subcategories which have different pollutants, effluent treatment technologies, and water management problems. These subcategories are Phosphate, Ammonia, Urea, Ammonium Nitrate, Nitric Acid, Ammonium Sulfate and Mixed and Blend Fertilizers. In this Phase II study, only ammonium sulfate manufacture as a synthetic and a coke oven by-product material and the mixed and blend fertilizer processes are included. The mixed and blend fertilizers in combination represent by an overwhelming majority the largest number of individual process plants in the overall fertilizer category.
Functions performed in the survey included data gathering, sample collection and analysis, and visitations with responsible plant operating personnel to obtain verifiable information on treatment technology in commercial use and in development.
For the Phase II fertilizer processes of interest, the effluent treatment technologies consist entirely of treatment technologies now in use in the better plants. Use of these technologies coupled with good water management make the recommended best practicable control technology currently available, best available technology economically achievable, and new source performance standards identical and capable of no discharge of process waste water pollutants to navigable waters.
iii

Section
I
II
III
IV
V
VI
VII
VIII
IX
X
XI
XII
XIII
XIV
CONTENTS
CONCLUSIONS
RECOMMENDATIONS
IN'J"~ODUCTION
INDUSTRY CATEGORIZATION
WASTE CHARACTERIZATION
SELECTION OF POLLUTANT PARAMETERS
CONTROL AND TREATMENT TECHNOLOGY
COSTr ENERGY AND NONWATER QUALITY ASPECTS
BEST PRACTICABLE CONTROL TECHNOLOGY CURRENTLY AVAILABLEr GUIDELINES AND LIMITATIONS
BEST AVAILABLE TECHNOLOGY ECONOMICALLY ACHIEVABLEr GUIDELINES AND LIMITATIONS
NEW SOURCE PERFORMANCE STANDARDS AND PRETREATMENT STANDARDS
ACKNOWLEDGEMENTS
REFERENCES
GLOSSARY
V
3
5
31
35
41
47
53
57
61
63
65
67
71

FIGURES
fig~~
1 Ammonium Sulfate - Synthetic Plant Locations
2
3
4
5
6
7
8
9
10
11
Ammonium Sulfate - By-Product Plant Locations
Ammonium sulfate Flow Sheet - Synthetic
Ammonium Sulfate Flow Sheet - Coke Ovens
Blend Fertilizer - Plant Locations
Mixed Fertilizer - Plant Locations
Mixed Fertilizer Flow Sheet
Blend Fertilizer Flow Sheet
Ammonium sulfate Plant - Effluent control
Mixed Fertilizer Process - Effluent Control
Blend Plants - Airborne solids control
vi
Pag~
15
16
19
20
23
24
29
30
49
51
52

~Qle
1 Cost Summary Table
2 Metric Units
TABLES
vii
Page
54
72


SECTION I
CONCLUSIONS
The fertilizer industry subcategories established in the original "Development Document for Effluent Limitations Guidelines and Standards of Performance" document were also utilized in this Phase II study namely, phosphate, ammonia, ammonium nitrate, urea, and nitric acid.
Phase II includes ammonium sulfate produced as both a synthetic and as a coke oven by-product material and the mixed fertilizer and blend fertilizer materials.
In both of the subcategories the treatment technologies do exist and are commercially practiced to meet the proposed best practical control technology currently available, best available technology economically achievable, and which will allow new plants to also meet the proposed guidelines without changes in process design or equipment.
1


SECTION II
RECOMMENDATIONS
Ammonium Sulfate Production Subcategory >(
The proposed effluent limitation representing the degree of effluent reduction attainable through application of the best practicable control technology currently available, best available technology economically achievable and best demonstrated control technology in the production of ammonium sulfate - both synthetic and coke oven by-product -is no discharge of process waste water pollutants to navigable waters.
Mixed and Blend Fertilizer Production Subcategory
The proposed effluent limitation representing the degree of effluent reduction attainable through application of the best practicable control technologies currently available, best available technology economically achievable and best demonstrated control technology from both the mixed fertilizer and blend fertilizer process plants is no discharge of process waste water pollutants to navigable waters.
3


SECTION III
INTRODUCTION
Section JOl(b) of the Act requires the achievement by not later than July 1, 1977, of effluent limitations for point sources, other than publicly owned treatment works, which are based on the application of the best practicable control technology currently available as defined by the Administrator pursuant to Section 304(b) of the Act. Section 30l(b) also requires the achievement by not later than July 1, 1983, of effluent limitations for point sources, other than publicly owned treatment works. These are to be based on the application of the best available technology economically achievable which will result in reasonable further progress toward the national goal of eliminating the discharge of all pollutants, as determined in accordance with regulations issued by the Administrator pursuant to Section 304(b) of the Act. Section 306 of the Act requires the achievement by new sources of a Federal standard of performance providing for the control of the discharge of pollutants which reflects the greatest degree of effluent reduction which the Administrator determines to be achievable through the application of the best available demonstrated control technology, processes, operating methods, or other alternatives, including, where practicable, a standard permitting no discharge of pollutants.
Section 304(b) of the Act requires the Administrator to publish within one year of enactment of the Act, regulations providing guidelines for effluent limitations setting forth the degree of effluent reduction attainable through the application of the best practicable control technology currently available and the degree of effluent reduction attainable through the application of the best control measures and practices achievable including treatment techniques, process and procedure innovations, operation methods and other alternatives. The regulations proposed herein set forth effluent limitations guidelines pursuant to Section 304{b) of the Act for the fertilizer manufacturing category of point sources.
Section 306 of the Act requires the Administrator, within one year after a category of sources is included in a list published pursuant to Section 306 (b) (1) (a) of the Act, to propose regulations establishing Federal Standards of performances for new sources within such categories. The Administrator published in the Federal Register of January
5

16, 1973 (38 F.R. 1624), a list of 27 source categories. Publication of the list constituted announcement of the Administrator's intention of establishing, under section 306, standards of performance applicable to new sources within the fertilizer manufacturing category of point sources, which was included within the list published January 16, 1973.
The effluent limitations guidelines and standards of performance presented in this report were developed from operating data, samples, and information gathered from some fifteen (15) plants. The methods and procedures used in the accumulation of that overall information are described in the following paragraphs.
Summary Qf Methods ysed for Development of 1he Effluent Limitations Guidelines ang Standards of Performance
The effluent limitations guidelines and standards of performance presented herein were developed in the following manner. The point source category was first studied for the purpose of determining whether separate limitations and standards are appropriate for different segments within the category. This analysis included a determination of whether differences in raw material used, product produced, manufacturing process employed, age, size, waste water constituents, and other factors require development of separate limitations and standards for different segments of the point source category.
The raw waste characteristics for each such segment were then identified. This included an analysis of (1) the source of flow and volume of water used in the process employed and the sources of waste and waste waters in the plant; and (2) the constituents (including thermal) of all waste waters, including toxic constituents and other constituents which result in taste, odor, and color in the water or aquatic organisms. The constituents of the waste waters which should be subject to effluent limitations guidelines and standards of performance were identified.
The range of control and treatment technologies existing within each segment was identified. This included an identification of each distinct control and treatment technology, including both in-plant and end-of-process technologies, which are existent or capable of being designed for each segment. It also included an identification of, in terms of the amount of constituents (including thermal) and the effluent level resulting from the application of each of the treatment and control
6

technologies. The problems, limitations and reliability of each was also identified. In addition, the nonwater impact of these technologies upon other pollution problems, including air, solid waste, noise and radiation were also identified. The energy requirements of each control and treatment technology was identified as well as the cost of the application of such technologies.
The information, as outlined above, was then evaluated in order to determine what levels of technology constituted the "best practicable control technology currently available", the "best available technology economically achievable" and the "best available demonstrated control technology, processes, operating methods, or other alternatives". In identifying such technologies, various factors were considered. These included the total cost of application of technology in relation to the effluent reduction benefits to be achieved from such application, the age of equipment and facilities involved, the process employed, the engineering aspects of the application of various types of control techniques, process changes, nonwater quality environmental impact (including energy requirements), and other factors.
Delineation of Study
of from from
in the in the
The effluent limitation guidelines and standards performance proposed in this report were developed operating data, samples, and information gathered fifteen (15) plants. The methods and procedures used accumulation of that overall data is described following paragraphs.
Identification and categorization of the four (4) processes covered in this report were made during the preparation of the Phase I portion of the industry report on Basic Fertilizer Chemicals. The four processes covered in this Phase II portion of the Formulated Fertilizer report and the corresponding standard Industrial classification (SIC) codes are defined as:
MIXED FERTILIZER, SIC Codes 2874 and 2875
This process is defined as one which mixes (wet or dry) straight and mixed fertilizer materials through chemical reaction into complete N-P-K fertilizer goods. By fertilizer terminology it includes three types of plants:
7

B type - Dry mixing plant that mixes wet or dry, straight and mixed fertilizer materials through chemical reaction, into complete mix goods.
C type - Does same as B type except that normal superphosphate is also produced on site.
D type - Does same as Band c types plus the manu-facture of sulfuric acid.
BLEND PLANT, SIC Code 2875
This process is defined as one which physically mixes dry straight and mixed granular fertilizer materials to a given N-P-K formulation. By fertilizer terminology it is specified as an A type plant.
AMMONIUM SULFATE - Steel mill By-Product, SIC Code 2873 .... AMMONIUM SULFATE - Synthetic, SIC Code 2873
The objective was to categorize the many processes into the least number of units that are practical for the end purpose of water effluent monitoring and structuring of specific fertilizer complexes for EPA and State enforcement officials. Categorization inherently included determination of those point sources which required separate limitations and standards. The overall concept was to provide sufficient definition and information on an unitized basis to allow application of a building block principle. such classification of data readily permits the structuring of total water effluent information for any specific fertilizer complex regardless of the multiplicity of processes comprising its make-up.
Bases for Definition of Technology Levels
The validated data and samples obtained from the fifteen plants were the primary basis for choosing the levels of technology which were considered to be the "best practicable control technology currently available", the "best available technology economically achievable," and the "best available demonstrated control technology, process operating methods, or other alternatives". This selection of the separate technologies, of necessity, required consideration of such additional factors as evaluation of the engineering and operational problems associated with the technology, effect on existing processes, total cost of the technology in relation to the effluent reduction that would ce realized,
8

energy requirements and cost, the range of control variations on contaminant concentration and/or guantity, and non-water quality environmental impact. Information regarding the influence of these diverse factors was obtained from a number of sources. These sources include government research information, published literature, trade organization publications, information from c:ualified consultants, and cross reference with related technologies utilized in other industries.
Implementatio,n
The value of a study such as this is entirely dependent upon the quality of the data from which it is made. Particular attention was, therefore, directed to selecting criteria for determining the commercial installations to be visited and from which to collect information.
The multiplicity of plants, wide geographical distribution (particularly blend plants), and the wide range of plant capacities (300 to 876,000 TPY) made the Phase I concept of selecting only exemplary plants for the study impractical. The selection of plants was based primarily on consideration of geographical location. Plants of all different capacities in the states of Alabama and Illinois were selected for the study. These two states were considered representative of the two general geographical areas, Southeast and west North central, with the highest process plant density coupled with good proximity of the two subcategories to each other.
Contact was then made with plants in the two selected areas to establish a time for a screening visit. The screening visit had the objective of informing the plant manager on the purpose and intent of the study. Information acquired during the visit was used to determine whether that particular plant was to be included in the study or whether there were other plants and/or conditions which better exemplified industry standards. As in the Phase I study a variety of situations were encountered. These ranged from decisions not to include a specific plant, although exemplary, to learning of another plant which could add a different dimension or production level to the study. It was found that a very small percentage of the plants had records of either water or air effluent streams.
A comparative evaluation was made of the various plants visited. This evaluation was based upon the criteria used in the Phase I study. It consisted of the following points:
9

l) Discharge Effluent Quantities
Installations with low effluent quantities and/or the ultimate of "no discharge".
2) Effluent contaminant Level
Installations with low effluent contaminant concentrations and quantities.
3) ~ffluent Treatment Method and Effectiveness
Use of best currently available treatment methods, operating control, and operational reliability.
4) Water Management Practice
Utilization of good management practices such as main water re-use, planning for seasonal rainfall variations, in-plant water segregation and proximity of cooling towers to operating units where airborne contamination can occur.
5) Land Utilization
Consideration of land area involved in water effluent control system with the most acceptable being those with the least area.
6) Air Pollution Control
Those plants with the most comprehensive and effective air pollution control. In turn liquid effluent from such plants may represent the most serious water effluent condition.
7) Geographic Location
Those facilities in close proximity to sensitive vegetation, high population density, land availability, and areas where local or state standards are most restrictive.
8) Management Operating Philosophy
Plants whose management insists upon effective equipment maintenance and housekeeping practices.
9) Raw Materials
Installations utilizing different effluent contaminants differ in tration.
10
raw materials where impurity type or concen-

10) Diversity of Processes
On the basis that other criteria are met, then consideration was given to installations having a multiplicity of fertilizer processes.
Each of the above criterion were assigned a numerical values to allow a comparative evaluation different plants visited in each process category.
Sampling collection and Validation of Data
range of of the
The most obtain data conditions Steps and sampling, accomplish
important item in a study of this nature is to representative of a given process under all of operation and range of production rates. procedures used in selecting data, stream and sample analysis were all designed to
this goal to the best possible degree.
An important step toward this objective was the assignment of only highly experienced operating personnel to the field work. Three·persons were used. The fertilizer plant operating experience of these three people ranged from a minimum of 16 years to 24 years. With such operational knowledge it was possible to expeditiously select data, identify specific process streams for sampling, and conduct sampling under readily discernible plant operating conditions. The points considered and identified in all data collection, sampling, and validation were:
1) Segregation of process effluent streams so that only an identifiable single process and/or piece of equipment was represented.
2) Collection of data and samples at different states of process conditions such as normal steady state, plant washout when such a procedure is followed on a routine basis, upset process condition, operation at above/below plant design rate, and during shutdown conditions if effluent flow occurs.
3) Evaluation of the effect if any of seasonal rainfall, particularly on non-point effluent and ponds.
4) Establishment of devices and/or other effluent flows.
the existence of flow measurement means of quantitatively measuring
5) Making positive identity of the type, frequency, and handling of the samples represented by collected data -
11

i.e., such items as grab, composite, or continuous type; shift, daily, or weekly frequency, etc. All samples collected by the contractor were composite samples.
6) Validation of data, via intimate knowledge of plant laboratory analytical procedures used for sample analysis, check samples analyzed by independent laboratories. and/or DPG sampling under known and defined process conditions with sample analysis by an accredited commercial laboratory, was conducted on each plant which had liquid effluents. A total of 15 plants were visited. Data was collected by DPG from seven of these plants. Verified data on ammonium sulfate production was also obtained from another contractor who had collected data in two large complexes which included ammonium sulfate manufacturing facilities.
GENERAL DESCRIPTION OF THE INDUSTRY
The u. s. fertilizer industry has undergone such significant changes in the past thirty years that it has lost its old stigma of "mud chemistry". The sledge hammer and shovel days have been replaced by large, modern, fume free, plants operated from an air conditioned control room.
Eighty percent of the volume of agricultural chemicals used today are materials that were not available in their present form at the time of World war II. Fertilizer use today, in terms of plant nutrients, is four and one quarter times as great as it was in 1940. On the assumption that this fertilizer is properly used, it represents one of the major reasons why farm yields are up and unit costs are lower. It has been estimated that the use of commercial fertilizer saves the U. s. public $13 billion a year on food bills or about $70 a year per person. Large scale centrifugal compressor ammonia plants, increasing single train plant capacities from 90 - 180 to 1400 - 1800 kkg/day (100 - 200 to 1500 - 2000 tons/day); sulfuric acid plant capacity increased from 270 - 450 to 1800 kkg/day (300 - 500 to 2000 tons/day); and development of ammonium phosphate granule fertilizers illustrate the dramatic technology change.
Fertilizer industry jargon identifies two types of product -nonmixed and mixed. Straight fertilizers are defined as those which contain only a single major plant nutrient. Mixed fertilizers are defined as those which contain two or more primary plant nutrients. Mixed fertilizers can be produced by chemically reacting different ingredients and utilizing the chemical reaction as the binding force; or simply by mechanically blending together straight
12

fertilizers. straight and States.
The following tabulation lists mixed fertilizers produced
the principal in the United
Straight Fertilizers Mixed Fertilizers
Nitrogen Fertilizers
Ammonia Urea Ammonium Nitrate
*Ammonium Sulfate
fhos!2hate Fertilizers
Phosphoric Acid Normal Superphosphate Triple Superphosphate
Ammonium Phosphates *Mixed Fertilizers *Blend Fertilizers
* Processes included in this study.
This Phase II portion of the Basic Fertilizer Chemicals study considers only those fertilizer processes not included in the Phase I study scope - namely Ammonium Sulfate and Mixed and Blend Fertilizers.
Ammonium Sulfate Manufacturing
Ammonium sulfate is one of the older forms of nitrogen fertilizer and is still used in significant quantity. It is, however, the one nitrogen fertilizer material in the U. s., which with the exception of 1972, has a history of gradual production decrease. Production records of recent years are shown below:
1966 1967 1968 1969 1970 1971 1972
Ammonium Sulfate Production Tons per Year
2,859,505 2,824,255 2,723,267 2,563,724 2,483,985 2,359,800 2,419,000
This unusual situation is attributed to the spectacular popularity and corresponding production increases of diammonium phosphate {DAP) as a mixed fertilizer material.
13

Ammonium sulfate (AS) and DAP have approximately equal N contents - nominal 21% and 18% respectively. DAP, however, has both a chemical and physical advantage over AS. The chemical advantage is that it also has a nominal 48% P2O5. This in turn means shipping and storage cost advantages to the mixed fertilizer manufacturers. The physical advantage is that DAP is a granular rather than a crystalline material and, therefore, is more compatible with other straight or mixed fertilizers for either granulation or dry blending.
There seems to be little question that ammonium sulfate's percentage of total N market will continue to decrease although production tons may hold relatively steady and even possibly increase. This possible increase in tonnage would be a result of by-product material from rapidly increasing caprolactum and acrynitrile production rather than from new AS manufacturing facilities. The rapid increase in synthetic fibers demand (nylon and acrylic) for which caprolactum and acrynitrile are production intermediates means that 1.0 to 5.0 tons of AS will come on the market for every 1.0 ton of intermediates produced.
Ammonium sulfate is generated from basically three sources -synthetic, chemical, and coke oven. Synthetic AS is produced by the direct combination of virgin ammonia and sulfuric acid. Chemical AS is produced as a by-product of the above mentioned synthetic fiber intermediates. Coke oven AS is produced from ammonia reclaimed from the coking of coal by absorption with sulfuric acid. Only AS as produced synthetically and from coke oven gas are covered in this report. Chemical AS is covered in a separate industrial category. Today there are six synthetic plants and approximately 46 coke oven units. The greatest concentration of coke oven plants is in the steel producing states, particularly Ohio and Pennsylvania. Locations of synthetic and coke oven AS plants are indicated on Figures 1 and 2.
General
Ammonium sulfate (AS) has been an important nitrogen fertilizer source for many years. one of the early reasons for AS's rise to importance as a fertilizer material was due to the fact that it developed as a by-product from such basic industries as steel and petroleum manufacturing. That reason is still the primary basis for AS's importance. In fact, it now has the same status in the rapidly growing synthetic fibers industry. AS's role as a by-product from such large and basic industries insures that it will continue to be an important source of U.S. nitrogen
14

I-' I.JI
FIGURE 1

FIGURE 2
AMMONIUM SULFATE - BY PRODUCT
PLANT IDCATIQNS

fertilizer tonnage. An additional reason for the continuing importance of AS is the growing awareness of the agronomic need for sulfur addition to many soils.
Ammonium sulfate is a versatile fertilizer material. It can be used as a straight fertilizer for direct application, as a raw material for production of blend fertilizer, and as a raw material for production of mixed fertilizer. AS is a crystalline material which exhibits those desirable physical fertilizer characteristics, such as being freeflowing and relatively non-caking, when additives are used. Agronomically AS is suitable for use on most crops. It is especially compatible and desirable for rice, tobacco, tea, cocoa and millet.
The emphasis on environmental improvement is another issue which is expected to affect future AS production. Specific reference is to the restrictions on sulfur oxides emission. The air pollution control processes for removal of sulfur oxides either from commercial products such as natural gas, petroleum and coal or end-of-process streams such as exhaust gases from sulfuric acid and power generation plants all have a sulfur base compound as an end product. Sizeable quantities of these end products are expected to end up as fertilizer AS principally because this material can accept small quantities of impurities without detracting from its value. The AS future is expected to continue to be a reversal of the decreasing production tonnage trend which started in 1965 and concluded in 1972. This greater future tonnage is, however, expected to be as a by-product material rather than from an increase in synthetic AS production.
The processes studied in this Phase II report included only two of the three principal AS production processes namely, synthetic and coke oven-by-product. Ammonium sulfate production from these two processes for the period 1966 through 1972 are tabulated below:
PRODUCTION - SHORT TONS
1966 1967 1968 1969 1970 1971 1972
Synthetic
1,155,100 1,242,300
17
903,700 758,500 663,900 606,700 578,600
~y-Product
763,800 738,000 670,000 638,000 595,000 540,000 564,000

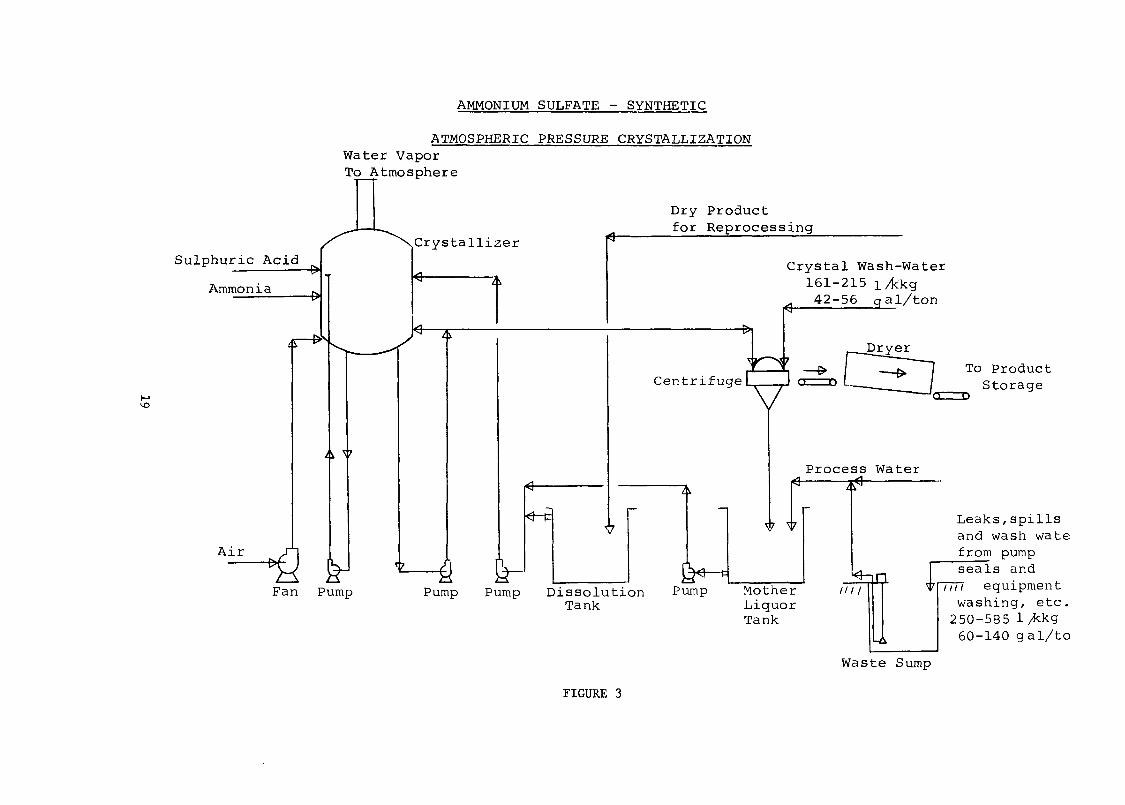
AMMONIUM SULFATE (SYNTHETICl - PROCESS DESCRIPTION
Synthetic ammonium sulfate is produced from virgin ammonia and sulfuric acid. (See Figure 3). The chemical reaction is essentially the neutralization of sulfuric acid with ammonia as indicated by following chemical equation:
2 NH3 (gas Ammonia
or liq.) + H2SO4 (liq.)➔Q!H4)2S04 (solid) + HEAT Sulfuric Acid Ammonium Sulfate
This reaction is highly exothermic liberating approximately 67,710 cal/g. mole or 4230 BTU/lb N. The raw materials are reacted in neutralizer/crystallizer units designed with means of controlled heat removal. Heat removal is achieved by controlled water addition and evaporation under either vacuum (sub-atmospheric) or atmospheric pressure conditions. Vacuum process units control evaporation by variation of absolute pressure while the atmospheric pressure process is controlled by varying the air volume blown into the reaction vessel.
The major process problem is control of the AS crystal size. Process control consists of regulating water evaporation and slurry circulation rates to give that combination of cooling/evaporation and slurry solids necessary for optimum crystal size formation. Precipitated crystals are separated from the mother liquor normally by centrifugation. Following centrifugation the crystals are washed, neutralized, and dried to product specifications.
AMMONIUM SULFATE - COKE OVEN BY-PRODUCT
In the process of carbonizing coal to coke such as in the steel industry, coal volatiles including ammonia, ammonium hydroxide and ammonium chloride are liberated. Many of the bituminous coals used in coke production contain 1-2% N and approximately 15-20% of this quantity can be recovered as ammonia. Ammonia formation is normally considered to occur at coking temperatures of approximately l000OC (1832oF) such as utilized in steel industry coking operations. Under these conditions some 35-45 pounds of ammonium sulfate can be produced per ton of steel. This AS production is accomplished by either of tbree different ways. These three ways are known as Direct, Indirect and Semi-Direct processes, according to the method of contacting the ammonia and sulfuric acid (See Figure 4).
18
Sulphuric Acid
Ammonia
Air
AMMONIUM SULFATE - SYNTHETIC
ATMOSPHERIC PRESSURE CRYSTALLIZATION Water Vapor To Atmosphere
Dry Product for Reprocessing
Crystallizer
Crystal Wash-Water 161-215 1 ;k.kg
42-56 al/ton
Process Water
Product Storage
Leaks,spills and wash wate from pump
r seals and
Fan Pump Pump Pump Dissolution Tank
Pump ~other Liquor Tank
W 1111 equipment washing, etc.
250-585 1 fa.kg 60-140 gal/to
Waste Sump
FIGURE 3

N 0
Lime Water
Steam£)
Tar Separator
Liquor
AMMONIUM SULPHATE - COKE OVENS
Cooling Water
To Atmosphere
Crystal Wash-Water 161-215 1/kkg
---------,,....---_-6 gal/ton
Waste Sump
Product to
Storage
Leaks, spills and wash
11 I/ 11 water from pump seals and equipment washing, etc.
250-585 1/kkg 60-140 gal/ton
Li'--me -Amm-onia--~f#/½1 Leg Still
Gaseous Ammonia Cleaning Equipment Connected with AS Plant but not Directly Part of AS Process
FIGURE 4

The Direct process treats the mixture of volatile off-gases by first cooling them to remove the maximum possible quantity of tar. Following tar removal the gases are passed through a saturator - either a bubbler or spray type - where they are washed with sulfuric acid. AS crystals form in the liquor and are recirculated in the saturator until the desired crystal size is formed. After the desired AS crystal size is realized they are separated from the liquor by centrifugation, washed, dried and conveyed to storage.
The Indirect process was developed primarily to improve AS crystal purity by further removal of such contaminates as tar, pyradine and other organic compounds. In this method the volatile off-gases are first cooled by recirculated wash liquor and scrubbing water. These liquors are then combined and treated with steam in a stripping column to release relatively high purity "free" ammonia present in the form of such easily disassociated salts as ammonium carbonate and ammonium sulfide. The partially stripped liquor is then treated with lime solution to decompose such "fixed" salts as ammonium chloride. This treated liquor then passes to a second stripping column where essentially all the remaining ammonia is freed from the liquor. The stripped ammonia is recovered as a crude ammonia soluti..m which is in turn redistilled or converted directly to AS in a saturater/crystallizer.
The semi-Direct process is a logical outcome of both the above described techniques. The volatile off-gases are cooled and washed. This processing removes the majority of the tar and yields an aqueous condensate containing a high percentage of the ammonia present in the gas. Ammonia is then released from this aqueous condensate in a small still. The evolved ammonia is then re-combined with the main gas stream and the whole stream reheated to approximately 70oC. This reheated gas stream is then scrubbed with 5-6% sulfuric acid and a near-saturation 60-70% ammonium sulfate solution. Spray-absorbers or saturators utilizing cracker pipes are both used for this operation. AS crystals are formed and removed as product similar to the previously described procedure~ This Semi-Direct process yields an essentially pure AS and high ammonia recovery.
Mixed and Blend Fertilizer Industry
Plants utilizing the two mixed fertilizer processes included in this Phase II Study - Mixed and Blend Fertilizers - have had a very rapid growth since 1964. This growth has been primarily due to the first time availability of granular high analysis straight and mixed fertilizer materials.
21
Prior to 1965 the predominant materials available to manufacturers were powders with a comparatively low nutrient content. Use of these older materials resulted in high production costs due to freight handling, materials loss, as well as production of a final product of poor quality and physical characteristics.
The introduction of good quality high analysis fertilizer materials represented one of the most significant technological developments in N-P-K fertilizer production in the past decade. The extent of the influence of these materials is best appreciated by noting the large increase in the number of particularly Blend Fertilizer plants which came into existence during the years 1964 to 1974.
1960 1964 1966 1968 1970 1974
Estimated Number of Operating U.S. Blend Fertilizer Plants
441 1536 3152 4140 5158 7000
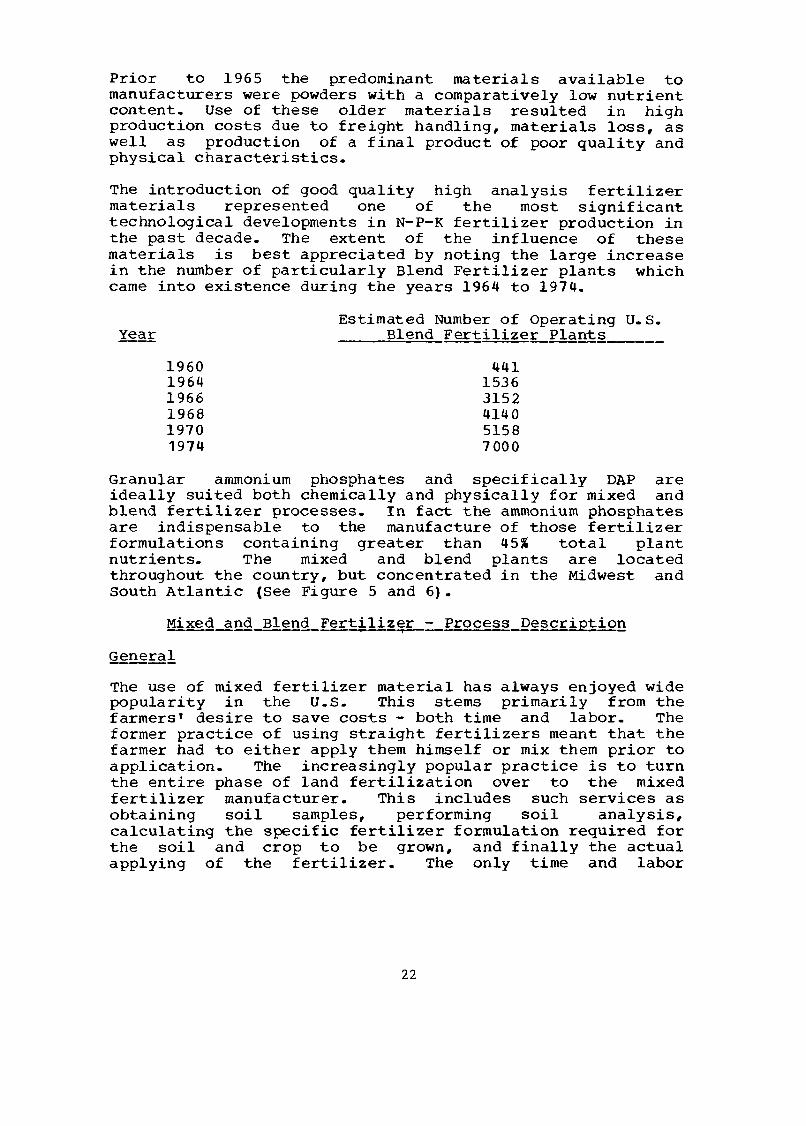
Granular ammonium phosphates and specifically DAP are ideally suited both chemically and physically for mixed and blend fertilizer processes. In fact the ammonium phosphates are indispensable to the manufacture of those fertilizer formulations containing greater than 45% total plant nutrients. The mixed and blend plants are located throughout the country, but concentrated in the Midwest and south Atlantic (See Figure 5 and 6).
Mixed and Blend Fertilizer - Process Description I
General
The use of mixed fertilizer material has always enjoyed wide popularity in the U.S. This stems primarily from the farmers' desire to save costs - both time and labor. The former practice of using straight fertilizers meant that the farmer had to either apply them himself or mix them prior to application. The increasingly popular practice is to turn the entire phase of land fertilization over to the mixed fertilizer manufacturer. This includes such services as obtaining soil samples, performing soil analysis, calculating the specific fertilizer formulation required for the soil and crop to be grown, and finally the actual applying of the fertilizer. The only time and labor
22

N l,J
0
0 19 O
70 0 0
FIGURE 5
0 52 0 0 0
0
0
0
120 O
0
NOTE: DUE TO THE LARGE NUMBER OF PLANTS IN MANY STATES ONLY REPRESENTATIVE SITES WITH THE NUMBER OF PLANTS ARE INDICATED.

FIGURE 6
MIXED FERTILIZER
PLANT IDCATIONS
0 oo Joo
0 Ool90
,---.L 0 0
NOTE: DUE TO THE Ll\RGE NU:--tBER OF PLANTS IN MA:::-;y STi1.TE S ONLY REPRESENTATIVE SITES WI'I'H THE NUMBER OF PLANTS ARE ·INDICATED.

expended by the farmer is the telephone call to request the service, approval of the application, and writing of the check.
This trend, plus the fact that fertilizer application quantities barely equal tbe crop uptake of nitrogen, phosphorous, and potassium assures continued growth of mixed fertilizer consumption. All these different factors have served to make the farmers increasingly cost conscious. In turn this has pressured fertilizer dealers into performing the above described services at little or no additional cost. These cost pressures have made manufacturing cost reduction a necessity. One of the outcomes has been a gradual reduction in the number of small manufacturers (300 to 10,000 TPY capacity). These small manufacturers have been replaced by a distribution system based on a large (30,000-60,000 TPY) central or "mother" plant serving a number of small distribution centers located within a 25-50 mile radius.
The point in describing the mixed fertilizer industry to this degree is to emphasize that a transition is in progress. Manufacturers are becoming increasingly aware of the need to maintain stable year round operation for maximum labor and cost economy. Small tonnage mixed fertilizer producers are going out of business. These defunct operations are being replaced by an increasing number of blend fertilizer manufacturers. The end result is that the mixed and blend fertilizer manufacturers have a new appreciation of all phases of plant operational efficiency. This includes provisions for effluent control - both gas and liquid.
The designation of Mixed and Blend Fertilizer processes made in this study necessitates some additional description so that fertilizer people can correlate them to the accepted Fertilizer Industry terminology. A Mixed Fertilizer process in this report refers to the process which mixes (wet or dry) straight and mixed fertilizer materials through chemical reactions into complete mix goods. The Fertilizer Industry designates the type of plants which process fertilizer according to this definition as being B, c, and D type plants. A Blend Fertilizer process designation refers to the process which physically mixes dry straight and mixed granular fertilizer materials to a given N-P-K formulation. This process is designated by the Fertilizer Industry as an A type plant.
The following u. s. consumption of dry mixed fertilizer goods (exclusive of liquids) gives some appreciation of the
25

annual tonnage of materials produced by the Mixed and Blend Fertilizer processes over the last 16 years.
1955 1960 1965 1970 1971
Q!:y_Mixed Fertilizer Goods Consumption (Short tons)
15,230,505 14,868,024 17,229,239 18,176,900 18,399,800
The tonnage figures do not fully reflect the status of dry mixed fertilizer goods. It should be added that the total amount of mixed fertilizers - both dry and liquids - applied on U. S. soil in 1970 was 20,963,000 tons. Dry mixed fertilizer therefore represented approximately 87% of this 1970 total. Currently the total quantity of direct application and mixed fertilizers used in the U.S. is approximately 42 million tons per year. Agriculturists estimate that fertilizer usage needs to be 80 million tons per year to realize most efficient crop growth. This indicates that dry mixed fertilizer consumption could approach 40 million tons per year in the near future. It is also observed that approximately 88% of the P2O5 used in the U.S. is applied as mixed fertilizer.
The total annual mixed fertilizer tonnages do not indicate the major change in the two production processes involved. Reference is to the great increase in bulk blends plants and decrease in mixed fertilizer process plants in the period 1959 to 1970 (e.g. 201 blend plants in 1959 to 5158 in 1970). This trend of increasing numbers of blend plants is expected to continue. In turn, this means that in the near future the majority of all U.S. mixed fertilizer goods will be produced by the Blend Fertilizer process.
MIXED FERTILIZER - PROCESS DESCRIPTION
The raw materials used to produce mixed fertilizer goods include inorganic acids, solutions, double nutrient fertilizers, and all types of straight fertilizers. Typical raw materials include sulfuric acid, phosphoric acid, nitrogen solutions, diamrnonium phosphate, ammonia, urea, ammonium nitrate, ammonium sulfate, normal superphosphate, triple superphosphate, potash, sand and a variety of minor elements. The choice of raw materials is dependent on the specific N-P-K formulation to be produced and the cost of the different posible materials from which it can be made. In some N-P-K formulations, two or more raw materials may be
26

selected because of the chemical reaction which will take place between them. The objective is to create conditions -such as chemical neutralization, dilution, etc., - which will produce the optimum temperature and moisture conditions for good physical product formation.
The Mixed Fertilizer process involves the controlled addition of both dry and liquid raw materials to a granulator. The granulator is normally a rotary drum, but pug mills are also used. Raw materials, plus some recycled product material, are mixed to form an essentially homogeneous granular product. It is common to also add water and/or steam to aid the chemical reactions and granule formation. Wet granules from the granulator are discharged into a rotary drier where the excess water is evaporated. Dried granules from the drier are sized on vibrating screens. Over and under size granules are separated for use as recycle material in the granulator. Product size granules are cooled and conveyed to storage or shipping (See Figure 7).
BLEND FERTILIZER - PROCESS DESCRIPTION
As previously mentioned the development and subsequent availability of good quality granular fertilizer materials in the mid 1 60 1 s was the catalyst which "made" the blend fertilizer process. Prior to this time the dry blending of fertilizer was a limited success. Raw materials available were largely powders with little or no particle size control. Consequently, the product had poor handling characteristics as well as unavoidable tendency to segregate. In the majority of cases the relationship of the N-P-K formulation in different sections of a bag or bulk shipment applied by the farmer to that which he purchased was purely coincidental. Both state fertilizer regulatory officers and customers took dim views of such fertilizers.
The availability and like physical characteristics of good quality straight and mixed fertilizer materials corrected the majority of these problems. Process problems such as handling and loss from dusty materials were practically eliminated. Product segregation was reduced to a minimum.
The process is simple. Raw materials are a combination of granular dry straight and mixed fertilizer materials with essentially identical particle size. While many materials can be utilized the five most commonly used are ammonium nitrate, urea, triple superphosphate, diammonium phosphate, and potash. These raw materials are stored in a multicompartmented bin and withdrawn in the precise quantities
27

needed to produce the N-P-K formulation desired~ Raw material addition is normally by batch weighing. This combination of batch-weighed and granular raw materials are then conveyed to a mechanical blender for mixing. These batch units are usually one of two types: a cement-type mixer, capable of 20 to 30 tons per hour or an auger-type with a four or five ton per hour capacity. From the blender the product is conveyed to storage or shipping (See Figure 8) •
28
Pond
Contaminated Water
Process Water 0-92 L/KKG 0-22 Gal/ton
Triple Superphosphate
DAP Normal
Superphosphate NPK
Phosphoric Acid
MIXED FERTILIZER PROCESS
Scrubber System .-- -- -
I I
Granulator
Ammonia
Muriate of Potash Addition
Dryer
FIGURE 7
-& I I I
Contaminated Dust Water .
3120-3330 L/KKG Collectio
750-800 Gal/to
I
I~ - - - - - - - - - - - - - - - - -I 4 ,
Sizingt----RILooler
To Product Storage

l,.)
0
0
I
Elevator
BLEND FERTILIZER PROCESS
Dust Bag Collector To Atmosphere
Fertilizer
Weigh/Belt
-.f>
Blender
FIGURE 8
r
Elevator
Product Hopper
To Railroad
Fan

SECTION IV
INDUSTRY CATEGORIZATION
The task of dividing the many fertilizer specific categories was considered one of the aspects of the Phase I study. one important to minimize the number of categories by processes which had similar characteristics. considered in the categorization process following:
1. Natural industry division.
processes into most important objective was grouping those
The factors included the
2. "Common denominator" contaminants.
3. Raw materials.
4. Problems with separation of individual process effluents within a plant complex.
The application of establishment of industry. These, processes, are:
these listed criteria resulted in the seven subcategories within the Fertilizer together with their listed component
A) Phosphate Subcategory 1. Phosphate Rock Grinding 2. wet Process Phosphoric Acid 3. Phosphoric Acid Concentration 4. Phosphoric Acid Clarification 5. Normal Superphosphate 6. Triple Superphosphate 7. Ammonium Phosphates 8. sulfuric Acid
B) Ammonia Subcategory C) Urea Subcategory D) Ammonium Nitrate subcategory E) Nitric Acid Subcategory F)* Ammonium Sulfate subcategory G)* Mixed and Blend Fertilizer Subcategory
The processes marked by asterisk (*) are the processes covered by this Phase II Study.
The reasoning applied to the four categorization factors listed above in the assignment of the Phase II processes to their specific Industry classification is contained in the following paragraphs.
31

Natural Industry Division '
Industry traditionally views ammonium sulfate production and mixed and blend fertilizer production as distinctly separate. By-product AS plants are part of an overall steel complex and synthetic plants are tied closely to a nitrogen and/or phosphate complex, because of the ammonia and sulfuric acid needed. Mixed, and blend plants in particular, usually are separate installations.
"Common Denominator" Contaminants -The various processes in the two identified categories all have like effluent contaminants which are either mixed together into a common effluent stream or because of the specific contaminant treatment required, it necessitates that an individual process effluent be treated separately regardless of the categorization. The commonness of contaminants and intermixing of effluents also permits establishment of a limitation for a total complex regardless of the number of different processes involved. This in turn simplifies matters for enforcement officials and industry monitoring.
Problems with Separation of Individual Process Efflu~nt2 Within a Complex
A somewhat surprising fact brought to light in the study was the lack of information available on a specific process within a complex. Industrial complexes are generally not physically designed to keep individual process streams separate. The reasons for this condition are due to a combination of items, such as there previously was no reason to do so, simplification of underground sewer systems, and the practice of using effluent from one process as a liquid in another process. The realization of this general situation was a reason in establishing the stated industrial categorization.
Raw Materials -Type of raw material used was the foremost reason for establishing the stated industry categorization. Mixed and blend plants obtain their raw materials from the basic fertilizer materials, such as Ammonia, Urea, AS, Potash, Triple Superphosphate, and Diammonium Phosphate. Coke oven ammonium sulfate raw materials are either a by-product of the coking process or, in synthetic ammonium sulfate production, ammonia and sulfuric acid.
32

Ammonium Sulfate subcqteqory
Ammonium sulfate (AS) was included as a distinct subcategory at least partially because industry historically regards it as a nitrogen fertilizer, separate from the mixed fertilizers. Other considerations such as the lack of an actual process effluent and the relatively "pure" characteristic of the plant effluent definitely established the categorization.
Mixed and Blend Fertilizer Sub£ateqory
The assignment of a Mixed and Blend Fertilizer subcategory was based primarily on the criteria of raw materials used, products produced, and natural industry division. The raw materials are principally products obtained from basic fertilizer processes. Industry has traditionally regarded this subcategory as distinct from other fertilizers. Many plants operate at separate geographical locations, not coupled with an overall complex as are most other fertilizer processes.
33


S~TWNV
WASTE CHARACTERIZATION
General
The intent of this section is to describe and id€ntify water usage and waste water flows in each individual process included in this Phase II report of the two fertilizer subcategories ammonium sulfate and mixed and blend fertilizer. Each type of water usage and effluent is discussed separately.
Ammonium Sulfate Manufacturing
While the study included AS production in two different industrial categories, the basic process procedures, water usage, and effluents are essentially identical. The only differences between the two procedures involve the source, concentration, and purity of the raw materials used. These differences do not change the type of water usage or effluent. The AS process operation has the following types of water usage and wastes.
A. Contaminated Water
B. Closed Loop cooling Tower water
c. Crystal wash Water
D. Process condensate
E. Spills and Leaks
F. Non-Point source Discharges
Each of the above listed types of water usage and wastes are identified below as to flow and contaminant content under their respective headings:
A. Contaminated Water
As previously described in the process descriptions there are several variations in the way the saturator/crystallizers are operated and controlled. One variation is to operate the saturater/crystallizers under vacuum conditions. This involves the use of a barometric condenser which requires significant water
35

quantities which may or may not make direct contact with the saturator/crystallizer offgases.
In those condensers in which direct water - gas contact occurs it is common practice to utilize contaminated water from the overall complex recirculated water system. This recirculated water is an accumulation of waters from all the different process units at the complex site and consequently accumulates sizeable concentrations of many cations and anions. Each pass through equipment does add to the water contaminate level although it is normally impractical to quantitatively analyze for that increase on an individual pass. This results from inability to obtain precise water measurement and human variables in laboratory techniques. This contaminated water is the major process stream. This stream is reused by collection in the sump and returning it to the crystallizer,.
Process yg~ 1/kkg gal/ton
Ammonium Sulfate 16680-34800 4000-8350
B. Closed Looe Cooling Towgf_Water
Closed loop cooling tower water may be used to condense the vapor from the evaporative type crystallizers. In these cases indirect contact condensers are utilized and no contamination of cooling waters occurs. Water usage figures are in the same range as those listed for contaminated water. There were no cases found where a cooling tower existed specifically for an AS unit and, therefore, no cooling tower blowdown is reported.
c. Crystal Wash Water
Following the centrifugation of the AS crystals from the mother liquor it is necessary to wash the crystals to remove retained liquor. This wash water is a noncontaminated water which is in turn added to the mother liquor tank. The small amount of impurities from the recycled effluent go into the product, and product AS can accept these without detracting from its value. The following figures indicate the usage:
Process
Ammonium Sulfate
36
1/kkg 161-215
gal/ton 42 - 56
D. Process Condensate
In those units where an indirect contact condenser is utilized (as described in B above) the water vapor from the evaporative type crystallizers is condensed. This condensate is small in quantity and is used to dissolve under-size AS crystals for return to the process.
E. Spills and Leak§
Spills and leaks are collected as part of normal process and housekeeping. Sources of this water are pump seal leaks and plant wash-up. Quantity is minor and it is reintroduced into the system. The following figures indicate a representative range for this source:
Process
Ammonium Sulfate
Quantity 1/kkg 250-585
gal/ton 60-140
Typical contaminants and concentrations in a Spills and Leak stream are listed below:
Contaminan!
Ammonia
BODS
COD
Ph
Fluoride
Total Phosphate
Nitrite Nitrogen
Nitrate Nitrogen
Phenol
F. Non-Point Source Discharge
concentration-mg/1
12
5
23
6.85
0.60
0.77
44
23
57 ppb
The origin of such discharges are dry product, usually from conveying equipment, dusting over the plant area and then being solubilized by rain or melting snow. The magnitude of this contaminant source is a function of dust containment, housekeeping, snow/rainfall quantities and the
37

design of the general plant drainage facilities. Most of this material is directed to the sump and returned to the process. The remainder is runoff, which is not regulated.
Mixed and Blend Fertilizer Industry
The mixed and blend fertilizer frocesses represent by far the largest number of individual plants in the entire fertilizer industry - an estimated 7400 plants. In respect to water usage and effluents, however, this subcategory is among the lowest water usage segments of u. s. industry. The processes have the following listed types of water usage and wastes:
A. Contaminated water
B. Process Water
c. Spills and Leaks
D. Non-Point Source Discharges
Each of the above listed types of water usage and wastes are identified in the following paragraphs as to flow and contaminant content under their respective headings.
A. Contaminated Water
Mixed fertilizer plants do have one process function which requires a significant quantity of water. This is in the wet scrubbing of drier and/or ammoniator exhaust gases. In order to minimize fresh water usage and to maintain an overall negative process water balance, a closed loop recirculation system of contaminated water is used to provide the relatively high instantaneous water usage requirements. Normally the contaminated water recirculation system used in connection with a fertilizer process is small and services only that particular unit. The following figures indicate the usage range.
Process
Mixed Fertilizer
B. fro2ess Water
1/kkg 3120-3330
gal/ton 750-800
Process water is defined as the fresh water addition to the contaminated water recirculation system required to maintain the water inventory. The quantity used is highly variable
38
due to the liquid requirements of the different fertilizer grade formulations; collection of spills and leaks; the periodic addition of water from housekeeping chores; and rainfall addition to the pond. The following figures indicate the usage range.
Process
Mixed Fertilizer
c. SQills and Leaks
1/kkg 0 - 92
gal/ton 0 - 22
Spills and leaks are collected as part of normal process and housekeeping. sources of this water are pump and plant wash-up. The quantity is minor and it is added to the contaminated recirculation water system.
D. Non-Point source Disch~rge
The origin of this discharge is dry product, usually from conveying equipment, dusting over the plant area and then being solubilized by rain or melting snow. This type discharge is the only liquid effluent.
39


SECTION VI
SELECTION OF POLLUTANT PARAMETERS
General
The selection of pollutant parameters was a necessary early step of the study. collection of meaningful data and sampling was dependent on knowing what fertilizer process contaminants are important so far as degradation of natural water resources are concerned~
The general criteria considered and reviewed in the selection of pollutant parameters included:
- quality of the plant intake water
- products manufactured
- raw materials used
- environmental harmfulness of the compounds or elements included in process effluent streams
Ammonium Sulfa!&_Sutcateq9ry
Effluent waste water from Ammonium Sulfate production units must be monitored for the following primary parameters: Ammonia nitrogen and pH.
secondary parameters which should be monitored but do not warrant establishment of guidelines at this time are: Chemical oxygen demand (COD), total dissolved solids (TDS), suspended solids, and temperature. The chief reason for not, establishing standards for the secondary pararne_~rs is that treatment of the primary parameters will effect removal of these secondary parameters. Another reason is that insufficient data exists to establish effluent limitations.
Mixed and Blend Fertilizers subcategory
Effluent waste water from the Phase II processes - Mixed and Blend Fertilizer - must be monitored for the following primary parameters: Ammonia nitrogen, pH, phosphorus, fluorides, nitrate and organic nitrogen.
Secondary parameters which should be monitored but do not warrant establishment of guidelines at this time are: Chemical oxygen demand (COD), total dissolved solids (TDS),
41

and suspended solids. The setting of standards for these secondary parameters is not warranted because treatment technology for the primary parameters (when required) effect removal.
Rationale for Selecting Identified Parameters
Ammonia and Nitrate Nitrogen
Ammonia is a common product of the decomposition of organic matter. Dead and decaying animals and plants along with human and animal body wastes account for much of the ammonia entering the aquatic ecosystem. Ammonia exists in its nonionized form only at higher pH levels and is the most toxic in this state. The lower th~ pH, the more ionized ammonia is formed and its toxicity decreases. Ammonia, in the presence of dissolved oxygen, is converted to nitrate (NO3} by nitrifying bacteria. Nitrite (NOl), which is an intermediate product between ammonia and nitrate, sometimes occurs in quantity when depressed oxygen conditions ~ermit. Ammonia can exist in several other chemical combinations including ammonium chloride and other salts.
Nitrates are considered to be among the poisonous ingredients of mineralized waters, with potassium nitrate being more poisonous than sodium nitrate. Excess nitrates cause irritation of the mucous linings of the gastrointestinal tract and the bladder; the symftoms are diarrhea and diuresis, and drinking one liter of water containing 500 mg/1 of nitrate can cause such symptoms.
Infant methemoglobinemia, a disease characterized by certain specific blood changes and cyanosis, may be caused by high nitrate concentrations in the water used for preparing feeding formulae. while it is still impossible to state precise concentration limits, it has been widely recommended that water containing more than 10 mg/1 of nitrate nitrogen (NO}-N) should not be used for infants. Nitrates are also harmful in fermentation processes and can cause disagreeable tastes in beer. In most natural water the pH range is such that ammonium ions (NH!+) predominate. In alkaline waters, however, high concentrations of un-ionized ammonia in undissociated ammonium hydroxide increase the toxicity of ammonia solutions. In streams polluted with sewage, up to one half of the nitrogen in the sewage may be in the form of free ammonia, and sewage may carry up to 35 mg/1 of total nitrogen. It has been shown that at a level of 1.0 mg/1 unionized ammonia, the ability of hemoglobin to combine with
42

oxygen is impaired and fish may suffocate. Evidence indicates that ammonia exerts a considerable toxic effect on all aquatic life within a range of less than 1.0 mg/1 to 25 mg/1, depending on the pH and dissolved oxygen level present.
Ammonia can add to the problem of eutrophication by supplying nitrogen through its breakdown products. Some lakes in warmer climates, and others that are aging quickly are sometimes limited by the nitrogen available. Any increase will speed up the plant growth and decay process.
Fluorides
As the most reactive non-metal, fluorine is never found free in nature but as a constituent of fluorite or fluorspar, calcium fluoride, in sedimentary rocks and also of cryolite, sodium aluminum fluoride, in igneous rocks. Owing to their origin only in certain types of rocks and only in a few regions, fluorides in high concentrations are not a common constituent of natural surface waters, but they may occur in detrimental concentrations in ground waters.
Fluorides are used as insecticides, for disinfecting brewery apparatus, as a flux in the manufacture of steel, for preserving wood and mucilages, for the manufacture of glass and enamels, in chemical industries, for water treatment, and for other uses.
Fluorides in sufficient quantity are toxic to humans, with doses of 250 to 450 mg giving severe symptoms or causing death.
There are numerous articles describing the effects of fluoride-bearing waters on dental enamel of children; these studies lead to the generalization that water containing less than 0.9 to 1.0 mg/1 of fluoride will seldom cause mottled enamel in children, and for adults, concentrations less than 3 or 4 mg/1 are not likely to cause endemic cumulative fluorosis and skeletal effects. Abundant literature is also available describing the advantages of maintaining 0.8 to 1.5 mg/1 of fluoride ion in drinking water to aid in the reduction of dental decay, especially among children.
Chronic fluoride poisoning of livestock has been observed in areas where water contained 10 to 15 mg/1 fluoride. Concentrations of 30 50 mg/1 of fluoride in the total ration of dairy cows is considered the upper safe limit. Fluoride from waters apparently does not accumulate in soft
43

tissue to a very small degree into fluorides 1. 5 mg/1.
significant degree and it is transferred to a extent into the milk and to a somewhat greater eggs. Data for fresh water indicate that
are toxic to fish at concentrations higher than
Organic Nitrog~!!
Organic nitrogen contaminants in the waste waters consist mainly of urea and lesser amounts of organic COJ scrubbing solutions. Such compounds can supply nutrient nitrogen for increased plant and algae growth in receiving waters.
The organic scrubbing solution - monethanolamine (MEA) - can add a slight BOD load to the effluent waste stream.
Phosphorus
During the past 30 years, a formidable case has developed for the belief that increasing standing crops of aquatic plant growths, which often interfere with water uses and are nuisances to man, frequently are caused by increasing supplies of phosphorus. Such phenomena are associated with a condition of accelerated eutrophication or aging of waters. It is generally recognized that phosphorus is not the sole cause of eutrophication, but there is evidence to substantiate that it is frequently the key element in all of the elements required by fresh water plants and is generally present in the least amount relative to need. Therefore, an increase in phosphorus allows use of other, already present, nutrients for plant growths. Phosphorus is usually described, for this reasons. as a "limiting factor."
When a plant population is stimulated in production and attains a nuisance status, a large number of associated liabilities are immediately apparent. Dense populations of pond weeds make swimming dangerous. Boating and water skiing and sometimes fishing may be eliminated because of the mass of vegetation that serves as an physical impediment to such activities. Plant populations have been associated with stunted fish populations and with poor fishing. Plant nuisances emit vile stenches, impart tastes and odors to water supplies, reduce the efficiency of industrial and municipal water treatment, impair aesthetic beauty, reduce or restrict resort trade, lower waterfront property values, cause skin rashes to man during water contact, and serve as a desired substrate and breeding ground for flies.
Phosphorus in the elemental form is particularly toxic, and subject to bioaccumulation in much the same way as mercury.
44

Colloidal elemental phosphorus will poison marine (causing skin tissue breakdown and discoloration). phosphorus is capable of being concentrated and accumulate in organs and soft tissues. Experiments shown that marine fish will concentrate phosphorus water containing as little as 1 ug/1.
2H, Acidity 2nQ Alkalinity
fish Also, will have from
Acidity and alkalinity are reciprocal terms. Acidity is produced by substances that yield hydrogen ions upon hydrolysis and alkalinity is produced by substances that yield hydroxyl ions. The terms "total acidity" and "total alkalinity" are often used to express the buffering capacity of a solution. Acidity in natural waters is caused by carbon dioxide, mineral acids, weakly dissociated acids, and the salts of strong acids and weak bases. Alkalinity is caused by strong bases and the salts of strong alkalies and weak acids.
The term pH is a logarithmic expression of the concentration of hydrogen ions. At a pH of 7, the hydrogen and hydroxyl ion concentrations are essentially equal and the water is neutral. Lower pH values indicate acidity while higher values indicate alkalinity. The relationship between pH and acidity or alkalinity is not necessarily linear or direct.
Waters with a pH below 6.0 are corrosive to water works structures, distribution lines, and household plumbing fixtures and can thus add such constituents to drinking water as iron, copper, zinc, cadmium and lead. The hydrogen ion concentration can affect the "taste" of the water. At a low pH water tastes "sour". The bactericidal effect of chlorine is weakened as the pH increases, and it is advantageous to keep the pH close to 7. This is very significant for providing safe drinking water.
Extremes of pH or rapid pH changes can exert stress conditions or kill aquatic life outright. Dead fish, associated algal blooms, and foul stenches are aesthetic liabilities of any waterway. Even moderate changes from "acceptable" criteria limits of pH are deleterious to some species. The relative toxicity to aquatic life of many materials is increased by changes in the water pH. Metalocyanide complexes can increase a thousand-fold in toxicity with a drop of 1.5 pH units. The availability of many nutrient substances varies with the alkalinity and acidity. Ammonia is more lethal with a higher pH.
45

The lacrimal fluid of the human eye has a pH of approximately 7.0 and a deviation of 0.1 pH unit from the norm may result in eye irritation for the swimmer. Appreciable irritation will cause severe pain.
The methods of determination are for the following
METHODS OF ANALYSIS
analysis to be used for quantitative given in the Federal Register 40 CFR 130 parameters pertinent to this study: Alkalinity (and acidity)
ammonia nitrogen fluoride hardness
nitrogen, total kjeldahl oxygen demand, chemical
phosphorus solids, total
suspended nofilterable solids, total temperature
46

SECTION VII
CONTROL AND TREATMENT TECHNOLOGY
The factors and contaminants in fertilizer process effluent streams have for the most part been quite well identified and known for many years. As a consequence considerable effort has been expended to correct or minimize the majority of those which are particularly detrimental to natural water receiving bodies. Much of this work has been directed at correcting the source of the contamination or an in-process improvement rather than an end-of-pipe type of treatment. A large part of the motivation for such improvement has been economics that is, improved operating efficiency and costs. Such improvements are just plain good business and justify capital expenditure required to achieve them.
With an appreciation of the above mentioned facts, the following criteria were established as bases for investigating treatment technology.
- To determine the extent of existing waste water control and treatment technology
- To determine the availability of applicable waste water control and treatment technology regardless of whether it be intra-industry transfer technology
- To determine the degree of treatment cost reason-ability
Based upon these stated criteria, the effort was made to factually investigate overall treatment technologies dealing with each of the primary factors and contaminants listed in Section VI. The results of that investigation are covered separately for ammonium sulfate and mixed and blend fertilizers.
Ammonium Sulfate Plant - Effluent control
Two of the three commercial processes used to produce Ammonium Sulfate were included in this Phase II study synthetic and coke by-product processes. Basic process unit operations and functions are identical in both processes. The differences are essentially the ammonia raw material source.
In the coke oven by-product process appreciable equipment is involved in removing contaminants from the oven gas prior to
47

its introduction to the saturator/crystallizer. The gas cleaning equipment and the liquid flows to and from the equipment are outside the AS process battery limits and were not included in the study. Essentially the AS process is an additional gas cleaning and air pollution control mechanism for the oven gas prior to its use as coke burner fuel.
Process Descrietion
The highly exothermic ammonia - sulfuric acid neutralization reaction permits judicious recycle of the minor process effluents back into the process. These minor streams include crystal wash, spills and leaks, and saturator/ammoniator indirect contact gas condensate (where existent).
The effluent control consists of a mea~s to collect these streams and/or their controlled addition to the process equipment. A common means of accomplishing this is by means of a trench and sump system complete with pump for rehandling of the collected effluents. The collected effluents can then be continuously or batch fed into the process equipment (See Figure 9).
Mixed Fertilizer Process-Effluent Control
This is the only Phase II phosphate process with liquid effluent. Each mixed fertilizer plant is very cognizant of water usage and exercises close control on it. Process equipment with an effluent purge stream includes dryer, cooler, and/or ammoniator exhaust gas scrubbers. A minor secondary source is effluent from leaks, spills and housekeeping.
Process Description
The mixed fertilizer process requires a certain amount of liquid to satisfy requirements of mixed fertilizer manufacture. The quantity of liquid required varies widely and is dependent on the raw materials and specific fertilizer formulation. At least a portion of that liquid can be supplied from the wet scrubber contaminated water recirculation system.
The effluent control process consists simply of a closed loop contaminated water system. This system includes a small retention pond (a representative size is 10 1 wide x 60' long x 10' deep) equipped with a pump to control the
48

FIGURE 9
AMMONIUM SULFATE PLANT
EFFLUENT CONTROL
Make-Up Water
//////////
To Process
Spills,Leaks and Wash Water l illl/flf//1
Waste Sump
clarified (either by settling or mechanical means) scrubber water addition to the ammoniator/granulator (See Figure 10).
The function of the wet scrubber is to remove noxious gases and particulate material from ammoniator offgases in addition to the dryer and cooler offgases. Because of the sizeable difference in temperature between these exhausts, separate scrubbers are sometimes utilized. The particulate material collected in the scrubber liquor if not solubilized must at least partially be removed from the circulated scrubber liquor before the liquor is added to the process. Removal of the insoluble material can be accomplished mechanically by such equipment as hydrocyclones or can be allowed to gravity settle from the liquor in the small retention pond. In the case of hydrocyclone equipment, the reasonably well concentrated solids (5-20% solids) can also be returned to the ammoniator/granulator as a slurrry. In the case of use of the retention pond as a settling area, the solids accumulated on the pond bottom are periodically (approximately once per year) "mucked out". The removed solids are then transported to a customer's field for distribution as a low grade fertilizer.
Blend Fertilizer Process Airborne Solids control
The technology involved with the blend fertilizer process may seem to be one out of place in a study on liquid plant effluents. It is however thought important to briefly discuss this point due to the large number of plants involved and the possible consideration of air pollution control authorities to allow wet scrubbing as at least an alternate for removal of airborne solids. Use of wet scrubbing equipment in this process would create more problems than it could possibly solve. It is considered important that only dry type collectors be used for removal of airborne solids from blend fertilizer process plants (See Figure 11).
50

Contaminated water from
MIXED FERTILIZER PROCESS
EFFLUENT CONTROL
Contaminated Water To Scrubber
Flow Element
Scrubber, Leaks, Spills and Wash Water
-----~ l/1////////I
Retention Pond
FIGURE 10
ll/1/////II/I// Pump
Flow Control valve
Contaminated Water to
Ammoniator/Granulato:

Ln N
BLEND PIANTS
AIRBORNE SOLIDS CONTROL
Bag Collecter
Screw
,--------, __ _ I
Blender I 1-- ... __ J
To Atmosphere
Fan
,...1
Product to Storage
- - - Major Equipment & Stream Flows
FIGURE 11

SECTION VIII
COST, ENERGY AND NON-WATER QUALITY ASPECT
General
The costs - capital and operating - have been estimated for each of the three in-process treatment technologies described in Section VII. These costs are given as August 1971 dollar values and have been based on a specific plant capacity. The capacity used was from a moderate size production unit and is specified on the cost summary table (See Table 1). An explanation of the various cost elements included in the table is given under the respective headings of the chart items.
There is a point in regard to the Mixed Fertilizer Process Plants which may require some consideration with respect to guidelines. There are a number of relatively small production units (8,000 - 20,000 TPY) throughout the United States. currently, operating costs have reduced profitability of these units to a point where they are gradually going out of business. The trend is for the establishment of a moderate size plant (30,000 - 60,000 TPY) in a central location to supply a number of small blend or distribution centers within a 25 50 mile radius. The point is that when air pollution standards are established it will force an additional number of these small process units to either install wet scrubbers or go out of business at an earlier time than possibly would have been expected. Based on the wet scrubber capital and operating costs it is considered unlikely that such costs can be absorbed by process units of less than 30,000 TPY capacity. As mentioned previously, this condition will be basically caused by local, state and/or national air pollution standards and not by water effluent standards.
Investments
This is the capital cost associated with engineering; site preparation; construction and installation; and such other costs required to place the equipment in operation. It does not include production loss or profits that may be realized from tying the facilities into the existing plant.
Interest
This cost is based on the assumption that the capital expenditure was borrowed at a 7.5% annual interest rate.
53
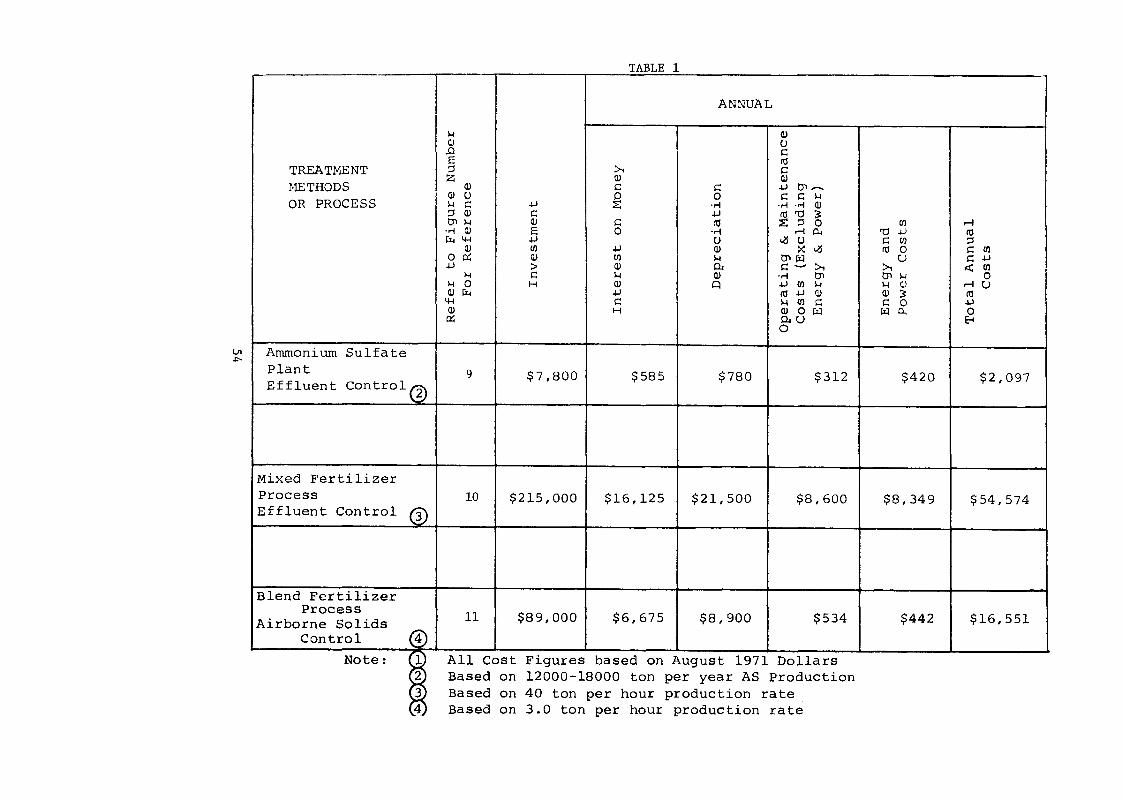
lJl .i,-
TREATMENT METHODS OR PROCESS
Ammonium Sulfate Plant Effluent Control(i)
Mixed Fertilizer Process Effluent Control (3)
Blend Fertilizer Process
Airborne Solids Control (4)
Note: w ~ IJ l4)
TABLE 1
ANNUAL
),..j a, a, (J ..a C: E ru :i >-, C: z a, a,
a, C s:: .jJ ty, -(!) CJ ~ 0 s:: s:: ),..j ),..j s:: .jJ ·.-i ·.-l ·.-l a, :i (!) s:: .j.J ru 'O 3: ty, ),..j a, C: ru ~ :i 0 rJ) ,-f
·.-i (!) E 0 ·.-i ,-f 0.. 'O .jJ ru t"li~ .jJ (J «I (J s:: rJJ :i
(!) rJ) .jJ a, >: «I ru o C Ul 0 o::; a, rJ) ),..j 0-,µ:j u C -iJ
.j.J :> (!) 0, C - >-, >-, ,:t Ul ),..j C ),..j a, ·.-i ty, 0-, ),..j 0
),..j 0 H a, A -iJ Ul ),..j l-1 (!) r-lU (!) t"li .j.J ru ..iJ a, a, 3: ru ~ C ),..j Ul C: C: 0 .jJ (!) H a, 0 rz:i rz:i 0.. 0 o::; 0, u 8
0
9 $7,800 $585 $780 $312 $420 $2,097
10 $215,000 $16,125 $21,500 $8,600 $8,349 $54,574
11 $89,000 $6,675 $8,900 $534 $442 $16,551
All Cost Figures based on August 1971 Dollars Based on 12000-18000 ton per year AS Production Based on 40 ton per hour production rate Based on 3.0 ton per hour production rate
Q§;!reciation
The nature and service life expected of this type equipment were the basis for the selection of an assumed ten-year straight line method depreciation cost.
Operating and Maintenan~ Costs
The various items included in supplies, replacement parts, labor and maintenance labor.
these costs are operating insurance, taxes, operating
This item is the power equipment. Electrical mils per KWH.
costs to operate tbe mechanical energy is assumed at the cost of 10
Solid Wastes
Solid waste control must be considered. Best practicable control technology and best available control technology as they are known today, require disposal of the pollutants removed from waste waters in this industry in the form of solid wastes and liquid concentrates. In most cases, these are non-hazardous substances requiring only minimal custodial care. However, some constituents may be hazardous and may require special consideration. In order to ensure long term protection of the environment from these hazardous or harmful constituents, special consideration of disposal sites must be made. All landfill sites where such hazardous wastes are disposed should be selected so as to prevent horizontal and vertical migration of these contaminants to ground or surface waters. In cases where geologic conditions may not reasonably ensure this, adequate legal and mechanical precautions (e.g. impervious liners) should be taken to ensure long term protection to the environment from hazardous materials. Where appropriate, the location of solid hazardous materials disposal sites should be permanently recorded in the appropriate office of legal jurisdiction.
Sludges from mixed fertilizer retention ponds could contain hazardous materials such as fluorides. This creates a disposal problem. Proper waste disposal procedures for such materials should be undertaken.
Total Annual costs
An accumulation of the various cost items described above.
55

INSTALLATION AND OPERATION OF TECHNOLOG~
Ammonium sulfate Plant Effluent control
The estimated time required for engineering, procurement and construction is 3 months.
Installation of this control system would be possible without interruption of plant operation in the event that it is an addition to an existing plant.
Mixed Fertilizer frocess Effluent Control
The estimated time required for engineering, procurement and construction is 12 months.
Installation of this equipment could proceed concurrently with plant operation except for some 8 hours of tie-in work.
Blend Fertilizer Airborne Solids Control
The estimated time required for engineering, procurement and construction is 9 months.
Installation of this equipment could largely proceed concurrent with production but will require approximately 24 hours of tie-in work.
56

SECTION IX
BEST PRACTICABLE CONTROL TECHNOLOGY CURRENTLY AVAILABLE, GUIDELINES AND LIMITATIONS
Introduction
The effluent limitations which must be achieved by July 1, 1977 are based on the degree of effluent reduction attainable through the application of the best practicable control technology currently available. For the fertilizer manufacturing industry, this level of technology is based on the best existing performance by exemplary plants of various sizes, ages and chemical processes within each of the industry's categories.
Best practicable control tecnnology currently available in the Ammonium sulfate and Mixed and Blend Fertilizer process plants involves only control technology within the processes. The control techniques included are manufacturing process control, use of recycle water systems, recovery and reuse of waste water, and use of dry collectors for airborne solids.
Other factors included in the considerations were:
a. The total cost of application of technology in relation to the effluent reduction benefits to be achieved from such application.
b. The size and age of equipment and facilities involved.
c. The process employed.
d. The engineering aspects of the application of various types of control techniques.
e. Process changes.
f. Nonwater quality environmental impact (including energy requirements).
General Water Guidelines
Process water is defined as any water directly contacting the reactants, intermediates, waste products, or endproducts of a manufacturing process including contact cooling water. Not included in the guidelines are noncontact cooling water or ancillary waste streams
57

resulting from steam and water supply. No limitations are established for either pollutant concentration or process waste water flow.
Based upon the information contained in sections III through VIII of this report, the following determinations were made on the degree of effluent reduction attainable with the application of the best practicable control technology currently available to the fertilizer manufacturing industry.
AMMONIUM SULFfilE SUBCATEGORY
General Description
The survey (described in detail under Section III) of ammonium sulfate plants was the composite of two separate industry studies. Synthetic AS plants and one coke oven byproduct plant were covered in the first study. A second study included data obtained from four by-product plants. The objective of both surveys was to determine the qualitative and quantitative levels of contaminants being discharged as well as the in-process technology used to control plant process effluents.
Best Practicable Control Technology currently Available includes:
Ammonium sulfate Plant Effluent control
This control technology was found to be in current industrial use at all the plants surveyed - both synthetic and coke oven by-product units. The technology consists of simply collecting the few process effluent streams (including leaks, spills and housekeeping) followed by controlled addition of the effluents back into the main process streams. A more detailed discussion of this technology is included in Section VII.
Proposed Effluent Limitations Guidelines
This technology coupled with judicious use of water in the process plant has demonstrated that the degree of effluent reduction obtainable is no discharge of process waste water pollutants to navigable waters.
The criteria used for selection of the treatment technology was information obtained at each of the plants - both synthetic and coke oven by-product process - covered in the survey. This criteria was obtained by sampling in-process
58

streams for raw waste load data; inspection and review of plant operations; collection of validated historical effluent data; and direct discussions with responsible plant operational personnel for positive definition of control and operational techniques practiced. Additional information was gathered from technical literature and direct contact with experts.
The proposed limitation of no discharge of process waste water pollutants is commercially practiced at all the synthetic AS plants surveyed and, with the additional feature of either a specific AS plant recirculation or overall plant recirculation system, also practiced at all coke oven by-product AS plants.
MIXED AND BLEND FERTILIZER SUECATEGORY
The survey (described in detail under Section III) of progressive plants with wide capacity variations in the selected geographical areas was conducted to determine wha :. level of contaminants was in the effluents from these plants and what were the treatment methods in use to maintain these levels. The following technology is considered to be the best practicable and currently available which is needed to meet the 1977 requirements.
Best Practicable Control Technology Currently Available includes:
Mixed Fertilizer Process Effluent control -.-
This control technology was found in current industrial use at four of the five plants surveyed. The single plant not currently using the technology was in the process of installing it with completion scheduled for early 1974. The technology consists of a contaminated water recirculation system with provisions for collecting spills, leaks, and wash water together with instrumentation to permit controlled addition of contaminated water to the process. A more detailed discussion of this technology is included in Section VII.
Proposed Effluent Limitat!Q!!__Guideline
This technology coupled with judicious use of water in the process plant has demonstrated that the degree of effluent reduction obtainable is no discharge of process waste water pollutants to navigable waters.
Blend Fertilizer Process Liquid Efflue!!!
59
The technology description as applied to this process is a misnomer in that this process inherently has no liquid requirements. Process raw materials include only dry materials and only dry type air effluent control equipment is used.
Proposed Effluent Limitation Guideline
The limitation guideline is simply that the existent technology be maintained on the principle of applying only dry type air effluent control equipment in blend fertilizer plants.
Rationale for Best Practicable control Technology currently Available
The proposed limitation of no discharge of process waste water pollutants is commercially practiced at all blend fertilizer process plants surveyed in this study.
60

SECTION X
BEST AVAILABLE TECHNOLOGY ECONOMICALLY ACHIEVABLE, GUIDELINES AND LIMITATIONS
IntroductiQn
The effluent limitations which must be achieved by July 1, 1983, are based on the degree of effluent reduction attainable through application of the best available technology economically achievable. This level of technology was based on the very best control and treatment technology employed by a specific point source within the industrial category. Best available technology economically achievable places equal emphasis upon in-process controls and control or treatment techniques employed at the end of a production process.
The following determining achievable:
factors best
were - taken into consideration in available technology economically
a. The age of equipment and facilities involved;
b. The process employed;
c. The engineering aspects of the application of various types of control techniques;
d. Process changes;
e. Cost of achieving the effluent reduction from application of best available economically achievable;
resulting technology
f. Non-water quality environmental impact (including energy requirements).
Process Waste Water Guidelines ~
Process waste water is defined as any water which, during the manufacturing process, comes into direct contact with raw materials, intermediates, products, or by-products.
Based upon the information contained in Sections III through IX of this report, the following determinations were made on the degree of effluent reduction attainable with the application of the best available control technology economically achievable in the various subcategories of the fertilizer manufacturing industry.
61

Proposed Best Available Technology Economically Achievable
For the processes included in this Phase II survey, the best available technology economically achievable is synonymous with the technologies described as best practicable technologies currently available. This is no discharge of process waste water pollutants to navigable waters.
62
Introduction
SECTION XI
NEW SOURCE PERFORMANCE STANDARDS AND PRETREATMENT RECOMMENDATIONS
This level of technology is to be achieved by new sources. The term "new source" is defined in the Act to mean "any source, the construction of which is commenced after publication of proposed regulations prescribing a standard of performance." New source performance standards are to be evaluated by adding to the consideration underlying the identification of best practicable control technology currently available a determination of what higher levels of pollution control are available througfil the use of improved production processes and/or treatment techniques. Thus, in addition to considering the best in-plant and end-of-process control technology, new source performance standards are to be based upon an analysis of how the level of effluent may be reduced by changing the production process itself. Alternative processes, operating methods or other alternatives are to be considered. However, the end result of the analysis identifies effluent standards which would reflect levels of control achievable through the use of improved production processes (as well as control technology), rather than prescribing a particular type of process or technology which must be employed. A further determination which was to be made for new source performance standards is
· whether a standard, permitting no discharge of pollutants is practicable.
The following factors were to be considered with respect to production processes which were analyzed in assessing new source performance standards:
a. The type of process employed and process changes.
b. Operating methods.
c. Batch as opposed to continuous operations.
d. Use of alternative raw materials and mixes of raw materials.
e. Use of dry rather than wet processes (including substitution of recoverable solvents for water).
f. Recovery of pollutants as by-products.
63

Proposed New Source Performance Standard
For the processes included in this Phase II survey, the proposed new source performance standard is synonymous with the best practical and best available technologies currently available. This is no discharge of process waste water pollutants to navigable waters.
Rationale and Assumptions_in the Development of New Source Performance Standards
One major problem in trying to treat waste water contaminants is that of dealing with large quantities of water with very dilute contaminant concentrations. Most existing plant complexes have very limited facilities for keeping different waste waters separated and, therefore, any treatment system installed has to handle large amounts of effluent waste water. The construction of a new process plant allows the design of a contaminated water separation/collection system to allow more efficient, less costly treatment of contaminants. More improved use of plant water including recycling should also aid in treating waste effluents.
of particular importance is the placement of cooling towers in relation to the ammonia, air emissions sources. Downwind absorption of ammonia by recycled cooling water can significantly contribute to the raw waste load. New plants have the freedom of plant arrangement that existing plants do not. Furthermore, through good engineering design, new plants should be able to eliminate the problem at the source by minimizing air leaks.
Pretreatment Requi~ements for New Sources
The type of waste water effluent that is discharged from an ammonium sulfate or mixed and blend plant contains compounds, such as ammonia nitrogen and nitrate nitrogen, that would pass through a typical activated sludge or trickling filter waste water plant and, therefore, this waste water at its normal concentration levels would not be amenable to treatment by conventional biological treatment processes. No discharge of process waste water pollutants from new sources to publicly owned treatment works is recommended for these subcategories. For the remaining subcategories, pretreatment and treatment provided by the publicly owned treatment works must sum to equal the effluent limitations for discharge to navigable waters for new sources if a discharge to publicly owned treatment works is to be allowed.
64

SECTION XII
ACKNOWLEDGEMENTS
This report was prepared by the Environmental Protection Agency on the basis of a comprehensive study performed by Davy Powergas, Inc., under contract no. 68-01-1508. Mr. Robert w. Heinz, Project Manager, assisted by Mr. Charles T. Harding, Mr. Gerald T. Fields, Mr. N. V. Fry, Mr. George Telatnik and Mr. Jack Frost, prepared the original (contractor's) report.
This study was conducted under the supervision and guidance of Elwood E. Martin, Project Officer for the fertilizer manufacturing industry assisted by Mr. Bruno E. Maier.
overall guidance and excellent assistance was provided by the author's.associates in the-Effluent Guidelines Division, particularly Messrs. Allen Cywin, Director, Ernst P. Hall, Deputy Director, and Walter J. Hunt, Branch Chief.
The cooperation of manufacturers who offered their plants for survey and contributed pertinent data is gratefully appreciated. The operations and the plants visited were the property of the following companies:
Borden Chemical company, Plant City, Fla.
Ellington Equity, Ellington, Illinois
Fertilizer Institute, washington, D.C.
Gold Kist Chemical co., Hanceville, Ala.
IMCC Rainbow Div., Atlanta, Ga.
Mississippi Chemical Corp., Dothan, Ala.
NU s - Rice, Pittsburgh, Pa.
Occidental Chemical co., Houston, Tex.
Olin Corporation, Stamford, Conn.
Perkinson Fertilizer, Decatur, Ill.
J. R. Simplot co., Pocatello, Idaho
Thornton Laboratory, Tampa, Fla.
65

Woodward Company, Woodward, Ala.
Valley Nitrogen, Helm, Calif.
Acknowledgement and appreciation is also given to Ms. Kay Starr, Ms. Nancy zrubek, Ms. Alice Thompson, Ms. Linda Rose, and Ms. Brenda Holmone of the Effluent Guidelines Division secretarial staff and to the secretarial staff of Davy Powergas, Inc., for their efforts in the typing of drafts, necessary revisions, and the final preparation of this and the contractor's draft document.
Thanks are also given to the members of the EPA working group/steering committee for their advice and assistance. They are:
Mr. Walter J. Hunt, Effluent Guidelines Division, Chairman
Mr. Elwood E. Martin, Effluent Guidelines Division
Mr. Harry Trask, Office of Solid waste Management Division
Dr. Edmond Lomasney, Region VI
Mr. Paul DesRosiers, Office of Research and Monitoring
Dr. Murray Strier, Office of Permit Programs
Dr. Robert R. swank, Jr., Office of Research and Development, NERC - Corvallis, Athens, Georgia
Dr. Chester Rhines, Effluent Guidelines Division
Mr. G. W. Frick, Office of General counsel
Mr. James Kamihachi, Office of Planning and Evaluation
66
SECTION XIII
REFERENCES
A. Inorganic Fertilizer fillQ Phosphate Mining Industries Water Pollution and control -- .,...
B. Industrial Pollution control Handbook by Herbert F.
c.
Lund; McGraw Hill Publishing Co., New York, Library of Congress Catalog card Number 70-101164.
Gauging and sampling Industrial Wastewater Robasky and Donald L. Koraido Calgon Chemical Engineering Magazine, Vol. 80, No. 8, 1973, Pages 111-120.
by Joseph G. Corporation; 1, January
D. Environmental Protection Agency Study E~EQ.f~ Industrial Waste St~gies Program Group 6 Fertilizers prepared by Wellman-Powergas, Inc.; Lakeland, Florida, 33803, for Environmental Protection Agency, July, 1971, contract No. 68-01-0029.
E. The Phosphat~ Industry in the United States by E. c. Houston Tennessee Valley Authority:- Office of Agricultural and Chemical Development, Division of Chemical Development, Muscle Shoals, Alabama, July, 1966.
F. Commercial Fertilizer Yearbook - 1970 Walter w. Brown Publishing Co., Inc. 75 *Third--Street, N.W. Atlanta, Georgia, 30308.
G. Characteristics of the World Fertilizer Industry Rhosphatic Fertilizers- by Travis Hignett, Director of Chemical Development, Tennessee Valley Authority, Muscle Shoals, Alahama, December, 1967, TVA Report No. S-422.
H. world Fertilizer Forecast 1965-19ftQ by Wellman-Lord, Inc. Lakeland, Florida, Copyright 1967, Paramount Press, Inc., Jacksonville, Florida.
I. Economic Impact 2! Water Pollution control ~egui~~§ Q!1 the Fertilizer Manufacturing Industry by Development Planning and Research Associates, Inc., P.O. Box 727, Manhattan, Kansas, 66502. Interim Report to Environmental Protection Agency, contract No. 68-01-0766, November, 1972.
67

J. Wor!g Nit~gfil! Plan~ 1968-1973 Chemical Products Series Report - May 1969, Stanford Research Institute; Menlo Park, California, 94025.
K. Phosphatic Fertilizer~ - Properties an_g_Rrocesses by David w. Bixby, Delbert L. Rucker, Samuel L. Tisdale, Technical Bulletin No. 8, October 1966, The Sulphur Institute, 1725 "K" Street Northwest, Washington, D. c. 20006.
L.
M.
N.
o.
P.
Q.
R.
!he Chemical Industa Facts Chemist Association, Inc., Connecticut Ave., Washington, Catalog Card No. 59-15407.
Book by Manufacturing 5th Edition 1962, 1825
D. c., Library of congress
Wat~~ Quality Criteria National Committee, Federal Water Administration, Washington, D. c.,
Technical Pollution
1968.
1\dvisory control
Industrial Water Pollution Control w. w. Ekenfelder, McGraw-Hill Publishing Co., New York, Published 1966, Library of congress Catalog card No. 66 - 17913.
Standard Methods for the Examination of Water and Waste Wat~ 13th, Edition,-American Public-Health Association (1971).
Methods fQ!: Chemical Analysis of Water ~nd wastes EPA, National Environmental Research center, Analytical Quality Control Laboratory, Cincinnati, Ohio (1971).
Chemical Process Industries R. Norris Shreve, Professor of Chemical Engineering-;-Purdue University, Pages 398-404, First Edition Fifth Impression, 1945.
Ammonium Sulfate Manufacture J. F. Holt and P. J. Farley, United States Steel corporation, Fairless Hills, Penn. Reprint 12A, Presented at the Symposium on Nitrogen Fertilizer Manufacturing Sixty-Third National Meeting, St. Louis, Mo. February 18-21, 1968. American Institute of Chemical Engineers.
s. Fertilizer Trends 1971 National Fertilizer Development Center, Muscle Shoals°-; Alabama 33660.
T. 1~1~ Fertilizer summary Qfil=~ Norman L. Hargett, National Fertilizer Development Center, Tennessee Valley Authority, Muscle Shoals, Alabama.
68

U. Nitrogen Fertilizer Chemical Processes Christopher J. Pratt, Robert Noyes, Noyes Development corp., 16-18 Railroad Ave., Pearl River, N. Y., U.S.A. 1965 Library of c.onqress card Number 64-24901.
V. Fertilizer Nitroqen Vincent Sauchelli. American ·Chemical Society Monograph Series, Reinhold Publishing corp., N. Y. 1964, pages 128-135 Library of Congress Catalog Card Number 64-20956.
w. Inorqanic Fertilizer Materials 2 nd Related Acids , 2!!!!!ffiary for .1272 Lonnie M. Conner, Chief for Chemicals, wood Products, and Non-Metalic Minerals Branch, u.s. Department of Commerce, Bureau of the Census, Industry Division, Washington, D.C. 20233.
x. Wat~ Quality Criteria 1272, Sciences and National Ac~demy Environmental Protection Agency, (U.S. Government Printing Office
69
National Academy of of Engineering for the
Washington, D.C. 1972 Stock No. 5501-00520).


TPY
Short Tons per year
Toxic constituents
Relating to a poison
AS
Ammonium Sulfate
Virgin
SECTION XIV
GLOSSARY
Manufactured from essentially pure raw materials
Mother
Central unit furnishing several other satellite units with material
contaminated waste water
Effluent waste water that has been contaminated due to contact with process water (could be cooling tower, boiler blowdown or pond water)
Cooling water Blowdown
small quantity of cooling water discharged from a recycling cooling water system to remove concentrated contaminants from the tower
Process Water
Any water which, during the manufacturing process, comes into direct contact with any raw material, intermediate, product, by-product, or gas or liquid that has accumulated such constituents
Ton
All uses of the term "ton" imply short ton equal to 2,000 lb.
71

MULTIPLY (ENGLISH UNITS)
TABLE 2
METRIC UNITS
CONVERSION TABLE
by TO OBTAIN (METRIC UNITS)
ENGLISH UNIT ABBREVIATION CONVERSION ABBREVIATION METRIC UNIT
acre ac 0.405 ha hectares acre - feet ac ft 1233.5 cu m cubic meters British Thermal
Unit BTU 0.252 kg cal kilogram-calories British Thermal BTU/lb 0.555 kg cal/kg kilogram calories/
Unit/pound kilogram cubic feet/minute cfm 0.028 cu m/min cubic meters/minute cubic feet/second cfs 1.7 cu m/min cubic meters/minute cubic feet cu ft 0.028 cu m cubic meters cubic feet cu ft 28.32 1 liters cubic inches cu in 16.39 cu cm cubic centimeters degree Fahrenheit oF 0.555(oF-32)*oC degree Centigrade feet ft 0.3048 m meters gallon gal 3.785 1 liters gallon/minute gpm 0.0631 1/sec liters/second horsepower hp 0.7457 kw killowatts inches in 2.54 cm centimeters inches of mercury in Hg 0.03342 atm atmospheres pounds lb 0.454 kg kilograms million gallons/day mgd 3,785 cum/day cubic meters/day mile mi 1.609 km kilometer pound/square inch psig (0.06805 psig +l)*atm atmospheres
(gauge) (absolute) square feet sq ft 0.0929 sq m square meters square inches sq in 6.452 sq cm square centimeters tons (short) ton 0.907 kkg metric tons
(1000 kilograms) yard yd 0.9144 m meters
* Actual conversion, not a multiplier
U.S. GOVERNMENT PRINTING OFFICE: 1975-- 582-420:226
72