Embed Size (px)
Citation preview

1
Development Assistance in the 21st Century Homi Kharas Senior Fellow, Wolfensohn Center for Development at Brookings Contribution to the VIII Salamanca Forum The Fight Against Hunger and Poverty July 2-4, 2009

2
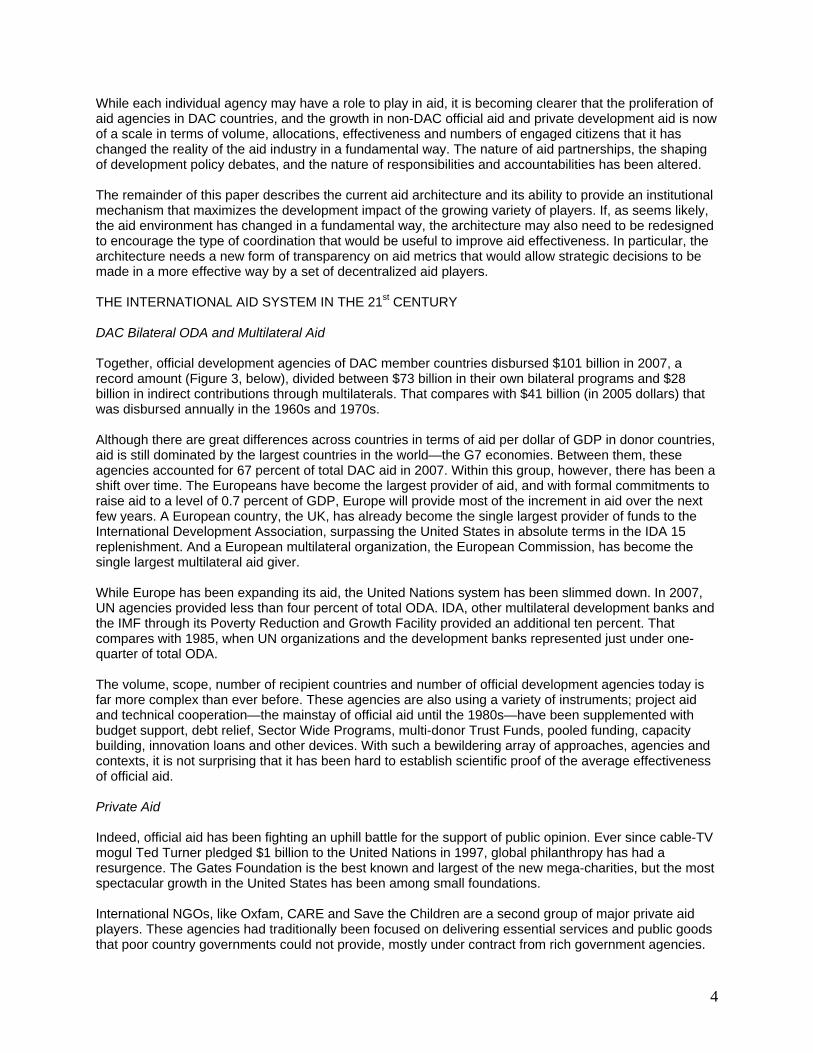
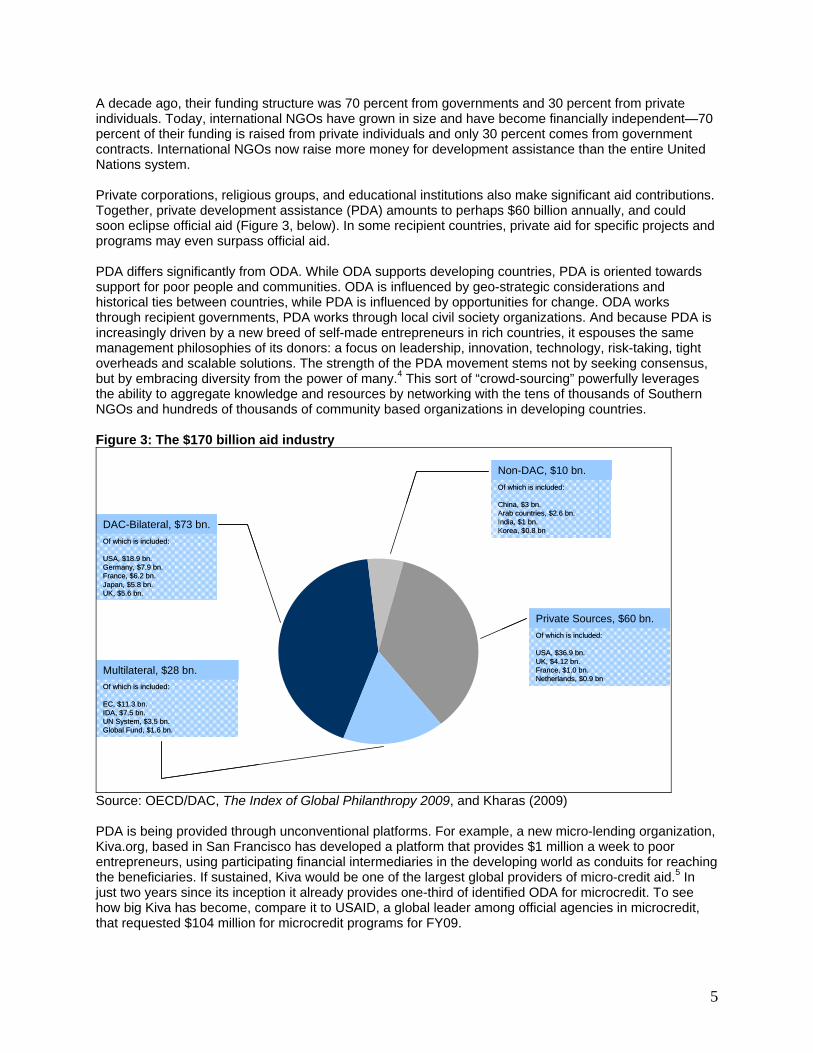
INTRODUCTION The basic architecture of development assistance—aid as it has come to be known1—is changing at an accelerated pace. Over 60 years, a network of national and international aid agencies and programs has been built “to promote social progress and better standards of life for all peoples”.2 While the foundations of today’s aid architecture were laid during World War II, with the creation of the Bretton Woods institutions and the stunning success of the Marshall Plan, the structures put in place reflect a steady evolution of events: decolonization, the Cold War, and, more recently, responses to oil shocks and other economic forces linked with globalization (the New International Economic Order of the 1980s), environmental pressures, democratization and the collapse of dictatorships in many developing countries and managing fragile states. With each event, aid agencies and policies adapted. In some cases, new agencies were created to fill perceived gaps and needs. By the beginning of the 21st Century, the aid architecture no longer resembled its initial design (see Figures 1 and 2). The number of official aid agencies has mushroomed. Through the 1970s, the U.S., France and the U.K. accounted for three-quarters of total official development assistance. Today, these three countries account for only 40 percent. There are 20 other countries that form part of the main donors’ club—the Development Assistance Committee of the OECD, that explicitly tries to coordinate the effort of its members. Many of these countries have several agencies that provide development assistance. As a result, there are over 126 bilateral agencies from DAC countries providing official development assistance. In addition, outside the DAC, there are at least 23 other countries that give aid—mostly well-off countries, but an increasing number of large middle income countries as well, such as China, India, Brazil and Turkey, who are active in their neighborhoods and in selected countries where they have strategic interests. It is not surprising that as countries get richer they take on more responsibilities for managing global affairs. From that perspective, the growing number of donors is a positive sign of global progress and in the perceived usefulness in giving aid. More surprisingly, there are at least 263 multilateral aid agencies, ranging from large well-known bodies like the International Development Association (IDA), that operates in 80 of the world’s poorest countries and that has provided $161 billion dollars since its inception, to small and highly focused organizations like the International Network for Bamboo and Rattan. These agencies raise funds from both private and official grants. Many are multilateral programs funded by foundations and governments.3 They are designed as a channel to aggregate and pool bilateral aid to make it more effective and efficient.

3
Figure 1
Source: Kharas (2007) Figure 2
Rich governments Poor governments
?Poor individuals
?Poor individuals
Private aid organizations
Corruption
Technical cooperation
Debt relief and administration New bilaterals
Rich individualsRich individualsRich individuals
Multilateral institutions
Newmultilaterals
Multilateral institutionsMultilateral institutionsMultilateral institutions
Newmultilaterals
Bilateral aid
Project administration
Capture byrich citizensTechnical
Cooperation
Interest on loans
Interest on loans
Administration and fund-raising
Debt relief
Vertical funds
Administration, technical cooperation, etc.
Taxes
Emergency and humanitarian aid
$19 billion?
?
?
?TechnicalCooperation
Source: Kharas (2007)
Poor Governments
Poor Individuals
Multilateral Institutions
Rich Individuals
Rich Governments
4
While each individual agency may have a role to play in aid, it is becoming clearer that the proliferation of aid agencies in DAC countries, and the growth in non-DAC official aid and private development aid is now of a scale in terms of volume, allocations, effectiveness and numbers of engaged citizens that it has changed the reality of the aid industry in a fundamental way. The nature of aid partnerships, the shaping of development policy debates, and the nature of responsibilities and accountabilities has been altered. The remainder of this paper describes the current aid architecture and its ability to provide an institutional mechanism that maximizes the development impact of the growing variety of players. If, as seems likely, the aid environment has changed in a fundamental way, the architecture may also need to be redesigned to encourage the type of coordination that would be useful to improve aid effectiveness. In particular, the architecture needs a new form of transparency on aid metrics that would allow strategic decisions to be made in a more effective way by a set of decentralized aid players. THE INTERNATIONAL AID SYSTEM IN THE 21st CENTURY DAC Bilateral ODA and Multilateral Aid Together, official development agencies of DAC member countries disbursed $101 billion in 2007, a record amount (Figure 3, below), divided between $73 billion in their own bilateral programs and $28 billion in indirect contributions through multilaterals. That compares with $41 billion (in 2005 dollars) that was disbursed annually in the 1960s and 1970s. Although there are great differences across countries in terms of aid per dollar of GDP in donor countries, aid is still dominated by the largest countries in the world—the G7 economies. Between them, these agencies accounted for 67 percent of total DAC aid in 2007. Within this group, however, there has been a shift over time. The Europeans have become the largest provider of aid, and with formal commitments to raise aid to a level of 0.7 percent of GDP, Europe will provide most of the increment in aid over the next few years. A European country, the UK, has already become the single largest provider of funds to the International Development Association, surpassing the United States in absolute terms in the IDA 15 replenishment. And a European multilateral organization, the European Commission, has become the single largest multilateral aid giver. While Europe has been expanding its aid, the United Nations system has been slimmed down. In 2007, UN agencies provided less than four percent of total ODA. IDA, other multilateral development banks and the IMF through its Poverty Reduction and Growth Facility provided an additional ten percent. That compares with 1985, when UN organizations and the development banks represented just under one-quarter of total ODA. The volume, scope, number of recipient countries and number of official development agencies today is far more complex than ever before. These agencies are also using a variety of instruments; project aid and technical cooperation—the mainstay of official aid until the 1980s—have been supplemented with budget support, debt relief, Sector Wide Programs, multi-donor Trust Funds, pooled funding, capacity building, innovation loans and other devices. With such a bewildering array of approaches, agencies and contexts, it is not surprising that it has been hard to establish scientific proof of the average effectiveness of official aid. Private Aid Indeed, official aid has been fighting an uphill battle for the support of public opinion. Ever since cable-TV mogul Ted Turner pledged $1 billion to the United Nations in 1997, global philanthropy has had a resurgence. The Gates Foundation is the best known and largest of the new mega-charities, but the most spectacular growth in the United States has been among small foundations. International NGOs, like Oxfam, CARE and Save the Children are a second group of major private aid players. These agencies had traditionally been focused on delivering essential services and public goods that poor country governments could not provide, mostly under contract from rich government agencies.
5
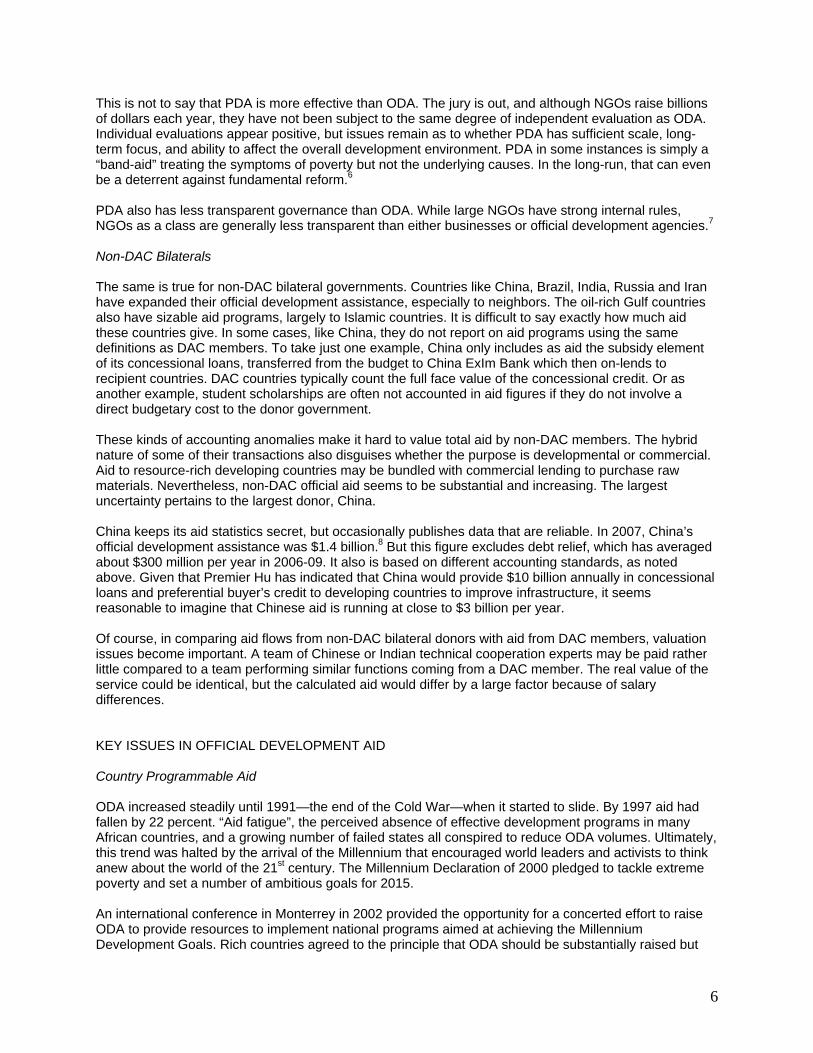
A decade ago, their funding structure was 70 percent from governments and 30 percent from private individuals. Today, international NGOs have grown in size and have become financially independent—70 percent of their funding is raised from private individuals and only 30 percent comes from government contracts. International NGOs now raise more money for development assistance than the entire United Nations system. Private corporations, religious groups, and educational institutions also make significant aid contributions. Together, private development assistance (PDA) amounts to perhaps $60 billion annually, and could soon eclipse official aid (Figure 3, below). In some recipient countries, private aid for specific projects and programs may even surpass official aid. PDA differs significantly from ODA. While ODA supports developing countries, PDA is oriented towards support for poor people and communities. ODA is influenced by geo-strategic considerations and historical ties between countries, while PDA is influenced by opportunities for change. ODA works through recipient governments, PDA works through local civil society organizations. And because PDA is increasingly driven by a new breed of self-made entrepreneurs in rich countries, it espouses the same management philosophies of its donors: a focus on leadership, innovation, technology, risk-taking, tight overheads and scalable solutions. The strength of the PDA movement stems not by seeking consensus, but by embracing diversity from the power of many.4 This sort of “crowd-sourcing” powerfully leverages the ability to aggregate knowledge and resources by networking with the tens of thousands of Southern NGOs and hundreds of thousands of community based organizations in developing countries. Figure 3: The $170 billion aid industry
DAC-Bilateral, $73 bn.Of which is included:
USA, $18.9 bn.Germany, $7.9 bn.France, $6.2 bn.Japan, $5.8 bn.UK, $5.6 bn.
Non-DAC, $10 bn.Of which is included:
China, $3 bn.Arab countries, $2.6 bn.India, $1 bn.Korea, $0.8 bn
Multilateral, $28 bn.
Private Sources, $60 bn.Of which is included:
USA, $36.9 bn.UK, $4.12 bn.France, $1.0 bn.Netherlands, $0.9 bn
Of which is included:
EC, $11.3 bn.IDA, $7.5 bn.UN System, $3.5 bn.Global Fund, $1.6 bn.
Source: OECD/DAC, The Index of Global Philanthropy 2009, and Kharas (2009) PDA is being provided through unconventional platforms. For example, a new micro-lending organization, Kiva.org, based in San Francisco has developed a platform that provides $1 million a week to poor entrepreneurs, using participating financial intermediaries in the developing world as conduits for reaching the beneficiaries. If sustained, Kiva would be one of the largest global providers of micro-credit aid.5 In just two years since its inception it already provides one-third of identified ODA for microcredit. To see how big Kiva has become, compare it to USAID, a global leader among official agencies in microcredit, that requested $104 million for microcredit programs for FY09.
6
This is not to say that PDA is more effective than ODA. The jury is out, and although NGOs raise billions of dollars each year, they have not been subject to the same degree of independent evaluation as ODA. Individual evaluations appear positive, but issues remain as to whether PDA has sufficient scale, long-term focus, and ability to affect the overall development environment. PDA in some instances is simply a “band-aid” treating the symptoms of poverty but not the underlying causes. In the long-run, that can even be a deterrent against fundamental reform.6 PDA also has less transparent governance than ODA. While large NGOs have strong internal rules, NGOs as a class are generally less transparent than either businesses or official development agencies.7 Non-DAC Bilaterals The same is true for non-DAC bilateral governments. Countries like China, Brazil, India, Russia and Iran have expanded their official development assistance, especially to neighbors. The oil-rich Gulf countries also have sizable aid programs, largely to Islamic countries. It is difficult to say exactly how much aid these countries give. In some cases, like China, they do not report on aid programs using the same definitions as DAC members. To take just one example, China only includes as aid the subsidy element of its concessional loans, transferred from the budget to China ExIm Bank which then on-lends to recipient countries. DAC countries typically count the full face value of the concessional credit. Or as another example, student scholarships are often not accounted in aid figures if they do not involve a direct budgetary cost to the donor government. These kinds of accounting anomalies make it hard to value total aid by non-DAC members. The hybrid nature of some of their transactions also disguises whether the purpose is developmental or commercial. Aid to resource-rich developing countries may be bundled with commercial lending to purchase raw materials. Nevertheless, non-DAC official aid seems to be substantial and increasing. The largest uncertainty pertains to the largest donor, China. China keeps its aid statistics secret, but occasionally publishes data that are reliable. In 2007, China’s official development assistance was $1.4 billion.8 But this figure excludes debt relief, which has averaged about $300 million per year in 2006-09. It also is based on different accounting standards, as noted above. Given that Premier Hu has indicated that China would provide $10 billion annually in concessional loans and preferential buyer’s credit to developing countries to improve infrastructure, it seems reasonable to imagine that Chinese aid is running at close to $3 billion per year. Of course, in comparing aid flows from non-DAC bilateral donors with aid from DAC members, valuation issues become important. A team of Chinese or Indian technical cooperation experts may be paid rather little compared to a team performing similar functions coming from a DAC member. The real value of the service could be identical, but the calculated aid would differ by a large factor because of salary differences. KEY ISSUES IN OFFICIAL DEVELOPMENT AID Country Programmable Aid ODA increased steadily until 1991—the end of the Cold War—when it started to slide. By 1997 aid had fallen by 22 percent. “Aid fatigue”, the perceived absence of effective development programs in many African countries, and a growing number of failed states all conspired to reduce ODA volumes. Ultimately, this trend was halted by the arrival of the Millennium that encouraged world leaders and activists to think anew about the world of the 21st century. The Millennium Declaration of 2000 pledged to tackle extreme poverty and set a number of ambitious goals for 2015. An international conference in Monterrey in 2002 provided the opportunity for a concerted effort to raise ODA to provide resources to implement national programs aimed at achieving the Millennium Development Goals. Rich countries agreed to the principle that ODA should be substantially raised but

7
did not commit to specific targets. That would come later at a G8 Summit at Gleneagles in 2005. There, spurred perhaps by a mass demonstration of 250,000 marchers to Make Poverty history, an agreement was reached to provide an incremental amount of ODA of $50 billion by 2010, along with a specific commitment to provide an additional $25 billion to Sub-Saharan Africa. In 2008, net ODA was $120 billion, $10 billion less than the $130 billion that is the Gleneagles target for 2010. The increase since 2005 has been significant. However, a closer look at the details shows that ODA may not have been directed towards reducing extreme poverty, as was intended. International conferences and commitments are useful in ensuring an equitable burden sharing across countries in reaching common goals. But if there is no real consensus, targets can be manipulated. That is happening with ODA, which is defined quite broadly across a range of categories which are not really comparable. This means that the goalposts are not really fixed by an ODA target. Figure 4 shows how ODA is actually broken down by category. First, not all ODA actually is cash coming from rich countries. About $4-5 billion per year is interest paid by developing countries to rich countries for past aid. As such, interest which is paid and then re-lent or gifted back to developing countries is not a net transfer of resources for development. Second, a substantial portion of ODA is in the form of technical cooperation, about $24.5 billion in 2006.9 Technical cooperation (TC) can of course be valuable for development. At its best, it builds capabilities of countries to manage their own development and provides practical expertise to implement policy change and institutional strengthening. But technical cooperation is hard to value, and is an indirect way of bringing about development. Technical cooperation does not provide money for the budget in poor countries or for specific projects to alleviate poverty. It typically does not even involve a cross-border flow of funds. What is delivered is people and studies, not cash. This makes the measured value of TC dependent on how it is delivered, not on what it accomplishes. That can vary considerably. One study suggests that TC provided through a consulting contract from an official agency can cost up three times as much as the same service provided by an equally qualified individual from a non-profit agency.10 The next biggest category of aid is debt relief.11 Many poor countries had accumulated large amounts of commercial debt mostly from official export credit agencies. When countries were not able to repay, the debts have been cancelled. The value of debt relief, however, is not restricted to the amount borrowed. Instead, it is measured as the amount legally owed. That can be far higher than the amount borrowed as it includes the accumulation of unpaid interest (often at penalty rates) and various other fees and charges. It is only in international affairs that such write-offs are labeled as “assistance”. In commercial circles, they are called what they are—debt write-offs. Poor countries do not receive incremental funds when debt is written off. Debt relief in 2005-7 averaged about $16 billion. Debt relief can in theory free up domestic resources for poverty reduction programs in cases where countries were making some interest and principal repayments. However, studies comparing countries receiving debt relief with those that did not suggest that this amount is small. There is little evidence to support the idea that debt relief has increased public expenditures in general, or public expenditures in specific categories like health and education.12 Another ODA category that is hard to value is developmental food aid. Food aid is provided in kind, purchased at prices reflecting food procurement policies in rich countries. It must then be shipped to developing countries, incurring high transport costs. Developmental food aid is then sold with the proceeds used for development projects, but it has become highly controversial in terms of its effectiveness. Critics claim that not only is developmental food aid overvalued, compared to its worth in a true global market, but it can also distort local markets and be damaging to local farmers.13 Many international NGOs have stopped accepting food aid to fund their activities in response to these concerns.

8
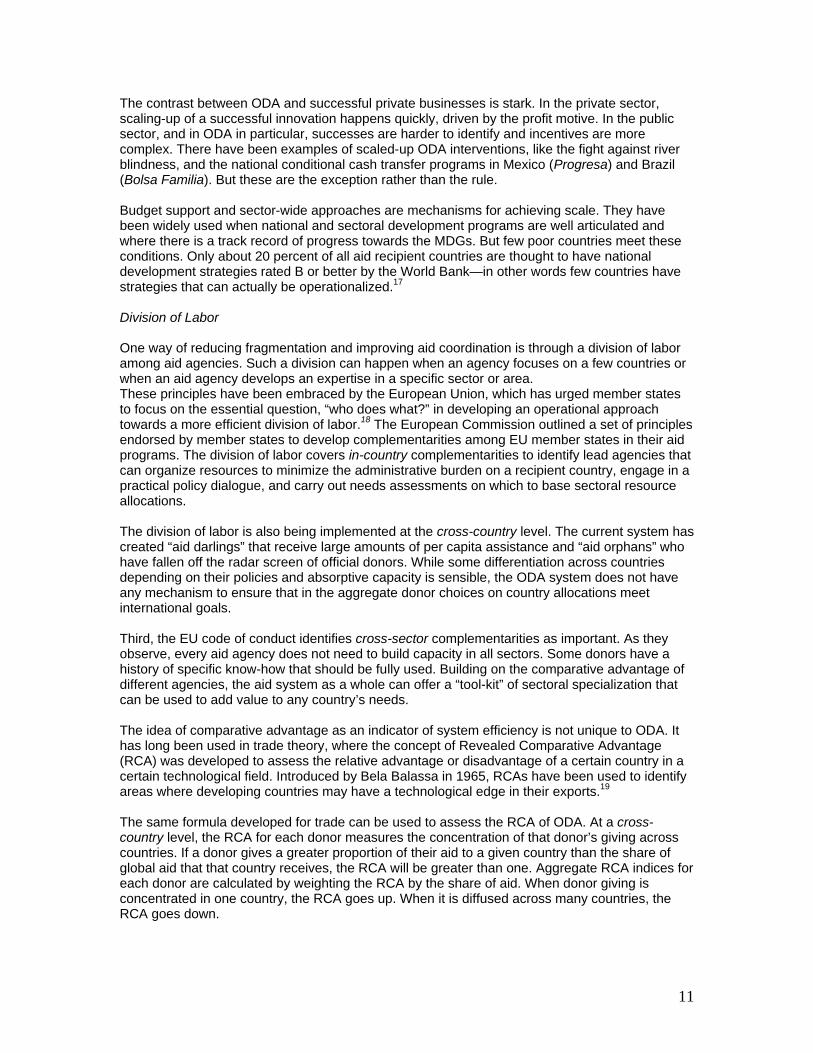
Food, supplies and money is also given for humanitarian purposes. This aid saves lives and millions of people are dependent on it. But its purpose is not for long-term development. Humanitarian assistance accounts for $8-9 billion annually in recent years. Last, to arrive at a figure for how much ODA is actually available for development projects and programs, a concept that can be termed Country Programmable Aid (CPA), one needs to subtract out amounts spent on administrative costs of bilateral aid agencies ($4.5 billion per year). Making these adjustments suggests that only 44 percent of ODA is actually available for long-term development projects and programs. And even this does not paint the full picture. Two countries, Iraq and Afghanistan, for special reasons, now account for $13 billion per year. Prior to 9/11, these countries were receiving only $380 million annually in ODA. Taken together, in the decade between 1996 and 2006, Country Programmable Aid for countries other than Iraq and Afghanistan increased by only $6.5 billion, or two percent per year. The non-CPA component of ODA grew by $28.5 billion or 5.7 percent annually. So while ODA has expanded, the amounts available for actual projects and programs outside Iraq and Afghanistan have not received the kind of major expansion envisaged in the rhetoric about providing the resources to meet the Millennium Development Goals. Figure 4 illustrates the breakdown for ODA in 2005-07. To see the impact of ODA, it is necessary to estimate the size of “leakages” and administrative expenses borne within the recipient country. Some studies, based on survey results of how much of the money allocated in the budget actually reached schools and clinics, have rough estimates that these leakages could be around fifty percent of all aid. If this is taken as a proxy for CPA as a whole, then the resource transfer from rich countries to poor beneficiaries may only be about 19 cents on the dollar. Less than half of this, 8 cents on the dollar, goes to sub-Saharan African countries. Fragmentation With an ever greater number of donors and donor agencies, aid budgets are being fragmented. In 2006, there were 81,000 new aid activity commitments registered with the DAC, up from 17,000 in 1996. At the same time, the mean size of each activity steadily fell, to a level of $1.6 million in 2006 from $3.2 million in 1996 (Figure 5). The median size of a new activity is now only $67,000. It appears that the increase in total ODA has come about by adding many small new projects rather than by scaling up what works.14 Small projects are not bad, per se. They are a source of experimentation and innovation. They can be exactly what are needed in isolated communities where small amounts of money can make a significant difference in lives. But fragmentation of ODA runs the risk of heavy administrative costs. Each project must be prepared, negotiated between governments, supervised and reported on. Official donors probably sent 30,000 missions in 2007 to manage their aid projects.

9
Figure 4: Aid Activity Fragmentation
0
1
2
3
4
1996 1998 2000 2002 2004 2006
Mea
n S
ize
(US
$200
6, m
ils)
0
30000
60000
90000
Num
ber o
f Act
iviti
es
Number of activities
Mean Size
Source: OECD/CRS and author’s calculations. Fragmentation has other costs. It can weaken domestic institutions by poaching scarce staff from key government positions to manage individual donor projects. It can cause a system that by-passes government structures and procedures, as small projects are less likely to be included in recipient country budgets.15 It can lead to a lack of government ownership.16 Official aid donors recognize this and have pledged to reduce their use of separate project implementation units (PIUs), but progress on this front has been slow. A survey to monitor implementation of the Paris Declaration targets for improved aid effectiveness found 2,473 active PIUs that are parallel to government systems. As the sample covered countries receiving a bit over half of ODA, it could be that the total number of parallel PIUs is around 5,000.

10
Figure 5:
Source: OECD/DAC and author’s calculations
Net ODA Transfer95.8
Although TC can accomplish worthwhile capacity building, it is valued at the salaries of donor-country consultants, often three times the rate of an equivalent expatriate NGO hire.
Debt relief is, in many ways, a simple write-off of misguided commercial loans made to poor countries in the past; it only provides new resources to the extent that debt service payments were actually being paid.
While critical in alleviating suffering, relief efforts are not targeted at long-term development and growth.
Headquarters-level administration does not represent any transfer to poor people.
Technical Cooperation,Imputed Student Costs
19.8
Debt Relief16.3
Humanitarian Relief, Refugee Costs
10.2
Administrative Costs4.4
Development Food Aid1.3
Country Programmable Aid
43.8
Iraq and Afghanistan6.3
Project administration, capture, and corruption
18.8 (estimate)
Final Beneficiaries18.8
(of which, 8 is to SSA)
How $100 of aid becomes $19 to beneficiaries (and $8 to African beneficiaries)Uses of aid, by percent share of net ODA, 2005-2007 average
Food aid is valued at cost, but inflated by at least 50% over recipient market values because of procurement and transport costs.
Interest Payments4.2
11
The contrast between ODA and successful private businesses is stark. In the private sector, scaling-up of a successful innovation happens quickly, driven by the profit motive. In the public sector, and in ODA in particular, successes are harder to identify and incentives are more complex. There have been examples of scaled-up ODA interventions, like the fight against river blindness, and the national conditional cash transfer programs in Mexico (Progresa) and Brazil (Bolsa Familia). But these are the exception rather than the rule. Budget support and sector-wide approaches are mechanisms for achieving scale. They have been widely used when national and sectoral development programs are well articulated and where there is a track record of progress towards the MDGs. But few poor countries meet these conditions. Only about 20 percent of all aid recipient countries are thought to have national development strategies rated B or better by the World Bank—in other words few countries have strategies that can actually be operationalized.17 Division of Labor One way of reducing fragmentation and improving aid coordination is through a division of labor among aid agencies. Such a division can happen when an agency focuses on a few countries or when an aid agency develops an expertise in a specific sector or area. These principles have been embraced by the European Union, which has urged member states to focus on the essential question, “who does what?” in developing an operational approach towards a more efficient division of labor.18 The European Commission outlined a set of principles endorsed by member states to develop complementarities among EU member states in their aid programs. The division of labor covers in-country complementarities to identify lead agencies that can organize resources to minimize the administrative burden on a recipient country, engage in a practical policy dialogue, and carry out needs assessments on which to base sectoral resource allocations. The division of labor is also being implemented at the cross-country level. The current system has created “aid darlings” that receive large amounts of per capita assistance and “aid orphans” who have fallen off the radar screen of official donors. While some differentiation across countries depending on their policies and absorptive capacity is sensible, the ODA system does not have any mechanism to ensure that in the aggregate donor choices on country allocations meet international goals. Third, the EU code of conduct identifies cross-sector complementarities as important. As they observe, every aid agency does not need to build capacity in all sectors. Some donors have a history of specific know-how that should be fully used. Building on the comparative advantage of different agencies, the aid system as a whole can offer a “tool-kit” of sectoral specialization that can be used to add value to any country’s needs. The idea of comparative advantage as an indicator of system efficiency is not unique to ODA. It has long been used in trade theory, where the concept of Revealed Comparative Advantage (RCA) was developed to assess the relative advantage or disadvantage of a certain country in a certain technological field. Introduced by Bela Balassa in 1965, RCAs have been used to identify areas where developing countries may have a technological edge in their exports.19 The same formula developed for trade can be used to assess the RCA of ODA. At a cross-country level, the RCA for each donor measures the concentration of that donor’s giving across countries. If a donor gives a greater proportion of their aid to a given country than the share of global aid that that country receives, the RCA will be greater than one. Aggregate RCA indices for each donor are calculated by weighting the RCA by the share of aid. When donor giving is concentrated in one country, the RCA goes up. When it is diffused across many countries, the RCA goes down.

12
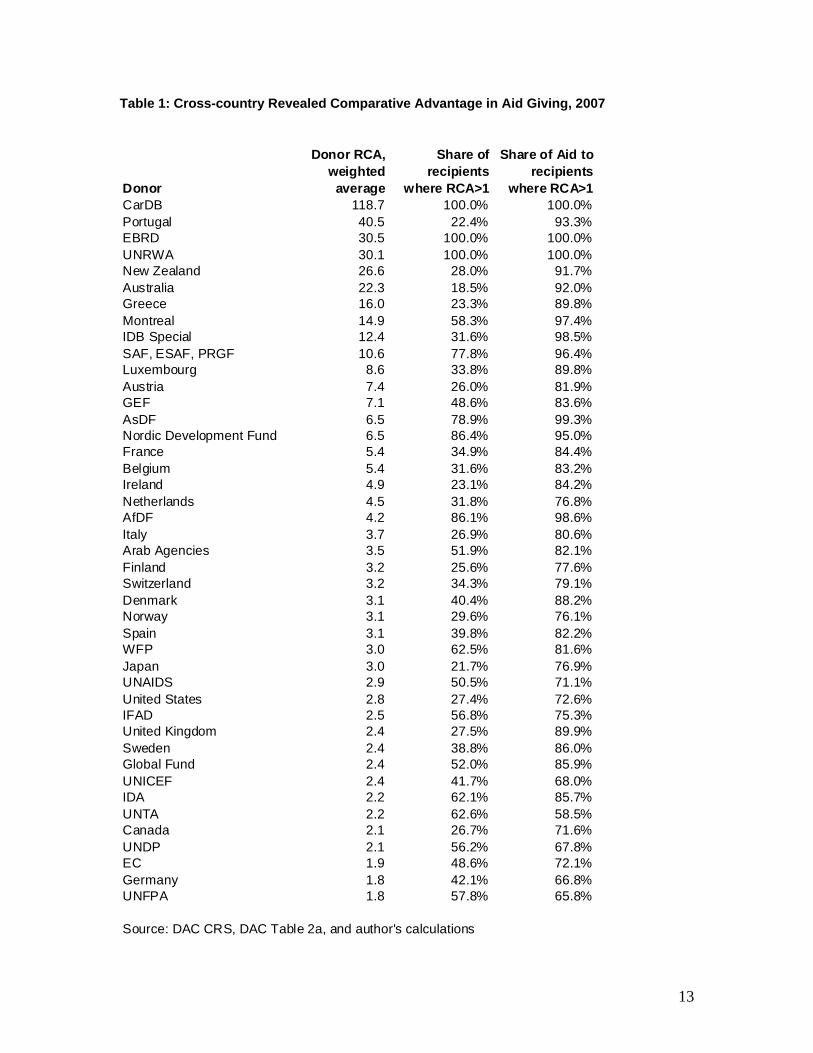
The cross-country RCA measure directly tackles the issue of aid darlings and orphans. When many countries give aid to the same recipient, the RCA for donors to that country automatically falls. Conversely, when few other donors give money to a country, it is easy to have a high RCA. Table 1 shows the results for 42 donor countries and multilateral agencies. Specialized bodies like the Caribbean Development Bank, the European Development Bank and the Inter-American Bank Special Fund have very high RCAs. Countries which concentrate their aid on a few regional neighbors, like Australia which gives sizeable aid to Papua New Guinea, or New Zealand which helps many small Pacific islands, also score highly. By contrast, aid donors that have a global outreach, like IDA, the United Nations agencies and the EC, have the most dispersed aid. Germany stands out as a bilateral whose aid goes largely to countries where others are also big givers—its RCA is the lowest by far. While useful, this measure of the cross-country RCA introduces a bias against donors who are global players that have a relationship with all developing countries. An alternative measure asks what share of a donor’s aid goes to countries where it has a comparative advantage greater than one. For example, African Development Fund provides nearly 99 percent of its resources to countries where it has a comparative advantage. In general, multilateral agencies score much better than bilateral countries on this measure.
13
Table 1: Cross-country Revealed Comparative Advantage in Aid Giving, 2007
Donor
Donor RCA, weighted
average
Share of recipients
where RCA>1
Share of Aid to recipients
where RCA>1CarDB 118.7 100.0% 100.0%Portugal 40.5 22.4% 93.3%EBRD 30.5 100.0% 100.0%UNRWA 30.1 100.0% 100.0%New Zealand 26.6 28.0% 91.7%Australia 22.3 18.5% 92.0%Greece 16.0 23.3% 89.8%Montreal 14.9 58.3% 97.4%IDB Special 12.4 31.6% 98.5%SAF, ESAF, PRGF 10.6 77.8% 96.4%Luxembourg 8.6 33.8% 89.8%Austria 7.4 26.0% 81.9%GEF 7.1 48.6% 83.6%AsDF 6.5 78.9% 99.3%Nordic Development Fund 6.5 86.4% 95.0%France 5.4 34.9% 84.4%Belgium 5.4 31.6% 83.2%Ireland 4.9 23.1% 84.2%Netherlands 4.5 31.8% 76.8%AfDF 4.2 86.1% 98.6%Italy 3.7 26.9% 80.6%Arab Agencies 3.5 51.9% 82.1%Finland 3.2 25.6% 77.6%Switzerland 3.2 34.3% 79.1%Denmark 3.1 40.4% 88.2%Norway 3.1 29.6% 76.1%Spain 3.1 39.8% 82.2%WFP 3.0 62.5% 81.6%Japan 3.0 21.7% 76.9%UNAIDS 2.9 50.5% 71.1%United States 2.8 27.4% 72.6%IFAD 2.5 56.8% 75.3%United Kingdom 2.4 27.5% 89.9%Sweden 2.4 38.8% 86.0%Global Fund 2.4 52.0% 85.9%UNICEF 2.4 41.7% 68.0%IDA 2.2 62.1% 85.7%UNTA 2.2 62.6% 58.5%Canada 2.1 26.7% 71.6%UNDP 2.1 56.2% 67.8%EC 1.9 48.6% 72.1%Germany 1.8 42.1% 66.8%UNFPA 1.8 57.8% 65.8%
Source: DAC CRS, DAC Table 2a, and author's calculations

14
The same approach can be used to gauge the cross-sectoral specialization of countries and multilateral agencies. When a country is more focused on a particular sector than that sector represents in total global aid, it is said to have a revealed comparative advantage in aid in that sector. Using this measure, it is possible to compare the degree of specialization across countries and agencies. Table 2 shows the results.20 Multilateral agencies tend to be more specialized than bilateral countries. Table 2: Cross-sector Revealed Comparative Advantage in Aid Giving, 2007
Donor
Donor RCA, weighted
average
Share of recipients
where RCA>1
Share of Aid to recipients
where RCA>1UNAIDS 11.3 100.0% 100.0%UNFPA 11.3 100.0% 100.0%Global Fund 7.8 100.0% 100.0%IFAD 7.4 100.0% 100.0%New Zealand 7.0 34.6% 85.7%Greece 6.6 26.9% 74.2%Portugal 4.1 34.6% 87.7%UNICEF 4.0 58.3% 84.3%Austria 4.0 25.0% 67.5%UNDP 3.9 29.6% 89.4%IDB Sp.Fund 2.8 77.8% 91.8%France 2.8 45.5% 82.9%Australia 2.8 35.7% 86.9%AsDF 2.8 60.0% 85.4%Italy 2.5 48.3% 70.7%Luxembourg 2.3 53.8% 85.5%Germany 2.2 31.0% 61.4%United Kingdom 2.1 35.7% 88.5%Finland 2.1 42.3% 83.1%Sweden 2.1 41.7% 72.8%AfDF 2.1 63.6% 89.7%Canada 2.0 40.0% 72.0%Japan 2.0 46.7% 72.8%Spain 2.0 50.0% 71.3%Switzerland 1.9 39.1% 71.2%Denmark 1.8 52.0% 75.3%Ireland 1.7 41.4% 84.9%Netherlands 1.7 46.4% 80.1%IDA 1.7 39.1% 73.4%Norway 1.6 48.3% 78.4%United States 1.4 39.3% 75.6%Belgium 1.4 44.8% 60.1%EC 1.4 44.4% 79.6%
Source: DAC CRS and author's calculations The RCA calculations can be used to see the focus of donors, both by recipient country and by sector. Table 3 below shows these focus areas for major donors. For context, the table also displays the global mean and standard deviation of the relevant measure. For example, the United States is seen to focus its aid on Iraq, with some attention given to North Korea as well. It

15
has a relatively weak sectoral focus, with its highest RCA in the trade policy sector standing about one-half standard deviation above the mean. Norway, by contrast, focuses on mineral rich countries: Peru, Chile and Sudan. Its specialization is in mineral resource and mining, as well as peace and conflict resolution. The pattern seems to be that there is a much greater tendency to focus on selected countries, which may have special ties to a donor for historical or geopolitical reasons, rather than a tendency to focus by sector. Few of the major donors have strong RCAs in major development sectors. Most of them, however, are present in most sectors. That is why one finds multiple donors active in any given sector in many countries. This proliferation of voices and approaches within the same sector makes in-country aid coordination complex. It also implies that donor agencies cannot develop specific expertise in a sector. They become generalists. That, too, mitigates against effective development interventions. Volatility Net ODA disbursements, as seen from the perspective of a recipient country, are highly volatile and this diminishes their value. From the early days of development assistance, the Resolution of the Common Aid Effort in 1961 recognized that “assistance provided on an assured and continuing basis would make the greatest contribution to sound economic growth in the less-developed countries”.21 Unfortunately that understanding has not been put into practice. Large aid shocks are rare but eventful. For poor countries, aid shocks have been as large, in terms of loss of national income, as the major global economic shocks faced by rich countries over the last century, namely the Great Depression, the two World Wars and the Spanish Civil War (and perhaps the current global recession). The risk of an aid cut-off, in aid dependent economies, may have significant consequences for how aid is used. It is useful to focus on crisis-sized episodes of aid crises because there is strong empirical evidence that crises are what matter most in reducing growth. Aid crises have significant disruptive effects on exchange rates, public investment, and inflation. Sound macroeconomic policy, universally acknowledged as the foundation of growth and development, is impossible with high aid volatility, especially if such volatility tends to compound the normal business cycle. At a macro level, the volatility of CPA is seven times as big as the volatility in GDP and three and a half times as big as the volatility of exports.

16
Table 3: Focus Areas of Selected Donors Donor Country RCA (World Mean = 1.78, sigma = 5.2) Sector RCA (World Mean = 1.36, sigma = 2.1)
USA Iraq (5.8); N. Korea (3.6) Trade Policy (2.47)
IDA Liberia (5.47); Sierra Leone (5.16); Sao Tome & Principe (5.13) Secondary education (3.03)
Japan Malaysia (8.35); Phillipines (5.79); Thailand (4.35); Paraguay (4.11); China (4.08); Indonesia (4.06)
NGOs (7.88); Forestry (6.48); Communications (4.97)
EC Croatia (5.79); Turkey (4.55); Dominican Republic (4.52); Jamaica (4.28)
Trade Policy (2.86)
France Wallis & Futuna (17.65); Mayotte (17.64); Gabon (12.18); Mauritius (10.54); Algeria (9.95); Djibouti (7.84); Tunisia (6.88); Moroco (5.46); Central African Republic (5.3); Congo, Rep. (5.17); Lebanon (4.63); Togo (4.61); Brazil (4.50); Cameroon (4.31); Costa Rica (4.01); Senegal (3.68)
Post-secondary Education (6.19); Secondary Education (3.15)
UK Zimbabwe (5.44); Nigeria (5.03); India (3.85) Construction (11.16); Health, general (5.42)
Germany Iran (8.02); Chile (4.97); Brazil (4.05); Syria (3.7) Post-secondary Education (5.16); Banking and Financial Services (4.09)
Spain Ecuador (10.06); El Salvador (9.24); Argentina (8.81); Guatemala (7.62); Namibia (5.63); Algeria (5.62); Peru (5.05); Cape Verde (4.92); Costa Rica (4.82); Dominican Republic (4.76); Mauritania (4.71); Colobmia (3.91); Guinea-Bissau (3.9)
Tourism (18.04); Construction (11.82); Fishing (9.47)
Netherlands Suriname (32.72); Sudan (6.12); Ghana (5.36); Yemen (3.88); Gambia (3.75)
Basic Education (3.78)
Canada Haiti (7.04) Construction (3.52); Mineral Resources and Mining (3.41); Banking and Financial Services (3.27)
AsDF Sri Lanka (9.04); Laos (8.38); Bangladesh (8.37); Pakistan (8.29); Tajikistan (8.07); Nepal (7.22); Kyrgz Republic (5.51); Mongolia (4.81); Cambodia (4.35); Bhutan (4.35)
Fishing (8.16)
GFATM Namibia (7.06); Togo (6.91); Thailand (6.46); Malawi (5.60); Somalia (5.46); Eritrea (4.45); Gambia (4.43); Zimbabwe (4.08); Uzbekistan (3.82); Cote d'Ivoire (3.8)
Basic Health (8.1); Population and Reproductive Health (7.6)
Norway Chile (15.26); Peru (7.7); Sudan (5.56); Somalia (5.43); Zambia (4.38); Malawi (4.13); Nepal (3.85)
Mineral Resources and Mining (12.8); Conflict, Peace and Security (3.49)
Australia Solomon Islands (49.58); Papua New Guinea (47.94); Timor-Leste (18.82); Indonesia (7.86)
Government and Civil Society (3.25)
Sweden Bosnia (5.84); Guatemala (5.43); Moldova (4.51); Somalia (4.3); Tajikistan (4.21); Mozambique (3.99); Zambia (3.87); Ukraine (3.77)
Industry (4.39); Conflict, Peace and Security (4.0)
(RCA in parenthesis)
Source: DAC CRS, DAC Table 2a, and author's calculations

17
If aid expanded when countries faced external shocks, and contracted in times of global prosperity, volatility in aid could even be good, a useful way of counteracting shocks in the global economy. Unfortunately, exactly the opposite seems to be the case. From a recipient country point of view, aid declines when macro conditions in a country worsen. This is perhaps because aid disbursements are often linked to the ability of countries to raise counterpart funds, or perhaps because donors become more reluctant to provide aid when budget deficits worsen. Regardless of the cause, as an empirical regularity, aid disbursements have been procyclical with respect to the economic cycle in recipient countries, expanding when fiscal revenues and spending expand and contracting when these contract. That is highly disruptive of long-term development programs.22 Donors have made some efforts to address this issue, for example by making multi-year commitments to selected recipient countries with good track records, but these efforts are still small compared to overall aid volumes. Other instruments, like credits with contingent repayment terms, or automatic countercyclical budget support for countries with good track records, have not been piloted. At a micro level, volatility can affect fiscal planning and the level and composition of investment. A typical example is from the budget speech of the Minister of Finance for Kenya in 1998/9: “although some programme grants and loans may materialize during the course of the year, if and when such additional resources materialize, I will use them for reducing our outstanding domestic debt.”23 Ten years later, the same sentiments were expressed in the 2008/9 Budget Speech: “consistent with our financial independence strategy, we have not factored in uncommitted budget support...” It is tempting to blame aid volatility on exogenous shocks. After all, humanitarian crises cannot be predicted and it is not surprising that aid should increase when there is a shock and decline when the emergency is over. To correct for this, it is possible to measure the volatility of country programmable aid rather than total aid. CPA removes humanitarian assistance, debt relief and other elements and focuses on resources available for long-term development projects and programs. The results of the calculations of volatility are the same, however. CPA is just as volatile as total aid or humanitarian aid. This may seem surprising, but it has an obvious explanation. Most donors pass budgets for total aid. If funds are needed to manage an emergency in a specific country, they are taken from elsewhere in that country’s aid program or from aid programs for other countries. In this way, any increase in humanitarian aid becomes a fall in CPA. The volatilities are linked. Of course, some volatility has to do with recipient country behavior. Kenya was cut off from aid in 1991 when donors started to focus more on governance as a pre-condition for aid. Thus, one can imagine that aid may be more volatile in weak or fragile states, where political volatility is high. There is, however, little empirical evidence to suggest that this is systematically the case. Aid volatility is just as high in strong states as in weak states; in Africa as in East Asia; in low income states as in middle income states; in aid dependent states as in non-aid-dependent states. In fact, there is considerable consistency in volatility across different aid recipient characteristics.24 By contrast, there is much more divergence in volatility of individual donors. Each donor’s contribution to aid volatility can be calculated by looking at its contribution to the total volatility of a recipient country. For example, if volatility arises because of issues in the project portfolio of any one donor, it may not be of great significance to aggregate volatility of the recipient country. It can be diversified away if the recipient country has a portfolio of donors. But if volatility comes about because of coordinated action by donors, it is much more significant. Calculating volatility in terms of a portfolio of aid is therefore important for determining its impact.

18
It is a standard precept of finance theory that a risky or uncertain cash flow is less valuable than a risk-free, steady cash flow, even when both have same expected net present value. Applying the same principles and techniques to value ODA suggests that the uncertainty over how much a country will actually receive reduces its value to the recipient of around 15 to 20 percent.25 That means the deadweight loss attributable to aid volatility may be around $18 billion in today’s prices. Much of this could be avoided if donors take adequate steps. There is considerable variance between donors on the extent of the volatility of their aid, with some managing to maintain steady, predictable flows by institutionalizing aid allocation mechanisms. Other donors prefer to retain greater flexibility over aid allocations, and retain considerable conditionality in disbursement processes. If recipient countries fail to meet conditions, considerable volatility in disbursements can occur. The Paris Declaration on aid effectiveness, endorsed in 2005, started to recognize the importance of this issue and urged donor countries to improve the predictability of their aid. But an implementation follow-up survey in 2007 revealed that only 45 percent of aid was actually disbursed according to the schedule recorded in country budget systems. This suggests that ODA volatility, like other cash flows, has a component of risk—the volatility of scheduled aid flows—and a component of uncertainty—the issues surrounding the unpredictability of disbursing aid, even when it is scheduled. KEY ISSUES IN PRIVATE DEVELOPMENT ASSISTANCE Warren Buffett made headlines in 2006 by announcing that he was earmarking 85 percent of his wealth to six foundations, an amount currently valued at about $44 billion, the largest philanthropic gift in history.26 “I know what I want to do and it makes sense to get going.”27 This declaration highlights, in a somewhat celebrity fashion, the importance of private sector giving in the landscape of global aid. Private aid includes not only generous gifts from philanthropists like Buffet, but also funds from foundations, corporations, private voluntary organizations (PVOs), universities, and religious organizations. Taken together, the private sector may contribute around $60 billion per year to developing countries.28 As a group, these private flows have a scale that is significant, even when compared to ODA. As demonstrated above, only about $40 billion of ODA actually were made available for development projects and programs in recipient countries in the form of CPA. The private sector may be smaller in scale, but more of its money goes directly to recipient countries. InterAction, the US umbrella organization for private giving, estimates that 92 percent of its members’ revenues are spent on projects and programs. To compare public and private CPA, the same deductions must be made for private development assistance as were made for the official sector. First, humanitarian assistance must be deducted. As international relief organizations make up about 36 percent of total non-profit revenues, about $22 billion of private aid can be assumed to go for relief efforts. Second, overheads and administrative expenses of about $4-5 billion should be deducted.29 The implication is that private aid for development projects and programs may be around $33 billion. Because there is no data collecting agency for the private sector (unlike OECD for the public sector), it is difficult to ascertain specific historic trends in private aid flows. However, a few trends do emerge from the limited data that is available, and all point to rapid growth. There has been an explosion of private foundations in the last decade, with a growth rate of 77 percent in the U.S. alone (37,600 in 1993 to 66,400 in 2003).30 NGOs have experienced growth as well, with the World Bank citing international NGO growth between 1990 and 1999 as more than quadrupling from 6,000 to 26,000.31 Similarly, religious organizations experienced high growth rates, with the U.S. reporting that charitable religious organizations grew at the highest rate of all new non-profit organizations registered with the IRS.32 In the corporate world, terms like “corporate social

19
responsibility” and “social entrepreneurship” have become important elements of mainstream corporate strategies, and new corporate-philanthropic hybrids have emerged, like Google.org. In short, the private sector’s international giving has been exploding over the past decade. Even in the face of current difficult economic circumstances, private giving may not fall back—many organizations believe that the long-term reputational benefits, and the increased leverage they get in hard times, makes it even more attractive to sustain giving in bad times. Why did private giving expand so rapidly in the 1990’s? Some cite globalization, the expansion of democratic governance, and information technology infrastructure for project delivery.33 Others cite a new-age generation of donors who have made money in the venture capital world and are convinced that the same technique can be used to solve the most pressing global problems, like poverty reduction.34 Still others argue that the public is losing faith in ODA, frustrated by the bureaucracy and inefficiencies of large organizations. A bipartisan US Congressional Commission bluntly stated: “Our foreign assistance system is broken. We ignore this reality at our peril.”35 Each of these reasons points to private aid as an increasingly impatient response to ODA. Private givers see opportunities for faster, cheaper, more effective solutions. They are bringing a new dynamism to efforts to solve global poverty problems. Can they succeed? There are skeptics who point to three basic problems that the private sector must deal with: collective action, transaction costs, and agency costs. Collective Action The public economics literature suggests that collective action problems may block private giving even for worthy causes. If each individual would like to contribute to a cause, but only on condition that others also help shoulder the cost burden, then there is a need to organize a group solution, or else rational individuals will not act. Usually, this is resolved by the government. Governments can tax their citizens, and contribute the proceeds to the causes to which individuals would want to give. It is possible to test empirically whether collective action problems occur. One common approach is to see whether individual donations are smaller in sectors where the government’s contribution is larger. If there was such crowding-out, it would suggest that there was a collective action problem which had been addressed by the government. A review of the literature by Bekkers and Wiepking (2007) finds evidence that crowding-out is significant in the United States. Their summary mostly looks at cross-section studies.36 Garrett and Rhine (2007) analyze time-series for 1965-2003 and reach the same conclusion. In the long run, cointegration tests show that increased government spending crowds out charitable giving, especially in the education sector.37 In the short run, however, the effect is weaker and not significant. The authors suggest that it may take time for individuals to get full information on what the government is doing. Andreoni and Payne (2008) also confirm the crowding-out effect in a large sample of charities. They demonstrate that crowding out occurs through two channels: classic crowding out (where donors feel less willing to give) and fund-raising crowding out (where grant receiving organizations reduce their activity to collect donations). Their evidence suggests that fund-raising crowding out accounts for 68 percent of the observed crowding-out effect.38 Crowding-out, or collective action issues, presuppose rational individuals with well-defined utility functions. If utility, however, is derived from altruism itself, then collective action issues disappear. There is some evidence this may be the case and that altruism is an important motivation in private giving. Moll, et al. provide experiments39 that show that giving charitable donations triggers brain activity in the subgenual cortex/septal region, areas related to social attachment and bonding in other species. They conclude that altruistic behavior may be hard-wired into

20
humans. Kosfeld (2008) also emphasizes that trust in other humans is a biologically-based part of human nature.40 His experiments show that the presence of oxytocin, a hormone that reduces social anxiety and helps people meet and bond with each other, is also linked with a greater degree of trust that good behavior will be reciprocated. Transaction costs Official aid is perceived to have low transaction costs because it operates at large scale. But official aid travels a long route, with costs at each stage. The first stage is the cost of tax collection when money is transferred from individuals to the Treasury. In this stage, direct administrative costs of tax collection as well as deadweight losses from taxation are incurred. These costs can be substantial. For example, Alm (1985) found that although direct administrative costs of tax collection in the United States are small, deadweight losses on US taxes could approach nine percent.41 In the second stage, funds are transferred to recipient country governments to support specific development projects and programs through official development agencies. The administrative costs of these agencies has averaged four to five percent according to the Development Assistance Committee of the OECD. The third stage involves costs associated with transferring the money from the recipient government to final beneficiaries through project implementation. Administrative costs of the project, corruption and other leakages mean that only about half the funds actually reach their stated end purpose. One study, based on surveys in Ghana, Tanzania and Rwanda, concludes that “approximately half of the overall amount allocated to clinics and hospitals did not actually reach them.”42 In some cases in that study, the share reaching beneficiaries is even lower. Similar figures appear in other studies. The GAO, in its recent analysis of the Millennium Challenge Corporation was able to identify the allocation of 59 percent of in-country disbursements in the nine compact countries that are currently operational.43 Of this, 32 percent was for direct project-related expenses, and 27 percent was for administrative, audit, fiscal and procurement expenses.44 Adding all these together, transaction costs on official aid could amount to 60 percent or more. Private aid offers the promise of a much shorter route from giver to recipient. For example, internet-based platforms offer a direct matching between the two. Organizations like Kiva.org provide a person-to-person link, matching individual donors and microentrepreneurs in developing countries. Its feedback mechanisms and other information on the site are all geared towards establishing a connection between people. In private giving, the flow of funds route is short. The money goes from an individual to the internet platform, where it is pooled before being transferred to a financial intermediary in the recipient country that then disburses to the final beneficiaries. The long route of passing through government bureaucracies is avoided. Kiva.org reports its administrative costs for developing and maintaining the web-sites and providing the matching and information services that permits the short route of funding from person to person to occur. Those costs have averaged around 10 percent. They may fall as Kiva expands its operations. Higher transaction costs are incurred in the financial intermediary that conveys the money from Kiva to the micro entrepreneur and that collects repayments. Studies suggest that the interest rates of sustainable microfinance institutions have been declining over time, averaging 26.4 percent in 2006. 45 This rate covers the cost of funds, default risk, operating expenses and profits: using just this example, the transaction costs for private giving is probably lower than those of official ODA.

21
Agency Costs Official development agencies have considerable experience of development activities. Most have active evaluation mechanisms, strong project review and implementation structures, and appropriate financial controls. On the other hand, one large source of official aid agency costs came from tied aid, a practice where procurement was linked to the country of origin of the funds. It is unlikely that altruistic individual donors would care about whether a particular good or service was procured from a specific country, whereas it is more obvious why a national government may care about such linkages. Estimates of the cost of tied aid vary, but averaged 15 to 30 percent. For some types of aid, like technical cooperation, tying to domestic firms may be even more costly.46 Private aid organizations have fewer formal structures to monitor effectiveness. They eschew networks of (expensive) field offices in recipient countries, and rely instead on past experiences as well as on partnerships with local frontline NGOs. Of the thousand or so NGOs operating internationally, a tiny portion has been evaluated.47 The available evidence is mixed. One study of several European NGOs found that NGO aid per capita had a limited effect on infant mortality and female illiteracy in recipient countries. An examination of Swedish NGOs found that the selection of potential recipients was less affected by policy considerations as was the case with official aid, but that the funds did not out-perform official Swedish aid. NGOs are also susceptible to financial misconduct.48 While there are reasons to believe that NGOs may be less vulnerable to corruption, some notes of caution are necessary. In the first place, the history of charity is replete with scandals involving misappropriations of funds and theft. High-profile incidents include the misuse of children's aid funds by U.S.-based groups in the late 1990s, the American Red Cross's use of 9/11 donations for other causes, and a series of questionable land deals by the Washington, DC-based Nature Conservancy in 2003. A study by Harvard University’s Hauser Center for Nonprofit Organizations listed 152 incidents of misconduct by U.S. nonprofits between 1995 and 2002, including 104 cases of criminal activity.49 These may be no more alarming than recent corporate cases, but as NGOs operate more and more like businesses, there will inevitably be a greater need for tighter rules and enforcement. While many large NGOs have strong internal rules, NGOs as a class are generally much less transparent than either business or government.50 As NGOs increase in scale and scope, the importance of transparency and oversight is clear. But in practice, even those who think that NGOs should be accountable cannot agree on how to accomplish that goal. Who should be the judge of success? What metrics should be used? What evaluation methodologies to permit benchmarking across NGOs? Agency issues are less pronounced for foundations and corporations. In the case of the former, accountability is squarely to the principle donor. Corporations have their own accountability structures. Most importantly, the tension between corporate social responsibility and long-term profits appears to have declined. More and more corporations find it in their bottom-line interest to participate in development assistance. The most significant change in agency costs, however, is the fresh business approach that the private sector is bringing to development assistance. Groups like Effective Intervention in the UK believe there is more room for science and rigorous analysis in improving foreign aid. Each of the projects that Effective Intervention supports has a pre-specified analysis plan. They work with local partners and governments to achieve narrowly focused goals in health. The case of Effective Intervention shows how even small foundations can enter the development arena. Collective action issues have been resolved by reducing scale to a level which a single

22
donor can manage. Transaction costs have been brought down by working with local partners. Agency costs have been reduced by clarity in specifying exactly what needs to be done. In short, all the reasons why private international development assistance was subordinated to official aid have diminished over time and new organizations are springing up to enter the development field. CONCLUSION The international aid architecture is no longer delivering the benefits of institutional coordination that it was originally designed for. New players, public and private, new technologies and new development problems call for a fundamental redesign. It is no longer possible, nor desirable, to plan and coordinate what each player should do; the system is too decentralized. Rather, the new aid architecture must provide information that is useful for each player to determine their own strategies to best effect. What might that look like? This paper argues that new aid architecture must start with better aid data and metrics of performance. It is worth returning to the principles of aid coordination that guided the construction of today’s architecture. First, the aid architecture was designed to achieve burden sharing between nations and to mobilize and generate public support for development assistance. Today, that seems anachronistic. Although sporadic efforts have been made to use international commitments to increase official development assistance, these have been more effective at the regional level than at the global level. The European Commission, in particular, has been able to use the need for efficient aid architecture to advance its broader objectives of achieving a uniform European approach to foreign policy. The architecture has not been helpful in getting the USA and Japan to increase their contributions to ODA. Nor does it seem to be useful in bringing non-DAC bilateral players into the common fold. Those countries have increased ODA on their own terms. The expansion of private aid suggests that the emphasis on a need to coordinate within and across donor nations is exaggerated. International public opinion is heavily in favor of foreign aid. In recent polls, 57 percent of Americans say the US should give about the same amount in foreign assistance as other countries, but at the same time 69 percent think the US gives more.51 The reality is that US giving is the lowest of any DAC country as a percent of its GDP. That may be one reason why informed, concerned Americans give more to international causes than private citizens in other countries. In Europe, 91 percent of people think it very important (53 percent) or fairly important (38 percent) to help people in poor countries.52 The depth of public support for international assistance suggests that international aid coordination is not needed to maintain support. National politics can do the trick. In the new aid architecture, the key requirement will be for accurate information about who is giving what to whom. There is scope for donor countries to educate their population about development issues and the potential for individual engagement. Collective action will give way to individual action as long as individuals can see a roadmap of how they can help bring about change. This means unbundling aid into its components and clarifying the distinction between types of aid. In particular, programmable aid for development projects and programs should be separated from broader measures of aid. The second function of the aid architecture is to coordinate better to achieve maximum development impact. Matching resources to needs across countries and across sectors within countries is a complex undertaking. Maximum development impact does not occur when individual decisions lead to herd behavior by donors, with overlap in some areas and inaction in others.

23
In this sphere, there is much to be done. A first requirement is that each donor country should be able to coordinate its own official aid across multiple agencies. Some countries have already moved in this direction, with the Department For International Development in the UK and the Japanese International Cooperation Agency both organized to deliver the vast bulk of their respective country aid programs. In these cases, not only is aid coordinated, but aid is also coordinated with other programs that can affect development, like trade policy and security policy. Whole-of-government approaches, popularized by Australia in its revamp of international assistance, lend coherence to official aid which is much needed. The European Commission is playing its part by establishing common rules and norms across European countries, but the EC does not represent its member countries in aid coordination forums. The single largest outlier is the United States, where agency proliferation has created major problems in overlap of functions. There is far more to do to coordinate among different players. Little is known about the geographic allocation of private aid, or about the sectors in which it is active. When private aid was small, this did not matter to the general outlines of where aid went. Today, it is an urgent need. Umbrella organizations of civil society groups, like InterAction in the United States or Concorde in Europe, could provide an institutional basis for encouraging members to provide better statistical information on their activities. Similarly, the broad contours of non-DAC official aid are hard to see. While there is growing anecdotal evidence of how important these players are, there is little understanding of exactly how much resources they provide, to whom and on what terms. The core of a 21st century aid architecture should be its ability to provide information on where aid needs are greatest and where resources are flowing. What is more, public and private aid agencies need to build up their expertise in selected areas. Unlike in a marketplace, there are no competitive pressures on aid agencies. Many aid agencies have been born in the past fifty years. None have died. A better division of labor between agencies is needed. In many cases, public and private agencies can complement each other. The aid architecture must help in finding these complementary areas. It can do so by providing the basis for metrics such as the revealed comparative advantage measure used in this paper. Along with other information, such metrics can guide aid donors’ decisions in terms of the strategic directions they should take. Gaps in the system should be readily identifiable. For example, many agencies today have turned away from cross-cutting areas like urban development, early child development, land titling and property rights, and scientific and agricultural research. Private players moved into the area of randomized trials when it became clear that official agencies were not doing sufficient work in this area. That type of information can push the system towards greater effectiveness. Third, efficient aid architecture should generate long-term, assured and continuous funding at concessional terms for the poorest countries. The more aid donors there are, the greater the likelihood of more stability in aid funding flows. An architecture where true recipient ownership is respected would be helpful. This is new territory for private aid givers. They have not organized to engage in broad-based policy dialogue with governments in a way that would give them comfort to engage over a long term in a country. In fact, they have often been critics of local governments, moving to provide critical public services where local capacity is lacking. This can put private aid givers into adversarial situations. An effective in-country aid architecture can provide institutional mechanisms for resolving such conflict. In-country aid coordination is a key foundation for an international system of aid coordination which is as yet unaddressed. The Paris Declaration sets broad targets, but does not specify how this is to be implemented at the country level.53 While not yet properly tested, modalities such as joint country assistance strategies in specific countries, or sectoral strategies in specific countries, offer one way of reinforcing the new aid architecture. Such exercises are, however, costly and
24
fraught with difficulties as is understandable given the complexity of the problem. They need to be clear on the purposes to be achieved though coordination. More broadly, there is an urgent need to improve the capacity of countries to develop their own national and sectoral strategies and for donors to adapt to these rather than vice-versa. One clear purpose of coordination at the recipient country level must be to reduce the volatility of aid, except in circumstances where aid is perceived to be damaging development—the Samaritan’s Dilemma. There are metrics which suggest that volatility is a first-order problem and that the current system, even with its emphasis on predictability, has not resolved the problem in a meaningful way. As the impact of volatility of each donor depends on the actions of other donors, coordination is desirable. Metrics on volatility can help improve the system. Fourth, the aid architecture must focus squarely on evaluation of effectiveness. The challenges are well-known. Fragmentation is now acknowledged as a major issue, but few specifics have been advanced to deal with it. Public aid agencies must do more to focus on achieving results on a scale commensurate with the problems they are trying to resolve. Private aid groups must indicate how they are contributing to the great challenges of the age, exemplified by the Millennium Development Goals. A better aid architecture, by identifying who is active in which sector, at what scale and with what results, can help spread the faster dissemination of good development experiences across all agencies.
25
References Alm, James (1985). "The Welfare Cost of the Underground Economy," Economic Inquiry 23. Andreoni, James and A. Abigail Payne (2008). “Crowding out Both Sides of the Philanthropy
Market,” available at: http://econ.ucsd.edu/~jandreon/WorkingPapers/andreoni_payne2.pdf.
Balassa, B. (1965). “Trade Liberalization and Revealed Comparative Advantage,” The
Manchester School, 33, 99-123. Bekkers, Rene and Pamala Wiepking (2007). “Generosity and Philanthropy: A Literature Review,”
available at: http://papers.ssrn.com/sol3/papers.cfm?abstract_id=1015507. Brautigam, Deborah (2008). “China’s Africa Aid: Transatlantic Challenges,” The German Marshall
Fund Paper Series (Washington: German Marshall Fund). Brooks, David (2008). “Thoroughly Modern Do-Gooders,” The New York Times, March 21. Chauvin, Nicolas Depetris and Aart Kraay (2007). "Who Gets Debt Relief?" Journal of the
European Economic Association 5(2/3). Cuaresma, Jesus Crespo and Gallina Vincelette (2008). “Debt Relief and Education in HIPCs,”
mimeo, University of Innsbruck and World Bank. Desai, Raj and Homi Kharas (2008). “The California Consensus,” Survival 50(4). Domeland, Doerte and Homi Kharas (2008). “Debt Relief and Sustainable Financing to Meet the
MDGs,” mimeo, World Bank. Eurobarometer (2005). “Attitudes towards Development Aid,” Special Eurobarometer 222,
available at: http://ec.europa.eu/public_opinion/archives/ebs/ebs_222_en.pdf. European Commission (2007), Communication from the Commission to the Council and the
European Parliament, February 28 (Brussels). Fremont-Smith, Marion and Andras Kosaras (2003). “Wrongdoing by Officers and Directors of
Charities: A Survey of Press Reports 1995-2002,” Hauser Center Working Paper No. 20 (Cambridge: Harvard University).
Garret, Laurie (2007). “The Challenge of Global Health,” Foreign Affairs, January/February. Garrett, Thomas and Russell Rhine (2007). "Does Government Spending Really Crowd Out
Charitable Contributions? New Time Series Evidence," Working Papers 2007-012 (Federal Reserve Bank of St. Louis).
Government Accountability Office (2007). “Analysis of Millennium Challenge Corporation (MCC)
Compact Disbursements through March 2007,” Letter to congressional committees, May 14, 2007.
Hartmann, Arntraud and Johannes Linn (2008). “Scaling Up Through Aid: The Real Challenge,”
Global Views No. 7, (Washington: Brookings). Kerlin, Janet and S. Thanasombat (2006). “The International Charitable Nonprofit Subsector,”
Urban Institute Policy Brief No. 2, (Washington: Urban Institute).

26
Kharas, Homi (2007). “The New Reality of Aid,” in Global Development 2.0, Brainard and Chollet,
eds. (Washington: Brookings). ____________ (2007b). “Trends and Issues in Development Aid,” Wolfensohn Center for
Development Working Paper No. 1 (Washington: Brookings). ____________ (2008). “Measuring the Cost of Aid Volatility,” Wolfensohn Center for
Development Working Paper No. 3 (Washington: Brookings). ____________ (2009). “Action on Aid: Steps Toward Making Aid More Effective,” (Washington:
Brookings) available at: http://www.brookings.edu/reports/2009/04_aid_kharas.aspx. Knack, Stephen and Aminur Rahman (2004). "Donor Fragmentation and Bureaucratic Quality in
Aid Recipients," Policy Research Working Paper Series No. 3186 (Washington: World Bank).
Kosfeld, Michael (2008). “Brain Trust,” Greater Good Magazine 5(2) (UC Berkeley). Lindelow, M., I. Kushnarova and K. Kaiser (2007). “Measuring corruption in the health sector,” in
Global Corruption Report, Transparency International (Cambridge UP). Lloyd, Robert, Jeffery Oatham, and Michael Hammer (2007). 2007 Global Accountability Report
(London: One World Trust). Loomis, Carol (2006). “Warren Buffett gives away his fortune,” CNNMoney.com, June 25,
available at: http://money.cnn.com/2006/06/25/magazines/fortune/charity1.fortune/index.htm.
Melito, Thomas (2009). “International Food Assistance,” Testimony Before the Subcommittee on
Africa and Global Health, Committee on Foreign Affairs, House of Representatives, GAO09-757T (Washington: Government Accountability Office).
Moll, J., F. Krueger, R.Zahn, M. Pardini , R. de Oliveira-Souza, and J. Grafman (2006). “Human
Fronto–mesolimbic Networks Guide Decisions About Charitable Donation,” Proceedings of the National Academy of Science 103.
Mwega, Francis (2009). “A Case Study of Aid Effectiveness in Kenya,” Wolfensohn Center for
Development Working Paper No. 8 (Washington: Brookings). OECD (2001). “Untying aid to the Least Developed Countries,” OECD Policy Brief, OECD
Observer. ____________ (2006). DAC in Dates: The History of the OECD’s Development Assistance
Committee, (Paris: OECD) available at: http://www.oecd.org/dataoecd/3/38/1896808.pdf. ____________ (2008). Survey on Monitoring the Paris Declaration, (Paris: OECD). Ramsay, Clay, Stephen Weber, Steven Kull, and Evan Lewis (2009). “American Public Opinion
and Global Health,” World Public Opinion Poll (Washington: Program on International Policy Attitudes, University of Maryland).
Rollins, Karina, ed. (2006). The Index of Global Philanthropy 2006 (Washington: The Hudson
Institute), p.20.

27
____________ (2007). The Index of Global Philanthropy 2007 (Washington: The Hudson Institute).
Rosenberg, Richard, Adrian Gonzalez, and Sushma Narain (2009). “The New Moneylenders: Are
the Poor Being Exploited by High Microcredit Interest Rates?” CGAP Occasional Paper No. 15 (Washington: CGAP).
Smith, Robert (2006). “Buffett Gift Sends $31B to Gates Foundation,” All Things Considered,
NPR, June 26, available at: http://www.npr.org/templates/story/story.php?storyId=5512893.
The U.S. Commission on HELP (2007). Beyond Assistance: The HELP Commission Report on
Foreign Assistance Reform, (Washington: HELP Commission). World Bank (nd). “Defining Civil Society,” available at:
http://web.worldbank.org/WBSITE/EXTERNAL/TOPICS/CSO/0,,contentMDK:20101499~menuPK:244752~pagePK:220503~piPK:220476~theSitePK:228717,00.html, accessed May 25, 2009.
1 Official Development Assistance (ODA) has three characteristics: (i) it is provided by an official body; (ii) its main purpose is economic development and welfare in poor countries; (iii) it is concessional, with a grant element of at least 25 percent. 2 Preamble to the UN Charter 3 There are agencies which raise money in capital markets and on-lend to poor countries. The multilateral development banks, like the International Bank for Reconstruction and Development, or the Asian Development Bank, are the largest in this category. But their loans are not concessional, so they do not qualify as ODA. 4 InterAction, a U.S. based umbrella organization for international development foundations and NGOs, claims 13.5 million individual donors to its member organizations last year. 5 Significant amounts of non-concessional funding for micro-credit organizations also exist, but here we are focused just on aid. 6 Laurie Garret, “The Challenge of Global Health,” Foreign Affairs 86(1), New York, January/February 2007, p. 14-38. 7 Robert Lloyd, Jeffery Oatham, and Michael Hammer, 2007 Global Accountability Report, One World Trust, London, 2007. 8 Deborah Brautigam, “China’s Africa Aid: Transatlantic Challenges,” The German Marshall Fund Paper Series, German Marshal Fund, Washington, 2008. 9 The DAC reporting requirements are changing in a way that precludes identification of technical cooperation. Some countries are already reporting in the new format, and thus technical cooperation cannot be estimated reliably for 2007 and later years. 10 Karina Rollins, ed., The Index of Global Philanthropy 2007, The Hudson Institute, Washington, 2007. 11 A significant amount of concessional credits have also been written off under the Heavily Indebted Poor Country and Multilateral Debt Relief Initiatives. But because the concessional funds had already been classified as ODA when disbursed, the relief is not treated as additional ODA to avoid double counting. 12 Doerte Domeland and Homi Kharas, “Debt Relief and Sustainable Financing to Meet the MDGs,”mimeo, World Bank, 2008. See also, Nicolas Depetris Chauvin and Aart Kraay, "Who Gets Debt Relief?" Journal of the European Economic Association 5(2/3), 2007; and Jesus Crespo Cuaresma and Gallina Vincelette, “Debt Relief and Education in HIPCs,” mimeo, University of Innsbruck and World Bank, 2008. 13 For example, on average food costs 25-34 per cent more to procure in the US as opposed to domestic markets. See Thomas Melito, “International Food Assistance,” Testimony Before the Subcommittee on Africa and Global Health, Committee on Foreign Affairs, House of Representatives, GAO09-757T, Government Accountability Office, Washington, 2009. 14 Homi Kharas, “Action on Aid: Steps Toward Making Aid More Effective,” Brookings, Washington, 2009, available at: http://www.brookings.edu/reports/2009/04_aid_kharas.aspx. 15 Less than half of all CPA actually passes through recipient country budgets. 16Stephen Knack and Aminur Rahman, "Donor Fragmentation and Bureaucratic Quality in Aid Recipients," Policy Research Working Paper Series No. 3186, World Bank, Washington, 2004. 17 OECD, Survey on Monitoring the Paris Declaration, OECD, Paris, 2008. 18 European Commission, Communication from the Commission to the Council and the European Parliament, Brussels, February 28 2007. 19 B. Balassa, “Trade Liberalization and Revealed Comparative Advantage,” The Manchester School 33, 1965, p. 99-123. The formula for the RCA is: RCA = (Air / Ait) / (Art / At) where A is aid, i is the donor country, t is total, and r is the recipient country. Aid is defined using the OECD/DAC definition of country programmable aid; it excludes from total aid things like debt relief, humanitarian assistance, and imputed student costs but includes technical cooperation. 20 Calculations based on commitments 21 OECD, DAC in Dates: The History of the OECD’s Development Assistance Committee, OECD, Paris, 2006, available at: http://www.oecd.org/dataoecd/3/38/1896808.pdf.

28
22 Homi Kharas, “Measuring the Cost of Aid Volatility,” Wolfensohn Center for Development Working Paper No. 3, Brookings, Washington, 2006. 23 Francis Mwega, “A Case Study of Aid Effectiveness in Kenya,” Wolfensohn Center for Development Working Paper No. 8, Brookings, Washington, 2009. 24 Homi Kharas (2008), op cit. 25 ibid. 26 Robert Smith, “Buffett Gift Sends $31B to Gates Foundation,” All Things Considered, NPR, Washington, June 26 2006, available at: http://www.npr.org/templates/story/story.php?storyId=5512893. 27Carol Loomis, “Warren Buffett gives away his fortune,” CNNMoney.com, June 25 2006, available at: http://money.cnn.com/2006/06/25/magazines/fortune/charity1.fortune/index.htm. 28 Homi Kharas, “The New Reality of Aid,” in Global Development 2.0, Brainard and Chollet, eds. Brookings, Washington, 2007; and Homi Kharas, “Trends and Issues in Development Aid,” Wolfensohn Center for Development Working Paper No. 1, Brookings, Washington, 2007. 29 Janet Kerlin and S. Thanasombat, “The International Charitable Nonprofit Subsector,” Urban Institute Policy Brief 2, Urban Institute, Washington, 2006. 30 Karina Rollins, ed., The Index of Global Philanthropy 2006, The Hudson Institute, Washington, 2006, p.20. 31 World Bank, “Defining Civil Society,” nd, available at: http://web.worldbank.org/WBSITE/EXTERNAL/TOPICS/CSO/0,,contentMDK:20101499~menuPK:244752~pagePK:220503~piPK:220476~theSitePK:228717,00.html, accessed May 25, 2009. 32 Rollins (2007), op cit. p. 22. 33 World Bank (nd), “Defining Civil Society,” op cit. 34 David Brooks, “Thoroughly Modern Do-Gooders,” The New York Times, March 21 2008. 35 The U.S. Commission on HELP Beyond Assistance: The HELP Commission Report on Foreign Assistance Reform, HELP Commission, Washington, 2007. 36 Rene Bekkers and Pamala Wiepking, “Generosity and Philanthropy: A Literature Review,” 2007, available at: http://papers.ssrn.com/sol3/papers.cfm?abstract_id=1015507. 37 Thomas Garrett and Russell Rhine, "Does Government Spending Really Crowd Out Charitable Contributions? New Time Series Evidence," Working Papers 2007-012, Federal Reserve Bank of St. Louis, 2007. 38 James Andreoni and A. Abigail Payne, “Crowding out Both Sides of the Philanthropy Market,” 2008, available at: http://econ.ucsd.edu/~jandreon/WorkingPapers/andreoni_payne2.pdf. 39 J. Moll, F. Krueger, R.Zahn, M. Pardini , R. de Oliveira-Souza, and J. Grafman, “Human Fronto–mesolimbic Networks Guide Decisions About Charitable Donation,” Proceedings of the National Academy of Science 103, Washington, 2006, p. 15623-15628. 40 Michael Kosfeld, “Brain Trust,” Greater Good Magazine 5(2), UC Berkeley, 2008, p. 18-19. 41 James Alm, "The Welfare Cost of the Underground Economy," Economic Inquiry 23, 1985, p. 243-263 42 M. Lindelow, I. Kushnarova and K. Kaiser, “Measuring corruption in the health sector,” in Global Corruption Report, Transparency International, Cambridge UP, 2007. 43 The remaining 41 percent of funds have still not been classified by use. 44 Government Accountability Office, “Analysis of Millennium Challenge Corporation (MCC) Compact Disbursements through March 2007,” Letter to congressional committees, Washington, May 14 2007. 45 Richard Rosenberg, Adrian Gonzalez, and Sushma Narain, “The New Moneylenders: Are the Poor Being Exploited by High Microcredit Interest Rates?” CGAP Occasional Paper No. 15, CGAP, Washington, 2009. 46 OECD, “Untying aid to the Least Developed Countries,” OECD Policy Brief, OECD Observer, 2001. 47 Duke University Non-Governmental Organizations Research Guide. 48Raj Desai and Homi Kharas, “The California Consensus,” Survival 50(4), 2008. 49 Marion R. Fremont-Smith and Andras Kosaras, “Wrongdoing by Officers and Directors of Charities: A Survey of Press Reports 1995-2002,” Hauser Center Working Paper No. 20, Harvard University, Cambridge, 2003. 50 The Global Accountability Report 2007, (op cit.) looks at some 30 of the world’s most significant international aid players and finds that NGOs do generally less well than their official aid agency counterparts. 51 Clay Ramsay, Stephen Weber, Steven Kull, and Evan Lewis, “American Public Opinion and Global Health,” World Public Opinion Poll, Program on International Policy Attitudes, University of Maryland, Washington, 2009. 52 Eurobarometer, “Attitudes towards Development Aid,” Special Eurobarometer 222, 2005, available at: http://ec.europa.eu/public_opinion/archives/ebs/ebs_222_en.pdf. 53 Arntraud Hartmann and Johannes Linn, “Scaling Up Through Aid: The Real Challenge,” Global Views No. 7, Brookings, Washington, 2008.