Embed Size (px)
Citation preview

Development and validation of school-basedasthma and allergy screening questionnairesin a 4-city studySusan Redline, MD, MPH*; Rebecca S. Gruchalla, MD, PhD†; Raoul L. Wolf, MD‡;Barbara P. Yawn, MD, MSc§; Lydia Cartar, MA*; Vanthaya Gan, MD¶; Patricia Nelson, RN*;and Peter Wollan, PhD§
Background: Asthma and allergies are commonly undiagnosed in children. Schools provide settings for potentially accessingalmost all children for asthma and allergy screening.
Objective: To evaluate the feasibility and validity of using a questionnaire-based screening tool to identify undiagnosedasthma and respiratory allergies in children in kindergarten to grade 6.
Methods: A student questionnaire (SQ) and a parent questionnaire (PQ) were developed, administered in 4 diversecommunities, and validated against standardized clinical assessments. Children without diagnosed asthma and representing arange of symptoms participated in a validation study that consisted of independent, standardized, clinical assessments.Sensitivity, specificity, and predictive values for questionnaire items were evaluated against expert consensus designations.
Results: A total of 190 children (age range, 7–13 years) completed the validation study. Affirmative responses to individualquestions from either the SQ or PQ regarding asthma and allergy were modestly to moderately predictive of the clinicalassessments (odds ratios, generally 2.5–5.0). When considering a positive asthma screen as affirmative responses to 3 of the best7 SQ asthma questions, the odds ratio for asthma was 9.3 (95% confidence interval, 4.1–21.1), with 80% sensitivity and 70%specificity. Considering the allergy screen as positive based on affirmative response to either of the 2 SQ allergy questionsyielded 81% sensitivity and 42% specificity.
Conclusions: Either a 9-item SQ or a 10-item PQ can be used in diverse settings to screen for asthma and respiratory allergies.The SQ, obtained by directly screening students, may provide a sensitive approach for detecting children with previouslyundiagnosed asthma and allergies.
Ann Allergy Asthma Immunol. 2004;93:36–48.
INTRODUCTIONAsthma is a common chronic condition that most often beginsin childhood1–3 and has been reported to affect between 7%and 20% of children by the age of 18 years.4 Despite the highprevalence of recognized asthma in school-aged children,many additional schoolchildren may have unrecognized asth-ma.5–7 These children may experience symptoms, lost schooldays, and lost activity days due to this unrecognized and thusuntreated chronic health condition.8
Allergies are also common, affecting as many as 10 millionto 20 million children in the United States, including approx-imately 80% of children with asthma.9,10 Allergic rhinitis may
trigger asthma exacerbations and contributes to reduced qual-ity of life, lost activity days, and increased health carecosts.10,11 Like asthma, allergies are often unrecognized.
Recent attempts to improve the identification of childrenwith unrecognized asthma and allergies, thereby improvingtheir chances of access to appropriate symptom management,have been focused on schools.12–17 Schools are one of the fewsites in which almost all children gather and thus are availablefor screening or identification programs.18 Schools offer theopportunity to evaluate a large number of children and toidentify treatable diseases, such as asthma.13
School-based asthma and allergy case identification pro-grams require a validated screening tool that provides suffi-cient sensitivity to identify most of the cases, while limitingthe number of referrals of children who do not have asthma orallergy. To be useful throughout the United States, the toolneeds to be valid in multiple socioeconomic, racial, andethnic groups and easy and inexpensive to administer. Thisstudy aims to evaluate the feasibility and validity of using aquestionnaire-based screening tool to identify undiagnosedasthma and respiratory allergies in children in kindergarten tograde 6.
* Department of Pediatrics, Case Western Reserve University and RainbowBabies and Children’s Hospital, Cleveland, Ohio.† Division of Allergy and Immunology, UT Southwestern Medical Center,Dallas, Texas.‡ Rabida Children’s Hospital and University of Chicago, Chicago, Illinois.§ Department of Research, Olmsted Medical Center, Rochester, Minnesota.¶ Division of General Academic Pediatrics, UT Southwestern Medical Cen-ter, Dallas, Texas.Supported by the American College of Asthma, Allergy and Immunology.Received for publication March 22, 2004.Accepted for publication in revised form April 20, 2004.
36 ANNALS OF ALLERGY, ASTHMA & IMMUNOLOGY

METHODS
Study DesignUsing information from a series of preliminary studies onschool-based asthma and allergy screening performed by ourcollaborative research group, we developed a short question-naire-based screening tool and validated it against indepen-dent, standardized assessments that included physical exam-ination, pulmonary function testing, and allergy skin testing(Fig 1). The validation sites consisted of 4 geographicallydiverse centers that participated in an initial, collaborativeschool-screening program funded by the American College ofAsthma, Allergy and Immunology.14–17 The combined studypopulation consisted of racially and ethnically diverse chil-dren across socioeconomic strata. The study was approved bythe local institutional review boards at each site. The finalvalidated asthma and allergy screening tool that resulted from
this study is designed to be useful in a variety of geographiclocales as the foundation for school-based programs to im-prove asthma and allergy recognition and care.
Questionnaire Development and DistributionAn asthma and allergy screening questionnaire was devel-oped based on preliminary, independent phase 1 work per-formed at each of the 4 validation sites (Chicago, IL, Cleve-land, OH, Dallas, TX, and Rochester, MN).14–17 In brief,during phase 1, each site independently tested distinct asthmaand allergy screening questionnaires, assessing their predic-tive validity, community acceptance, response rates, andfeasibility of use. Using the aggregate findings, individualquestionnaire items that appeared to have had the best psy-chometric properties and/or highest levels of concordancewith asthma and/or allergy were selected. Items were modi-fied to improve their face validity across sites. The Rochester
Figure 1. Schemata for study design. PE indicates physical examination; PFTs, pulmonary function tests; PIs, principal investigators.
VOLUME 93, JULY, 2004 37

site evaluated the test-retest validity of the selected questionsin a sample of 25 fifth grade students. The concordance ofstudents’ answers was very high (94%) for the same surveyadministered twice in more than 48 hours. Two versions of
the survey were developed: a student questionnaire (SQ) anda parent questionnaire (PQ; Figs 2 and 3).
The newly developed questionnaires were distributed tofamilies of elementary-aged children at the 4 study sites.
Figure 2. Student questionnaire used in the val-idation study.
Figure 3. Parent/guardian questionnaire used inthe validation study.
38 ANNALS OF ALLERGY, ASTHMA & IMMUNOLOGY

Each site surveyed at least 400 children in kindergarten togrades 5 or 6, using distribution techniques specific for eachsite. Parents or guardians were asked to complete the PQ foreach student in kindergarten through grade 6. Surveys weredistributed by “backpack express” (ie, the child took it homefor the parents to complete), by mail, and/or at school openhouse forums. All children in grades 2 to 6 also were askedto complete the SQ. According to the preferences of the localschools, these surveys were either distributed with the PQ andcompleted at home (Rochester) or distributed and completedin school (homeroom, health class, or special assemblies)(Cleveland, Chicago, and Dallas). If these surveys were dis-tributed in schools, a standard preamble was read by a com-munity volunteer or research staff member, and each questionwas read out loud, with no attempt to provide any asthma orallergy education that might influence answers.
ValidationSince the questionnaire was primarily developed to identifyundiagnosed asthma and respiratory allergies, the validationstudy focused on students with a wide spectrum of asthma orallergy symptoms but without a diagnosis of asthma. In 3sites, eligibility for the validation study was based on acompleted PQ (ie, targeting children in kindergarten to grades5 or 6). In one site, the local institutional review boardrestricted eligibility for the validation studies to children ingrades 2 to 6. The PQs from these targeted students who alsodid not have a known diagnosis of asthma (reporting “no” tophysician- or nurse-diagnosed asthma) were sorted by grade,sex, and categories of symptoms: possible asthma, possibleallergies, and neither asthma nor allergies. Children withpossible asthma were defined as those with responses of“sometimes” or “a lot” to questions regarding whether theyhad at least 2 of the following symptoms: noisy breathing;wheezy breathing sounds; hard time breathing; cough thatwon’t go away; chest tightness; chest tightness with coldweather; waking up coughing; waking up with trouble breath-ing; trouble playing due to breathing problems; cough whenrunning, etc; missing days from school due to breathingproblems; coughing near pets; and/or trouble breathing nearpets. From the remaining questionnaires, a group of studentswith possible allergies was identified based on a “sometimes”or “a lot” response to questions regarding whether they had“itchy eyes” or “runny, stuffy nose.” All remaining question-naires were categorized as “unlikely asthma/allergy.” Eachsite randomly selected and invited students from each of the3 categories to participate in the examination portion of thestudy until at least 16 from each category were enrolled.
Validation ProtocolThe parents of all students who agreed to participate in thevalidation study were asked to bring their child to a conve-nient site for further evaluation. After informed consent fromthe parent or guardian and assent from the child were ob-tained, a physician with expertise in the treatment and diag-nosis of asthma conducted a clinical evaluation of each stu-
dent. The physician and/or a research nurse–physician teamalso obtained histories using standardized forms. Physiciansand nurses were blinded to the results of the screening ques-tionnaires. Baseline spirometry was performed using stan-dardized approaches; spirometry was repeated 15 minutesfollowing inhalation of 2 puffs of an albuterol bronchodilatorfor children with reduced or questionably reduced pulmonaryfunction levels. Children with symptoms that the examiningphysician thought consistent with possible inhaled allergiesunderwent allergy skin prick testing. Allergens tested in-cluded Dermatophagoides pteronyssinus, Dermatophagoidesfarinae, cat, dog, rat, mouse, cockroach, Alternaria, Clados-porium, Aspergillus, Penicillium, ragweed mix, Timothygrass, Bermuda grass, histamine (positive control), and di-luent alone (negative control). Testing, measurement, andinterpretation were completed using standard procedures.19
Determination of Disease StatusDe-identified copies of the validation data collection formscompleted for each student were distributed to the principalinvestigators (R.S.G., S.R., R.L.W., B.P.Y.) at each of the 4study sites. Each investigator reviewed the history and phys-ical examination results and the spirometry and skin testresults of the children of all 4 sites. Based on these data (andindependent of data collected from the screening question-naires), the 4 site principal investigators categorized the like-lihood of asthma and allergic rhinoconjunctivitis for eachstudent as definite, probable, possible, or unlikely. A definitedesignation of asthma required history-identified respiratorysymptoms that were episodic and trigger related (by exercise,allergens, respiratory infections, or changes of weather con-ditions) with evidence of either reversible airflow limitationby spirometry or audible wheezing or prolongation of expi-ration by physician examination. The student was consideredto have probable asthma when symptoms were consistentwith asthma (as above) but supportive spirometry or physicalfindings were absent. Possible asthma identified studentswith some symptoms or other findings that could be consis-tent with asthma but were less typical than the ones above.Unlikely referred to absence of any symptoms or findingssuggestive of asthma.
A definitive designation of inhalant allergies requiredsymptoms such as sneezing, itching, and runny nose thateither varied seasonally or were exacerbated in response toexposures to specific triggers, such as dust, animal dander, orpollens, in addition to demonstrating at least 1 positive skinprick test result.19 Probable allergies were designated whenthese symptoms were recorded or there were physical find-ings consistent with the presence of inhalant allergies (eg,“allergic shiners”; transverse nasal crease; swollen, pale, blu-ish nasal mucosa; and clear nasal drainage) but when allergyskin test results were unavailable, either because the studentrefused to take the test or the test result was uninterpretable.Students were classified as having possible allergy when lesstypical symptoms and signs were noted and unlikely allergywhen symptoms and findings were absent.
VOLUME 93, JULY, 2004 39

Each investigator’s designation was further collapsed intodefinite/probable and possible/unlikely categories; the desig-nations made by all 4 investigators for each student weresummarized. Each student was assigned a final designation ofdefinite/probable or possible/unlikely asthma and allergic rhi-noconjunctivitis that reflected a consensus designation (ie,agreement by at least 3 of the investigators). When at least 3investigators did not initially classify the student’s diseasestatus similarly, that case was discussed among investigatorson one of several conference calls held to resolve differencesin designations.
Statistical AnalysesUsing the final clinical consensus designations as the goldstandard, the sensitivity and specificity of data obtained fromthe PQ and SQ (ie, the screening instruments) were deter-mined. Spearman correlation coefficient was used to describethe correlation among variables (SAS statistical software,version 8.2, SAS Institute Inc, Cary, NC). Both �2 and mul-tiple logistic regression analyses were used to evaluate therelationships of each outcome (definite/probable asthma orallergy, each considered as distinct although not mutuallyexclusive outcomes) as determined by consensus designationto items from the questionnaires. Each symptom from the PQor SQ was considered present if the symptom was reported asoccurring “sometimes” or “a lot.” Analyses evaluated thepredictive ability of single questions, combinations of ques-tions, and total scores. Initial models considered data from thePQ and SQ separately. Additional models were constructedthat considered a “positive symptom complex” based onaffirmative responses for a progressively increasing numberof symptoms relevant to each outcome. For example, from atotal of 12 asthma symptoms, the relative predictive values(sensitivity, specificity, and positive and negative predictivevalues) were computed for positive responses to 1 or morequestions. Finally, alternative models, combining data fromboth the PQ and SQ, were constructed.
RESULTSFrom all 4 sites, 1,673 PQs and 1,788 SQs were returned. Thestudents screened in Chicago and Cleveland were predomi-nantly African American (100% and 84%, respectively),whereas in Rochester they were mostly white (81%) and inDallas they were of varied racial/ethnic backgrounds andincluded the largest proportion of Hispanic children (30%).The age of the students from each site ranged from 5 to 13years; there was an approximately equal representation ofboys and girls. The characteristics of the 190 students in thevalidation sample largely reflected the underlying ethniccomposition of the targeted populations. Most students (63%)in the validation study were in grades 2 to 6, and the remain-ing were in kindergarten to grade 1.
Corresponding SQ and PQ forms were available for a totalof 171 parent-student pairs in the validation sample. Al-though the responses to most of the individual questions weresignificantly associated, the magnitude of agreement was
generally modest (Table 1). The strongest correlation be-tween parent and child responses was to the question regard-ing use of medicines for allergies (r � 0.53, P � .001). Therewas little, if any agreement, for the item “it is hard to breathein the cold” (r � 0.10, P � .18).
The sensitivity, specificity, and positive and negative pre-dictive values for each of the 12 asthma questions and the 2allergy symptom questions, using the parent or the studentresponses, are shown in Table 2. Overall, using data fromeither the SQ or PQ, most of the individual asthma symptomswere moderately predictive of the asthma clinical consensusdesignation, with odds ratios of approximately 3 (Table 2).However, the 2 questions regarding symptoms in associationwith exposure to pets had no significant association withasthma. Parent, but not student, responses to the questionregarding missing school due to breathing problems wasassociated with asthma. Each of the allergy symptoms wasmodestly to moderately predictive of the allergic rhinocon-junctivitis designation, using either student- or parent-re-ported responses (Table 2).
A series of logistic regression models was then fit toidentify the best combination of symptoms that predictedeach of the clinical outcomes (asthma or allergic rhinocon-junctivitis). A number of alternative approaches were used,including modeling the most significant univariate predictors,using various combinations from the pool of 12 asthmasymptoms, and combining parent and student responses.These analyses showed that for asthma little predictive ability
Table 1. Correlations of Parent and Child Responses for Asthmaand Allergy Symptoms from the Validation Sample*
Symptom (question No.)Child-parentSpearman r
P value
Noisy breathing (1) 0.15 .06Hard to take deep breath (2) 0.26 .001Hard to stop coughing (3) 0.32 �.001Chest hurts after sports (4) 0.27 �.001Hard to breathe in cold (5) 0.10 .18Night coughing (6) 0.32 �.001Trouble breathing at night (7) 0.15 .05Trouble breathing during sports (8) 0.24 .001Cough during sports (9) 0.12 .12Eyes get itchy or burn (10) 0.29 �.001Problems with runny nose (11) 0.20 .01Miss school due to breathing problems
(12)0.31 �.001
Cough around pets (13) 0.19 .01Trouble breathing around pets (14) 0.32 �.001Doctor or nurse said child has asthma
(15)†. . . . . .
Stayed in hospital overnight for asthmaon breathing in last year (16)†
. . . . . .
Take medicine for asthma (17) 0.25 .001Take medicine for allergies (18) 0.53 �.001
* n � 171 for complete parent-child pairs.† Parent questions 15 and 16 were entered as “no” for all subjects.
40 ANNALS OF ALLERGY, ASTHMA & IMMUNOLOGY
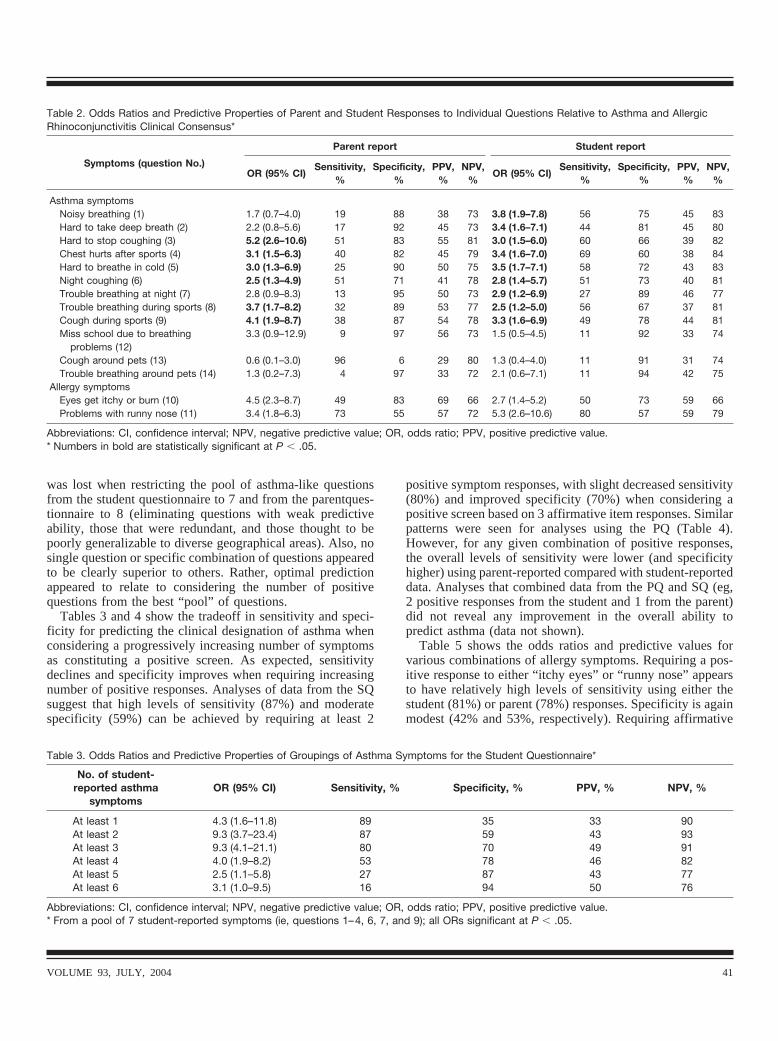
was lost when restricting the pool of asthma-like questionsfrom the student questionnaire to 7 and from the parentques-tionnaire to 8 (eliminating questions with weak predictiveability, those that were redundant, and those thought to bepoorly generalizable to diverse geographical areas). Also, nosingle question or specific combination of questions appearedto be clearly superior to others. Rather, optimal predictionappeared to relate to considering the number of positivequestions from the best “pool” of questions.
Tables 3 and 4 show the tradeoff in sensitivity and speci-ficity for predicting the clinical designation of asthma whenconsidering a progressively increasing number of symptomsas constituting a positive screen. As expected, sensitivitydeclines and specificity improves when requiring increasingnumber of positive responses. Analyses of data from the SQsuggest that high levels of sensitivity (87%) and moderatespecificity (59%) can be achieved by requiring at least 2
positive symptom responses, with slight decreased sensitivity(80%) and improved specificity (70%) when considering apositive screen based on 3 affirmative item responses. Similarpatterns were seen for analyses using the PQ (Table 4).However, for any given combination of positive responses,the overall levels of sensitivity were lower (and specificityhigher) using parent-reported compared with student-reporteddata. Analyses that combined data from the PQ and SQ (eg,2 positive responses from the student and 1 from the parent)did not reveal any improvement in the overall ability topredict asthma (data not shown).
Table 5 shows the odds ratios and predictive values forvarious combinations of allergy symptoms. Requiring a pos-itive response to either “itchy eyes” or “runny nose” appearsto have relatively high levels of sensitivity using either thestudent (81%) or parent (78%) responses. Specificity is againmodest (42% and 53%, respectively). Requiring affirmative
Table 2. Odds Ratios and Predictive Properties of Parent and Student Responses to Individual Questions Relative to Asthma and AllergicRhinoconjunctivitis Clinical Consensus*
Symptoms (question No.)
Parent report Student report
OR (95% CI)Sensitivity,
%Specificity,
%PPV,
%NPV,
%OR (95% CI)
Sensitivity,%
Specificity,%
PPV,%
NPV,%
Asthma symptomsNoisy breathing (1) 1.7 (0.7–4.0) 19 88 38 73 3.8 (1.9–7.8) 56 75 45 83Hard to take deep breath (2) 2.2 (0.8–5.6) 17 92 45 73 3.4 (1.6–7.1) 44 81 45 80Hard to stop coughing (3) 5.2 (2.6–10.6) 51 83 55 81 3.0 (1.5–6.0) 60 66 39 82Chest hurts after sports (4) 3.1 (1.5–6.3) 40 82 45 79 3.4 (1.6–7.0) 69 60 38 84Hard to breathe in cold (5) 3.0 (1.3–6.9) 25 90 50 75 3.5 (1.7–7.1) 58 72 43 83Night coughing (6) 2.5 (1.3–4.9) 51 71 41 78 2.8 (1.4–5.7) 51 73 40 81Trouble breathing at night (7) 2.8 (0.9–8.3) 13 95 50 73 2.9 (1.2–6.9) 27 89 46 77Trouble breathing during sports (8) 3.7 (1.7–8.2) 32 89 53 77 2.5 (1.2–5.0) 56 67 37 81Cough during sports (9) 4.1 (1.9–8.7) 38 87 54 78 3.3 (1.6–6.9) 49 78 44 81Miss school due to breathing
problems (12)3.3 (0.9–12.9) 9 97 56 73 1.5 (0.5–4.5) 11 92 33 74
Cough around pets (13) 0.6 (0.1–3.0) 96 6 29 80 1.3 (0.4–4.0) 11 91 31 74Trouble breathing around pets (14) 1.3 (0.2–7.3) 4 97 33 72 2.1 (0.6–7.1) 11 94 42 75
Allergy symptomsEyes get itchy or burn (10) 4.5 (2.3–8.7) 49 83 69 66 2.7 (1.4–5.2) 50 73 59 66Problems with runny nose (11) 3.4 (1.8–6.3) 73 55 57 72 5.3 (2.6–10.6) 80 57 59 79
Abbreviations: CI, confidence interval; NPV, negative predictive value; OR, odds ratio; PPV, positive predictive value.* Numbers in bold are statistically significant at P � .05.
Table 3. Odds Ratios and Predictive Properties of Groupings of Asthma Symptoms for the Student Questionnaire*
No. of student-reported asthma
symptomsOR (95% CI) Sensitivity, % Specificity, % PPV, % NPV, %
At least 1 4.3 (1.6–11.8) 89 35 33 90At least 2 9.3 (3.7–23.4) 87 59 43 93At least 3 9.3 (4.1–21.1) 80 70 49 91At least 4 4.0 (1.9–8.2) 53 78 46 82At least 5 2.5 (1.1–5.8) 27 87 43 77At least 6 3.1 (1.0–9.5) 16 94 50 76
Abbreviations: CI, confidence interval; NPV, negative predictive value; OR, odds ratio; PPV, positive predictive value.* From a pool of 7 student-reported symptoms (ie, questions 1–4, 6, 7, and 9); all ORs significant at P � .05.
VOLUME 93, JULY, 2004 41

responses to both symptoms lowers sensitivity to 49% and44%, respectively, for student and parent questionnaires, withimproved specificity (89% and 84%, respectively). Usingvarious combinations of student- and parent-reported symp-toms did not appear to improve overall prediction.
Using data from the entire screened sample provided site-specific estimates of the potential number of subjects whomight screen positive for asthma and allergy. Of the 7 bestasthma symptoms from the SQ, considering 3 or more posi-tive responses as a positive screen would identify 42%, 49%,39%, and 35% of students from Chicago, Cleveland, Dallas,and Rochester, respectively. Using a positive response toeither of the allergy questions would have identified 70%,69%, 61%, and 51% of students from each of these sites,respectively, as candidates for follow-up.
DISCUSSIONSeveral methods have been proposed for school-based asthmaand allergy screening,20–22 including questionnaire screening,pulmonary function testing, and exercise challenges. Ofthese, questionnaires are the least invasive and expensive andthe easiest to implement in diverse settings. Before a wide-spread adoption of any screening instrument, its universalapplicability across diverse communities must be demon-strated. Most of the screening questionnaires that have beenvalidated to detect asthma among schoolchildren are specificfor a particular population in which the validation was per-formed21,23–25; the generalizability of such findings to other
populations is often uncertain. For example, the questionnairedeveloped from the International Study of Asthma and Al-lergies in Childhood (ISAAC), a widely used but population-specific tool, did not adapt well to an inner-city population ofschoolchildren.15 For the present study, we created a compos-ite tool informed by the coordinated experiences of 4 sitesthat represented broad geographic, ethnic, and socioeconomicbackgrounds with the goal of developing a screening instru-ment that would be broadly generalizable. The current workdemonstrates the potential utility of a single questionnaire forscreening asthma and allergy in school-aged children andfurther shows that most children in grades 2 to 6 can completethe questionnaire.
We evaluated 2 almost identical questionnaires, one forparents and one for students, both of which used similarLikert-type frequency response scales. The overall correla-tions between parent and child responses were generallysmall to modest and of similar or somewhat lower levels ofmagnitude than what had been observed in our individualsite-specific pilot work.14,17 The modest levels of agreementmay reflect differences in the approaches and setting forcompletion of the PQ and SQ (which in 2 sites were based onin-school administration for the children and in-home for theparents), variable levels of literacy among the targeted adultsand children, and real differences in how parents perceive theirchild’s asthma or allergy symptoms compared with the child’sself-perceptions and reports. Overall, compared with their par-ents, children tend to report more symptoms, a finding that has
Table 4. Odds Ratios and Predictive Properties of Groupings of 8 Asthma Symptoms for the Parent Questionnaire*
No. of parent-reported asthma
symptomsOR (95% CI) Sensitivity, % Specificity, % PPV, % NPV, %
At least 1 3.5 (1.7–7.1) 75 54 39 85At least 2 3.1 (1.6–6.0) 58 69 42 81At least 3 4.7 (2.3–9.6) 47 84 54 80At least 4 5.0 (2.0–12.4) 27 93 61 76At least 5 4.2 (1.4–12.6) 17 95 60 74At least 6 13.5 (1.5–118.2) 9 99 83 73At least 7 5.2 (0.5–58.8) 4 99 67 72
Abbreviations: CI, confidence interval; NPV, negative predictive value; OR, odds ratio; PPV, positive predictive value.* From a pool of 8 parent-reported questions (ie, 1–4, 6, 7, 9, and 12); all ORs significant at P � .05 other than “at least 7.”
Table 5. Odds Ratios and Predictive Properties of Groupings of Allergy Symptoms Relative to the Allergic Rhinoconjunctivitis ClinicalConsensus Using Student and Parent Responses*
Allergy symptoms OR (95% CI) Sensitivity, % Specificity, % PPV, % NPV, %
S10 or S11 3.1 (1.5–6.4) 81 42 52 75S10 and S11 7.3 (3.4–15.9) 49 89 77 69P10 or P11 4.1 (2.1–7.8) 78 53 57 75P10 and P11 4.3 (2.2–8.5) 44 84 70 65S10 or S11 or P10 or P11 10.0 (2.9–34.3) 96 28 52 90S10 or S11 and P10 or P11 3.4 (1.8–6.4) 62 68 59 70
Abbreviations: CI, confidence interval; NPV, negative predictive value; OR, odds ratio; PPV, positive predictive value.* S10 and P10 refer to the “itchy eyes” question for student and parent, respectively. S11 and P11 refer to the “runny nose” question for studentand parent, respectively. All ORs significant at P � .05.
42 ANNALS OF ALLERGY, ASTHMA & IMMUNOLOGY

also been observed by others.26 Despite the rather low levels ofagreement for responses to individual items from each question-naire, we found that after considering the best grouping ofresponses from each questionnaire, the PQ and SQ providedfairly equivalent levels of prediction regarding each outcome,with generally better sensitivity for analyses using the SQ andbetter specificity for the PQ. Furthermore, an extensive series ofanalyses demonstrated that there was no gain in combining theparent and student responses. The high sensitivity for data ob-tained directly from the students is of particular importancegiven that a major obstacle for school-based screening is ineliciting participation of parents, especially in some low-incomeneighborhoods where there are challenges in getting forms backand forth between the school and home. Our data suggest thatdirecting initial efforts at screening the students, who may bedirectly surveyed in classroom settings, may provide a relativelyeasy means for accessing nearly all school-aged children. Hav-ing both questionnaires available, however, may provide flexi-bility for screening under differing circumstances, especially incircumstances where higher specificity may be needed or insituations where students’ reading levels are extremely low.
Using our validation data and modeling the responses fromthe PQ and SQ against the independently determined consen-sus clinical designation, we attempted to identify the combi-nation of symptoms that provided an optimal balance be-tween sensitivity and specificity. As expected, when apositive asthma screen was based on increasing the numbersof affirmative responses to the pool of asthma questions,specificity increased at the expense of sensitivity. Decisionsregarding threshold values (ie, number of symptoms to con-sider as constituting a positive screen) relate to the inherentgoals of the specific school-based screening program. Forexample, if resources permit and community-specific con-cerns are to minimize the burdens and costs related to reducedquality of life, missed school and work days, and morbidityassociated with undiagnosed asthma or allergy cases, onewould aim to optimize sensitivity. In this regard, requiring atleast 3 asthma symptoms provides a sensitivity of 80% and aspecificity of 70%, suggesting that asthma may be suspectedand referral considered in students reporting this number ofsymptoms.
Both the SQ and PQ contained 18 items, 14 of which wererelated to asthma and allergy symptoms. Our analyses al-lowed us to reduce the number of asthma-related items on thequestionnaires to 7 (SQ) or 8 (PQ) by eliminating items thatwere individually weakly predictive or did not generalizewell to diverse social and geographic groups. However, sinceusing the pool of 7 (or 8) questionnaire responses providedbetter asthma prediction than modeling specific items, wecould not justify further abbreviating the questionnaire (Figs4 and 5).
We included the detection of allergies in the screen forseveral reasons. Like asthma, inhalant allergies are both com-mon and often unrecognized in children.27,28 Furthermore,there is significant morbidity associated with allergies, in-cluding sleep loss and school absenteeism.27–29 Common
pathophysiological mechanisms also often underlie allergicrhinoconjunctivitis and asthma,27–32 and information onsymptoms of each condition may help improve the identifi-cation of the other condition. Additionally, since allergies arerelevant in the development and aggravation of asthma,33–36
information on allergic symptoms may help target children atincreased risk for developing asthma.
Analysis of the allergy-specific questions provided a sim-ilar pattern to that of asthma. We used only 2 allergy-specificquestions, but requiring either “itchy eyes” or “runny nose”as constituting a positive screen showed high sensitivity andmodest specificity. Combining the 2 allergy questions pro-duced a marked reduction in sensitivity but made the screenvery specific. If the goal of allergy screening is to minimizefalse-negative results, then considering a positive responseto either student allergy question would yield a sensitivityof 80%.
The ultimate cost of any asthma-allergy screening programwill depend in part on the number of children identified whowill require additional testing. With a goal of achievingmoderate sensitivity (ie, considering positive responses to 3of the best 7 asthma questions), more than 35% of children(and as many as 49% of children in high-risk areas) with noreported history of prior asthma diagnosis would requireadditional testing for asthma. Our data suggest that approxi-mately 50% of these children are likely to meet clinicalcriteria for asthma. The overall societal costs for identifyingand treating between 15% and 25% of targeted school pop-ulations who may have undiagnosed asthma, as well as thecosts of evaluating children whose test results prove to befalse positive, need to be weighed against potential gains inreduced morbidity and improved quality of life of detectingand treating children with asthma and respiratory allergies.
Although the goal of this study was not to estimate theprevalence of undiagnosed asthma, it is important to note thevariability among sites in asthma and allergy symptoms.These differences are consistent with the observed 20- to30-fold international differences in wheezing and asthma37
found by ISAAC. Internationally, the highest prevalence ratesfor wheezing symptoms have been from Australia, New Zea-land, and Canada, where as many as 30% of school-agedchildren are reported to wheeze.37–39 In our study, asthma andallergy symptoms were highest in our 2 inner-city, AfricanAmerican sites, where approximately 50% to 60% of childrenwere reported to have asthma symptoms, resulting in anestimate of undiagnosed asthma as high as 25% to 30%.Previous research from Chicago, New York, and Detroit alsohas suggested that the prevalence of wheezing symptoms andundiagnosed asthma is extremely high among disadvantagedminority children,40–42 with symptoms such as nocturnalcough reported by 54% of inner-city, African American chil-dren.40
Among the challenges in developing a screening instru-ment that detects asthma and allergy among children is theneed to identify the appropriate “gold standard” for validity
VOLUME 93, JULY, 2004 43

Figure 4. Final version of the student questionnaire.
44 ANNALS OF ALLERGY, ASTHMA & IMMUNOLOGY

Figure 5. Final version of the parent/guardian questionnaire.
VOLUME 93, JULY, 2004 45

evaluation. Asthma is not clearly defined in young children,and there are no good objective tests available for a pediatricage group that are easily applied. Often the “gold standard”adopted is based on the opinion of an expert in the diagnosisand management of asthma.43,44 As has been done previously,we adopted this approach to validate the respiratory screen inthis study. In a similar manner, Hall et al45 presented data ona screening tool based on the International Union AgainstTuberculosis and Lung Disease interview. They validated a25-question instrument against a “gold standard” defined bythe results of an examination by a pulmonologist and pulmo-nary function studies. Their final 4-item questionnaire in-cluded wheezing or whistling in the chest, nocturnal cough-ing, exercise symptoms, and symptoms that interfered withactivities. Using a similar approach to enhance primary carediagnosis of asthma, Glasgow et al25 and Halfon andNewachek46 tested a short survey in rural Australia that alsowas validated against a history and physical examination.Their ideal balance showed a positive predictive value similarto our findings (51%) and a negative predictive value of 98%.Others have used less rigorous validation methods. Frank etal39 used a postal questionnaire survey that was validatedagainst a retrospective analysis of patient diagnosis of asthmaor of use of asthma medication. In that study, one third ofchildren for whom asthma was suggested by the survey didnot have corroborating support in the physician’s record.
Previously, one of us14 addressed the problem of develop-ing a validated screening tool by using a blinded panel ofexperts to make an independent determination on the pres-ence of asthma and allergy in children who had responded toan asthma questionnaire. We adopted this approach for thisstudy, with the modification that the expert panel was com-posed of the 4 investigators, one from each of the differentstudy sites. We believe that this approach minimizes be-tween-rater variability in the determination of the asthma andallergy outcomes, strengthening the validity and generaliz-ability of our findings.
We chose to use site-specific methods for distributing andcollecting the questionnaires to optimize local acceptabilityand maximize response rates. Three sites used modest incen-tives to enhance participation (Cleveland and Dallas used giftcertificates to educational stores for teachers and food or icecream certificates for children, and Chicago provided a pizzaparty for students). Our experience, however, indicated thateven when distribution methods were designed to accommo-date site-specific needs, participation rates varied substan-tially, suggesting the influences of intrinsic community,school, and cultural differences among the sites. Two of thesites that administered the SQs directly to students in schoolachieved nearly 100% participation rates (Dallas and Cleve-land). The Chicago site, which also administered the SQs inschools, however, obtained only a 56% participation rate.Although this appeared to be due to difficulties some Chicagostudents had understanding the written form, this was not theexperience in the other inner-city, predominantly AfricanAmerican site (Cleveland), where virtually all children in
grades 2 and higher completed the questionnaire. Both sitesused volunteers and research staff to read each question aloudto groups of students. In Dallas and Chicago, 74% and 85%,respectively, of PQs delivered home via backpack were re-turned; this is in contrast to Cleveland, where even after 2attempts to either send via backpack or mail home the PQ, aswell as attempts to have questionnaires completed by parentsattending school functions, the return rate was only 38%. TheRochester schools did not allow classroom time for question-naire administration, and both the PQs and SQs were mailedto the parents’ homes. The resulting response rate of com-pleted pairs of parent and student surveys was 57% after 2reminders. Based on these site-to-site differences, we recom-mend that the choice of using a student or parent screen orboth and the distribution method should be tailored to theprevailing culture of the school and community.
This study has several limitations that are often associatedwith multicenter studies. As discussed herein, not all siteswere able to implement the study using the same methods ofsurvey dissemination and completion, and the proportion ofstudents who completed questionnaires varied. It is possiblethat differences in the relationships between symptoms andclinical designations may have been observed if the sampleincluded in the validation studies was more cooperative andbetter able to complete questionnaires than the sample notrepresented. Also, different physicians or nurses at each ofthe sites completed examinations. This might affect the re-producibility of the findings on the history or physical exam-ination. However, the examination was not complex andincluded findings that may be considered somewhat subjec-tive in most any physician’s hands. Finally, allergy testingand spirometry were not completed on every eligible student,and the criteria for performing postbronchodilator spirometryvaried across sites. However, lack of postbronchodilator spi-rometry and allergy skin test data would most likely alter theconsensus designations from definite to probable, categoriesthat were later collapsed for analytic purposes. The strengthof the diverse sample and geographic distribution of sitesparticipating may offset the limitations experienced.
In conclusion, we have developed and validated a screen-ing tool for use in schools. The purpose of this screen is todetect students who have symptoms that indicate that theywould benefit from a further evaluation for asthma and aller-gies and therapy as indicated. We identified a range ofgroupings of questions that provide a spectrum of sensitivityand specificity. We also evaluated both a parental and achild’s form of the questionnaire. Our data indicate that theseforms are comparable, although the SQ in general providedgreater sensitivity and the PQ greater specificity. Finally, ourdata suggest that 7 to 8 asthma symptom questions and 2allergy symptom questions may provide approximately asmuch prediction ability as a longer series of items.
REFERENCES1. Grant EN, Turner-Roan K, Daugherty SR, et al. Development of
a survey of asthma knowledge, attitudes, and perceptions: the
46 ANNALS OF ALLERGY, ASTHMA & IMMUNOLOGY

Chicago Community Asthma Survey. Chicago Asthma Surveil-lance Initiative Project Team. Chest. 1999;116(Suppl):178S–183S.
2. Siersted HC, Boldsen J, Hansen HS, Mostgaard G, HyldebrandtN. Population based study of risk factors for underdiagnosis ofasthma in adolescence: Odense schoolchild study. BMJ. 1998;316:651–655, discussion 655–666.
3. Mannino DM, Homa DM, Pertowski CA, et al. Surveillance forasthma–United States, 1960 –1995. MMWR CDC SurveillSumm. 1998;47:1–27.
4. Yeatts K, Davis KJ, Sotir M, Herget C, Shy C. Who getsdiagnosed with asthma? Frequent wheeze among adolescentswith and without a diagnosis of asthma. Pediatrics. 2003;111:1046–1054.
5. Ciprandi G, Vizzaccaro A, Cirillo I, Tosca M, Passalacqua G,Canonica GW. Underdiagnosis and undertreatment of asthma: a9-year study of Italian conscripts. Int Arch Allergy Immunol.2001;125:211–215.
6. Grech V, Agius-Muscat H, Montefort S, Lenicker H. Recogni-tion of asthmatic symptoms in the pediatric age group. PediatrAllergy Immunol. 2001;12:49–53.
7. Helms PJ. Issues and unmet needs in pediatric asthma. PediatrPulmonol. 2000;30:159–165.
8. Newacheck PW, Halfon N. Prevalence, impact, and trends inchildhood disability due to asthma. Arch Pediatr Adolesc Med.2000;154:287–293.
9. Togias A. Rhinitis and asthma: evidence for respiratory systemintegration. J Allergy Clin Immunol. 2003;111:1171–1183.
10. Settipane RA. Rhinitis: a dose of epidemiological reality. Al-lergy Asthma Proc. 2003;24:147–154.
11. Weinmann S, Kamtsiuris P, Henke KD, Wickman M, Jenner A,Wahn U. The costs of atopy and asthma in children: assessmentof direct costs and their determinants in a birth cohort. PediatrAllergy Immunol. 2003;14:18–26.
12. Doull I, Lawrence S, Watson M, et al. Allelic association ofgene markers on chromosomes 5q and 11q with atopy andbronchial hyperresponsiveness. Am J Respir Crit Care Med.1996;153:1280–1284.
13. Wolf R, Berry C, O’Connor T, Coover L. Validation of the BriefPediatric Asthma Screen. Chest. 1999;116(Suppl):224S–228S.
14. Redline S, Larkin E, Kercsmar C, Berger M, Siminoff L.Development and validation of school-based asthma and allergyscreening instruments for parents and students. Ann AllergyAsthma Immunol. 2003;90:516–528.
15. Gruchalla RS, Gan V, Roy L, et al. Results of an inner-cityschool-based asthma and allergy screening pilot study: a com-bined approach using written questionnaires and step testing.Ann Allergy Asthma Immunol. 2003;90:491–499.
16. Wolf RL, Berry CA, Quinn K. Development and validation ofa brief pediatric screen for asthma and allergies among children.Ann Allergy Asthma Immunol. 2003;90:500–507.
17. Yawn BP, Wollan P, Scanlon PD, Kurland M. Outcome resultsof a school-based screening program for undertreated asthma.Ann Allergy Asthma Immunol. 2003;90:508–515.
18. Yawn BP, Wollan P, Scanlon P, Kurland M. Are we ready foruniversal school-based asthma screening? an outcomes evalua-tion. Arch Pediatr Adolesc Med. 2002;156:1256–1262.
19. Kattan M, Mitchell H, Eggleston P, et al. Characteristics ofinner-city children with asthma: the National Cooperative Inner-City Asthma Study. Pediatr Pulmonol. 1997;24:253–262.
20. Jones A, Bowen M. Screening for childhood asthma using anexercise test. Br J Gen Pract. 1994;44:127–1231.
21. Bauer EJ, Lurie N, Yeh C, Grant EN. Screening for asthma inan inner-city elementary school in Minneapolis, Minnesota. JSch Health. 1999;69:12–16.
22. Heaman DJ, Estes J. The free-running asthma screening test: anapproach to screening for exercise-induced asthma in ruralAlabama. J Sch Health. 1997;67:83–88.
23. Fowler SJ, Dempsey OJ, Sims EJ, Lipworth BJ. Screening forbronchial hyperresponsiveness using methacholine and adeno-sine monophosphate: relationship to asthma severity and �2-receptor genotype. Am J Respir Crit Care Med. 2000;162:1318–1322.
24. Glasgow NJ, Ponsonby AL, Yates RE, McDonald T, AttewellR. Asthma screening as part of a routine school health assess-ment in the Australian Capital Territory. Med J Aust. 2001;174:384–388.
25. Kilpelainen M, Terho EO, Helenius H, Koskenvuo M. Valida-tion of a new questionnaire on asthma, allergic rhinitis, andconjunctivitis in young adults. Allergy. 2001;56:377–384.
26. Braun-Fahrlander C, Gassner M, Grize L, et al. Comparison ofresponses to an asthma symptom questionnaire (ISAAC corequestions) completed by adolescents and their parents: SwissStudy on Childhood Allergy and Respiratory Symptoms withrespect to Air Pollution (SCARPOL-Team). Pediatr Pulmonol.1998;25:159–166.
27. Kim YY, Cho SH, Kim WK, et al. Prevalence of childhoodasthma based on questionnaires and methacholine bronchialprovocation test in Korea. Clin Exp Allergy. 1997;27:761–768.
28. Habbick BF, Pizzichini MM, Taylor B, Rennie D, SenthilselvanA, Sears MR. Prevalence of asthma, rhinitis and eczema amongchildren in 2 Canadian cities: the International Study of Asthmaand Allergies in Childhood. CMAJ. 1999;160:1824–1828.
29. Esamai F, Ayaya S, Nyandiko W, Anabwani GM. Prevalence ofasthma, allergic rhinitis and dermatitis in primary school chil-dren in Uasin Gishu district, Kenya. East Afr Med J. 2002;79:514–518.
30. Greisner WA III, Settipane RJ, Settipane GA. Co-existence ofasthma and allergic rhinitis: a 23-year follow-up study of col-lege students. Allergy Asthma Proc. 1998;19:185–188.
31. Palma-Carlos AG, Branco-Ferreira M, Palma-Carlos ML. Al-lergic rhinitis and asthma: more similarities than differences.Allerg Immunol (Paris). 2001;33:237–241.
32. Corren J. Allergic rhinitis and asthma: how important is thelink? J Allergy Clin Immunol. 1997;99:S781–S786.
33. Corretti MC, Anderson TJ, Benjamin EJ, et al. Guidelines forthe ultrasound assessment of endothelial-dependent flow-mediated vasodilation of the brachial artery: a report of theInternational Brachial Artery Reactivity Task Force. J Am CollCardiol. 2002;39:257–265. [Erratum in: J Am Coll Cardiol.2002;39:1082.]
34. Settipane RJ, Hagy GW, Settipane GA. Long-term risk factorsfor developing asthma and allergic rhinitis: a 23-year follow-upstudy of college students. Allergy Proc. 1994;15:21–25.
35. DuBuske LM. The link between allergy and asthma. AllergyAsthma Proc. 1999;20:341–345.
36. Leynaert B, Bousquet J, Neukirch C, Liard R, Neukirch F.Perennial rhinitis: an independent risk factor for asthma innonatopic subjects: results from the European Community Re-spiratory Health Survey. J Allergy Clin Immunol. 1999;104:301–304.
VOLUME 93, JULY, 2004 47

37. Worldwide variations in the prevalence of asthma symptoms:the International Study of Asthma and Allergies in Childhood(ISAAC). Eur Respir J. 1998;12:315–335.
38. Robertson CF, Dalton MF, Peat JK, et al. Asthma and otheratopic diseases in Australian children: Australian arm of theInternational Study of Asthma and Allergy in Childhood. Med JAust. 1998;168:434–438.
39. Frank TL, Frank PI, McNamee R, et al. Assessment of a simplescoring system applied to a screening questionnaire for asthmain children 5–15 years. Eur Respir J. 1999;14:1190–1197.
40. Persky VW, Slezak J, Contreras A, et al. Relationships of raceand socioeconomic status with prevalence, severity, and symp-toms of asthma in Chicago school children. Ann Allergy AsthmaImmunol. 1998;81:266–271.
41. Joseph CL, Foxman B, Leickly FE, Peterson E, Ownby D.Prevalence of possible undiagnosed asthma and associated mor-bidity among urban schoolchildren. J Pediatr. 1996;129:735–742.
42. Crain EF, Weiss KB, Bijor PE, Hush M, Westbrook L, SteinRE. An estimate of the prevalence of asthma and wheezingamong inner-city children. Pediatrics. 1994;94:356–362.
43. DeFronzo RA, Hendler R, Simonson D. Insulin resistance is aprominent feature of insulin-dependent diabetes. Diabetes.1982;31:795–801.
44. Demissie K, White N, Joseph L, Ernst P. Bayesian estimation ofasthma prevalence, and comparison of exercise and question-naire diagnostics in the absence of a gold standard. Ann Epide-miol. 1998;8:201–208.
45. Hall CB, Wakefield D, Rowe TM, Carlisle PS, Cloutier MM.Diagnosing pediatric asthma: validating the Easy BreathingSurvey. J Pediatr. 2001;139:267–272.
46. Halfon N, Newachek PW. Trends in the hospitalization foracute childhood asthma, 1970–84. Am J Public Health. 1986;76:1308–1311.
Requests for reprints should be addressed to:Marmie KivaAmerican College of Allergy, Asthma & Immunology85 West Algonquin Rd, Suite 550Arlington Heights, IL 60005E-mail: [email protected]
48 ANNALS OF ALLERGY, ASTHMA & IMMUNOLOGY