Embed Size (px)
Citation preview

Development and validation of a standard area diagram set to assess powdery mildew severity on watermelon leaves.
Ciência Rural, v.50, n.10, 2020.
1
Development and validation of a standard area diagram set to assess powdery mildew severity on watermelon leaves
Desenvolvimento e validação de uma escala diagramática para avaliar a severidade do oídio em folhas de melancia
Francinete Alves Nascimento1 Henrique da Silva Silveira Duarte2 Flávio França Souza3 Francine Hiromi Ishikawa1 Alexandre Sandri Capucho1*
ISSNe 1678-4596Ciência Rural, Santa Maria, v.50:10, e20200281, 2020
Received 03.30.20 Approved 06.08.20 Returned by the author 07.20.20CR-2020-0281.R1
http://doi.org/10.1590/0103-8478cr20200281
INTRODUCTION
Watermelon (Citrullus lanatus) is one of the most cultivated fruits in the world. In 2018, the world production exceeds 103 million tons, with the largest producers China, Turkey, Iran and Brazil (FAO, 2020). This fruit is the source of several bioactive compounds, such as lycopene, β-carotene and other flavonoids, as
well as citrulline, potassium and vitamins A and C. In particular, lycopene and β-carotene are well studied for their antioxidant activity in the human body, combating free radicals and oxidative stress (SCHWARZ et al. 2008; Qu et al. 2011).
Because of the rusticity, lower capital investment and the possibility of financial return in less than 90 days, the exploitation of this crop is very important for family farmers, especially in
1Universidade Federal do Vale do São Francisco (UNIFASF), 56300-990, Petrolina, PE, Brasil. E-mail: [email protected]. *Corresponding author.2Departamento de Fitotecnia e Fitossanidade, Universidade Federal do Paraná (UFPR), Curitiba, PR, Brasil.3Embrapa semiárido, Petrolina, PE, Brasil.
ABSTRACT: The development and validation of a standard area diagram set (SADs) was proposed in this study to assess the severity of powdery mildew (Podosphaera xanthii) in watermelon (Citrullus lanatus) leaves. The SADs proposed has twelve levels of severity, varying from 0.07 to 100%. The SADs were validated by 16 raters who had no previous experience in evaluating plant disease severity. Initially, the estimation of severity was performed without the use of the SADs in leaves with different levels of severity. In a second moment, the same raters estimated the disease severity using the SADs proposed. By Lin’s concordance correlation analysis, there was an improvement in precision (coefficient of correlation, r = 0.878 and r = 0.959, without and with SADs, respectively) and accuracy (bias correction factor, Cb = 0.830 and 0.982, without and with SADs, respectively) using SADs when compared to the non-use of SADs. The agreement (Lin’s concordance correlation coefficient, ρc = 0.734 and 0.952 without and with SADs, respectively) also improved using SADs. Severity estimates inter-rater were more reliable when using SADs (coefficient of determination, R2 = 0.681 without and R2 = 0.864 with SADs; Intra-class correlation coefficient, ρ = 0.759 and ρ = 0.928, without and with SADs, respectively). Therefore, SADs improved precision, accuracy and reliability of powdery mildew severity on watermelon leaves. Key words: disease assessment, severity, Podosphaera xanthii, Citrullus lanatus.
RESUMO: Neste estudo foi proposto o desenvolvimento e validação de uma escala diagramática (ED) para avaliar a severidade do oídio (Podosphaera xanthii) em folhas de melancia (Citrullus lanatus). A ED proposta possui 12 níveis de severidade, variando de 0,07 a 100%. A ED foi validada por 16 avaliadores inexperientes em avaliação de severidade de doenças de plantas. Inicialmente, as estimativas de severidade foram realizadas sem o uso da ED em folhas com diferentes níveis de severidade. No segundo momento, os mesmos avaliadores estimaram a severidade da doença usando a ED proposta. Pela análise da correlação concordante de Lin, houve melhoria na precisão (coeficiente de correlação, r = 0,787 e r = 0,959, sem e com o uso da ED, respectivamente) e acurácia (fator de correção do desvio, Cb = 0,830 e 0,982, sem e com o uso da ED, respectivamente) usando a ED quando comparado ao não uso da ED. O coeficiente de correlação concordante de Lin, ρc = 0,734 e 0,952 sem e com o uso da ED, respectivamente) também melhorou com o uso da ED. As estimativas de severidade tiveram melhoria na reprodutibilidade quando a ED foi usada (coeficiente de determinação, R2=0,681 e R2 = 0,864 sem e com o uso da ED, respectivamente; coeficiente de correlação intra-classe, ρ = 0,759 e ρ = 0,928, sem e com o uso da ED, respectivamente). Portanto, a ED melhorou a precisão, acurácia e reprodutibilidade das estimativas de severidade do oídio em folhas de melancia. Palavras-chave: avaliação de doenças, severidade, Podosphaera xanthii, Citrullus lanatus.
CROP PROTECTION

2
Ciência Rural, v.50, n.10, 2020.
Nascimento et al.
developing countries, like Brazil. The watermelon crop is undoubtedly one of the most susceptible to powdery mildew (DAUGHTREY et al. 2017).
Powdery mildew (Podosphaera xanthii) is one of the most frequent diseases on watermelon crop in a hot and dry environment, as it occurs in semiarid regions. In these regions a complete cycle of the disease occurs in 7 days, thus, epidemics can occur rapidly, since it is a polycyclic disease. Powdery mildew is favored by average temperatures between 20-27 ºC and relative humidity between 50-70% (DAUGHTREY et al. 2017), typical of semiarid regions, such as those occurring in the Caatinga biome from northeastern Brazil.
Damages caused by this disease are associated with the reduction of plant canopy, reducing the size and number of commercial fruits per plant, and reducing the quality of fruit and storage life (KEINATH & DUBOSE, 2004). The most adopted control of the disease measure is the use of site-specific systemic fungicides, but its overuse can lead to the selection of populations resistant to fungicides (MCGRATH, 2001). However, genetic control of plant diseases is most desired. Watermelon cultivars resistant to powdery mildew are scarce in Brazil and for the search for genotypes with some level of resistance it is necessary to quantify the severity of the disease, because the resistance in this pathosystem is horizontal (KIM et al. 2013; GAMA et al. 2015).
Disease measurement is an integral part of the epidemiology and management of powdery mildew of watermelon, as well as other plant diseases. For instance, estimates of disease intensity are commonly used to evaluate many plant diseases. In the case of powdery mildew of watermelon, severity is often the most useful variable to assess, where the percentage of diseased leaf tissue in relation to the total leaf area is estimated. It is important to ensure that estimates of disease severity are accurate, precise and reliable.
There are various methods to improve precision, accuracy and reliability of estimates including the use of standard area diagram set (SADs). A good SADs should be easy to use, makes disease assessment more accurate, precise, reliable, and be applicable under a wide variety of conditions (BOCK et al. 2016; MADDEN et al. 2007). In studies published in the plant pathology literature from 1991 to 2017, there is a tendency for the use of original color photographs (>24% of SADs) to compose the SADs and the use of a linear distribution to their ranges (DEL PONTE et al. 2017).
Therefore, the goals of this study were to develop and validate a SADs to quantify the severity of powdery mildew on watermelon leaves. Relationship between disease severity on upper and lower leaf surfaces was also evaluated.
MATERIALS AND METHODS
For the development of SADs, 150 leaves with symptoms of powdery mildew were collected in the susceptible ‘Crimson sweet’ cultivar and plants from a segregating population between ‘Crimson sweet’ and accessions from Active Bank Germplasm of Cucurbitaceae in the Brazilian Northeast from Embrapa. Leaves sampled showed the maximum variation in the disease severity in the field.
As powdery mildew occurs on the upper and lower leaf surface, both were scanned at a resolution of 300 dpi using a scanner, and after it was determined the actual severity using the Quant software (VALE et al. 2003). The severity was considered as the percentage of area covered by the structure of the fungus (hyphae, conidiophores and conidia) and symptoms of leaf necrosis. A correlation analysis was performed between the values of real severity of the upper and lower leaf surfaces, which were highly correlated. Thus, the SADs was based on data from the upper surface of the leaves. The twelve proposed severity diagrams were made with real leaves using a linear distribution intervals, as proposed in the literature (NUTTER & ESKER 2006; BOCK et al. 2010; DEL PONTE et al. 2017) (Figure 1).
The SADs were validated by 16 raters who had no previous experience in evaluating plant disease severity. Raters analyzed and estimated the powdery mildew severity using 40 images of leaves diseased. Each image was projected for 30 seconds on a white wall using a PowerPoint presentation. The length of the projected images was 70 cm. After a 10-min break, the raters analyzed and estimated the severity of another set of 40 images, this time with the help of the proposed SADs.
The accuracy, precision and inter-rater reliability of the estimates with and without the SADs were calculated as previously described (DOLINSKI et al. 2017). The statistical analyses were performed using R software (R CORE TEAM, 2020). The LCCC statistics were estimated by the epi.ccc function of the epiR package (STEVENSON et al. 2020). The built-in boot sample R function was used for the equivalence test. The ρ was estimated using the icc function of the irr R package (GAMER et al. 2019).

Development and validation of a standard area diagram set to assess powdery mildew severity on watermelon leaves.
Ciência Rural, v.50, n.10, 2020.
3
RESULTS AND DISCUSSION
Disease severity values in the upper and lower surfaces were highly correlated (0.959; P<0.001). Since it is more agile to estimate the powdery mildew on the upper surface of the leaves, the SADs was elaborated with the data of upper leaf surface and we recommend that the evaluation of the disease is performed on this side of surface of the leaf.
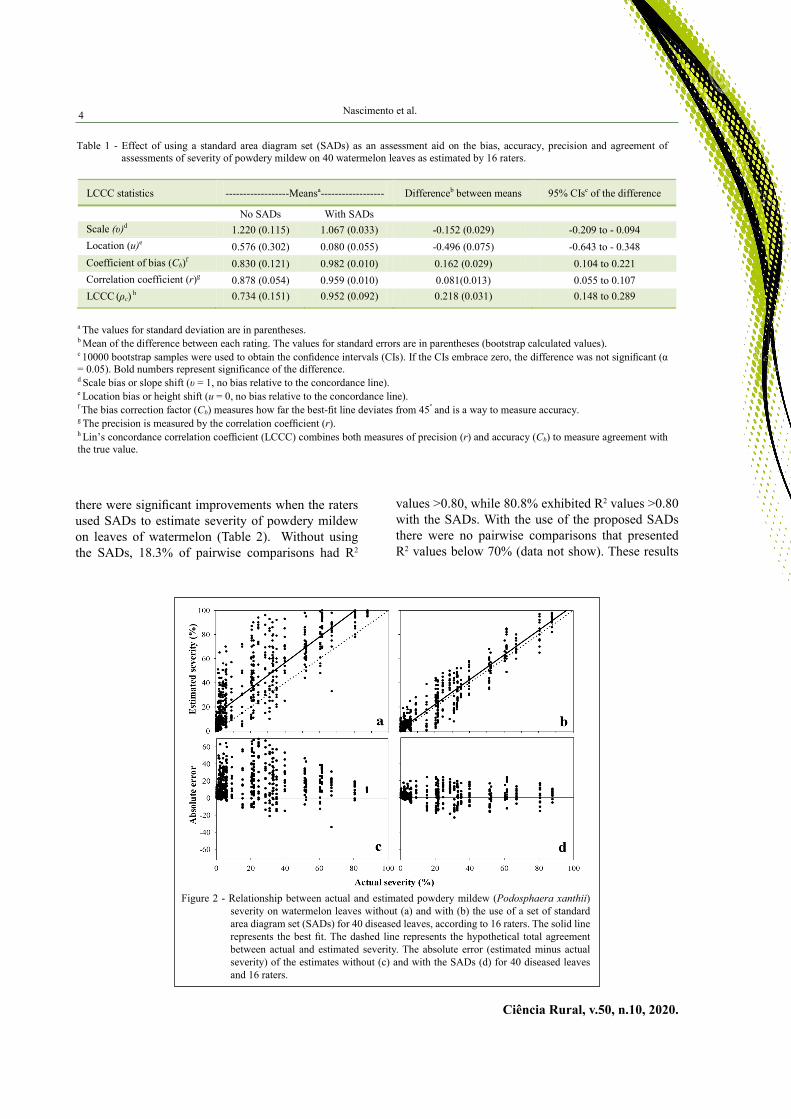
Based on estimated and actual severity, assessments made by the raters were closer to the actual values using the SADs (Fig. 2 a and b). All statistical parameters (υ, u, Cb, r, and ρc) of Lin’s concordance correlation (LCCC) were significantly
improved when the raters used the SADs to estimate disease severity, demonstrating that both the accuracy and precision of the estimated values were improved (Table 1). The absolute error of the estimates reduced significantly when the raters used the SADs (Fig. 2 c and d). Without SADs, there was a greater tendency to overestimate of disease severity. This is evidenced by 89% of the absolute error values were positive (Figure 2 c). Using these SADs, the tendency to overestimate of disease severity was reduced because 61% of absolute error values were positive (Figure 2 d).
Based on the intra-class correlation coefficient (ρ) and coefficient of determination (R2),
Figure 1 - Standard area diagram set (SADs) for powdery mildew (Podosphaera xanthii) severity on watermelon leaves. The numbers represent percent (%) leaf area showing structure of the fungus (hyphae, conidiophores and conidia) and symptoms of leaf necrosis.
4
Ciência Rural, v.50, n.10, 2020.
Nascimento et al.
there were significant improvements when the raters used SADs to estimate severity of powdery mildew on leaves of watermelon (Table 2). Without using the SADs, 18.3% of pairwise comparisons had R2
values >0.80, while 80.8% exhibited R2 values >0.80 with the SADs. With the use of the proposed SADs there were no pairwise comparisons that presented R2 values below 70% (data not show). These results
Table 1 - Effect of using a standard area diagram set (SADs) as an assessment aid on the bias, accuracy, precision and agreement of assessments of severity of powdery mildew on 40 watermelon leaves as estimated by 16 raters.
LCCC statistics ------------------Meansa------------------ Differenceb between means 95% CIsc of the difference
No SADs With SADs Scale (υ)d 1.220 (0.115) 1.067 (0.033) -0.152 (0.029) -0.209 to - 0.094 Location (u)e 0.576 (0.302) 0.080 (0.055) -0.496 (0.075) -0.643 to - 0.348 Coefficient of bias (Cb)f 0.830 (0.121) 0.982 (0.010) 0.162 (0.029) 0.104 to 0.221 Correlation coefficient (r)g 0.878 (0.054) 0.959 (0.010) 0.081(0.013) 0.055 to 0.107 LCCC (ρc) h 0.734 (0.151) 0.952 (0.092) 0.218 (0.031) 0.148 to 0.289
a The values for standard deviation are in parentheses. b Mean of the difference between each rating. The values for standard errors are in parentheses (bootstrap calculated values). c 10000 bootstrap samples were used to obtain the confidence intervals (CIs). If the CIs embrace zero, the difference was not significant (α = 0.05). Bold numbers represent significance of the difference. d Scale bias or slope shift (υ = 1, no bias relative to the concordance line). e Location bias or height shift (u = 0, no bias relative to the concordance line). f The bias correction factor (Cb) measures how far the best-fit line deviates from 45º and is a way to measure accuracy. g The precision is measured by the correlation coefficient (r). h Lin’s concordance correlation coefficient (LCCC) combines both measures of precision (r) and accuracy (Cb) to measure agreement with the true value.
Figure 2 - Relationship between actual and estimated powdery mildew (Podosphaera xanthii) severity on watermelon leaves without (a) and with (b) the use of a set of standard area diagram set (SADs) for 40 diseased leaves, according to 16 raters. The solid line represents the best fit. The dashed line represents the hypothetical total agreement between actual and estimated severity. The absolute error (estimated minus actual severity) of the estimates without (c) and with the SADs (d) for 40 diseased leaves and 16 raters.

Development and validation of a standard area diagram set to assess powdery mildew severity on watermelon leaves.
Ciência Rural, v.50, n.10, 2020.
5
demonstrated that using the SADs to estimate powdery mildew severity improved inter-rater reliability.
Disease measurement is an important procedure in the study of the epidemiology and management of powdery mildew severity on watermelon leaves. We have demonstrated that SADs improve precision, accuracy and reliability of the data collected and will help minimize the risk of erroneous decisions or Type II errors in statistical analysis (BOCK et al. 2010). The SADs have been demonstrated to improve the precision, accuracy and reliability of estimates of several crop diseases including, white spot on corn (CAPUCHO et al. 2010), rust on coffee (CAPUCHO et al. 2011), early blight on potato (DUARTE et al. 2013), blast on wheat (RIOS et al. 2013), rust on peach (DOLINSKI et al. 2017), botrytis leaf blight on onion (ARAÚJO et al. 2019), glomerella leaf spot on apple (MOREIRA et al. 2019), rust on eucalyptus (BORGES et al. 2019), rust on plum (VIDAL et al. 2019), grapevine downy mildew on Vitis labrusca (CAMARGO et al 2019), ring spot on sugarcane (ROESE & DUARTE, 2018) and rust on soybean (FRANCESCHI et al. 2020)
The intervals chosen and the number of diagrams used were sufficient to improve the accuracy, precision and reliability of the estimates made for the severity of Podosphaera xanthii in watermelon leaves. The number of diagrams is considered quite sufficient to include the levels of powdery mildew severity. A few amounts of diagrams contained in a SADs can compromise the accuracy and the precision of the values of powdery mildew severity selected by the raters (YADAV et al. 2012). However, an excessive number of diagrams can be time consuming and affect the efficiency of the assessments (CORREA et al. 2009; YADAV et al. 2012).
With the analysis of all the results we can safely recommend the use of the SADs proposed to assess the severity of powdery mildew on watermelon leaves, since the SADs helped the raters to generate
more accurate, precise and reliable severity estimates. Thus, these SADs is useful for breeders to evaluate the genetic resistance, as well, plant pathologist to evaluate control measures, assess the efficacy of fungicides, epidemiological research, develop crop loss models, pathotype characterization, and other studies where accurate, precise and reliable assessment of powdery mildew severity is required.
CONCLUSION
The SADs improved raters’ ability to accurately, precisely and reliably estimate powdery mildew severity on watermelon leaves.
ACKNOWLEDGEMENTS
This study was financed in part by the ‘Coordenação de Aperfeiçoamento de Pessoal de Nível Superior – Brasil’ (CAPES) – Finance Code 001. The first and second author thanks the ‘Conselho Nacional de Desenvolvimento Científico e Tecnológico’ (CNPq)/Brazil for its scholarship and research fellowship, respectively.
DECLARATION OF CONFLICTS OF INTERESTS
The authors declare no conflict of interest. The founding sponsors had no role in the design of the study; in the collection, analyses, or interpretation of data; in the writing of the manuscript, and in the decision to publish the results.
AUTHORS’ CONTRIBUTIONS
All authors contributed equally to the design and writing of the manuscript. All authors critically reviewed the manuscript and approved the final version.
REFERENCES
ARAÚJO, E.R. et al. A standard area diagram set for severity assessment of botrytis leaf blight of onion. European Journal of
Table 2 - Inter-rater reliability of assessments by 16 raters of powdery mildew on 40 leaves of watermelon both without and with the use of a standard area diagram set (SADs) assessment aid. Inter-rater reliability is measured by the intra-class correlation coeficiente (ρ) and coefficient of determination (R2).
Statistics No SADs With SADs
Intra-class correlation coefficient (ρ) 0.759 (CI 0.662-0.845) 0.928 (0.894-0.955) Mean inter-rater coefficient of determination (R2)a
0.681 (0.401 - 0.909) 0.864 (0.724 - 0.962) ---------------------Mean difference b = 0.182 (0.011), 95% CI 0.159-0.206-------------------
a Mean coefficients of determination estimated from pairwise comparisons of assessments by all visual raters. b Mean of the difference between each rating, with standard errors in parentheses (bootstrap calculated value), confidence intervals (CI) were based on 10000 bootstrap samples. If the CI embrace zero, the difference is not significant (α = 0.05).
6
Ciência Rural, v.50, n.10, 2020.
Nascimento et al.
Plant Pathology, v.153, p.283-287, 2019. Available from: <https://link.springer.com/article/10.1007/s10658-018-1526-4>. Accessed: Mar. 30, 2020. doi: 10.1007/s10658-018-1526-4.
BOCK, C.H. et al. Accuracy of plant specimen disease severity estimates: concepts, history, methods, ramifications and challenges for the future. CAB Reviews, v.11, p.1-21, 2016. Available from: <https://www.cabdirect.org/cabdirect/abstract/20163376514>. Accessed: Mar. 30, 2020. doi: 10.1079/PAVSNNR201611032.
BOCK, C.H. et al. Some consequences of using the Horsfall-Barratt scale for hypothesis testing. Phytopathology, v.100, p.1030-1041, 2010. Available from: <https://apsjournals.apsnet.org/doi/10.1094/PHYTO-08-09-0220>. Accessed: Mar. 30, 2020. doi: 10.1094/PHYTO-08-09-0220.
BORGES, L.S. et al. Standard area diagram set to assess rust severity on eucalyptus leaves. Forest Pathology, v.49, p.e12510-e12510, 2019. Available from: <https://onlinelibrary.wiley.com/doi/abs/10.1111/efp.12510>. Accessed: Mar. 30, 2020. doi: 10.1111/efp.12510.
CAMARGO, M.P. et al. Development and validation of a standard area diagram set to estimate severity of grapevine downy mildew on Vitis labrusca. European Journal of Plant Pathology, v.155, p.1033-1038, 2019. Available from: <https://link.springer.com/article/10.1007/s10658-019-01806-y>. Accessed: Mar. 30, 2020. doi: 10.1007/s10658-019-01806-y.
CAPUCHO, A.S. et al. Development and validation of a standard area diagram set to estimate severity of leaf rust in Coffea arabica and C. canephora. Plant Pathology, v.60, p.1144-1150, 2011. Available from: <https://bsppjournals.onlinelibrary.wiley.com/doi/full/10.1111/j.1365-3059.2011.02472.x>. Accessed: Mar. 30, 2020. doi: 10.1111/j.1365-3059.2011.02472.x.
CAPUCHO, A.S. et al. Influence of leaf position that correspond to whole plant severity and diagrammatic scale for white spot of corn. Crop Protection, v.29, p.1015-1020, 2010. Available from: <https://www.sciencedirect.com/science/article/pii/S0261219410001079>. Accessed: Mar. 30, 2020. doi: 10.1016/j.cropro.2010.04.012.
CORREA, F.M. et al. Comparison of three diagrammatic keys for the quantification of late blight in tomato leaves. Plant Pathology, v.58, p.1128-1133, 2009. Available from: <https://bsppjournals.onlinelibrary.wiley.com/doi/full/10.1111/j.1365-3059.2009.02140.x>. Accessed: Mar. 30, 2020. doi: 10.1111/j.1365-3059.2009.02140.x.
DAUGHTREY, M.L. et al. The powdery mildews. In: OWNLEY, B.H.; TRIGIANO, R.N. Plant pathology: Concepts and laboratory exercises. Boca Raton: CRC Press, 2017. Cap.12, p.191-204.
DEL PONTE, E.M. et al. Standard area diagrams for aiding severity estimation: Scientometrics, pathosystems and methodological trends in the last 25 years. Phytopathology, v.10, p.1161-1174, 2017. Available from: <https://apsjournals.apsnet.org/doi/10.1094/PHYTO-02-17-0069-FI>. Accessed: Mar. 30, 2020. doi: 10.1094/PHYTO-02-17-0069-FI.
DOLINSKI, M.A. et al. Development and validation of a standard area diagram set for assessment of peach rust. European Journal of Plant Pathology, v.148, p.817-824, 2017. Available from: <https://link.springer.com/article/10.1007/s10658-016-1138-9>. Accessed: Mar. 30, 2020. doi: 10.1007/s10658-016-1138-9.
DUARTE, H.S.S. et al. Development and validation of a set of standard area diagrams to estimate severity of potato early blight. European Journal of Plant Pathology. v.137, p.249-257, 2013. Available from: <https://link.springer.com/article/10.1007/s10658-013-0234-3>. Accessed: Mar. 30, 2020. doi: 10.1007/s10658-013-0234-3.
FAOSTAT. Food and Agriculture Organization os the United Nations. Available from: <http://www.fao.org/faostat/en/#data/QC>. Acessed: Mar. 09, 2020.
FRANCESCHI, V.T. et al. A new standard area diagram set for assessment of severity of soybean rust improves accuracy of estimates and optimizes resource use. Plant Pathology, v.69, p.495-505, 2020. Available from: <https://bsppjournals.onlinelibrary.wiley.com/doi/abs/10.1111/ppa.13148>. Accessed: Mar. 30, 2020. doi: 10.1111/ppa.13148.
GAMA, R.N.C.S. et al. Microsatellite markers linked to powdery mildew resistance locus in watermelon. Australasian journal of crop science, v.9, p.92-97, 2015 Available from: <http://www.cropj.com/natalia_9_1_2015_92_97.pdf>. Accessed: Mar. 30, 2020.
GAMER M. et al. irr: various coefficients of interrater reliability and agreement, 2019. Available from: <https://cran.r-project.org/web/packages/irr/irr.pdf>. Accessed: Mar. 30, 2020.
KEINATH, A.P.; DUBOSE, B. (2004). Evaluation of fungicides for prevention and management of powdery mildew on watermelon. Crop Protection, v.23, p.35-42, 2004. Available from: <https://www.sciencedirect.com/science/article/pii/S0261219403001650>. Accessed: Mar. 30, 2020. doi: 10.1016/S0261-2194(03)00165-0.
KIM, K.H. et al. Inheritance of resistance to powdery mildew in the watermelon and development of a molecular marker for selecting resistant plants. Horticulture, Environment, and Biotechnology, v.54, p.134-140, 2013 Available from: <https://link.springer.com/article/10.1007/s13580-013-0156-1>. Accessed: Mar. 30, 2020. doi: 10.1007/s13580-013-0156-1.
MADDEN, L.V. et al. The study of plant disease epidemics. Saint Paul: American Phytopathological Society, 2007.
MCGRATH, M.T. Fungicide resistance in cucurbit powdery mildew: Experiences and challenges. Plant Disease, v.85, p.236-245, 2001. Available from: <https://apsjournals.apsnet.org/doi/10.1094/PDIS.2001.85.3.236>. Accessed: Mar. 30, 2020. doi: 10.1094/PDIS.2001.85.3.236.
MOREIRA, R.R. Improving accuracy, precision and reliability of severity estimates of Glomerella leaf spot on apple leaves using a new standard area diagram set. European Journal of Plant Pathology, v.153, p.975-982, 2019. Available from: <https://link.springer.com/article/10.1007/s10658-018-01610-0>. Accessed: Mar. 30, 2020. doi: 10.1007/s10658-018-01610-0.
NUTTER, F.W.; ESKER, P.D. The role of psychophysics in phytopathology. European Journal of Plant Pathology, v.114, p.199-213, 2006. Available from: <https://link.springer.com/article/10.1007/s10658-005-4732-9>. Accessed: Mar. 30, 2020. doi: 10.1007/s10658-005-4732-9.
QU, M., et al. Protective effects of lycopene against amyloid beta-induced neurotoxicity in cultured rat cortical neurons. Neuroscience Letters, v.505, p.286-290, 2011. Available
Development and validation of a standard area diagram set to assess powdery mildew severity on watermelon leaves.
Ciência Rural, v.50, n.10, 2020.
7
from: <https://www.sciencedirect.com/science/article/abs/pii/S0304394011014467>. Accessed: Mar. 30, 2020. doi: 10.1016/j.neulet.2011.10.048.
R CORE TEAM. The R project for statistical computing, 2020. Available from: <https://www.r-project.org/>. Accessed: Mar. 30, 2020.
RIOS, J.A. et al. Development and validation of a standard area diagram set to assess blast severity on wheat leaves. European Journal of Plant Pathology, v.136, p.603 – 611, 2013. Available from: <https://link.springer.com/article/10.1007/s10658-013-0191-x>. Accessed: Mar. 30, 2020. doi: 10.1007/s10658-013-0191-x.
ROESE, A.D.; DUARTE, H.S.S. A standard area diagram set to aid assessment of ring spot symptoms severity on sugarcane. Sugar Tech, v.20, p.770-774, 2018. Available from: <https://link.springer.com/article/10.1007/s12355-018-0609-z>. Accessed: Mar. 30, 2020. doi: 10.1007/s12355-018-0609-z.
SCHWARZ, S. et al. Lycopene inhibits disease progression in patients with benign prostate hyperplasia. The Journal of Nutrition, v.138, p.49-53, 2008. Available from: <https://academic.oup.com/jn/article/138/1/49/4665062?searchresult=1>. Accessed: Mar. 30, 2020. doi: 10.1093/jn/138.1.49.
STEVENSON, M. et al. EpiR: Tools for the Analysis of Epidemiological Data, 2020. Available from: <https://cran.r-project.org/web/packages/epiR/epiR.pdf>. Accessed: Mar. 30, 2020.
VALE, F.X.R., et al. QUANT: A software plant disease severity assessment. In: CLOSE, R. et al. Proceedings of the 8th International Congress of Plant Pathology, New Zealand, 2003, v.8, p.105.
VIDAL, G. S. et al. Development and validation of a standard area diagram set for assessment of plum rust severity. Australasian plant pathology, v.48, p.603-606, 2019. Available from: <https://link.springer.com/article/10.1007/s13313-019-00662-y>. Accessed: Mar. 30, 2020. doi: 10.1007/s13313-019-00662-y.
YADAV, N.V. et al. Development and validation of standard area diagrams to aid assessment of pecan scab symptoms on fruit. Plant Pathology. v.62, p.325-335, 2013. Available from: <https://bsppjournals.onlinelibrary.wiley.com/doi/full/10.1111/j.1365-3059.2012.02641.x>. Accessed: Mar. 30, 2020. doi: https://bsppjournals.onlinelibrary.wiley.com/doi/full/10.1111/j.1365-3059.2012.02641.x.


![Validation and Accreditation of Transient Stability Results · PDF fileFigure 3.2: Block diagram of IEEEG1 as represented in [7] ... Figure 4.10: Block Diagram for PSS2A Stabilizer](https://img.dokumen.tips/doc/110x75/5a78865f7f8b9aa2448d3204/validation-and-accreditation-of-transient-stability-results-32-block-diagram-of.jpg)