Embed Size (px)
Citation preview

PhD
The
sis
Development and Testing of Tailored Tool Surfaces for Sheet Metal Forming
Mohd Hafi s Bin Sulaiman September 2017

Development and Testing of Tailored
Tool Surfaces for Sheet Metal Forming
PhD Thesis
Mohd Hafis Bin Sulaiman
Department of Mechanical Engineering
Technical University of Denmark
September 2017


Segala puji bagi Allah Robbil ‘Aalamiin
Untuk Nur Farahana, Affan Hafiy dan Afeef Fikri yang dicintai
Untuk Sulaiman, Hindun, Husny, Rushilawaty, Norsuhaida dan Abu Hanifah yang disayangi
Untuk Ramli, Ruziah dan Adib Firas yang dikasihi

PhD student
Mohd Hafis Bin Sulaiman, MEng
Department of Mechanical Engineering
Technical University of Denmark
Supervisors
Professor Emeritus Niels Bay, PhD, DSc, Dr. h.c.
Department of Mechanical Engineering
Technical University of Denmark
Associate Professor Chris Valentin Nielsen, PhD
Department of Mechanical Engineering
Technical University of Denmark
Peter Christiansen, PhD
Department of Mechanical Engineering
Technical University of Denmark
Examining Committee
Professor Leonardo De Chiffre, PhD, DSc, Dr. h.c.
Department of Mechanical Engineering
Technical University of Denmark
Professor Laurent Dubar, PhD
Directeur TEMPO EA 4542
Institute Carnot ARTS
Université de Valenciennes et du Hainaut Cambrésis, France
Ermano Ceron, PhD
Senior Engineer
Grundfos A/S, Denmark
i
PREFACE
This thesis is submitted in partial fulfillment of the requirements for obtaining the
degree of PhD at the Technical University of Denmark (DTU). This PhD project was
carried out in the period from 1st October 2014 to 30th September 2017 within the new
environmentally benign sheet metal forming tribology systems (SHETRIB) project
framework under supervision of Professor Emeritus Dr. Tech. Niels Bay, Associate
Professor Dr. Chris Valentin Nielsen and Dr. Peter Christiansen. This PhD project was
funded by the Ministry of Education, Malaysia and Universiti Malaysia Perlis.
My sincere gratitude goes to my supervisors for their guidance and continual support
throughout the course of this project. I equally appreciated their wisdom, tolerance,
patience and challenging criticism. I am very grateful to all staffs at the DTU-MEK
workshop who helped with the fabrication work, development of the test rig, and for
dealing with all of my last minute requests with great humour and professionalism.
Special thanks to my officemates for their companionship, helpful insights and friendly
working environment.
Many thanks to SHETRIB project partner Dr. Ermano Ceron from Grundfos A/S, Allan
de Neergaard and Casper Fjordbak Larsen from CemeCon Scandinavia A/S, Karsten
Sørensen from Carbo Tech Nordic ApS, Professor Tatsuhiko Aizawa from Shibaura
Institute of Technology Japan and Morita Hiroshi from Nano Film and Coat Laboratory
LLC Japan for consultations and materials. Many thanks also to Professor Habil. Paulo
AF Martins from University of Lisbon, Portugal for fruitful discussions and guidance
in the first year of my PhD project.
And most importantly, the unconditional love, support and care from my family, my
parents and parents in law, my beloved wife and kids, my siblings and siblings in law,
have been unsurpassed at all times, and for this, I am eternally indebted.
Whenever I think of the past 3-year PhD journey, it brings back so many memories. I
learnt Danish work-life balance environments and cultures, I enjoyed my first-time
skiing and I am delighted with those opportunities to meet up with prominent
professors, researchers, experts and PhD students in the field of metal forming during
seminars, industrial visits, conferences and summer holiday events in several places
like Copenhagen, Jutland, Nuremberg, Munich, Hirschegg, Phuket and Cambridge.
Mohd Hafis Bin Sulaiman
September 30th, 2017
ii
Abstract
This thesis describes measures taken to minimize or substitute environmentally
hazardous lubricants applied in sheet metal forming processes by less harmful
lubricants or not applying lubricant at all. The breakdown of lubricant film often leads
to galling, and therefore application of the hazardous lubricants has spurred industrial
interest. In order to face a serious challenge in trying to stimulate less consumptions of
such hazardous lubricants, the PhD project was intended to lead to improvements in
resistivity towards galling in sheet metal forming by studying three different subjects;
compressibility of lubricants, application of structured tool surfaces and application of
anti-seizure tool coatings.
In order to analyze the mechanisms of lubricant entrapment and escape,
knowledge of the lubricant bulk modulus characterizing the compressibility of lubricant
is required. Two methods were studied to achieve this purpose. A simple laboratory test
consisting of upsetting a specially designed metal cylinder with a lubricant reservoir
together with elasto-plastic, numerical modelling of the metal cylinder is carried out in
order to determine the bulk modulus at low pressure regimes of approximately 100
MPa. The above mentioned simple experimental procedure for determining lubricant
bulk modulus gives a first rough estimate, and it is supplemented by a more advanced
laboratory test based on a newly designed equipment. The lubricant compressibility
experiment with a direct pressure measurement inside the high-pressure container
allows for the direct determination of the bulk modulus at various pressure levels with
no influence from friction in the sealing between punch and container. Using water as
a reference, a good agreement between the experimental bulk modulus and values
suggested in literature was found. Testing of liquid lubricants has revealed a nonlinear
relationship between the bulk modulus and the pressure.
While texturing of workpiece surfaces to promote lubrication in sheet metal
forming has been applied for several decades, tool surface texturing is rather new. A
detailed background investigation and fundamental analysis of different textured tool
surface arrangements have been carried out by Strip Reduction Test (SRT). Low as well
as high viscosity oils were tested at varying sliding speeds. Micro-textured surfaces on
the tool were made using an in-house micro-milling machine for the manufacturing.
The SRT tools were manufactured with longitudinal, shallow pocket geometries
oriented perpendicular to the sliding direction. The pockets have small angles to the
workpiece surface and varying distance. The experiments show an optimum distance
between the pockets to exist that creates a table mountain topography with flat plateaus
and narrow pockets in between. If the flat plateaus are too narrow, an increase in
drawing load and pick-up on the tool plateaus is observed. The same occurs for too
wide plateaus. The tool textures were advantageous at larger sliding speeds when using
higher viscosity oils, which facilitates the escape of trapped lubricant by micro-plasto-
hydrodynamic lubrication. Large lubricant viscosity results in higher sheet plateau
roughness and prevents pick-up and galling.
iii
A theoretical friction model for a soft workpiece deforming against a textured
tool surface was proposed. The friction model takes into account the plastic wave
motion appearing, when the workpiece material flows into and out of local pockets
between the flat plateaus of a table mountain tool surface topography. The friction
model supports the experimental findings of an optimum distance between the pockets,
where the contribution to friction by mechanical interlocking of the strip in the pockets
is limited and lubrication of the plateaus is enhanced by micro-plasto-hydrodynamic
lubrication. It was found that an optimum amount of tool texture exists which reduces
friction and thus drawing load for the table-mountain tool surface topography.
Stamping of sheet metal components without lubrication or using minimum
amount of hazard free lubricant is a possible solution to diminish health hazards to
personnel and environmental impact and to reduce production costs. Adopting SRT,
which emulates industrial ironing production of deep drawn, stainless steel cans,
Diamond-Like Carbon (DLC) coating were deposited on SRT tools. The DLC coated
tools with multi-, double- and single-layer coating structures were tested under severe
tribological conditions, i.e, high normal pressure and temperature. A screening test
campaign on a manually operated sheet tribo-tester is carried out to identify promising
candidates. The screening tests revealed that the double layer coating worked
successfully, i.e. with no sign of galling using no lubrication even at elevated tool
temperature, while the other coatings peeled off and resulted in severe galling unless
lubrication was applied. The next test campaign on an automatic sheet tribo-tester
examines the durability of the promising candidate as regards persistence towards pick-
up. It is shown that the double-layer coating, DLC/Hyperlox®, can function effectively
if a minimum quantity of hazard free lubricant is applied and hence, avoid peeling off
of the coating leading to galling. Numerical simulation using a thermo-mechanical
analysis supports the experimental findings, where lubrication lowers the temperature
at the tool/workpiece interface by reducing the friction.
iv
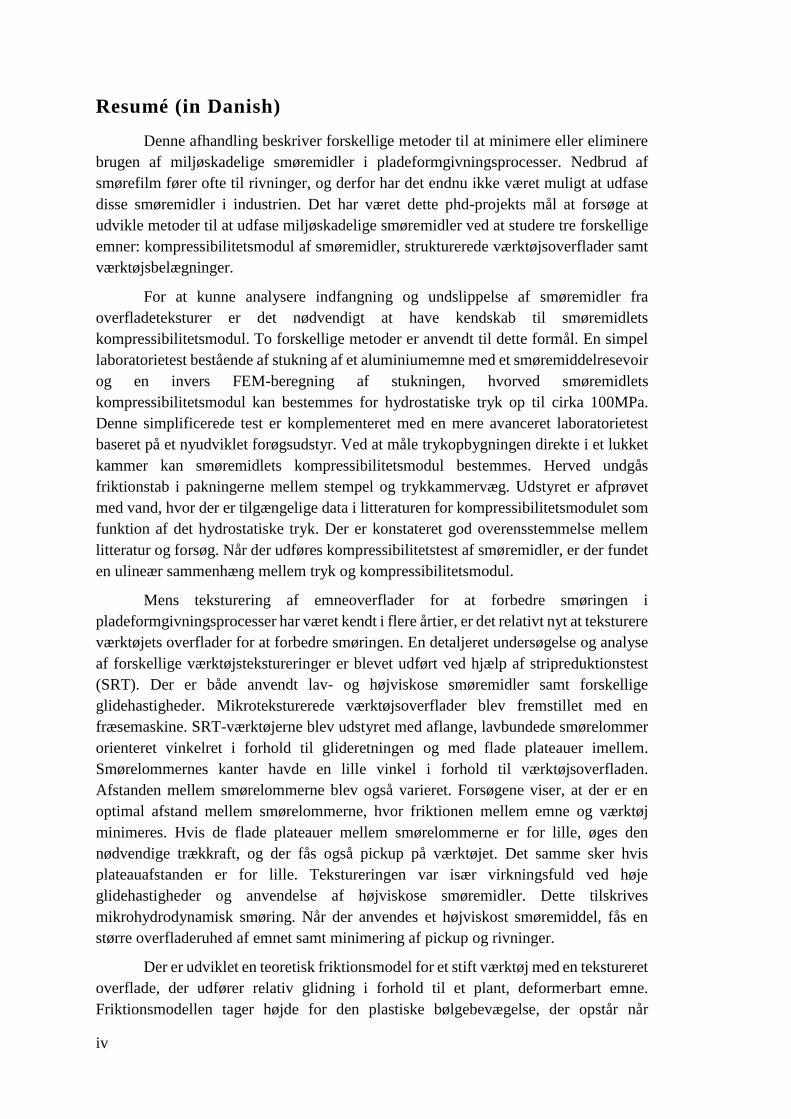
Resumé (in Danish)
Denne afhandling beskriver forskellige metoder til at minimere eller eliminere
brugen af miljøskadelige smøremidler i pladeformgivningsprocesser. Nedbrud af
smørefilm fører ofte til rivninger, og derfor har det endnu ikke været muligt at udfase
disse smøremidler i industrien. Det har været dette phd-projekts mål at forsøge at
udvikle metoder til at udfase miljøskadelige smøremidler ved at studere tre forskellige
emner: kompressibilitetsmodul af smøremidler, strukturerede værktøjsoverflader samt
værktøjsbelægninger.
For at kunne analysere indfangning og undslippelse af smøremidler fra
overfladeteksturer er det nødvendigt at have kendskab til smøremidlets
kompressibilitetsmodul. To forskellige metoder er anvendt til dette formål. En simpel
laboratorietest bestående af stukning af et aluminiumemne med et smøremiddelresevoir
og en invers FEM-beregning af stukningen, hvorved smøremidlets
kompressibilitetsmodul kan bestemmes for hydrostatiske tryk op til cirka 100MPa.
Denne simplificerede test er komplementeret med en mere avanceret laboratorietest
baseret på et nyudviklet forøgsudstyr. Ved at måle trykopbygningen direkte i et lukket
kammer kan smøremidlets kompressibilitetsmodul bestemmes. Herved undgås
friktionstab i pakningerne mellem stempel og trykkammervæg. Udstyret er afprøvet
med vand, hvor der er tilgængelige data i litteraturen for kompressibilitetsmodulet som
funktion af det hydrostatiske tryk. Der er konstateret god overensstemmelse mellem
litteratur og forsøg. Når der udføres kompressibilitetstest af smøremidler, er der fundet
en ulineær sammenhæng mellem tryk og kompressibilitetsmodul.
Mens teksturering af emneoverflader for at forbedre smøringen i
pladeformgivningsprocesser har været kendt i flere årtier, er det relativt nyt at teksturere
værktøjets overflader for at forbedre smøringen. En detaljeret undersøgelse og analyse
af forskellige værktøjstekstureringer er blevet udført ved hjælp af stripreduktionstest
(SRT). Der er både anvendt lav- og højviskose smøremidler samt forskellige
glidehastigheder. Mikroteksturerede værktøjsoverflader blev fremstillet med en
fræsemaskine. SRT-værktøjerne blev udstyret med aflange, lavbundede smørelommer
orienteret vinkelret i forhold til glideretningen og med flade plateauer imellem.
Smørelommernes kanter havde en lille vinkel i forhold til værktøjsoverfladen.
Afstanden mellem smørelommerne blev også varieret. Forsøgene viser, at der er en
optimal afstand mellem smørelommerne, hvor friktionen mellem emne og værktøj
minimeres. Hvis de flade plateauer mellem smørelommerne er for lille, øges den
nødvendige trækkraft, og der fås også pickup på værktøjet. Det samme sker hvis
plateauafstanden er for lille. Tekstureringen var især virkningsfuld ved høje
glidehastigheder og anvendelse af højviskose smøremidler. Dette tilskrives
mikrohydrodynamisk smøring. Når der anvendes et højviskost smøremiddel, fås en
større overfladeruhed af emnet samt minimering af pickup og rivninger.
Der er udviklet en teoretisk friktionsmodel for et stift værktøj med en tekstureret
overflade, der udfører relativ glidning i forhold til et plant, deformerbart emne.
Friktionsmodellen tager højde for den plastiske bølgebevægelse, der opstår når
v
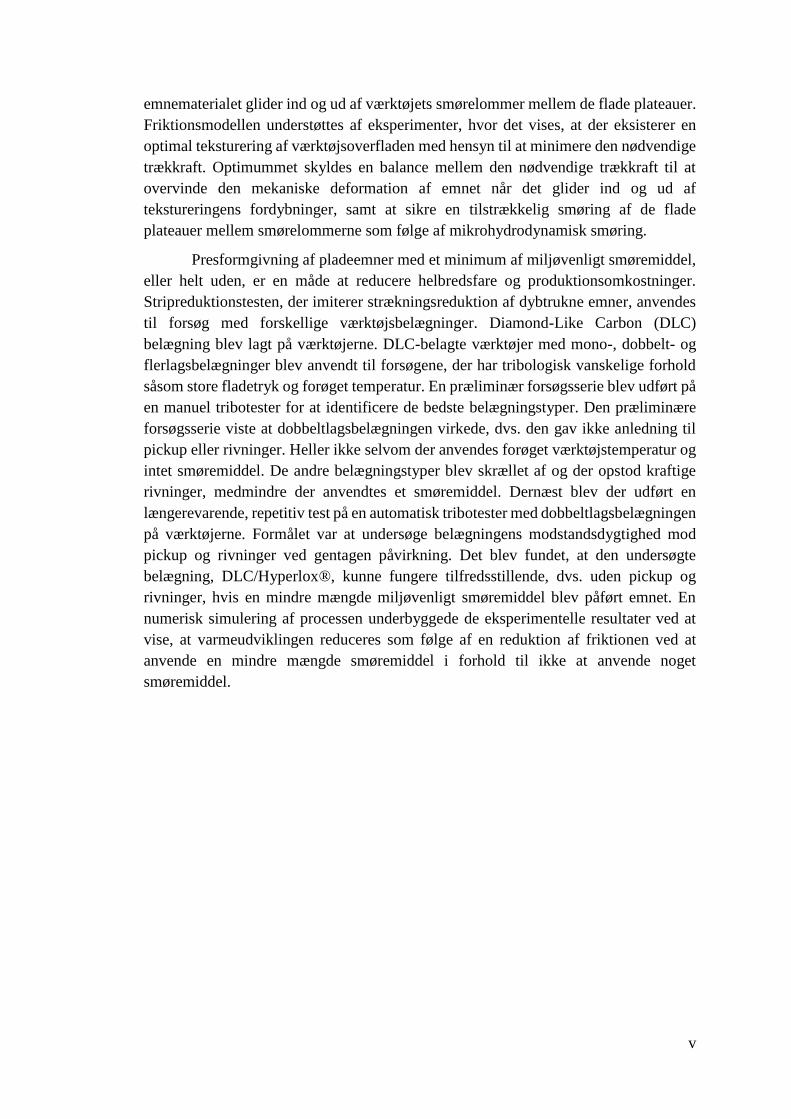
emnematerialet glider ind og ud af værktøjets smørelommer mellem de flade plateauer.
Friktionsmodellen understøttes af eksperimenter, hvor det vises, at der eksisterer en
optimal teksturering af værktøjsoverfladen med hensyn til at minimere den nødvendige
trækkraft. Optimummet skyldes en balance mellem den nødvendige trækkraft til at
overvinde den mekaniske deformation af emnet når det glider ind og ud af
tekstureringens fordybninger, samt at sikre en tilstrækkelig smøring af de flade
plateauer mellem smørelommerne som følge af mikrohydrodynamisk smøring.
Presformgivning af pladeemner med et minimum af miljøvenligt smøremiddel,
eller helt uden, er en måde at reducere helbredsfare og produktionsomkostninger.
Stripreduktionstesten, der imiterer strækningsreduktion af dybtrukne emner, anvendes
til forsøg med forskellige værktøjsbelægninger. Diamond-Like Carbon (DLC)
belægning blev lagt på værktøjerne. DLC-belagte værktøjer med mono-, dobbelt- og
flerlagsbelægninger blev anvendt til forsøgene, der har tribologisk vanskelige forhold
såsom store fladetryk og forøget temperatur. En præliminær forsøgsserie blev udført på
en manuel tribotester for at identificere de bedste belægningstyper. Den præliminære
forsøgsserie viste at dobbeltlagsbelægningen virkede, dvs. den gav ikke anledning til
pickup eller rivninger. Heller ikke selvom der anvendes forøget værktøjstemperatur og
intet smøremiddel. De andre belægningstyper blev skrællet af og der opstod kraftige
rivninger, medmindre der anvendtes et smøremiddel. Dernæst blev der udført en
længerevarende, repetitiv test på en automatisk tribotester med dobbeltlagsbelægningen
på værktøjerne. Formålet var at undersøge belægningens modstandsdygtighed mod
pickup og rivninger ved gentagen påvirkning. Det blev fundet, at den undersøgte
belægning, DLC/Hyperlox®, kunne fungere tilfredsstillende, dvs. uden pickup og
rivninger, hvis en mindre mængde miljøvenligt smøremiddel blev påført emnet. En
numerisk simulering af processen underbyggede de eksperimentelle resultater ved at
vise, at varmeudviklingen reduceres som følge af en reduktion af friktionen ved at
anvende en mindre mængde smøremiddel i forhold til ikke at anvende noget
smøremiddel.

vi
List of Publications
Part I: Compressibility of Lubricants
1. M.H. Sulaiman, P. Christiansen, P.A.F. Martins, N. Bay, “Determination of
lubricant bulk modulus in metal forming by means of a simple laboratory test
and inverse FEM analysis”. Proceedings of the 7th International Conference on
Tribology in Manufacturing Processes. 28 Feb – 2 Mac 2016. p. 316-323.
2. M.H. Sulaiman, P. Christiansen, N. Bay, “Direct measurement of lubricant bulk
modulus at high pressures”. Submitted to Lubrication Science, review in
progress.
Part II: Structured Tool Surfaces
1. M.H. Sulaiman, P. Christiansen, N. Bay, “The influence of tool texture on
friction and lubrication in strip reduction testing”. Special issue – Tribology in
Manufacturing Process, Journal “Lubricants”, 2017, 5 (3), p. 1-11.
2. M.H. Sulaiman, P. Christiansen, N. Bay, “The influence of tool texture on
friction and lubrication in strip reduction”. 12th Int. Conf. on Technology of
Plasticity (ICTP), Cambridge, United Kingdom, 17-22 Sept. 2017.
Part III: Anti-Seizure Tool Coatings
1. M.H. Sulaiman, P. Christiansen, N. Bay, “A study of DLC coatings in ironing
of stainless steel”. 36th Int. Deep Drawing Research Group (IDDRG)
conference, Munich, Germany, 2-6 July 2017.
2. M.H. Sulaiman, P. Christiansen, N. Bay, “A study of anti-seizure tool coatings
for ironing of stainless steel”. Submitted to Jurnal Tribologi – Special issue:
WTC2017, Accepted for publication.
vii
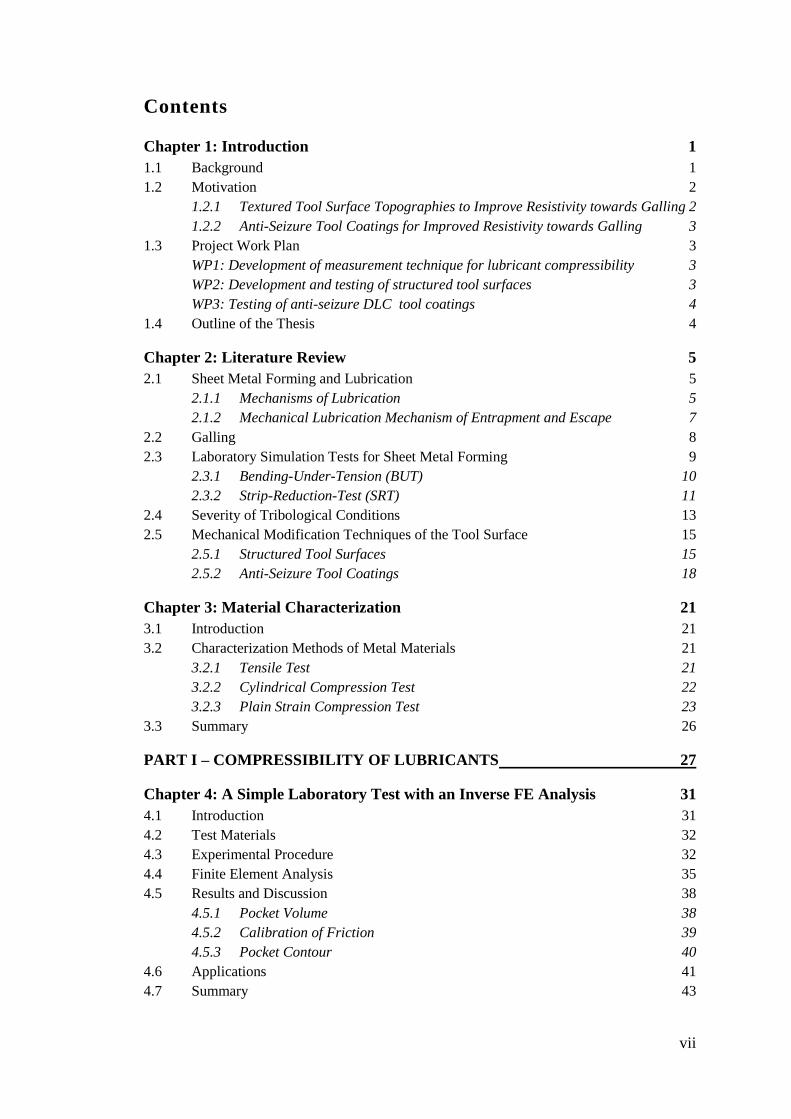
Contents
Chapter 1: Introduction 1
1.1 Background 1
1.2 Motivation 2
1.2.1 Textured Tool Surface Topographies to Improve Resistivity towards Galling 2
1.2.2 Anti-Seizure Tool Coatings for Improved Resistivity towards Galling 3
1.3 Project Work Plan 3
WP1: Development of measurement technique for lubricant compressibility 3
WP2: Development and testing of structured tool surfaces 3
WP3: Testing of anti-seizure DLC tool coatings 4
1.4 Outline of the Thesis 4
Chapter 2: Literature Review 5
2.1 Sheet Metal Forming and Lubrication 5
2.1.1 Mechanisms of Lubrication 5
2.1.2 Mechanical Lubrication Mechanism of Entrapment and Escape 7
2.2 Galling 8
2.3 Laboratory Simulation Tests for Sheet Metal Forming 9
2.3.1 Bending-Under-Tension (BUT) 10
2.3.2 Strip-Reduction-Test (SRT) 11
2.4 Severity of Tribological Conditions 13
2.5 Mechanical Modification Techniques of the Tool Surface 15
2.5.1 Structured Tool Surfaces 15
2.5.2 Anti-Seizure Tool Coatings 18
Chapter 3: Material Characterization 21
3.1 Introduction 21
3.2 Characterization Methods of Metal Materials 21
3.2.1 Tensile Test 21
3.2.2 Cylindrical Compression Test 22
3.2.3 Plain Strain Compression Test 23
3.3 Summary 26
PART I – COMPRESSIBILITY OF LUBRICANTS 27
Chapter 4: A Simple Laboratory Test with an Inverse FE Analysis 31
4.1 Introduction 31
4.2 Test Materials 32
4.3 Experimental Procedure 32
4.4 Finite Element Analysis 35
4.5 Results and Discussion 38
4.5.1 Pocket Volume 38
4.5.2 Calibration of Friction 39
4.5.3 Pocket Contour 40
4.6 Applications 41
4.7 Summary 43
viii
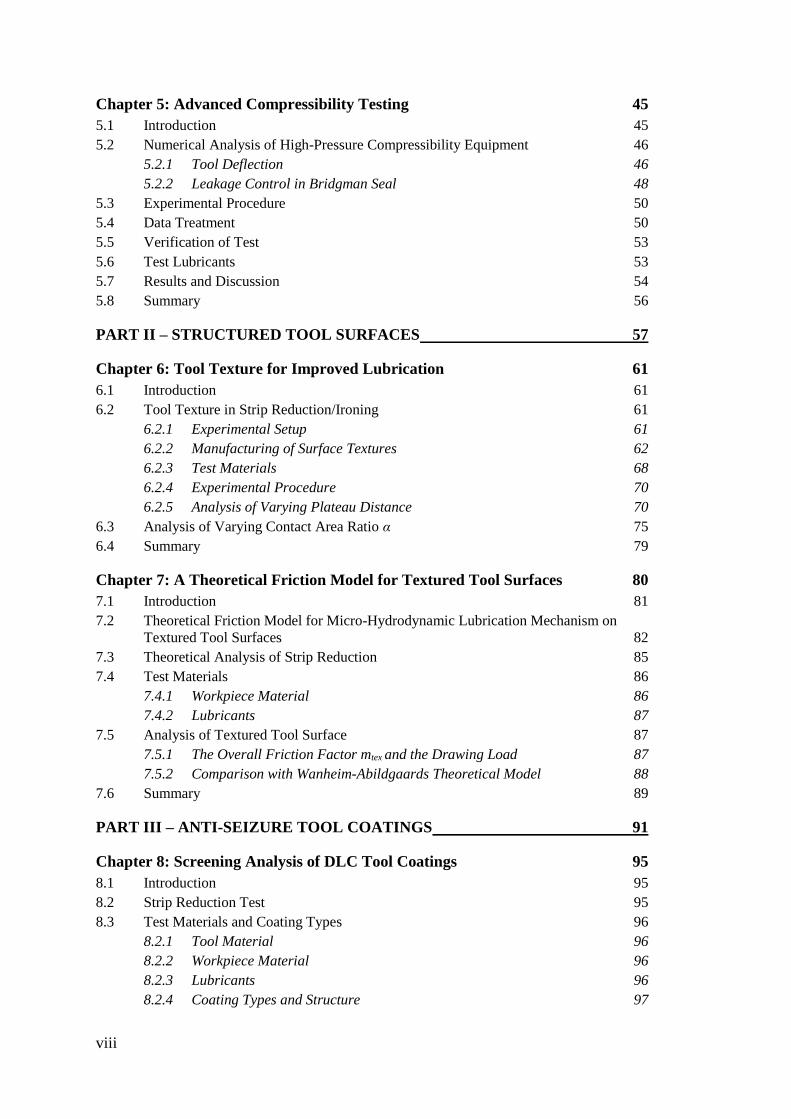
Chapter 5: Advanced Compressibility Testing 45
5.1 Introduction 45
5.2 Numerical Analysis of High-Pressure Compressibility Equipment 46
5.2.1 Tool Deflection 46
5.2.2 Leakage Control in Bridgman Seal 48
5.3 Experimental Procedure 50
5.4 Data Treatment 50
5.5 Verification of Test 53
5.6 Test Lubricants 53
5.7 Results and Discussion 54
5.8 Summary 56
PART II – STRUCTURED TOOL SURFACES 57
Chapter 6: Tool Texture for Improved Lubrication 61
6.1 Introduction 61
6.2 Tool Texture in Strip Reduction/Ironing 61
6.2.1 Experimental Setup 61
6.2.2 Manufacturing of Surface Textures 62
6.2.3 Test Materials 68
6.2.4 Experimental Procedure 70
6.2.5 Analysis of Varying Plateau Distance 70
6.3 Analysis of Varying Contact Area Ratio α 75
6.4 Summary 79
Chapter 7: A Theoretical Friction Model for Textured Tool Surfaces 80
7.1 Introduction 81
7.2 Theoretical Friction Model for Micro-Hydrodynamic Lubrication Mechanism on
Textured Tool Surfaces 82
7.3 Theoretical Analysis of Strip Reduction 85
7.4 Test Materials 86
7.4.1 Workpiece Material 86
7.4.2 Lubricants 87
7.5 Analysis of Textured Tool Surface 87
7.5.1 The Overall Friction Factor mtex and the Drawing Load 87
7.5.2 Comparison with Wanheim-Abildgaards Theoretical Model 88
7.6 Summary 89
PART III – ANTI-SEIZURE TOOL COATINGS 91
Chapter 8: Screening Analysis of DLC Tool Coatings 95
8.1 Introduction 95
8.2 Strip Reduction Test 95
8.3 Test Materials and Coating Types 96
8.2.1 Tool Material 96
8.2.2 Workpiece Material 96
8.2.3 Lubricants 96
8.2.4 Coating Types and Structure 97
ix
8.4 Experimental Procedure 97
8.5 Screening Analysis of DLC Coatings 98
8.4.1 Preliminary Experiment of DLC Coatings 98
8.4.2 A More Severe Testing of DLC Coating Type B 100
8.4.3 Repetitive Experiments with DLC Coating Type B 101
8.6 Laboratory Simulation of an Industrial Production Case 103
8.7 Summary 106
Chapter 9: Long-Term Analysis of a New DLC Tool Coating 107
9.1 Introduction 107
9.2 Coating Types 107
9.3 Screening Analysis of Tool Coatings in a Manual Tribo-Tester 108
9.2.1 Experimental Setup 108
9.2.2 Results and Discussion 109
9.4 Long-Term Analysis of Tool Coatings in Automatic Tribo-Tester 110
9.3.1 Introduction 110
9.3.2 Experimental Setup 111
9.3.3 Test Materials 112
9.3.4 Experimental Procedure 114
9.3.5 Results and Discussion 114
9.3.6 Numerical Simulation of Strip Reduction Test 117
9.5 Summary 120
Chapter 10: Conclusion and Future Research 121
10.1 Objective 1: Compressibility of Liquid Lubricants 121
10.1.1 Conclusions 121
10.1.2 Suggestions for Future Research 121
10.2 Objective 2: Structured Tool Surfaces 122
10.2.1 Conclusions 122
10.2.2 Suggestions for Future Research 122
10.3 Objective 3: Anti-Seizure Tool Coatings 123
10.3.1 Conclusions 123
10.3.2 Suggestions for Future Research 124
References 125
Appendices 131

x
Nomenclature
A Contact area [mm2]
Ao Nominal contact area [mm2]
Amet Metal-to-metal contact area [mm2]
B Strength coefficient [MPa]
C Strength coefficient [MPa]
Do Diameter (Chapter 4) [mm]
d Pocket depth [mm]
do Top diameter for surface pocket (Chapter 4) [mm]
di Base diameter for surface pocket (Chapter 4) [mm]
DR Drawing ratio [ - ]
E Elastic modulus [GPa]
F Force [N]
Favg Average drawing force [N]
Fb Back tension force [N]
Ff Front tension force [N]
FN Normal force [N]
FD Drawing force [N]
Ho Height (Chapter 4) [mm]
HTC Heat transfer coefficient [W/m2K]
HV Vickers hardness kp/mm2
ΔH Height change [mm]
h Thickness [mm]
havg Average thickness [mm]
ho Initial thickness (Chapter 2) [mm]
ho Height for surface pocket (Chapter 4) [mm]
h1 Final thickness [mm]
K Bulk modulus [GPa]
L Sliding length [mm]
l Length [mm]
m Friction factor [ - ]
mmet Local friction factor between strip and flat plateau [ - ]
mlow Friction factor on lower tool surface [ - ]
mlub Friction factor due to viscous drag forces [ - ]

xi
mpock Local pocket friction factor [ - ]
mtex Friction factor of textured tool surface [ - ]
mup Friction factor on upper tool surface [ - ]
mwave Apparent friction factor [ - ]
n Strain hardening exponent [ - ]
p Normal pressure [MPa]
p Hydrostatic pressure (Chapter 5) [MPa]
pf Forward normal pressure [MPa]
pi Instantaneous hydrostatic pressure (Chapter 5) [MPa]
pr Backward normal pressure [MPa]
qo Hydrostatic pressure of trapped lubricant within pocket [MPa]
R Radius of curvature [mm]
Ra Average surface roughness [µm]
r Radial direction (Chapter 5) [ - ]
r Thickness reduction [ - ]
Δr Radial expansion change (Chapter 5) [mm]
s Sliding length [mm]
T Temperature [°C]
Ti Initial temperature [°C]
ΔT Temperature change [°C]
t Time [s]
u Speed [mm/s]
V Volume [mm3]
Vo Initial volume [mm3]
ΔV Volume change (Chapter 5) [mm3]
w Width [mm]
W Total width [mm]
x Distance between pockets [mm]
X Total length [mm]
y Length [mm]
Y Total length [mm]
z Vertical direction (Chapter 5) [ - ]
Δz Vertical loading length change [mm]
α Contact angle (Chapter 6) [ ° ]
α Contact area ratio (Chapter 7) [ - ]
xii
γ Slope of inclined ceiling surface [ ° ]
ε Strain [ - ]
εeff Effective strain [ - ]
εo Effective strain [ - ]
𝜀 ̅ Initial effective strain or pre-straining [ - ]
𝜀1̅ Effective strain of material after drawing [ - ]
η Viscosity, referring to kinematic viscosity [cSt]
ηo Dynamic viscosity [Pa.s]
ηv Kinematic viscosity [cSt]
θ Angle [ ° ]
θ Slope of inclined pocket wall (Chapter 4) [ ° ]
κ Thermal conductivity W/(m.°C)
μ Friction coefficient [ - ]
ν Poisson ratio [ - ]
ρ Density [g/cm3]
σ Stress [MPa]
σd Drawing stress [MPa]
σf Flow stress [MPa]
σo Initial yield stress [MPa]
σr Radial stress [MPa]
𝜎𝑓 Average flow stress [MPa]
σ∞ Maximum flow stress [MPa]
τ Torque [Nm]
τs Shear stress [MPa]
υ Speed [mm/s]
1
Chapter 1: Introduction
Chapter 1: Introduction
1.1 Background
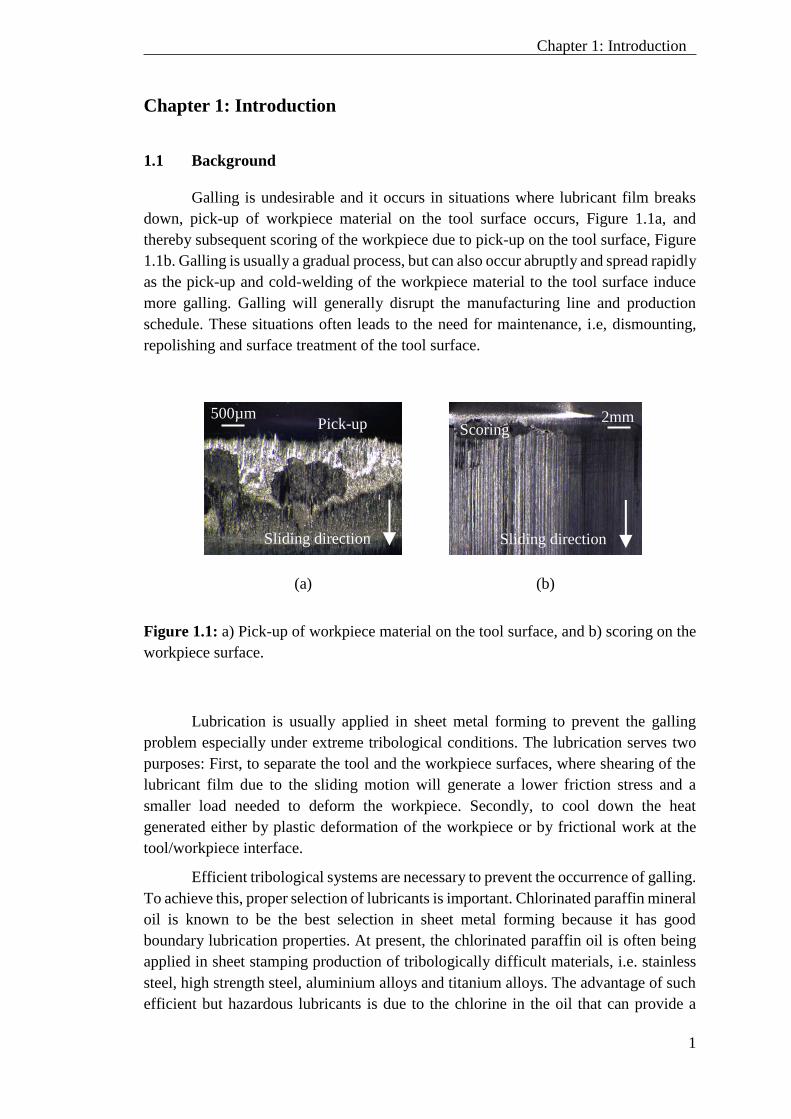
Galling is undesirable and it occurs in situations where lubricant film breaks
down, pick-up of workpiece material on the tool surface occurs, Figure 1.1a, and
thereby subsequent scoring of the workpiece due to pick-up on the tool surface, Figure
1.1b. Galling is usually a gradual process, but can also occur abruptly and spread rapidly
as the pick-up and cold-welding of the workpiece material to the tool surface induce
more galling. Galling will generally disrupt the manufacturing line and production
schedule. These situations often leads to the need for maintenance, i.e, dismounting,
repolishing and surface treatment of the tool surface.
(a) (b)
Figure 1.1: a) Pick-up of workpiece material on the tool surface, and b) scoring on the
workpiece surface.
Lubrication is usually applied in sheet metal forming to prevent the galling
problem especially under extreme tribological conditions. The lubrication serves two
purposes: First, to separate the tool and the workpiece surfaces, where shearing of the
lubricant film due to the sliding motion will generate a lower friction stress and a
smaller load needed to deform the workpiece. Secondly, to cool down the heat
generated either by plastic deformation of the workpiece or by frictional work at the
tool/workpiece interface.
Efficient tribological systems are necessary to prevent the occurrence of galling.
To achieve this, proper selection of lubricants is important. Chlorinated paraffin mineral
oil is known to be the best selection in sheet metal forming because it has good
boundary lubrication properties. At present, the chlorinated paraffin oil is often being
applied in sheet stamping production of tribologically difficult materials, i.e. stainless
steel, high strength steel, aluminium alloys and titanium alloys. The advantage of such
efficient but hazardous lubricants is due to the chlorine in the oil that can provide a
Sliding direction
Pick-up
Sliding direction
Scoring 500µm 2mm

2
Chapter 1: Introduction
strong molecular bonding to the exposed metallic surfaces [1], and this will generate a
protective low shear strength film to minimize friction and prevent metal-to-metal
contact.
The chlorinated paraffin oils are being largely consumed in production to avoid
galling, but surveys find insufficient awareness of risks and side effects to personnel
health and working environment. Application of such hazardous lubricants requires
additional costs for post-cleaning after stamping. Furthermore, insufficient post-
cleaning promotes hazardous chemical residues on the sheet surface, which may be
unacceptable in cases like biomedical and food container products. Here, efforts are
made of reducing or preventing the hazardous lubricants in production, employing
mechanical instead of chemical means.
1.2 Motivation
1.2.1 Textured Tool Surface Topographies to Improve Resistivity towards Galling
Liquid lubrication is commonly applied in sheet metal forming in progressive
dies for deep drawing, punching and ironing operations. The liquid lubricant serves to
separate the tool and workpiece surfaces by producing a thin, hydrodynamic film, here
the mechanism is named macro-hydrodynamic lubrication, which can carry the load.
Engineering of the workpiece surface topography by creating pockets for entrapment
of lubricant may further improve lubrication. The trapped lubricant is pressurized and
may subsequently escape from the pockets during forming by the so-called mechanism
of micro-hydrodynamic lubrication identified and studied by Azushima and Kudo [2]
and Bay et al. [3][4][5].
Industrial application of engineered surfaces has since the 1990-ies become
state of the art in automotive stamping industry [6][7]. Normally, tailored sheet surfaces
are made by skin-pass rolling in the final rolling step after annealing using large rolls
roughened by Shot Blast Texturing (SBT) or Electro Discharge Texturing (EDT),
Kijima and Bay [8]. A drawback is here the problem of reproducing the surfaces in
large scale sheet production due to wear of the textured roll surfaces. Besides this
drawback comes economic considerations and the fact that the technique is less feasible
in multistage operations, since the pockets are flattened out after the first forming
operation, Groche et al. [9]. Texturing of tool surfaces would be more economically
feasible since a textured tool surface can be utilized for thousands of workpiece
components. A few tests of surface engineered deep drawing tools by industries [10]
and researchers [11][12] have shown very promising results indicating that the textured
tool surfaces may lead to replacement of environmentally hazardous lubricants with
benign lubricants. This has led to a detailed investigation on parameters involved in the
application of textured tool surfaces for sheet metal forming to improve lubrication by
the micro-hydrodynamic lubrication mechanism.
3
Chapter 1: Introduction
1.2.2 Anti-Seizure Tool Coatings for Improved Resistivity towards Galling
A promising way to eliminate the hazardous lubricants is to perform the sheet
stamping under dry lubrication condition or using a minimum quantity of hazard free
lubricant by depositing an overlay hard coating layer to the tools, which impedes pick-
up. A few promising tool coatings, i.e, Diamond-Like Carbon (DLC) coating [13][14]
and pure diamond coating [15], have been reported to produce thousands of sheet
components with no galling in deep drawing of aluminium, stainless steel and titanium
under dry condition. Drawbacks of the pure diamond coating are cost and the fact that
it can only be deposited on specific tool materials, e.g. tungsten carbide. Furthermore,
it leaves a rough surface of crystalline diamond, which needs to be polished by a special
ultrasonic vibration technique [16][17] to obtain a smooth surface. Adopting DLC may
solve the galling problem, however literature reports the necessity of a good boundary
lubrication in sheet stamping at high normal pressures such as ironing or blanking [18]
due to the generation of a high shear stress in the DLC coating resulting in peeling off
of the coating from the tool surface. Due to this, it is of importance to understand the
DLC coating characteristics that can function in severe tribological stamping
environments.
1.3 Project Work Plan
The present PhD project includes three work packages; WP1, WP2 and WP3.
WP1: Development of measurement technique for lubricant compressibility
In order to understand the micro-hydrostatic lubrication mechanism of lubricant
entrapped in situations where the pressurized lubricant can carry the load, an important
lubricant property designated as the bulk modulus is needed for characterizing the
compressibility of the trapped lubricant at the tool/workpiece interface. The following
tasks are described for laboratory tests to determine the bulk modulus:
WP1.1 Development and testing of a simple laboratory test with an inverse Finite
Element Method (FEM) analysis to determine the bulk modulus.
WP1.2 Development and testing of a high-pressure equipment for directly measuring
the bulk modulus.
WP2: Development and testing of structured tool surfaces
Surface textures are being utilized to improve lubrication and to reduce friction.
The present work is centered on manufacturing structured textures on the tool surface.
The following tasks are planned to promote lubricant entrapment and subsequent escape
by the micro-plasto-hydrodynamic lubrication mechanism:
WP2.1 A detailed investigation and fundamental analysis of different textured tool
arrangements in Strip-Reduction-Test (SRT), replicating an ironing operation.
4
Chapter 1: Introduction
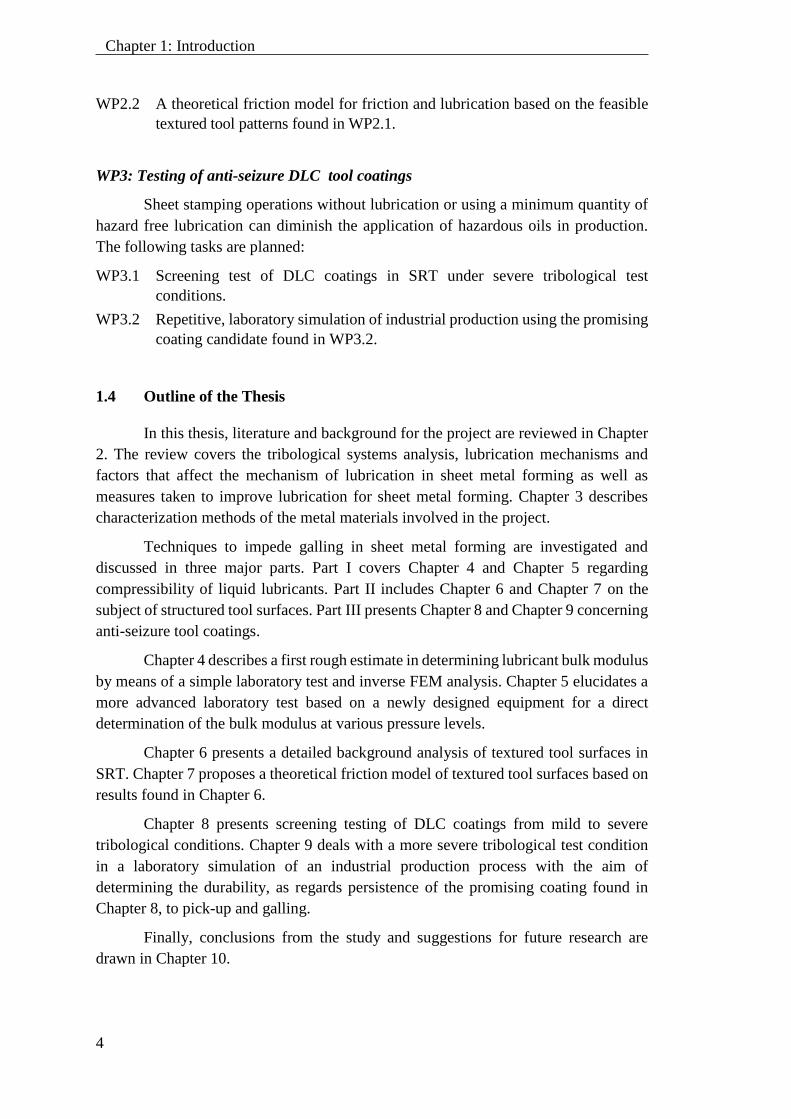
WP2.2 A theoretical friction model for friction and lubrication based on the feasible
textured tool patterns found in WP2.1.
WP3: Testing of anti-seizure DLC tool coatings
Sheet stamping operations without lubrication or using a minimum quantity of
hazard free lubrication can diminish the application of hazardous oils in production.
The following tasks are planned:
WP3.1 Screening test of DLC coatings in SRT under severe tribological test
conditions.
WP3.2 Repetitive, laboratory simulation of industrial production using the promising
coating candidate found in WP3.2.
1.4 Outline of the Thesis
In this thesis, literature and background for the project are reviewed in Chapter
2. The review covers the tribological systems analysis, lubrication mechanisms and
factors that affect the mechanism of lubrication in sheet metal forming as well as
measures taken to improve lubrication for sheet metal forming. Chapter 3 describes
characterization methods of the metal materials involved in the project.
Techniques to impede galling in sheet metal forming are investigated and
discussed in three major parts. Part I covers Chapter 4 and Chapter 5 regarding
compressibility of liquid lubricants. Part II includes Chapter 6 and Chapter 7 on the
subject of structured tool surfaces. Part III presents Chapter 8 and Chapter 9 concerning
anti-seizure tool coatings.
Chapter 4 describes a first rough estimate in determining lubricant bulk modulus
by means of a simple laboratory test and inverse FEM analysis. Chapter 5 elucidates a
more advanced laboratory test based on a newly designed equipment for a direct
determination of the bulk modulus at various pressure levels.
Chapter 6 presents a detailed background analysis of textured tool surfaces in
SRT. Chapter 7 proposes a theoretical friction model of textured tool surfaces based on
results found in Chapter 6.
Chapter 8 presents screening testing of DLC coatings from mild to severe
tribological conditions. Chapter 9 deals with a more severe tribological test condition
in a laboratory simulation of an industrial production process with the aim of
determining the durability, as regards persistence of the promising coating found in
Chapter 8, to pick-up and galling.
Finally, conclusions from the study and suggestions for future research are
drawn in Chapter 10.

5
Chapter 2: Literature Review
Chapter 2: Literature Review
2.1 Sheet Metal Forming and Lubrication
Lubrication is essential in most sheet metal forming processes. The lubricant
film has two basic functions: i) to separate the workpiece and tool surfaces and ii) to
cool the workpiece and the tool. Separation of the tool-workpiece surfaces by the
lubricant film implies lower friction facilitating deformation, lowering the tool loads,
reducing wear and avoiding pick-up of workpiece material on the tool surface.
2.1.1 Mechanisms of Lubrication
Four basic mechanisms of lubrication are identified in sheet metal forming [19]:
i) hydrodynamic lubrication, ii) mixed lubrication, iii) boundary lubrication and iv) dry
lubrication. The four mechanisms are shown schematically in Figure 2.1.
2.1.1.1 Hydrodynamic Lubrication
In hydrodynamic lubrication, the liquid lubricant film is thick enough to ensure
complete separation between tool and workpiece asperities and the load is completerly
carried by the pressurized, viscous film, see Figure 2.1a. The hydrodynamic lubrication
is defined by metal surfaces separated by a continuous lubricant film having a thickness
considerably greater than the height of the surface asperities of the metal. The
hydrodynamic lubrication is seldom observed in sheet metal forming, however it is
commonly observed in slide bearings where the lubricant is present in the bearing.
2.1.1.2 Mixed Lubrication
In sheet metal forming with liquid lubrication, the tribological conditions are
insufficient for complete separation of the tool and workpiece. In the mixed lubrication
regime, where the average film thickness is smaller, some asperity contacts are
established and the load is supported partly by the asperities aand partly by the
pressurized film trapped in the pockets of the rough workpiece surface, Figure 2.1b. At
the asperity contacts, pick-up of workpiece material on the tool surface is typically
prevented by a thin boundary lubricant film, Figure 2.1b. The assperity contacts may
also be lubricated by escape of pressurized lubricant in pockets in the workpiece surface
by so-called microhydrodynamic lubrication.
6
Chapter 2: Literature Review
2.1.1.3 Boundary Lubrication
In case of pure boundary lubrication, as shown in Figure 2.1c, the interface load
is completely carried by the asperities in contact and pure metal-to-metal contact is
avoided by a lubricant film only one or a few molecular layers thick. The film may be
physically adsorbed or chemisorbed on the metal surface. The classical phenomena of
boundary lubrication are exhibited by organic films that contain molecules with
permanent dipole moments, primarily derivatives of fatty oils, such as fatty acids,
alcohols, and amines. They are characterized by a long hydrocarbon chain and a polar
end that reacts with metal surface oxides. The long hydrocarbon chains are oriented
perpendicular to the metal surface and further layers subsequent to the layer
chemisorbed to the surface are held by weaker forces with increasing disorientation on
moving from the surface monolayer into the bulk of the fluid.
Extreme Pressure Additives
Extreme Pressure (EP) additive is one of the special additive types. Mineral oils
containing EP additives are commonly used in high volume sheet stamping production
[20]. When subjected to a sufficiently high contact pressure, the lubricant can be
squeezed out from between some of the asperities, permitting metallic contact at those
points. Chemical interaction plays an important role in which the EP additive reacts as
the interface temperature increases and generates a film by a chemical reaction with the
oxide of the metal surface. This will generally provide a low shear strength film to
reduce friction and physically help separating the workpiece from the tool. Since the
EP additives may contain either chlorine, phosphorus or sulphur, the mineral oils with
EP additives may have different levels of effectiveness, for instance, phosphorus is
effective up to 250 °C, chlorine is effective between 205 and 700 °C, and sulphur is
effective between 700 and 960 °C [21,22]. In most deep drawing operations, a thick
lubricant film with extreme pressure additives is of major advantage in controlling
friction and separating the workpiece against the drawing die and the blank holder.
2.1.1.4 Dry Lubrication
In case of dry lubrication, the interface load is completely carried by the
asperities in contact when no lubricant film is present, see Figure 2.1d. Larger friction
is present than in the boundary lubrication regime and this leads to an extreme, dry
frictional contact in the absence of lubricant. The adhesion of the sliding metal surfaces
can easily occur. This implies direct cold welding of the softer and weaker workpiece
material to the tool surface and subsequently tearing of fragments out of the surface.
The adhering particles plough through the surface and this leads to a quick progressing
pickup development and galling.
7
Chapter 2: Literature Review
(a)
(b)
(c)
(d)
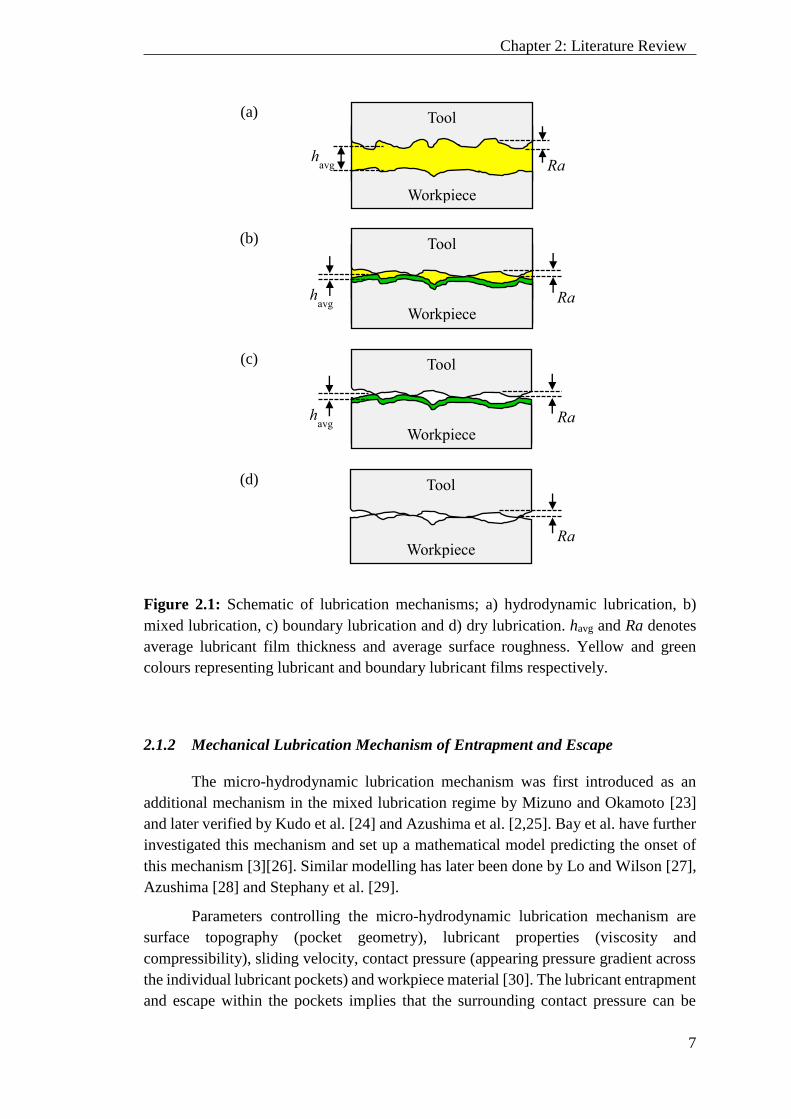
Figure 2.1: Schematic of lubrication mechanisms; a) hydrodynamic lubrication, b)
mixed lubrication, c) boundary lubrication and d) dry lubrication. havg and Ra denotes
average lubricant film thickness and average surface roughness. Yellow and green
colours representing lubricant and boundary lubricant films respectively.
2.1.2 Mechanical Lubrication Mechanism of Entrapment and Escape
The micro-hydrodynamic lubrication mechanism was first introduced as an
additional mechanism in the mixed lubrication regime by Mizuno and Okamoto [23]
and later verified by Kudo et al. [24] and Azushima et al. [2,25]. Bay et al. have further
investigated this mechanism and set up a mathematical model predicting the onset of
this mechanism [3][26]. Similar modelling has later been done by Lo and Wilson [27],
Azushima [28] and Stephany et al. [29].
Parameters controlling the micro-hydrodynamic lubrication mechanism are
surface topography (pocket geometry), lubricant properties (viscosity and
compressibility), sliding velocity, contact pressure (appearing pressure gradient across
the individual lubricant pockets) and workpiece material [30]. The lubricant entrapment
and escape within the pockets implies that the surrounding contact pressure can be
Workpiece
Tool
Ra h
avg
Tool
Ra havg
Workpiece
Tool
Ra havg
Workpiece
Tool
Ra Workpiece
8
Chapter 2: Literature Review
exceeded by the lubricant pressure acting on the edges of the lubricant pockets, thus the
lubricant moves from a high- to a low-pressure regime occurring on the asperity
plateaus.
(a) (b)
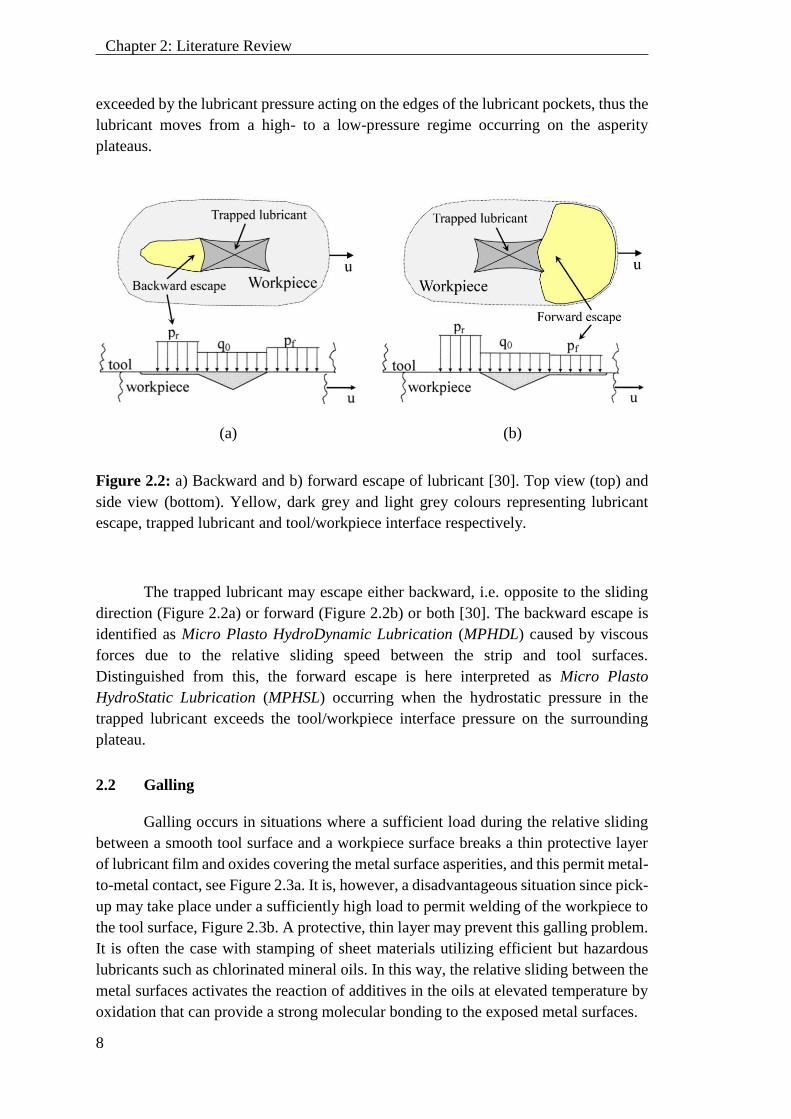
Figure 2.2: a) Backward and b) forward escape of lubricant [30]. Top view (top) and
side view (bottom). Yellow, dark grey and light grey colours representing lubricant
escape, trapped lubricant and tool/workpiece interface respectively.
The trapped lubricant may escape either backward, i.e. opposite to the sliding
direction (Figure 2.2a) or forward (Figure 2.2b) or both [30]. The backward escape is
identified as Micro Plasto HydroDynamic Lubrication (MPHDL) caused by viscous
forces due to the relative sliding speed between the strip and tool surfaces.
Distinguished from this, the forward escape is here interpreted as Micro Plasto
HydroStatic Lubrication (MPHSL) occurring when the hydrostatic pressure in the
trapped lubricant exceeds the tool/workpiece interface pressure on the surrounding
plateau.
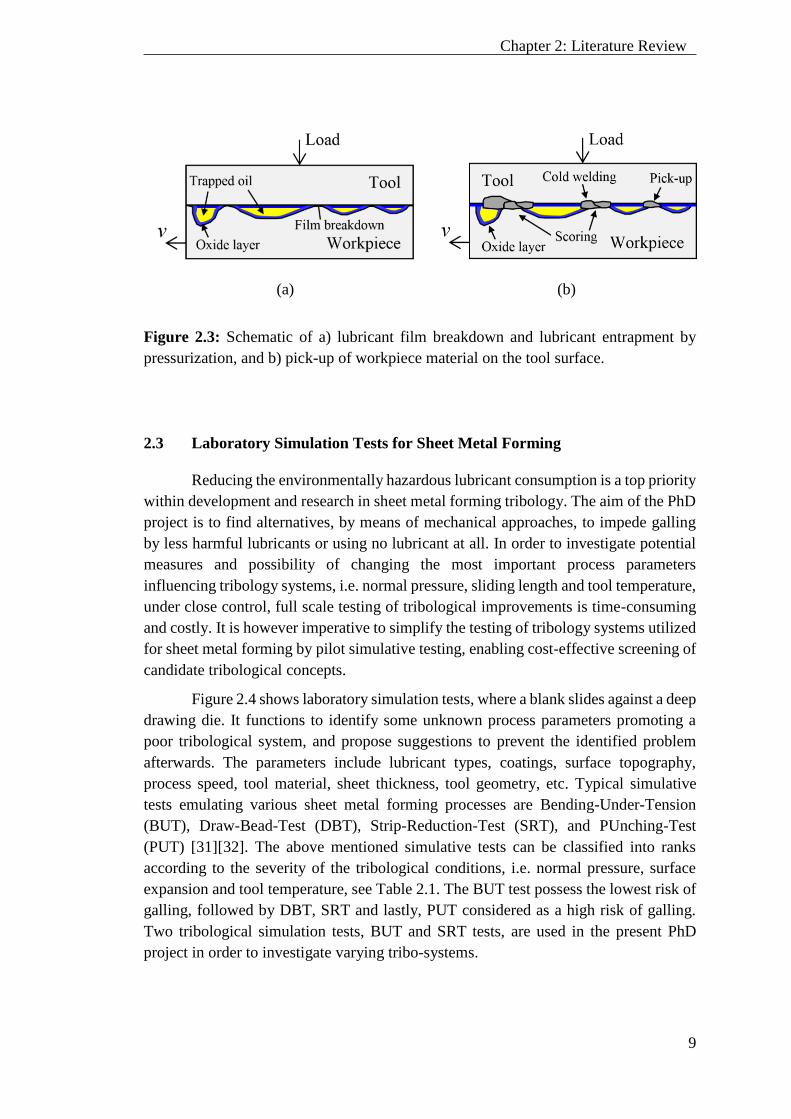
2.2 Galling
Galling occurs in situations where a sufficient load during the relative sliding
between a smooth tool surface and a workpiece surface breaks a thin protective layer
of lubricant film and oxides covering the metal surface asperities, and this permit metal-
to-metal contact, see Figure 2.3a. It is, however, a disadvantageous situation since pick-
up may take place under a sufficiently high load to permit welding of the workpiece to
the tool surface, Figure 2.3b. A protective, thin layer may prevent this galling problem.
It is often the case with stamping of sheet materials utilizing efficient but hazardous
lubricants such as chlorinated mineral oils. In this way, the relative sliding between the
metal surfaces activates the reaction of additives in the oils at elevated temperature by
oxidation that can provide a strong molecular bonding to the exposed metal surfaces.
9
Chapter 2: Literature Review
(a) (b)
Figure 2.3: Schematic of a) lubricant film breakdown and lubricant entrapment by
pressurization, and b) pick-up of workpiece material on the tool surface.
2.3 Laboratory Simulation Tests for Sheet Metal Forming
Reducing the environmentally hazardous lubricant consumption is a top priority
within development and research in sheet metal forming tribology. The aim of the PhD
project is to find alternatives, by means of mechanical approaches, to impede galling
by less harmful lubricants or using no lubricant at all. In order to investigate potential
measures and possibility of changing the most important process parameters
influencing tribology systems, i.e. normal pressure, sliding length and tool temperature,
under close control, full scale testing of tribological improvements is time-consuming
and costly. It is however imperative to simplify the testing of tribology systems utilized
for sheet metal forming by pilot simulative testing, enabling cost-effective screening of
candidate tribological concepts.
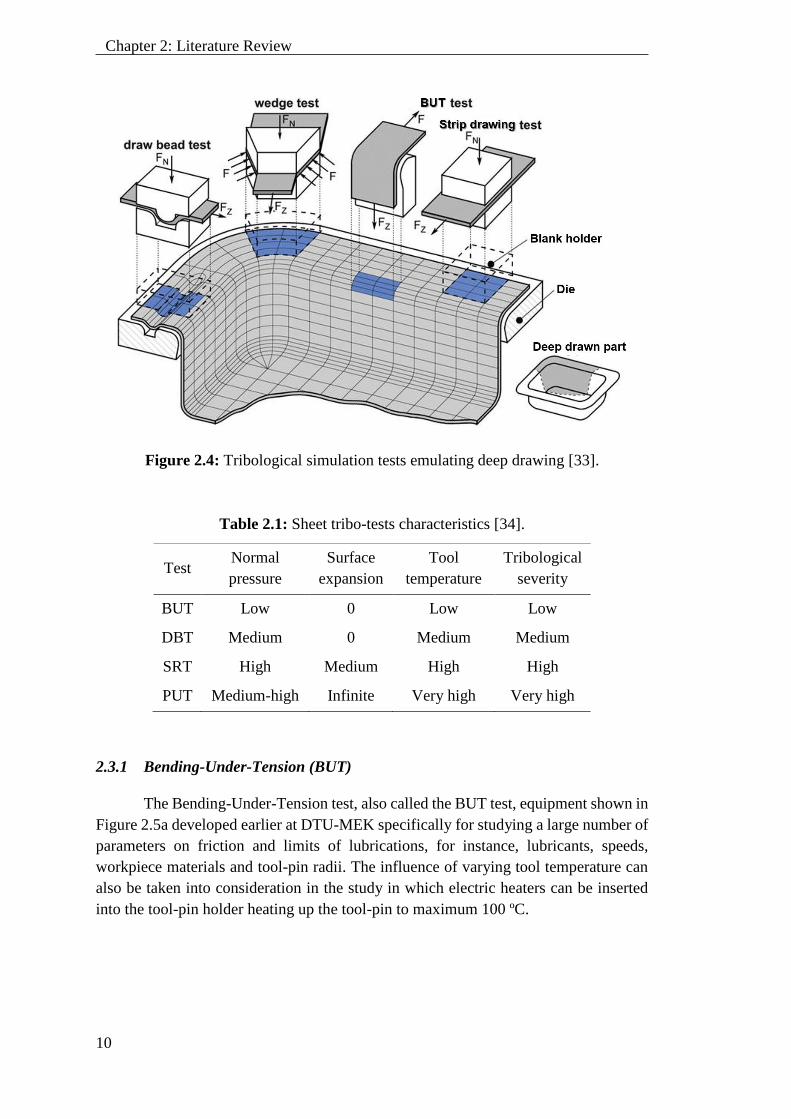
Figure 2.4 shows laboratory simulation tests, where a blank slides against a deep
drawing die. It functions to identify some unknown process parameters promoting a
poor tribological system, and propose suggestions to prevent the identified problem
afterwards. The parameters include lubricant types, coatings, surface topography,
process speed, tool material, sheet thickness, tool geometry, etc. Typical simulative
tests emulating various sheet metal forming processes are Bending-Under-Tension
(BUT), Draw-Bead-Test (DBT), Strip-Reduction-Test (SRT), and PUnching-Test
(PUT) [31][32]. The above mentioned simulative tests can be classified into ranks
according to the severity of the tribological conditions, i.e. normal pressure, surface
expansion and tool temperature, see Table 2.1. The BUT test possess the lowest risk of
galling, followed by DBT, SRT and lastly, PUT considered as a high risk of galling.
Two tribological simulation tests, BUT and SRT tests, are used in the present PhD
project in order to investigate varying tribo-systems.
10
Chapter 2: Literature Review
Figure 2.4: Tribological simulation tests emulating deep drawing [33].
Table 2.1: Sheet tribo-tests characteristics [34].
Test Normal
pressure
Surface
expansion
Tool
temperature
Tribological
severity
BUT Low 0 Low Low
DBT Medium 0 Medium Medium
SRT High Medium High High
PUT Medium-high Infinite Very high Very high
2.3.1 Bending-Under-Tension (BUT)
The Bending-Under-Tension test, also called the BUT test, equipment shown in
Figure 2.5a developed earlier at DTU-MEK specifically for studying a large number of
parameters on friction and limits of lubrications, for instance, lubricants, speeds,
workpiece materials and tool-pin radii. The influence of varying tool temperature can
also be taken into consideration in the study in which electric heaters can be inserted
into the tool-pin holder heating up the tool-pin to maximum 100 ºC.
11
Chapter 2: Literature Review
(a) (b)
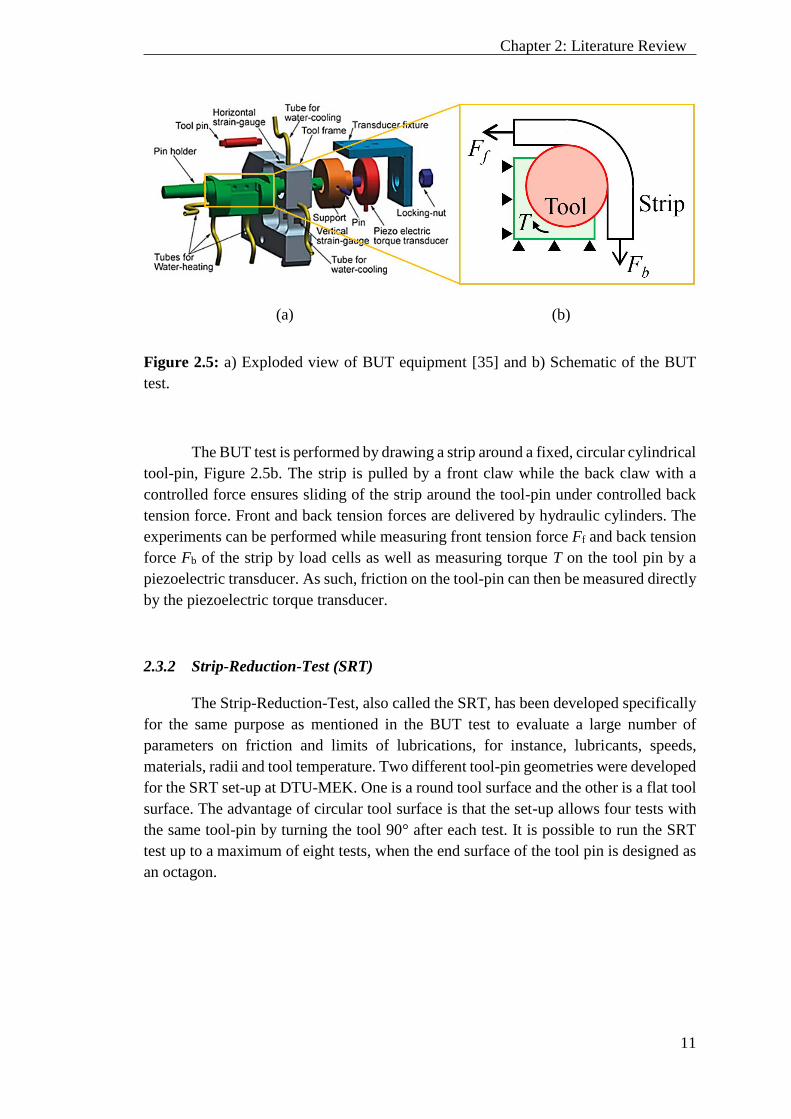
Figure 2.5: a) Exploded view of BUT equipment [35] and b) Schematic of the BUT
test.
The BUT test is performed by drawing a strip around a fixed, circular cylindrical
tool-pin, Figure 2.5b. The strip is pulled by a front claw while the back claw with a
controlled force ensures sliding of the strip around the tool-pin under controlled back
tension force. Front and back tension forces are delivered by hydraulic cylinders. The
experiments can be performed while measuring front tension force Ff and back tension
force Fb of the strip by load cells as well as measuring torque T on the tool pin by a
piezoelectric transducer. As such, friction on the tool-pin can then be measured directly
by the piezoelectric torque transducer.
2.3.2 Strip-Reduction-Test (SRT)
The Strip-Reduction-Test, also called the SRT, has been developed specifically
for the same purpose as mentioned in the BUT test to evaluate a large number of
parameters on friction and limits of lubrications, for instance, lubricants, speeds,
materials, radii and tool temperature. Two different tool-pin geometries were developed
for the SRT set-up at DTU-MEK. One is a round tool surface and the other is a flat tool
surface. The advantage of circular tool surface is that the set-up allows four tests with
the same tool-pin by turning the tool 90° after each test. It is possible to run the SRT
test up to a maximum of eight tests, when the end surface of the tool pin is designed as
an octagon.
12
Chapter 2: Literature Review
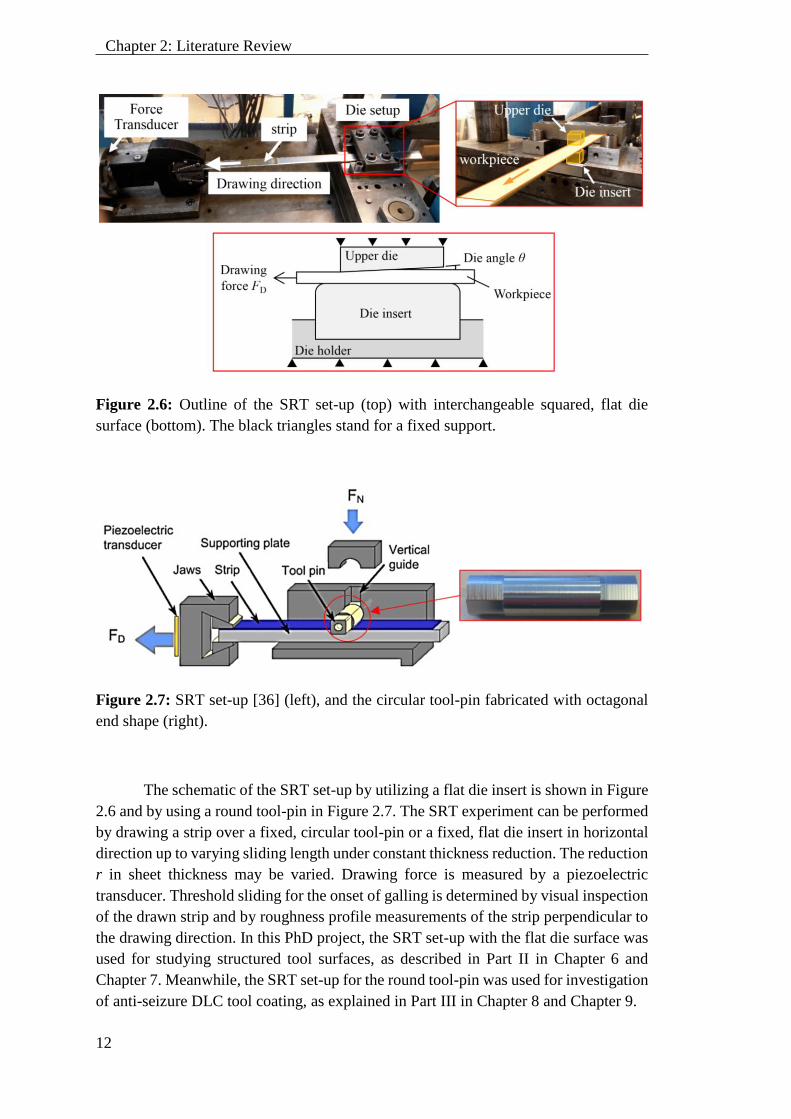
Figure 2.6: Outline of the SRT set-up (top) with interchangeable squared, flat die
surface (bottom). The black triangles stand for a fixed support.
Figure 2.7: SRT set-up [36] (left), and the circular tool-pin fabricated with octagonal
end shape (right).
The schematic of the SRT set-up by utilizing a flat die insert is shown in Figure
2.6 and by using a round tool-pin in Figure 2.7. The SRT experiment can be performed
by drawing a strip over a fixed, circular tool-pin or a fixed, flat die insert in horizontal
direction up to varying sliding length under constant thickness reduction. The reduction
r in sheet thickness may be varied. Drawing force is measured by a piezoelectric
transducer. Threshold sliding for the onset of galling is determined by visual inspection
of the drawn strip and by roughness profile measurements of the strip perpendicular to
the drawing direction. In this PhD project, the SRT set-up with the flat die surface was
used for studying structured tool surfaces, as described in Part II in Chapter 6 and
Chapter 7. Meanwhile, the SRT set-up for the round tool-pin was used for investigation
of anti-seizure DLC tool coating, as explained in Part III in Chapter 8 and Chapter 9.
13
Chapter 2: Literature Review
2.4 Severity of Tribological Conditions
Sheet stamping includes single- and multi-stage operations. In single-stage
operations, a single tool set will shape a strip or a sheet metal into a desired form. In a
multi-stage operation, the workpiece undergoes a series of deformation steps in
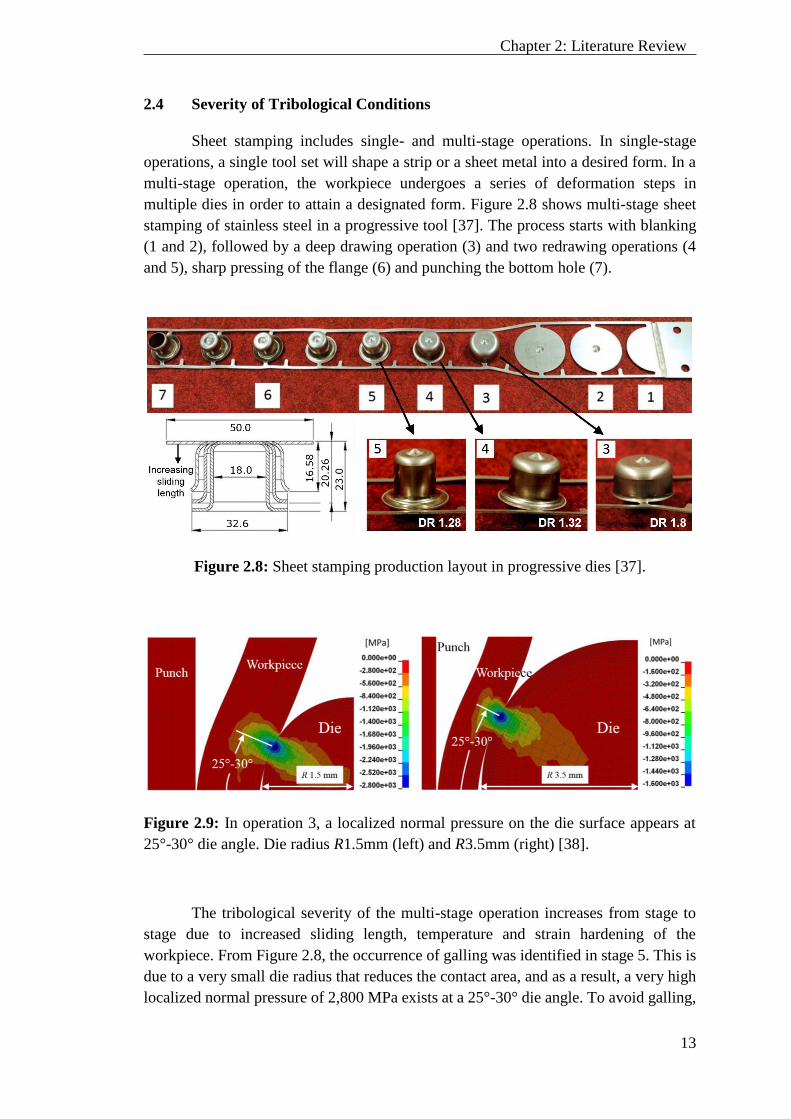
multiple dies in order to attain a designated form. Figure 2.8 shows multi-stage sheet
stamping of stainless steel in a progressive tool [37]. The process starts with blanking
(1 and 2), followed by a deep drawing operation (3) and two redrawing operations (4
and 5), sharp pressing of the flange (6) and punching the bottom hole (7).
Figure 2.8: Sheet stamping production layout in progressive dies [37].
Figure 2.9: In operation 3, a localized normal pressure on the die surface appears at
25°-30° die angle. Die radius R1.5mm (left) and R3.5mm (right) [38].
The tribological severity of the multi-stage operation increases from stage to
stage due to increased sliding length, temperature and strain hardening of the
workpiece. From Figure 2.8, the occurrence of galling was identified in stage 5. This is
due to a very small die radius that reduces the contact area, and as a result, a very high
localized normal pressure of 2,800 MPa exists at a 25°-30° die angle. To avoid galling,

14
Chapter 2: Literature Review
the die radius was then increased since a larger die radius implies a decrease of the
localized normal pressure to 1,600 MPa, see Figure 2.9. Here, the numerical analysis
revealed that the normal pressure is a dominant process parameter that can cause
lubricant film breakdown and pick-up of workpiece material on the tool surface.
a)
b)
c)
Figure 2.10: Production test in a progressive tool. a) Schematic outline of a five-step
operation, b) deformed strip, and c) outline of collar drawing and ironing operation [39].
Stamping of sheet metals in progressive tools offers high volume metal
stamping capabilities. Figure 2.10a and Figure 2.10b illustrates a schematic outline of
a five-step progressive tool producing a stainless steel component [39]. The five steps
are as follows: 1) Punching, 2) deep drawing, 3) punching, 4) collar drawing and
ironing, and 5) blanking of the finished components. Operation 4 shown in Figure 2.10c
is found to be the tribologically most critical operation leading to lubricant film
breakdown and galling. Due to this, very efficient boundary lubricants are applied.
Other factors than the high normal pressure in operation 4, such as repetitive strokes

15
Chapter 2: Literature Review
and a fast production rate, can also be a main issue to this galling problem when it
comes to large volume of sheet metal produced. More produced units per minute
increases productivity, however the drawback here is that the temperature increase at
the tool/workpiece interface will decrease lubricant viscosity, which promotes pick-up
and galling.
While the punch return to its original position, the lubricant is scraped off
further when the punch moved upwards, see Figure 2.10c. At this stage, galling occurs
between the punch and the workpiece surfaces. Two possible reasons contribute to this
galling problem. First, direct metal-to-metal contact in which almost no lubricant is
present, and this can cause temperature increase and larger friction on the punch and
the workpiece surfaces. Second, elastic deformation of the punch and springback of the
deformed workpiece [40,41] may also contribute to extra reduction in thickness during
the back stroke.
2.5 Mechanical Modification Techniques of the Tool Surface
A large amount of lubricant is necessary for a high volume sheet stamping
production. This will further increase the risks to health hazards if the efficient but
hazardous lubricant is being employed in production as the only reliable solution to
impede galling. Aside from the good boundary lubricants, other techniques by means
of mechanical approaches exist to impede galling, for instance, anti-seizure tool
materials, structured surface topographies, and anti-seizure tool surface treatments
(either by coatings or by thermochemical diffusion). To date, some of them are being
used in production, i.e., application of structured workpiece surfaces by using large rolls
roughened by Shot Blast Texturing (SBT) or Electro Discharge Texturing (EDT) [8].
In this PhD project, the target is set towards development and testing of tailored
tool surfaces by means of mechanical surface modification. In the following sub-
sections, trends and applications of two potential measures taken to decrease the
environmentally hazardous lubricant consumption as regards modifications to the tool
surface were reviewed and discussed; 1) structured tool surfaces and 2) anti-seizure tool
coatings.
2.5.1 Structured Tool Surfaces
Surface textures are progressing rapidly with the aim to achieve an efficient
lubrication system. Significant knowledge gains regarding surface textures have meant
that the technique is feasible to improve the lubrication system in engineering
applications, i.e. bearings, internal combustion engines, metal cutting, and metal
forming.

16
Chapter 2: Literature Review
Engineered workpiece surface topography by creating pockets for the
entrapment of lubricant has become state-of-the-art in the past years but it is less
feasible in multi-stage operations since pockets are flattened out after the first forming
operation [9]. Texturing of the tool surfaces would be much more economically
feasible, since a textured tool surface can be utilized for thousands of workpiece
components before it is worn out. A few tests of surface engineered deep drawing tools
have shown very promising results [42–46] indicating that tailored tool surfaces may
lead to replacement of environmentally hazardous lubricants with benign lubricants. A
great number of surface texturing techniques are available for texturing of hard tool
materials such as combined milling, grinding and manual polishing [47], chemical
etching [48], rolling ball indentation [49] and laser radiation [50,51]. It is however
important to understand the influence of the surface texture parameters and the
mechanism of lubricant entrapment and escape.
(a) (b)
Figure 2.11: a) Textured punch nose used for backward can extrusion and b) the
lubricant was manufactured with a small pocket angle [52].
Some potentially determining surface texture parameters needs to be identified
in order to promote micro-hydrodynamic lubrication mechanism. One of the feasible
surface texture parameters is lubricant pocket geometry. A small pocket angle can
improve lubrication and it works by pressurization of trapped lubricant inside the
pocket and subsequent escape by micro-plasto-hydrodynamic lubrication [53]. The
smaller the pocket angle, the easier it is to drag out the trapped lubricant. Application
of such small pocket angles, less than 10°, on a punch nose in backward can extrusion
has shown significant improvements in the tool life [16], Figure 2.11. The friction
reduction is more pronounced with a smaller pocket angle since the elimination of the
sharp curve bend at the pocket edges prevents mechanical interlocking of the
penetrating workpiece material into the pocket edges [42]. Robot Assisted Polishing
(RAP) technique is advantageous to produce the small pocket angle oriented to the
sliding direction. BUT tools manufactured with a contact ratio between the pocket area
and total area at approximately 5 percent to 25 percent by using the RAP technique
improves the tool life in comparison to the smooth tool surface [54]. In strip drawing

17
Chapter 2: Literature Review
tests, a low friction can be achieved when the contact ratio between pocket area and
total area is approximately 20 percent [55] and it is shown that increasing drawing speed
enhances these effects [49].
Closed lubricant pockets are much more advantageous than open pockets [56].
The developed hydrostatic pressure of the lubricant trapped in the closed pockets share
the external load with the asperities, thus reducing the normal pressure on the asperities,
which results in lower friction. A study of open and closed pockets manufactured on
the deep drawing die surface has shown that the open pockets increased the friction.
The open pockets are meant to function effectively in controlling material flow of the
workpiece material sliding against the textured die surface, Figure 2.12b. Reduction of
friction by pressurization of the trapped lubricant inside the closed pockets further
enhanced lubrication [57], Figure 2.12c.
Figure 2.12: Deep drawing die manufactured with a) non-textured, b) open lubricant
pockets and c) closed pockets [57].
A proper selection of orientation of the lubricant pockets enhances the retention
mechanism. A transverse, long groove perpendicular to the sliding direction enhanced
lubrication in comparison to a smooth surface and other surface features such as dimple
pockets, chevron pockets and a parallel groove oriented to the sliding direction [18]. A
similar effect has been found in transverse grinding and polishing techniques on the
tool surface in the Bending-Under-Tension (BUT) test [17], [12]. The transverse
textured surface profiles restrained lubricant flow and probably entrapped more
lubricant in order to carry some of the external load. Strip reduction tools manufactured
with a transverse arrangement of the closed pockets perpendicular to sliding direction
minimizes friction when a small amount of a hazardous lubricant is applied [58].
Similar findings of manufacturing the transverse, long groove perpendicular to sliding
direction on a strip drawing tool can also be found in [59]. Application of a hard coating
to the structured tool surfaces further reduced galling occurrence.
18
Chapter 2: Literature Review
In this study, the application of structured surfaces to the tools is carried out
without coating with the aim directed towards surface texture parameters that are
beneficial to promote micro-hydrodynamic lubrication mechanism.
2.5.2 Anti-Seizure Tool Coatings
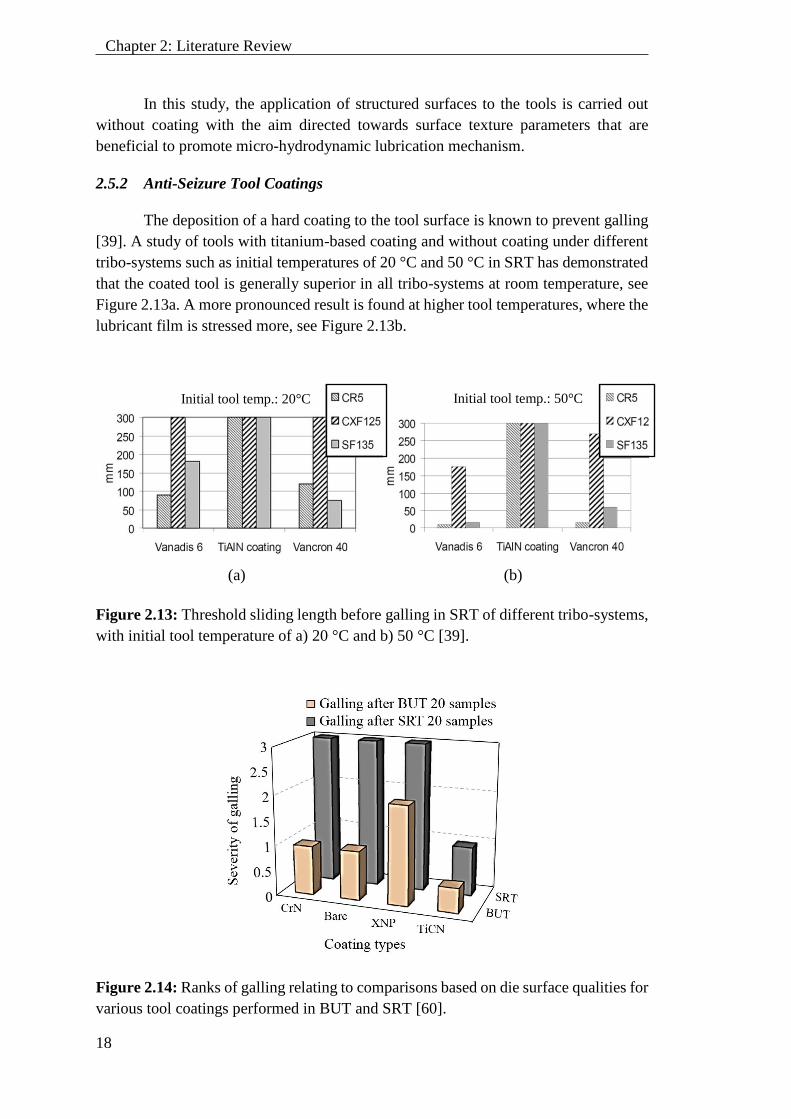
The deposition of a hard coating to the tool surface is known to prevent galling
[39]. A study of tools with titanium-based coating and without coating under different
tribo-systems such as initial temperatures of 20 °C and 50 °C in SRT has demonstrated
that the coated tool is generally superior in all tribo-systems at room temperature, see
Figure 2.13a. A more pronounced result is found at higher tool temperatures, where the
lubricant film is stressed more, see Figure 2.13b.
(a) (b)
Figure 2.13: Threshold sliding length before galling in SRT of different tribo-systems,
with initial tool temperature of a) 20 °C and b) 50 °C [39].
Figure 2.14: Ranks of galling relating to comparisons based on die surface qualities for
various tool coatings performed in BUT and SRT [60].
Initial tool temp.: 20°C Initial tool temp.: 50°C

19
Chapter 2: Literature Review
(a) Configuration of
specimen (yellow)
and the die insert
(grey)
(b)
Figure 2.15: a) Schematic of BUT and SRT tests, and b) surface topographies of
uncoated and coated die inserts after conducting repetitive experiments in the SRT
(bottom) [61]. The red square in (a) marked the approximate location of the
micrographs in (b).
A similar result, adopting the titanium-based coating such as TiCN, can be seen
in Figure 2.14. The titanium-based, chromium-based and nitride-based coatings were
deposited on the tool surface and they were tested in BUT and SRT of Advanced High
Strength Steel (AHSS), i.e, DP590, TRIP780 and DP980, at room temperature. The
severity of galling was qualitatively ranked with a visual inspection after conducting 20
specimens in BUT and SRT tests by using various tool coatings [60]. The results have
shown that the titanium-based coating is found to be the best tool coating in reducing
galling in BUT and SRT. A more severe tribological condition is observed when testing
the coated tools in SRT, where the titanium-based coating is the only coating that can
work effectively at a larger normal pressure occurring at the tool/workpiece interface,
see Figure 2.15 [61]. The experimental results concluded that a polymer based lubricant
20
Chapter 2: Literature Review
with pressure additives is found necessary in both operations involved in sheet metal
forming [60].
A promising way to eliminate hazardous lubrication issues is to perform the
sheet stamping under dry lubrication condition or using a small amount of hazard free
lubricant to the hard coated tools, which impedes pick-up. A few promising tool
coatings have been reported to work in deep drawing of aluminium, stainless steel and
titanium under dry friction conditions or with minimum lubrication. They include
Diamond-Like Carbon (DLC) coating [13,14] and pure diamond coating [15]. Both
coating types are able to produce thousands of sheet components without galling. In
addition, a diamond coated die resulted in a 20% reduction of the drawing force in dry
deep drawing with a subsequent 10% ironing of magnesium alloy at elevated
temperature as compared to lubrication with MoS2 [62]. Drawbacks of the pure
diamond coating are cost and the fact that it can only be deposited on specific tool
materials, e.g. tungsten carbide. Furthermore, it leaves a rough surface of crystalline
diamond, which needs to be polished by a special ultrasonic technique to obtain a
smooth surface. Adopting DLC, literature reports the necessity of lubrication in sheet
stamping at high normal pressures such as ironing or blanking [18] due to the generation
of a high shear stress in the DLC coating resulting in peeling off of the coating from the
tool surface.
Although a thin layer coating deposited on the tool surface can improve
frictional and wear properties of the coated tool surface, stresses induced in the coated
tool become a major problem since it always influences the adhesion strength of the
coating. Tailoring the interaction between the coating and the tool surface is a method
to prevent the adhesion problem. For instance, depositing multilayer coating structures
on the tool surface offers films with improved internal stresses of each coating layer,
while retaining high hardness, good adhesion and wear properties [63], [64]. The
multilayer coatings with optimized layer thickness condition serves to improve
hardness and modulus of elasticity of the coating structure, which increases the load-
carrying capacity due to improved mechanical properties of the coated tool surface [65].
Adopting an increased surface roughness of the tool substrate prior to coating [66] is a
useful technique for improved coating adhesion but it generates a larger surface
roughness after coating, which is difficult to polish to a sufficiently low final surface
roughness.
A proper selection of interlayer coating types, number of interlayer coatings and
interlayer coating thickness promotes an improved Young’s modulus and hardness of
the coating. This will enhance persistence of the coated tool towards pick-up [63],
where a graded multilayer structure is a better alternative compared to a conventional
one [64]. A good combination of high hardness and low friction coating further
promotes low wear rate [67]. This is attributed by the Physical Vapor Deposition (PVD)
depositing technique, which yields coatings with high levels of adhesion, dense and
packed structures, and provides a smooth macro particle free surface [68].
21
Chapter 3: Material Characterization
Chapter 3: Material Characterization
3.1 Introduction
The flow stress curve of a material is important when analyzing material
deformation in sheet metal forming processes. The flow stress curve characterizes the
strain hardening of the sheet metal. The flow stress curve of a material can be
determined in different ways, e.g. by uniaxial tensile testing or by uniaxial compression
testing. The main challenge is, however, to determine strength of a material at large
strain without extrapolation. Therefore, investigations of different experimental
methods were studied to evaluate strength of workpiece materials.
Each different material test has its limitation to determine strength of the
material as a function of strain. Some common material strain hardening expressions
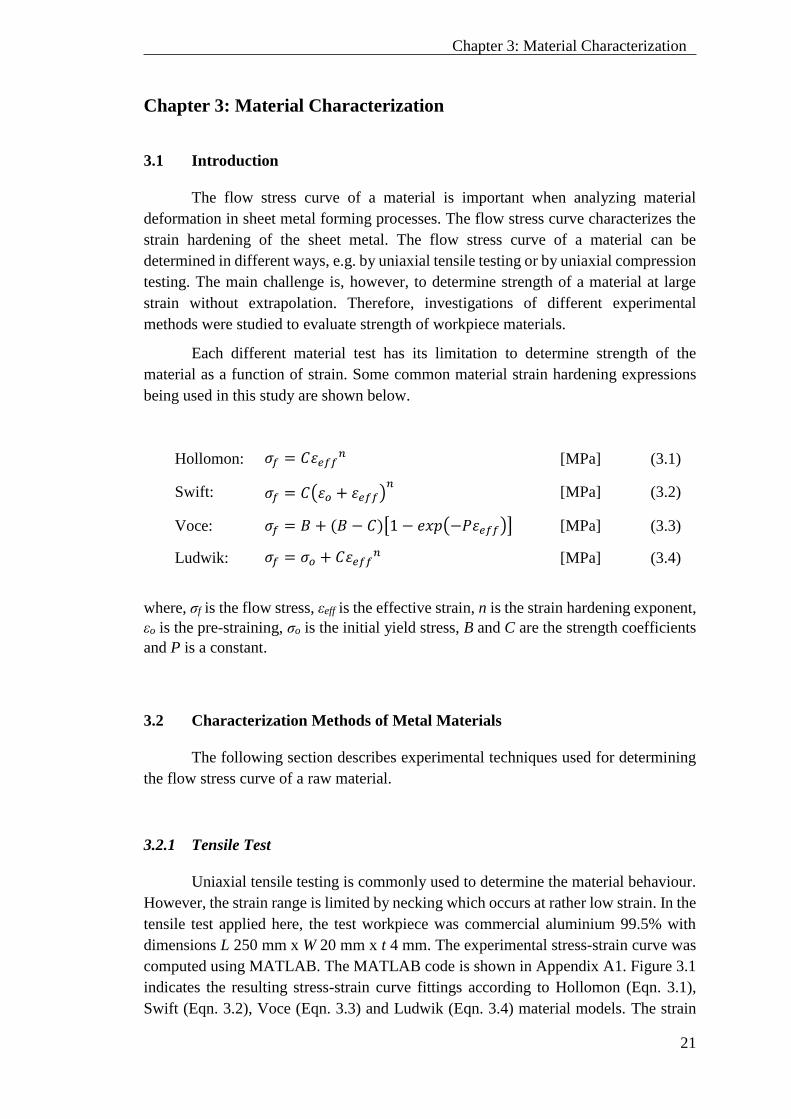
being used in this study are shown below.
Hollomon: 𝜎𝑓 = 𝐶𝜀𝑒𝑓𝑓𝑛 [MPa] (3.1)
Swift: 𝜎𝑓 = 𝐶(𝜀𝑜 + 𝜀𝑒𝑓𝑓)𝑛 [MPa] (3.2)
Voce: 𝜎𝑓 = 𝐵 + (𝐵 − 𝐶)[1 − 𝑒𝑥𝑝(−𝑃𝜀𝑒𝑓𝑓)] [MPa] (3.3)
Ludwik: 𝜎𝑓 = 𝜎𝑜 + 𝐶𝜀𝑒𝑓𝑓𝑛 [MPa] (3.4)
where, σf is the flow stress, εeff is the effective strain, n is the strain hardening exponent,
εo is the pre-straining, σo is the initial yield stress, B and C are the strength coefficients
and P is a constant.
3.2 Characterization Methods of Metal Materials
The following section describes experimental techniques used for determining
the flow stress curve of a raw material.
3.2.1 Tensile Test
Uniaxial tensile testing is commonly used to determine the material behaviour.
However, the strain range is limited by necking which occurs at rather low strain. In the
tensile test applied here, the test workpiece was commercial aluminium 99.5% with
dimensions L 250 mm x W 20 mm x t 4 mm. The experimental stress-strain curve was
computed using MATLAB. The MATLAB code is shown in Appendix A1. Figure 3.1
indicates the resulting stress-strain curve fittings according to Hollomon (Eqn. 3.1),
Swift (Eqn. 3.2), Voce (Eqn. 3.3) and Ludwik (Eqn. 3.4) material models. The strain
22
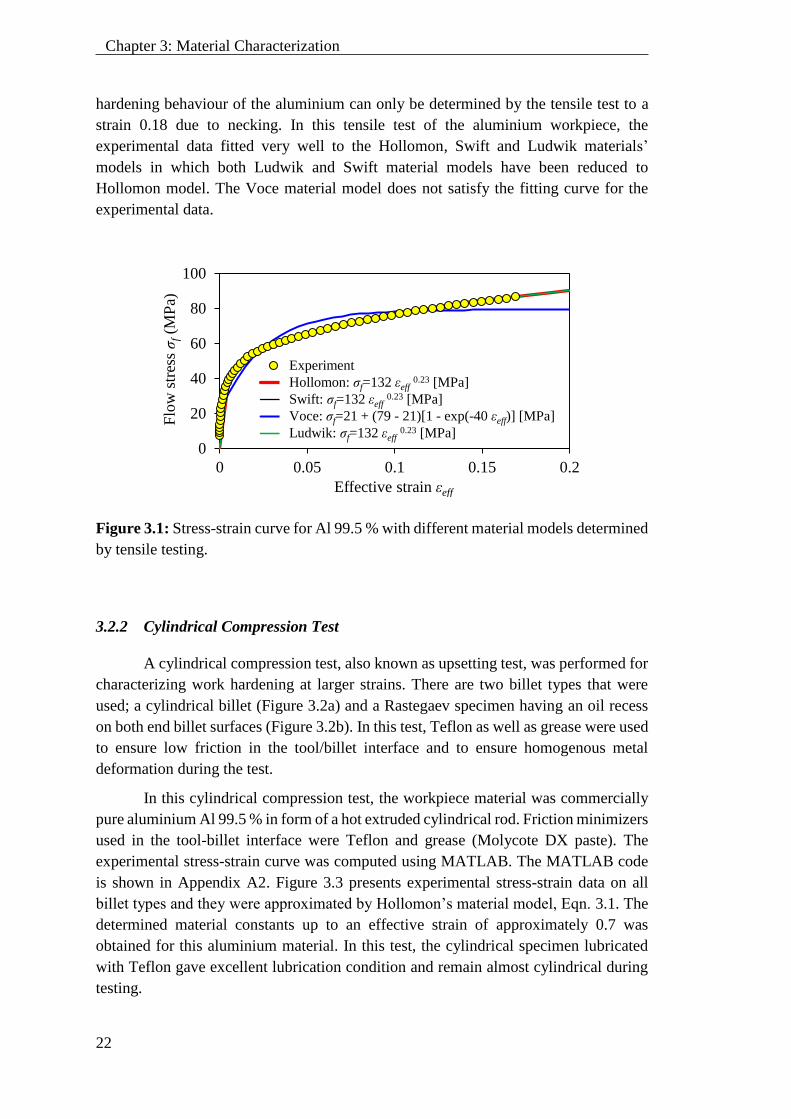
Chapter 3: Material Characterization
hardening behaviour of the aluminium can only be determined by the tensile test to a
strain 0.18 due to necking. In this tensile test of the aluminium workpiece, the
experimental data fitted very well to the Hollomon, Swift and Ludwik materials’
models in which both Ludwik and Swift material models have been reduced to
Hollomon model. The Voce material model does not satisfy the fitting curve for the
experimental data.
Figure 3.1: Stress-strain curve for Al 99.5 % with different material models determined
by tensile testing.
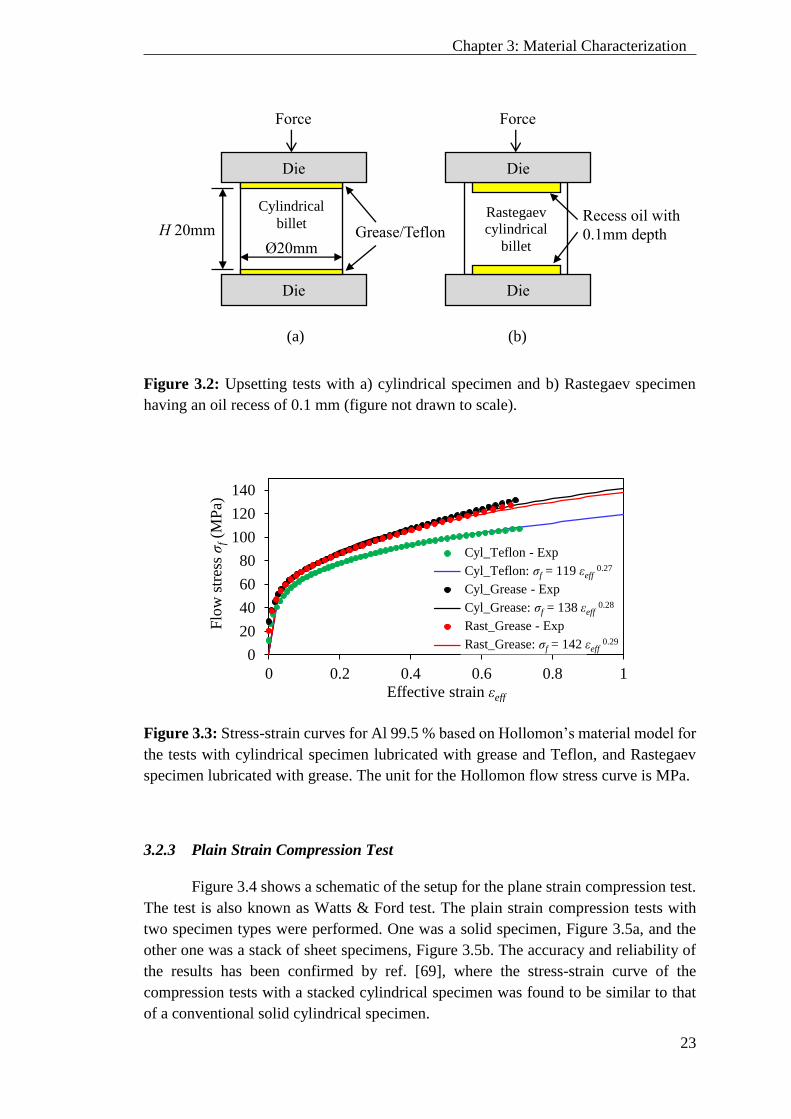
3.2.2 Cylindrical Compression Test
A cylindrical compression test, also known as upsetting test, was performed for
characterizing work hardening at larger strains. There are two billet types that were
used; a cylindrical billet (Figure 3.2a) and a Rastegaev specimen having an oil recess
on both end billet surfaces (Figure 3.2b). In this test, Teflon as well as grease were used
to ensure low friction in the tool/billet interface and to ensure homogenous metal
deformation during the test.
In this cylindrical compression test, the workpiece material was commercially
pure aluminium Al 99.5 % in form of a hot extruded cylindrical rod. Friction minimizers
used in the tool-billet interface were Teflon and grease (Molycote DX paste). The
experimental stress-strain curve was computed using MATLAB. The MATLAB code
is shown in Appendix A2. Figure 3.3 presents experimental stress-strain data on all
billet types and they were approximated by Hollomon’s material model, Eqn. 3.1. The
determined material constants up to an effective strain of approximately 0.7 was
obtained for this aluminium material. In this test, the cylindrical specimen lubricated
with Teflon gave excellent lubrication condition and remain almost cylindrical during
testing.
0
20
40
60
80
100
0 0.05 0.1 0.15 0.2
Flo
w s
tres
s σ
f(M
Pa)
Effective strain εeff
Experiment
Hollomon: σo=132 (εeff)^0.23
Swift: σo=132 (2.07e-7+εeff )^0.23
Voce: σo=21+(79-21)[1-exp(-40 εeff )]
Ludwik: σo=9.6e-12 + 132 (εeff)^0.23
Experiment
Hollomon: σf=132 εeff0.23 [MPa]
Swift: σf=132 εeff0.23 [MPa]
Voce: σf=21 + (79 - 21)[1 - exp(-40 εeff)] [MPa]
Ludwik: σf=132 εeff0.23 [MPa]
23
Chapter 3: Material Characterization
(a) (b)
Figure 3.2: Upsetting tests with a) cylindrical specimen and b) Rastegaev specimen
having an oil recess of 0.1 mm (figure not drawn to scale).
Figure 3.3: Stress-strain curves for Al 99.5 % based on Hollomon’s material model for
the tests with cylindrical specimen lubricated with grease and Teflon, and Rastegaev
specimen lubricated with grease. The unit for the Hollomon flow stress curve is MPa.
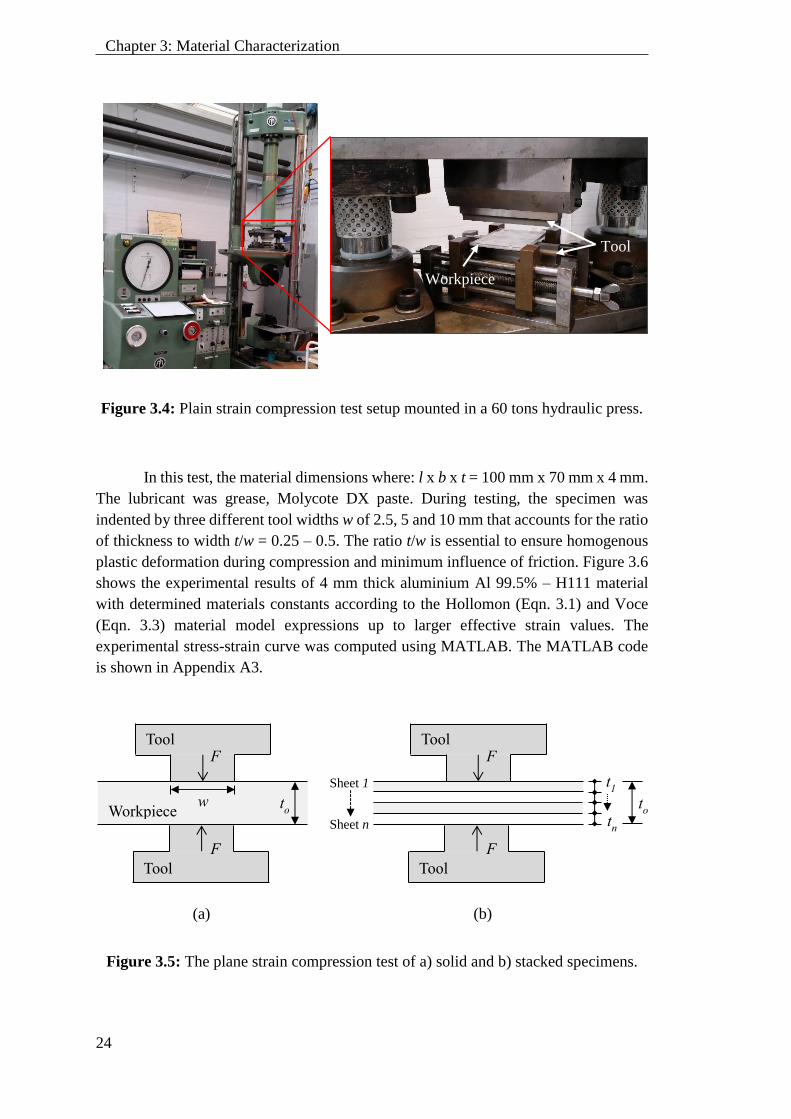
3.2.3 Plain Strain Compression Test
Figure 3.4 shows a schematic of the setup for the plane strain compression test.
The test is also known as Watts & Ford test. The plain strain compression tests with
two specimen types were performed. One was a solid specimen, Figure 3.5a, and the
other one was a stack of sheet specimens, Figure 3.5b. The accuracy and reliability of
the results has been confirmed by ref. [69], where the stress-strain curve of the
compression tests with a stacked cylindrical specimen was found to be similar to that
of a conventional solid cylindrical specimen.
0
20
40
60
80
100
120
140
0 0.2 0.4 0.6 0.8 1
Flo
w s
tres
s σ
f(M
Pa)
Effective strain εeff
Cyl_Teflon - Exp
Cyl_Teflon:
Cyl_Grease - Exp
Cyl_grease:
Rast_Grease - Exp
Rast_Grease:
Cyl_Teflon - Exp
Cyl_Teflon: σf = 119 εeff0.27
Cyl_Grease - Exp
Cyl_Grease: σf = 138 εeff0.28
Rast_Grease - Exp
Rast_Grease: σf = 142 εeff0.29
Rastegaev cylindrical
billet
Die
Die
Force
Recess oil with
0.1mm depth H 20mm
Cylindrical
billet
Die
Die
Force
Ø20mm Grease/Teflon
24
Chapter 3: Material Characterization
Figure 3.4: Plain strain compression test setup mounted in a 60 tons hydraulic press.
In this test, the material dimensions where: l x b x t = 100 mm x 70 mm x 4 mm.
The lubricant was grease, Molycote DX paste. During testing, the specimen was
indented by three different tool widths w of 2.5, 5 and 10 mm that accounts for the ratio
of thickness to width t/w = 0.25 – 0.5. The ratio t/w is essential to ensure homogenous
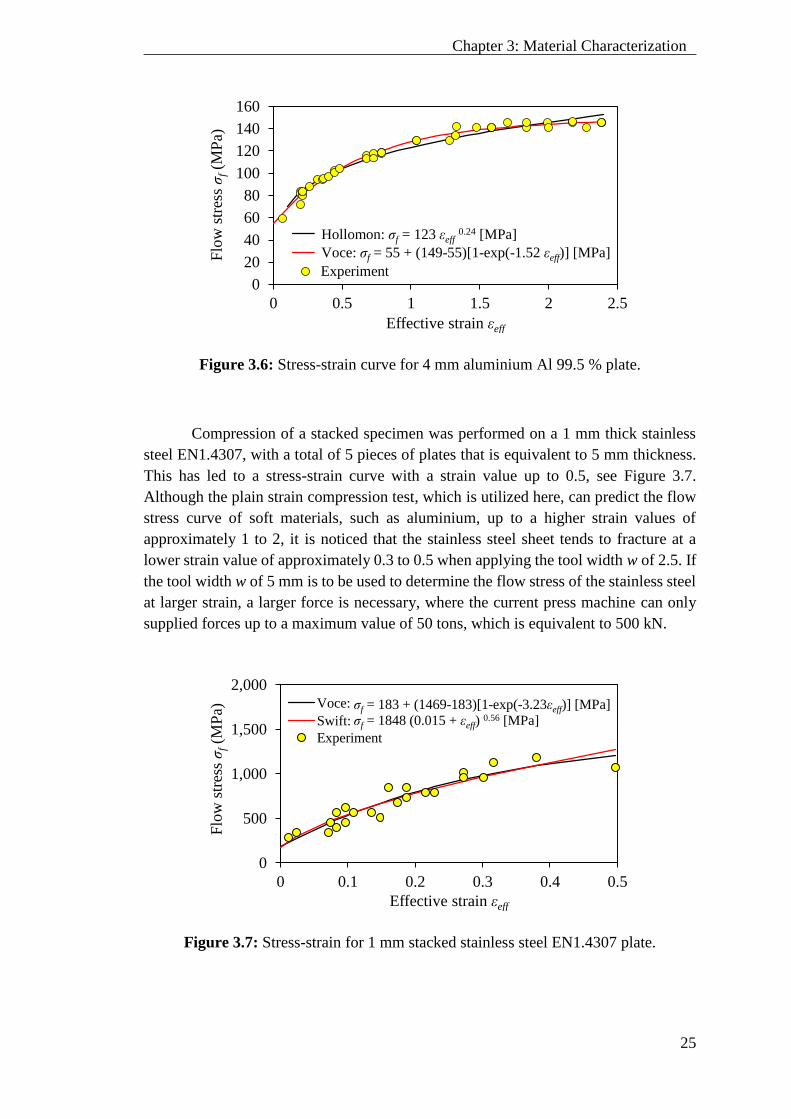
plastic deformation during compression and minimum influence of friction. Figure 3.6
shows the experimental results of 4 mm thick aluminium Al 99.5% – H111 material
with determined materials constants according to the Hollomon (Eqn. 3.1) and Voce
(Eqn. 3.3) material model expressions up to larger effective strain values. The
experimental stress-strain curve was computed using MATLAB. The MATLAB code
is shown in Appendix A3.
(a) (b)
Figure 3.5: The plane strain compression test of a) solid and b) stacked specimens.
Workpiece
Tool
Tool F
F
to w
Tool
Tool F
F
to
t1
tn
Sheet 1
Sheet n
Workpiece
Tool
25
Chapter 3: Material Characterization
Figure 3.6: Stress-strain curve for 4 mm aluminium Al 99.5 % plate.
Compression of a stacked specimen was performed on a 1 mm thick stainless
steel EN1.4307, with a total of 5 pieces of plates that is equivalent to 5 mm thickness.
This has led to a stress-strain curve with a strain value up to 0.5, see Figure 3.7.
Although the plain strain compression test, which is utilized here, can predict the flow
stress curve of soft materials, such as aluminium, up to a higher strain values of
approximately 1 to 2, it is noticed that the stainless steel sheet tends to fracture at a
lower strain value of approximately 0.3 to 0.5 when applying the tool width w of 2.5. If
the tool width w of 5 mm is to be used to determine the flow stress of the stainless steel
at larger strain, a larger force is necessary, where the current press machine can only
supplied forces up to a maximum value of 50 tons, which is equivalent to 500 kN.
Figure 3.7: Stress-strain for 1 mm stacked stainless steel EN1.4307 plate.
0
20
40
60
80
100
120
140
160
0 0.5 1 1.5 2 2.5
Flo
w s
tres
s σ
f(M
Pa)
Effective strain εeff
Swift: σ=123(0.000+ε)^0.243 [MPa]
Voce: σ=55+(149-55)(1-exp(-1.52ε)) [MPa]
Experiment
Hollomon: σf = 123 εeff0.24 [MPa]
Voce: σf = 55 + (149-55)[1-exp(-1.52 εeff)] [MPa]
0
500
1,000
1,500
2,000
0 0.1 0.2 0.3 0.4 0.5
Flo
w s
tres
s σ
f(M
Pa)
Effective strain εeff
Voce: σ=183+(1469-183)[1-exp(-3.23ε)]
Swift: σ=1848 (0.015+ε)^0.56
Experiment
σf = 183 + (1469-183)[1-exp(-3.23εeff)] [MPa]σf = 1848 (0.015 + εeff)
0.56 [MPa]

26
Chapter 3: Material Characterization
The plain strain compression test has demonstrated that the strain hardening of
the stainless steel sheet material (n = 0.56) is larger than the aluminium sheet material
(n = 0.24). Both tests have shown that the Voce model fitted well to the experimental
stress-strain data. Hence, the Voce model was chosen for the study of textured tool
surface (Part II) where the aluminium material was used and for the study of anti-seizure
tool coatings (Part III) where the stainless steel material was used.
3.3 Summary
In this study, the flow stress curve obtained by plain strain compression test is
more appropriate use for sheet material than tensile testing, since higher strains can be
reached. The plain strain compression test convey stress-strain data at higher strain
values with Voce’s material model fitting very well with the experimental results.
27
PART I – COMPRESSIBILITY OF LUBRICANTS
Part I
Compressibility of Lubricants

28
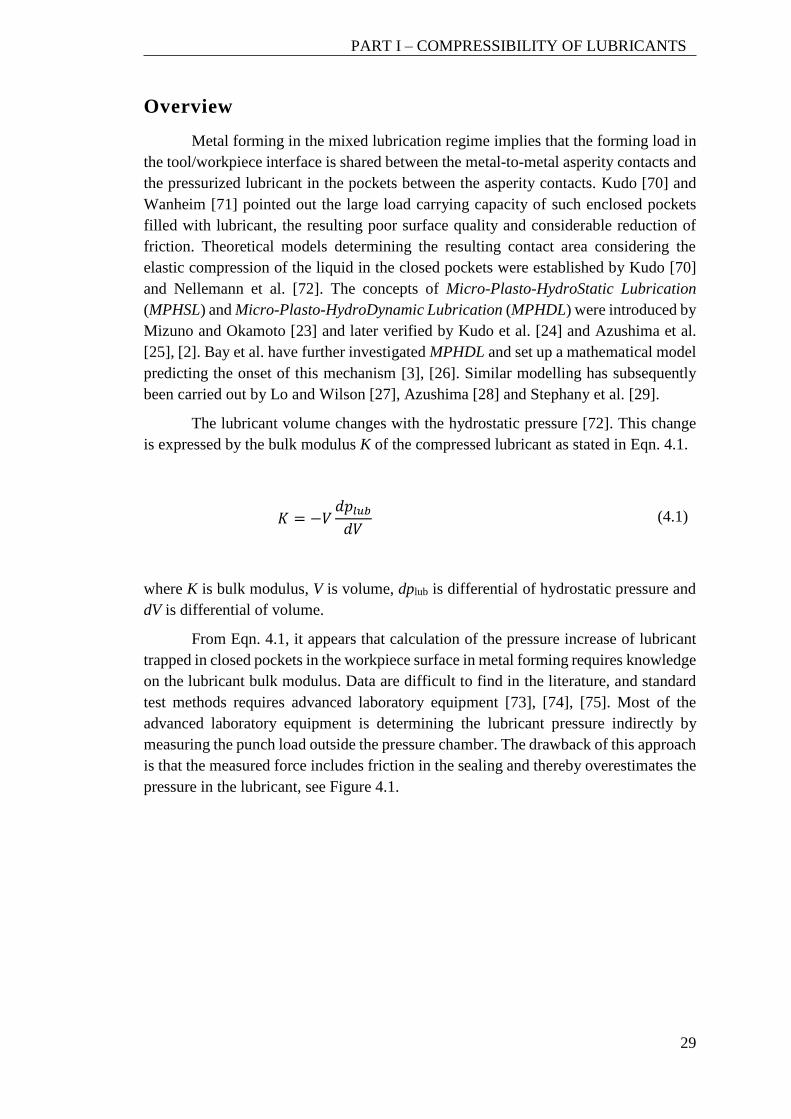
29
PART I – COMPRESSIBILITY OF LUBRICANTS
Overview
Metal forming in the mixed lubrication regime implies that the forming load in
the tool/workpiece interface is shared between the metal-to-metal asperity contacts and
the pressurized lubricant in the pockets between the asperity contacts. Kudo [70] and
Wanheim [71] pointed out the large load carrying capacity of such enclosed pockets
filled with lubricant, the resulting poor surface quality and considerable reduction of
friction. Theoretical models determining the resulting contact area considering the
elastic compression of the liquid in the closed pockets were established by Kudo [70]
and Nellemann et al. [72]. The concepts of Micro-Plasto-HydroStatic Lubrication
(MPHSL) and Micro-Plasto-HydroDynamic Lubrication (MPHDL) were introduced by
Mizuno and Okamoto [23] and later verified by Kudo et al. [24] and Azushima et al.
[25], [2]. Bay et al. have further investigated MPHDL and set up a mathematical model
predicting the onset of this mechanism [3], [26]. Similar modelling has subsequently
been carried out by Lo and Wilson [27], Azushima [28] and Stephany et al. [29].
The lubricant volume changes with the hydrostatic pressure [72]. This change
is expressed by the bulk modulus K of the compressed lubricant as stated in Eqn. 4.1.
𝐾 = −𝑉𝑑𝑝𝑙𝑢𝑏
𝑑𝑉 (4.1)
where K is bulk modulus, V is volume, dplub is differential of hydrostatic pressure and
dV is differential of volume.
From Eqn. 4.1, it appears that calculation of the pressure increase of lubricant
trapped in closed pockets in the workpiece surface in metal forming requires knowledge
on the lubricant bulk modulus. Data are difficult to find in the literature, and standard
test methods requires advanced laboratory equipment [73], [74], [75]. Most of the
advanced laboratory equipment is determining the lubricant pressure indirectly by
measuring the punch load outside the pressure chamber. The drawback of this approach
is that the measured force includes friction in the sealing and thereby overestimates the
pressure in the lubricant, see Figure 4.1.

30
PART I – COMPRESSIBILITY OF LUBRICANTS
Figure 4.1: Illustration of the overestimated force due to extra contribution of friction
stress τ in the sealing from both upper and lower punches.
A simple laboratory test combined with an inverse Finite Element (FE) analysis
to determine the lubricant bulk modulus was designed and developed, but the
methodology was only applied to the low pressure range. The experiment is described
in Chapter 4.
An experimental compression test of liquid lubricants with direct measurement
of the lubricant pressure build-up and the subsequent determination of the lubricant
bulk modulus in a wide pressure range was also designed and developed. The work
includes design and construction of a new high-pressure compressibility equipment and
testing of the liquid lubricant compressibility up to 500 MPa, i.e. in a pressure range
similar to the one appearing in the tool-workpiece interface in stamping of stainless
steel sheet [46]. The experiment is described in Chapter 5.
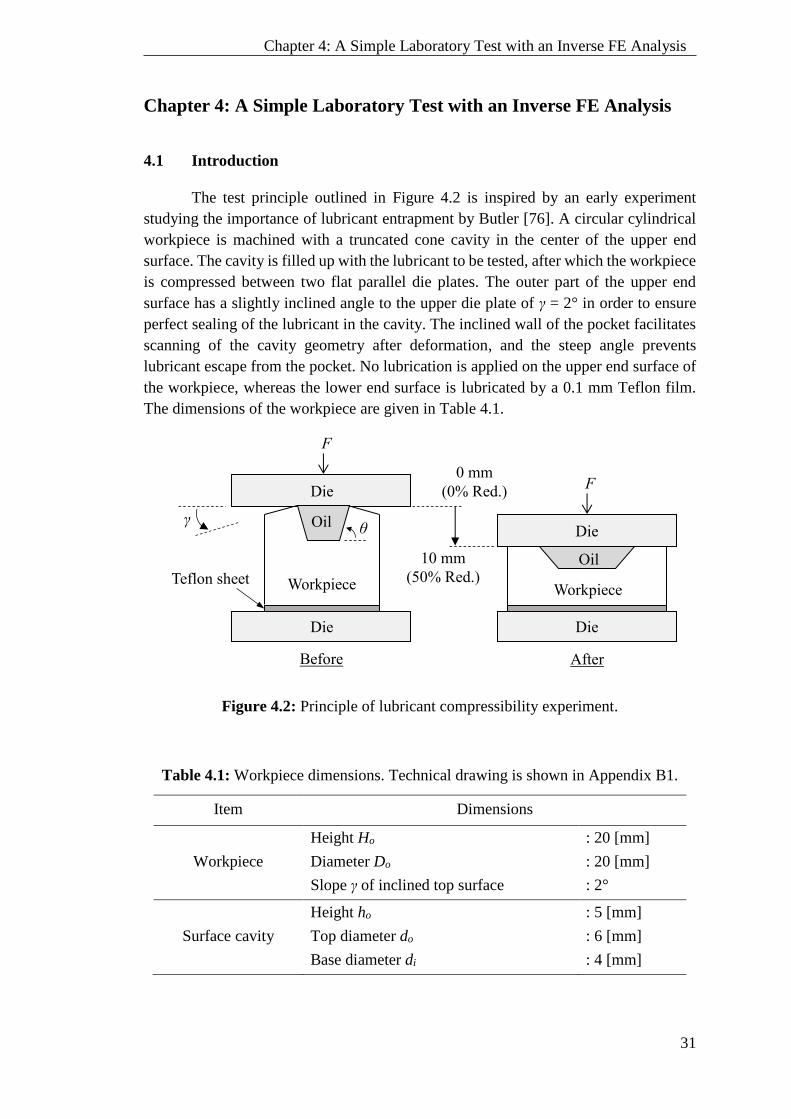
31
Chapter 4: A Simple Laboratory Test with an Inverse FE Analysis
Chapter 4: A Simple Laboratory Test with an Inverse FE Analysis
4.1 Introduction
The test principle outlined in Figure 4.2 is inspired by an early experiment
studying the importance of lubricant entrapment by Butler [76]. A circular cylindrical
workpiece is machined with a truncated cone cavity in the center of the upper end
surface. The cavity is filled up with the lubricant to be tested, after which the workpiece
is compressed between two flat parallel die plates. The outer part of the upper end
surface has a slightly inclined angle to the upper die plate of γ = 2° in order to ensure
perfect sealing of the lubricant in the cavity. The inclined wall of the pocket facilitates
scanning of the cavity geometry after deformation, and the steep angle prevents
lubricant escape from the pocket. No lubrication is applied on the upper end surface of
the workpiece, whereas the lower end surface is lubricated by a 0.1 mm Teflon film.
The dimensions of the workpiece are given in Table 4.1.
Figure 4.2: Principle of lubricant compressibility experiment.
Table 4.1: Workpiece dimensions. Technical drawing is shown in Appendix B1.
Item Dimensions
Workpiece
Height Ho
Diameter Do
Slope γ of inclined top surface
: 20 [mm]
: 20 [mm]
: 2°
Surface cavity
Height ho
Top diameter do
Base diameter di
: 5 [mm]
: 6 [mm]
: 4 [mm]
Die
Oil
0 mm
(0% Red.)
10 mm
(50% Red.)
F
F
Workpiece
Die
Die
Die
Workpiece
Oil
Before After
Teflon sheet
θ γ
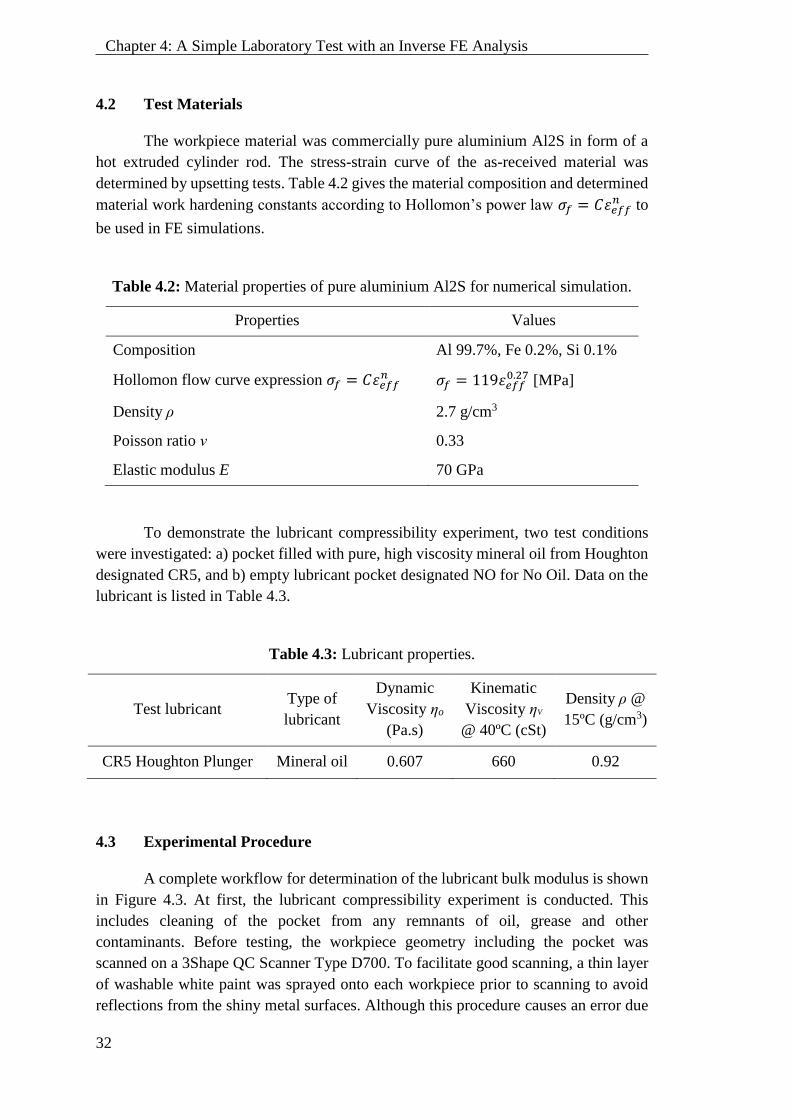
32
Chapter 4: A Simple Laboratory Test with an Inverse FE Analysis
4.2 Test Materials
The workpiece material was commercially pure aluminium Al2S in form of a
hot extruded cylinder rod. The stress-strain curve of the as-received material was
determined by upsetting tests. Table 4.2 gives the material composition and determined
material work hardening constants according to Hollomon’s power law 𝜎𝑓 = 𝐶𝜀𝑒𝑓𝑓𝑛 to
be used in FE simulations.
Table 4.2: Material properties of pure aluminium Al2S for numerical simulation.
Properties Values
Composition Al 99.7%, Fe 0.2%, Si 0.1%
Hollomon flow curve expression 𝜎𝑓 = 𝐶𝜀𝑒𝑓𝑓𝑛
𝜎𝑓 = 119𝜀𝑒𝑓𝑓0.27 [MPa]
Density ρ 2.7 g/cm3
Poisson ratio ν 0.33
Elastic modulus E 70 GPa
To demonstrate the lubricant compressibility experiment, two test conditions
were investigated: a) pocket filled with pure, high viscosity mineral oil from Houghton
designated CR5, and b) empty lubricant pocket designated NO for No Oil. Data on the
lubricant is listed in Table 4.3.
Table 4.3: Lubricant properties.
Test lubricant Type of
lubricant
Dynamic
Viscosity ηo
(Pa.s)
Kinematic
Viscosity ηV
@ 40ºC (cSt)
Density ρ @
15ºC (g/cm3)
CR5 Houghton Plunger Mineral oil 0.607 660 0.92
4.3 Experimental Procedure
A complete workflow for determination of the lubricant bulk modulus is shown
in Figure 4.3. At first, the lubricant compressibility experiment is conducted. This
includes cleaning of the pocket from any remnants of oil, grease and other
contaminants. Before testing, the workpiece geometry including the pocket was
scanned on a 3Shape QC Scanner Type D700. To facilitate good scanning, a thin layer
of washable white paint was sprayed onto each workpiece prior to scanning to avoid
reflections from the shiny metal surfaces. Although this procedure causes an error due
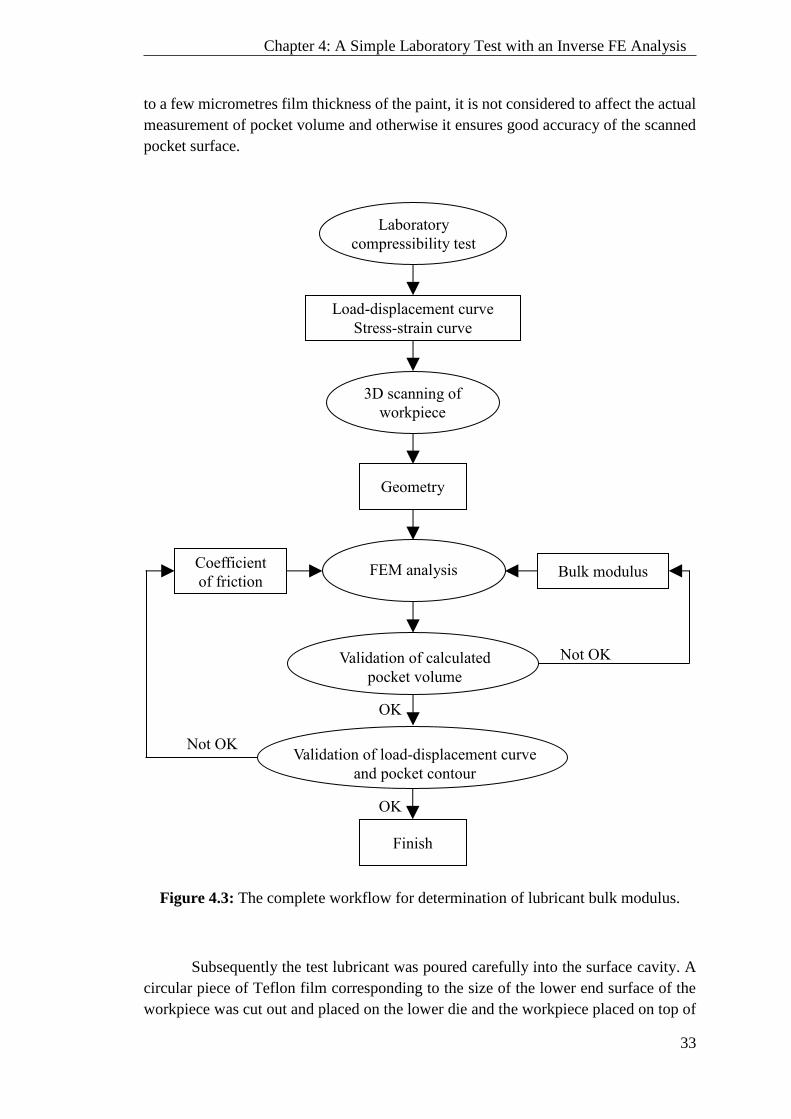
33
Chapter 4: A Simple Laboratory Test with an Inverse FE Analysis
to a few micrometres film thickness of the paint, it is not considered to affect the actual
measurement of pocket volume and otherwise it ensures good accuracy of the scanned
pocket surface.
Figure 4.3: The complete workflow for determination of lubricant bulk modulus.
Subsequently the test lubricant was poured carefully into the surface cavity. A
circular piece of Teflon film corresponding to the size of the lower end surface of the
workpiece was cut out and placed on the lower die and the workpiece placed on top of
Bulk modulus
Validation of calculated
pocket volume
Laboratory
compressibility test
Validation of load-displacement curve
and pocket contour
OK
OK
Not OK
Not OK
FEM analysis Coefficient
of friction
Geometry
3D scanning of
workpiece
Load-displacement curve
Stress-strain curve
Finish
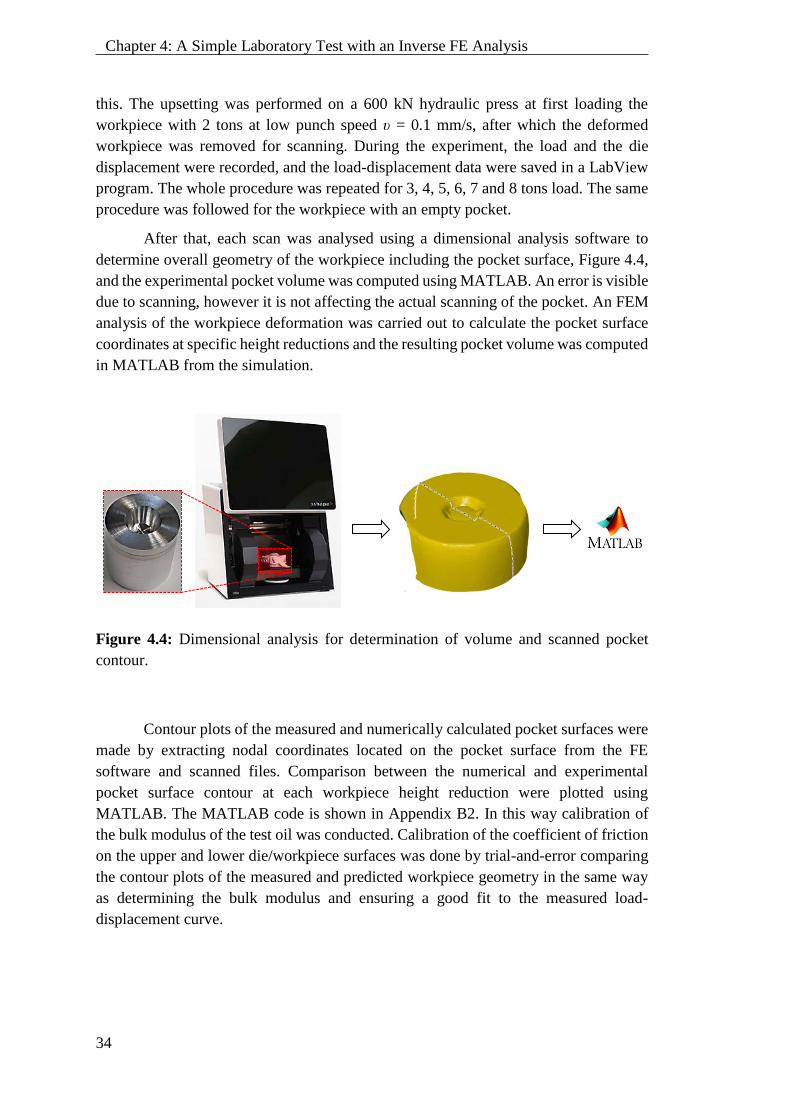
34
Chapter 4: A Simple Laboratory Test with an Inverse FE Analysis
this. The upsetting was performed on a 600 kN hydraulic press at first loading the
workpiece with 2 tons at low punch speed υ = 0.1 mm/s, after which the deformed
workpiece was removed for scanning. During the experiment, the load and the die
displacement were recorded, and the load-displacement data were saved in a LabView
program. The whole procedure was repeated for 3, 4, 5, 6, 7 and 8 tons load. The same
procedure was followed for the workpiece with an empty pocket.
After that, each scan was analysed using a dimensional analysis software to
determine overall geometry of the workpiece including the pocket surface, Figure 4.4,
and the experimental pocket volume was computed using MATLAB. An error is visible
due to scanning, however it is not affecting the actual scanning of the pocket. An FEM
analysis of the workpiece deformation was carried out to calculate the pocket surface
coordinates at specific height reductions and the resulting pocket volume was computed
in MATLAB from the simulation.
Figure 4.4: Dimensional analysis for determination of volume and scanned pocket
contour.
Contour plots of the measured and numerically calculated pocket surfaces were
made by extracting nodal coordinates located on the pocket surface from the FE
software and scanned files. Comparison between the numerical and experimental
pocket surface contour at each workpiece height reduction were plotted using
MATLAB. The MATLAB code is shown in Appendix B2. In this way calibration of
the bulk modulus of the test oil was conducted. Calibration of the coefficient of friction
on the upper and lower die/workpiece surfaces was done by trial-and-error comparing
the contour plots of the measured and predicted workpiece geometry in the same way
as determining the bulk modulus and ensuring a good fit to the measured load-
displacement curve.
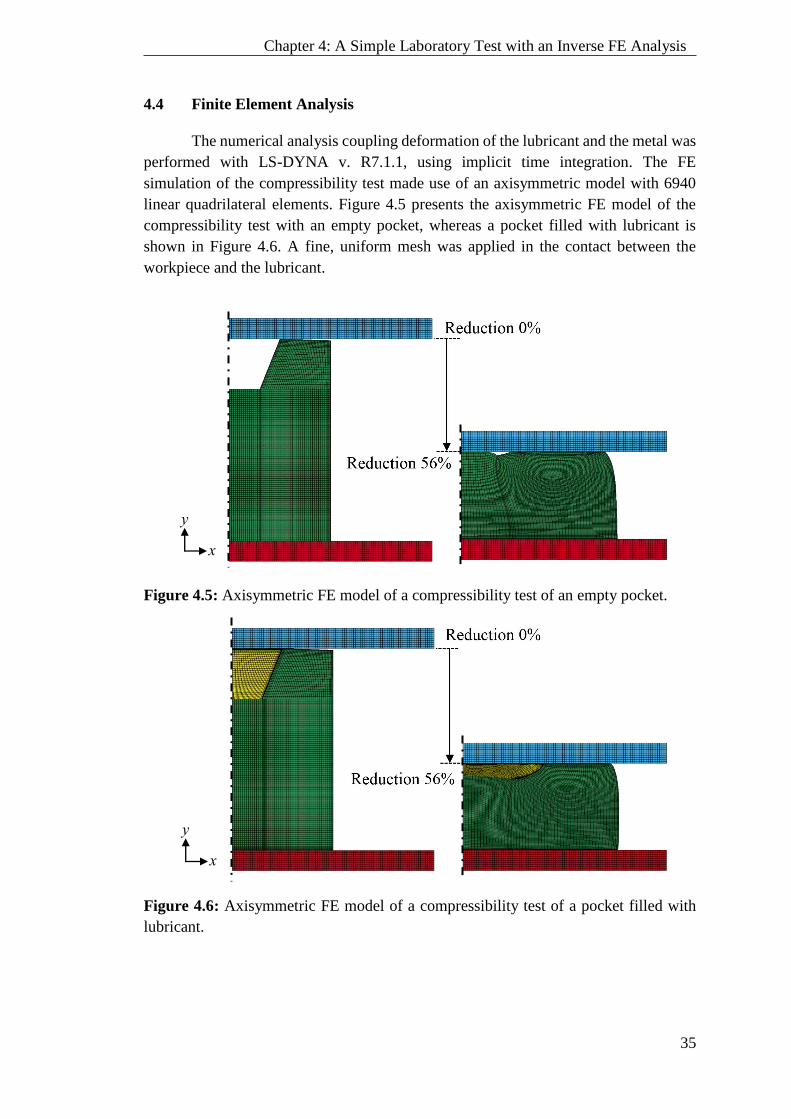
35
Chapter 4: A Simple Laboratory Test with an Inverse FE Analysis
4.4 Finite Element Analysis
The numerical analysis coupling deformation of the lubricant and the metal was
performed with LS-DYNA v. R7.1.1, using implicit time integration. The FE
simulation of the compressibility test made use of an axisymmetric model with 6940
linear quadrilateral elements. Figure 4.5 presents the axisymmetric FE model of the
compressibility test with an empty pocket, whereas a pocket filled with lubricant is
shown in Figure 4.6. A fine, uniform mesh was applied in the contact between the
workpiece and the lubricant.
Figure 4.5: Axisymmetric FE model of a compressibility test of an empty pocket.
Figure 4.6: Axisymmetric FE model of a compressibility test of a pocket filled with
lubricant.
x
y
x
y
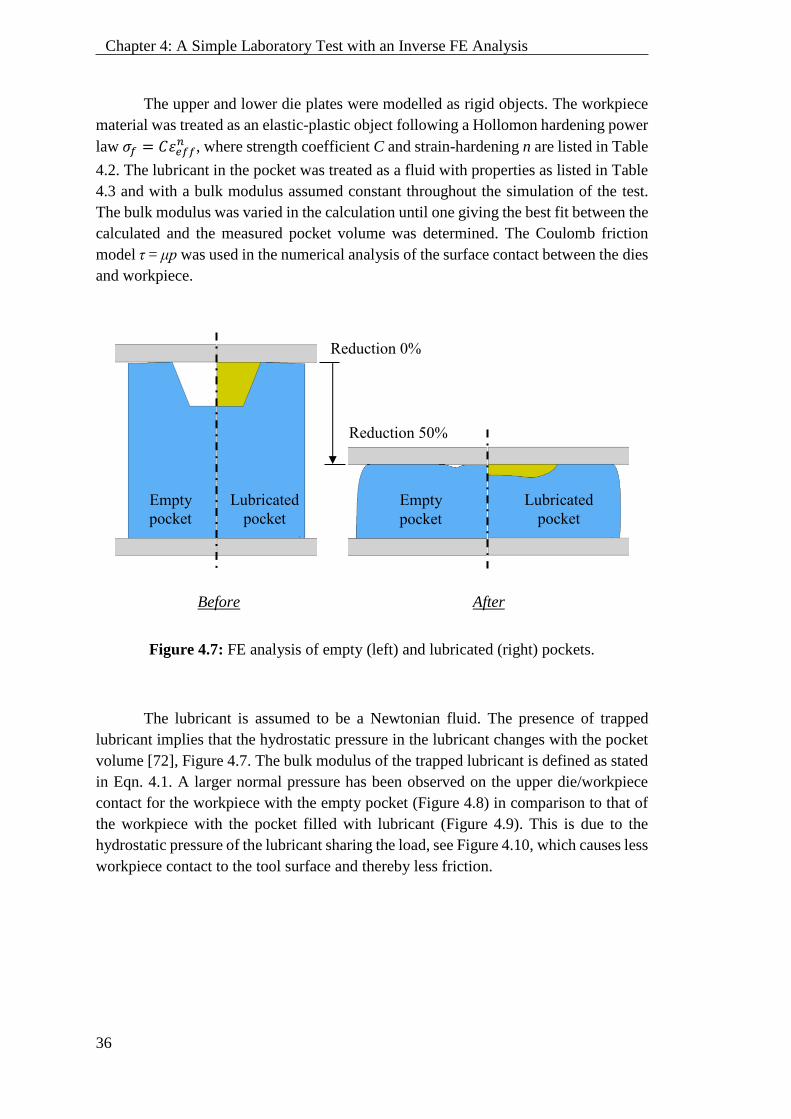
36
Chapter 4: A Simple Laboratory Test with an Inverse FE Analysis
The upper and lower die plates were modelled as rigid objects. The workpiece
material was treated as an elastic-plastic object following a Hollomon hardening power
law 𝜎𝑓 = 𝐶𝜀𝑒𝑓𝑓𝑛 , where strength coefficient C and strain-hardening n are listed in Table
4.2. The lubricant in the pocket was treated as a fluid with properties as listed in Table
4.3 and with a bulk modulus assumed constant throughout the simulation of the test.
The bulk modulus was varied in the calculation until one giving the best fit between the
calculated and the measured pocket volume was determined. The Coulomb friction
model τ = μp was used in the numerical analysis of the surface contact between the dies
and workpiece.
Before After
Figure 4.7: FE analysis of empty (left) and lubricated (right) pockets.
The lubricant is assumed to be a Newtonian fluid. The presence of trapped
lubricant implies that the hydrostatic pressure in the lubricant changes with the pocket
volume [72], Figure 4.7. The bulk modulus of the trapped lubricant is defined as stated
in Eqn. 4.1. A larger normal pressure has been observed on the upper die/workpiece
contact for the workpiece with the empty pocket (Figure 4.8) in comparison to that of
the workpiece with the pocket filled with lubricant (Figure 4.9). This is due to the
hydrostatic pressure of the lubricant sharing the load, see Figure 4.10, which causes less
workpiece contact to the tool surface and thereby less friction.
Reduction 0%
Reduction 50%
Empty
Lubricated
Empty
Lubricated
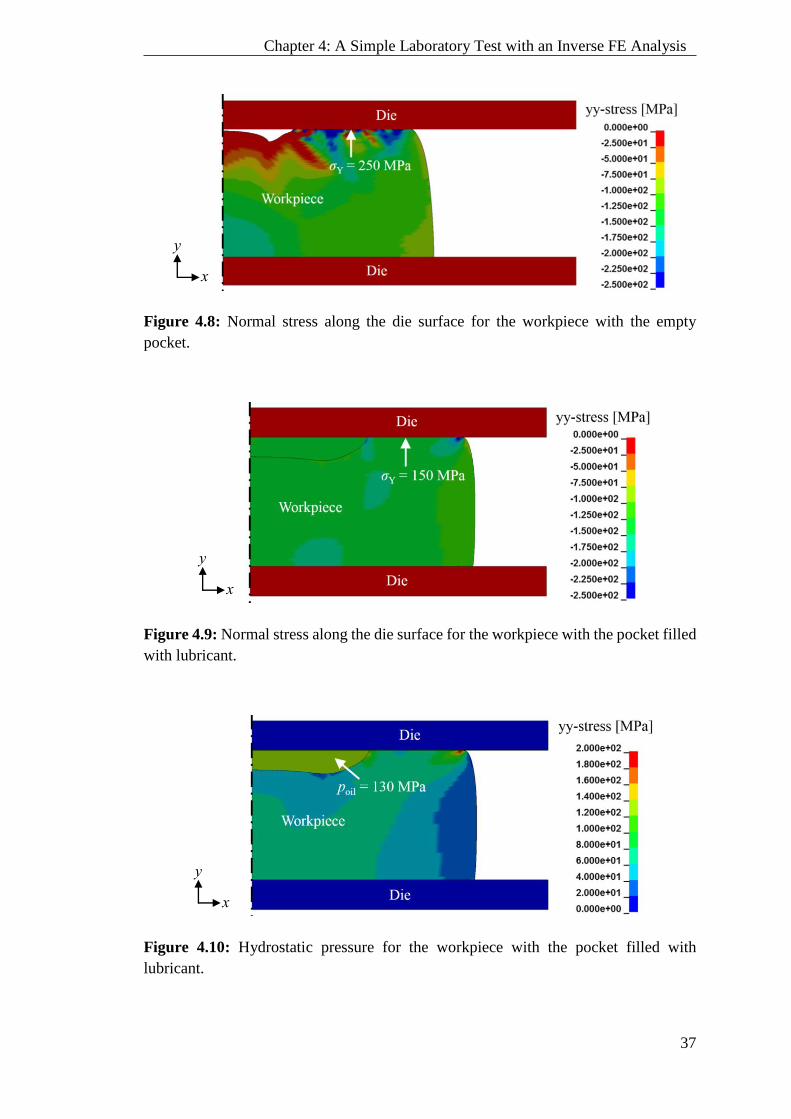
37
Chapter 4: A Simple Laboratory Test with an Inverse FE Analysis
Figure 4.8: Normal stress along the die surface for the workpiece with the empty
pocket.
Figure 4.9: Normal stress along the die surface for the workpiece with the pocket filled
with lubricant.
Figure 4.10: Hydrostatic pressure for the workpiece with the pocket filled with
lubricant.
x
y
x
y
x
y

38
Chapter 4: A Simple Laboratory Test with an Inverse FE Analysis
4.5 Results and Discussion
4.5.1 Pocket Volume
Figure 4.11 shows measured and calculated ratios V/Vo between deformed and
undeformed pocket volumes for different bulk moduli. It is seen that the FEM analysis
based on a bulk modulus K = 1.7 GPa gives the best fit within the experimental pocket
volume. Jacobson [74] has experimentally determined the bulk modulus for six
different oils at ambient pressure to be in the range 1.4 – 1.8 GPa. The bulk modulus
found in the present work is thus in the high end of this range, which fits well with the
fact that the present bulk modulus is determined at an elevated pressure where the bulk
modulus is known to be larger [72]. Figure 4.12 shows the pocket volume ratio for the
two investigated cases 1) pocket with liquid (CR5) and 2) pocket without liquid (NO).
The difference in pocket volume between the filled and empty pockets is significant
due to the large bulk modulus of the oil, which creates a high hydrostatic pressure build-
up in the lubricant, which prevents excessive deformation of the pocket. During
deformation the trapped lubricant acts like an elastic spring, where a larger bulk
modulus increases the spring constant.
Figure 4.11: FEM predicted and experimentally determined relative pocket volume as
a function of relative workpiece height reduction for different bulk moduli of CR5 oil.
0.90
0.92
0.94
0.96
0.98
1.00
0 0.1 0.2 0.3 0.4 0.5 0.6
Pock
et V
olu
me
V/V
o
Relative Height ΔH/Ho
Exp (CR5)FEM (K=2000 MPa)FEM (K=1700 MPa)FEM (K=1500 MPa)
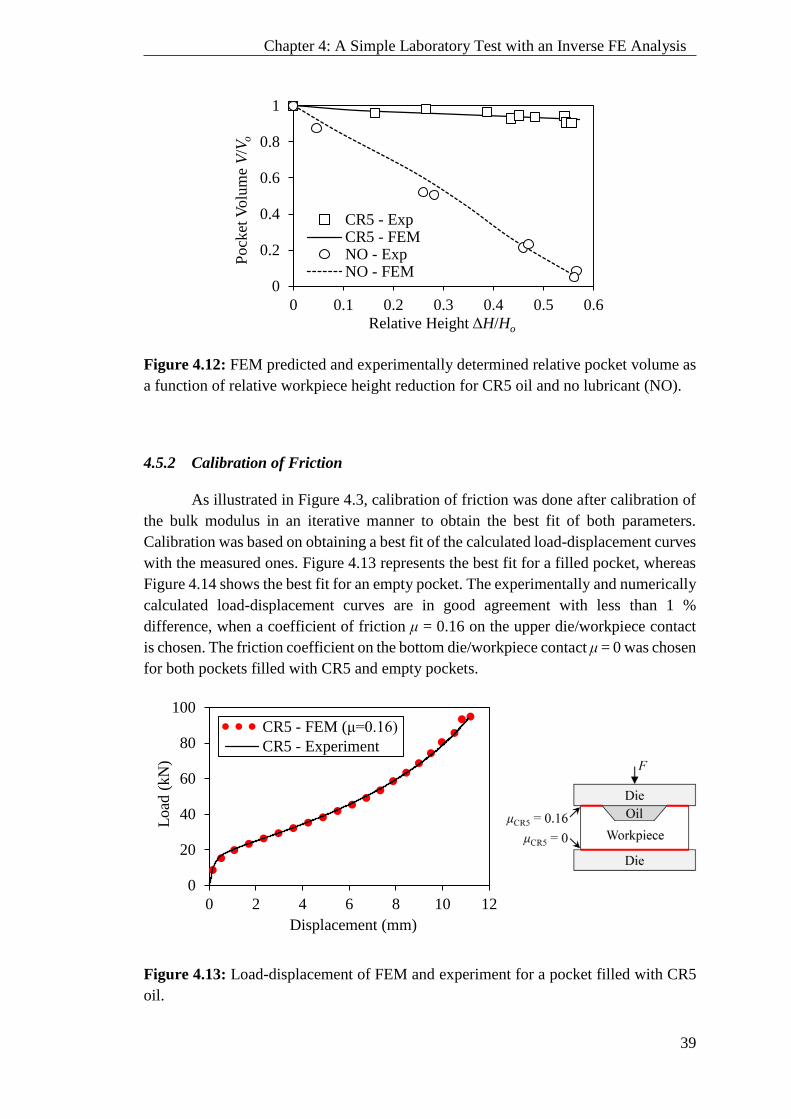
39
Chapter 4: A Simple Laboratory Test with an Inverse FE Analysis
Figure 4.12: FEM predicted and experimentally determined relative pocket volume as
a function of relative workpiece height reduction for CR5 oil and no lubricant (NO).
4.5.2 Calibration of Friction
As illustrated in Figure 4.3, calibration of friction was done after calibration of
the bulk modulus in an iterative manner to obtain the best fit of both parameters.
Calibration was based on obtaining a best fit of the calculated load-displacement curves
with the measured ones. Figure 4.13 represents the best fit for a filled pocket, whereas
Figure 4.14 shows the best fit for an empty pocket. The experimentally and numerically
calculated load-displacement curves are in good agreement with less than 1 %
difference, when a coefficient of friction μ = 0.16 on the upper die/workpiece contact
is chosen. The friction coefficient on the bottom die/workpiece contact μ = 0 was chosen
for both pockets filled with CR5 and empty pockets.
Figure 4.13: Load-displacement of FEM and experiment for a pocket filled with CR5
oil.
0
0.2
0.4
0.6
0.8
1
0 0.1 0.2 0.3 0.4 0.5 0.6
Pock
et V
olu
me
V/V
o
Relative Height ΔH/Ho
CR5 - ExpCR5 - FEMNO - ExpNO - FEM
0
20
40
60
80
100
0 2 4 6 8 10 12
Load
(kN
)
Displacement (mm)
CR5 - FEM (μ=0.16)
CR5 - Experiment
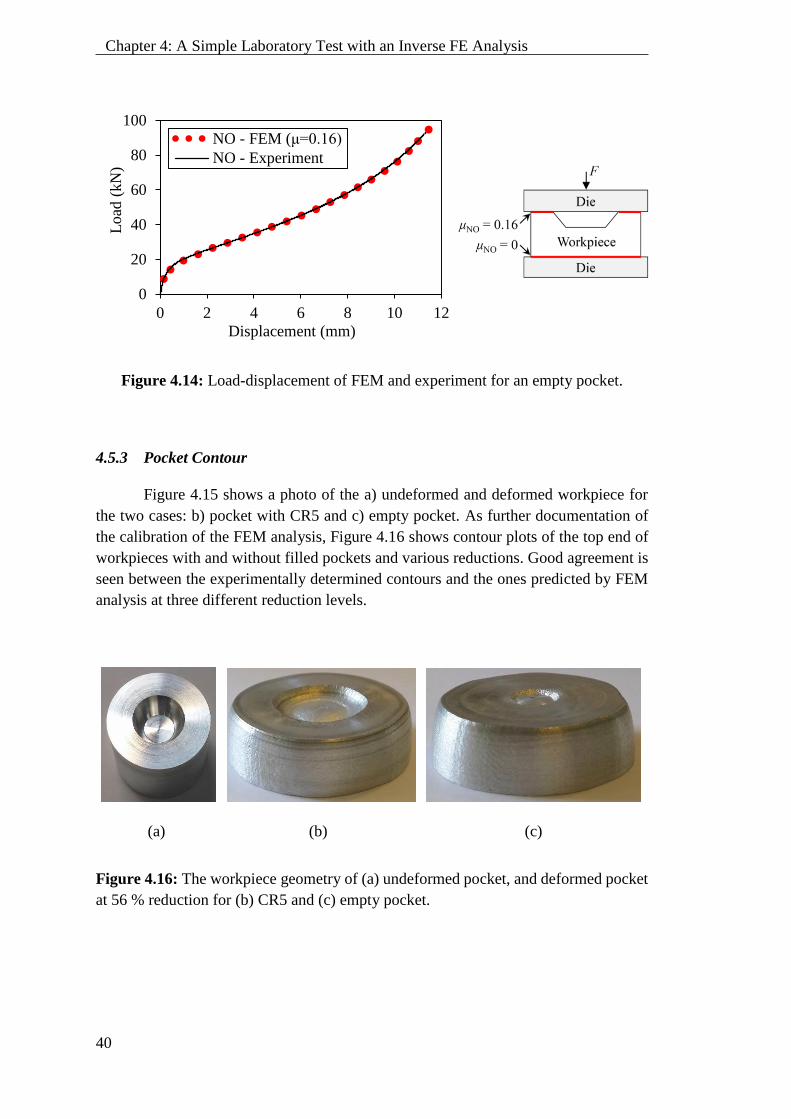
40
Chapter 4: A Simple Laboratory Test with an Inverse FE Analysis
Figure 4.14: Load-displacement of FEM and experiment for an empty pocket.
4.5.3 Pocket Contour
Figure 4.15 shows a photo of the a) undeformed and deformed workpiece for
the two cases: b) pocket with CR5 and c) empty pocket. As further documentation of
the calibration of the FEM analysis, Figure 4.16 shows contour plots of the top end of
workpieces with and without filled pockets and various reductions. Good agreement is
seen between the experimentally determined contours and the ones predicted by FEM
analysis at three different reduction levels.
(a) (b) (c)
Figure 4.16: The workpiece geometry of (a) undeformed pocket, and deformed pocket
at 56 % reduction for (b) CR5 and (c) empty pocket.
0
20
40
60
80
100
0 2 4 6 8 10 12
Load
(kN
)
Displacement (mm)
NO - FEM (μ=0.16)
NO - Experiment
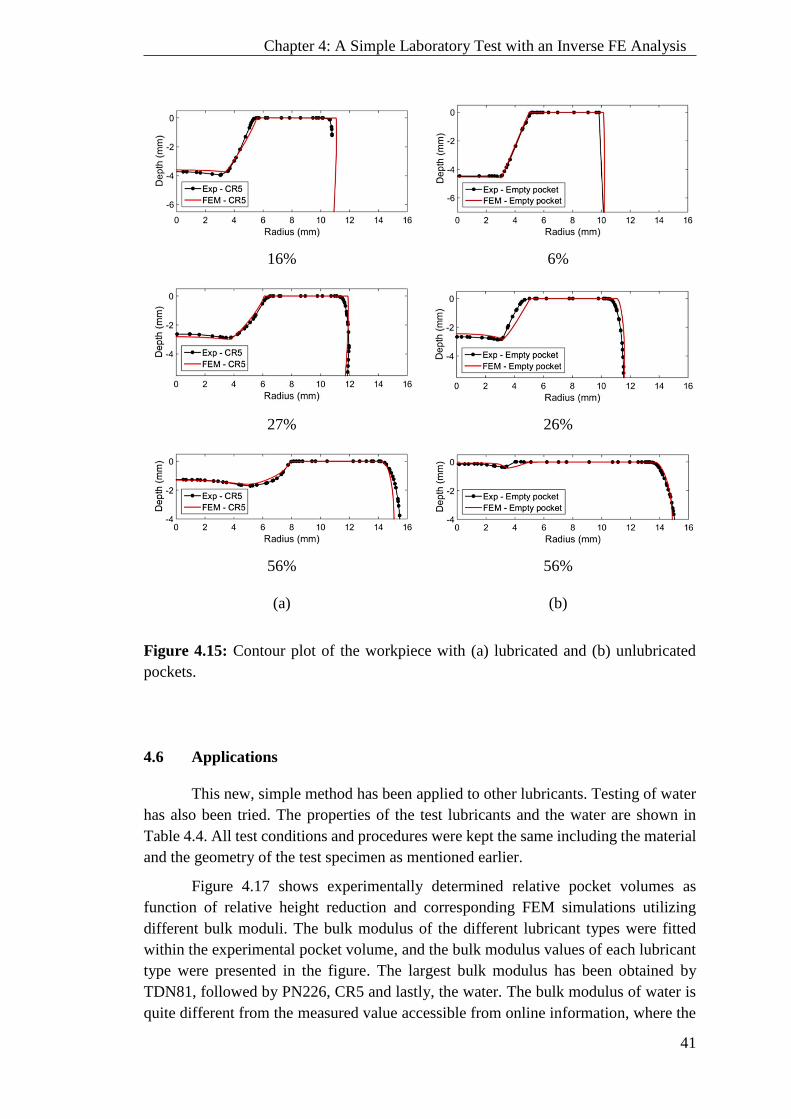
41
Chapter 4: A Simple Laboratory Test with an Inverse FE Analysis
16% 6%
27% 26%
56% 56%
(a) (b)
Figure 4.15: Contour plot of the workpiece with (a) lubricated and (b) unlubricated
pockets.
4.6 Applications
This new, simple method has been applied to other lubricants. Testing of water
has also been tried. The properties of the test lubricants and the water are shown in
Table 4.4. All test conditions and procedures were kept the same including the material
and the geometry of the test specimen as mentioned earlier.
Figure 4.17 shows experimentally determined relative pocket volumes as
function of relative height reduction and corresponding FEM simulations utilizing
different bulk moduli. The bulk modulus of the different lubricant types were fitted
within the experimental pocket volume, and the bulk modulus values of each lubricant
type were presented in the figure. The largest bulk modulus has been obtained by
TDN81, followed by PN226, CR5 and lastly, the water. The bulk modulus of water is
quite different from the measured value accessible from online information, where the
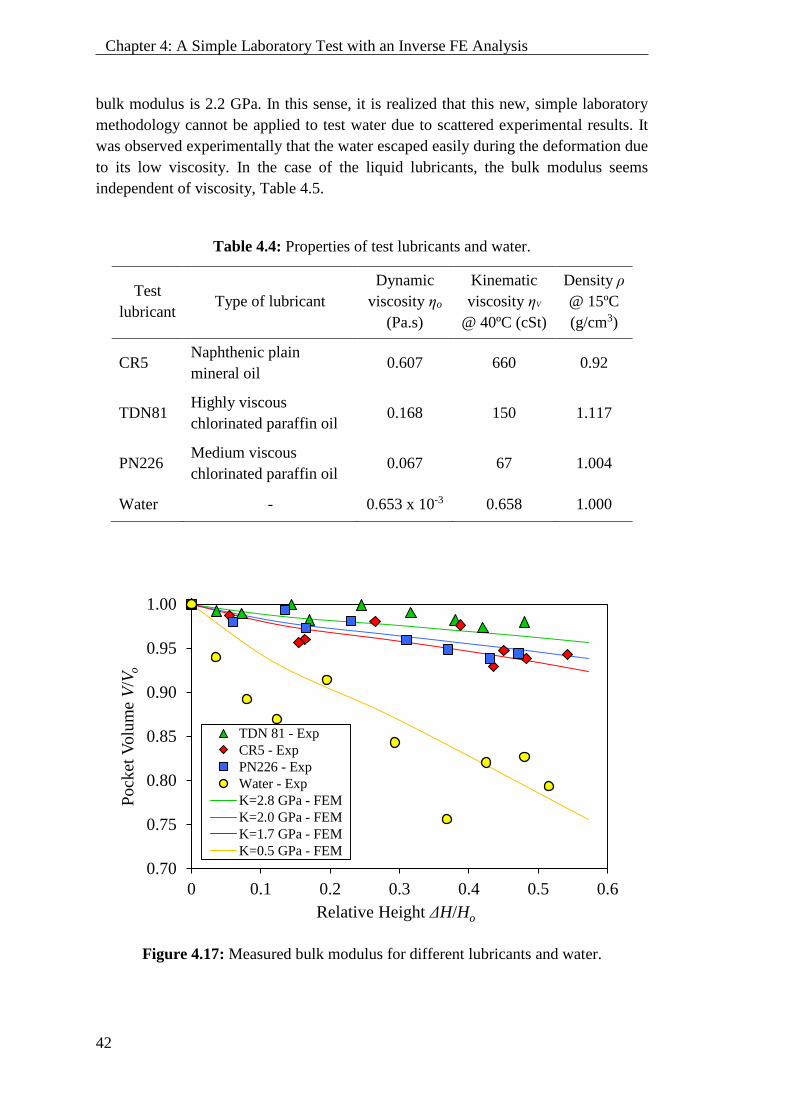
42
Chapter 4: A Simple Laboratory Test with an Inverse FE Analysis
bulk modulus is 2.2 GPa. In this sense, it is realized that this new, simple laboratory
methodology cannot be applied to test water due to scattered experimental results. It
was observed experimentally that the water escaped easily during the deformation due
to its low viscosity. In the case of the liquid lubricants, the bulk modulus seems
independent of viscosity, Table 4.5.
Table 4.4: Properties of test lubricants and water.
Test
lubricant Type of lubricant
Dynamic
viscosity ηo
(Pa.s)
Kinematic
viscosity ηV
@ 40ºC (cSt)
Density ρ
@ 15ºC
(g/cm3)
CR5 Naphthenic plain
mineral oil 0.607 660 0.92
TDN81 Highly viscous
chlorinated paraffin oil 0.168 150 1.117
PN226 Medium viscous
chlorinated paraffin oil 0.067 67 1.004
Water - 0.653 x 10⁻³ 0.658 1.000
Figure 4.17: Measured bulk modulus for different lubricants and water.
0.70
0.75
0.80
0.85
0.90
0.95
1.00
0 0.1 0.2 0.3 0.4 0.5 0.6
Pock
et V
olu
me
V/V
o
Relative Height ΔH/Ho
TDN 81 - Exp
CR5 - Exp
PN226 - Exp
Water - Exp
K=2.8 GPa - FEM
K=2.0 GPa - FEM
K=1.7 GPa - FEM
K=0.5 GPa - FEM

43
Chapter 4: A Simple Laboratory Test with an Inverse FE Analysis
Table 4.5: Comparison of lubricant properties (viscosity and bulk modulus).
Test
lubricant Type of lubricant
Kinematic viscosity
ηV @ 40ºC (cSt)
Bulk modulus
(GPa)
CR5 Naphthenic plain mineral oil 660 1.75
TDN81 Highly viscous chlorinated
paraffin oil 150 2.8
PN226 Medium viscous chlorinated
paraffin oil 67 2.0
4.7 Summary
The proposed methodology consists of a simple laboratory test and an inverse
FEM analysis for determining the bulk modulus. It has proven to work satisfactory in
the low pressure regime of approximately 100 MPa. Further verification of the simple
laboratory experimental methodology can also be explored to the higher pressure range.
Such an experiment requires higher strength test material such as steel. However, the
next test campaign focuses on the development and testing of a high-pressure
equipment based on a new design concept. The new design concept is planned for
measuring the bulk modulus at varying pressure range.

44
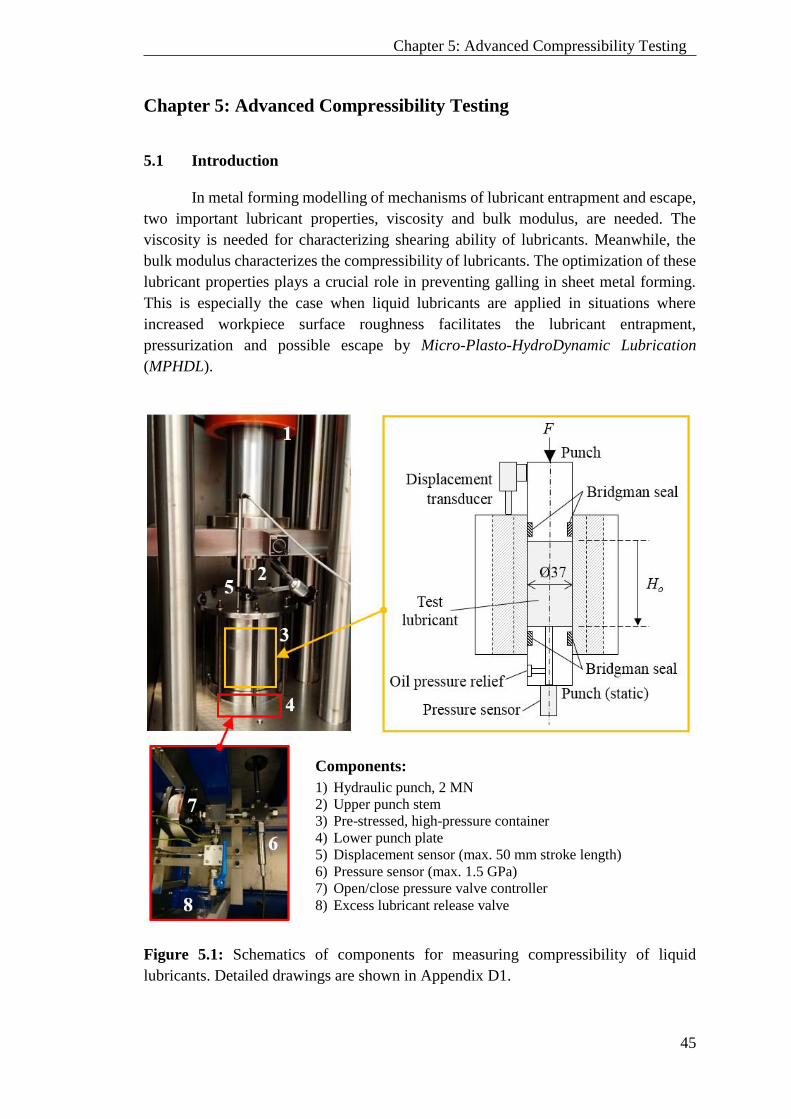
45
Chapter 5: Advanced Compressibility Testing
Chapter 5: Advanced Compressibility Testing
5.1 Introduction
In metal forming modelling of mechanisms of lubricant entrapment and escape,
two important lubricant properties, viscosity and bulk modulus, are needed. The
viscosity is needed for characterizing shearing ability of lubricants. Meanwhile, the
bulk modulus characterizes the compressibility of lubricants. The optimization of these
lubricant properties plays a crucial role in preventing galling in sheet metal forming.
This is especially the case when liquid lubricants are applied in situations where
increased workpiece surface roughness facilitates the lubricant entrapment,
pressurization and possible escape by Micro-Plasto-HydroDynamic Lubrication
(MPHDL).
Figure 5.1: Schematics of components for measuring compressibility of liquid
lubricants. Detailed drawings are shown in Appendix D1.
Components:
1) Hydraulic punch, 2 MN
2) Upper punch stem
3) Pre-stressed, high-pressure container
4) Lower punch plate
5) Displacement sensor (max. 50 mm stroke length)
6) Pressure sensor (max. 1.5 GPa)
7) Open/close pressure valve controller
8) Excess lubricant release valve

46
Chapter 5: Advanced Compressibility Testing
A new equipment has been designed and built to determine the lubricant
properties in a wide pressure range. The new equipment has been designed by Lund
and Hansen [77]. The construction of the new equipment has also included some
components for measuring lubricant pressure build-up with decreasing lubricant
volume in a pre-stressed Ø37 mm pressure container with two fitting punches, see
Figure 5.1, and subsequent calculation of the lubricant bulk modulus.
The lower punch is stationary, whereas the upper punch is moving in order to
compress the liquid between the punches. Load is delivered by a 2 MN hydraulic
cylinder. Custom made Bridgman seals are mounted on the punches. Figure 5.2 shows
the seal components comprising of three rings. For testing of lubricants to a pressure of
500 MPa, ring 1, which has a triangular cross section is made of copper, ring 2 with a
square cross section is made of Teflon, whereas ring 3 is a commercial U-shaped rubber
seal, Variseal M2S from Trelleborg, Sweden. A central bore in the bottom punch leads
the oil to a pressure sensor (HBM, P3MBP BlueLine, measuring range 0 – 1.5 GPa).
The volume change of the oil is determined by measuring the punch travel by a length
transducer (HBM, WA/50mm, measuring length range 0 – 50 mm).
(a) (b)
Figure 5.2: Bridgman seal on a) upper and b) lower punches. For pressures up to
500MPa. Technical drawings are shown in Appendix D2.
5.2 Numerical Analysis of High-Pressure Compressibility Equipment
5.2.1 Tool Deflection
A numerical analysis using LS-DYNA v. R7.1.1 was performed to estimate the
deflection of the tools under load by coupling deformation of the lubricant and the
metal, Figure 5.3a. The FE simulation made use of an axisymmetric model with fully
integrated, linear quadrilateral elements and implicit time integration. A fine, uniform
mesh was applied in the contact between the container, the punches and the lubricant.
The upper and lower punches as well as the container were modelled as elastic bodies
in order to calculate the tool deflections and compare the pressure build-up and punch
stroke with the one obtained by assuming rigid dies and punches in order to determine
the size of the elastic deflections. The material properties are listed in Table 5.1. The
Components:
1) Ring 1 – Copper
2) Ring 2 – Teflon
3) Ring 3 – Commercial U-shaped seal
4) Punch cap
5) Punch
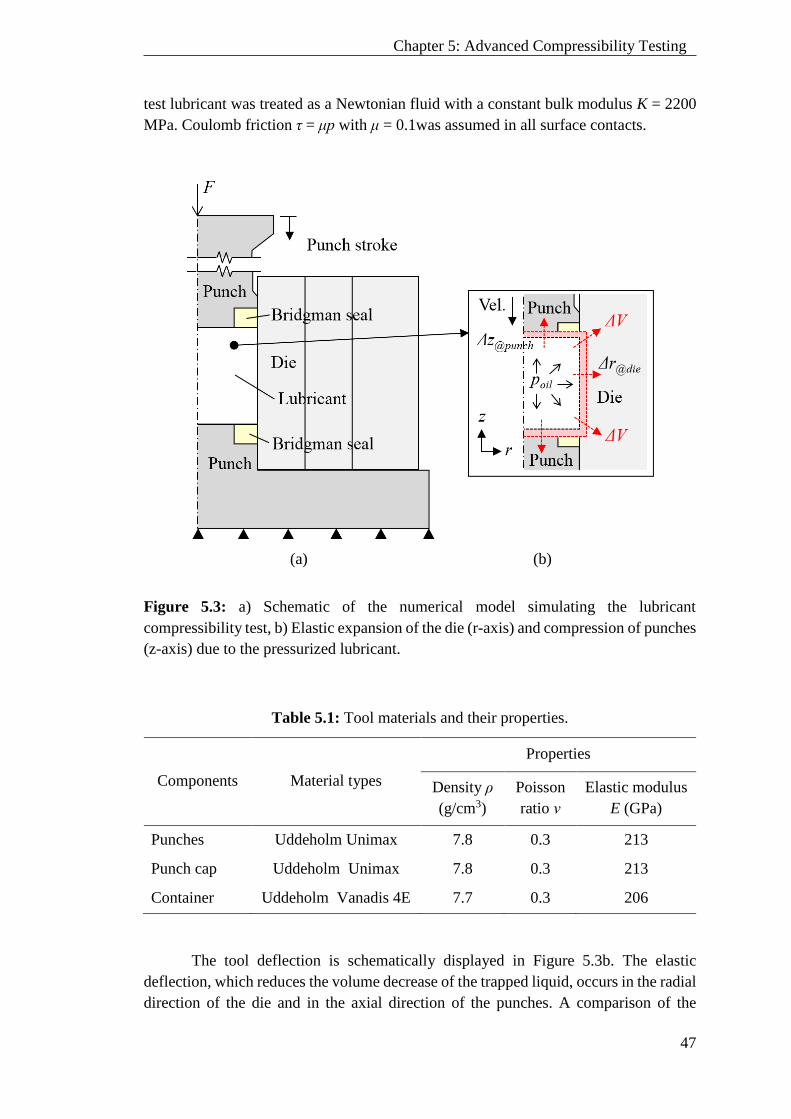
47
Chapter 5: Advanced Compressibility Testing
test lubricant was treated as a Newtonian fluid with a constant bulk modulus K = 2200
MPa. Coulomb friction τ = μp with μ = 0.1was assumed in all surface contacts.
(a) (b)
Figure 5.3: a) Schematic of the numerical model simulating the lubricant
compressibility test, b) Elastic expansion of the die (r-axis) and compression of punches
(z-axis) due to the pressurized lubricant.
Table 5.1: Tool materials and their properties.
Components Material types
Properties
Density ρ
(g/cm3)
Poisson
ratio ν
Elastic modulus
E (GPa)
Punches Uddeholm Unimax 7.8 0.3 213
Punch cap Uddeholm Unimax 7.8 0.3 213
Container Uddeholm Vanadis 4E 7.7 0.3 206
The tool deflection is schematically displayed in Figure 5.3b. The elastic
deflection, which reduces the volume decrease of the trapped liquid, occurs in the radial
direction of the die and in the axial direction of the punches. A comparison of the
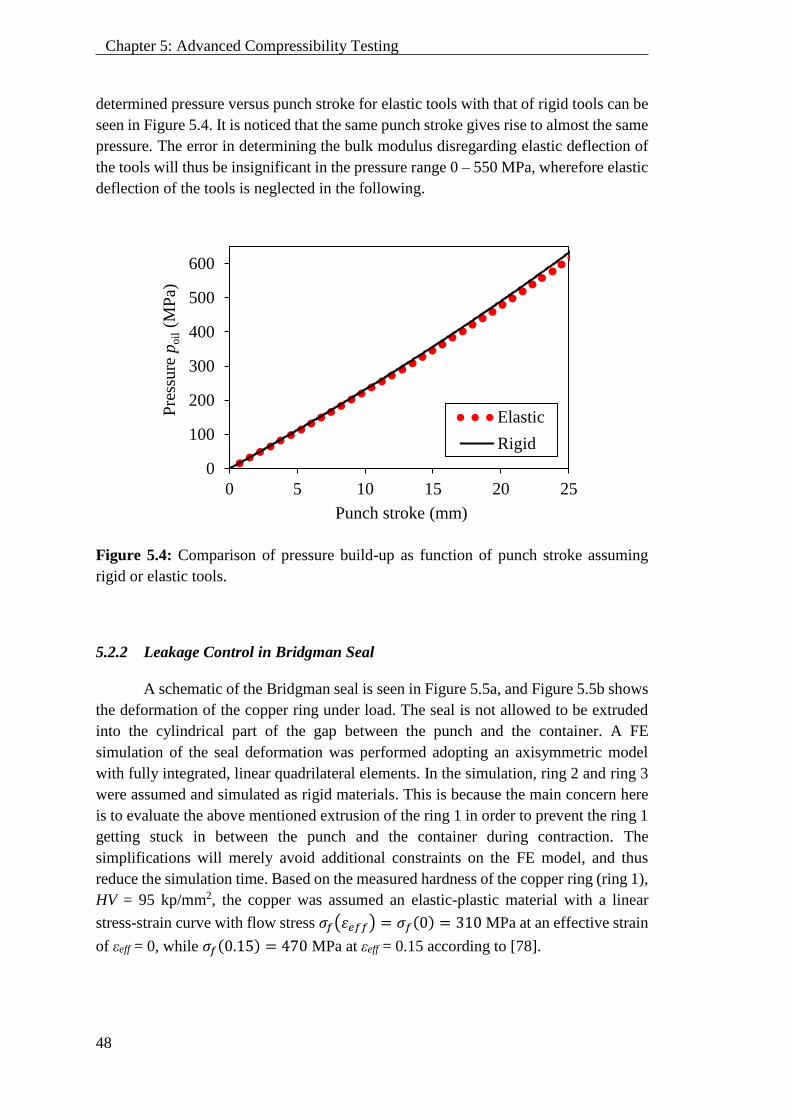
48
Chapter 5: Advanced Compressibility Testing
determined pressure versus punch stroke for elastic tools with that of rigid tools can be
seen in Figure 5.4. It is noticed that the same punch stroke gives rise to almost the same
pressure. The error in determining the bulk modulus disregarding elastic deflection of
the tools will thus be insignificant in the pressure range 0 – 550 MPa, wherefore elastic
deflection of the tools is neglected in the following.
Figure 5.4: Comparison of pressure build-up as function of punch stroke assuming
rigid or elastic tools.
5.2.2 Leakage Control in Bridgman Seal
A schematic of the Bridgman seal is seen in Figure 5.5a, and Figure 5.5b shows
the deformation of the copper ring under load. The seal is not allowed to be extruded
into the cylindrical part of the gap between the punch and the container. A FE
simulation of the seal deformation was performed adopting an axisymmetric model
with fully integrated, linear quadrilateral elements. In the simulation, ring 2 and ring 3
were assumed and simulated as rigid materials. This is because the main concern here
is to evaluate the above mentioned extrusion of the ring 1 in order to prevent the ring 1
getting stuck in between the punch and the container during contraction. The
simplifications will merely avoid additional constraints on the FE model, and thus
reduce the simulation time. Based on the measured hardness of the copper ring (ring 1),
HV = 95 kp/mm2, the copper was assumed an elastic-plastic material with a linear
stress-strain curve with flow stress 𝜎𝑓(𝜀𝑒𝑓𝑓) = 𝜎𝑓(0) = 310 MPa at an effective strain
of εeff = 0, while 𝜎𝑓(0.15) = 470 MPa at εeff = 0.15 according to [78].
0
100
200
300
400
500
600
0 5 10 15 20 25
Pre
ssure
poil
(MP
a)
Punch stroke (mm)
Elastic
Rigid
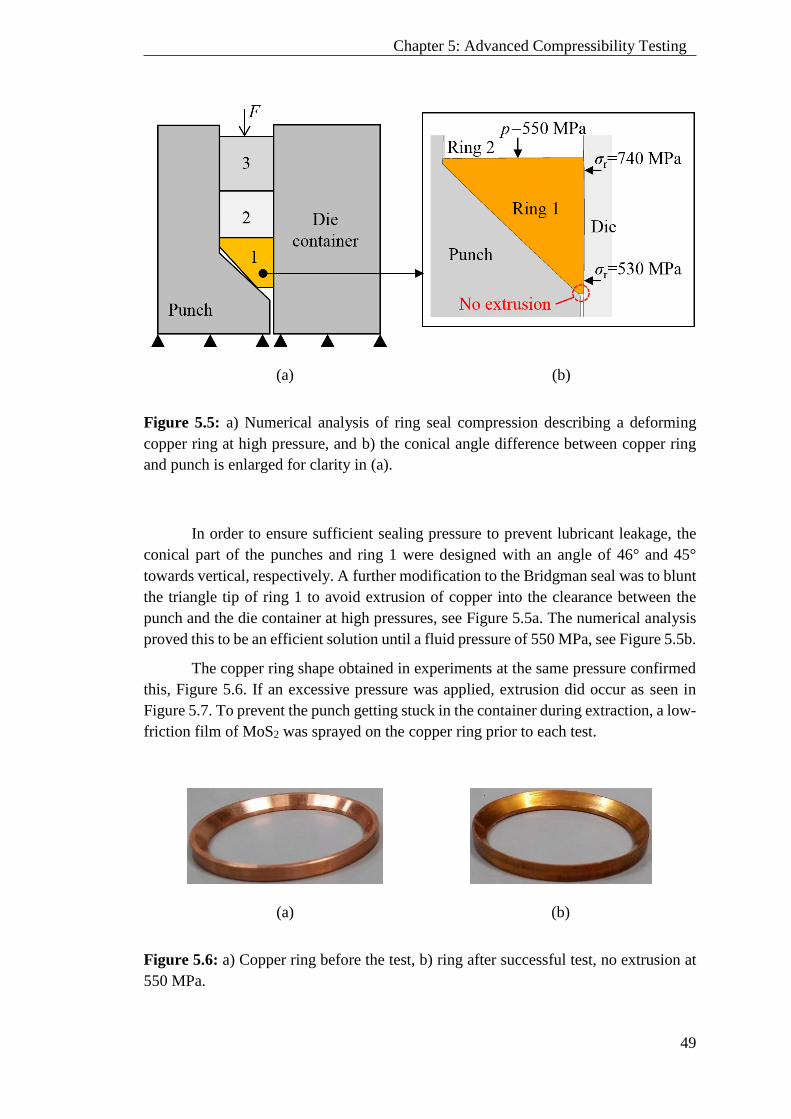
49
Chapter 5: Advanced Compressibility Testing
(a) (b)
Figure 5.5: a) Numerical analysis of ring seal compression describing a deforming
copper ring at high pressure, and b) the conical angle difference between copper ring
and punch is enlarged for clarity in (a).
In order to ensure sufficient sealing pressure to prevent lubricant leakage, the
conical part of the punches and ring 1 were designed with an angle of 46° and 45°
towards vertical, respectively. A further modification to the Bridgman seal was to blunt
the triangle tip of ring 1 to avoid extrusion of copper into the clearance between the
punch and the die container at high pressures, see Figure 5.5a. The numerical analysis
proved this to be an efficient solution until a fluid pressure of 550 MPa, see Figure 5.5b.
The copper ring shape obtained in experiments at the same pressure confirmed
this, Figure 5.6. If an excessive pressure was applied, extrusion did occur as seen in
Figure 5.7. To prevent the punch getting stuck in the container during extraction, a low-
friction film of MoS2 was sprayed on the copper ring prior to each test.
(a) (b)
Figure 5.6: a) Copper ring before the test, b) ring after successful test, no extrusion at
550 MPa.
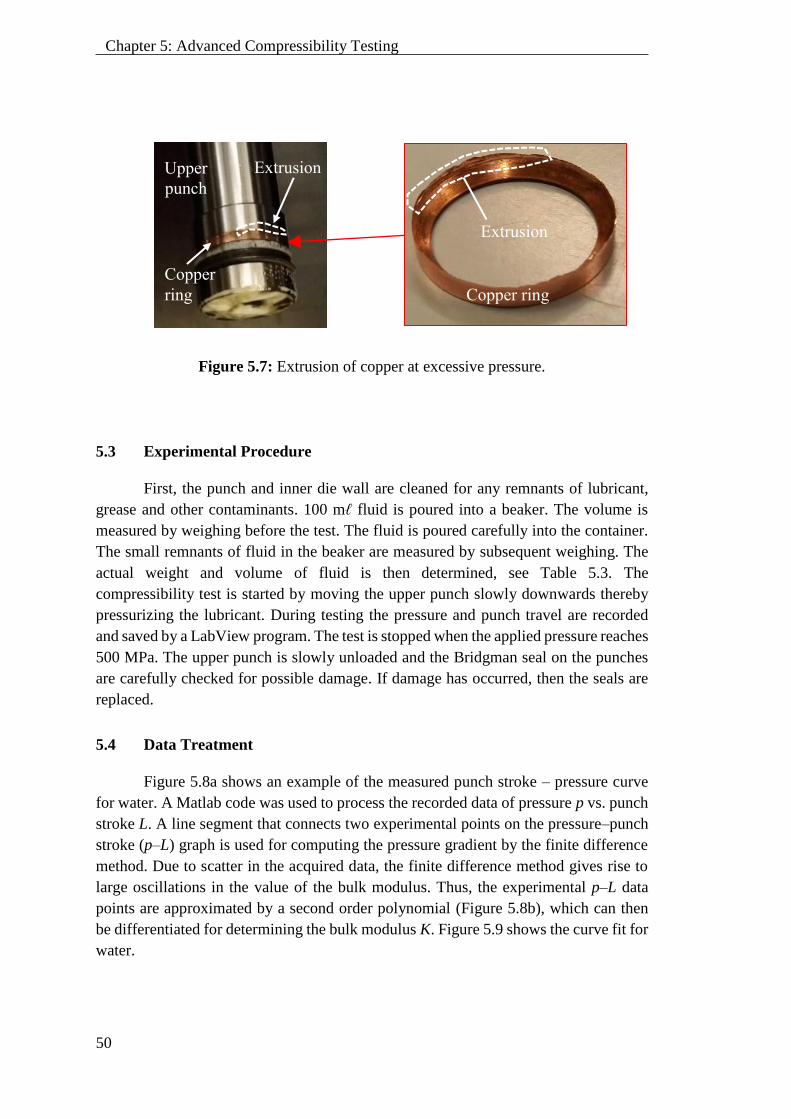
50
Chapter 5: Advanced Compressibility Testing
Figure 5.7: Extrusion of copper at excessive pressure.
5.3 Experimental Procedure
First, the punch and inner die wall are cleaned for any remnants of lubricant,
grease and other contaminants. 100 mℓ fluid is poured into a beaker. The volume is
measured by weighing before the test. The fluid is poured carefully into the container.
The small remnants of fluid in the beaker are measured by subsequent weighing. The
actual weight and volume of fluid is then determined, see Table 5.3. The
compressibility test is started by moving the upper punch slowly downwards thereby
pressurizing the lubricant. During testing the pressure and punch travel are recorded
and saved by a LabView program. The test is stopped when the applied pressure reaches
500 MPa. The upper punch is slowly unloaded and the Bridgman seal on the punches
are carefully checked for possible damage. If damage has occurred, then the seals are
replaced.
5.4 Data Treatment
Figure 5.8a shows an example of the measured punch stroke – pressure curve
for water. A Matlab code was used to process the recorded data of pressure p vs. punch
stroke L. A line segment that connects two experimental points on the pressure–punch
stroke (p–L) graph is used for computing the pressure gradient by the finite difference
method. Due to scatter in the acquired data, the finite difference method gives rise to
large oscillations in the value of the bulk modulus. Thus, the experimental p–L data
points are approximated by a second order polynomial (Figure 5.8b), which can then
be differentiated for determining the bulk modulus K. Figure 5.9 shows the curve fit for
water.
Copper
ring
Upper
punch
Extrusion
Extrusion
Copper ring
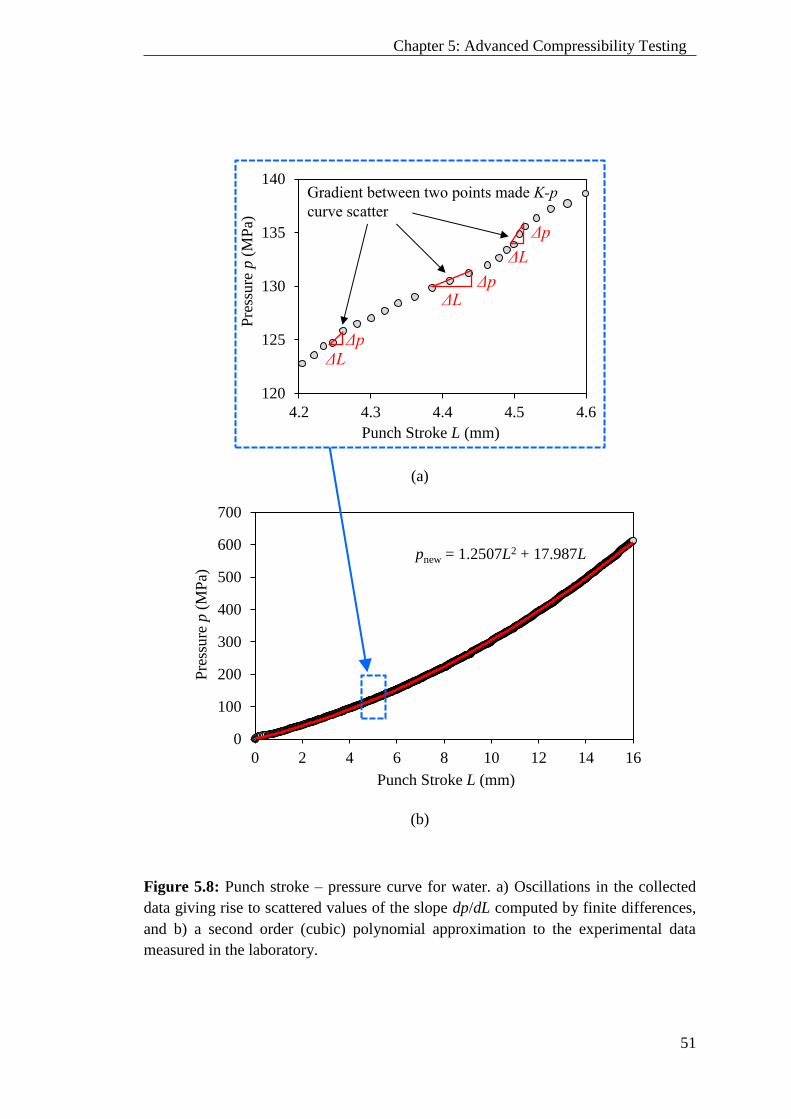
51
Chapter 5: Advanced Compressibility Testing
(a)
(b)
Figure 5.8: Punch stroke – pressure curve for water. a) Oscillations in the collected
data giving rise to scattered values of the slope dp/dL computed by finite differences,
and b) a second order (cubic) polynomial approximation to the experimental data
measured in the laboratory.
pnew = 1.2507L2 + 17.987L
0
100
200
300
400
500
600
700
0 2 4 6 8 10 12 14 16
Pre
ssure
p(M
Pa)
Punch Stroke L (mm)
120
125
130
135
140
4.2 4.3 4.4 4.5 4.6
Pre
ssure
p(M
Pa)
Punch Stroke L (mm)
ΔL
Δp
ΔL
Δp
ΔL
Δp
Gradient between two points made K-p
curve scatter
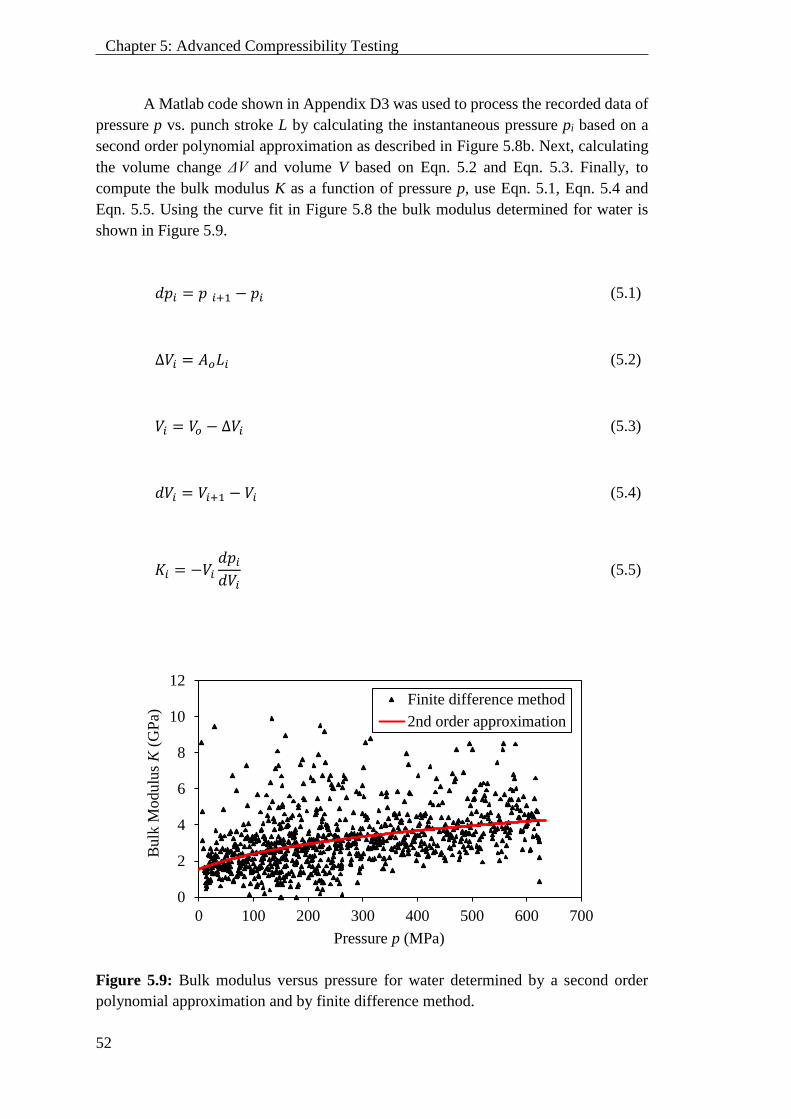
52
Chapter 5: Advanced Compressibility Testing
A Matlab code shown in Appendix D3 was used to process the recorded data of
pressure p vs. punch stroke L by calculating the instantaneous pressure pi based on a
second order polynomial approximation as described in Figure 5.8b. Next, calculating
the volume change ΔV and volume V based on Eqn. 5.2 and Eqn. 5.3. Finally, to
compute the bulk modulus K as a function of pressure p, use Eqn. 5.1, Eqn. 5.4 and
Eqn. 5.5. Using the curve fit in Figure 5.8 the bulk modulus determined for water is
shown in Figure 5.9.
𝑑𝑝𝑖 = 𝑝 𝑖+1 − 𝑝𝑖 (5.1)
∆𝑉𝑖 = 𝐴𝑜𝐿𝑖 (5.2)
𝑉𝑖 = 𝑉𝑜 − ∆𝑉𝑖 (5.3)
𝑑𝑉𝑖 = 𝑉𝑖+1 − 𝑉𝑖 (5.4)
𝐾𝑖 = −𝑉𝑖
𝑑𝑝𝑖
𝑑𝑉𝑖 (5.5)
Figure 5.9: Bulk modulus versus pressure for water determined by a second order
polynomial approximation and by finite difference method.
0
2
4
6
8
10
12
0 100 200 300 400 500 600 700
Bulk
Modulu
s K
(GP
a)
Pressure p (MPa)
Finite difference method
2nd order approximation
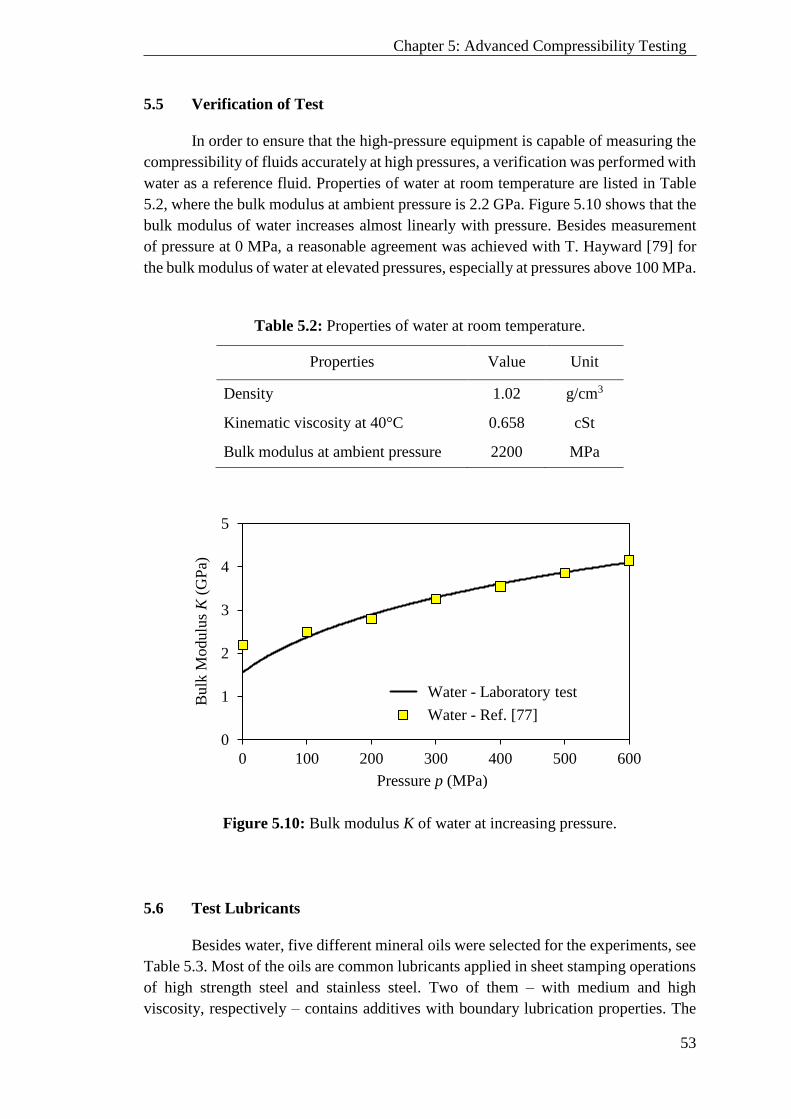
53
Chapter 5: Advanced Compressibility Testing
5.5 Verification of Test
In order to ensure that the high-pressure equipment is capable of measuring the
compressibility of fluids accurately at high pressures, a verification was performed with
water as a reference fluid. Properties of water at room temperature are listed in Table
5.2, where the bulk modulus at ambient pressure is 2.2 GPa. Figure 5.10 shows that the
bulk modulus of water increases almost linearly with pressure. Besides measurement
of pressure at 0 MPa, a reasonable agreement was achieved with T. Hayward [79] for
the bulk modulus of water at elevated pressures, especially at pressures above 100 MPa.
Table 5.2: Properties of water at room temperature.
Properties Value Unit
Density 1.02 g/cm3
Kinematic viscosity at 40°C 0.658 cSt
Bulk modulus at ambient pressure 2200 MPa
Figure 5.10: Bulk modulus K of water at increasing pressure.
5.6 Test Lubricants
Besides water, five different mineral oils were selected for the experiments, see
Table 5.3. Most of the oils are common lubricants applied in sheet stamping operations
of high strength steel and stainless steel. Two of them – with medium and high
viscosity, respectively – contains additives with boundary lubrication properties. The
0
1
2
3
4
5
0 100 200 300 400 500 600
Bulk
Modulu
s K
(GP
a)
Pressure p (MPa)
Water - Laboratory test
Water (Ref: Hayward, 1967)
Water - Laboratory test
Water - Ref. [77]
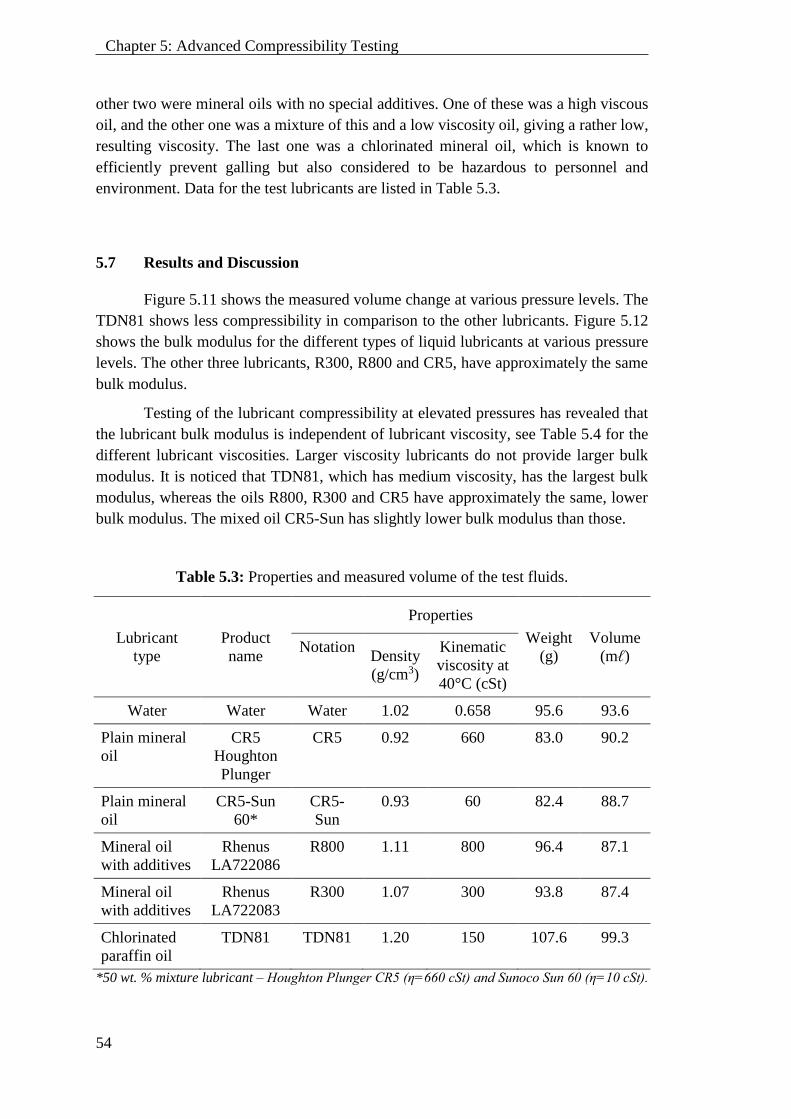
54
Chapter 5: Advanced Compressibility Testing
other two were mineral oils with no special additives. One of these was a high viscous
oil, and the other one was a mixture of this and a low viscosity oil, giving a rather low,
resulting viscosity. The last one was a chlorinated mineral oil, which is known to
efficiently prevent galling but also considered to be hazardous to personnel and
environment. Data for the test lubricants are listed in Table 5.3.
5.7 Results and Discussion
Figure 5.11 shows the measured volume change at various pressure levels. The
TDN81 shows less compressibility in comparison to the other lubricants. Figure 5.12
shows the bulk modulus for the different types of liquid lubricants at various pressure
levels. The other three lubricants, R300, R800 and CR5, have approximately the same
bulk modulus.
Testing of the lubricant compressibility at elevated pressures has revealed that
the lubricant bulk modulus is independent of lubricant viscosity, see Table 5.4 for the
different lubricant viscosities. Larger viscosity lubricants do not provide larger bulk
modulus. It is noticed that TDN81, which has medium viscosity, has the largest bulk
modulus, whereas the oils R800, R300 and CR5 have approximately the same, lower
bulk modulus. The mixed oil CR5-Sun has slightly lower bulk modulus than those.
Table 5.3: Properties and measured volume of the test fluids.
Lubricant
type
Product
name
Properties
Weight
(g)
Volume
(mℓ) Notation
Density
(g/cm3)
Kinematic
viscosity at
40°C (cSt)
Water Water Water 1.02 0.658 95.6 93.6
Plain mineral
oil
CR5
Houghton
Plunger
CR5 0.92 660 83.0 90.2
Plain mineral
oil
CR5-Sun
60*
CR5-
Sun
0.93 60 82.4 88.7
Mineral oil
with additives
Rhenus
LA722086
R800 1.11 800 96.4 87.1
Mineral oil
with additives
Rhenus
LA722083
R300 1.07 300 93.8 87.4
Chlorinated
paraffin oil
TDN81 TDN81 1.20 150 107.6 99.3
*50 wt. % mixture lubricant – Houghton Plunger CR5 (η=660 cSt) and Sunoco Sun 60 (η=10 cSt).
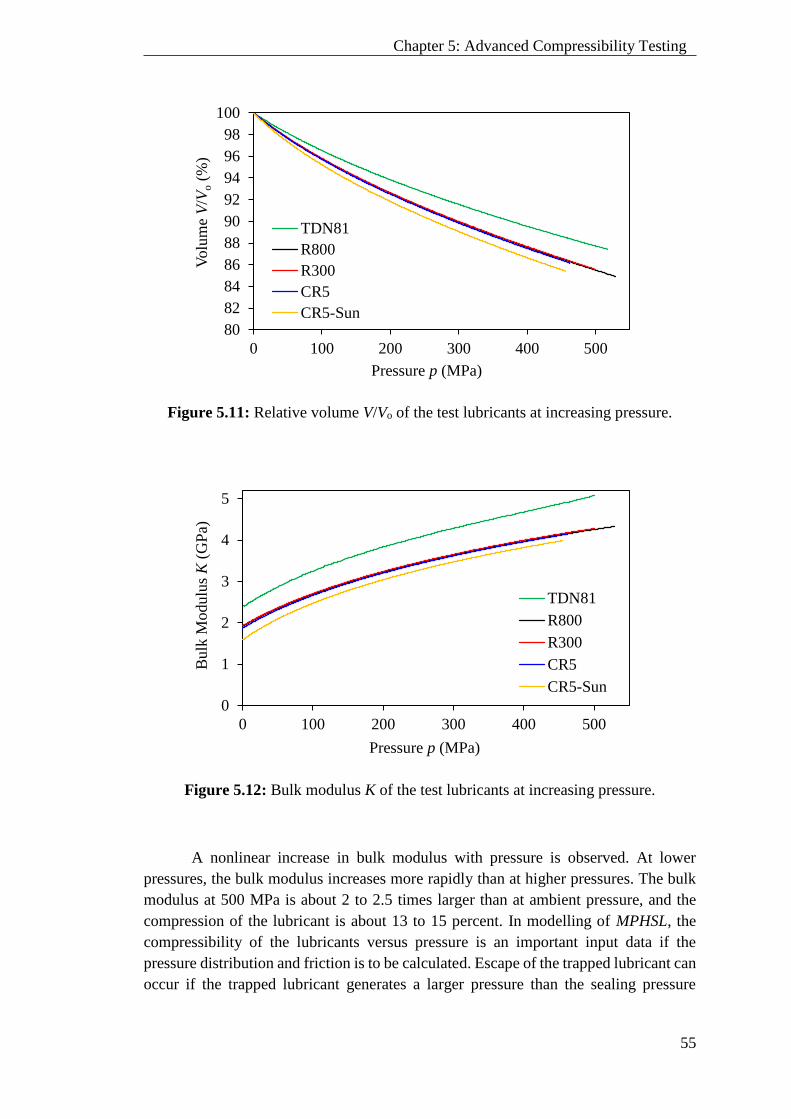
55
Chapter 5: Advanced Compressibility Testing
Figure 5.11: Relative volume V/Vo of the test lubricants at increasing pressure.
Figure 5.12: Bulk modulus K of the test lubricants at increasing pressure.
A nonlinear increase in bulk modulus with pressure is observed. At lower
pressures, the bulk modulus increases more rapidly than at higher pressures. The bulk
modulus at 500 MPa is about 2 to 2.5 times larger than at ambient pressure, and the
compression of the lubricant is about 13 to 15 percent. In modelling of MPHSL, the
compressibility of the lubricants versus pressure is an important input data if the
pressure distribution and friction is to be calculated. Escape of the trapped lubricant can
occur if the trapped lubricant generates a larger pressure than the sealing pressure
80
82
84
86
88
90
92
94
96
98
100
0 100 200 300 400 500
Volu
me
V/V
o(%
)
Pressure p (MPa)
TDN81
R800
R300
CR5
CR5-Sun
0
1
2
3
4
5
0 100 200 300 400 500
Bulk
Modulu
s K
(GP
a)
Pressure p (MPa)
TDN81
R800
R300
CR5
CR5-Sun

56
Chapter 5: Advanced Compressibility Testing
between the lubricated workpiece and the die [30] by the earlier mentioned MPHDL
mechanism. Prediction of this also requires data on the lubricant bulk modulus.
5.8 Summary
A high-pressure equipment were developed for determining lubricant bulk
modulus and has proven to work satisfactorily up to a pressure of 500 MPa. The
pressure is measured directly inside the high-pressure container, which means that the
test equipment allows a direct determination of the bulk modulus at varying pressure
with no influence from friction in the sealing.
57
PART II – STRUCTURED TOOL SURFACES
Part II
Structured Tool Surfaces

58
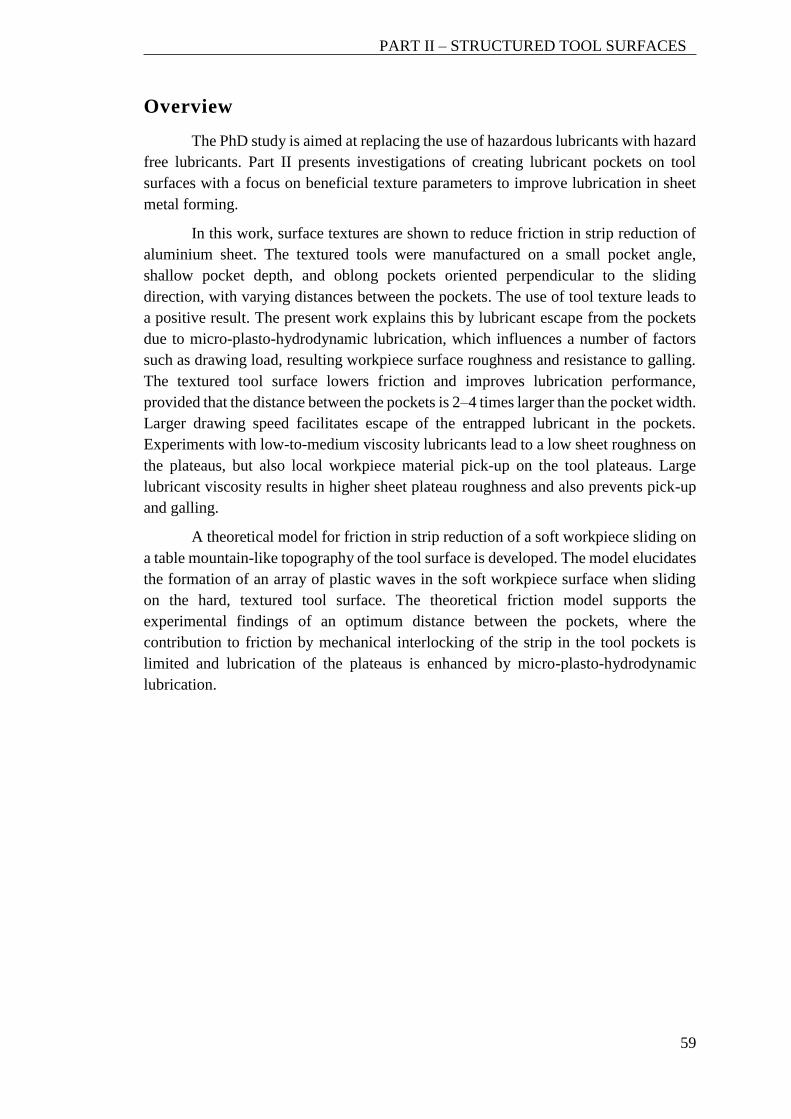
59
PART II – STRUCTURED TOOL SURFACES
Overview
The PhD study is aimed at replacing the use of hazardous lubricants with hazard
free lubricants. Part II presents investigations of creating lubricant pockets on tool
surfaces with a focus on beneficial texture parameters to improve lubrication in sheet
metal forming.
In this work, surface textures are shown to reduce friction in strip reduction of
aluminium sheet. The textured tools were manufactured on a small pocket angle,
shallow pocket depth, and oblong pockets oriented perpendicular to the sliding
direction, with varying distances between the pockets. The use of tool texture leads to
a positive result. The present work explains this by lubricant escape from the pockets
due to micro-plasto-hydrodynamic lubrication, which influences a number of factors
such as drawing load, resulting workpiece surface roughness and resistance to galling.
The textured tool surface lowers friction and improves lubrication performance,
provided that the distance between the pockets is 2–4 times larger than the pocket width.
Larger drawing speed facilitates escape of the entrapped lubricant in the pockets.
Experiments with low-to-medium viscosity lubricants lead to a low sheet roughness on
the plateaus, but also local workpiece material pick-up on the tool plateaus. Large
lubricant viscosity results in higher sheet plateau roughness and also prevents pick-up
and galling.
A theoretical model for friction in strip reduction of a soft workpiece sliding on
a table mountain-like topography of the tool surface is developed. The model elucidates
the formation of an array of plastic waves in the soft workpiece surface when sliding
on the hard, textured tool surface. The theoretical friction model supports the
experimental findings of an optimum distance between the pockets, where the
contribution to friction by mechanical interlocking of the strip in the tool pockets is
limited and lubrication of the plateaus is enhanced by micro-plasto-hydrodynamic
lubrication.

60
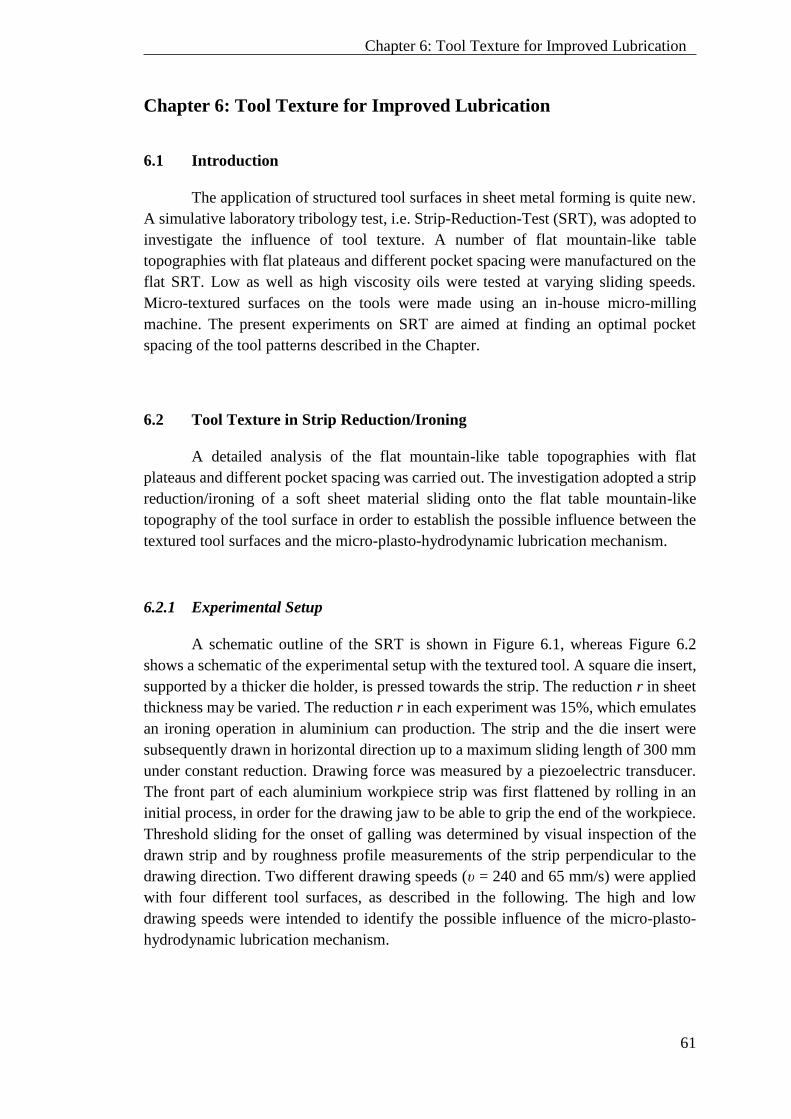
61
Chapter 6: Tool Texture for Improved Lubrication
Chapter 6: Tool Texture for Improved Lubrication
6.1 Introduction
The application of structured tool surfaces in sheet metal forming is quite new.
A simulative laboratory tribology test, i.e. Strip-Reduction-Test (SRT), was adopted to
investigate the influence of tool texture. A number of flat mountain-like table
topographies with flat plateaus and different pocket spacing were manufactured on the
flat SRT. Low as well as high viscosity oils were tested at varying sliding speeds.
Micro-textured surfaces on the tools were made using an in-house micro-milling
machine. The present experiments on SRT are aimed at finding an optimal pocket
spacing of the tool patterns described in the Chapter.
6.2 Tool Texture in Strip Reduction/Ironing
A detailed analysis of the flat mountain-like table topographies with flat
plateaus and different pocket spacing was carried out. The investigation adopted a strip
reduction/ironing of a soft sheet material sliding onto the flat table mountain-like
topography of the tool surface in order to establish the possible influence between the
textured tool surfaces and the micro-plasto-hydrodynamic lubrication mechanism.
6.2.1 Experimental Setup
A schematic outline of the SRT is shown in Figure 6.1, whereas Figure 6.2
shows a schematic of the experimental setup with the textured tool. A square die insert,
supported by a thicker die holder, is pressed towards the strip. The reduction r in sheet
thickness may be varied. The reduction r in each experiment was 15%, which emulates
an ironing operation in aluminium can production. The strip and the die insert were
subsequently drawn in horizontal direction up to a maximum sliding length of 300 mm
under constant reduction. Drawing force was measured by a piezoelectric transducer.
The front part of each aluminium workpiece strip was first flattened by rolling in an
initial process, in order for the drawing jaw to be able to grip the end of the workpiece.
Threshold sliding for the onset of galling was determined by visual inspection of the
drawn strip and by roughness profile measurements of the strip perpendicular to the
drawing direction. Two different drawing speeds (υ = 240 and 65 mm/s) were applied
with four different tool surfaces, as described in the following. The high and low
drawing speeds were intended to identify the possible influence of the micro-plasto-
hydrodynamic lubrication mechanism.

62
Chapter 6: Tool Texture for Improved Lubrication
Figure 6.1: The strip reduction test. Detailed drawings are shown in Appendix E1.
Figure 6.2: Schematic of the experiment with textured tool surface. The black triangles
stand for a fixed support (a fixed press table, as shown in Figure 6.1).
6.2.2 Manufacturing of Surface Textures
A great number of surface texturing techniques are available for the texturing
of hard tool materials, such as combined milling, grinding, and manual polishing [47],
combined turning and Robot Assisted Polishing (RAP) [80], chemical etching [81],
rolling ball indentation [49], and laser radiation [50][51]. In this study, high-speed hard
machining combined with manual polishing was chosen as manufacturing method.
Figure 6.3 shows the process sequence for the manufacturing of a textured tool
surface starting with the plane tool surface being lapped for ensuring the flatness of the
die insert for alignment in the milling machine. Then, the tool surface was milled to Ra
= 0.14 µm by the five-axis high speed milling machine, Mikron HSM 400U LP shown
in Figure 6.4. After this, the transverse pocket geometry was machined with the
previously mentioned milling tool running at 42,000 rpm and a feed of 600 mm/min.
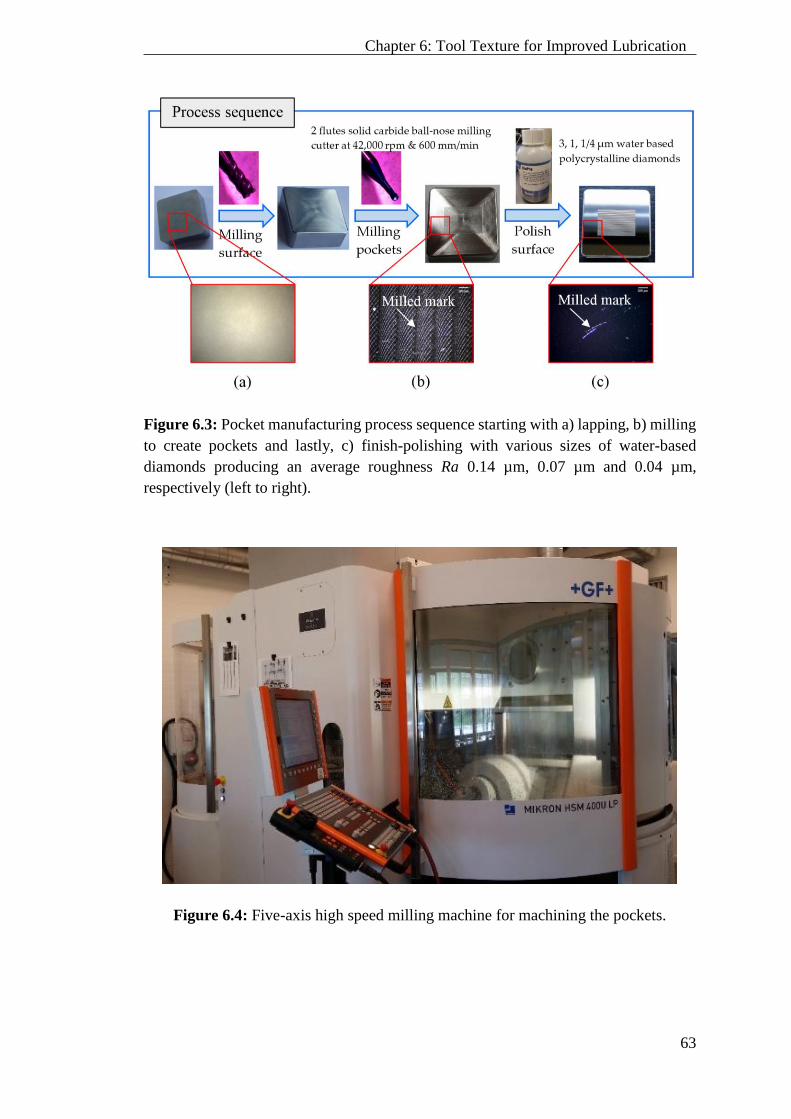
63
Chapter 6: Tool Texture for Improved Lubrication
Figure 6.3: Pocket manufacturing process sequence starting with a) lapping, b) milling
to create pockets and lastly, c) finish-polishing with various sizes of water-based
diamonds producing an average roughness Ra 0.14 µm, 0.07 µm and 0.04 µm,
respectively (left to right).
Figure 6.4: Five-axis high speed milling machine for machining the pockets.

64
Chapter 6: Tool Texture for Improved Lubrication
6.2.2.1 Surface Texture Parameters
Two surface texture features are important parameters to promote the micro-
hydrodynamic lubrication mechanism [20]; these are (1) small pocket angle γ and (2)
shallow pocket depth d, see Figure 6.5. The pocket angle γ and the pocket depth d were
chosen to be 5° and 0.01 mm, respectively. The small values of the pocket angle γ and
the pocket depth d requires a large radius R of the milling tool for machining the pocket.
The surface texture parameters can be calculated by Equations 6.1 and 6.2.
tan 𝛾 =𝑑
𝑎 (6.1)
𝑅2 = 𝑎2 + 𝐻2 = 𝑎2 + (𝑅 − 𝑑)2 (6.2)
Figure 6.5: Selection of milling tool based on lubricant pocket geometry.
Figure 6.6 shows a schematic of the SRT die insert consisting of a deformation
region (X x Y = 11.5 mm x 20 mm) and the transverse pocket length y = 16 mm. A
TiAl70 coated milling tool having a two-flute solid carbide ball-nose and a radius R of
1.25 mm was used for machining the transverse flat-bottomed lubricant pockets in the
surface of the hardened tool, see Figure 6.7. Three different inserts where
manufactured, the only difference being the distance between the pockets x. Table 6.1
lists the surface texture parameters for the SRT tool in which varying distance between
pockets x = 0.23, 0.46 and 0.92 mm gave contact area ratios Aro / Ao = 60, 74 and 84 %,
respectively.
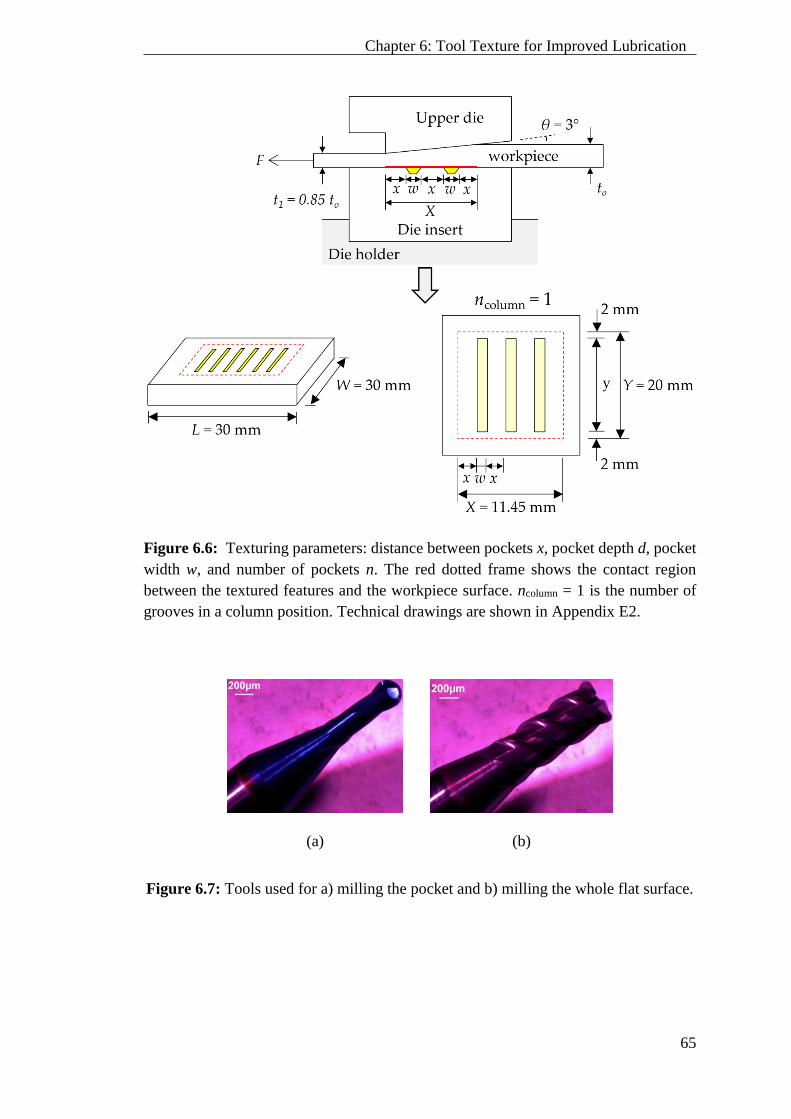
65
Chapter 6: Tool Texture for Improved Lubrication
Figure 6.6: Texturing parameters: distance between pockets x, pocket depth d, pocket
width w, and number of pockets n. The red dotted frame shows the contact region
between the textured features and the workpiece surface. ncolumn = 1 is the number of
grooves in a column position. Technical drawings are shown in Appendix E2.
(a) (b)
Figure 6.7: Tools used for a) milling the pocket and b) milling the whole flat surface.
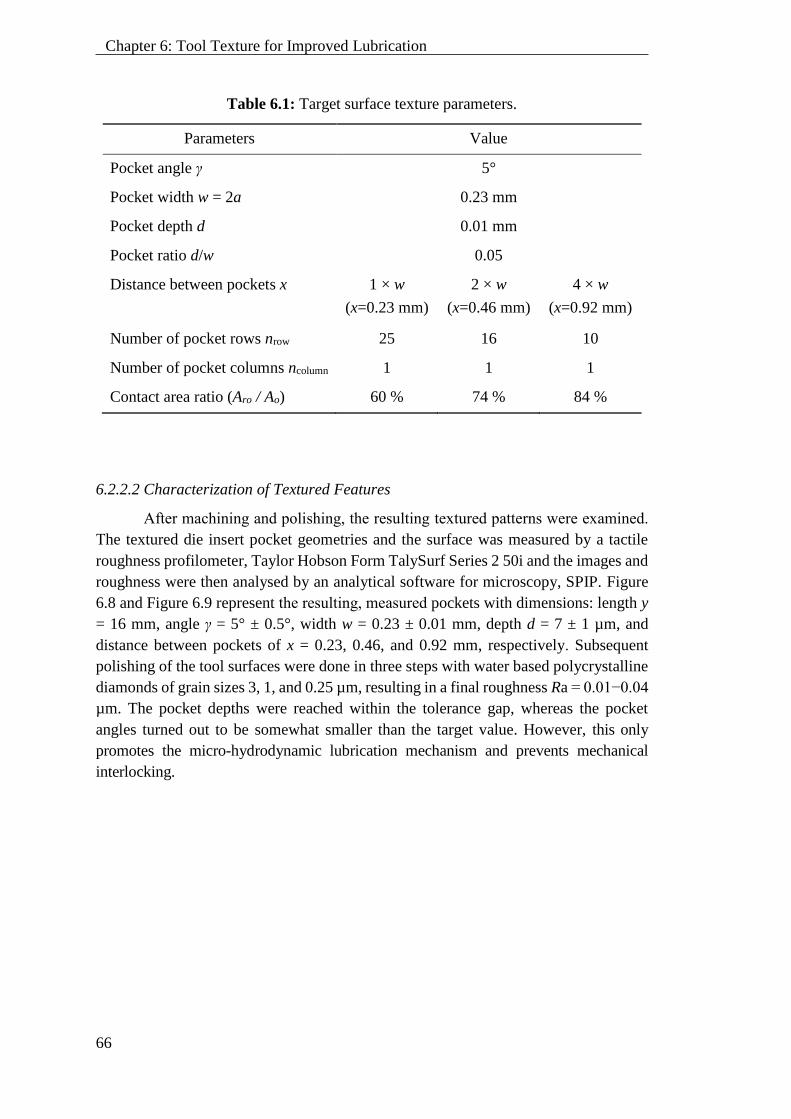
66
Chapter 6: Tool Texture for Improved Lubrication
Table 6.1: Target surface texture parameters.
Parameters Value
Pocket angle γ 5°
Pocket width w = 2a 0.23 mm
Pocket depth d 0.01 mm
Pocket ratio d/w 0.05
Distance between pockets x 1 × w 2 × w 4 × w
(x=0.23 mm) (x=0.46 mm) (x=0.92 mm)
Number of pocket rows nrow 25 16 10
Number of pocket columns ncolumn 1 1 1
Contact area ratio (Aro / Ao) 60 % 74 % 84 %
6.2.2.2 Characterization of Textured Features
After machining and polishing, the resulting textured patterns were examined.
The textured die insert pocket geometries and the surface was measured by a tactile
roughness profilometer, Taylor Hobson Form TalySurf Series 2 50i and the images and
roughness were then analysed by an analytical software for microscopy, SPIP. Figure
6.8 and Figure 6.9 represent the resulting, measured pockets with dimensions: length y
= 16 mm, angle γ = 5° ± 0.5°, width w = 0.23 ± 0.01 mm, depth d = 7 ± 1 µm, and
distance between pockets of x = 0.23, 0.46, and 0.92 mm, respectively. Subsequent
polishing of the tool surfaces were done in three steps with water based polycrystalline
diamonds of grain sizes 3, 1, and 0.25 µm, resulting in a final roughness Ra = 0.01−0.04
µm. The pocket depths were reached within the tolerance gap, whereas the pocket
angles turned out to be somewhat smaller than the target value. However, this only
promotes the micro-hydrodynamic lubrication mechanism and prevents mechanical
interlocking.

67
Chapter 6: Tool Texture for Improved Lubrication
(a) (b) (c) (d)
Figure 6.8: Die inserts with a) smooth surface as reference, and with varying pocket
interspacing x of b) 0.23mm, c) 0.46mm and d) 0.92mm. The flat plateaus were polished
down to a roughness Ra 0.01 – 0.04 µm.
Figure 6.9: Textured die insert pocket geometries.
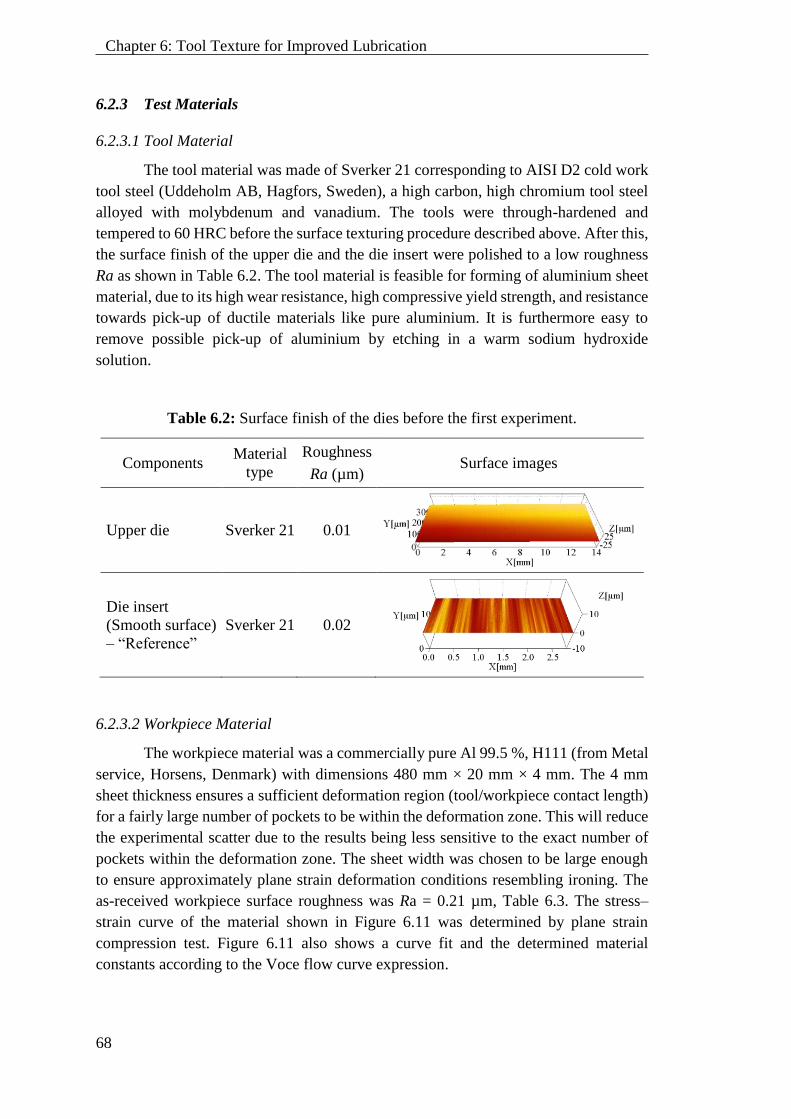
68
Chapter 6: Tool Texture for Improved Lubrication
6.2.3 Test Materials
6.2.3.1 Tool Material
The tool material was made of Sverker 21 corresponding to AISI D2 cold work
tool steel (Uddeholm AB, Hagfors, Sweden), a high carbon, high chromium tool steel
alloyed with molybdenum and vanadium. The tools were through-hardened and
tempered to 60 HRC before the surface texturing procedure described above. After this,
the surface finish of the upper die and the die insert were polished to a low roughness
Ra as shown in Table 6.2. The tool material is feasible for forming of aluminium sheet
material, due to its high wear resistance, high compressive yield strength, and resistance
towards pick-up of ductile materials like pure aluminium. It is furthermore easy to
remove possible pick-up of aluminium by etching in a warm sodium hydroxide
solution.
Table 6.2: Surface finish of the dies before the first experiment.
Components Material
type
Roughness
Ra (µm) Surface images
Upper die Sverker 21 0.01
Die insert
(Smooth surface)
– “Reference”
Sverker 21 0.02
6.2.3.2 Workpiece Material
The workpiece material was a commercially pure Al 99.5 %, H111 (from Metal
service, Horsens, Denmark) with dimensions 480 mm × 20 mm × 4 mm. The 4 mm
sheet thickness ensures a sufficient deformation region (tool/workpiece contact length)
for a fairly large number of pockets to be within the deformation zone. This will reduce
the experimental scatter due to the results being less sensitive to the exact number of
pockets within the deformation zone. The sheet width was chosen to be large enough
to ensure approximately plane strain deformation conditions resembling ironing. The
as-received workpiece surface roughness was Ra = 0.21 µm, Table 6.3. The stress–
strain curve of the material shown in Figure 6.11 was determined by plane strain
compression test. Figure 6.11 also shows a curve fit and the determined material
constants according to the Voce flow curve expression.
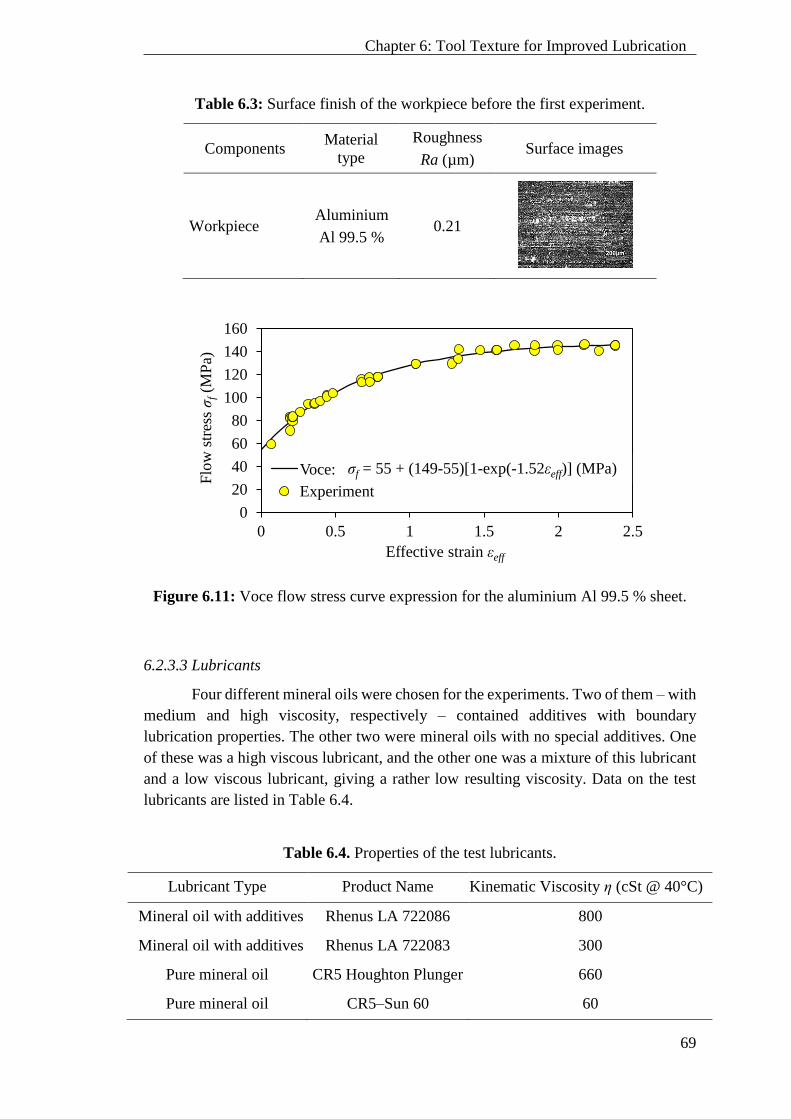
69
Chapter 6: Tool Texture for Improved Lubrication
Table 6.3: Surface finish of the workpiece before the first experiment.
Components Material
type
Roughness
Ra (µm) Surface images
Workpiece Aluminium
Al 99.5 % 0.21
Figure 6.11: Voce flow stress curve expression for the aluminium Al 99.5 % sheet.
6.2.3.3 Lubricants
Four different mineral oils were chosen for the experiments. Two of them – with
medium and high viscosity, respectively – contained additives with boundary
lubrication properties. The other two were mineral oils with no special additives. One
of these was a high viscous lubricant, and the other one was a mixture of this lubricant
and a low viscous lubricant, giving a rather low resulting viscosity. Data on the test
lubricants are listed in Table 6.4.
Table 6.4. Properties of the test lubricants.
Lubricant Type Product Name Kinematic Viscosity η (cSt @ 40°C)
Mineral oil with additives Rhenus LA 722086 800
Mineral oil with additives Rhenus LA 722083 300
Pure mineral oil CR5 Houghton Plunger 660
Pure mineral oil CR5–Sun 60 60
0
20
40
60
80
100
120
140
160
0 0.5 1 1.5 2 2.5
Flo
w s
tres
s σ
f(M
Pa)
Effective strain εeff
Voce: σ=55+(149-55)(1-exp(-1.52ε)) [MPa]
Experiment
σf = 55 + (149-55)[1-exp(-1.52εeff)] (MPa)
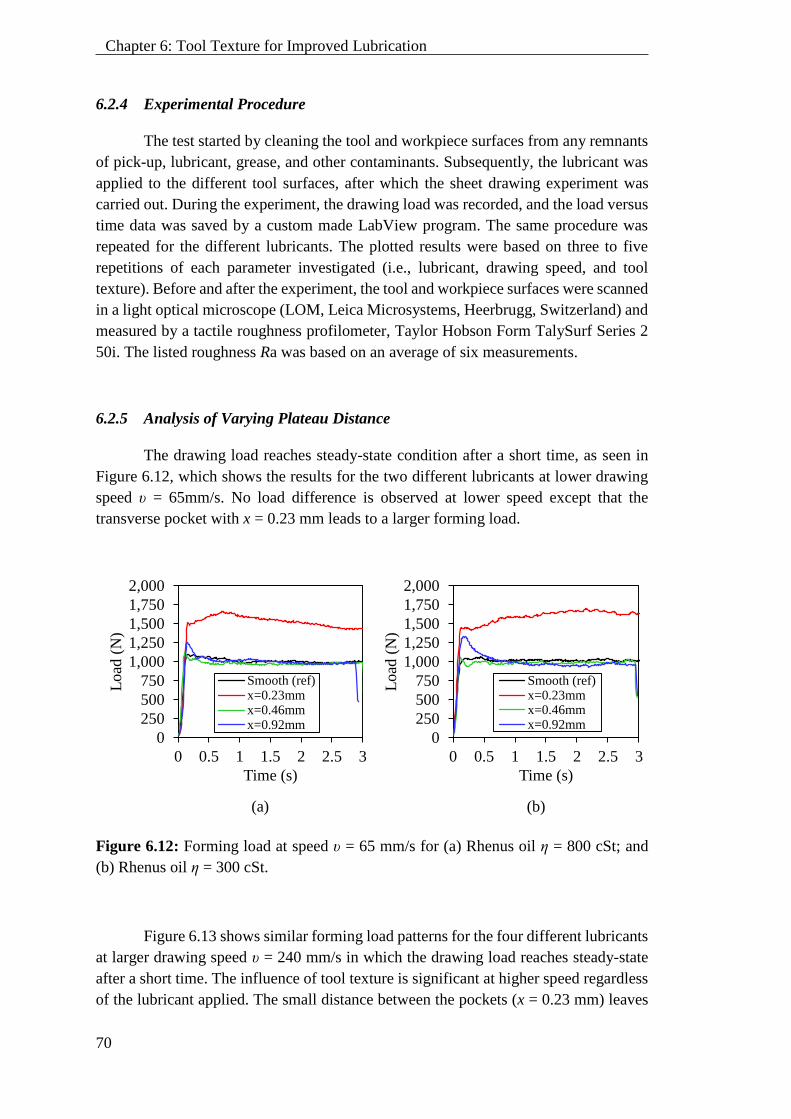
70
Chapter 6: Tool Texture for Improved Lubrication
6.2.4 Experimental Procedure
The test started by cleaning the tool and workpiece surfaces from any remnants
of pick-up, lubricant, grease, and other contaminants. Subsequently, the lubricant was
applied to the different tool surfaces, after which the sheet drawing experiment was
carried out. During the experiment, the drawing load was recorded, and the load versus
time data was saved by a custom made LabView program. The same procedure was
repeated for the different lubricants. The plotted results were based on three to five
repetitions of each parameter investigated (i.e., lubricant, drawing speed, and tool
texture). Before and after the experiment, the tool and workpiece surfaces were scanned
in a light optical microscope (LOM, Leica Microsystems, Heerbrugg, Switzerland) and
measured by a tactile roughness profilometer, Taylor Hobson Form TalySurf Series 2
50i. The listed roughness Ra was based on an average of six measurements.
6.2.5 Analysis of Varying Plateau Distance
The drawing load reaches steady-state condition after a short time, as seen in
Figure 6.12, which shows the results for the two different lubricants at lower drawing
speed υ = 65mm/s. No load difference is observed at lower speed except that the
transverse pocket with x = 0.23 mm leads to a larger forming load.
(a) (b)
Figure 6.12: Forming load at speed υ = 65 mm/s for (a) Rhenus oil η = 800 cSt; and
(b) Rhenus oil η = 300 cSt.
Figure 6.13 shows similar forming load patterns for the four different lubricants
at larger drawing speed υ = 240 mm/s in which the drawing load reaches steady-state
after a short time. The influence of tool texture is significant at higher speed regardless
of the lubricant applied. The small distance between the pockets (x = 0.23 mm) leaves
0
250
500
750
1,000
1,250
1,500
1,750
2,000
0 0.5 1 1.5 2 2.5 3
Load
(N
)
Time (s)
Smooth (ref)x=0.23mmx=0.46mmx=0.92mm
0
250
500
750
1,000
1,250
1,500
1,750
2,000
0 0.5 1 1.5 2 2.5 3
Load
(N
)
Time (s)
Smooth (ref)x=0.23mmx=0.46mmx=0.92mm
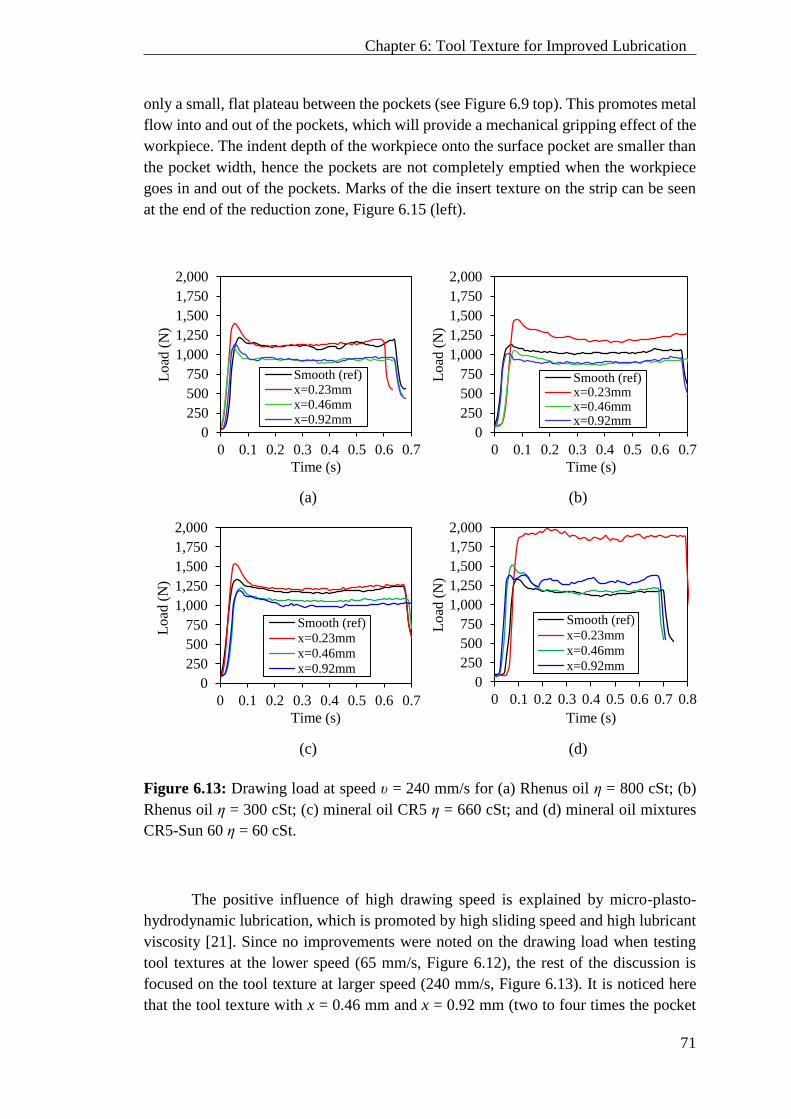
71
Chapter 6: Tool Texture for Improved Lubrication
only a small, flat plateau between the pockets (see Figure 6.9 top). This promotes metal
flow into and out of the pockets, which will provide a mechanical gripping effect of the
workpiece. The indent depth of the workpiece onto the surface pocket are smaller than
the pocket width, hence the pockets are not completely emptied when the workpiece
goes in and out of the pockets. Marks of the die insert texture on the strip can be seen
at the end of the reduction zone, Figure 6.15 (left).
(a) (b)
(c) (d)
Figure 6.13: Drawing load at speed υ = 240 mm/s for (a) Rhenus oil η = 800 cSt; (b)
Rhenus oil η = 300 cSt; (c) mineral oil CR5 η = 660 cSt; and (d) mineral oil mixtures
CR5-Sun 60 η = 60 cSt.
The positive influence of high drawing speed is explained by micro-plasto-
hydrodynamic lubrication, which is promoted by high sliding speed and high lubricant
viscosity [21]. Since no improvements were noted on the drawing load when testing
tool textures at the lower speed (65 mm/s, Figure 6.12), the rest of the discussion is
focused on the tool texture at larger speed (240 mm/s, Figure 6.13). It is noticed here
that the tool texture with x = 0.46 mm and x = 0.92 mm (two to four times the pocket
0
250
500
750
1,000
1,250
1,500
1,750
2,000
0 0.1 0.2 0.3 0.4 0.5 0.6 0.7
Lo
ad (
N)
Time (s)
Smooth (ref)x=0.23mmx=0.46mmx=0.92mm
0
250
500
750
1,000
1,250
1,500
1,750
2,000
0 0.1 0.2 0.3 0.4 0.5 0.6 0.7L
oad
(N
)
Time (s)
Smooth (ref)x=0.23mmx=0.46mmx=0.92mm
0
250
500
750
1,000
1,250
1,500
1,750
2,000
0 0.1 0.2 0.3 0.4 0.5 0.6 0.7
Load
(N
)
Time (s)
Smooth (ref)
x=0.23mm
x=0.46mm
x=0.92mm0
250
500
750
1,000
1,250
1,500
1,750
2,000
0 0.1 0.2 0.3 0.4 0.5 0.6 0.7 0.8
Load
(N
)
Time (s)
Smooth (ref)
x=0.23mm
x=0.46mm
x=0.92mm
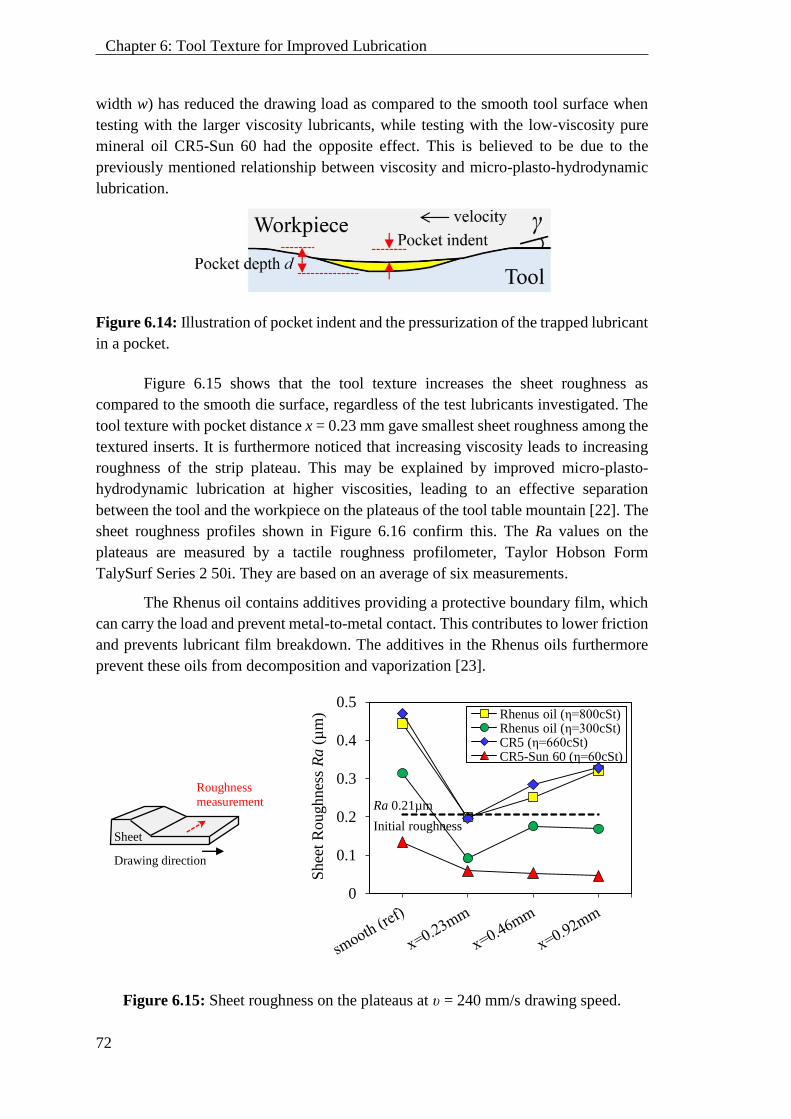
72
Chapter 6: Tool Texture for Improved Lubrication
width w) has reduced the drawing load as compared to the smooth tool surface when
testing with the larger viscosity lubricants, while testing with the low-viscosity pure
mineral oil CR5-Sun 60 had the opposite effect. This is believed to be due to the
previously mentioned relationship between viscosity and micro-plasto-hydrodynamic
lubrication.
Figure 6.14: Illustration of pocket indent and the pressurization of the trapped lubricant
in a pocket.
Figure 6.15 shows that the tool texture increases the sheet roughness as
compared to the smooth die surface, regardless of the test lubricants investigated. The
tool texture with pocket distance x = 0.23 mm gave smallest sheet roughness among the
textured inserts. It is furthermore noticed that increasing viscosity leads to increasing
roughness of the strip plateau. This may be explained by improved micro-plasto-
hydrodynamic lubrication at higher viscosities, leading to an effective separation
between the tool and the workpiece on the plateaus of the tool table mountain [22]. The
sheet roughness profiles shown in Figure 6.16 confirm this. The Ra values on the
plateaus are measured by a tactile roughness profilometer, Taylor Hobson Form
TalySurf Series 2 50i. They are based on an average of six measurements.
The Rhenus oil contains additives providing a protective boundary film, which
can carry the load and prevent metal-to-metal contact. This contributes to lower friction
and prevents lubricant film breakdown. The additives in the Rhenus oils furthermore
prevent these oils from decomposition and vaporization [23].
Figure 6.15: Sheet roughness on the plateaus at υ = 240 mm/s drawing speed.
0
0.1
0.2
0.3
0.4
0.5
Shee
t R
oughnes
s R
a(µ
m) Rhenus oil (η=800cSt)
Rhenus oil (η=300cSt)CR5 (η=660cSt)CR5-Sun 60 (η=60cSt)
Ra 0.21µm
Initial roughness
Roughness
measurement
Sheet
Drawing direction
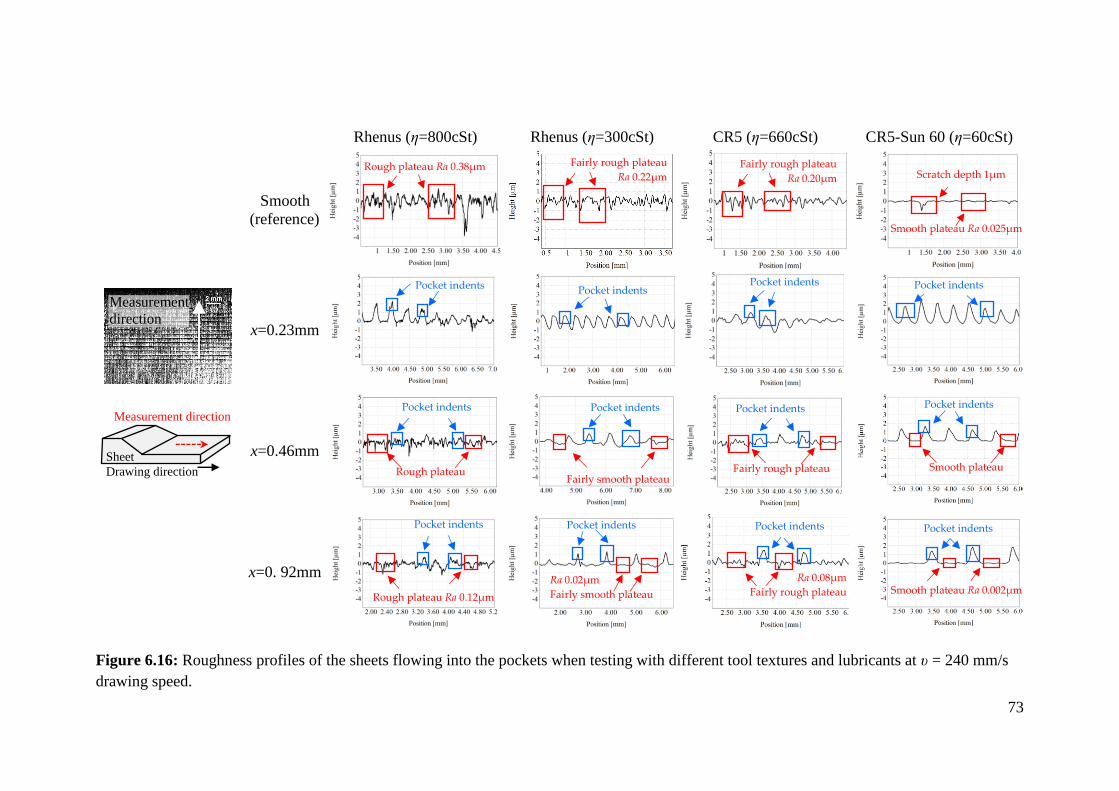
73
Rhenus (η=800cSt) Rhenus (η=300cSt) CR5 (η=660cSt) CR5-Sun 60 (η=60cSt)
Smooth
(reference)
x=0.23mm
x=0.46mm
x=0. 92mm
Figure 6.16: Roughness profiles of the sheets flowing into the pockets when testing with different tool textures and lubricants at υ = 240 mm/s
drawing speed.
Measurement direction
Sheet
Drawing direction
Fairly rough plateau
Ra 0.20µm
Pocket indents
Pocket indents
Rough plateau Ra 0.38µm
Pocket indents
Pocket indents
Rough plateau
Pocket indents
Rough plateau Ra 0.12µm
Fairly rough plateau
Ra 0.22µm
Pocket indents
Fairly smooth plateau
Pocket indents
Ra 0.02µm
Fairly smooth plateau
Smooth plateau Ra 0.025µm
Scratch depth 1µm
Pocket indents
Smooth plateau
Pocket indents
Smooth plateau Ra 0.002µm
Measurement
direction
Pocket indents
Fairly rough plateau
Pocket indents
Pocket indents
Ra 0.08µm
Fairly rough plateau
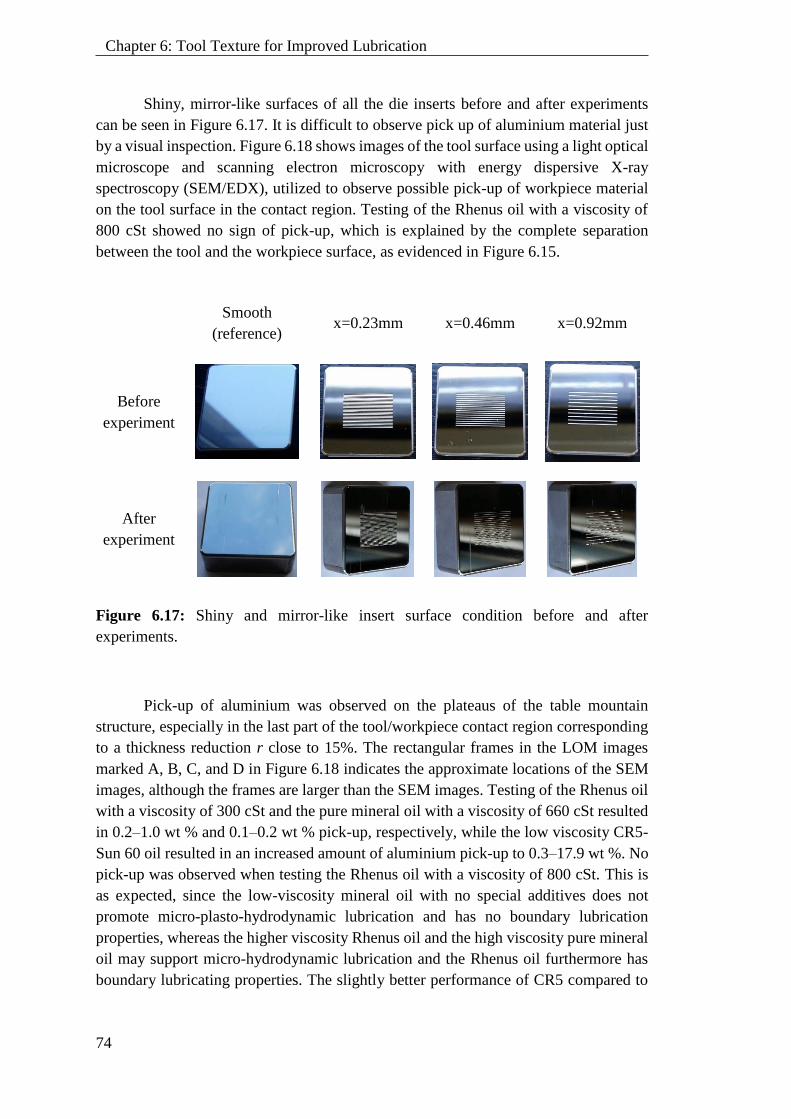
74
Chapter 6: Tool Texture for Improved Lubrication
Shiny, mirror-like surfaces of all the die inserts before and after experiments
can be seen in Figure 6.17. It is difficult to observe pick up of aluminium material just
by a visual inspection. Figure 6.18 shows images of the tool surface using a light optical
microscope and scanning electron microscopy with energy dispersive X-ray
spectroscopy (SEM/EDX), utilized to observe possible pick-up of workpiece material
on the tool surface in the contact region. Testing of the Rhenus oil with a viscosity of
800 cSt showed no sign of pick-up, which is explained by the complete separation
between the tool and the workpiece surface, as evidenced in Figure 6.15.
Smooth
(reference) x=0.23mm x=0.46mm x=0.92mm
Before
experiment
After
experiment
Figure 6.17: Shiny and mirror-like insert surface condition before and after
experiments.
Pick-up of aluminium was observed on the plateaus of the table mountain
structure, especially in the last part of the tool/workpiece contact region corresponding
to a thickness reduction r close to 15%. The rectangular frames in the LOM images
marked A, B, C, and D in Figure 6.18 indicates the approximate locations of the SEM
images, although the frames are larger than the SEM images. Testing of the Rhenus oil
with a viscosity of 300 cSt and the pure mineral oil with a viscosity of 660 cSt resulted
in 0.2–1.0 wt % and 0.1–0.2 wt % pick-up, respectively, while the low viscosity CR5-
Sun 60 oil resulted in an increased amount of aluminium pick-up to 0.3–17.9 wt %. No
pick-up was observed when testing the Rhenus oil with a viscosity of 800 cSt. This is
as expected, since the low-viscosity mineral oil with no special additives does not
promote micro-plasto-hydrodynamic lubrication and has no boundary lubrication
properties, whereas the higher viscosity Rhenus oil and the high viscosity pure mineral
oil may support micro-hydrodynamic lubrication and the Rhenus oil furthermore has
boundary lubricating properties. The slightly better performance of CR5 compared to
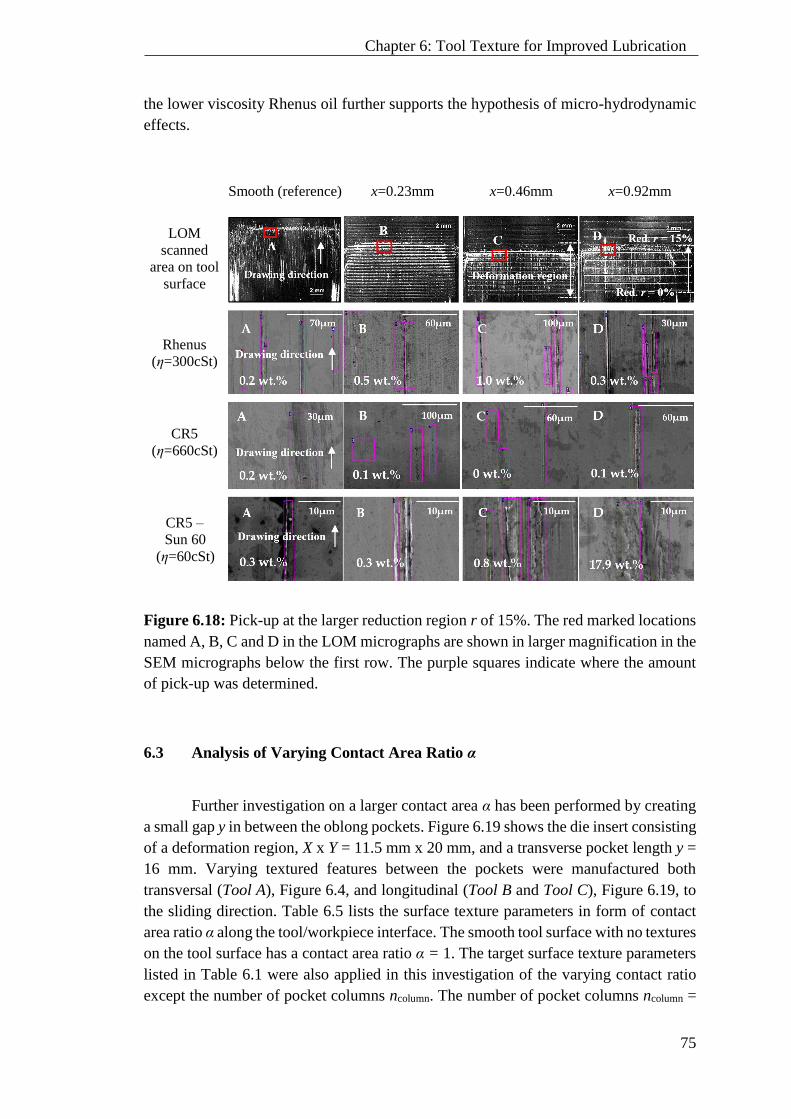
75
Chapter 6: Tool Texture for Improved Lubrication
the lower viscosity Rhenus oil further supports the hypothesis of micro-hydrodynamic
effects.
Smooth (reference) x=0.23mm x=0.46mm x=0.92mm
LOM
scanned
area on tool
surface
Rhenus
(η=300cSt)
CR5
(η=660cSt)
CR5 –
Sun 60
(η=60cSt)
Figure 6.18: Pick-up at the larger reduction region r of 15%. The red marked locations
named A, B, C and D in the LOM micrographs are shown in larger magnification in the
SEM micrographs below the first row. The purple squares indicate where the amount
of pick-up was determined.
6.3 Analysis of Varying Contact Area Ratio α
Further investigation on a larger contact area α has been performed by creating
a small gap y in between the oblong pockets. Figure 6.19 shows the die insert consisting
of a deformation region, X x Y = 11.5 mm x 20 mm, and a transverse pocket length y =
16 mm. Varying textured features between the pockets were manufactured both
transversal (Tool A), Figure 6.4, and longitudinal (Tool B and Tool C), Figure 6.19, to
the sliding direction. Table 6.5 lists the surface texture parameters in form of contact
area ratio α along the tool/workpiece interface. The smooth tool surface with no textures
on the tool surface has a contact area ratio α = 1. The target surface texture parameters
listed in Table 6.1 were also applied in this investigation of the varying contact ratio
except the number of pocket columns ncolumn. The number of pocket columns ncolumn =
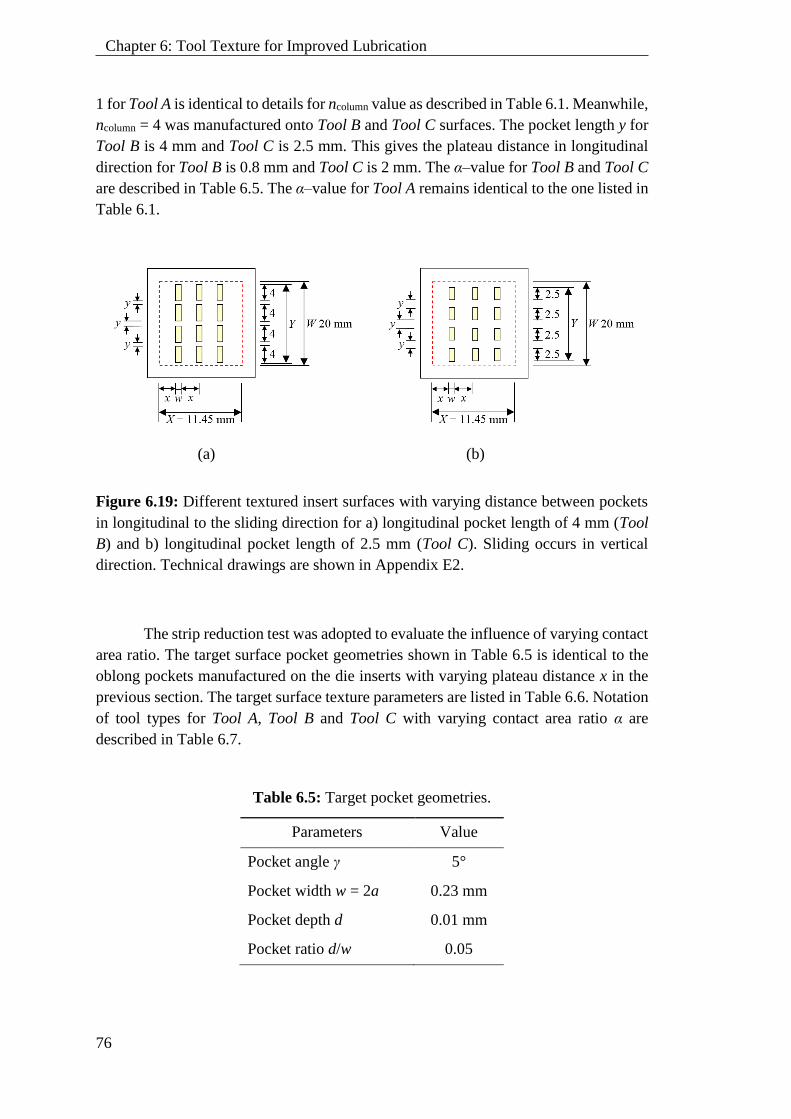
76
Chapter 6: Tool Texture for Improved Lubrication
1 for Tool A is identical to details for ncolumn value as described in Table 6.1. Meanwhile,
ncolumn = 4 was manufactured onto Tool B and Tool C surfaces. The pocket length y for
Tool B is 4 mm and Tool C is 2.5 mm. This gives the plateau distance in longitudinal
direction for Tool B is 0.8 mm and Tool C is 2 mm. The α–value for Tool B and Tool C
are described in Table 6.5. The α–value for Tool A remains identical to the one listed in
Table 6.1.
(a) (b)
Figure 6.19: Different textured insert surfaces with varying distance between pockets
in longitudinal to the sliding direction for a) longitudinal pocket length of 4 mm (Tool
B) and b) longitudinal pocket length of 2.5 mm (Tool C). Sliding occurs in vertical
direction. Technical drawings are shown in Appendix E2.
The strip reduction test was adopted to evaluate the influence of varying contact
area ratio. The target surface pocket geometries shown in Table 6.5 is identical to the
oblong pockets manufactured on the die inserts with varying plateau distance x in the
previous section. The target surface texture parameters are listed in Table 6.6. Notation
of tool types for Tool A, Tool B and Tool C with varying contact area ratio α are
described in Table 6.7.
Table 6.5: Target pocket geometries.
Parameters Value
Pocket angle γ 5°
Pocket width w = 2a 0.23 mm
Pocket depth d 0.01 mm
Pocket ratio d/w 0.05
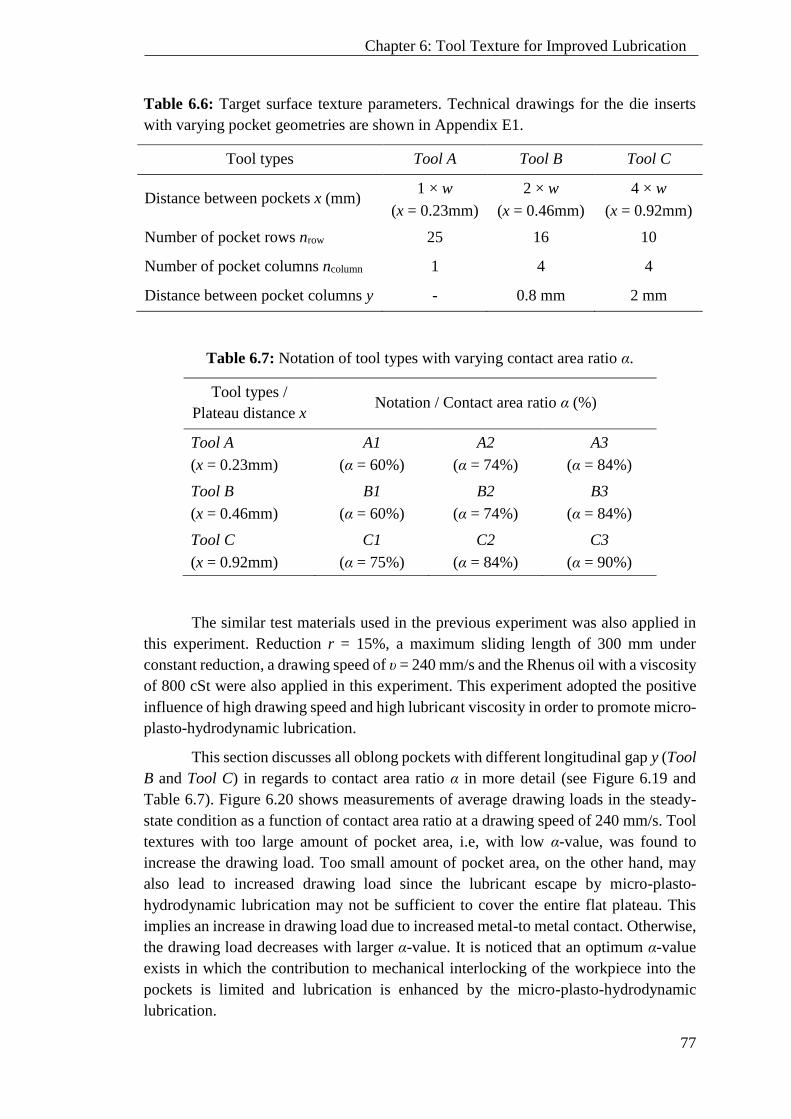
77
Chapter 6: Tool Texture for Improved Lubrication
Table 6.6: Target surface texture parameters. Technical drawings for the die inserts
with varying pocket geometries are shown in Appendix E1.
Tool types Tool A Tool B Tool C
Distance between pockets x (mm) 1 × w
(x = 0.23mm)
2 × w
(x = 0.46mm)
4 × w
(x = 0.92mm)
Number of pocket rows nrow 25 16 10
Number of pocket columns ncolumn 1 4 4
Distance between pocket columns y - 0.8 mm 2 mm
Table 6.7: Notation of tool types with varying contact area ratio α.
Tool types /
Plateau distance x Notation / Contact area ratio α (%)
Tool A
(x = 0.23mm)
A1
(α = 60%)
A2
(α = 74%)
A3
(α = 84%)
Tool B
(x = 0.46mm)
B1
(α = 60%)
B2
(α = 74%)
B3
(α = 84%)
Tool C
(x = 0.92mm)
C1
(α = 75%)
C2
(α = 84%)
C3
(α = 90%)
The similar test materials used in the previous experiment was also applied in
this experiment. Reduction r = 15%, a maximum sliding length of 300 mm under
constant reduction, a drawing speed of υ = 240 mm/s and the Rhenus oil with a viscosity
of 800 cSt were also applied in this experiment. This experiment adopted the positive
influence of high drawing speed and high lubricant viscosity in order to promote micro-
plasto-hydrodynamic lubrication.
This section discusses all oblong pockets with different longitudinal gap y (Tool
B and Tool C) in regards to contact area ratio α in more detail (see Figure 6.19 and
Table 6.7). Figure 6.20 shows measurements of average drawing loads in the steady-
state condition as a function of contact area ratio at a drawing speed of 240 mm/s. Tool
textures with too large amount of pocket area, i.e, with low α-value, was found to
increase the drawing load. Too small amount of pocket area, on the other hand, may
also lead to increased drawing load since the lubricant escape by micro-plasto-
hydrodynamic lubrication may not be sufficient to cover the entire flat plateau. This
implies an increase in drawing load due to increased metal-to metal contact. Otherwise,
the drawing load decreases with larger α-value. It is noticed that an optimum α-value
exists in which the contribution to mechanical interlocking of the workpiece into the
pockets is limited and lubrication is enhanced by the micro-plasto-hydrodynamic
lubrication.
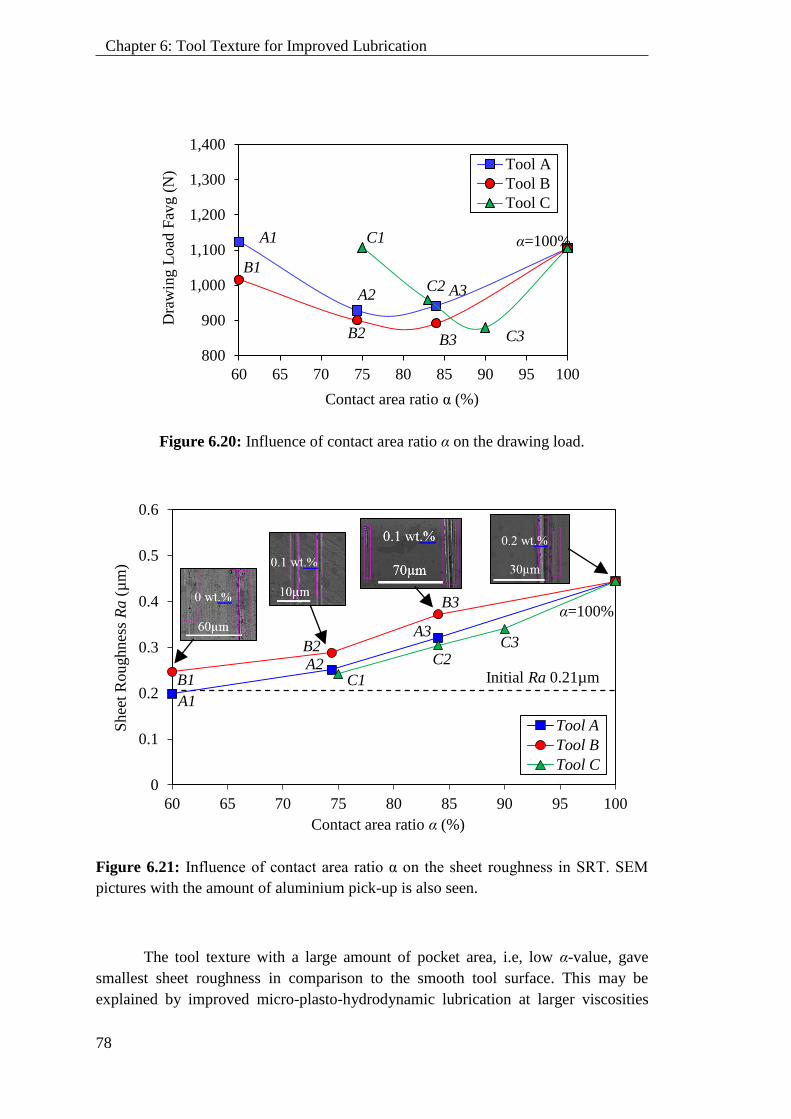
78
Chapter 6: Tool Texture for Improved Lubrication
Figure 6.20: Influence of contact area ratio α on the drawing load.
Figure 6.21: Influence of contact area ratio α on the sheet roughness in SRT. SEM
pictures with the amount of aluminium pick-up is also seen.
The tool texture with a large amount of pocket area, i.e, low α-value, gave
smallest sheet roughness in comparison to the smooth tool surface. This may be
explained by improved micro-plasto-hydrodynamic lubrication at larger viscosities
800
900
1,000
1,100
1,200
1,300
1,400
60 65 70 75 80 85 90 95 100
Dra
win
g L
oad
Fav
g (
N)
Contact area ratio α (%)
Tool A
Tool B
Tool C
B1
C1
0
0.1
0.2
0.3
0.4
0.5
0.6
60 65 70 75 80 85 90 95 100
Shee
t R
oughnes
s R
a(µ
m)
Contact area ratio α (%)
Tool A
Tool B
Tool C
Initial Ra 0.21µm
A1
B1
B2A2
C1
B3
A3
C2C3
α=100%
A1
A2
B2
C2 A3
B3 C3
α=100%

79
Chapter 6: Tool Texture for Improved Lubrication
leading to an effective separation between the tool and the workpiece on the plateaus
of the tool table mountain [30]. In addition, application of the Rhenus oil generates a
thin, protective film to separate the tool/workpiece interface. LOM images presented in
Figure 6.21 confirmed this, where almost no pick-up of aluminium is observed on the
plateaus of the table mountain structure.
6.4 Summary
A technique to improve resistivity towards galling by applying textured tool
surface topographies was investigated. Oblong shallow pockets with small pocket
angles, oriented perpendicular to the sliding direction with a distance of 2–4 times the
pocket width were tested. A strip reduction test, which emulates the tribological
conditions in an ironing process, was used for experimental measurements of friction
and determination of possible pick-up and galling. The study included testing of four
different lubricants—two plain mineral oils with a low and a high viscosity, and two
mineral-based oils with boundary lubrication additives having medium and high
viscosity. The results confirmed that the tool texture can lower friction and improve
lubrication performance in comparison to that of a fine polished tool surface when the
pocket distance is larger than the pocket width, which ensures a table mountain structure
of the tool topography. The tool textures were advantageous at greater sliding speeds,
when using higher viscosity oils, which facilitates the escape of trapped lubricant by
micro-plasto-hydrodynamic lubrication.

80
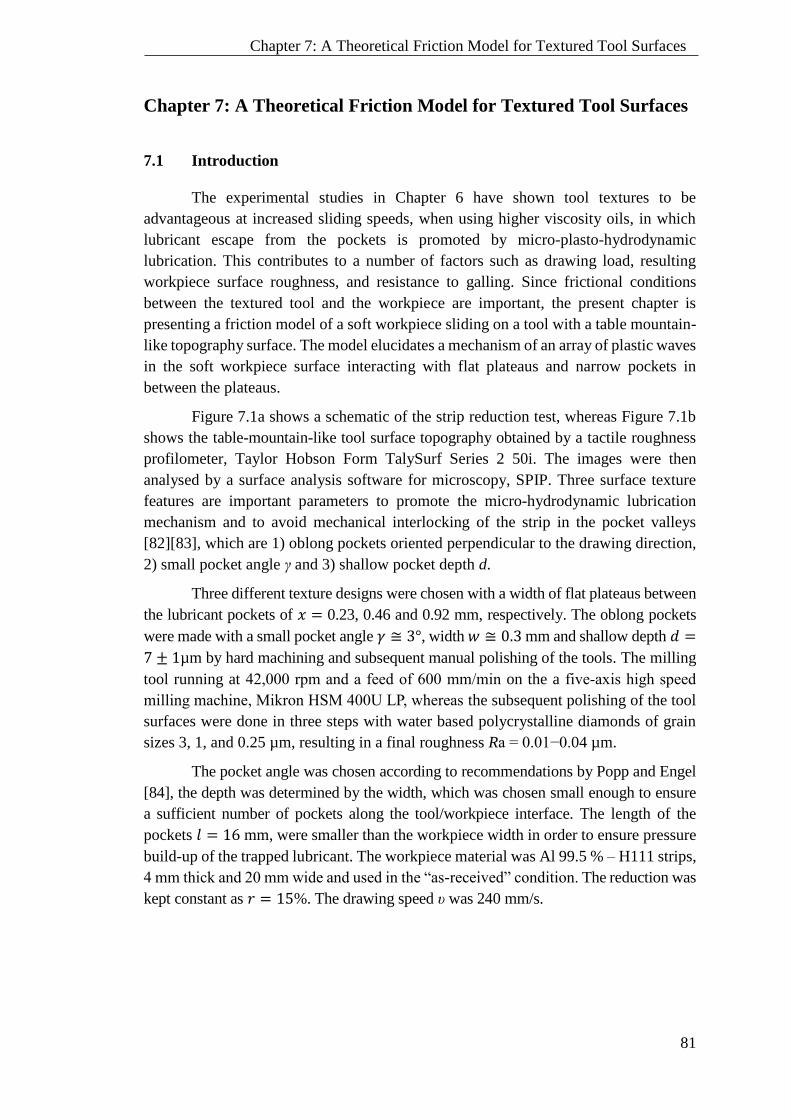
81
Chapter 7: A Theoretical Friction Model for Textured Tool Surfaces
Chapter 7: A Theoretical Friction Model for Textured Tool Surfaces
7.1 Introduction
The experimental studies in Chapter 6 have shown tool textures to be
advantageous at increased sliding speeds, when using higher viscosity oils, in which
lubricant escape from the pockets is promoted by micro-plasto-hydrodynamic
lubrication. This contributes to a number of factors such as drawing load, resulting
workpiece surface roughness, and resistance to galling. Since frictional conditions
between the textured tool and the workpiece are important, the present chapter is
presenting a friction model of a soft workpiece sliding on a tool with a table mountain-
like topography surface. The model elucidates a mechanism of an array of plastic waves
in the soft workpiece surface interacting with flat plateaus and narrow pockets in
between the plateaus.
Figure 7.1a shows a schematic of the strip reduction test, whereas Figure 7.1b
shows the table-mountain-like tool surface topography obtained by a tactile roughness
profilometer, Taylor Hobson Form TalySurf Series 2 50i. The images were then
analysed by a surface analysis software for microscopy, SPIP. Three surface texture
features are important parameters to promote the micro-hydrodynamic lubrication
mechanism and to avoid mechanical interlocking of the strip in the pocket valleys
[82][83], which are 1) oblong pockets oriented perpendicular to the drawing direction,
2) small pocket angle γ and 3) shallow pocket depth d.
Three different texture designs were chosen with a width of flat plateaus between
the lubricant pockets of 𝑥 = 0.23, 0.46 and 0.92 mm, respectively. The oblong pockets
were made with a small pocket angle 𝛾 ≅ 3°, width 𝑤 ≅ 0.3 mm and shallow depth 𝑑 =
7 ± 1µm by hard machining and subsequent manual polishing of the tools. The milling
tool running at 42,000 rpm and a feed of 600 mm/min on the a five-axis high speed
milling machine, Mikron HSM 400U LP, whereas the subsequent polishing of the tool
surfaces were done in three steps with water based polycrystalline diamonds of grain
sizes 3, 1, and 0.25 µm, resulting in a final roughness Ra = 0.01−0.04 µm.
The pocket angle was chosen according to recommendations by Popp and Engel
[84], the depth was determined by the width, which was chosen small enough to ensure
a sufficient number of pockets along the tool/workpiece interface. The length of the
pockets 𝑙 = 16 mm, were smaller than the workpiece width in order to ensure pressure
build-up of the trapped lubricant. The workpiece material was Al 99.5 % – H111 strips,
4 mm thick and 20 mm wide and used in the “as-received” condition. The reduction was
kept constant as 𝑟 = 15%. The drawing speed υ was 240 mm/s.
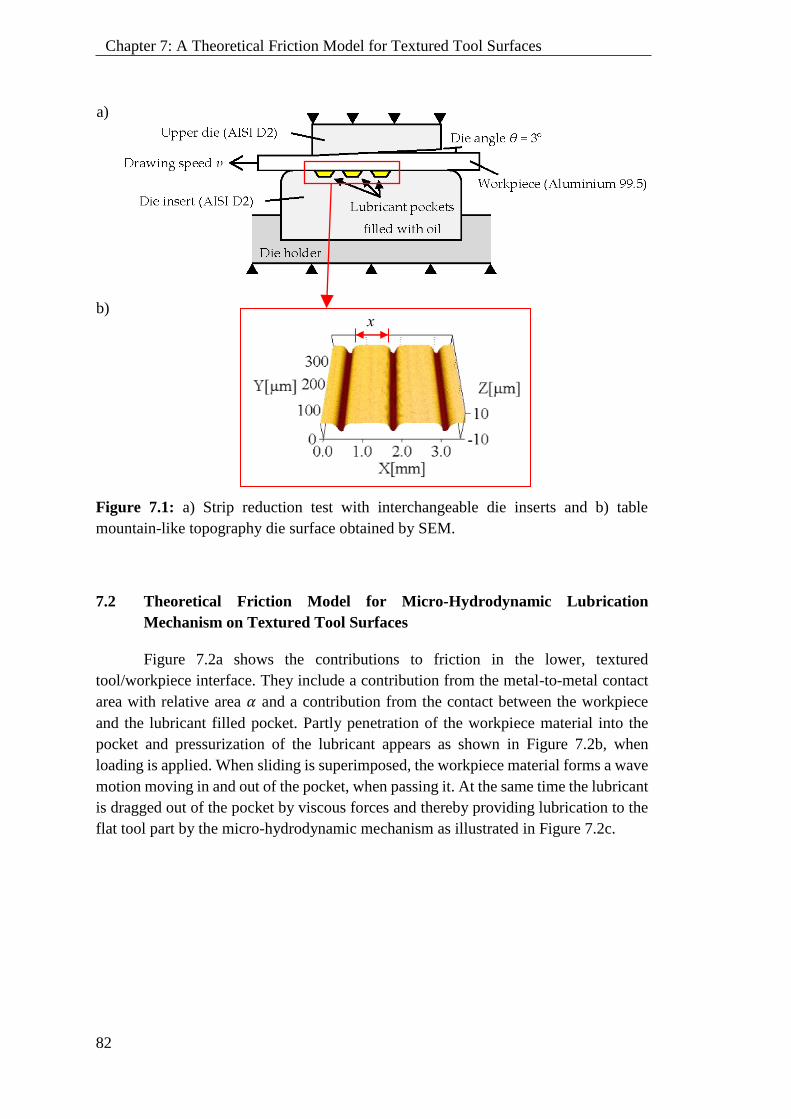
82
Chapter 7: A Theoretical Friction Model for Textured Tool Surfaces
a)
b)
Figure 7.1: a) Strip reduction test with interchangeable die inserts and b) table
mountain-like topography die surface obtained by SEM.
7.2 Theoretical Friction Model for Micro-Hydrodynamic Lubrication
Mechanism on Textured Tool Surfaces
Figure 7.2a shows the contributions to friction in the lower, textured
tool/workpiece interface. They include a contribution from the metal-to-metal contact
area with relative area 𝛼 and a contribution from the contact between the workpiece
and the lubricant filled pocket. Partly penetration of the workpiece material into the
pocket and pressurization of the lubricant appears as shown in Figure 7.2b, when
loading is applied. When sliding is superimposed, the workpiece material forms a wave
motion moving in and out of the pocket, when passing it. At the same time the lubricant
is dragged out of the pocket by viscous forces and thereby providing lubrication to the
flat tool part by the micro-hydrodynamic mechanism as illustrated in Figure 7.2c.
x
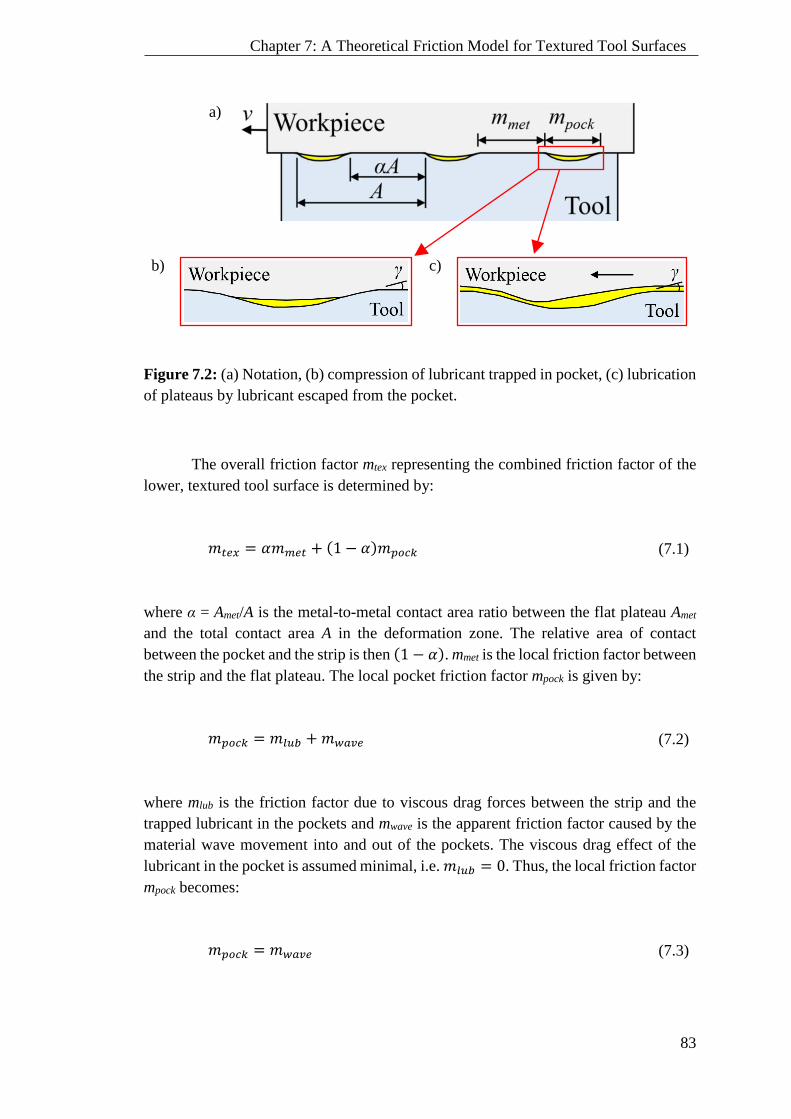
83
Chapter 7: A Theoretical Friction Model for Textured Tool Surfaces
a)
b)
c)
Figure 7.2: (a) Notation, (b) compression of lubricant trapped in pocket, (c) lubrication
of plateaus by lubricant escaped from the pocket.
The overall friction factor mtex representing the combined friction factor of the
lower, textured tool surface is determined by:
𝑚𝑡𝑒𝑥 = 𝛼𝑚𝑚𝑒𝑡 + (1 − 𝛼)𝑚𝑝𝑜𝑐𝑘 (7.1)
where α = Amet/A is the metal-to-metal contact area ratio between the flat plateau Amet
and the total contact area A in the deformation zone. The relative area of contact
between the pocket and the strip is then (1 − 𝛼). mmet is the local friction factor between
the strip and the flat plateau. The local pocket friction factor mpock is given by:
𝑚𝑝𝑜𝑐𝑘 = 𝑚𝑙𝑢𝑏 + 𝑚𝑤𝑎𝑣𝑒 (7.2)
where mlub is the friction factor due to viscous drag forces between the strip and the
trapped lubricant in the pockets and mwave is the apparent friction factor caused by the
material wave movement into and out of the pockets. The viscous drag effect of the
lubricant in the pocket is assumed minimal, i.e. 𝑚𝑙𝑢𝑏 = 0. Thus, the local friction factor
mpock becomes:
𝑚𝑝𝑜𝑐𝑘 = 𝑚𝑤𝑎𝑣𝑒 (7.3)
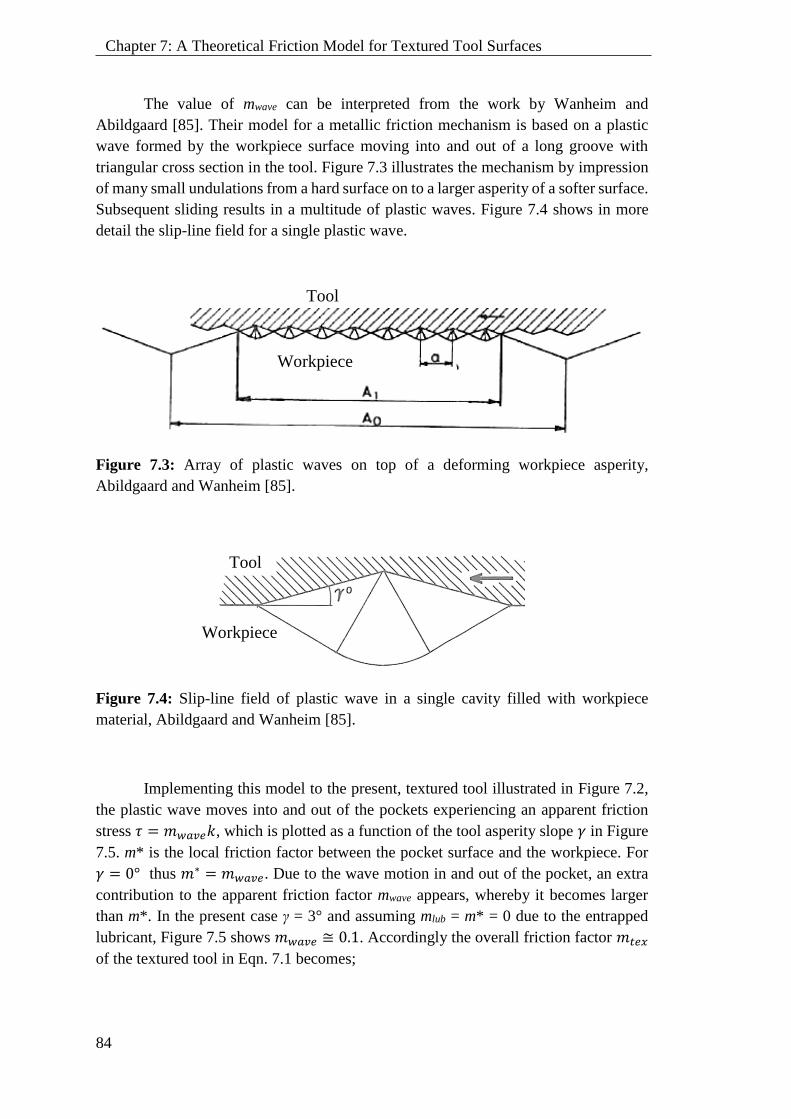
84
Chapter 7: A Theoretical Friction Model for Textured Tool Surfaces
The value of mwave can be interpreted from the work by Wanheim and
Abildgaard [85]. Their model for a metallic friction mechanism is based on a plastic
wave formed by the workpiece surface moving into and out of a long groove with
triangular cross section in the tool. Figure 7.3 illustrates the mechanism by impression
of many small undulations from a hard surface on to a larger asperity of a softer surface.
Subsequent sliding results in a multitude of plastic waves. Figure 7.4 shows in more
detail the slip-line field for a single plastic wave.
Figure 7.3: Array of plastic waves on top of a deforming workpiece asperity,
Abildgaard and Wanheim [85].
Figure 7.4: Slip-line field of plastic wave in a single cavity filled with workpiece
material, Abildgaard and Wanheim [85].
Implementing this model to the present, textured tool illustrated in Figure 7.2,
the plastic wave moves into and out of the pockets experiencing an apparent friction
stress 𝜏 = 𝑚𝑤𝑎𝑣𝑒𝑘, which is plotted as a function of the tool asperity slope 𝛾 in Figure
7.5. m* is the local friction factor between the pocket surface and the workpiece. For
𝛾 = 0° thus 𝑚∗ = 𝑚𝑤𝑎𝑣𝑒. Due to the wave motion in and out of the pocket, an extra
contribution to the apparent friction factor mwave appears, whereby it becomes larger
than m*. In the present case γ = 3° and assuming mlub = m* = 0 due to the entrapped
lubricant, Figure 7.5 shows 𝑚𝑤𝑎𝑣𝑒 ≅ 0.1. Accordingly the overall friction factor 𝑚𝑡𝑒𝑥
of the textured tool in Eqn. 7.1 becomes;
Workpiece
Tool
Tool
Workpiece
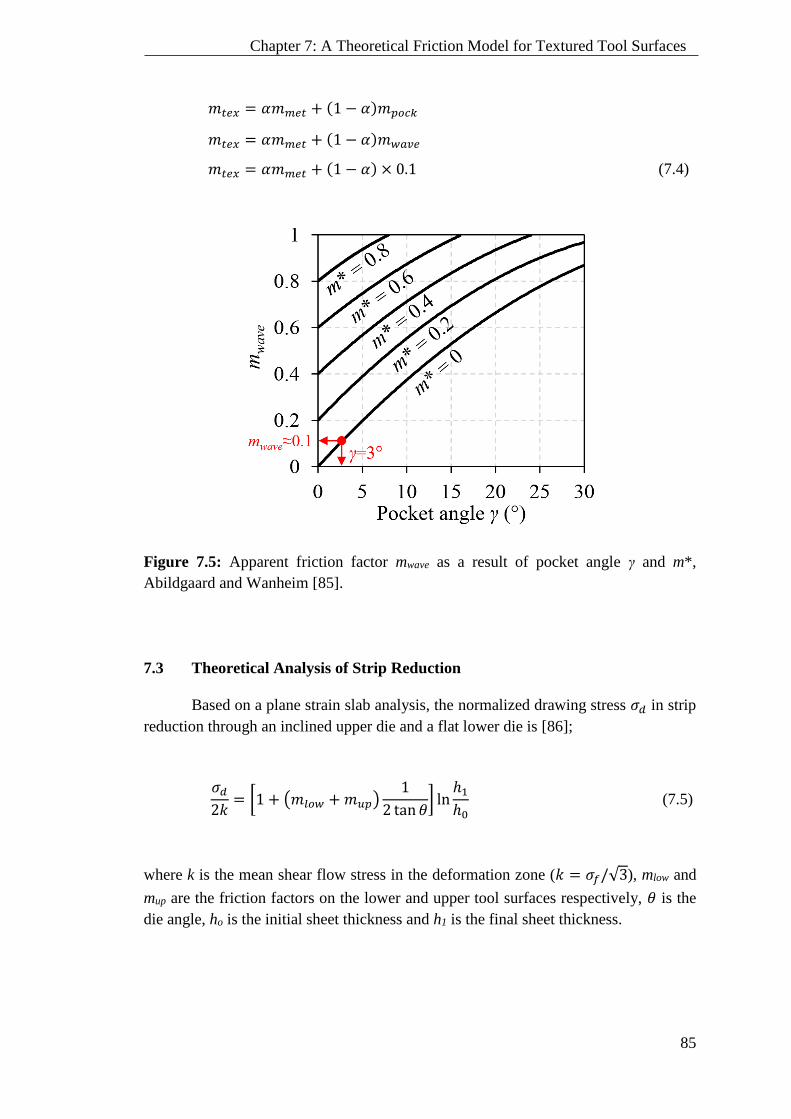
85
Chapter 7: A Theoretical Friction Model for Textured Tool Surfaces
𝑚𝑡𝑒𝑥 = 𝛼𝑚𝑚𝑒𝑡 + (1 − 𝛼)𝑚𝑝𝑜𝑐𝑘
𝑚𝑡𝑒𝑥 = 𝛼𝑚𝑚𝑒𝑡 + (1 − 𝛼)𝑚𝑤𝑎𝑣𝑒
𝑚𝑡𝑒𝑥 = 𝛼𝑚𝑚𝑒𝑡 + (1 − 𝛼) × 0.1 (7.4)
Figure 7.5: Apparent friction factor mwave as a result of pocket angle γ and m*,
Abildgaard and Wanheim [85].
7.3 Theoretical Analysis of Strip Reduction
Based on a plane strain slab analysis, the normalized drawing stress 𝜎𝑑 in strip
reduction through an inclined upper die and a flat lower die is [86];
𝜎𝑑
2𝑘= [1 + (𝑚𝑙𝑜𝑤 + 𝑚𝑢𝑝)
1
2 tan 𝜃] ln
ℎ1
ℎ0 (7.5)
where k is the mean shear flow stress in the deformation zone (𝑘 = 𝜎𝑓/√3), mlow and
mup are the friction factors on the lower and upper tool surfaces respectively, 𝜃 is the
die angle, ho is the initial sheet thickness and h1 is the final sheet thickness.
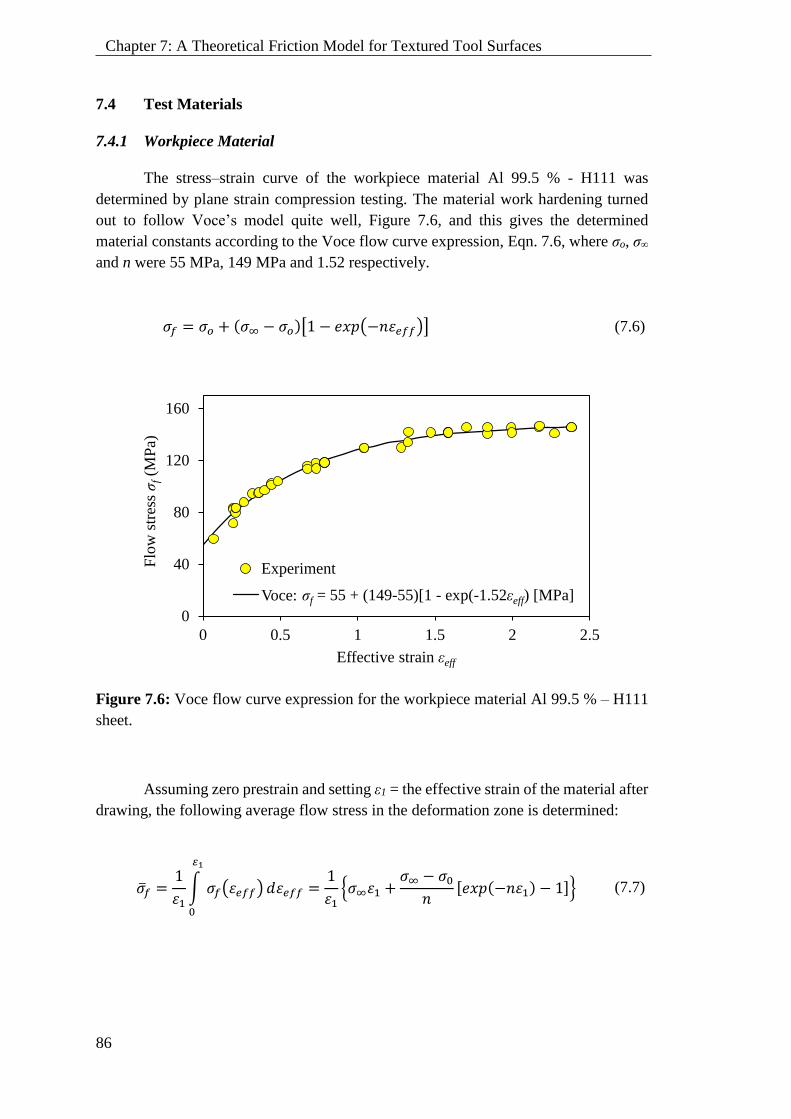
86
Chapter 7: A Theoretical Friction Model for Textured Tool Surfaces
7.4 Test Materials
7.4.1 Workpiece Material
The stress–strain curve of the workpiece material Al 99.5 % - H111 was
determined by plane strain compression testing. The material work hardening turned
out to follow Voce’s model quite well, Figure 7.6, and this gives the determined
material constants according to the Voce flow curve expression, Eqn. 7.6, where σo, σ∞
and n were 55 MPa, 149 MPa and 1.52 respectively.
𝜎𝑓 = 𝜎𝑜 + (𝜎∞ − 𝜎𝑜)[1 − 𝑒𝑥𝑝(−𝑛𝜀𝑒𝑓𝑓)] (7.6)
Figure 7.6: Voce flow curve expression for the workpiece material Al 99.5 % – H111
sheet.
Assuming zero prestrain and setting ε1 = the effective strain of the material after
drawing, the following average flow stress in the deformation zone is determined:
𝜎𝑓 =1
𝜀1∫ 𝜎𝑓(𝜀𝑒𝑓𝑓)
𝜀1
0
𝑑𝜀𝑒𝑓𝑓 =1
𝜀1{𝜎∞𝜀1 +
𝜎∞ − 𝜎0
𝑛[𝑒𝑥𝑝(−𝑛𝜀1) − 1]} (7.7)
0
40
80
120
160
0 0.5 1 1.5 2 2.5
Flo
w s
tres
s σ
f(M
Pa)
Effective strain εeff
Experiment
Voce: σ=55+(149-55)(1-exp(-1.52ε)) [MPa]σf = 55 + (149-55)[1 - exp(-1.52εeff) [MPa]
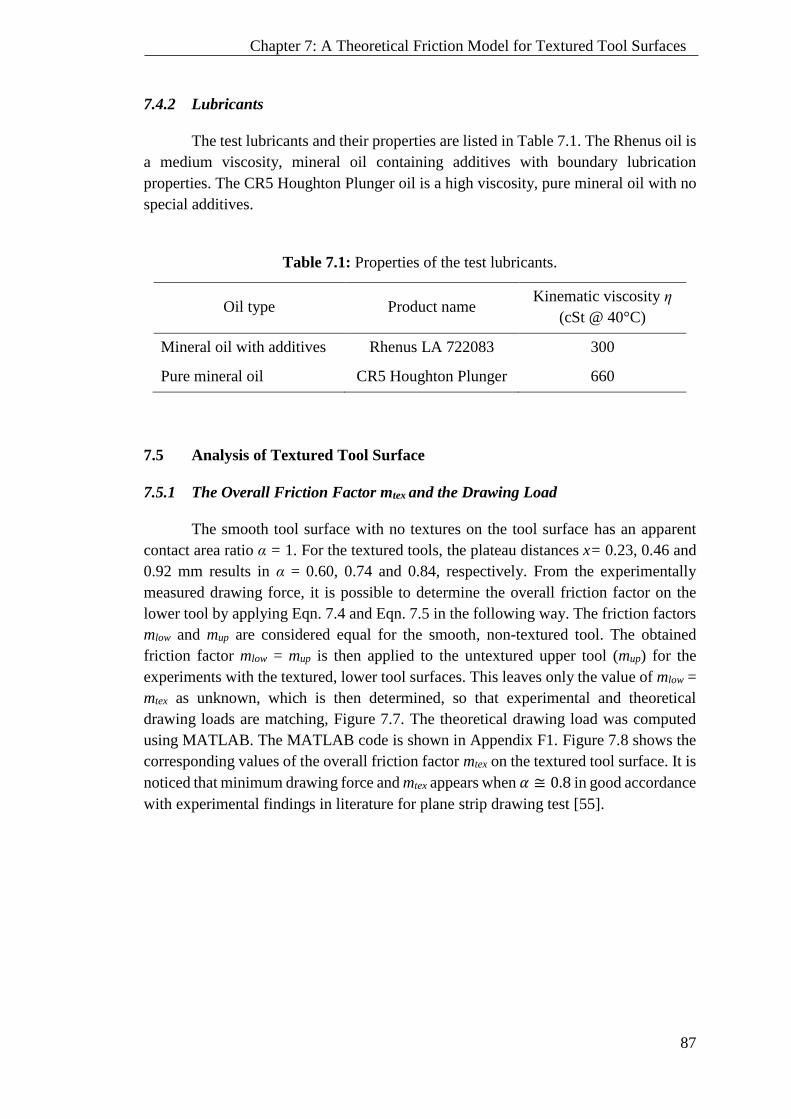
87
Chapter 7: A Theoretical Friction Model for Textured Tool Surfaces
7.4.2 Lubricants
The test lubricants and their properties are listed in Table 7.1. The Rhenus oil is
a medium viscosity, mineral oil containing additives with boundary lubrication
properties. The CR5 Houghton Plunger oil is a high viscosity, pure mineral oil with no
special additives.
Table 7.1: Properties of the test lubricants.
Oil type Product name Kinematic viscosity η
(cSt @ 40°C)
Mineral oil with additives Rhenus LA 722083 300
Pure mineral oil CR5 Houghton Plunger 660
7.5 Analysis of Textured Tool Surface
7.5.1 The Overall Friction Factor mtex and the Drawing Load
The smooth tool surface with no textures on the tool surface has an apparent
contact area ratio α = 1. For the textured tools, the plateau distances x= 0.23, 0.46 and
0.92 mm results in α = 0.60, 0.74 and 0.84, respectively. From the experimentally
measured drawing force, it is possible to determine the overall friction factor on the
lower tool by applying Eqn. 7.4 and Eqn. 7.5 in the following way. The friction factors
mlow and mup are considered equal for the smooth, non-textured tool. The obtained
friction factor mlow = mup is then applied to the untextured upper tool (mup) for the
experiments with the textured, lower tool surfaces. This leaves only the value of mlow =
mtex as unknown, which is then determined, so that experimental and theoretical
drawing loads are matching, Figure 7.7. The theoretical drawing load was computed
using MATLAB. The MATLAB code is shown in Appendix F1. Figure 7.8 shows the
corresponding values of the overall friction factor mtex on the textured tool surface. It is
noticed that minimum drawing force and mtex appears when 𝛼 ≅ 0.8 in good accordance
with experimental findings in literature for plane strip drawing test [55].
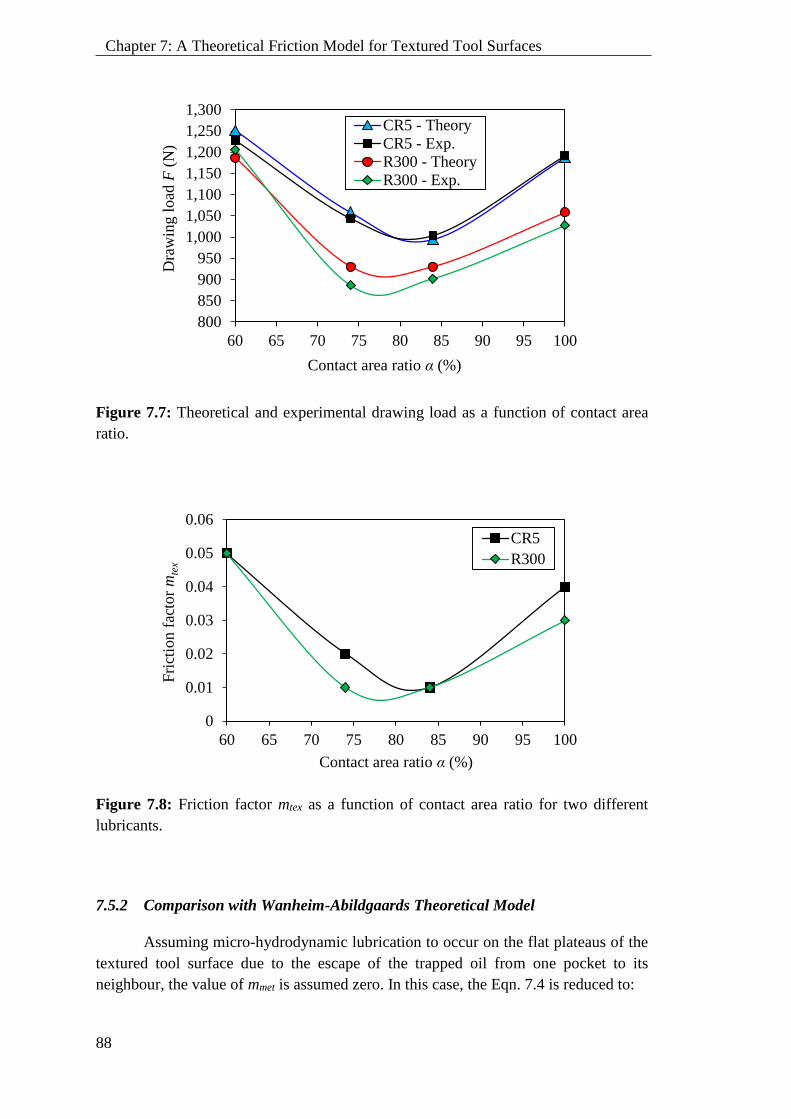
88
Chapter 7: A Theoretical Friction Model for Textured Tool Surfaces
Figure 7.7: Theoretical and experimental drawing load as a function of contact area
ratio.
Figure 7.8: Friction factor mtex as a function of contact area ratio for two different
lubricants.
7.5.2 Comparison with Wanheim-Abildgaards Theoretical Model
Assuming micro-hydrodynamic lubrication to occur on the flat plateaus of the
textured tool surface due to the escape of the trapped oil from one pocket to its
neighbour, the value of mmet is assumed zero. In this case, the Eqn. 7.4 is reduced to:
800
850
900
950
1,000
1,050
1,100
1,150
1,200
1,250
1,300
60 65 70 75 80 85 90 95 100
Dra
win
g l
oad
F(N
)
Contact area ratio α (%)
CR5 - Theory
CR5 - Exp.
R300 - Theory
R300 - Exp.
0
0.01
0.02
0.03
0.04
0.05
0.06
60 65 70 75 80 85 90 95 100
Fri
ctio
n f
acto
r m
tex
Contact area ratio α (%)
CR5
R300

89
Chapter 7: A Theoretical Friction Model for Textured Tool Surfaces
𝑚𝑡𝑒𝑥 = (1 − 𝛼)𝑚𝑤𝑎𝑣𝑒 (7.8)
where mwave can be determined by Abildgaard and Wanheims theoretical model in
Figure 7.5. A comparison between the overall friction factor mtex of the textured tools
determined in this way with the one determined in Section 6.1 by force measurement
and slab method analysis is shown in Figure 7.9. It is noticed that reasonable agreement
appears between the two methods. The value of m* = 0 was assumed for each individual
case.
Tool texture with too large amount of pocket area, i.e. with low α-value, was
found to increase the overall friction factor. Eqn. 7.8 explains this effect, since α
becomes smaller. Too small amount of pocket area, on the other hand, may also lead to
increased mtex, since the lubricant escape by micro-plasto-hydrodynamic lubrication
may not be sufficient to cover the entire flat plateau. This implies an increase in mmet
in Eqn. 7.4. These two counteracting factors influence on mtex are the reason for an
optimum value of α, which gives minimum mtex.
Figure 7.9: Comparison of the overall friction factor mtex determined by adopting
Wanheim and Abildgaards model (W&A) with the present calculations.
7.6 Summary
A friction model for a soft workpiece deforming against a textured tool surface
was proposed. The model takes into account the plastic wave motion appearing when
the workpiece material flows into and out of local pockets between the flat plateaus of
a table mountain like tool surface topography. The model was evaluated by strip
0
0.01
0.02
0.03
0.04
0.05
0.06
60 65 70 75 80 85
Fri
ctio
n f
acto
r m
tex
Contact area ratio α (%)
CR5 - W&A
R300 - W&A
CR5 - Present exp.
R300 - Present exp.

90
Chapter 7: A Theoretical Friction Model for Textured Tool Surfaces
reduction tests, which emulates the tribological conditions in an ironing process. The
study included testing of two different lubricants, a plain mineral oil with a high
viscosity, and a mineral-based oil with boundary lubrication additives having a medium
viscosity. It was found that an optimum amount of tool texture exists which reduces
friction and thus drawing load for the table-mountain-like tool surface topography. The
overall friction factor in the interface between workpiece and textured tool surface can
be satisfactory predicted by the theoretical model. However it is still necessary to obtain
a friction factor for the metal-to-metal contact.
91
PART III – ANTI-SEIZURE TOOL COATINGS
Part III
Anti-Seizure Tool Coatings

92

93
PART III – ANTI-SEIZURE TOOL COATINGS
Overview
In tribologically severe stamping operations such as ironing of stainless steel,
the phenomenon of galling, i.e. breakdown of the lubricant film followed by pick-up of
workpiece material on the tool surface and scoring of subsequent workpiece surfaces
may appear if the tribological system is inadequate. Mineral oils containing EP
additives are therefore commonly applied to avoid galling in sheet stamping production.
Application of these lubricants requires additional costs for pre-cleaning, lubrication as
well as post-cleaning after stamping. Applying lubricants such as chlorinated paraffin
oils to avoid galling furthermore poses risks to personnel health and working
environment. Insufficient post-cleaning promotes hazardous chemical residues on the
sheet surface, which may be unacceptable in cases like biomedical and food container
products.
Application of hard coating to the tool surface is rather familiar in sheet metal
forming, especially in progressive tools where the tribological conditions are severe and
possible galling may occur. However, depositing Diamond-Like Carbon (DLC) coating
is rather unusual in sheet metal forming. Although depositing the DLC coating to the
tool surface is beneficial to reduce friction and to improve resistivity towards galling,
stamping of sheet materials by utilizing these DLC coatings at larger normal pressures
such as in ironing operations requires an efficient but hazardous lubricant in order to
avoid peeling off of the coating from the tool surface. This may be due to the generation
of a high shear stress in the DLC coating. Thus, further investigations into the effect of
DLC coatings in such cases of larger normal pressure and higher temperature under
severe tribological conditions would be of interest to investigate.
The present study focuses on depositing the DLC coatings as the top layer
coating on tools to minimize galling. Two approaches were used; a screening
experiment on a manually operated sheet tribo-tester was performed on all coating
candidates and after that, the most promising coating candidate found from the
screening experiment in the manually operated tribo-tester was then tested in an
automatic sheet tribo-tester, where a laboratory simulation of an ironing operation
replicating a continuous can production is performed. The tribologically severe strip
reduction test, which emulates industrial ironing of stainless steel sheets, is suitable to
examine promising coating candidates for severe forming conditions and is therefore
used in this study. A numerical simulation, coupling mechanical and thermal analysis,
was added to evaluate the interaction at the tool/workpiece interface.
The tool surfaces were deposited with single-, double- and multi-layer DLC
coatings. The double-layer DLC coating is a new DLC coating that is specifically
developed for the PhD study, aiming at finding a promising way to eliminate hazardous
lubrication issues. The new, double-layer DLC coating has not been tested in industrial
production at varying tribological conditions.

94
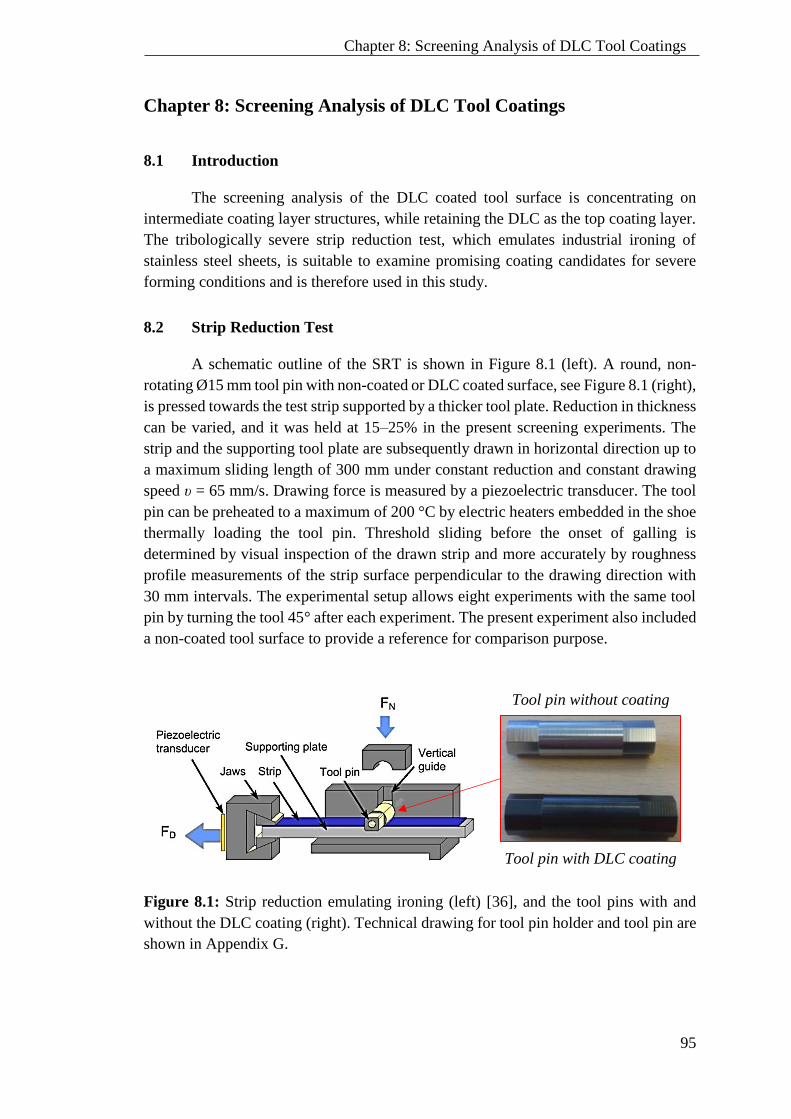
95
Chapter 8: Screening Analysis of DLC Tool Coatings
Chapter 8: Screening Analysis of DLC Tool Coatings
8.1 Introduction
The screening analysis of the DLC coated tool surface is concentrating on
intermediate coating layer structures, while retaining the DLC as the top coating layer.
The tribologically severe strip reduction test, which emulates industrial ironing of
stainless steel sheets, is suitable to examine promising coating candidates for severe
forming conditions and is therefore used in this study.
8.2 Strip Reduction Test
A schematic outline of the SRT is shown in Figure 8.1 (left). A round, non-
rotating Ø15 mm tool pin with non-coated or DLC coated surface, see Figure 8.1 (right),
is pressed towards the test strip supported by a thicker tool plate. Reduction in thickness
can be varied, and it was held at 15–25% in the present screening experiments. The
strip and the supporting tool plate are subsequently drawn in horizontal direction up to
a maximum sliding length of 300 mm under constant reduction and constant drawing
speed υ = 65 mm/s. Drawing force is measured by a piezoelectric transducer. The tool
pin can be preheated to a maximum of 200 °C by electric heaters embedded in the shoe
thermally loading the tool pin. Threshold sliding before the onset of galling is
determined by visual inspection of the drawn strip and more accurately by roughness
profile measurements of the strip surface perpendicular to the drawing direction with
30 mm intervals. The experimental setup allows eight experiments with the same tool
pin by turning the tool 45° after each experiment. The present experiment also included
a non-coated tool surface to provide a reference for comparison purpose.
Tool pin without coating
Tool pin with DLC coating
Figure 8.1: Strip reduction emulating ironing (left) [36], and the tool pins with and
without the DLC coating (right). Technical drawing for tool pin holder and tool pin are
shown in Appendix G.

96
Chapter 8: Screening Analysis of DLC Tool Coatings
8.3 Test Materials and Coating Types
8.2.1 Tool Material
The tool material was a Powder Metallurgical (PM) cold work tool steel,
Uddeholm UHB Vanadis 4, with high carbon and chromium content and alloyed with
manganese, molybdenum, silicon and vanadium. The tools were through-hardened and
tempered to 62 HRC and subsequently polished to Ra = 0.02 µm before coating.
8.2.2 Workpiece Material
The workpiece material was austenitic stainless steel EN1.4307 (AISI 304L),
1.2 mm thick, 15 mm wide and 500 mm long. It was used in the “as-received” condition
with a surface roughness Ra = 1.4 µm. The stress-strain curve of the workpiece material
was determined by uniaxial tension test, which gave the following Swift flow curve
expression: σf = C (B + εeff)n =1830 (0.091+ εeff)
0.76 MPa, see Figure 8.2.
Figure 8.2: Swift flow curve expression for the workpiece material stainless steel
EN1.4307 sheet.
8.2.3 Lubricants
Two severe lubrication conditions were chosen. One was lubrication with a low
viscous, plain mineral oil without special additives as listed in Table 8.1, and the other
one was reduction with no lubrication.
0
100
200
300
400
500
600
700
800
900
0 0.05 0.1 0.15 0.2 0.25 0.3
Flo
w s
tres
s σ
f(M
Pa)
Effective strain εeff
Experiment
Swift: σf = 1830 (0.091 + εeff)0.76 MPa

97
Chapter 8: Screening Analysis of DLC Tool Coatings
Table 8.1: Properties of the test lubricant.
Oil type Product name Kinematic viscosity η (cSt @ 40 °C)
Pure mineral oil CR5-Sun 60a 60
a 50 wt % mixture of Houghton Plunger CR5 (η = 660 cSt) and Sunoco Sun 60 (η = 10 cSt)
8.2.4 Coating Types and Structure
In this study, DLC coating was chosen to impede galling. In order to evaluate
the interaction between the DLC coating and the tool surface, three DLC coating
structures were evaluated; single layer, double layer and multi-layer coatings as
described in Figure 8.3. The tool roughness after coating was the same as before, Ra =
0.02 µm. Coating binders, CrN and Cr interlayer coatings, were added to the DLC
coating in form of a gradient coating structure.
Type A Type B Type C
Figure 8.3: The three coating structures: Type A (single layer), Type B (double layer)
and Type C (multi-layer).
8.4 Experimental Procedure
The experiment started by cleaning the tool and workpiece surfaces from any
remnants of pick-up, oil and other contaminants. In case of lubricated experiments,
lubricant was applied to the workpiece surfaces, after which reduction was carried out
with 300 mm drawing length. In some of the experiments, the tool was pre-heated to
either 80°C or 110°C, using a thermal cartridge heater inserted in the upper tool loading
the tool pin, see Figure 8.1. During the experiments, the load and temperature were
recorded and saved by a custom made LabView program. After the experiment, the tool
surfaces were scanned in a light optical microscope (LOM) and the workpiece surface
roughness was measured across the strip for every 30 mm drawing length by a tactile
roughness profilometer, Taylor Hobson Form TalySurf.
DLC
Tool
4 µm
3 µm
3 µm
Hyperlox®
Tool
DLC/
CrCN/
CrN
Cr
Tool
Nano-layer
DLC
CrN
5 µm
3 µm
2 µm
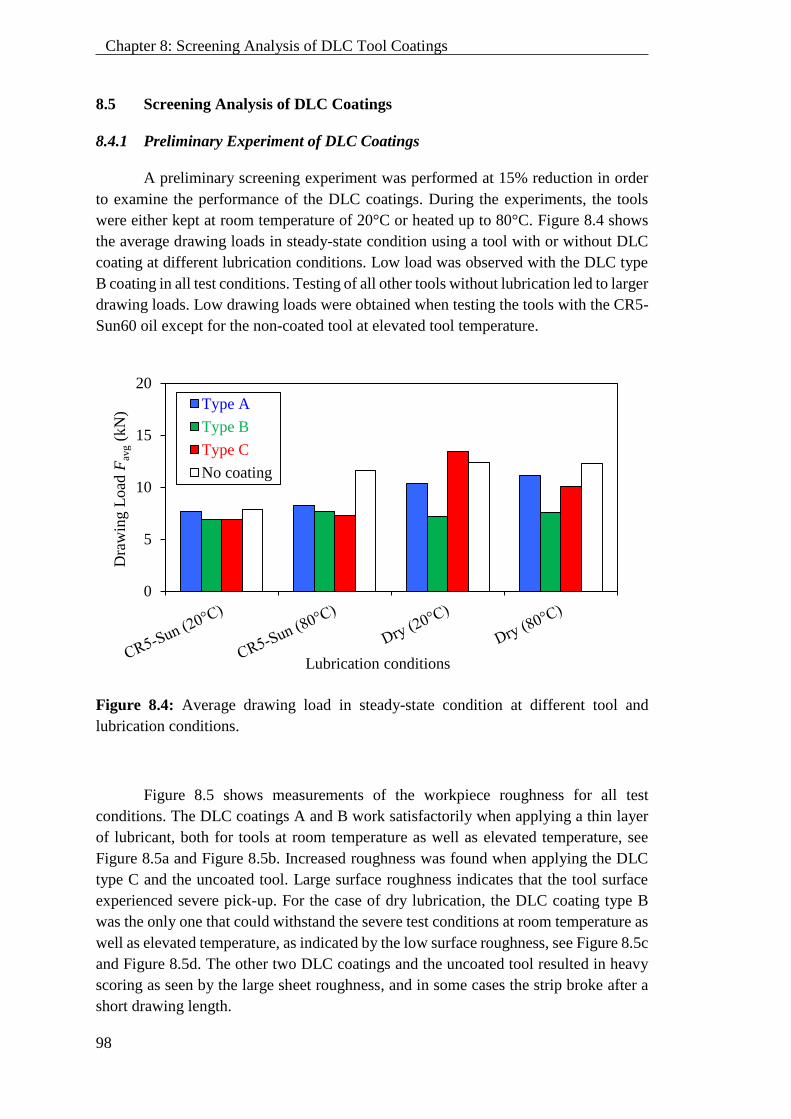
98
Chapter 8: Screening Analysis of DLC Tool Coatings
8.5 Screening Analysis of DLC Coatings
8.4.1 Preliminary Experiment of DLC Coatings
A preliminary screening experiment was performed at 15% reduction in order
to examine the performance of the DLC coatings. During the experiments, the tools
were either kept at room temperature of 20°C or heated up to 80°C. Figure 8.4 shows
the average drawing loads in steady-state condition using a tool with or without DLC
coating at different lubrication conditions. Low load was observed with the DLC type
B coating in all test conditions. Testing of all other tools without lubrication led to larger
drawing loads. Low drawing loads were obtained when testing the tools with the CR5-
Sun60 oil except for the non-coated tool at elevated tool temperature.
Figure 8.4: Average drawing load in steady-state condition at different tool and
lubrication conditions.
Figure 8.5 shows measurements of the workpiece roughness for all test
conditions. The DLC coatings A and B work satisfactorily when applying a thin layer
of lubricant, both for tools at room temperature as well as elevated temperature, see
Figure 8.5a and Figure 8.5b. Increased roughness was found when applying the DLC
type C and the uncoated tool. Large surface roughness indicates that the tool surface
experienced severe pick-up. For the case of dry lubrication, the DLC coating type B
was the only one that could withstand the severe test conditions at room temperature as
well as elevated temperature, as indicated by the low surface roughness, see Figure 8.5c
and Figure 8.5d. The other two DLC coatings and the uncoated tool resulted in heavy
scoring as seen by the large sheet roughness, and in some cases the strip broke after a
short drawing length.
0
5
10
15
20
Dra
win
g L
oad
Fav
g(k
N)
Lubrication conditions
Type A
Type B
Type C
No coating
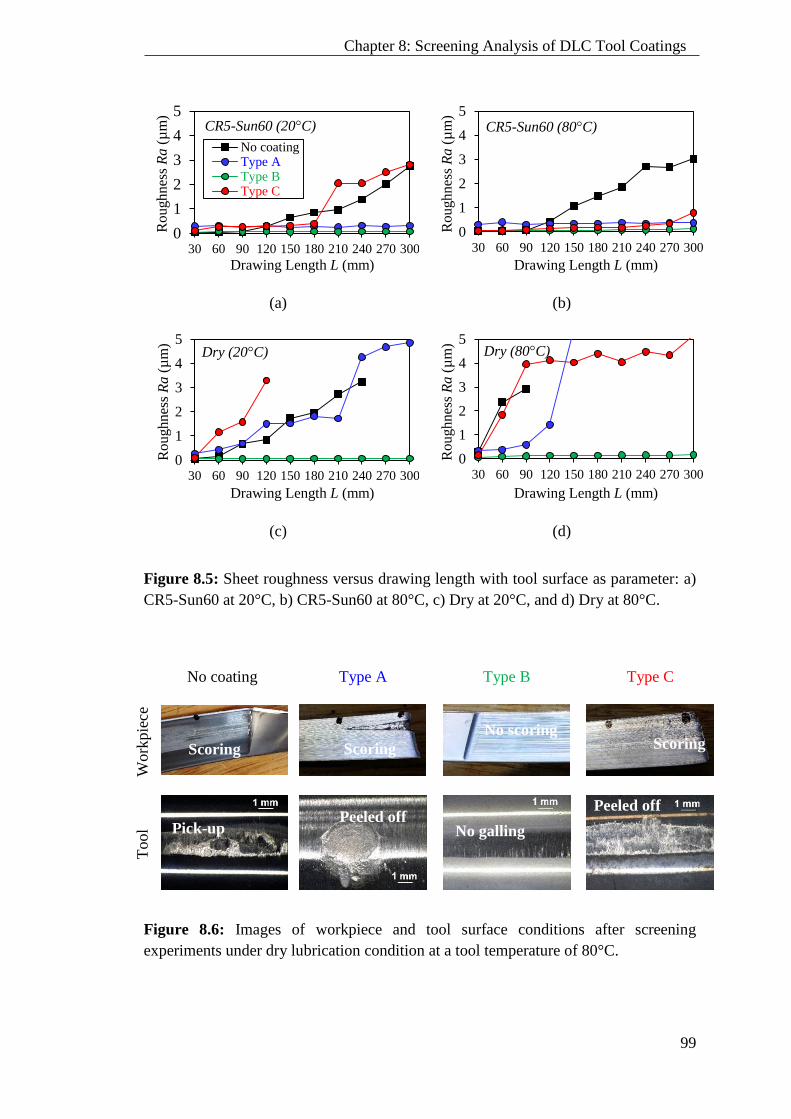
99
Chapter 8: Screening Analysis of DLC Tool Coatings
(a) (b)
(c) (d)
Figure 8.5: Sheet roughness versus drawing length with tool surface as parameter: a)
CR5-Sun60 at 20°C, b) CR5-Sun60 at 80°C, c) Dry at 20°C, and d) Dry at 80°C.
No coating Type A Type B Type C
Work
pie
ce
Tool
Figure 8.6: Images of workpiece and tool surface conditions after screening
experiments under dry lubrication condition at a tool temperature of 80°C.
0
1
2
3
4
5
30 60 90 120 150 180 210 240 270 300
Ro
ugh
nes
s R
a(µ
m)
Drawing Length L (mm)
No coatingType AType BType C
CR5-Sun60 (20°C)
0
1
2
3
4
5
30 60 90 120 150 180 210 240 270 300
Ro
ugh
nes
s R
a(µ
m)
Drawing Length L (mm)
CR5-Sun60 (80°C)
0
1
2
3
4
5
30 60 90 120 150 180 210 240 270 300
Rou
gh
nes
s R
a(µ
m)
Drawing Length L (mm)
Dry (20°C)
0
1
2
3
4
5
30 60 90 120 150 180 210 240 270 300
Rou
gh
nes
s R
a(µ
m)
Drawing Length L (mm)
Dry (80°C)
Pick-up
Peeled off No galling
Peeled off
Scoring
Scoring
Scoring
No scoring
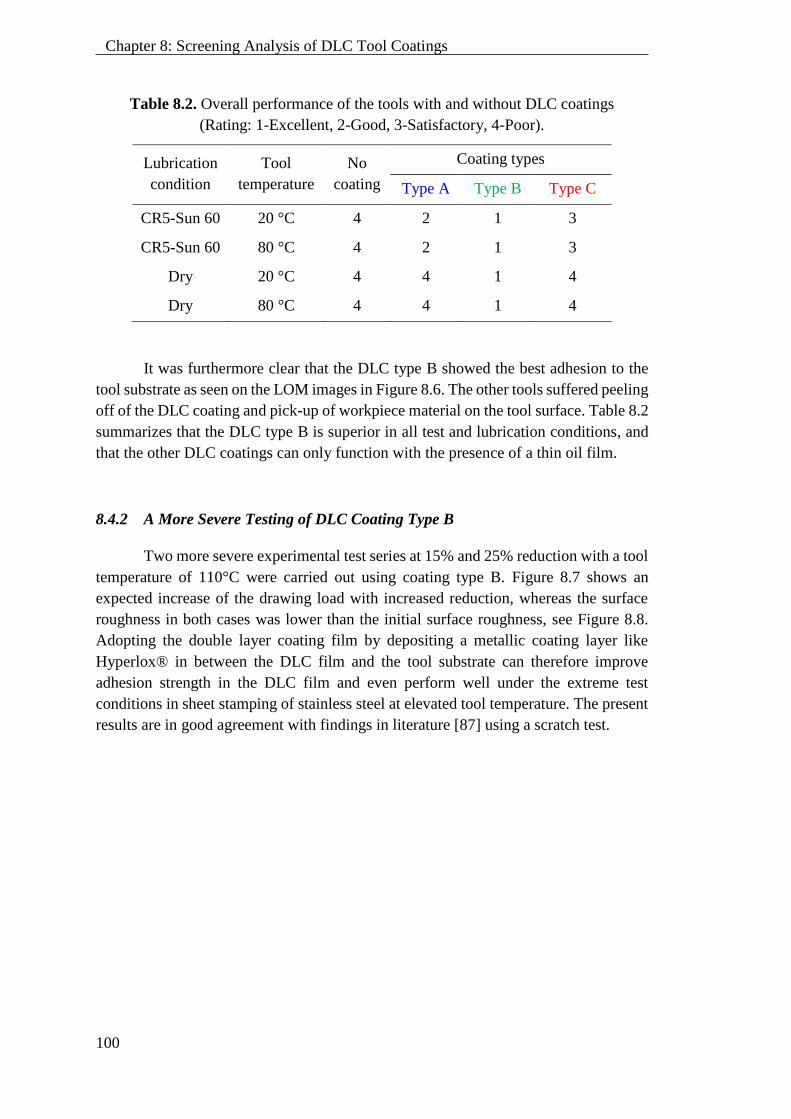
100
Chapter 8: Screening Analysis of DLC Tool Coatings
Table 8.2. Overall performance of the tools with and without DLC coatings
(Rating: 1-Excellent, 2-Good, 3-Satisfactory, 4-Poor).
Lubrication
condition
Tool
temperature
No
coating
Coating types
Type A Type B Type C
CR5-Sun 60 20 °C 4 2 1 3
CR5-Sun 60 80 °C 4 2 1 3
Dry 20 °C 4 4 1 4
Dry 80 °C 4 4 1 4
It was furthermore clear that the DLC type B showed the best adhesion to the
tool substrate as seen on the LOM images in Figure 8.6. The other tools suffered peeling
off of the DLC coating and pick-up of workpiece material on the tool surface. Table 8.2
summarizes that the DLC type B is superior in all test and lubrication conditions, and
that the other DLC coatings can only function with the presence of a thin oil film.
8.4.2 A More Severe Testing of DLC Coating Type B
Two more severe experimental test series at 15% and 25% reduction with a tool
temperature of 110°C were carried out using coating type B. Figure 8.7 shows an
expected increase of the drawing load with increased reduction, whereas the surface
roughness in both cases was lower than the initial surface roughness, see Figure 8.8.
Adopting the double layer coating film by depositing a metallic coating layer like
Hyperlox® in between the DLC film and the tool substrate can therefore improve
adhesion strength in the DLC film and even perform well under the extreme test
conditions in sheet stamping of stainless steel at elevated tool temperature. The present
results are in good agreement with findings in literature [87] using a scratch test.
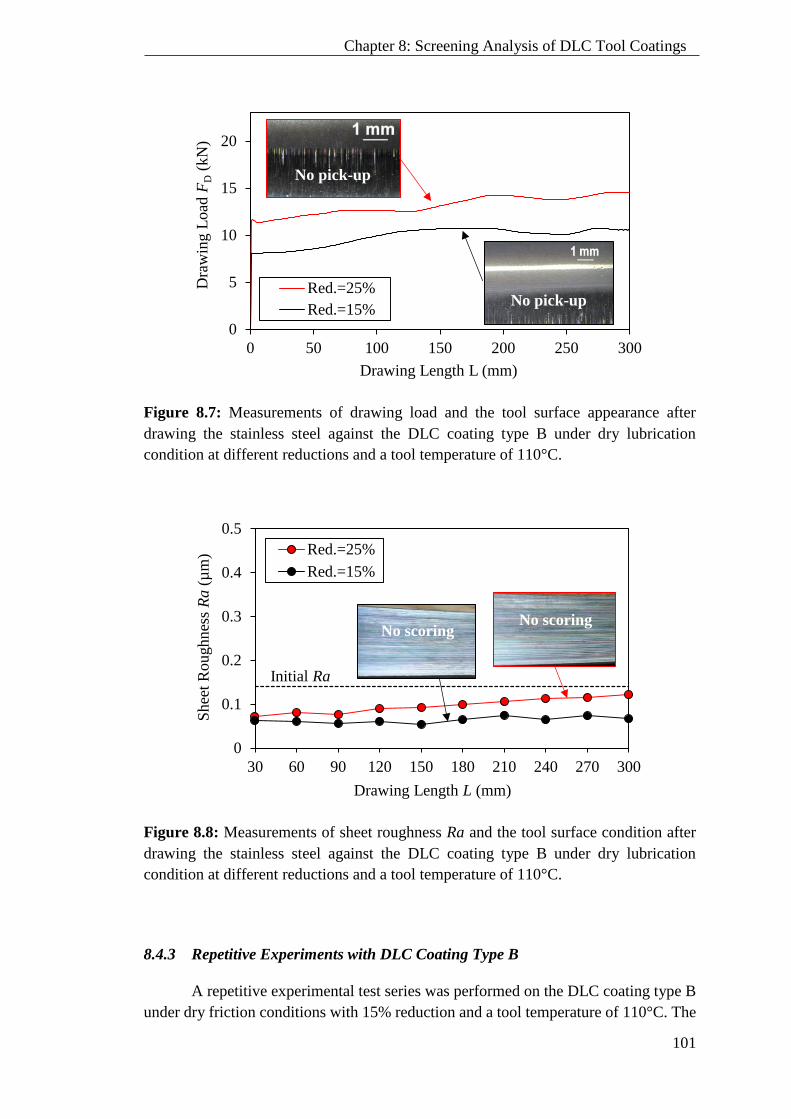
101
Chapter 8: Screening Analysis of DLC Tool Coatings
Figure 8.7: Measurements of drawing load and the tool surface appearance after
drawing the stainless steel against the DLC coating type B under dry lubrication
condition at different reductions and a tool temperature of 110°C.
Figure 8.8: Measurements of sheet roughness Ra and the tool surface condition after
drawing the stainless steel against the DLC coating type B under dry lubrication
condition at different reductions and a tool temperature of 110°C.
8.4.3 Repetitive Experiments with DLC Coating Type B
A repetitive experimental test series was performed on the DLC coating type B
under dry friction conditions with 15% reduction and a tool temperature of 110°C. The
0
5
10
15
20
0 50 100 150 200 250 300
Dra
win
g L
oad
FD
(kN
)
Drawing Length L (mm)
Red.=25%
Red.=15%
No pick-up
No pick-up
0
0.1
0.2
0.3
0.4
0.5
30 60 90 120 150 180 210 240 270 300
Shee
t R
oughnes
s R
a(µ
m)
Drawing Length L (mm)
Red.=25%
Red.=15%
Initial Ra
No scoringNo scoring
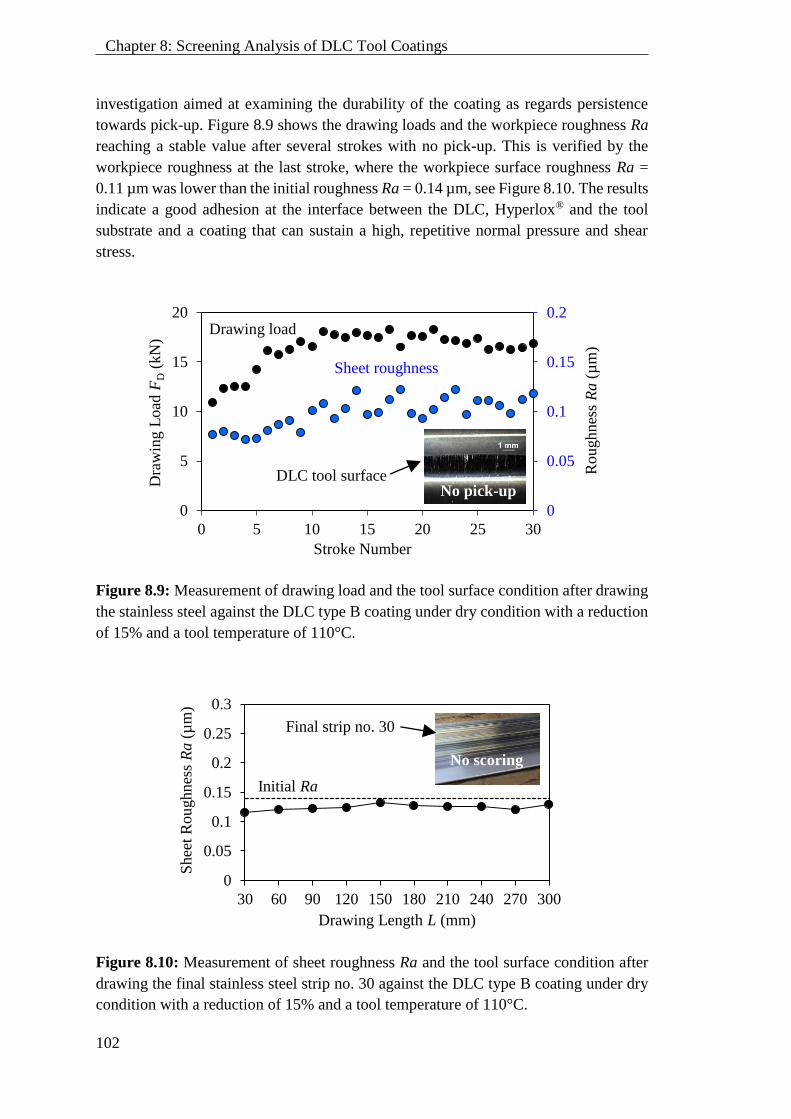
102
Chapter 8: Screening Analysis of DLC Tool Coatings
investigation aimed at examining the durability of the coating as regards persistence
towards pick-up. Figure 8.9 shows the drawing loads and the workpiece roughness Ra
reaching a stable value after several strokes with no pick-up. This is verified by the
workpiece roughness at the last stroke, where the workpiece surface roughness Ra =
0.11 µm was lower than the initial roughness Ra = 0.14 µm, see Figure 8.10. The results
indicate a good adhesion at the interface between the DLC, Hyperlox® and the tool
substrate and a coating that can sustain a high, repetitive normal pressure and shear
stress.
Figure 8.9: Measurement of drawing load and the tool surface condition after drawing
the stainless steel against the DLC type B coating under dry condition with a reduction
of 15% and a tool temperature of 110°C.
Figure 8.10: Measurement of sheet roughness Ra and the tool surface condition after
drawing the final stainless steel strip no. 30 against the DLC type B coating under dry
condition with a reduction of 15% and a tool temperature of 110°C.
0
5
10
15
20
0 5 10 15 20 25 30
0
0.05
0.1
0.15
0.2
Stroke Number
Dra
win
g L
oad
FD
(kN
)
Roughnes
s R
a(µ
m)
No pick-up
0
0.05
0.1
0.15
0.2
0.25
0.3
30 60 90 120 150 180 210 240 270 300
Shee
t R
oughnes
s R
a(µ
m)
Drawing Length L (mm)
Initial Ra
No scoring
Final strip no. 30
Drawing load
Sheet roughness
DLC tool surface
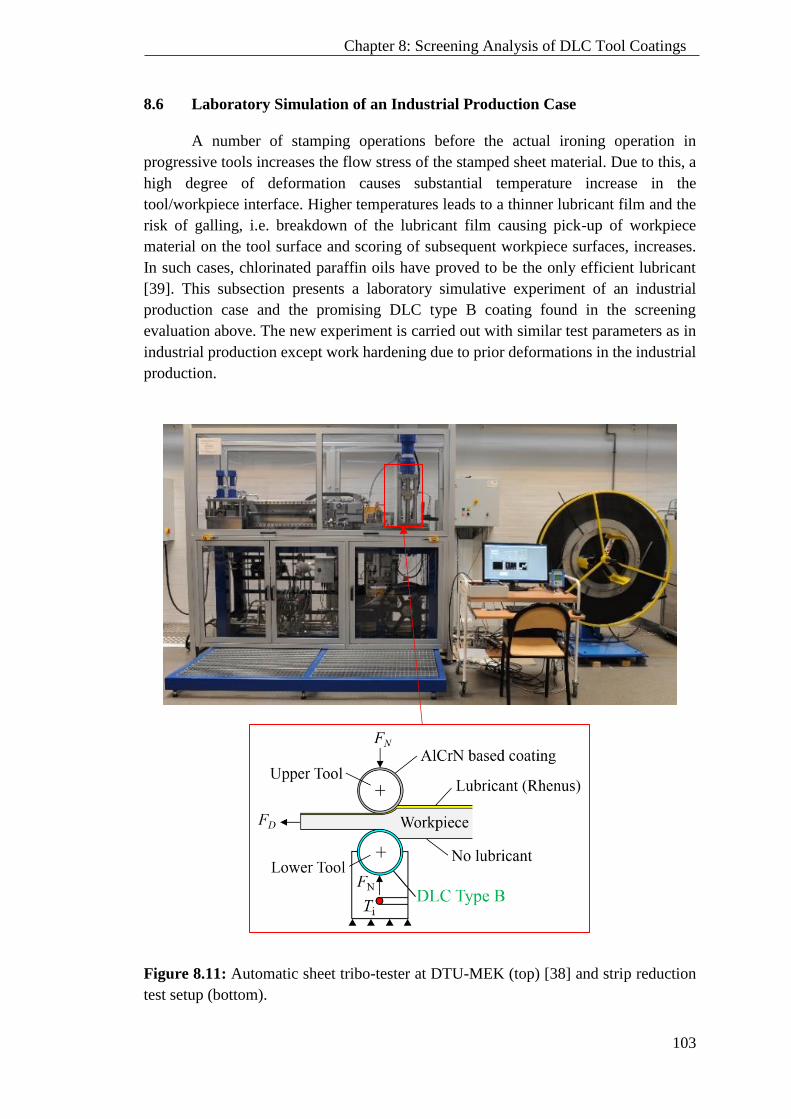
103
Chapter 8: Screening Analysis of DLC Tool Coatings
8.6 Laboratory Simulation of an Industrial Production Case
A number of stamping operations before the actual ironing operation in
progressive tools increases the flow stress of the stamped sheet material. Due to this, a
high degree of deformation causes substantial temperature increase in the
tool/workpiece interface. Higher temperatures leads to a thinner lubricant film and the
risk of galling, i.e. breakdown of the lubricant film causing pick-up of workpiece
material on the tool surface and scoring of subsequent workpiece surfaces, increases.
In such cases, chlorinated paraffin oils have proved to be the only efficient lubricant
[39]. This subsection presents a laboratory simulative experiment of an industrial
production case and the promising DLC type B coating found in the screening
evaluation above. The new experiment is carried out with similar test parameters as in
industrial production except work hardening due to prior deformations in the industrial
production.
Figure 8.11: Automatic sheet tribo-tester at DTU-MEK (top) [38] and strip reduction
test setup (bottom).
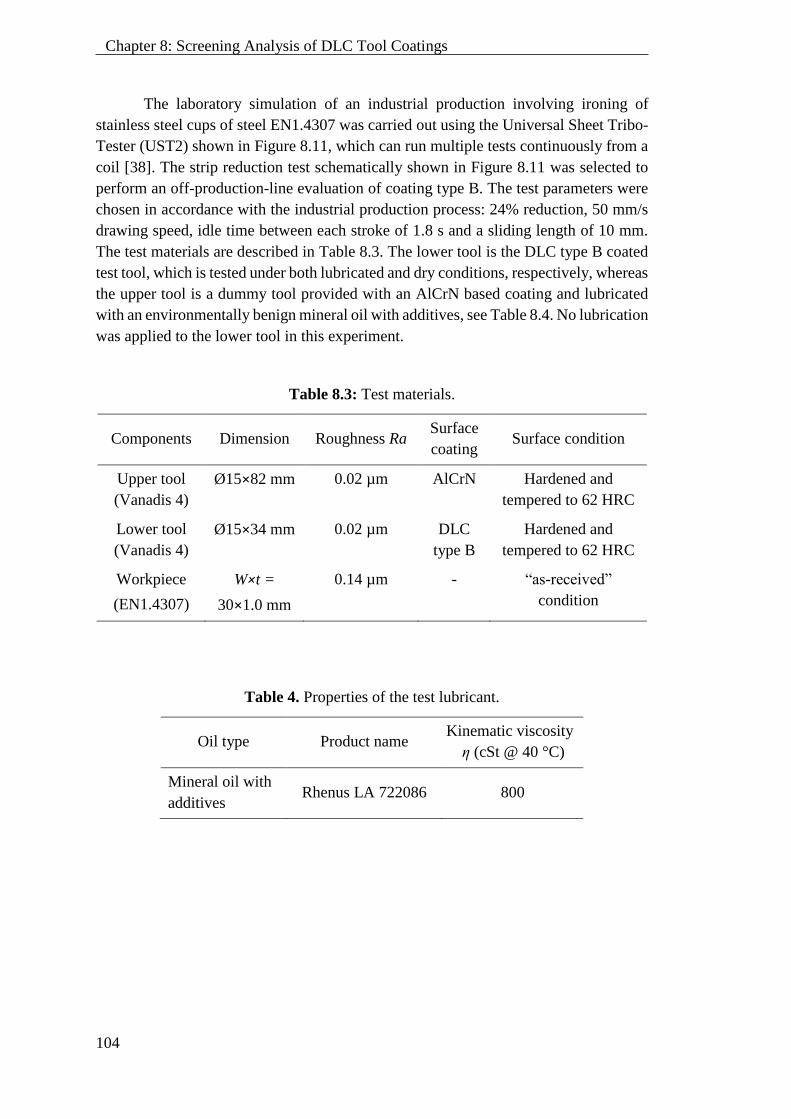
104
Chapter 8: Screening Analysis of DLC Tool Coatings
The laboratory simulation of an industrial production involving ironing of
stainless steel cups of steel EN1.4307 was carried out using the Universal Sheet Tribo-
Tester (UST2) shown in Figure 8.11, which can run multiple tests continuously from a
coil [38]. The strip reduction test schematically shown in Figure 8.11 was selected to
perform an off-production-line evaluation of coating type B. The test parameters were
chosen in accordance with the industrial production process: 24% reduction, 50 mm/s
drawing speed, idle time between each stroke of 1.8 s and a sliding length of 10 mm.
The test materials are described in Table 8.3. The lower tool is the DLC type B coated
test tool, which is tested under both lubricated and dry conditions, respectively, whereas
the upper tool is a dummy tool provided with an AlCrN based coating and lubricated
with an environmentally benign mineral oil with additives, see Table 8.4. No lubrication
was applied to the lower tool in this experiment.
Table 8.3: Test materials.
Components Dimension Roughness Ra Surface
coating Surface condition
Upper tool
(Vanadis 4)
Ø15×82 mm 0.02 µm AlCrN Hardened and
tempered to 62 HRC
Lower tool
(Vanadis 4)
Ø15×34 mm 0.02 µm DLC
type B
Hardened and
tempered to 62 HRC
Workpiece
(EN1.4307)
W×t =
30×1.0 mm
0.14 µm - “as-received”
condition
Table 4. Properties of the test lubricant.
Oil type Product name Kinematic viscosity
η (cSt @ 40 °C)
Mineral oil with
additives Rhenus LA 722086 800
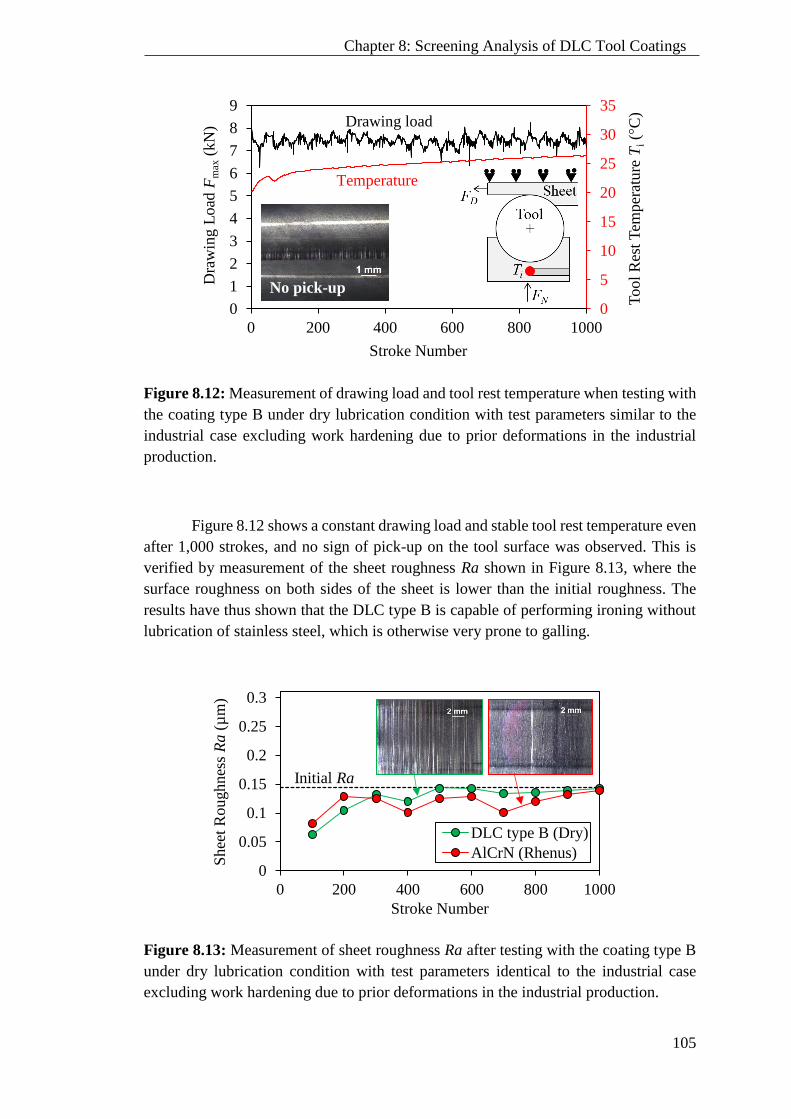
105
Chapter 8: Screening Analysis of DLC Tool Coatings
Figure 8.12: Measurement of drawing load and tool rest temperature when testing with
the coating type B under dry lubrication condition with test parameters similar to the
industrial case excluding work hardening due to prior deformations in the industrial
production.
Figure 8.12 shows a constant drawing load and stable tool rest temperature even
after 1,000 strokes, and no sign of pick-up on the tool surface was observed. This is
verified by measurement of the sheet roughness Ra shown in Figure 8.13, where the
surface roughness on both sides of the sheet is lower than the initial roughness. The
results have thus shown that the DLC type B is capable of performing ironing without
lubrication of stainless steel, which is otherwise very prone to galling.
Figure 8.13: Measurement of sheet roughness Ra after testing with the coating type B
under dry lubrication condition with test parameters identical to the industrial case
excluding work hardening due to prior deformations in the industrial production.
0
5
10
15
20
25
30
35
0
1
2
3
4
5
6
7
8
9
0 200 400 600 800 1000
Tool
Res
t T
emper
ature
Ti(°
C)
Dra
win
g L
oad
Fm
ax(k
N)
Stroke Number
No pick-up
0
0.05
0.1
0.15
0.2
0.25
0.3
0 200 400 600 800 1000
Shee
t R
oughnes
s R
a(µ
m)
Stroke Number
DLC type B (Dry)
AlCrN (Rhenus)
Initial Ra
Drawing load
Temperature
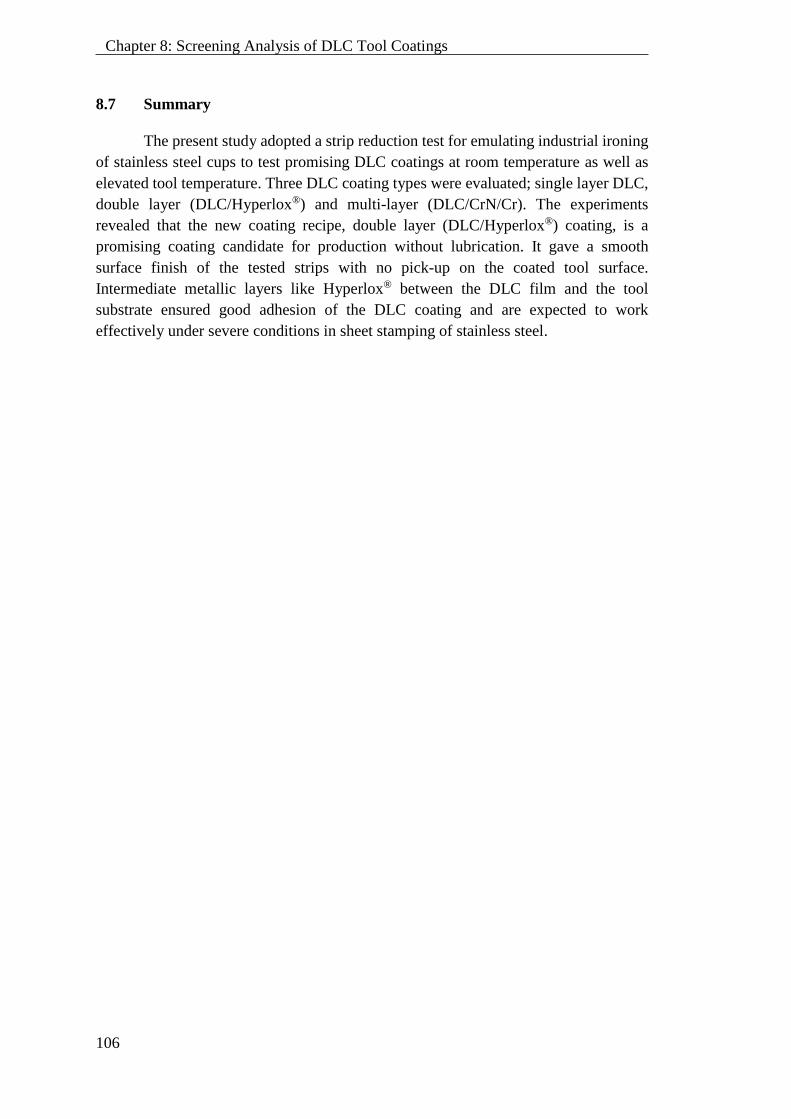
106
Chapter 8: Screening Analysis of DLC Tool Coatings
8.7 Summary
The present study adopted a strip reduction test for emulating industrial ironing
of stainless steel cups to test promising DLC coatings at room temperature as well as
elevated tool temperature. Three DLC coating types were evaluated; single layer DLC,
double layer (DLC/Hyperlox®) and multi-layer (DLC/CrN/Cr). The experiments
revealed that the new coating recipe, double layer (DLC/Hyperlox®) coating, is a
promising coating candidate for production without lubrication. It gave a smooth
surface finish of the tested strips with no pick-up on the coated tool surface.
Intermediate metallic layers like Hyperlox® between the DLC film and the tool
substrate ensured good adhesion of the DLC coating and are expected to work
effectively under severe conditions in sheet stamping of stainless steel.
107
Chapter 9: Long-Term Analysis of a New DLC Tool Coating
Chapter 9: Long-Term Analysis of a New DLC Tool Coating
9.1 Introduction
The earlier described screening experiment of the three different DLC tool
coating structures have shown that the new DLC coating, the double-layer DLC/
Hyperlox® coating, is advantageous to be applied in sheet stamping operations without
lubrication. However, a major issue when testing, has been to determine the onset of
galling as a function of most important process parameters, i.e. normal pressure, sliding
length and tool temperature. These process parameters need to be identical to the
production conditions since the new, double-layer DLC coating has not been tested in
industrial production at varying tribological conditions. Hence, a long-term experiment
of the new DLC coating under conditions similar to industrial production is therefore
important to determine the risk of galling.
The present investigation is focused on such a long-term experiment of the new
DLC coating, which is a double-layer DLC/Hyperlox® coating. For the long-term
experiment, the double-layer DLC coating is compared with a good wear and
temperature resistant coating, double-layer Hyperlox® coating, as recommended by the
SHETRIB industrial partner, CemeCON A/S. The Hyperlox® is an AlTiN-based
coating. The high content of aluminium in the Hyperlox® coating results in high
hardness. Previous experience by the company has shown that the very good adhesion
of the Hyperlox® coating reduces the wear and thereby increases tool life and
productivity. A numerical simulation, coupling mechanical and thermal analysis, was
also performed to evaluate the material deformation and heat generation at the
tool/workpiece interface.
9.2 Coating Types
A preliminary series of experiments of a variety of tool coatings demonstrated
that the double-layer coating structure, DLC/Hyperlox®, showed promising results
under severe test conditions, i.e. at high thickness reduction and tool temperature, with
no sign of galling in ironing of stainless steel, as reported in Chapter 8.
In the present study, further investigations are carried out with two double-layer
coating structures, namely DLC/Hyperlox® and Hyperlox®/Hyperlox®. Figure 9.1
and Figure 9.2 depicts schematically the cross section surface morphologies of the two
single-layer coating films, DLC and Hyperlox®, deposited directly to the tool
substrates. The DLC comprises of a gradient DLC coating structure supported by two
other coating films, CrN and CrCN, which acts as bonding layers. Meanwhile, the
Hyperlox® is a stand-alone, modified TiAlN coating film. The thickness of the two
coating layers, DLC and Hyperlox®, was 3 µm each.
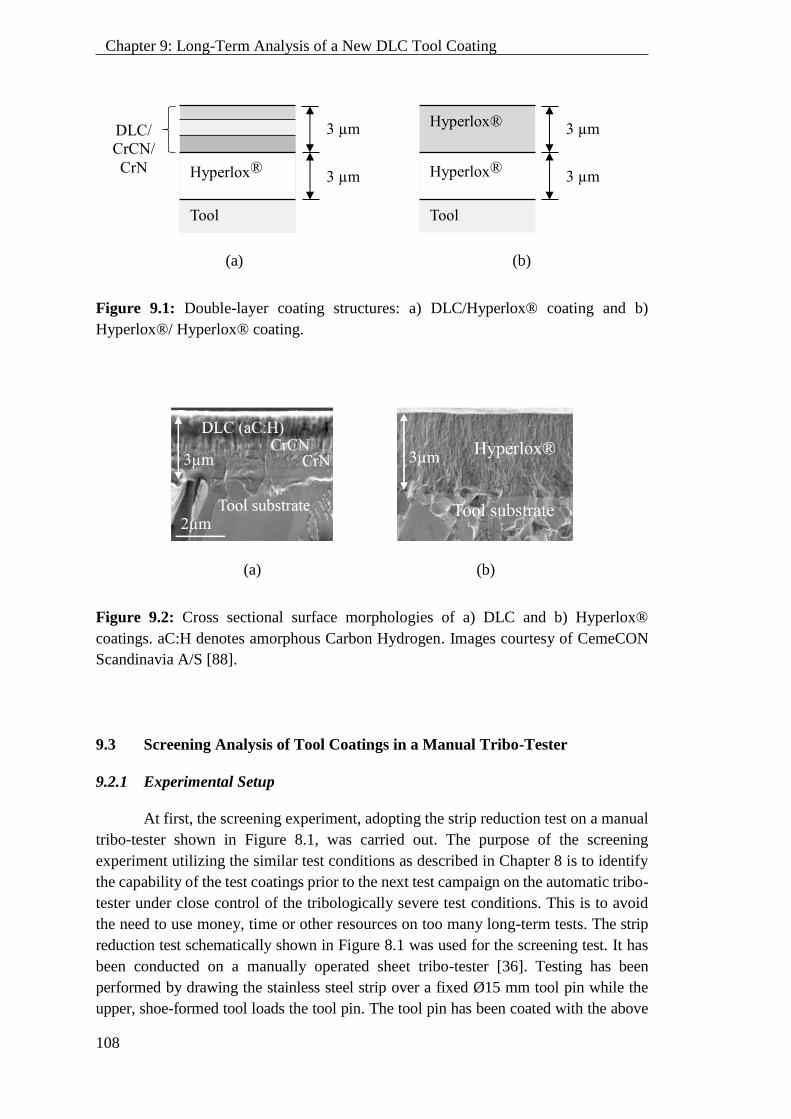
108
Chapter 9: Long-Term Analysis of a New DLC Tool Coating
(a) (b)
Figure 9.1: Double-layer coating structures: a) DLC/Hyperlox® coating and b)
Hyperlox®/ Hyperlox® coating.
(a) (b)
Figure 9.2: Cross sectional surface morphologies of a) DLC and b) Hyperlox®
coatings. aC:H denotes amorphous Carbon Hydrogen. Images courtesy of CemeCON
Scandinavia A/S [88].
9.3 Screening Analysis of Tool Coatings in a Manual Tribo-Tester
9.2.1 Experimental Setup
At first, the screening experiment, adopting the strip reduction test on a manual
tribo-tester shown in Figure 8.1, was carried out. The purpose of the screening
experiment utilizing the similar test conditions as described in Chapter 8 is to identify
the capability of the test coatings prior to the next test campaign on the automatic tribo-
tester under close control of the tribologically severe test conditions. This is to avoid
the need to use money, time or other resources on too many long-term tests. The strip
reduction test schematically shown in Figure 8.1 was used for the screening test. It has
been conducted on a manually operated sheet tribo-tester [36]. Testing has been
performed by drawing the stainless steel strip over a fixed Ø15 mm tool pin while the
upper, shoe-formed tool loads the tool pin. The tool pin has been coated with the above
3 µm
3 µm
Hyperlox®
Tool
DLC/
CrCN/
CrN 3 µm
3 µm Hyperlox®
Hyperlox®
Tool

109
Chapter 9: Long-Term Analysis of a New DLC Tool Coating
mentioned coatings shown in Figure 9.1. Before coating the tool pins are polished to a
surface roughness Ra = 0.02 µm and the roughness is the same after coating. The
workpiece material is austenitic stainless steel EN1.4307 (AISI 304L), 1.2 mm thick,
15 mm wide and 500 mm long. It is used in the “as-received” condition with a sheet
surface roughness Ra = 1.4 µm. A drawing speed υ = 65 mm/s and a thickness reduction
r = 15% are applied.
9.2.2 Results and Discussion
Figure 9.3 shows drawing load as function of drawing distance. A lower
drawing load was observed with the DLC/Hyperlox® coating than with the double-
layer Hyperlox® coating and no pick-up on the coated tool surface was observed with
the former coating. As regards the double-layer Hyperlox® coating, severe pick-up was
detected on the tool surface and in some areas, the coating was peeled off. The results
were further verified by measurement of the final workpiece roughness seen in Figure
9.4.
A very low surface roughness was achieved by the DLC/Hyperlox® coating,
while the Hyperlox®/Hyperlox® coating resulted in heavy scoring on the strip surface,
and the strip broke after a short drawing length. The results indicate that the Hyperlox®
coating offers a good adhesion between the DLC and the tool surface but is unable to
act as the anti-seizure coating film that can sustain high shear stresses, see Figure 9.5.
The screening test suggests that the DLC/Hyperlox® coating shall be the only one
tested in the following, continuous test campaign.
Figure 9.3: Measurement of drawing load and tool surface condition after drawing the
stainless steel in the DLC/Hyperlox® and the Hyperlox®/Hyperlox® coated tools under
dry lubrication condition.
0
5
10
15
20
0 50 100 150 200 250
Dra
win
g L
oad
FD
(kN
)
Drawing Distance L (mm)
2x Hyperlox®
DLC/Hyperlox®
Fractured
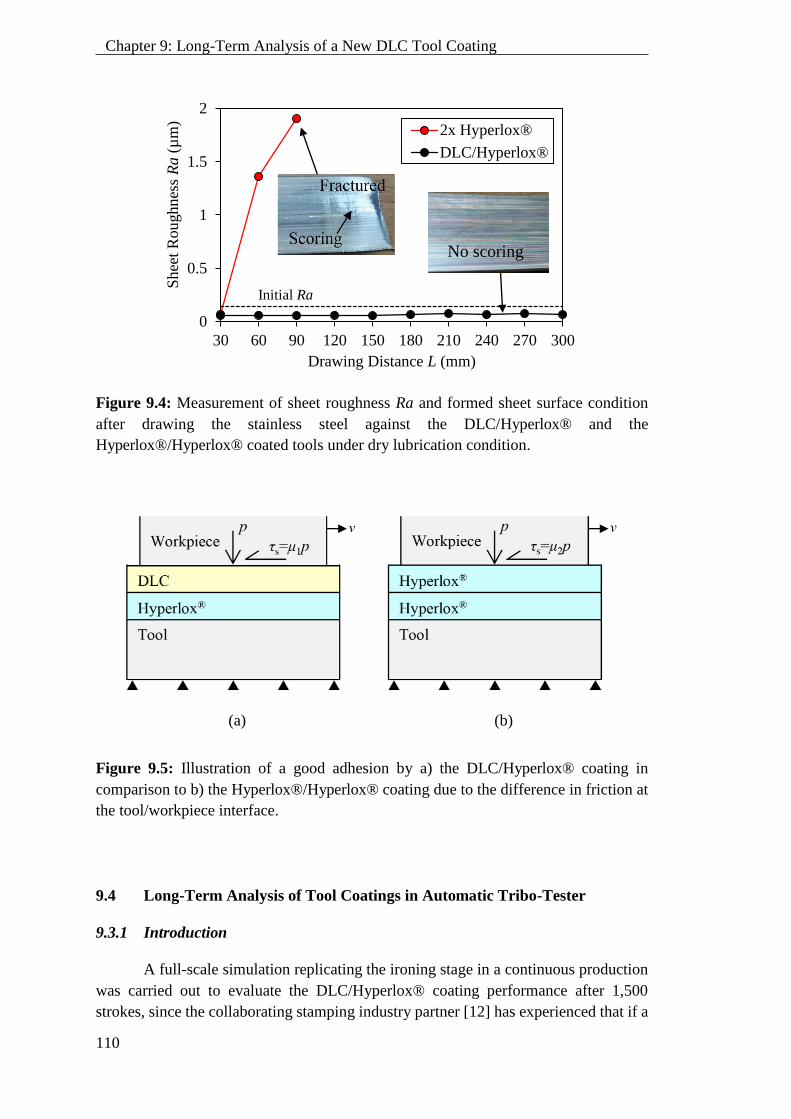
110
Chapter 9: Long-Term Analysis of a New DLC Tool Coating
Figure 9.4: Measurement of sheet roughness Ra and formed sheet surface condition
after drawing the stainless steel against the DLC/Hyperlox® and the
Hyperlox®/Hyperlox® coated tools under dry lubrication condition.
(a) (b)
Figure 9.5: Illustration of a good adhesion by a) the DLC/Hyperlox® coating in
comparison to b) the Hyperlox®/Hyperlox® coating due to the difference in friction at
the tool/workpiece interface.
9.4 Long-Term Analysis of Tool Coatings in Automatic Tribo-Tester
9.3.1 Introduction
A full-scale simulation replicating the ironing stage in a continuous production
was carried out to evaluate the DLC/Hyperlox® coating performance after 1,500
strokes, since the collaborating stamping industry partner [12] has experienced that if a
0
0.5
1
1.5
2
30 60 90 120 150 180 210 240 270 300
Shee
t R
oughnes
s R
a(µ
m)
Drawing Distance L (mm)
2x Hyperlox®
DLC/Hyperlox®
Initial Ra
No scoring
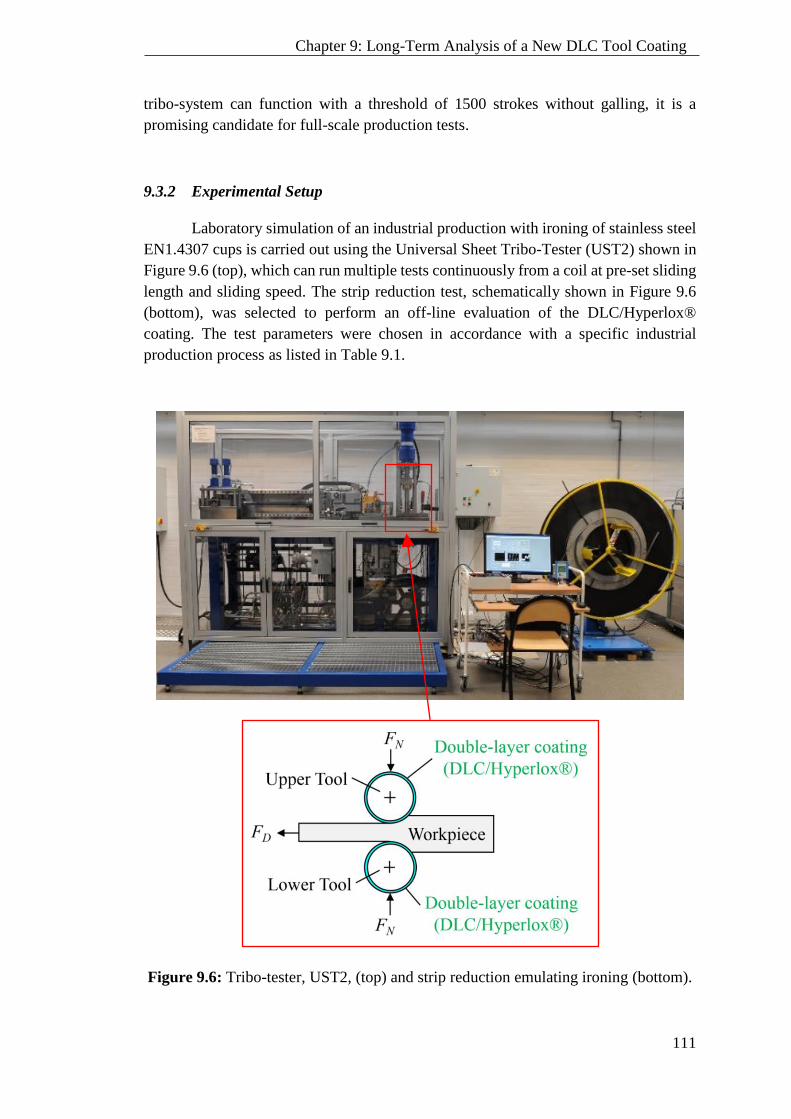
111
Chapter 9: Long-Term Analysis of a New DLC Tool Coating
tribo-system can function with a threshold of 1500 strokes without galling, it is a
promising candidate for full-scale production tests.
9.3.2 Experimental Setup
Laboratory simulation of an industrial production with ironing of stainless steel
EN1.4307 cups is carried out using the Universal Sheet Tribo-Tester (UST2) shown in
Figure 9.6 (top), which can run multiple tests continuously from a coil at pre-set sliding
length and sliding speed. The strip reduction test, schematically shown in Figure 9.6
(bottom), was selected to perform an off-line evaluation of the DLC/Hyperlox®
coating. The test parameters were chosen in accordance with a specific industrial
production process as listed in Table 9.1.
Figure 9.6: Tribo-tester, UST2, (top) and strip reduction emulating ironing (bottom).
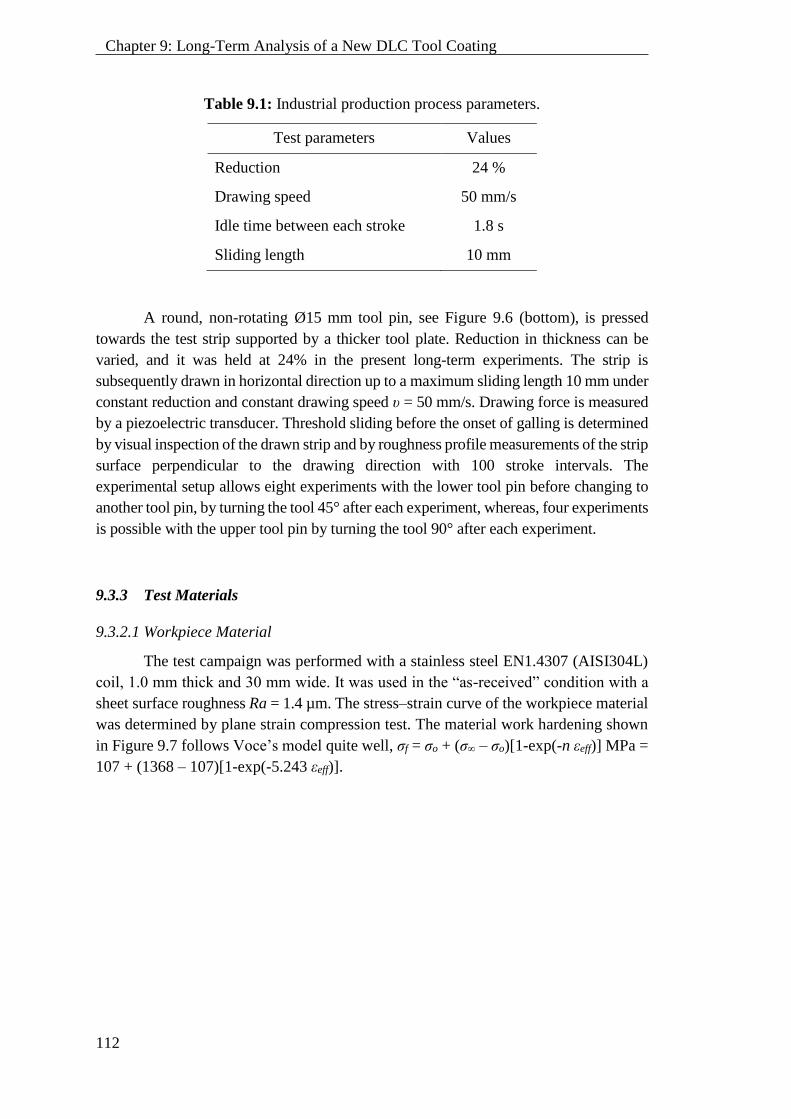
112
Chapter 9: Long-Term Analysis of a New DLC Tool Coating
Table 9.1: Industrial production process parameters.
Test parameters Values
Reduction 24 %
Drawing speed 50 mm/s
Idle time between each stroke 1.8 s
Sliding length 10 mm
A round, non-rotating Ø15 mm tool pin, see Figure 9.6 (bottom), is pressed
towards the test strip supported by a thicker tool plate. Reduction in thickness can be
varied, and it was held at 24% in the present long-term experiments. The strip is
subsequently drawn in horizontal direction up to a maximum sliding length 10 mm under
constant reduction and constant drawing speed υ = 50 mm/s. Drawing force is measured
by a piezoelectric transducer. Threshold sliding before the onset of galling is determined
by visual inspection of the drawn strip and by roughness profile measurements of the strip
surface perpendicular to the drawing direction with 100 stroke intervals. The
experimental setup allows eight experiments with the lower tool pin before changing to
another tool pin, by turning the tool 45° after each experiment, whereas, four experiments
is possible with the upper tool pin by turning the tool 90° after each experiment.
9.3.3 Test Materials
9.3.2.1 Workpiece Material
The test campaign was performed with a stainless steel EN1.4307 (AISI304L)
coil, 1.0 mm thick and 30 mm wide. It was used in the “as-received” condition with a
sheet surface roughness Ra = 1.4 µm. The stress–strain curve of the workpiece material
was determined by plane strain compression test. The material work hardening shown
in Figure 9.7 follows Voce’s model quite well, σf = σo + (σ∞ – σo)[1-exp(-n εeff)] MPa =
107 + (1368 – 107)[1-exp(-5.243 εeff)].
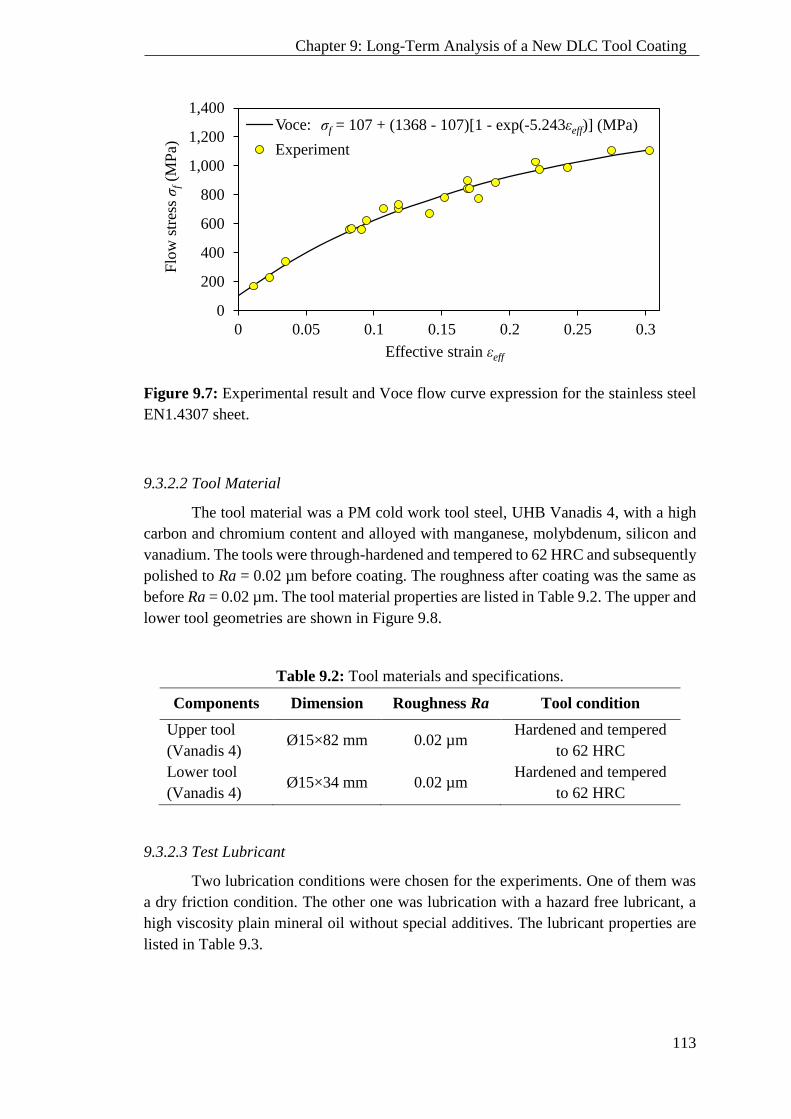
113
Chapter 9: Long-Term Analysis of a New DLC Tool Coating
Figure 9.7: Experimental result and Voce flow curve expression for the stainless steel
EN1.4307 sheet.
9.3.2.2 Tool Material
The tool material was a PM cold work tool steel, UHB Vanadis 4, with a high
carbon and chromium content and alloyed with manganese, molybdenum, silicon and
vanadium. The tools were through-hardened and tempered to 62 HRC and subsequently
polished to Ra = 0.02 µm before coating. The roughness after coating was the same as
before Ra = 0.02 µm. The tool material properties are listed in Table 9.2. The upper and
lower tool geometries are shown in Figure 9.8.
Table 9.2: Tool materials and specifications.
Components Dimension Roughness Ra Tool condition
Upper tool
(Vanadis 4) Ø15×82 mm 0.02 µm
Hardened and tempered
to 62 HRC
Lower tool
(Vanadis 4) Ø15×34 mm 0.02 µm
Hardened and tempered
to 62 HRC
9.3.2.3 Test Lubricant
Two lubrication conditions were chosen for the experiments. One of them was
a dry friction condition. The other one was lubrication with a hazard free lubricant, a
high viscosity plain mineral oil without special additives. The lubricant properties are
listed in Table 9.3.
0
200
400
600
800
1,000
1,200
1,400
0 0.05 0.1 0.15 0.2 0.25 0.3
Flo
w s
tres
s σ
f(M
Pa)
Effective strain εeff
Voce: σ=107+(1368 - 107)(1-exp(-5.243ε)) [MPa]
Experiment
σf = 107 + (1368 - 107)[1 - exp(-5.243εeff)] (MPa)
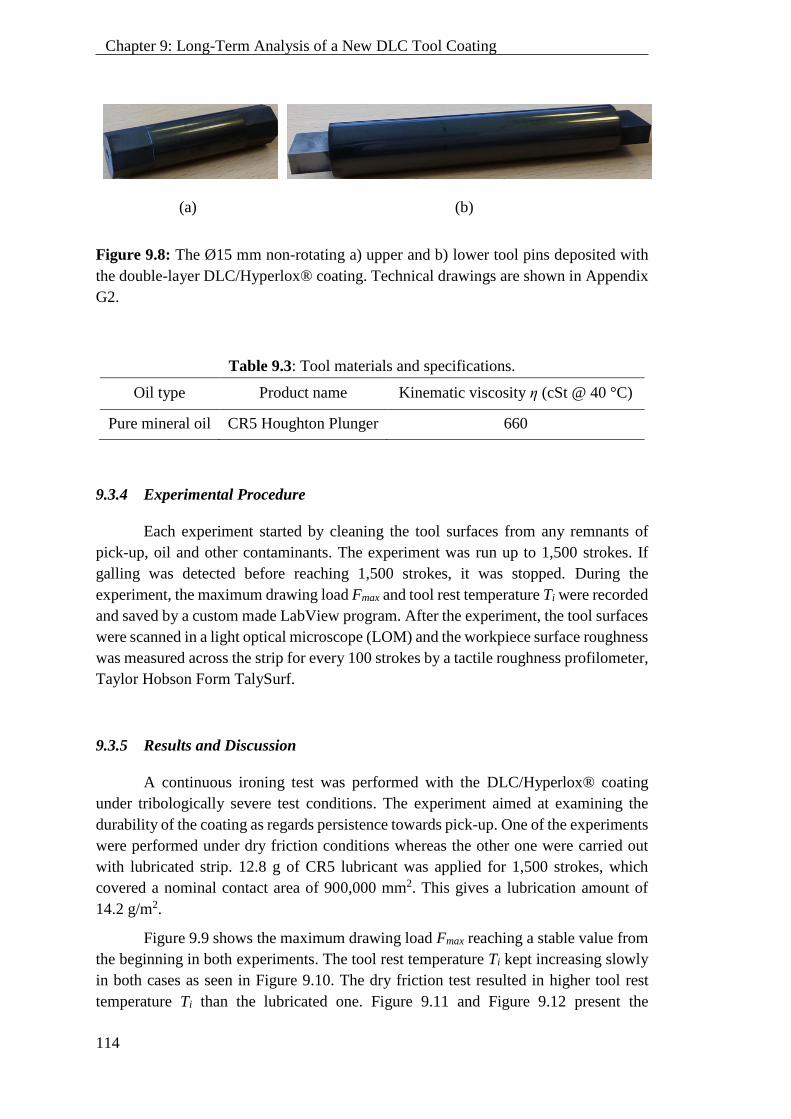
114
Chapter 9: Long-Term Analysis of a New DLC Tool Coating
(a) (b)
Figure 9.8: The Ø15 mm non-rotating a) upper and b) lower tool pins deposited with
the double-layer DLC/Hyperlox® coating. Technical drawings are shown in Appendix
G2.
Table 9.3: Tool materials and specifications.
Oil type Product name Kinematic viscosity η (cSt @ 40 °C)
Pure mineral oil CR5 Houghton Plunger 660
9.3.4 Experimental Procedure
Each experiment started by cleaning the tool surfaces from any remnants of
pick-up, oil and other contaminants. The experiment was run up to 1,500 strokes. If
galling was detected before reaching 1,500 strokes, it was stopped. During the
experiment, the maximum drawing load Fmax and tool rest temperature Ti were recorded
and saved by a custom made LabView program. After the experiment, the tool surfaces
were scanned in a light optical microscope (LOM) and the workpiece surface roughness
was measured across the strip for every 100 strokes by a tactile roughness profilometer,
Taylor Hobson Form TalySurf.
9.3.5 Results and Discussion
A continuous ironing test was performed with the DLC/Hyperlox® coating
under tribologically severe test conditions. The experiment aimed at examining the
durability of the coating as regards persistence towards pick-up. One of the experiments
were performed under dry friction conditions whereas the other one were carried out
with lubricated strip. 12.8 g of CR5 lubricant was applied for 1,500 strokes, which
covered a nominal contact area of 900,000 mm2. This gives a lubrication amount of
14.2 g/m2.
Figure 9.9 shows the maximum drawing load Fmax reaching a stable value from
the beginning in both experiments. The tool rest temperature Ti kept increasing slowly
in both cases as seen in Figure 9.10. The dry friction test resulted in higher tool rest
temperature Ti than the lubricated one. Figure 9.11 and Figure 9.12 present the
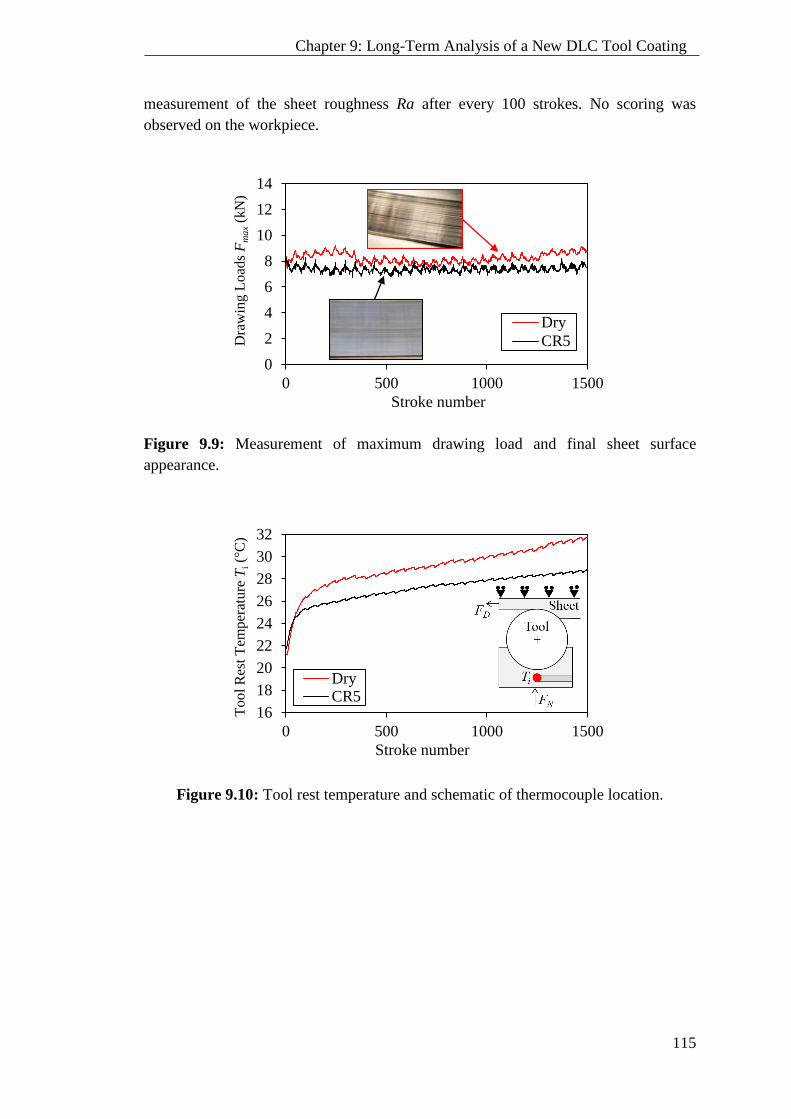
115
Chapter 9: Long-Term Analysis of a New DLC Tool Coating
measurement of the sheet roughness Ra after every 100 strokes. No scoring was
observed on the workpiece.
Figure 9.9: Measurement of maximum drawing load and final sheet surface
appearance.
Figure 9.10: Tool rest temperature and schematic of thermocouple location.
0
2
4
6
8
10
12
14
0 500 1000 1500
Dra
win
g L
oad
s F
ma
x(k
N)
Stroke number
Dry
CR5
16
18
20
22
24
26
28
30
32
0 500 1000 1500
Tool
Res
t T
emper
ature
Ti(°
C)
Stroke number
DryCR5

116
Chapter 9: Long-Term Analysis of a New DLC Tool Coating
Figure 9.11: Measurement of sheet surface roughness Ra under dry condition and final
sheet surface appearance.
In the dry friction test, no pick-up was observed after 1,000 strokes but slight
peeling off of the DLC coating occurred after 1,500 strokes, see Figure 9.13. In the
lubricated test, no pick-up was noticed after 1,500 strokes as seen in Figure 9.14. The
results indicated good adhesion at the interface between the DLC, Hyperlox® and the
tool substrate and a coating that can sustain a high, repetitive normal pressure and shear
stress. In case of lubrication, monitoring the tool temperature is important since an
increase of temperature at the tool/workpiece interface leads to lubricant film
breakdown and galling [37]. These thermal effects are evaluated in the next section.
Figure 9.12: Measurement of sheet surface roughness Ra under well lubricated
condition and final sheet surface condition.
0
0.05
0.1
0.15
0.2
0.25
0.3
0 500 1000 1500
Shee
t R
oughnes
s R
a(µ
m)
Number of strokes
Upper tool
Lower tool
Initial Ra
0
0.05
0.1
0.15
0.2
0.25
0.3
0 500 1000 1500
Shee
t R
ou
ghnes
s R
a(µ
m)
Number of strokes
Upper toolLower tool
Initial Ra

117
Chapter 9: Long-Term Analysis of a New DLC Tool Coating
(a) (b)
Figure 9.13: Tool surface appearance as a result of dry lubrication condition after a)
1,000 strokes and b) 1,500 strokes.
Figure 9.14: Tool surface appearance under lubricated condition after 1,500 strokes.
9.3.6 Numerical Simulation of Strip Reduction Test
A numerical analysis of the strip reduction test was performed with LS-DYNA
v. R7.1.1 using implicit time integration. Figure 9.14 shows the FE model of the strip
reduction assuming plane strain with 1,969 linear quadrilateral elements. Due to
symmetry, only half of the process is modelled. A fine, uniform mesh was applied in
the contact between the workpiece and the tool surface. The tool was modelled as an
elastic object, while the workpiece was treated as an elastic-plastic object of stainless
steel sheet material EN1.4307 according to Voce’s stress-strain curve described in
Figure 9.6.
Peeled off Peeled off
Drawing direction
1,000 strokes
No pick-up
1,500 strokes
No pick-up
1,500 strokes
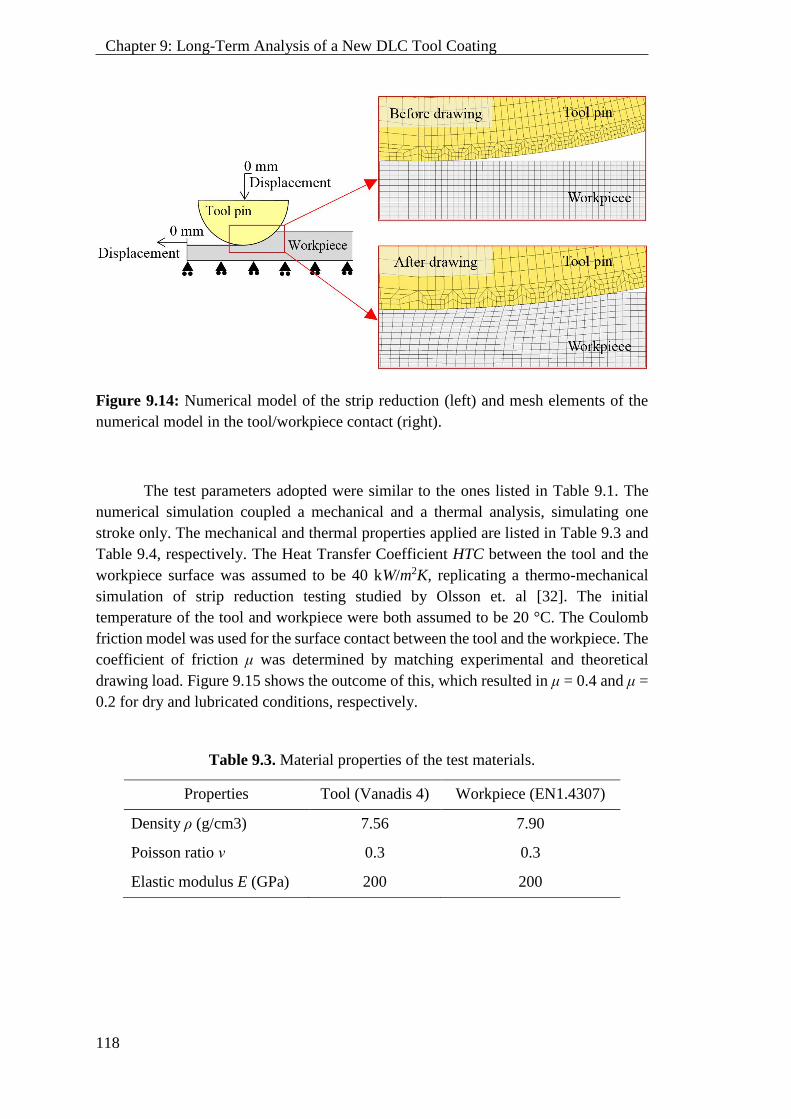
118
Chapter 9: Long-Term Analysis of a New DLC Tool Coating
Figure 9.14: Numerical model of the strip reduction (left) and mesh elements of the
numerical model in the tool/workpiece contact (right).
The test parameters adopted were similar to the ones listed in Table 9.1. The
numerical simulation coupled a mechanical and a thermal analysis, simulating one
stroke only. The mechanical and thermal properties applied are listed in Table 9.3 and
Table 9.4, respectively. The Heat Transfer Coefficient HTC between the tool and the
workpiece surface was assumed to be 40 kW/m2K, replicating a thermo-mechanical
simulation of strip reduction testing studied by Olsson et. al [32]. The initial
temperature of the tool and workpiece were both assumed to be 20 °C. The Coulomb
friction model was used for the surface contact between the tool and the workpiece. The
coefficient of friction μ was determined by matching experimental and theoretical
drawing load. Figure 9.15 shows the outcome of this, which resulted in μ = 0.4 and μ =
0.2 for dry and lubricated conditions, respectively.
Table 9.3. Material properties of the test materials.
Properties Tool (Vanadis 4) Workpiece (EN1.4307)
Density ρ (g/cm3) 7.56 7.90
Poisson ratio ν 0.3 0.3
Elastic modulus E (GPa) 200 200
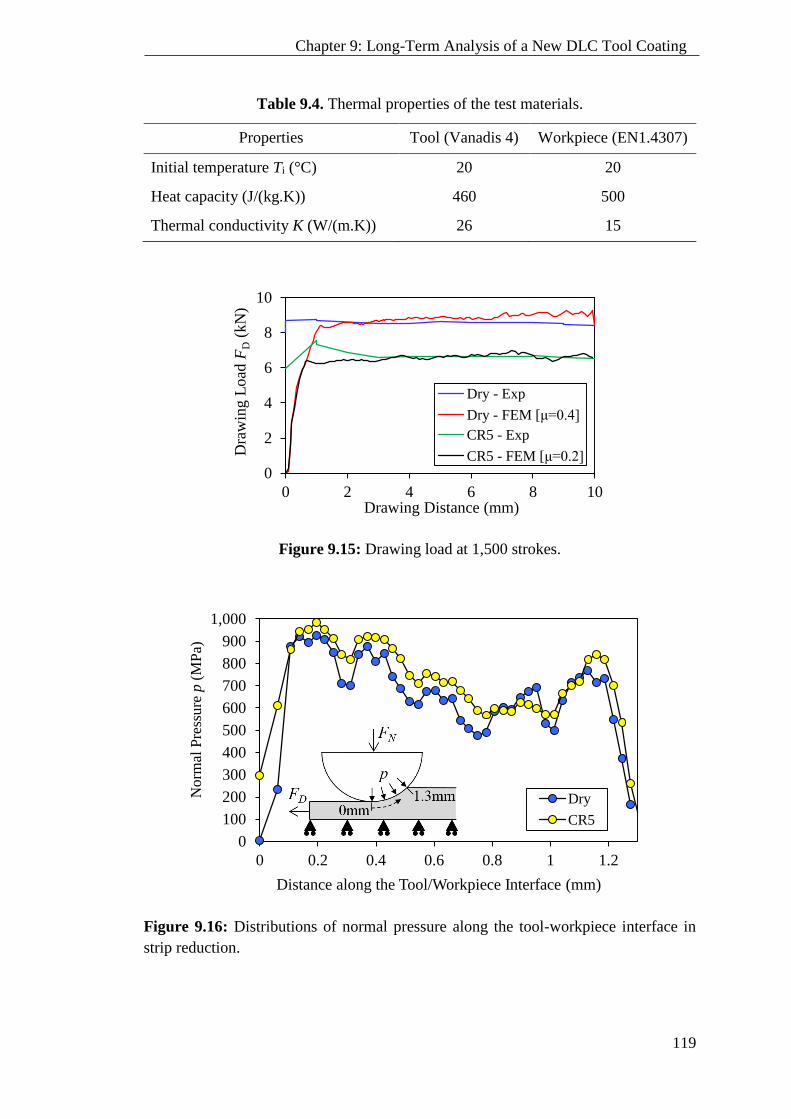
119
Chapter 9: Long-Term Analysis of a New DLC Tool Coating
Table 9.4. Thermal properties of the test materials.
Properties Tool (Vanadis 4) Workpiece (EN1.4307)
Initial temperature Ti (°C) 20 20
Heat capacity (J/(kg.K)) 460 500
Thermal conductivity K (W/(m.K)) 26 15
Figure 9.15: Drawing load at 1,500 strokes.
Figure 9.16: Distributions of normal pressure along the tool-workpiece interface in
strip reduction.
0
2
4
6
8
10
0 2 4 6 8 10
Dra
win
g L
oad
FD
(kN
)
Drawing Distance (mm)
Dry - Exp
Dry - FEM [μ=0.4]
CR5 - Exp
CR5 - FEM [μ=0.2]
0
100
200
300
400
500
600
700
800
900
1,000
0 0.2 0.4 0.6 0.8 1 1.2
Norm
al P
ress
ure
p(M
Pa)
Distance along the Tool/Workpiece Interface (mm)
Dry
CR5
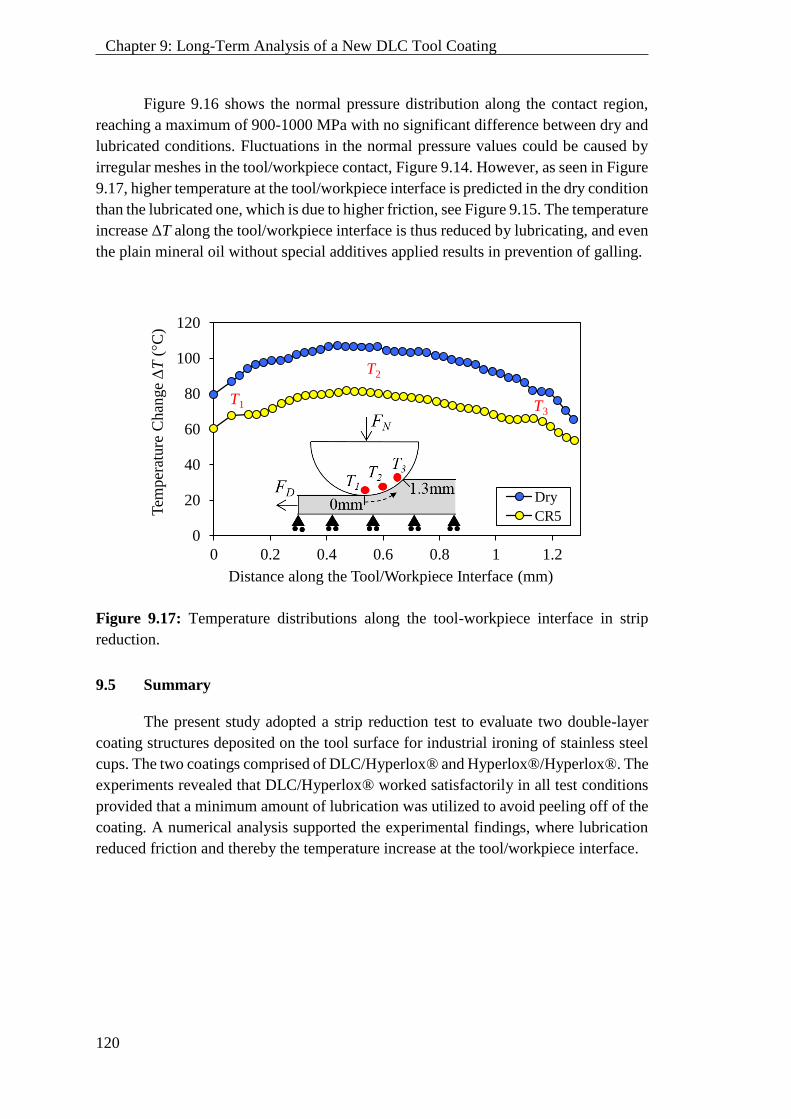
120
Chapter 9: Long-Term Analysis of a New DLC Tool Coating
Figure 9.16 shows the normal pressure distribution along the contact region,
reaching a maximum of 900-1000 MPa with no significant difference between dry and
lubricated conditions. Fluctuations in the normal pressure values could be caused by
irregular meshes in the tool/workpiece contact, Figure 9.14. However, as seen in Figure
9.17, higher temperature at the tool/workpiece interface is predicted in the dry condition
than the lubricated one, which is due to higher friction, see Figure 9.15. The temperature
increase ΔT along the tool/workpiece interface is thus reduced by lubricating, and even
the plain mineral oil without special additives applied results in prevention of galling.
Figure 9.17: Temperature distributions along the tool-workpiece interface in strip
reduction.
9.5 Summary
The present study adopted a strip reduction test to evaluate two double-layer
coating structures deposited on the tool surface for industrial ironing of stainless steel
cups. The two coatings comprised of DLC/Hyperlox® and Hyperlox®/Hyperlox®. The
experiments revealed that DLC/Hyperlox® worked satisfactorily in all test conditions
provided that a minimum amount of lubrication was utilized to avoid peeling off of the
coating. A numerical analysis supported the experimental findings, where lubrication
reduced friction and thereby the temperature increase at the tool/workpiece interface.
0
20
40
60
80
100
120
0 0.2 0.4 0.6 0.8 1 1.2
Tem
per
ature
Chan
ge
ΔT
(°C
)
Distance along the Tool/Workpiece Interface (mm)
Dry
CR5
T1
T2
T3
121
Chapter 10: Conclusion and Future Research
Chapter 10: Conclusion and Future Research
In this chapter, the concluding remarks are summarized on achievements against
thesis aims and objectives set in Chapter 1. The key findings are highlighted and
recommendations towards future research are suggested for each objective.
10.1 Objective 1: Compressibility of Liquid Lubricants
10.1.1 Conclusions
With the aim to determine the bulk modulus of fluids at elevated pressures, two
methodologies were designed and developed. The relationship between the bulk
modulus and the pressure has been established for characterizing the lubricant
entrapment and deformation in micro-plasto-hydrodynamic lubrication.
The proposed methodology consisting of a simple laboratory test and an inverse
FEM analysis, in order to determine the liquid bulk modulus, has proven to work
reasonably in the low pressure regime. It is of importance to determine the lubricant
bulk modulus at larger pressures above 100 MPa, which most of trapped lubricants
experiences in sheet forming of tribologically difficult materials, e.g, stainless steel,
aluminium alloys, and titanium alloys. Thus, this suggests an improved version of the
simple laboratory test, where a stronger specimen material could be used to determine
the bulk modulus at a larger pressure.
The high-pressure equipment for determining lubricant bulk modulus has
proven to work satisfactorily until a pressure of 500 MPa. The pressure is measured
directly in the pressurized lubricant inside the high-pressure container, hence the test
equipment allows for the direct determination of the bulk modulus at various pressure
levels with no influence from friction in the sealing on the moving punch building up
the pressure.
10.1.2 Suggestions for Future Research
Numerical software progresses rapidly to fulfill the demands and applications
in the field of tribology in sheet metal forming. The author believes that lubricant
properties at high pressures will be highly needed in modelling liquid lubricants in the
near future, i.e., micro-hydrodynamic lubrication mechanism for textured
tool/workpiece surfaces. At present, the bulk modulus can be obtained from the high-
pressure equipment designed and developed in this PhD study. The next aim would be
the lubricant viscosity at high pressures in order to obtain a complete lubricant data set
for metal forming.
122
Chapter 10: Conclusion and Future Research
10.2 Objective 2: Structured Tool Surfaces
10.2.1 Conclusions
The second objective of this study addresses textured tool surfaces with a focus
to impede galling. The present experiments on the structured tool surfaces have shown
a positive result regarding improvement of lubrication by facilitating the escape of
trapped lubricant by micro-plasto-hydrodynamic lubrication and thereby reducing the
friction. The theoretical and experimental results show strong agreement that back up
the research claiming that an optimal pocket spacing exists to reduce friction and thus
drawing load, at least for the tool patterns described in this experimental work.
A technique to improve resistivity towards galling by applying textured tool
surface topographies was investigated. Oblong shallow pockets with small pocket
angles, oriented perpendicular to the sliding direction with a distance of 2–4 times the
pocket width were tested. A strip reduction test, which emulates the tribological
conditions in an ironing process, was used for experimental measurements of friction
and determination of possible pick-up and galling. The study included testing of four
different lubricants—two plain mineral oils with a low and a high viscosity, and two
mineral-based oils with boundary lubrication additives having medium and high
viscosity. The results confirmed that tool texture can lower friction and improve
lubrication performance in comparison to that of a fine polished tool surface when the
pocket distance is 2–4 times larger than the pocket width, which ensures a table
mountain structure of the tool topography. The tool textures were advantageous at
greater sliding speeds, when using higher viscosity oils, which facilitates the escape of
trapped lubricant by micro-plasto-hydrodynamic lubrication.
A friction model for a soft workpiece deforming against a textured tool surface
was proposed. The model takes into account the plastic wave motion appearing, when
the workpiece material flows into and out of local pockets between the flat plateaus of
a table mountain like tool surface topography. The model was evaluated by strip
reduction tests, which emulates the tribological conditions in an ironing process. The
study included testing of two different lubricants, a plain mineral oil with a high
viscosity, and a mineral-based oil with boundary lubrication additives having a medium
viscosity. It was found that an optimum amount of tool texture exists which reduces
friction and thus drawing load for the table-mountain-like tool surface topography. The
overall friction factor in the interface between workpiece and textured tool surface can
be satisfactory predicted by the model.
10.2.2 Suggestions for Future Research
Further investigation is needed for long-term analysis of the feasible textured
tool surface with a pocket distance 2-4 times larger than the pocket width to the tool
surface, since the present experiments involved a maximum of up to six repetitions.

123
Chapter 10: Conclusion and Future Research
Alternatively, application of hard coating to the structured tool surface may further
improve resistivity towards galling. Such studies would provide engineers and
researchers with more knowledge about fundamental aspects in the improvement of
textured tool surface behaviour for a continuous production of sheet metal in the
industry.
10.3 Objective 3: Anti-Seizure Tool Coatings
10.3.1 Conclusions
A new DLC coating for ironing of stainless steel under tribologically severe test
conditions, i.e. dry lubrication, large normal pressure and elevated temperature, without
pick-up and galling, was developed in collaboration with CemeCON A/S. The
screening experiments were conducted under varied normal pressure at room
temperature. The experiments were also carried out at elevated temperatures of 80 °C
and 110 °C to investigate the effects of elevated tool temperature on the performance
of a promising double-layer DLC/Hyperlox® tool coating. The new DLC coating
deposited onto the tool surface seems to be able to reduce galling and extend the tool
life.
The screening experiment adopted a strip reduction test on a manually operated
tribo-tester for emulating industrial ironing of stainless steel cups to test DLC coatings
at room temperature as well as elevated tool temperature. Three DLC coating types
were evaluated; single layer DLC, double layer (DLC/Hyperlox®) and multi-layer
(DLC/CrN/Cr). The experiments revealed that the double layer (DLC/Hyperlox®)
coating is the only coating that can function without lubrication at least to 1,000 strokes.
It gave a smooth surface finish of the tested strips with no pick-up on the coated tool
surface. Intermediate metallic layers like Hyperlox® between the DLC film and the
tool substrate ensured good adhesion of the DLC coating and are expected to work
effectively under severe conditions in sheet stamping of stainless steel.
A long-term analysis of the promising DLC tool coating structure was
performed. The analysis involved a strip reduction experiment on an automatic tribo-
tester to evaluate two double-layer coating structures deposited on the tool surface for
replicating industrial ironing of stainless steel cups. The double-layer coating types
comprised of DLC/Hyperlox® and Hyperlox®/Hyperlox® coatings. The experiments
revealed that the new DLC coating, DLC/Hyperlox® coating, specifically developed
for this PhD study was the only tool coating working satisfactorily in all test conditions
provided that a minimum amount of hazard free lubrication is utilized to avoid peeling
off of the coating. A numerical analysis supports the experimental findings, where
lubrication is necessary to reduce the temperature increase at the tool/workpiece
interface by reducing the friction.
124
Chapter 10: Conclusion and Future Research
10.3.2 Suggestions for Future Research
Further investigations into the effect of the newly developed coating to
industrial progressive tools could provide interesting findings. One major direction of
future research is to better understand the effect of different, intermediate metallic
coating films in order to find the most suitable one and to keep the DLC coating as the
top layer and a better adhesion between the tool and the DLC coating surfaces.
Another direction of future research is to perform an industrial production
testing of the new DLC coating, the double-layer DLC/Hyperlox® coating. The current
thesis focused on the off-line tribological simulation testing of the new coating in which
the process parameters are similar to the production. However, additional evidence is
necessary to clearly demonstrate that the new DLC coating will function effectively
without lubrication or using minimum amount of environmentally benign lubrication.

125
References
References
[1] J.A. Schey, G.M. Dalton, Lubrication mechanism in the forming of galvanized
steel sheet, J. Mater. Process. Technol. 24 (1990) 365–374.
doi:10.1016/j.jmatprotec.2010.05.019.
[2] A. Azushima, H. Kudo, Direct observation of contact behaviour to interpret the
pressure dependence of the coefficient of friction in sheet metal forming, CIRP
Ann. - Manuf. Technol. 44 (1995) 209–212. doi:10.1016/S0007-8506(07)62309-
9.
[3] J. Bech, N. Bay, M. Eriksen, A study of mechanisms of liquid lubrication in
metal forming, CIRP Ann. Manuf. Technol. 47 (1998) 221–226.
doi:10.1016/S0007-8506(07)62822-4.
[4] N. Bay, J.I. Bech, J.L. Andreasen, I. Shimizu, Studies on micro plasto
hydrodynamic lubrication in metal forming, in: Met. Form. Sci. Pract. A State-
of-the-Art Vol. Honor. Prof. J.A. Schey., Woodhead Publishing Limited, 2002:
pp. 115–134. doi:10.1016/B978-008044024-8/50007-2.
[5] L. Dubar, C. Hubert, P. Christiansen, N. Bay, A. Dubois, Analysis of fluid
lubrication mechanisms in metal forming at mesoscopic scale, CIRP Ann. -
Manuf. Technol. 61 (2012) 271–274. doi:10.1016/j.cirp.2012.03.126.
[6] M. Geiger, U. Engel, M. Pfestorp, New developments for the quantification of
technical surfaces in forming processes, Ann. CIRP. 46 (1997) 171–174.
[7] D. Schmoeckel, M. Prier, J. Staeves, Topography deformation of sheet metal
during the forming process and its influence on friction, Measurement. 46 (1997)
175–178. doi:10.1016/S0007-8506(07)60802-6.
[8] H. Kijima, N. Bay, Contact conditions in skin-pass rolling, CIRP Ann. - Manuf.
Technol. 56 (2007) 301–306. doi:10.1016/j.cirp.2007.05.070.
[9] P. Groche, J. Stahlmann, J. Hartel, M. Köhler, Hydrodynamic effects of
macroscopic deterministic surface structures in cold forging processes, Tribol.
Int. 42 (2009) 1173–1179. doi:10.1016/j.triboint.2009.03.019.
[10] E. Madsen, Personal communication with Niels Bay, Grundfos A/S. (2012).
[11] F. Lindvall, J. Bergstrom, P. Krakhmalev, N. Bay, The effect of grinding and
polishing procedure of tool steels in sheet metal forming, in: Proc. 4th Int. Conf.
Tribol. Manuf. Process., 2010: pp. 603–612. doi:10.1081/E-EEE2-120046011.
[12] D. Wiklund, M. Liljebgren, J. Berglund, N. Bay, K. Kjellsson, B.-G. Rosén,
Friction in sheet metal forming – A comparison between machined and manually
polished die surfaces, in: Tribol. Manuf. Process. Proc. Int. Conf. Tribol. Manuf.
Process. ICTMP4, 2010: pp. 613–622.
[13] M. Murakawa, N. Koga, S. Takeuchi, Diamondlike carbon-coated dies for deep
drawing of aluminum sheets, J. Manuf. Sci. Eng. Trans. ASME. 121 (1999) 674–
678. doi:10.1115/1.2833101.
[14] B. Podgornik, S. Hogmark, O. Sandberg, Proper coating selection for improved
galling performance of forming tool steel, Wear. 261 (2006) 15–21.
doi:10.1016/j.wear.2005.09.005.
[15] S. Tsuda, S. Yoshihara, S. Kataoka, Dry deep drawing ironing of AZ31
magnesium alloy sheet using diamond coated dies, J. JSTP. 52 (2011) 480–484.
[16] T. Yokosawa, J. Takagi, S. Kataoka, An attempt to polish CVD diamond film by
126
References
ultrasonic vibration polishing without abrasive grain, in: 20th Annu. Meet. Am.
Soc. Precis. Eng. ASPE 2005, 2005.
[17] M. Murakawa, S. Takeuchi, A. Alahelisten, M. Kasugai, An efficient mechanical
polishing method for diamond-coated inserts and testing of their performance,
Surf. Coat. Technol. 86/87 (1996) 686–691.
[18] B. Podgornik, B. Zajec, N. Bay, J. Vizintin, Application of hard coatings for
blanking and piercing tools, Wear. 270 (2011) 850–856.
doi:10.1016/j.wear.2011.02.013.
[19] N. Bay, Metal forming and lubrication. Invited paper. Chapter in Encyclopedia
of Materials: Science and Technology, Elsevier Sci. Ltd. (2000) 5377–5380.
[20] N. Bay, A. Azushima, P. Groche, I. Ishibashi, M. Merklein, M. Morishita, T.
Nakamura, S. Schmid, M. Yoshida, Environmentally benign tribo-systems for
metal forming, CIRP Ann. - Manuf. Technol. 59 (2010) 760–780.
doi:10.1016/j.cirp.2010.05.007.
[21] J.A. Schey, Tribology in Metalworking: Friction, Lubrication and Wear, Am.
Soc. Met. 1 (1983) 1–736.
[22] H. Kim, N. Kardes, Chapter 7: Friction and lubrication, Sheet Met. Form. -
Fundam. 1 (2012) 89–103. doi:10.1016/0043-1648(68)90342-6.
[23] T. Mizuno, M. Okamoto, Effects of lubricant viscosity at pressure and sliding
velocity on lubricating conditions in the compression-friction test on sheet
metals, J. Lubr. Technol. 104 (1982) 53–59. doi:10.1115/1.3253164.
[24] H. Kudo, M. Tsubouchi, H. Takada, K. Okamura, An investigation into plasto-
hydrodynamic lubrication with a cold sheet drawing test, CIRP Ann. - Manuf.
Technol. 31 (1982) 175–180. doi:10.1016/S0007-8506(07)63292-2.
[25] A. Azushima, T. Tsubouchi, H. Kudo, Direct observation of lubricant behaviors
under the micro-PHL at the interface between workpiece and die, Proc. 3rd Int.
Conf. Technol. Plast. 1 (1990) 551–556.
[26] C.G. Sorensen, J.I. Bech, J.L. Andreasen, N. Bay, U. Engel, T. Neudecker, A
basic study of the influence of surface topography on mechanisms of liquid
lubrication in metal forming, CIRP Ann. Manuf. Technol. 48 (1999) 203–208.
http://www.sciencedirect.com/science/article/pii/S0007850607631667.
[27] S.-W. Lo, W.R.D. Wilson, A theoretical model of micro-pool lubrication in
metal forming, J. Tribol. 121 (1999) 731–738. doi:10.1115/1.2834129.
[28] A. Azushima, FEM analysis of hydrostatic pressure generated within lubricant
entrapped into pocket on workpiece surface in upsetting process, J. Tribol. 122
(2000) 822–827. doi:10.1115/1.1286160.
[29] A. Stephany, H.R. Le, M.P.F. Sutcliffe, An efficient finite element model of
surface pit reduction on stainless steel in metal forming processes, J. Mater.
Process. Technol. 170 (2005) 310–316. doi:10.1016/j.jmatprotec.2005.05.008.
[30] J. Bech, N. Bay, M. Eriksen, Entrapment and escape of liquid lubricant in metal
forming, Wear. 232 (1999) 134–139. doi:10.1016/S0043-1648(99)00136-2.
[31] N. Bay, D.D. Olsson, J.L. Andreasen, Lubricant test methods for sheet metal
forming, Tribol. Int. 41 (2008) 844–853. doi:10.1016/j.triboint.2007.11.017.
[32] D.D. Olsson, N. Bay, J.L. Andreasen, Prediction of limits of lubrication in strip
reduction testing, CIRP Ann. - Manuf. Technol. 53 (2004) 231–234.
doi:10.1016/S0007-8506(07)60686-6.

127
References
[33] T. Mang, Encyclopedia of lubricants and lubrication: Sheet metal forming
lubricants, (2014) 1747–1769. doi:10.1007/978-3-642-22647-2.
[34] N Bay, Trends and vision in metal forming tribology, Steel Res. Int. Planetary
(2011) 15–26.
[35] J.L. Andreasen, D.D. Olsson, K. Chodnikiewicz, N. Bay, Bending under tension
test with direct friction measurement, Proc. Inst. Mech. Eng. Part B J. Eng.
Manuf. 220 (2006) 73–80. doi:10.1243/095440505X32913.
[36] J.L. Andreasen, N. Bay, M. Andersen, E. Christensen, N. Bjerrum, Screening the
performance of lubricants for the ironing of stainless steel with a strip reduction
test, Wear. 207 (1997) 1–5. doi:DOI: 10.1016/S0043-1648(96)07462-5.
[37] N. Bay, E. Ceron, Off-line testing of tribo-systems for sheet metal forming
production, Adv. Mater. Res. 966–967 (2014) 3–20.
doi:10.4028/www.scientific.net/AMR.966-967.3.
[38] E. Ceron, N. Bay, A methodology for off-line evaluation of new environmentally
friendly tribo-systems for sheet metal forming, CIRP Ann. - Manuf. Technol. 62
(2013) 231–234. doi:10.1016/j.cirp.2013.03.062.
[39] P.S. Nielsen, K.S. Friis, N. Bay, Testing and modelling of new tribo-systems for
industrial sheet forming of stainless steels, Proc. Inst. Mech. Eng. Part J J. Eng.
Tribol. 225 (2011) 1036–1047. doi:10.1177/1350650111415331.
[40] K. Großmann, H. Wiemer, A. Hardtmann, L. Penter, S. Kriechenbauer,
Adjusting the contact surface of forming tools in order to compensate for elastic
deformations during the process, 7th Eur. LS-DYNA Conf. (2009).
[41] H. Kim, M. Kimchi, N. Kardes, T. Altan, Effects of variable elastic modulus on
springback predictions in stamping Advanced High-Strength Steels (AHSS).
Steel Research International, in: Spec. Ed. 10th Int. Conf. Technol. Plast. ICTP
2011, 2011: pp. 628–633.
[42] R. Krux, W. Homberg, M. Kalveram, M. Trompeter, M. Kleiner, K. Weinert,
Die surface structures and hydrostatic pressure system for the material flow
control in high-pressure sheet metal forming, Adv. Mater. Res. 6–8 (2005) 385–
392. doi:10.4028/www.scientific.net/AMR.6-8.385.
[43] A. Godi, J. Grønbæk, L. De Chiffre, Off-line testing of multifunctional surfaces
for metal forming applications, CIRP J. Manuf. Sci. Technol. 11 (2015) 28–35.
doi:10.1016/j.cirpj.2015.06.001.
[44] D. Wiklund, M. Liljengren, N. Bay, K. Kjellsson, B. Rosén, Effects of tool die
surface topography on friction and galling in sheet metal forming, Swedish Prod.
Symp. (2009) 1–6.
[45] J. Berglund, C.A. Brown, B.G. Rosen, N. Bay, B.G. Rosén, N. Bay, Milled die
steel surface roughness correlation with steel sheet friction, CIRP Ann. - Manuf.
Technol. 59 (2010) 577–580. doi:10.1016/j.cirp.2010.03.140.
[46] E. Ceron, M. Olsson, N. Bay, Lubricant film breakdown and material pick-up in
sheet forming of advanced high strength steels and stainless steels when using
environmental friendly lubricants, Adv. Mater. Res. 967 (2014) 219–227.
doi:10.4028/www.scientific.net/AMR.966-967.219.
[47] R.S. Eriksen, M. Arentoft, J. Grønbæk, N. Bay, Manufacture of functional
surfaces through combined application of tool manufacturing processes and
Robot Assisted Polishing, CIRP Ann. - Manuf. Technol. 61 (2012) 563–566.
doi:10.1016/j.cirp.2012.03.020.

128
References
[48] H.L. Costa, I.M. Hutchings, Development of a maskless electrochemical
texturing method, J. Mater. Process. Technol. 209 (2009) 3869–3878.
doi:10.1016/j.jmatprotec.2008.09.004.
[49] V. Franzen, J. Witulski, A. Brosius, M. Trompeter, A.E. Tekkaya, Textured
surfaces for deep drawing tools by rolling, Int. J. Mach. Tools Manuf. 50 (2010)
969–976. doi:10.1016/j.ijmachtools.2010.08.001.
[50] K. Wagner, R. Völkl, U. Engel, Tool life enhancement in cold forging by locally
optimized surfaces, J. Mater. Process. Technol. 201 (2008) 2–8.
doi:10.1016/j.jmatprotec.2007.11.152.
[51] B. Podgornik, J. Jerina, Surface topography effect on galling resistance of coated
and uncoated tool steel, Surf. Coatings Technol. 206 (2012) 2792–2800.
doi:10.1016/j.surfcoat.2011.11.041.
[52] M. Geiger, U. Popp, U. Engel, Excimer laser micro texturing of cold forging tool
surfaces - Influence on tool life, CIRP Ann. - Manuf. Technol. 51 (2002) 231–
234. doi:10.1016/S0007-8506(07)61506-6.
[53] I. Shimizu, J.L. Andreasen, J.I. Bech, N. Bay, Influence of workpiece surface
topography on the mechanisms of liquid lubrication in strip drawing, J. Tribol.
123 (2001) 290. doi:10.1115/1.1308017.
[54] A. Godi, J. Grønbæk, L. De Chiffre, Characterisation and full-scale production
testing of multifunctional surfaces for deep drawing applications, CIRP J.
Manuf. Sci. Technol. 16 (2015) 64–71. doi:10.1016/j.cirpj.2016.07.001.
[55] M. Steitz, P. Stein, P. Groche, Influence of hammer-peened surface textures on
friction behavior, Tribol. Lett. 58 (2015) 1–8. doi:10.1007/s11249-015-0502-9.
[56] U. Engel, Tribology in microforming, Wear. 260 (2006) 265–273.
doi:10.1016/j.wear.2005.04.021.
[57] L. Hiegemann, C. Weddeling, N. Ben Khalifa, E. Tekkaya, Control of the
material flow in deep drawing by the use of rolled surface textures, in: Offentl.
Kolloquium - SFB 708, 2013: pp. 33–43.
[58] F. Klocke, D. Trauth, F. Schongen, a. Shirobokov, Analysis of friction between
stainless steel sheets and machine hammer peened structured tool surfaces:
experimental and numerical investigation of the lubricated interaction gap, Prod.
Eng. 8 (2013) 263–272. doi:10.1007/s11740-013-0519-6.
[59] F. Klocke, D. Trauth, M. Terhorst, P. Mattfeld, Wear analysis of tool surfaces
structured by machine hammer peening for foil-free forming of stainless steel,
Adv. Mater. Res. 1018 (2014) 317–324.
doi:10.4028/www.scientific.net/AMR.1018.317.
[60] H. Kim, S. Han, Q. Yan, T. Altan, Evaluation of tool materials, coatings and
lubricants in forming galvanized advanced high strength steels (AHSS), CIRP
Ann. - Manuf. Technol. 57 (2008) 299–304. doi:10.1016/j.cirp.2008.03.029.
[61] H. Kim, S.-S. Han, K. Kim, T. Altan, Investigation of galling in forming of
galvanized advanced high strength steels - Sixth progress report: Evaluation of
die coatings and stamping lubricants using the strip drawing test, CPF Rep. No
CPF 2.3/08/02. (2008) 1–27.
[62] S. Tsuda, S. Yoshihara, S. Kataoka, Formability of AZ31 Mg alloy sheet in dry
press forming using diamond coated dies, in: Proc. ASME 2009 Int. Mech.
Congr. Expo. IMECE2009, 2009: pp. 1–6.
[63] T. Aizawa, E. Iwamura, K. Itoh, Nano-lamination in amorphous carbon for
129
References
tailored coating in micro-dry stamping of AISI-304 stainless steel sheets, Surf.
Coatings Technol. 203 (2008) 794–798. doi:10.1016/j.surfcoat.2008.08.059.
[64] J. Vetter, 60 years of DLC coatings: Historical highlights and technical review
of cathodic arc processes to synthesize various DLC types, and their evolution
for industrial applications, Surf. Coat. Technol. 257 (2014) 213–240.
doi:10.1016/j.surfcoat.2014.08.017.
[65] K. Holmberg, A. Matthews, H. Ronkainen, Coatings tribology—contact
mechanisms and surface design, Tribol. Int. 31 (1998) 107–120.
doi:10.1016/S0301-679X(98)00013-9.
[66] S. Kataoka, Improvements in adhesion of DLC thin film on the tool for dry deep
drawing process, Mem. Shonan, Inst. Technol. 41 (2008) 11–18.
[67] B. Podgornik, S. Hogmark, O. Sandberg, Hard PVD coatings and their
perspectives in forming tool applications, in: 6th Int. Tool. Conf., 2002: pp.
1053–1066.
[68] S. PalDey, S.C. Deevi, Single layer and multilayer wear resistant coatings of
(Ti,Al)N: A review, Mater. Sci. Eng. A. 342 (2003) 58–79. doi:10.1016/S0921-
5093(02)00259-9.
[69] L.M. Alves, C. V. Nielsen, P.A.F. Martins, Revisiting the fundamentals and
capabilities of the stack compression test, Exp. Mech. 51 (2011) 1565–1572.
doi:10.1007/s11340-011-9480-5.
[70] H. Kudo, A note on the role of microscopically trapped trapped lubricant at the
tool-work interface, J. Mech. Sci. 7 (1965) 383–388. doi:10.1016/0020-
7403(65)90066-4.
[71] T. Wanheim, Friction at high normal pressures, Wear. 25 (1973) 225–244.
doi:10.1016/0043-1648(73)90074-4.
[72] T. Nellemann, N. Bay, T. Wanheim, Real area of contact and friction stress - the
role of trapped lubricant, Wear. 43 (1977) 45–53. doi:10.1016/0043-
1648(77)90042-4.
[73] ASTM International, Standard test method for determination of isothermal
secant and tangent bulk modulus, in: ASTM Int. West Conshohocken, PA, 2012:
pp. 1–5. doi:10.1520/D6793-02R12.
[74] B.O. Jacobson, Rheology and elastohydrodynamic lubrication, in: Elsevier New
York USA, 1991: pp. 1–382.
[75] S. Bair, M. Baker, D.M. Pallister, Revisiting the compressibility of oil/refrigerant
lubricants, J. Tribol. 139 (2016) 1–4. doi:10.1115/1.4033335.
[76] L.H. Butler, Surface conformation of metals under high nominal contact
pressures, Metallurgia. 58 (1960) 167–174.
[77] M.T.O. Lund, N.S. Hansen, Design and construction of high pressure
viscometer, Masters Thesis, Tech. Univ. Denmark. (2016) 1–271.
[78] B. Sundström, Handbok och formelsamling i Hållfasthetslära (in swedish), KTH,
1998.
[79] A.T.J. Hayward, Compressibility equations for liquids: a comparative study, Br.
J. Appl. Phys. 18 (1967) 965–977. doi:10.1088/0508-3443/18/7/312.
[80] A. Godi, K. Mohaghegh, J. Grønbæk, P. Klit, L. De Chiffre, Testing of newly
developed functional surfaces under pure sliding conditions, Tribol. Lett. 51
(2013) 171–180. doi:10.1007/s11249-013-0162-6.
130
References
[81] H.L. Costa, I.M. Hutchings, Effects of die surface patterning on lubrication in
strip drawing, J. Mater. Process. Technol. 209 (2009) 1175–1180.
doi:10.1016/j.jmatprotec.2008.03.026.
[82] M.H. Sulaiman, P. Christiansen, N. Bay, The influence of tool texture on friction
and lubrication in strip reduction testing, Lubricants. 5 (2017) 1–11.
doi:10.3390/lubricants5010003.
[83] I. Shimizu, P.A.F. Martins, N. Bay, J.L. Andreasen, J.I. Bech, Influences of
lubricant pocket geometry and working conditions upon micro lubrication
mechanisms in upsetting and strip drawing, Int. J. Surf. Sci. Eng. 4 (2010) 42–
54. doi:http://dx.doi.org/10.1504/IJSURFSE.2010.029628.
[84] U. Popp, U. Engel, Microtexturing of cold-forging tools - Influence on tool life,
Proc. Inst. Mech. Eng. Part B J. Eng. Manuf. 220 (2006) 27–33.
doi:10.1243/095440505X32968.
[85] T. Wanheim, T. Abildgaard, A mechanism for metallic friction, in: Proc. 4th Int.
Conf. Prod. Eng. Tokyo, 1980: pp. 122–127.
[86] E. Siebel, Untersuchungen über bildsame Formänderung unter besonderer
Berück- sichtigung des Schmiedens, Maschinenbau/Betrieb. 9 (1923) 307–312.
[87] S. Paskvale, M. Kahn, M. Cekada, P. Panjan, W. Waldhauser, B. Podgornik,
Tribological properties of diamond-like carbon coatings prepared by anode layer
source and magnetron sputtering, Surf. Coatings Technol. 205 (2011) 99–102.
doi:10.1016/j.surfcoat.2010.06.006.
[88] A. de Neergaard, Personal communication with M.H. Sulaiman, CemeCON
Scand. A/S. March 22th, 2017. (2017).
131
Appendices
Appendices
Appendix A1: MATLAB code for tensile test
clear all
clc
%% This program computes the stress-strain behaviour based on tensile
test
% Models that can be fitted
% 1: Hollomon
% 2: Swift
% 3: Voce
% 4: Ludwik
%% Import of data
Data = load('Data.txt'); % [Load [kp], length change [mm], width
[mm]]
Data_treatment = load('Data treatment.txt'); % [Material model,
Sample length [mm], sheet thickness [mm], sample length to start fit
[mm], sample length to end fit [mm]]
%% Data treatment
if length(Data(1,:)) > 3
Data(:,1) = []; % Removing column with login time
end
% Converting numbers to positive
Data = abs(Data);
% Filtering of data
Filtersize = 1000;
Data_filtered = [zeros(Filtersize,3); Data]; % Inserting dummy data
in the beginning for the filtering process
Data_filtered(1:Filtersize,3) = Data(1,3); % Inserting initial width
of specimen
Data_filtered(:,1) =
filter(ones(1,Filtersize)/Filtersize,1,Data_filtered(:,1)); % Filter
force
Data_filtered(:,2) =
filter(ones(1,Filtersize)/Filtersize,1,Data_filtered(:,2)); % Filter
elongation
Data_filtered(:,3) =
filter(ones(1,Filtersize)/Filtersize,1,Data_filtered(:,3)); % Filter
width
Data_filtered(1:Filtersize,:) = []; % Removing dummy data
Data = Data_filtered;
% Offsetting data
Data(:,2) = Data(:,2) - min(Data(:,2)); % Setting initial elongation
to zero
[value,i] = max(Data(:,2)); % Removing data after maximum elongation
Data(i:end,:) = [];
Data = sortrows(Data,2); % Sorting data according to elongation
[value,i_start] = min(abs(Data(:,2)-Data_treatment(4))); % Starting
point of data treatment
[value,i_end] = min(abs(Data(:,2)-Data_treatment(5))); % End point of
data treatment
132
Appendices
% Initial dimensions
L0 = Data_treatment(2); % Measurement length [mm]
t0 = Data_treatment(3); % Initial thickness [mm]
W0 = max(Data(:,3)); % Initial width [mm]
A0 = W0*t0; % Initial cross sectional area [mm^2]
% Computation of deformation
L = L0+Data(:,2); % Length during deformation [mm]
W = Data(:,3); % Width during deformation
t = L0*W0*t0./(W.*L); % Thickness during deformation
A = W.*t; % Cross sectional area during deformation [mm^2]
% Force
F = Data(:,1)*9.80665; % Conversion from kp to N
% Stress and strains
Epsilon_L = log(L(i_start:i_end)/L(i_start)); % Length strain
Epsilon_W = log(W(i_start:i_end)/W(i_start)); % Width strain
Epsilon_t = -Epsilon_W - Epsilon_L; % Thickness strain
Epsilon = sqrt(2/3*(Epsilon_L.^2+Epsilon_W.^2+Epsilon_t.^2)); %
Effective strain
Sigma = F(i_start:i_end)./A(i_start:i_end); % Flow stress
Intermediate = [Epsilon Sigma]; % Intermediate matrix to sort
according to effective strain
Intermediate = sortrows(Intermediate,1); % Sorting according to
effective strain
Epsilon = Intermediate(:,1); % Overwritting effective strain
Sigma = Intermediate(:,2); % Overwritting effective stress
% Less points
EpsilonXX = Epsilon(1:100:7566);
SigmaXX = Sigma(1:100:7566);
% Computing Lankford coefficient
R = Epsilon_W./Epsilon_t; % Lankford coefficient
Epsilon_minimum_R = 0.05; % Minimum strain under which R is not
computed
[x,i_R] = min(abs(Epsilon-Epsilon_minimum_R)); % Only use strains
larger than a given minimum to compute average R
R_average = mean(R(i_R:end)); % Average Lankford coefficient
%% Data fitting
% Hollomon
if Data_treatment(1) == 1
Hollomon = @(x) norm(x(1)*Epsilon.^x(2) - Sigma);
Hollomon_constants = fminsearchbnd(Hollomon,[mean(Sigma) 0.1],[0
0]);
C = Hollomon_constants(1);
n = Hollomon_constants(2);
Sigma_fit = C*Epsilon.^n;
C_legend = num2str(C,'%10.0f');
n_legend = num2str(n,'%10.3f');
legend2 = ['Hollomon:
$\sigma_{o}=$',C_legend,'$\left(\bar{\varepsilon}^{pl}\right)^{',n_le
gend,'} [MPa]$'];
end
% Swift
if Data_treatment(1) == 2
133
Appendices
Swift = @(x) norm(x(1)*(x(2)+Epsilon).^x(3) - Sigma);
Swift_constants = fminsearchbnd(Swift,[mean(Sigma) 0.1 0.1],[0 0
0]);
C = Swift_constants(1);
B = Swift_constants(2);
n = Swift_constants(3);
Sigma_fit = C*(B+Epsilon).^n;
C_legend = num2str(C,'%10.0f');
B_legend = num2str(B,'%10.3f');
n_legend = num2str(n,'%10.3f');
legend2 = ['Swift:
$\sigma_{o}=$',C_legend,'$\left(',B_legend,'+\bar{\varepsilon}^{pl}\r
ight)^{',n_legend,'} [MPa]$'];
end
% Voce
if Data_treatment(1) == 3
Voce = @(x) norm(x(1)+(x(2)-x(1))*(1-exp(-x(3)*Epsilon)) -
Sigma);
Voce_constants = fminsearchbnd(Voce,[min(Sigma) max(Sigma) 10],[0
0 0]);
a_Voce = Voce_constants(1);
b_Voce = Voce_constants(2);
c_Voce = Voce_constants(3);
Sigma_fit = a_Voce + (b_Voce-a_Voce)*(1-exp(-c_Voce*Epsilon));
a_legend = num2str(a_Voce,'%10.0f');
b_legend = num2str(b_Voce,'%10.0f');
c_legend = num2str(c_Voce,'%10.1f');
legend2 = ['Voce: $\sigma_{o}=$',a_legend,'$+\left(',b_legend,'-
',a_legend,'\right)\left(1-exp\left(-
',c_legend,'\bar{\varepsilon}\right)\right) [MPa]$'];
end
% Ludwik
if Data_treatment(1) == 4
Ludwik = @(x) norm(x(1)*Epsilon.^x(2)+x(3) - Sigma);
Ludwik_constants = fminsearchbnd(Ludwik,[mean(Sigma) 0.1
min(Sigma)],[0 0 0]);
C = Ludwik_constants(1);
n = Ludwik_constants(2);
Sigma_0 = Ludwik_constants(3);
Sigma_fit = C*Epsilon.^n+Sigma_0;
C_legend = num2str(C,'%10.0f');
n_legend = num2str(n,'%10.3f');
Sigma_0_legend = num2str(Sigma_0,'%10.0f');
legend2 = ['Ludwik:
$\sigma_{o}=$',C_legend,'$\left(\bar{\varepsilon}^{pl}\right)^{',n_le
gend,'}+',Sigma_0_legend,' [MPa]$'];
end
%% Writting output stress-strain file
% Generating file and writting number of data points
Number_of_data_points_for_export = 20;
fid = fopen('Stress_strain.txt','w');
fprintf(fid,'%-5.0f\n',Number_of_data_points_for_export);
fclose(fid);
fid = fopen('Stress_strain.txt','a');
% % Linear distribution of strains
134
Appendices
% Epsilon_export =
linspace(0,max(Epsilon),Number_of_data_points_for_export)';
% Sigma_export = interp1(Epsilon,Sigma,Epsilon_export);
% Data_for_export = [Epsilon_export Sigma_export];
% fprintf(fid,'%-5.5f %-5.2f\n',Data_for_export');
% fclose(fid);
% Distributing strains according to a progressive series
Epsilon_min_export = 1E-4;
Epsilon_max_export = max(Epsilon);
a = Epsilon_min_export;
r =
(Epsilon_max_export/Epsilon_min_export)^(1/(Number_of_data_points_for
_export-2));
for i=1:Number_of_data_points_for_export-1
Epsilon_export(i,1) = a*r^(i-1);
end
Epsilon_export = [0; Epsilon_export];
Sigma_export = interp1(Epsilon,Sigma,Epsilon_export);
% Distributing strains according to power law
Epsilon_min_export = 0;
Epsilon_max_export = max(Epsilon);
b = Epsilon_min_export;
n = log(Epsilon_max_export-
Epsilon_min_export)/log(Number_of_data_points_for_export);
[0:1:Number_of_data_points_for_export].^n;
% Writting data
Data_for_export = [Epsilon_export Sigma_export];
fprintf(fid,'%-5.5f %-5.2f\n',Data_for_export');
fclose(fid);
%% Plots
% Load-stroke
f1 = figure(1);
plot(Data(:,2),Data(:,1)*9.80665,'.k');
hold on
plot(L(i_start:i_end)-L0,F(i_start:i_end),'.r');
hold off
xlabel('Elongation [mm]')
ylabel('Force [N]')
legend('All data','Data used for stress-strain
fit','location','southeast')
orient landscape
%enhance_plot(0,20,0,0,0)
print(f1,'-dpdf','Load_stroke')
close all
% Stress-strain
f1 = figure(1);
plot(Epsilon,Sigma,'.k')
hold on
plot(Epsilon,Sigma_fit,'-r')
hold off
xlabel('True effective strain')
ylabel('True stress [MPa]')
orient landscape
%enhance_plot(0,20,0,0,0)

135
Appendices
legend1 = ['Experiment'];
legend({legend1,legend2},'Location','southeast','interpreter','latex'
);
print(f1,'-dpdf','Stress_strain')
close all
% Lankford coefficient
f1 = figure(1);
plot(Epsilon(i_R:end),R(i_R:end),'.r')
hold on
plot(Epsilon,R,'.k')
plot(Epsilon(i_R:end),R(i_R:end),'.r')
hold off
axis( [min(Epsilon) max(Epsilon) 0 2] )
R_label = num2str(R_average,'%10.2f');
legend_R1 = ['Experiment'];
legend_R2 = ['R= ',R_label];
legend({legend_R1},{legend_R2});
xlabel('True effective strain')
ylabel('Lankford coefficient R')
orient landscape
%enhance_plot(0,20,0,0,0)
print(f1,'-dpdf','Lankford_coefficient')
close all

136
Appendices
Appendix A2: MATLAB code for compression test of cylindrical specimen
clear all
clc
%% Program to compute stress-strain curves
%% Loading of data
Test1 = load('Test 1.txt');
Test2 = load('Test 2.txt');
x_start = 300;
x_finish = 700;
D0 = 20.05;
H0 = 20.05;
A0 = D0*D0/4*pi;
Press_stroke = abs(Test1(x_start:x_finish,2) - Test1(x_start,2));
Press_force = Test1(x_start:x_finish,1)*1E3/10;
H = H0 - Press_stroke;
A = H0./H*A0;
Epsilon_eff = log(H0./H);
Sigma_eff = Press_force./A;
Epsilon_eff(1) = [];
Sigma_eff(1) = [];
%% Fitting of data
Hollomon = @(x) norm( x(1)*Epsilon_eff.^x(2) - Sigma_eff );
Constants_Hollomon = fminsearch(Hollomon,[150 0.2]);
Stress_Hollomon =
Constants_Hollomon(1)*Epsilon_eff.^Constants_Hollomon(2);
Ludwik = @(x) norm(x(1)*Epsilon_eff.^x(2) + x(3) - Sigma_eff);
Constants_Ludwik = fminsearch(Ludwik,[150 0.2 10]);
Stress_Ludwik =
Constants_Ludwik(1)*Epsilon_eff.^Constants_Ludwik(2)+Constants_Ludwik
(3);
Swift = @(x) norm(x(1)*(x(3)+Epsilon_eff).^x(2) - Sigma_eff);
Constants_Swift = fminsearch(Swift,[150 0.2 0.1]);
Stress_Swift =
Constants_Swift(1)*(Constants_Swift(3)+Epsilon_eff).^Constants_Swift(
2);
%% Plots
plot(Epsilon_eff,Sigma_eff,'.k')
hold on
plot(Epsilon_eff,Stress_Hollomon,'-r')
plot(Epsilon_eff,Stress_Ludwik,'-g')
plot(Epsilon_eff,Stress_Swift,'-b')
hold off
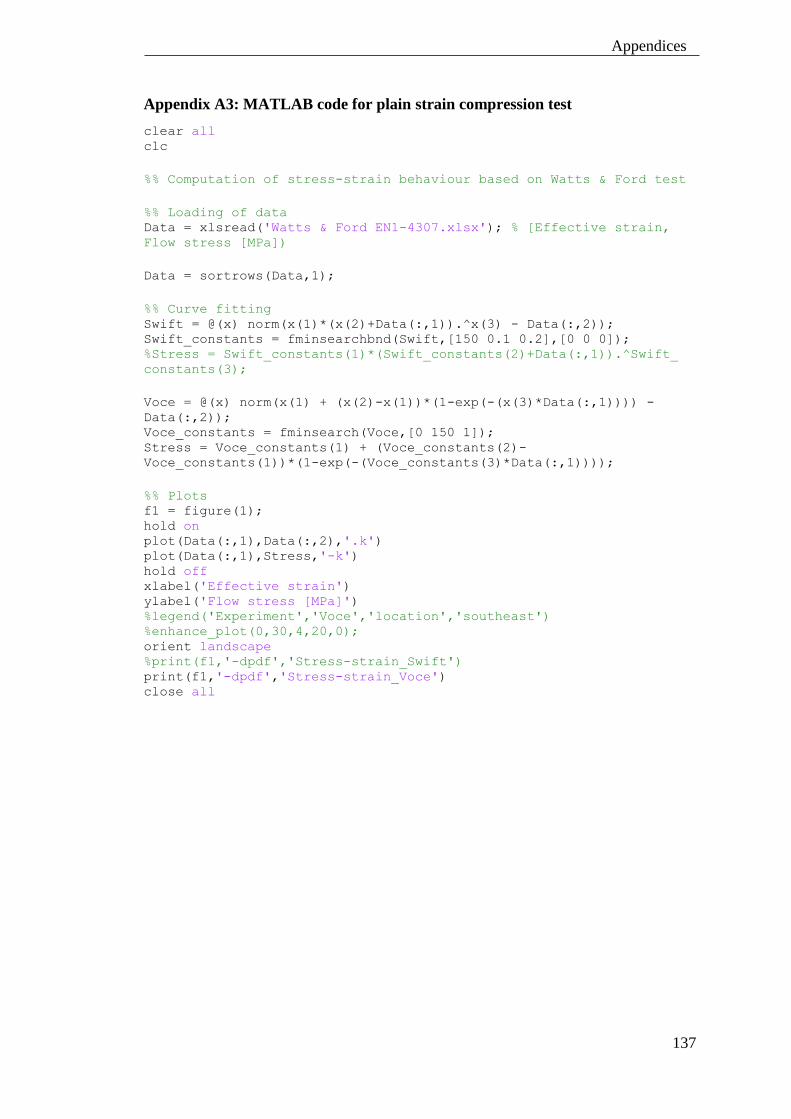
137
Appendices
Appendix A3: MATLAB code for plain strain compression test
clear all clc
%% Computation of stress-strain behaviour based on Watts & Ford test
%% Loading of data Data = xlsread('Watts & Ford EN1-4307.xlsx'); % [Effective strain,
Flow stress [MPa])
Data = sortrows(Data,1);
%% Curve fitting Swift = @(x) norm(x(1)*(x(2)+Data(:,1)).^x(3) - Data(:,2)); Swift_constants = fminsearchbnd(Swift,[150 0.1 0.2],[0 0 0]); %Stress = Swift_constants(1)*(Swift_constants(2)+Data(:,1)).^Swift_
constants(3);
Voce = @(x) norm(x(1) + (x(2)-x(1))*(1-exp(-(x(3)*Data(:,1)))) -
Data(:,2)); Voce_constants = fminsearch(Voce,[0 150 1]); Stress = Voce_constants(1) + (Voce_constants(2)-
Voce_constants(1))*(1-exp(-(Voce_constants(3)*Data(:,1))));
%% Plots f1 = figure(1); hold on plot(Data(:,1),Data(:,2),'.k') plot(Data(:,1),Stress,'-k') hold off xlabel('Effective strain') ylabel('Flow stress [MPa]') %legend('Experiment','Voce','location','southeast') %enhance_plot(0,30,4,20,0); orient landscape %print(f1,'-dpdf','Stress-strain_Swift') print(f1,'-dpdf','Stress-strain_Voce') close all
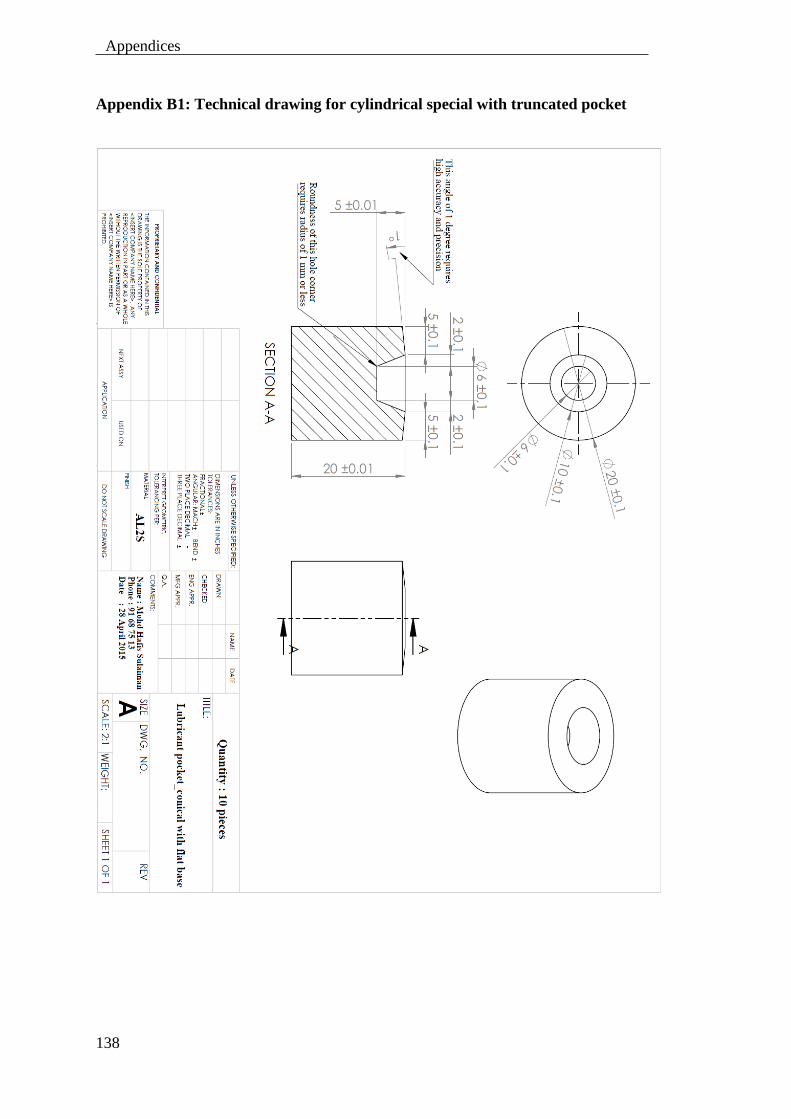
138
Appendices
Appendix B1: Technical drawing for cylindrical special with truncated pocket

139
Appendices
Appendix B2: MATLAB code for comparison of numerical and experimental
surface pocket deformation
clear all clc
%% This program plots the difference of the pocket surface
deformation between the experimental and numerical analyses.
%% Experimental pocket surface
% Load Experimental data (at Reduction 0%) Data = load('Sample no 7 - Before.txt'); % Loading data file [Node
number, x-coordinate, y-coordinate, z-coordinate] Data_treatment = load('Sample no 7 - Before_data treatment.txt'); %
Loading data file [x_min, x_max, y_min]
N = 200; % Number of gridpoints for numerical integration
% Coordinate vectors x = Data(:,1); % Loading data file [x-coordinate] y = Data(:,3); % Loading data file [y-coordinate]
x_min = Data_treatment(1); % Loading data file [x_min] x_max = Data_treatment(2); % Loading data file [x_max] y_top = Data_treatment(3); % Loading data file [y_min]
x_integration = linspace(x_min,x_max,N)'; % Integrate x-coordinate
points and ditributed them evenly y_integration = interp1(x,y,x_integration); % interpolate y-
coordinate points and distributed them evenly
i = find(y_integration < -0.01); % Find center points of x- and y-
coordinates
x_center = mean(x_integration(i)); % Determine center point of the
deformed pocket coordinates x = x - x_center; % Centering of pocket x_integration = x_integration - x_center; % Centering of pocket x_center = 0;
%% FEM pocket surface
% Load FEM data (at Reduction 0%) Node_numbers = load('NoLube_node_number2.txt'); % Vector with
relevant node numbers Node_coordinates = load('NoLube_Coordinates_step0.txt'); % [Node
number, x-coordinate, y-coordinate, z-coordinate] Node_coordinates(:,4) = []; % Removing z-coordinate
Number_of_nodes_relevant = length(Node_numbers); Number_of_elements = Number_of_nodes_relevant - 1;
V_element = zeros(Number_of_elements,1); % Volume of each element y_tool = max(Node_coordinates(:,3)); % Tool y-coordinate
for i=1:Number_of_nodes_relevant
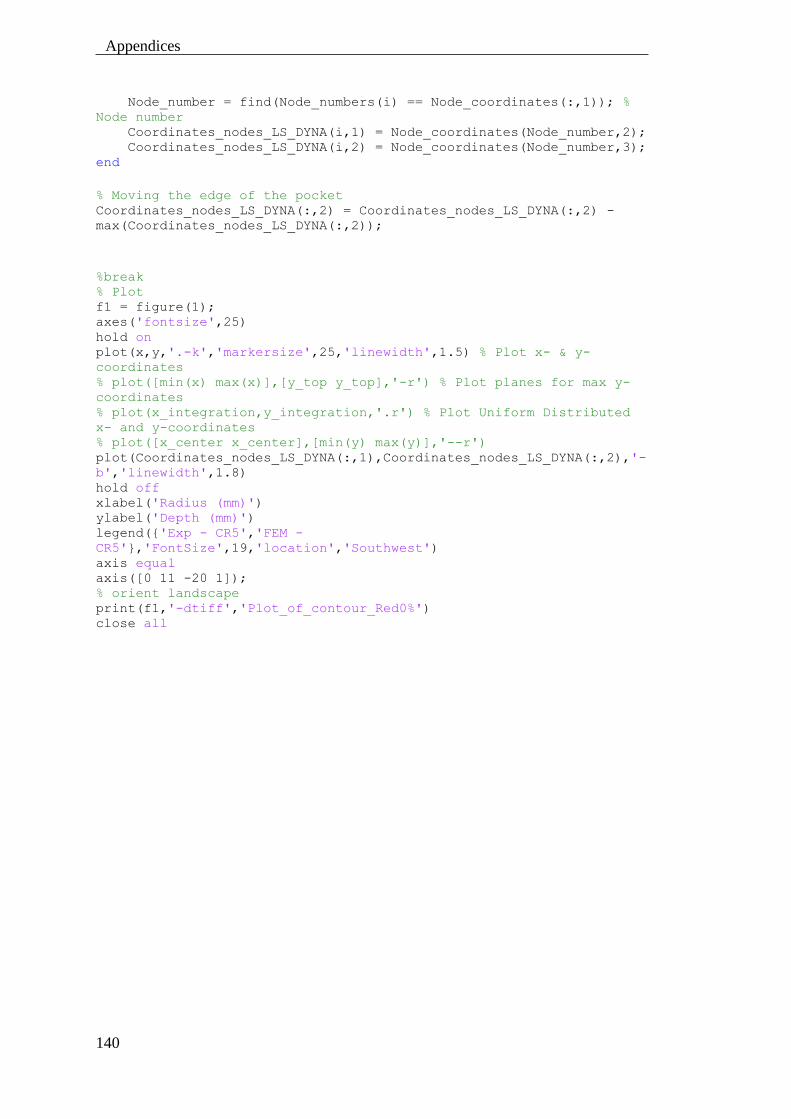
140
Appendices
Node_number = find(Node_numbers(i) == Node_coordinates(:,1)); %
Node number Coordinates_nodes_LS_DYNA(i,1) = Node_coordinates(Node_number,2); Coordinates_nodes_LS_DYNA(i,2) = Node_coordinates(Node_number,3); end
% Moving the edge of the pocket Coordinates_nodes_LS_DYNA(:,2) = Coordinates_nodes_LS_DYNA(:,2) -
max(Coordinates_nodes_LS_DYNA(:,2));
%break % Plot f1 = figure(1); axes('fontsize',25) hold on plot(x,y,'.-k','markersize',25,'linewidth',1.5) % Plot x- & y-
coordinates % plot([min(x) max(x)],[y_top y_top],'-r') % Plot planes for max y-
coordinates % plot(x_integration,y_integration,'.r') % Plot Uniform Distributed
x- and y-coordinates % plot([x_center x_center],[min(y) max(y)],'--r') plot(Coordinates_nodes_LS_DYNA(:,1),Coordinates_nodes_LS_DYNA(:,2),'-
b','linewidth',1.8) hold off xlabel('Radius (mm)') ylabel('Depth (mm)') legend({'Exp - CR5','FEM -
CR5'},'FontSize',19,'location','Southwest') axis equal axis([0 11 -20 1]); % orient landscape print(f1,'-dtiff','Plot_of_contour_Red0%') close all
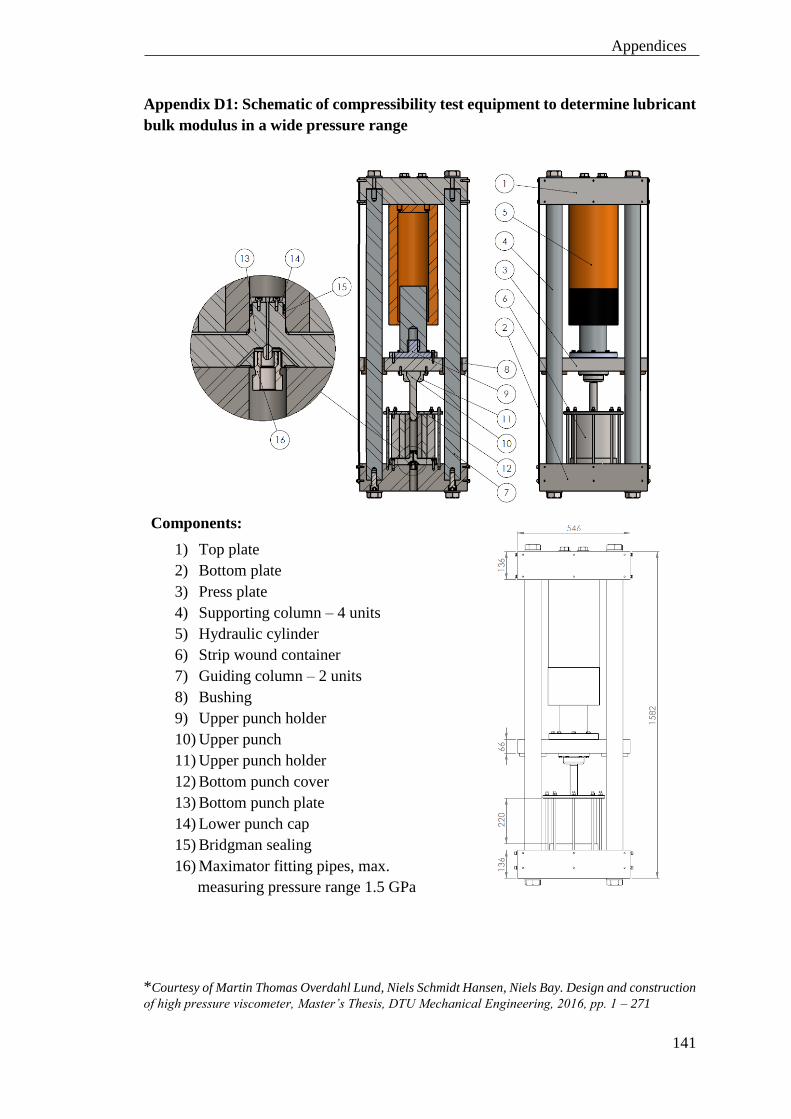
141
Appendices
Appendix D1: Schematic of compressibility test equipment to determine lubricant
bulk modulus in a wide pressure range
Components:
1) Top plate
2) Bottom plate
3) Press plate
4) Supporting column – 4 units
5) Hydraulic cylinder
6) Strip wound container
7) Guiding column – 2 units
8) Bushing
9) Upper punch holder
10) Upper punch
11) Upper punch holder
12) Bottom punch cover
13) Bottom punch plate
14) Lower punch cap
15) Bridgman sealing
16) Maximator fitting pipes, max.
measuring pressure range 1.5 GPa
*Courtesy of Martin Thomas Overdahl Lund, Niels Schmidt Hansen, Niels Bay. Design and construction
of high pressure viscometer, Master’s Thesis, DTU Mechanical Engineering, 2016, pp. 1 – 271
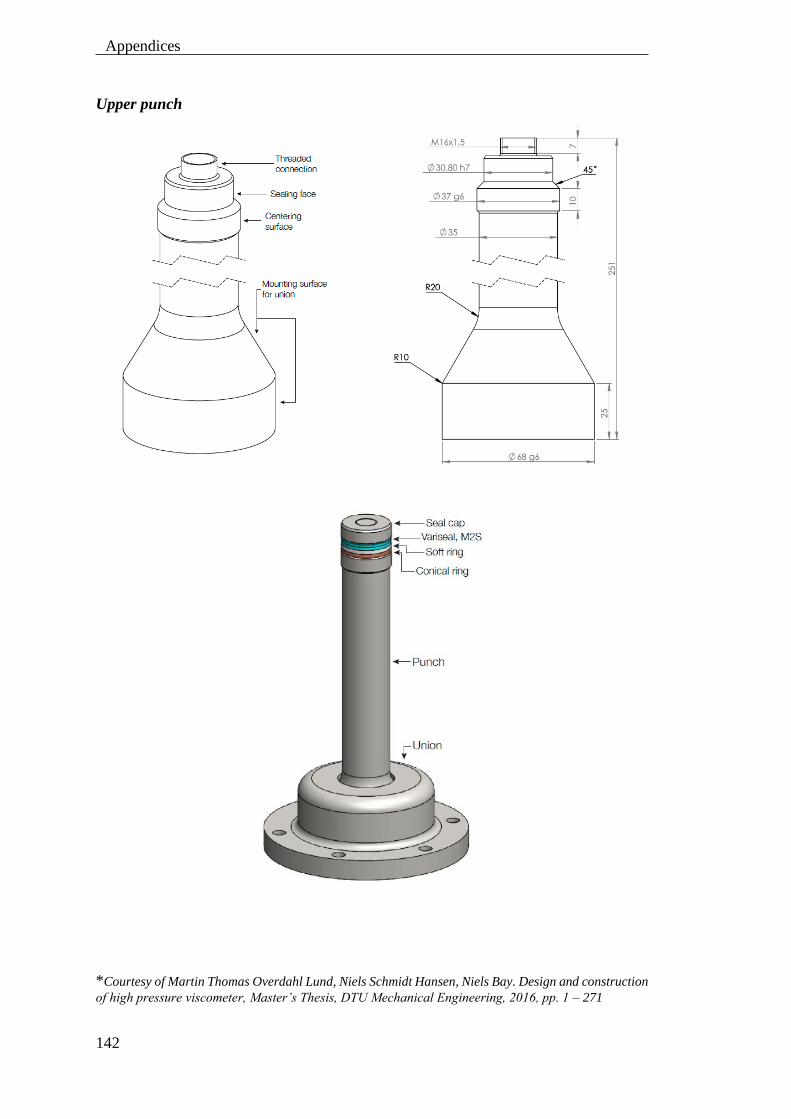
142
Appendices
Upper punch
*Courtesy of Martin Thomas Overdahl Lund, Niels Schmidt Hansen, Niels Bay. Design and construction
of high pressure viscometer, Master’s Thesis, DTU Mechanical Engineering, 2016, pp. 1 – 271
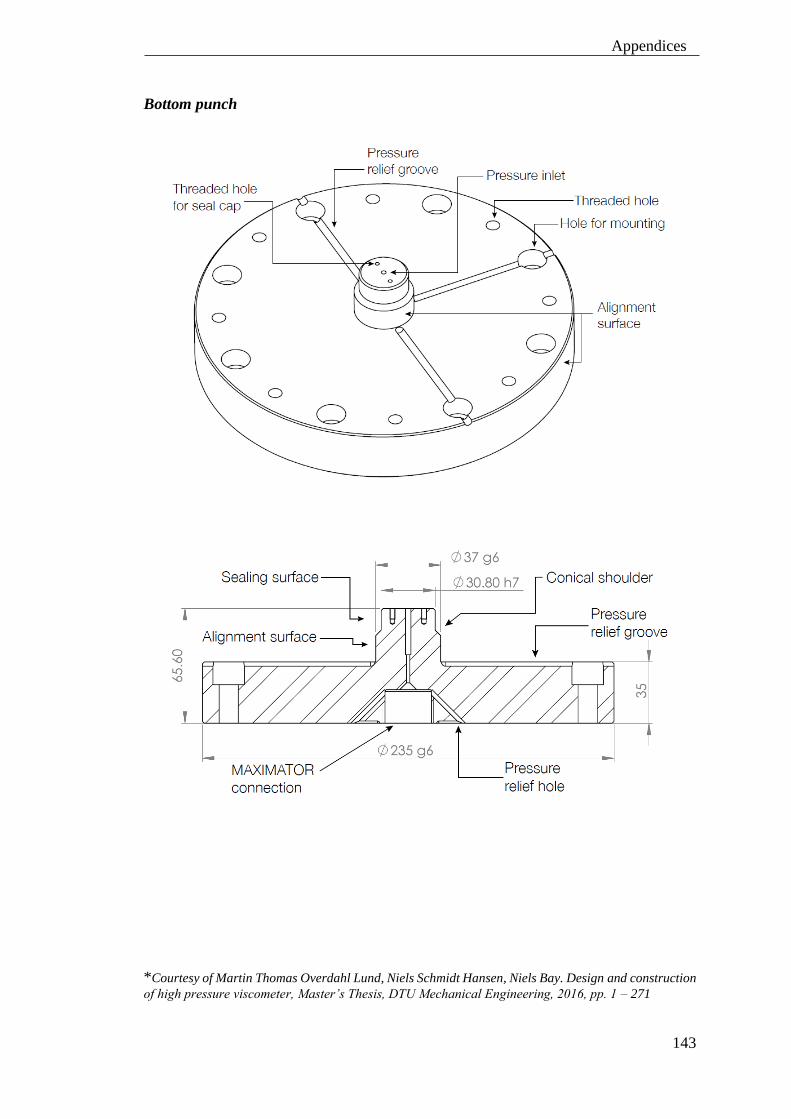
143
Appendices
Bottom punch
*Courtesy of Martin Thomas Overdahl Lund, Niels Schmidt Hansen, Niels Bay. Design and construction
of high pressure viscometer, Master’s Thesis, DTU Mechanical Engineering, 2016, pp. 1 – 271
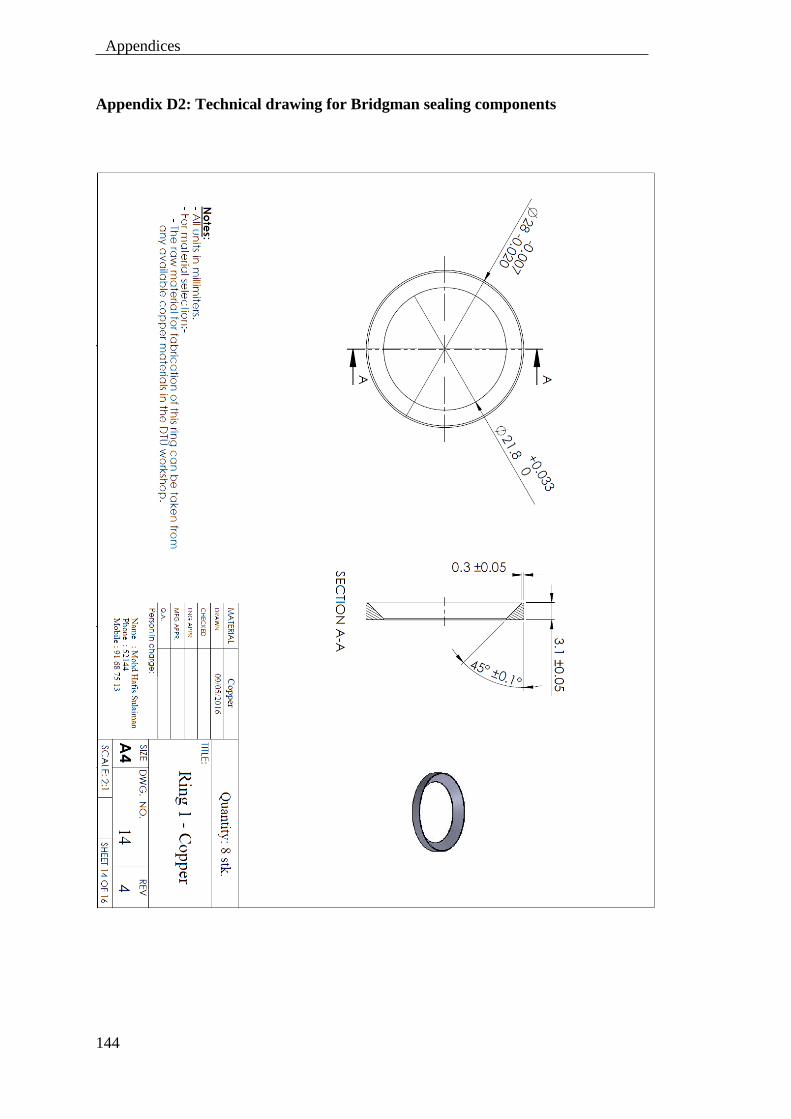
144
Appendices
Appendix D2: Technical drawing for Bridgman sealing components
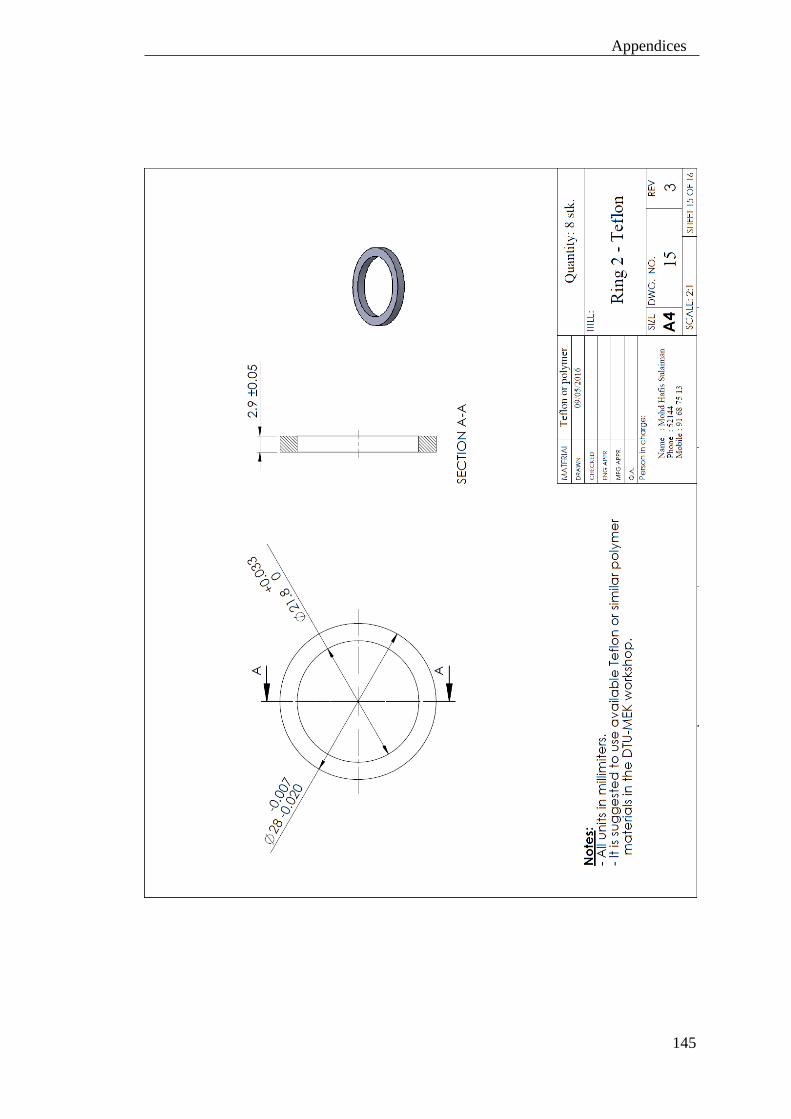
145
Appendices
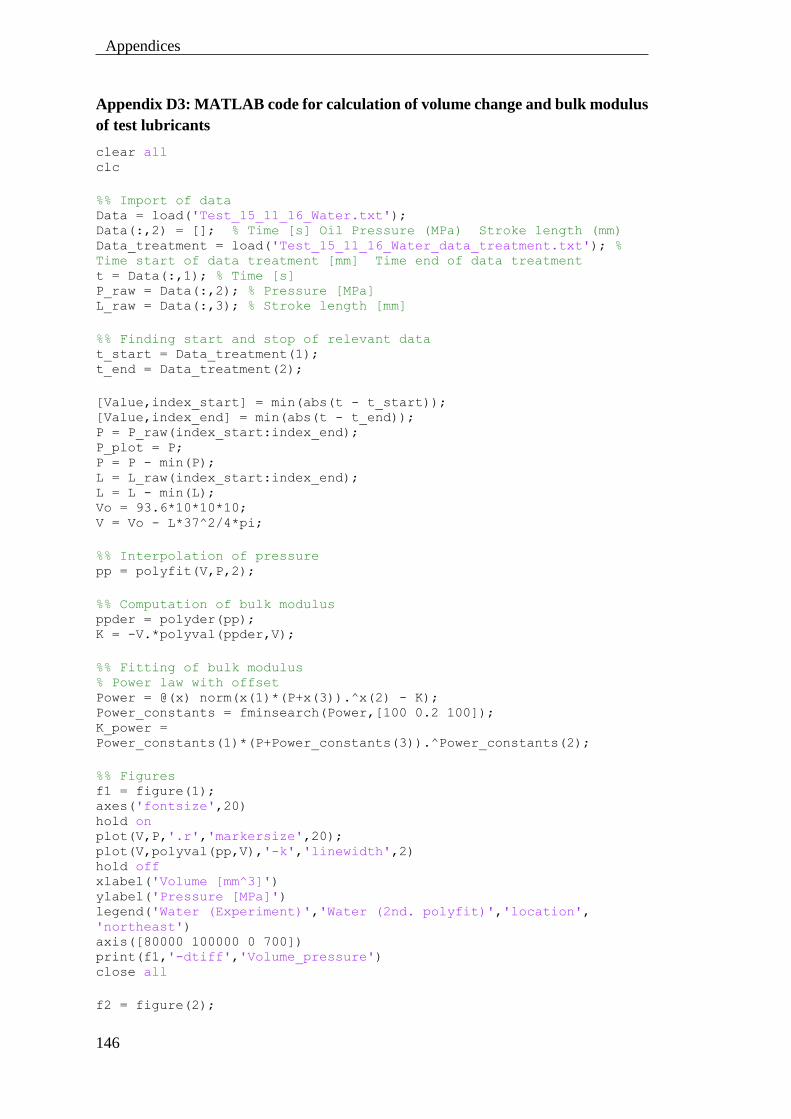
146
Appendices
Appendix D3: MATLAB code for calculation of volume change and bulk modulus
of test lubricants
clear all clc
%% Import of data Data = load('Test_15_11_16_Water.txt'); Data(:,2) = []; % Time [s] Oil Pressure (MPa) Stroke length (mm) Data_treatment = load('Test_15_11_16_Water_data_treatment.txt'); %
Time start of data treatment [mm] Time end of data treatment t = Data(:,1); % Time [s] P_raw = Data(:,2); % Pressure [MPa] L_raw = Data(:,3); % Stroke length [mm]
%% Finding start and stop of relevant data t_start = Data_treatment(1); t_end = Data_treatment(2);
[Value,index_start] = min(abs(t - t_start)); [Value,index_end] = min(abs(t - t_end)); P = P_raw(index_start:index_end); P_plot = P; P = P - min(P); L = L_raw(index_start:index_end); L = L - min(L); Vo = 93.6*10*10*10; V = Vo - L*37^2/4*pi;
%% Interpolation of pressure pp = polyfit(V,P,2);
%% Computation of bulk modulus ppder = polyder(pp); K = -V.*polyval(ppder,V);
%% Fitting of bulk modulus % Power law with offset Power = @(x) norm(x(1)*(P+x(3)).^x(2) - K); Power_constants = fminsearch(Power,[100 0.2 100]); K_power =
Power_constants(1)*(P+Power_constants(3)).^Power_constants(2);
%% Figures f1 = figure(1); axes('fontsize',20) hold on plot(V,P,'.r','markersize',20); plot(V,polyval(pp,V),'-k','linewidth',2) hold off xlabel('Volume [mm^3]') ylabel('Pressure [MPa]') legend('Water (Experiment)','Water (2nd. polyfit)','location',
'northeast') axis([80000 100000 0 700]) print(f1,'-dtiff','Volume_pressure') close all
f2 = figure(2);
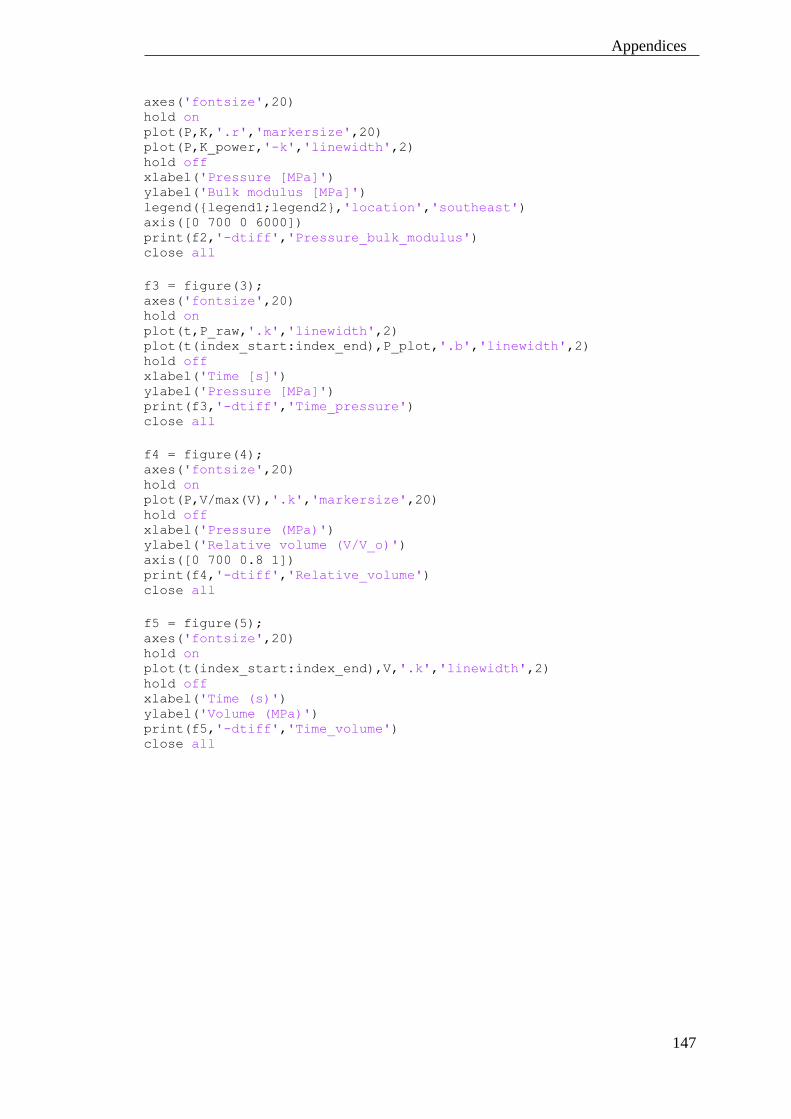
147
Appendices
axes('fontsize',20) hold on plot(P,K,'.r','markersize',20) plot(P,K_power,'-k','linewidth',2) hold off xlabel('Pressure [MPa]') ylabel('Bulk modulus [MPa]') legend({legend1;legend2},'location','southeast') axis([0 700 0 6000]) print(f2,'-dtiff','Pressure_bulk_modulus') close all
f3 = figure(3); axes('fontsize',20) hold on plot(t,P_raw,'.k','linewidth',2) plot(t(index_start:index_end),P_plot,'.b','linewidth',2) hold off xlabel('Time [s]') ylabel('Pressure [MPa]') print(f3,'-dtiff','Time_pressure') close all
f4 = figure(4); axes('fontsize',20) hold on plot(P,V/max(V),'.k','markersize',20) hold off xlabel('Pressure (MPa)') ylabel('Relative volume (V/V_o)') axis([0 700 0.8 1]) print(f4,'-dtiff','Relative_volume') close all
f5 = figure(5); axes('fontsize',20) hold on plot(t(index_start:index_end),V,'.k','linewidth',2) hold off xlabel('Time (s)') ylabel('Volume (MPa)') print(f5,'-dtiff','Time_volume') close all
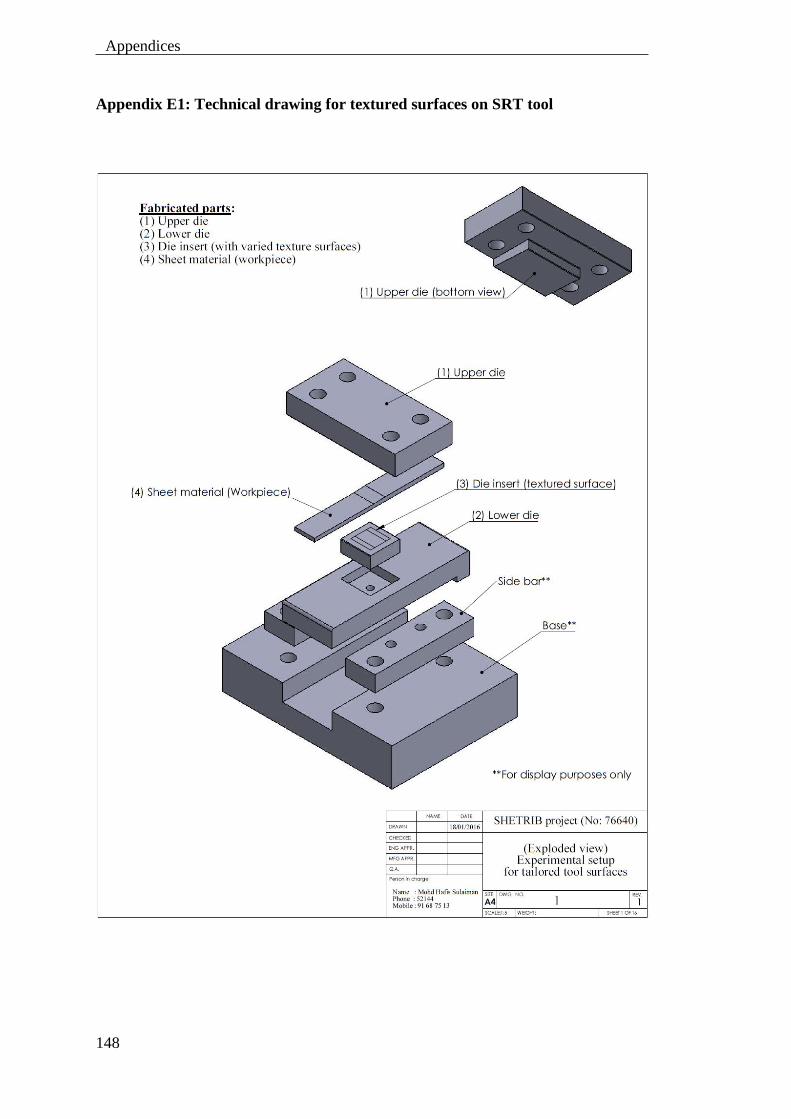
148
Appendices
Appendix E1: Technical drawing for textured surfaces on SRT tool
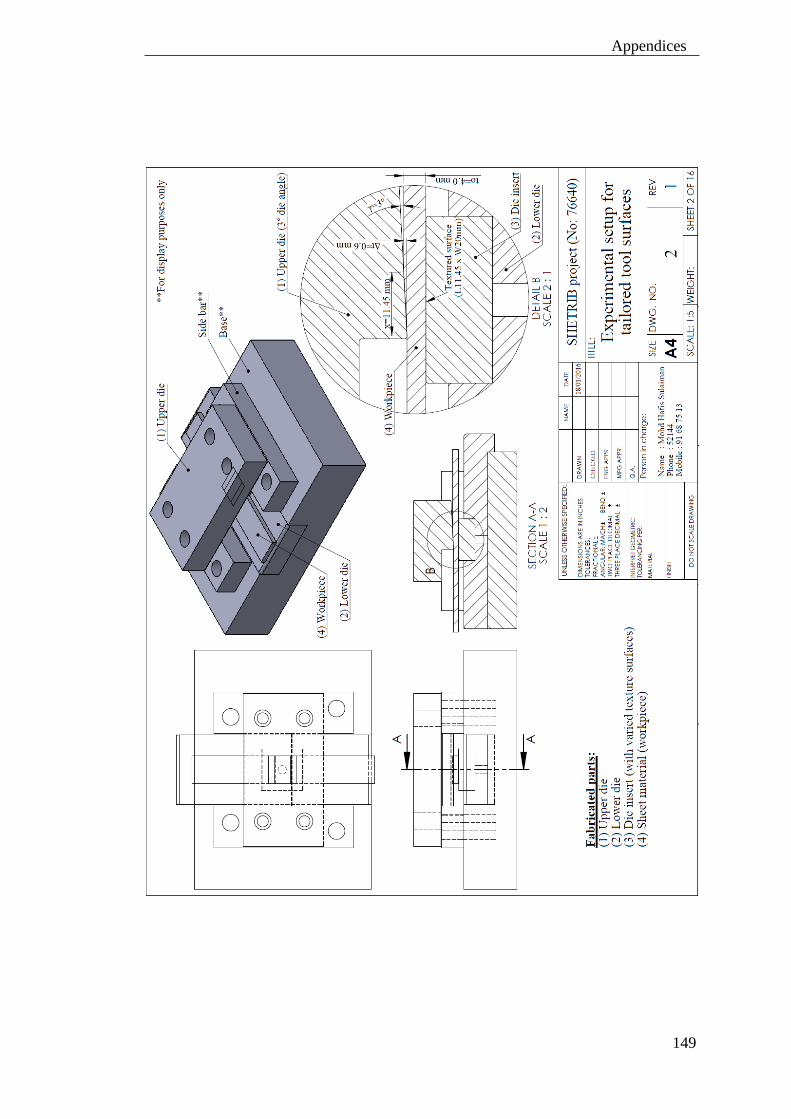
149
Appendices

150
Appendices

151
Appendices
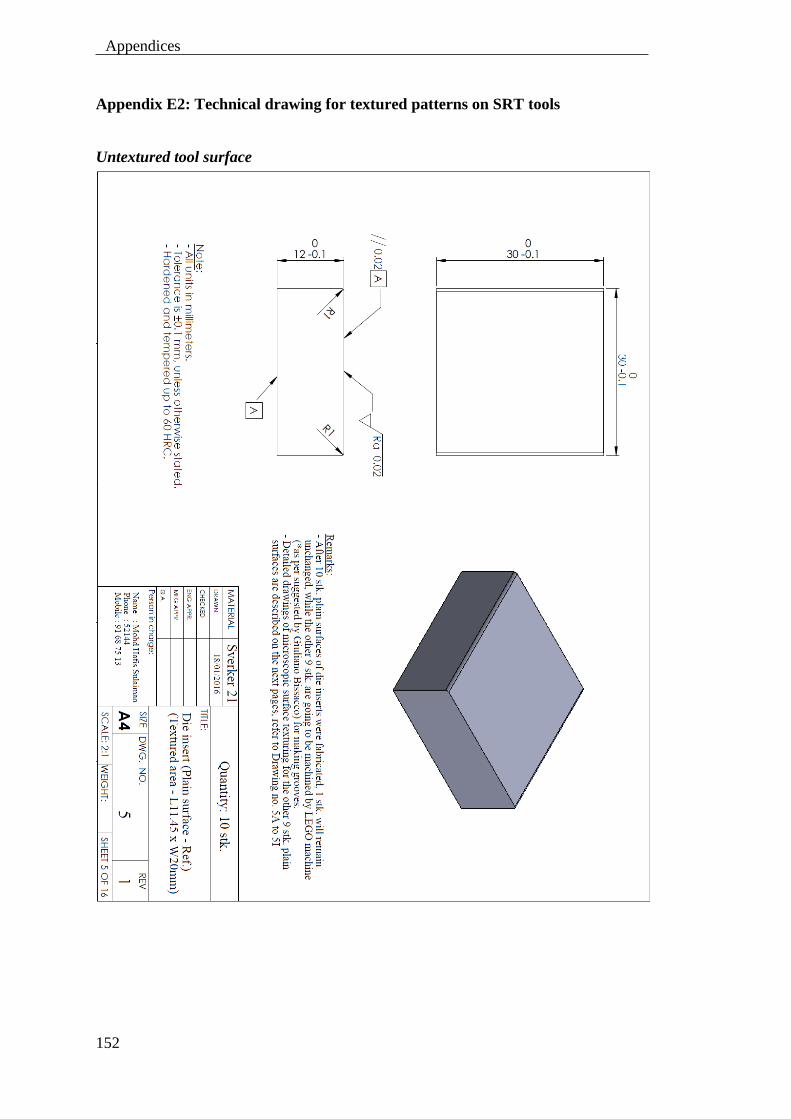
152
Appendices
Appendix E2: Technical drawing for textured patterns on SRT tools
Untextured tool surface
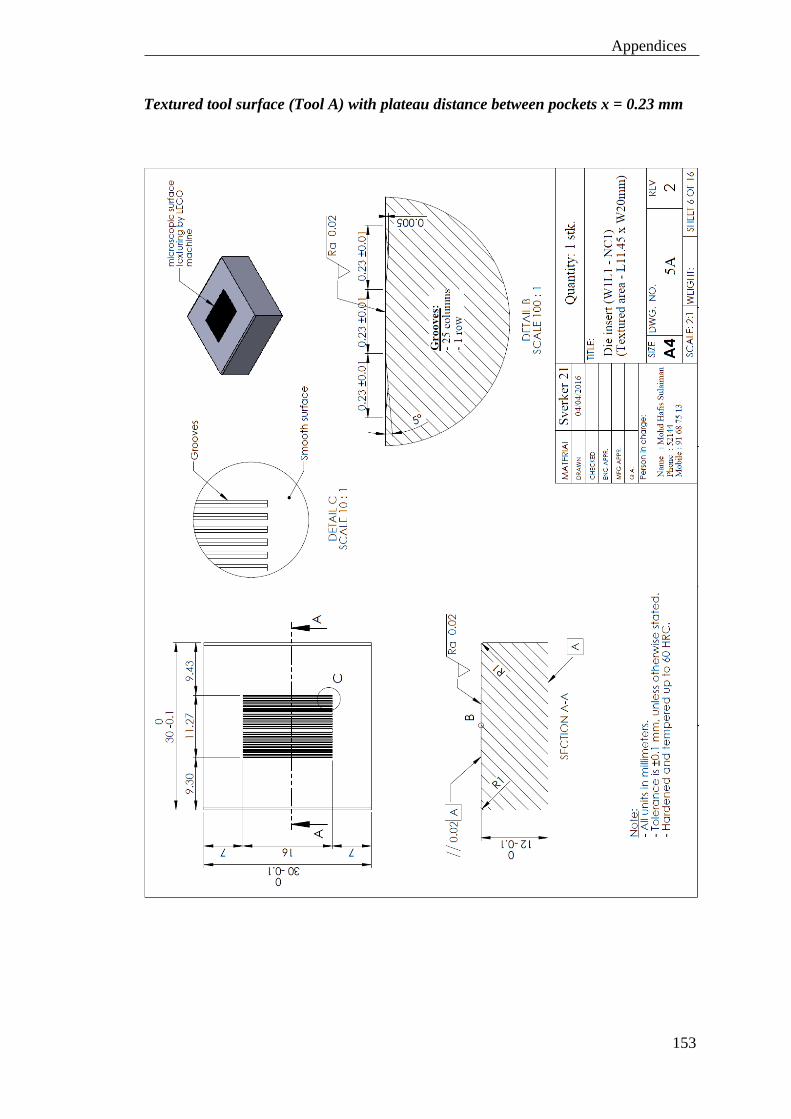
153
Appendices
Textured tool surface (Tool A) with plateau distance between pockets x = 0.23 mm
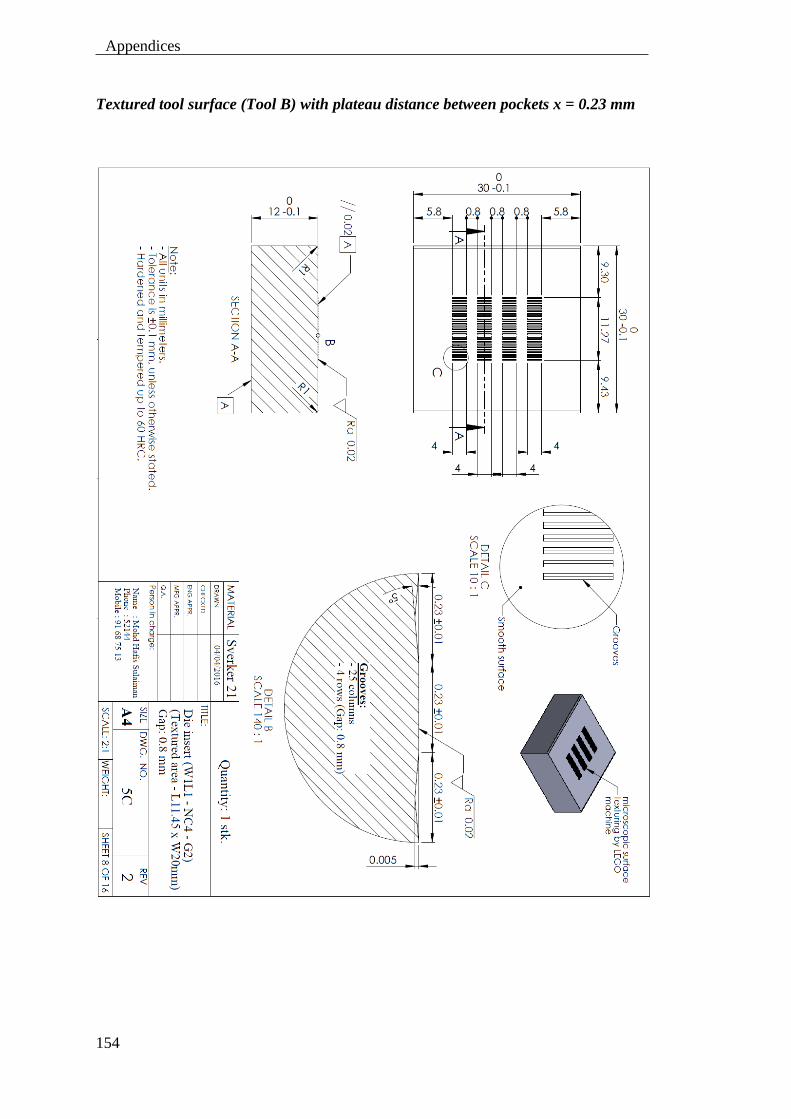
154
Appendices
Textured tool surface (Tool B) with plateau distance between pockets x = 0.23 mm
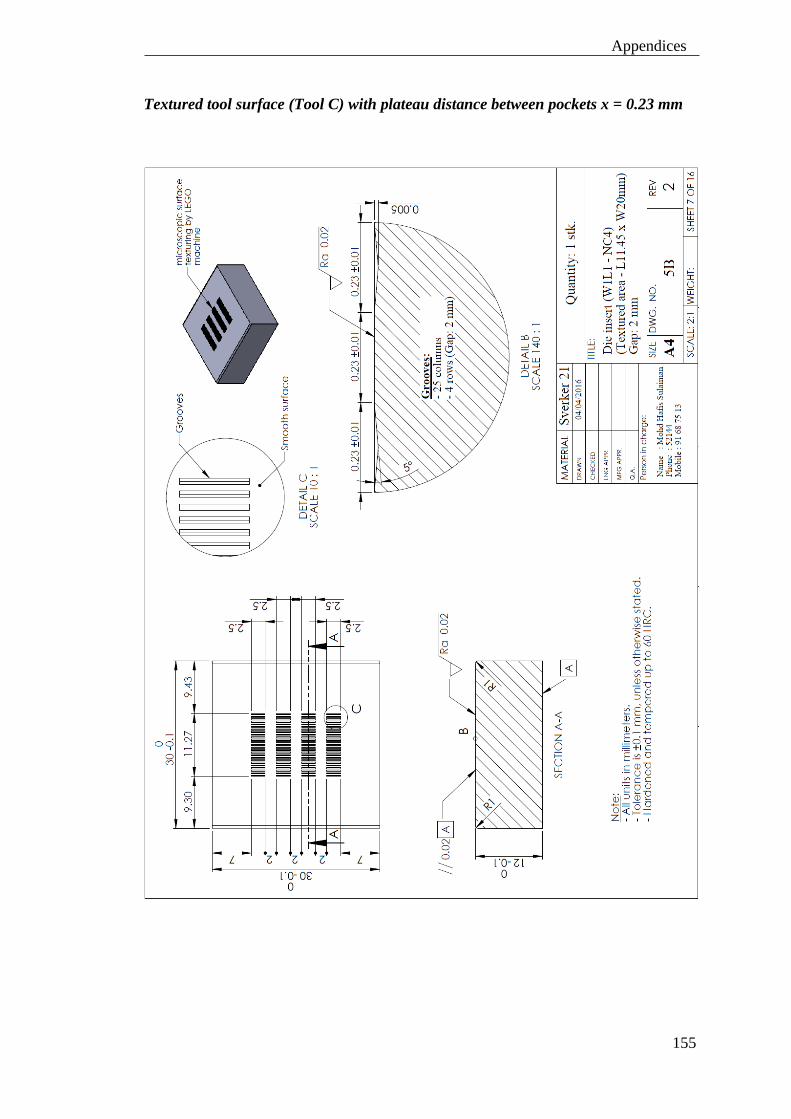
155
Appendices
Textured tool surface (Tool C) with plateau distance between pockets x = 0.23 mm

156
Appendices
Textured tool surface (Tool A) with plateau distance between pockets x = 0.46 mm
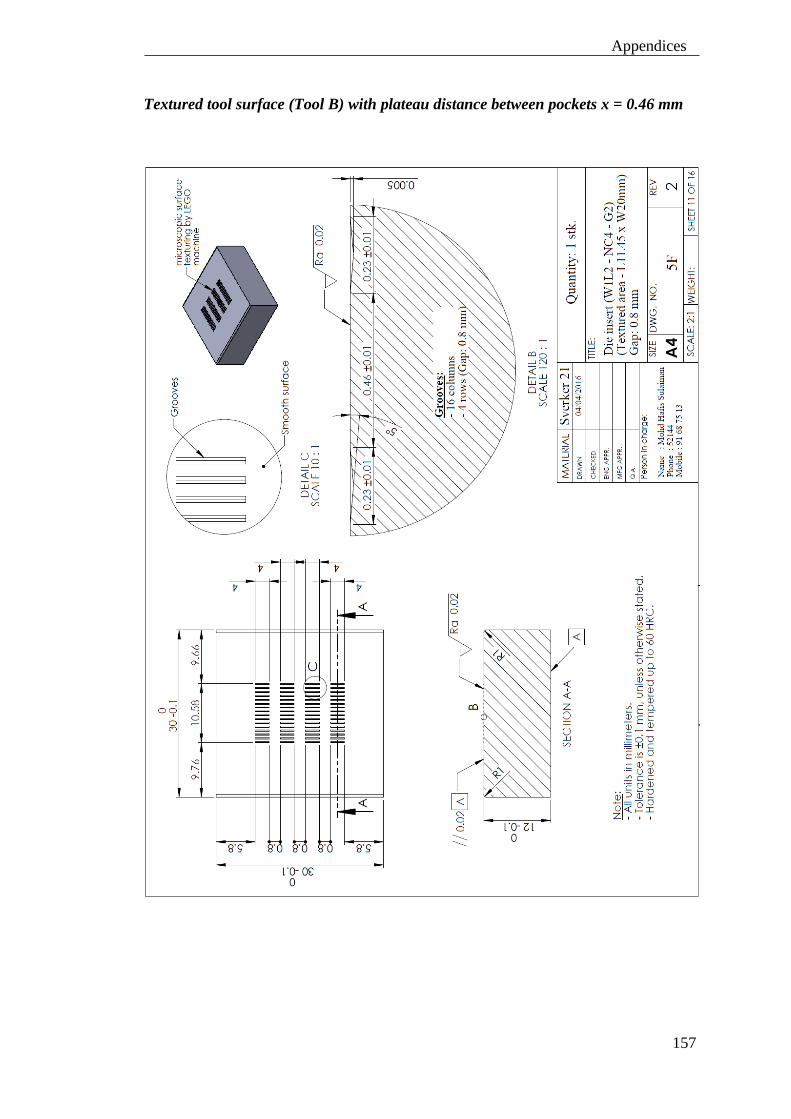
157
Appendices
Textured tool surface (Tool B) with plateau distance between pockets x = 0.46 mm
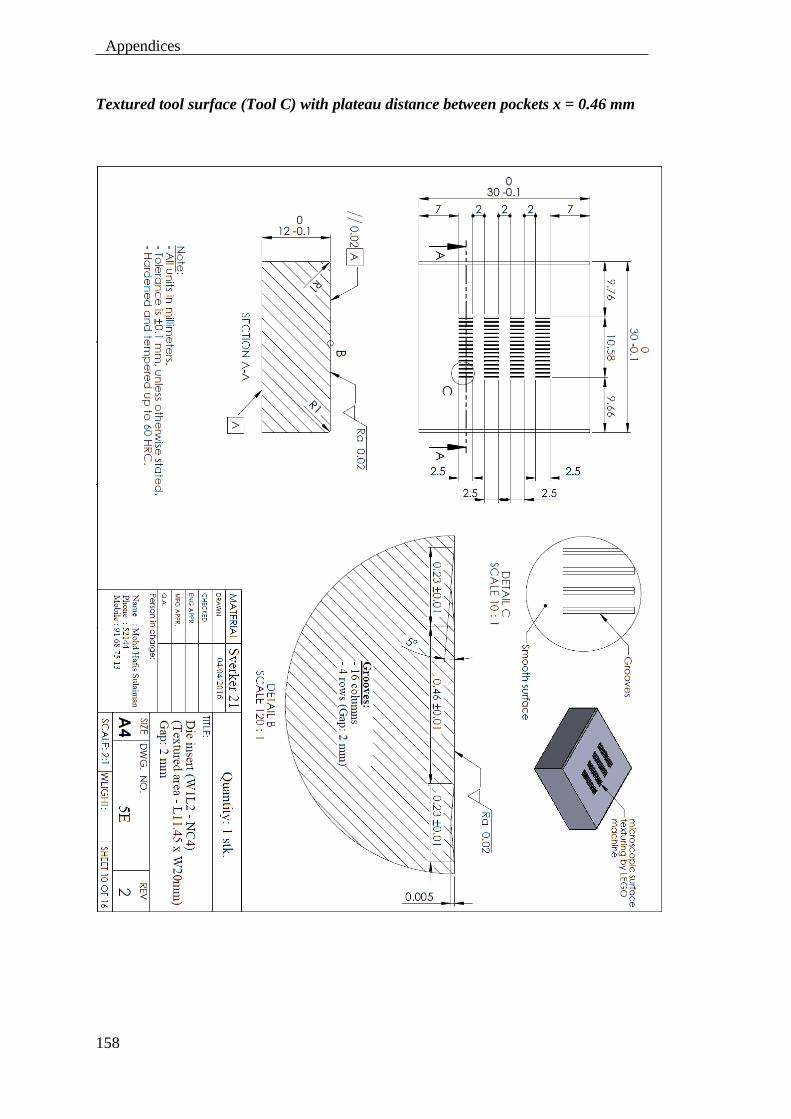
158
Appendices
Textured tool surface (Tool C) with plateau distance between pockets x = 0.46 mm
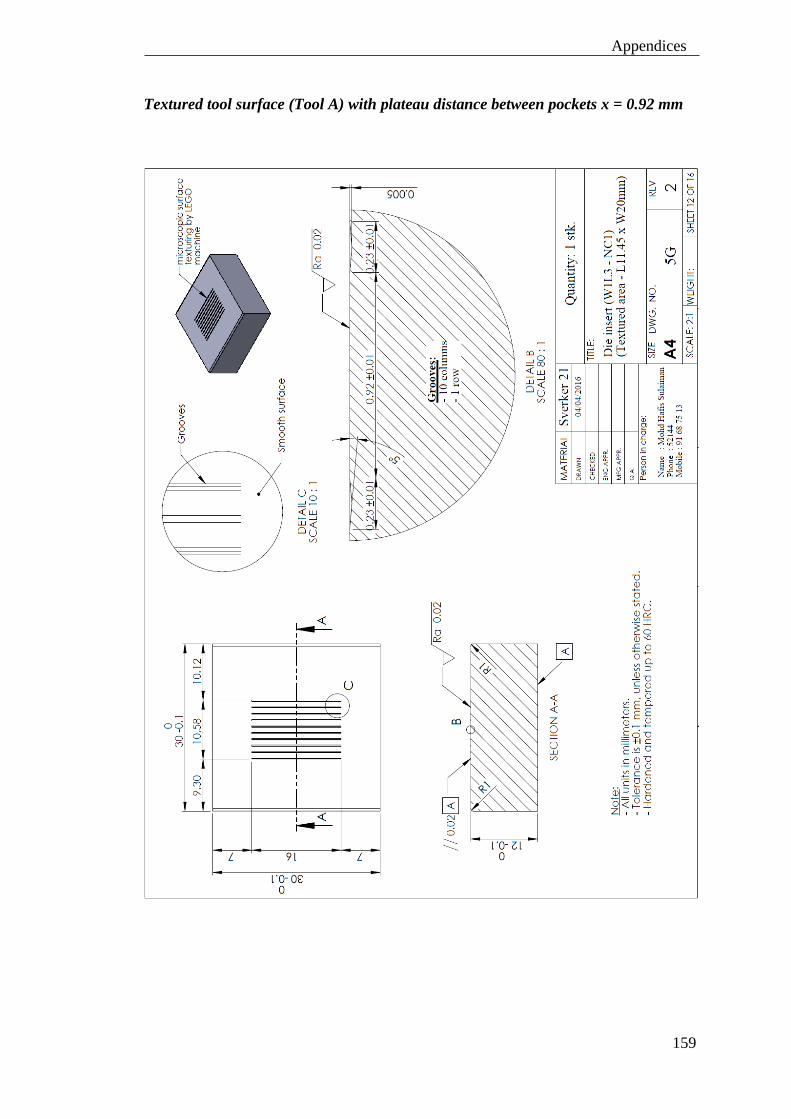
159
Appendices
Textured tool surface (Tool A) with plateau distance between pockets x = 0.92 mm
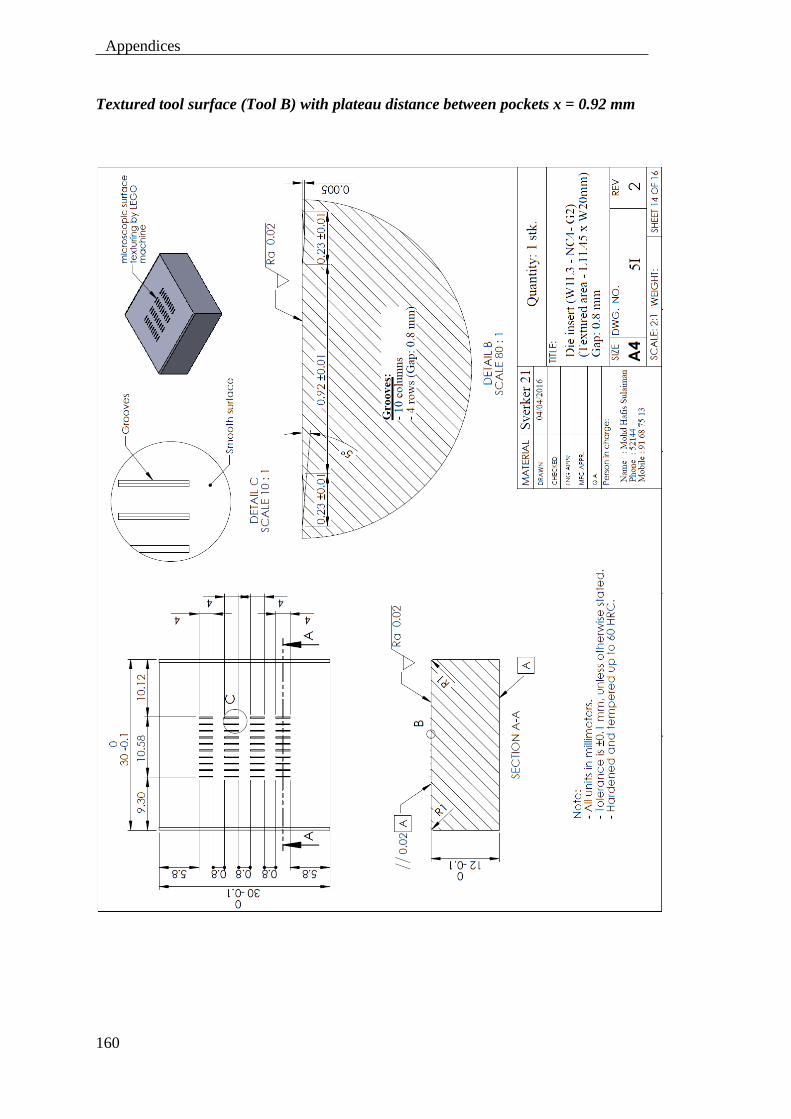
160
Appendices
Textured tool surface (Tool B) with plateau distance between pockets x = 0.92 mm
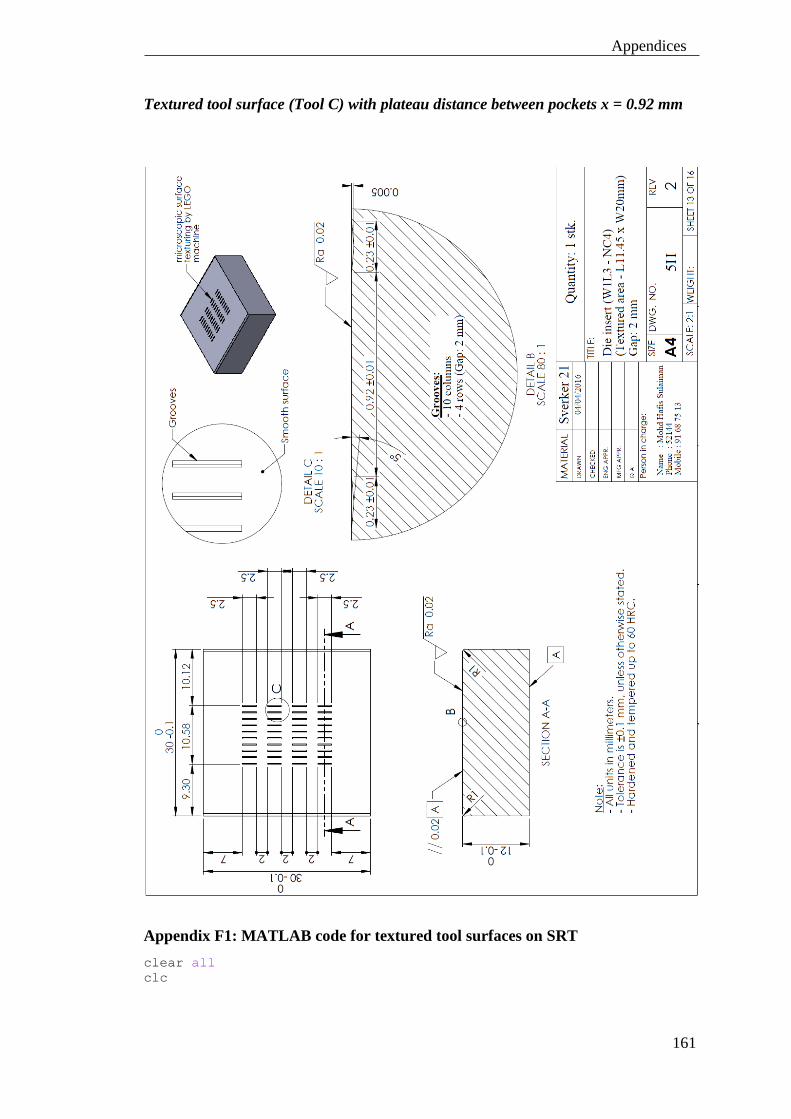
161
Appendices
Textured tool surface (Tool C) with plateau distance between pockets x = 0.92 mm
Appendix F1: MATLAB code for textured tool surfaces on SRT
clear all clc

162
Appendices
%% This programme computes the drawing force of strip drawing with an
inclined tool and a flat tool
%% Input h0 = 4; h1 = 0.88*h0; W = 20; Die_angle = 3; Sigma_0 = 55; Sigma_inf = 149; n_Voce = 1.52; m1 = 0.03; m2 = 0.02;
%% Computations Epsilon_h = log(h1/h0); Epsilon_eff = 2/sqrt(3)*(-Epsilon_h); Sigma_mean = 1/Epsilon_eff*(Sigma_0*Epsilon_eff+(Sigma_inf-
Sigma_0)*Epsilon_eff+(Sigma_inf-Sigma_0)/n_Voce*(exp(-
n_Voce*Epsilon_eff)-1)); k_mean = Sigma_mean/sqrt(3); Sigma_drawing = ((m1+m2)*k_mean/tand(Die_angle)+2*k_mean)*(-
Epsilon_h); F_drawing = Sigma_drawing*h1*W

163
Appendices
Appendix G1: Technical drawing for manually operated sheet tribo-test
component
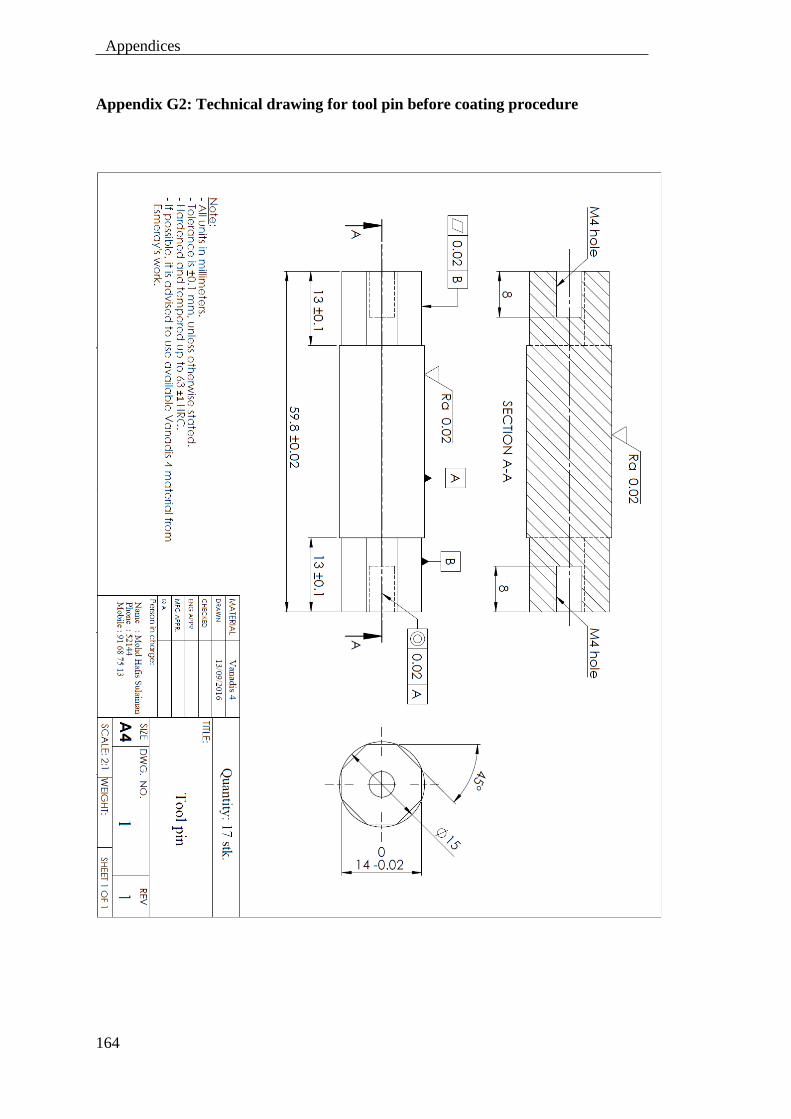
164
Appendices
Appendix G2: Technical drawing for tool pin before coating procedure
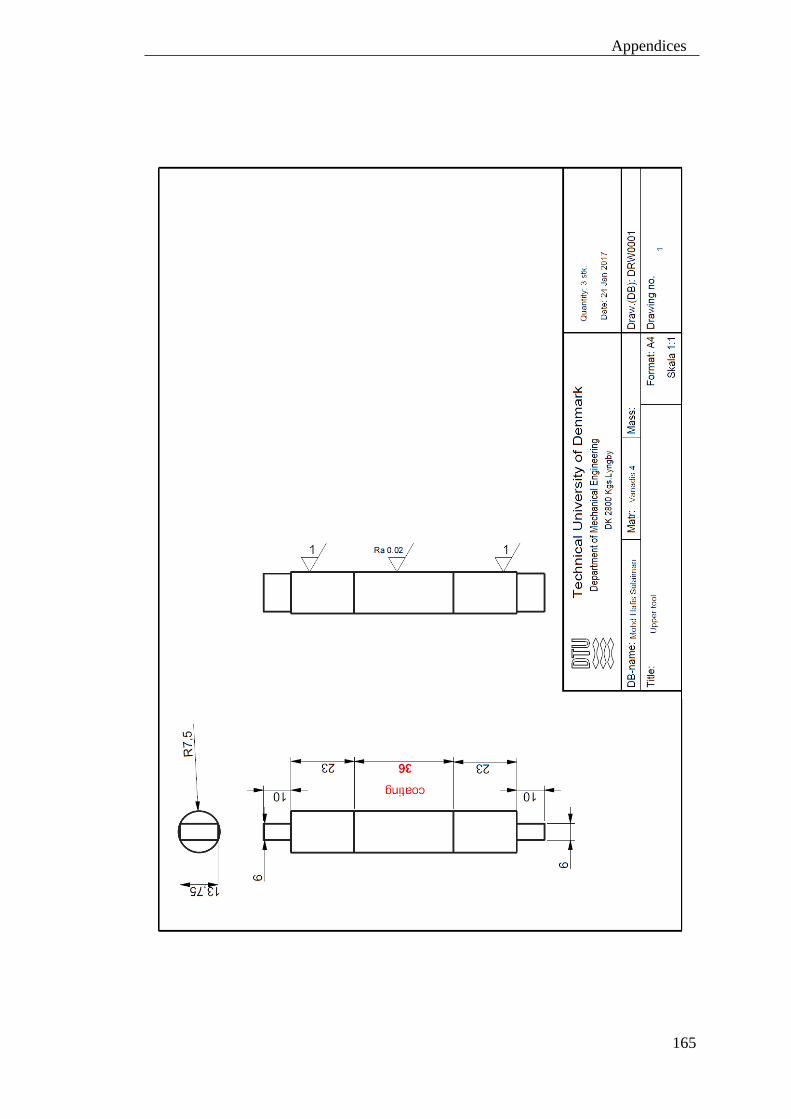
165
Appendices


DTU Mechanical Engineering
Section of Manufacturing Engineering
Technical University of Denmark
Produktionstorvet, Bld. 427A
DK-2800 Kgs. Lyngby
Denmark
Phone (+45) 4525 4763
Fax (+45) 4593 0190
www.mek.dtu.dk
ISBN: 978-87-7475-499-2