Embed Size (px)
Citation preview

HAL Id: hal-03265517https://hal.archives-ouvertes.fr/hal-03265517
Submitted on 21 Jun 2021
HAL is a multi-disciplinary open accessarchive for the deposit and dissemination of sci-entific research documents, whether they are pub-lished or not. The documents may come fromteaching and research institutions in France orabroad, or from public or private research centers.
L’archive ouverte pluridisciplinaire HAL, estdestinée au dépôt et à la diffusion de documentsscientifiques de niveau recherche, publiés ou non,émanant des établissements d’enseignement et derecherche français ou étrangers, des laboratoirespublics ou privés.
Development and Characterization of PhotocatalyticGaN Coatings by Cold Spray Process
Shaoyun Zhou, Chrystelle Bernard, Kesavan Ravi, Hiroki Saito, YujiIchikawa, Kazuhiro Ogawa, Shu Yin
To cite this version:Shaoyun Zhou, Chrystelle Bernard, Kesavan Ravi, Hiroki Saito, Yuji Ichikawa, et al.. Development andCharacterization of Photocatalytic GaN Coatings by Cold Spray Process. Journal of Thermal SprayTechnology, ASM International/Springer, inPress, �10.1007/s11666-021-01207-w�. �hal-03265517�
1
Development and Characterization of Photocatalytic GaN Coatings by Cold Spray
Process
Shaoyun Zhou1, Chrystelle A. Bernard1,2,3*, Kesavan Ravi4, Hiroki Saito1,
Yuji Ichikawa1, Kazuhiro Ogawa1,2, Shu Yin5
1Fracture and Reliability Research Institute, Tohoku University, Sendai, Japan
2ELyTMaX UMI 3757, CNRS – Université de Lyon – Tohoku University, International
Joint Unit, Tohoku University, Sendai, Japan
3Frontier Research Institute for Interdisciplinary Sciences, Tohoku University, Sendai,
Japan
4Indian Institute of Technology (Indian School of Mines) Dhanbad, Dhanbad, India
5Institute of Multidisciplinary Research for Advanced Materials, Tohoku University,
Sendai, Japan
*Corresponding author email: [email protected]
Abstract
For the first time, the low-pressure cold spray (LPCS) process was used to manufacture
Gallium Nitride (GaN) films to enhance its photocatalytic properties and decrease its
manufacturing cost. The deposition behavior of the GaN powder on stainless steel
substrates was investigated. Several specimens, with sparsely deposited agglomerated
GaN particles, were prepared under different spray conditions. Quantitative analysis of
the evolution of the coverage area, deposited particle count, and average sectional area
shows that, upon impact, agglomerated GaN particles disintegrate, leading to large
deposition of small particles. By analyzing the cross-sectional area of the deposited
2
particle, no discernible permanent deformation of the substrate was observed. In
addition, X-ray diffraction analysis of the coatings and powder indicated that no phase
transformation occurred during the process. Based on Williamson-Hall analysis, the
broader peaks of the coatings were mainly attributed to the distortions in the GaN lattice
rather than changes in the crystallite size. At 400°C and 0.6 MPa, the deposition
efficiency reached 5.3%, and the photocatalytic activities of the coating were about 33%
(+9% compared to the powder). It is attributed to the higher specific surface area and
roughness that the coatings exhibit after the breakage of the particles during the cold
spray.
Keywords: Cold spray, Gallium nitride (GaN), Photocatalysis, Agglomerated powder,
Splat test, Ceramic powder
1. Introduction
The world faces serious environmental problems related to air and water pollution. The
NOx gases emitted into the air because of human activities, such as the combustion of
fossil fuels in large amounts, contribute to acid rain, global warming, and are hazardous
to human health (Ref 1). In recent years, significant research progress has been made to
reduce pollution and its effects on the environment. Several techniques are used for the
treatment of polluted air and water. Compared to other common methods used for
depollution, such as precipitation, adsorption on active carbon, selective catalytic or
non-catalytic reactions, photocatalysis has emerged as a green and sustainable
technology for solar energy conversion and environmental remediation (Ref 2). The
3
splitting of water into H2 and O2 over photocatalysts by harvesting solar energy as a
source of renewable energy has been attracting significant attention worldwide (Ref 3).
In addition, because no oxidizing agents, such as ozone, or heat are necessary,
photocatalysis appears to be more economical than other methods (Ref 4).
Among numerous photocatalyst materials, fine oxide powders, such as TiO2 or ZnO,
have received tremendous attention for the degradation of several environmental
contaminants (Ref 5). These powders can easily be prepared using low-cost methods
(Ref 6–9), such as combustion, hydrothermal, precipitation, and sol-gel methods (Ref 5,
10). Another interesting material is Gallium nitride (GaN), a nitride ceramic material,
which exhibits high photoactivity and chemical stability against photo-corrosion (Ref
11). Kida et al. (Ref 12) demonstrated the photocatalytic properties of powdered GaN,
allowing him to decompose water into oxygen and dihydrogen when GaN is exposed to
light irradiation.
Photocatalysis occurring on the external and internal surfaces of the structures, the high
surface-to-volume (S/V) ratio that powdered or nano-porous materials exhibit is a great
advantage for enhancing their photocatalytic properties (Ref 13). However, a major
drawback lies in the recuperation and recycling of the fine particles suspended in water
after use, mainly because of the formation of aggregates (Ref 14). Therefore, the
development of nano-porous photocatalytic films manufactured from the powders is of
prime interest (Ref 15, 16).
GaN photocatalyst coatings are conventionally obtained through metal organic chemical
vapor deposition (MOCVD) (Ref 17), molecular beam epitaxy (MBE) (Ref 18) or
hydride vapor phase epitaxy (HVPE) (Ref 19). However, they still have certain
disadvantages that need to be resolved. For example, cracks are frequently observed

4
after MOCVD (Ref 20), MBE is time-consuming, and HVPE is an expensive and high-
skill technique. Besides, these three techniques require high temperature operation
(>850 °C) which is known to degradate the material photocatalytic properties due to the
changes in the surface microstructure (Ref 21). Therefore, a low temperature operating
process seems more suitable for retaining the powder's photocatalytic properties within
the films.
Thus, for the fabrication of photocatalytic GaN films, a new manufacturing process
combining the advantages of rapidity, cost efficiency, and low temperature is essential.
Among the various technologies available, the cold spray (CS) process, also known as
cold gas dynamic spray process, appears to be a suitable candidate. The CS process is a
solid-state coating technique based on the high-speed impact and consolidation of finely
divided powder particles on different substrates (Ref 22). The coating was manufactured
at a temperature well below the melting point of the sprayed feedstock. In contrast to
other thermal spray techniques, such as thermal spray, sol-gel, and sputtering, the CS
process has no risk of oxidation, thermal degradation, grain growth, and low energy
consumption. Therefore, the CS technique can be considered to be a safe, green, and
economical technology because of the absence of high-temperature explosive gases and
radiation (Ref 23). Considering that the bonding process by cold spray predominantly
involves the prior particle/substrate interactions and following particle/particle
interactions (Ref 24–26), meanwhile, ceramic particles not easy to be plastically
deformed and melt (Ref 27), the coating formation would be conceivably elucidated
from the first layer and following layers, respectively (Ref 28).
In this study, for the first time, GaN coatings on stainless steel substrates using a cold-
spray process were manufactured. The bonding mechanisms occurring at the interface
5
of particle/substrate and particle/particle were investigated using splat and multi-pass
tests, respectively. These two deposition processes were investigated to understand the
coating formation and build-up. Later, NOx decomposition tests were conducted to
evaluate the photocatalytic properties of the cold-sprayed GaN coatings and compare
them with those of the GaN powder.
2. Materials and Methods
2. 1 Powders and Substrates
Commercially available GaN powder (Toshima Manufacturing Co., Ltd., Saitama,
Japan) with an average particle diameter of 1.7 µm, ascertained from the particle size
distribution results, was used as feedstock to develop photocatalytic active coatings via
the low-pressure cold spray (LPCS) technique. The morphology of the feedstock
powder was investigated using a field emission scanning electron microscope (FE-SEM,
Hitachi SU-70, Tokyo, Japan) equipped with an energy dispersive X-ray (EDX) system
for elemental analysis, which was operated at 10 kV. The material properties of the GaN
feedstock are listed in Table 1.
GaN powder was cold-sprayed onto as-received and mirror-polished stainless steel
substrates. Prior to the cold spray experiments, the surface roughness of the stainless
steel substrates were measured using a surface roughness measuring instrument, that is,
a surface profilometer (Surfcorder SE300, Kosaka Laboratory Ltd., Tokyo, Japan) (Ref
26). As illustrated in Table 1, the mean roughness (Ra) and the maximum height of the
profile (Rz) of the as-received stainless steel substrates are 0.10 ± 0.012 μm and
0.83 ± 0.076 μm, respectively. After mirror polishing, the values of Ra and Rz
decreased to 0.06 ± 0.012 μm and 0.39 ± 0.101 μm, respectively. Subsequently, the

6
Vickers hardness of stainless steel was measured at 216 HV by microhardness testing
system (Fischerscope HM2000, Helmut Fischer) (Ref 26).
2. 2 Splat Test and Coating Build-up
Cold-spraying was performed using the DYMET-423 equipment (Obninsk Center for
Powder Spraying, Obninsk, Kaluga, Russia), which comprises an internal gas heater in
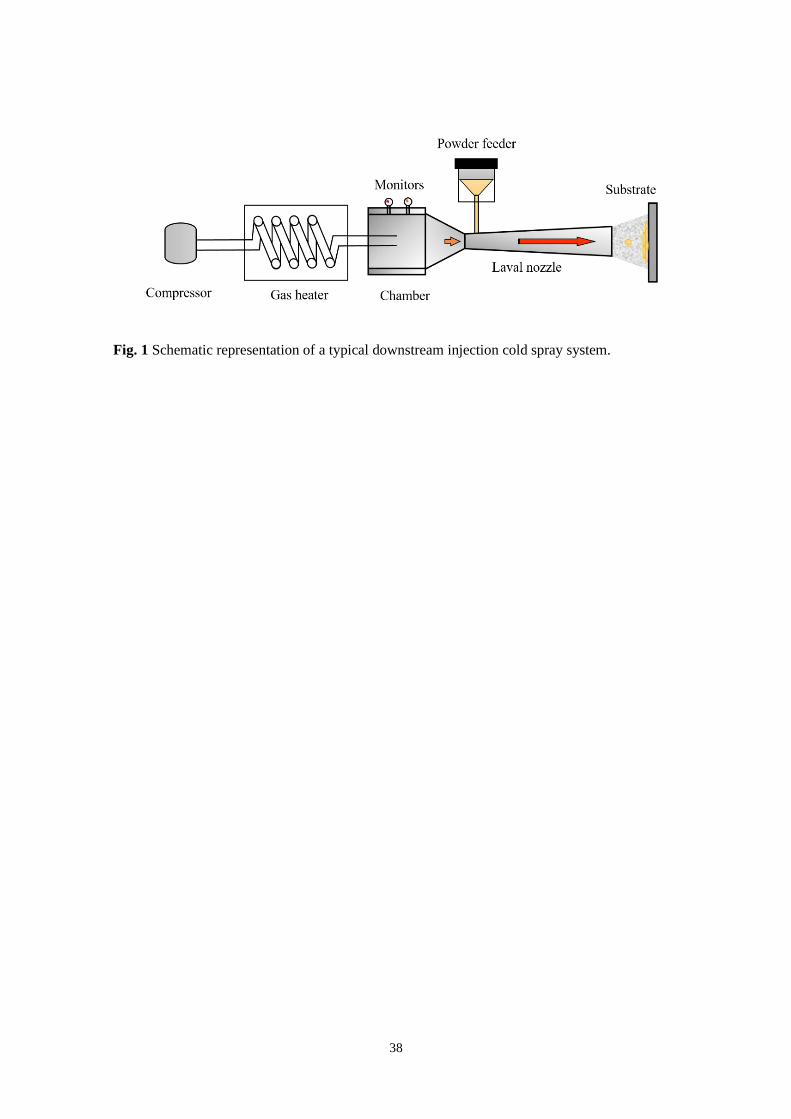
the spraying gun. Figure 1 reveals a schematic illustration of the downstream injection
cold spray apparatus used for the experiment. The spraying gun was attached to a
manipulator (BZT Maschinenbau GmbH, Leopoldshöhe, Germany) moving at the same
traverse speed. To control the standoff distance between the nozzle and substrate
surface, and the traverse parameters, the substrate was mounted on an XYZ stage and
manipulated by a personal computer (Ref 30).
Coating formation by cold spray technique can be considered as a two-step process:
development of the first layer followed by the coating build-up (Ref 28). In that regards,
the splat test appears as an ideal experimental approach for the study of the single-
particle impact and particle/substrate interaction. Splat tests were performed on mirror-
polished stainless steel substrates to remove the effects of the mechanical interlocking
(Ref 31).
In total, six spray conditions (three inlet gas temperatures and two inlet gas pressures)
were investigated for splat tests to characterize the deposition quality of the GaN
powder on the mirror-polished stainless steel substrate (Table 2). A low feeding rate of
0.019 g/s was used to impinge particles sparsely onto the substrate, resulting in no
overlapping of the particles. After the test, the particle/substrate interface was
investigated, highlighting the deformation and deposition mechanisms of GaN ceramic
particle on a metallic substrate.

7
After understanding the development of the first layer and the deposition mechanisms
between GaN particle and stainless steel substrate, coating build-up was performed. The
same spray conditions as for splat tests were used (see Table 2). As it was proven than
an initial substrate roughness promotes the mechanical interlocking and coating build-
up (Ref 32), coating build-up experiments were performed on as-received substrates.
2. 3 Characterization of the First Layer Deposition Behavior
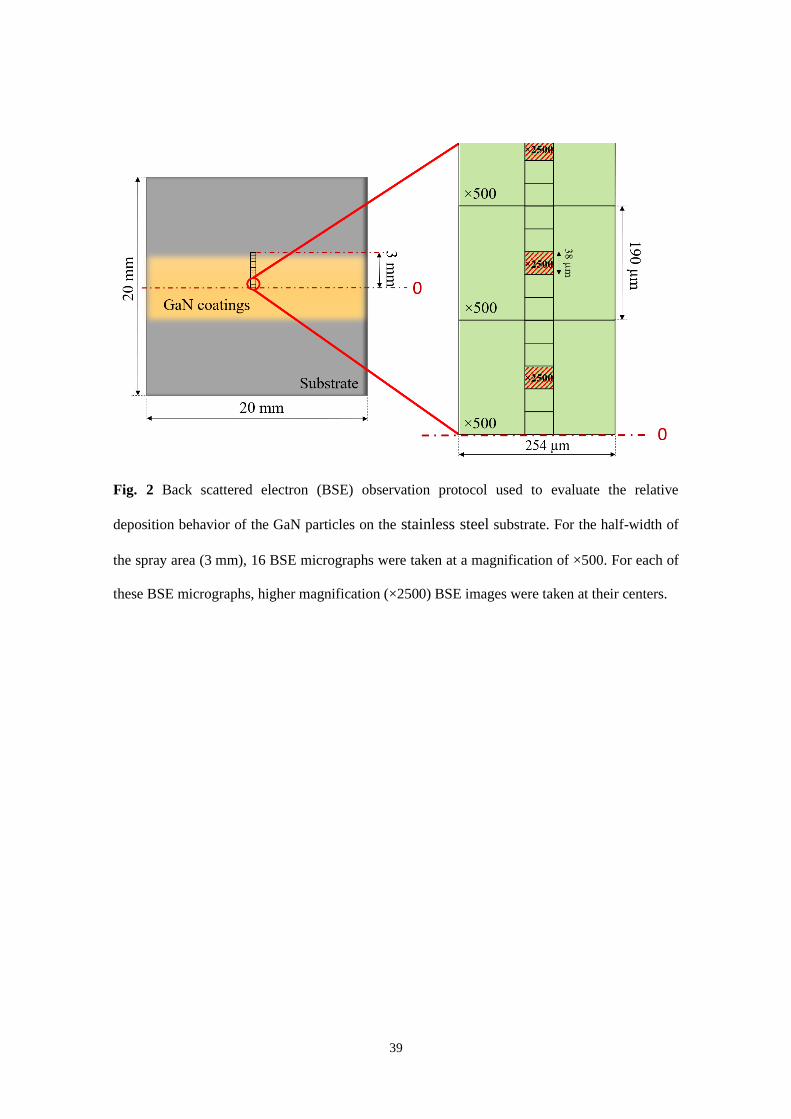
Back-scattered electron (BSE) micrography (FE-SEM, Hitachi SU-70, Tokyo, Japan)
was used to study the deposition behavior of the GaN particle after the splat tests.
Sixteen BSE images were taken from the center to the edge of the spray position,
perpendicular to the spray direction, at a magnification of ×500 (Fig. 2), covering a
surface of 3 mm×254 µm. Meanwhile, to investigate the deposition behavior of the
deposited particles, higher magnification images (×2500) were also taken at the center
of each BSE image (at a magnification of ×500) (Fig. 2). Each BSE image was
processed using the open-source software ImageJ. The study mainly focused on the
identification of the number of particles being deposited, their location of deposition,
and the coverage area on the substrate for each spray condition. Therefore, the
deposition behavior of the GaN particles onto a stainless steel substrate was investigated
and analyzed quantitatively.
2. 4 Coatings Build-up Characterization
Sixteen passes of GaN powder were cold-sprayed onto the as-received stainless steel
substrates to form thick coatings. The influence of the spray conditions (gas temperature
and pressure, see Table 2) on the coating build-up were investigated to understand their
effect on the coating characteristics and the particle/particle bonding mechanisms.
8
During the spray tests, the deposition efficiency (DE) was concluded according to the
ratio of the mass of the deposited powder to the mass of the sprayed powder (Ref 26).
Before the SEM characterization, the thick coating specimens were embedded in a
water-free epoxy resin, ground with SiC sandpaper, polished initially with a 3 µm, and
subsequently with a 1 µm diamond polishing compound with colloidal silica suspension
before immersion in an ultrasonic bath. This procedure helped produce mirror-polished
specimens for SEM analysis without any impurities generated from the polishing step.
Phase analysis of the GaN powder and coatings samples were carried out using X-ray
diffraction (XRD-7000, Shimadzu Scientific Instruments, Tokyo, Japan) with CuKα
radiation having a wavelength of 1.5406 Å, operated at an acceleration voltage of 40 kV
and an emission current of 30 mA, with 2θ from 10-80°, using a step size of 0.02° and a
scan speed of 2.4 s/step.
2. 5 Material Coating Characterization for Photocatalytic Properties
The NOx photocatalytic decomposition process offers an effective way for the
abatement of NOx gas, particularly under sufficient visible-light irradiation (Ref 33).
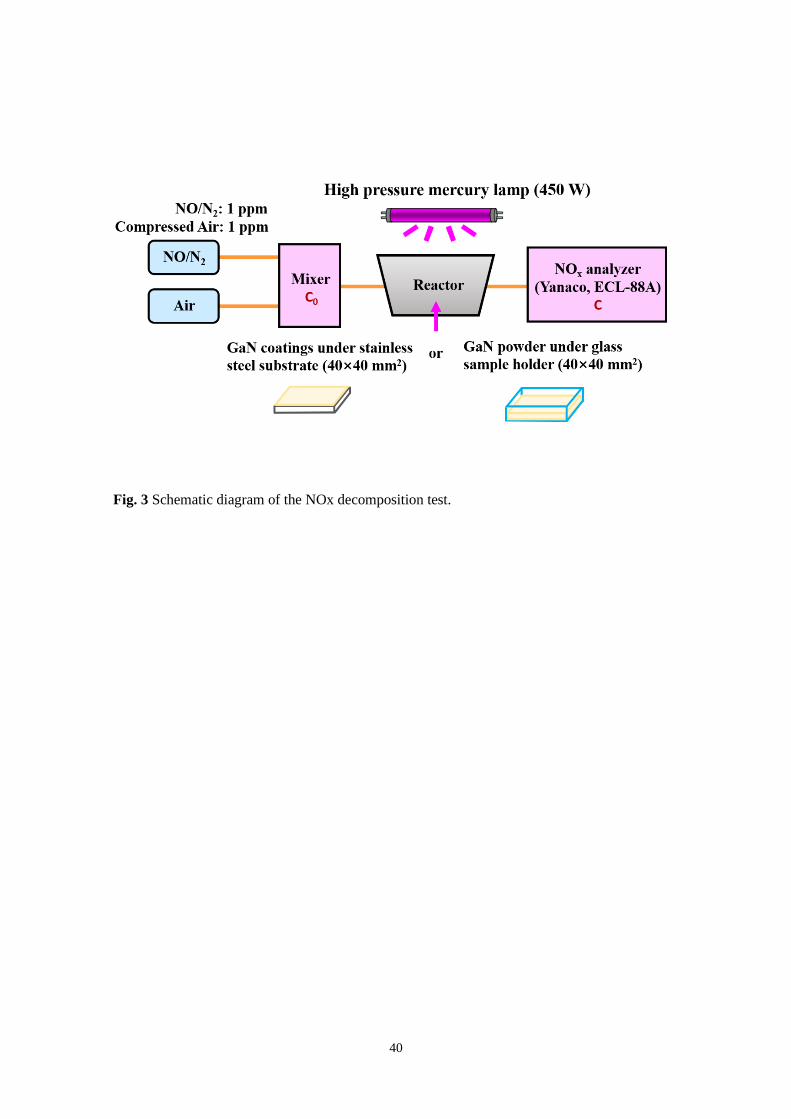
As illustrated in Fig. 3, the photocatalytic properties of the GaN powder and cold-
sprayed GaN coatings on the stainless steel substrates were evaluated using NOx
decomposition tests. Before the test, the NO gas concentration was set at 1 ppm, and
was prepared by mixing compressed air with NO/N2 (2 ppm). The mixed gas was
continuously introduced into the reactor at a flow rate of 200 mL/min. Notably, the
powder was poured in a 40×40 mm2 glass sample holder to ensure the same surface area
of the coated specimen. As for the coated specimen all under a deposition area of
40×40 mm2 in stainless steel substrates, the sample holder was placed on the stage
inside the reactor to perform photocatalytic test. Thereafter, the reactor was placed in

9
the dark for 30 min under continuous NO gas flow of 1 ppm concentration, to reach a
dynamic adsorption–desorption equilibrium of NO gas. After the pretreatment, the tests
were carried out at room temperature (25 °C ) and a 450 W high-pressure mercury (Hg)
lamp irradiation for 10 min (Ref 33) in different light wavelengths. During irradiation,
filters were selected for controlling the light wavelength (λ) in the photocatalytic
reaction, that is, Fuji triacetyl cellulose filter for λ>510 nm, Kenko L41 Super Pro (W)
filter for λ>400 nm, and Pyrex glass for λ>290 nm (Ref 34). Besides, the Hg lamp was
cooled by a circulating water flow generated using a Pyrex jacket. After each irradiation
test under different wavelengths, the sample was placed in the dark for 10 min by
blocking the light, to return to the initial NO concentration.
During the photocatalytic reaction, the gas was directly delivered to a NOx analyzer
(Yanaco ECL-88A, Kyoto, Japan) to measure the NO concentration. Thus, the deNOx
ratio is defined by:
deNO𝑥 𝑟𝑎𝑡𝑖𝑜 =𝐶0 − 𝐶
𝐶0× 100%, (Eq 1)
where 𝐶0 and 𝐶 are the initial and actual concentrations of NOx gas, respectively,
obtained after the photocatalytic reaction.
3. Results and Discussion
3. 1 Characterization of the Feedstock Powder
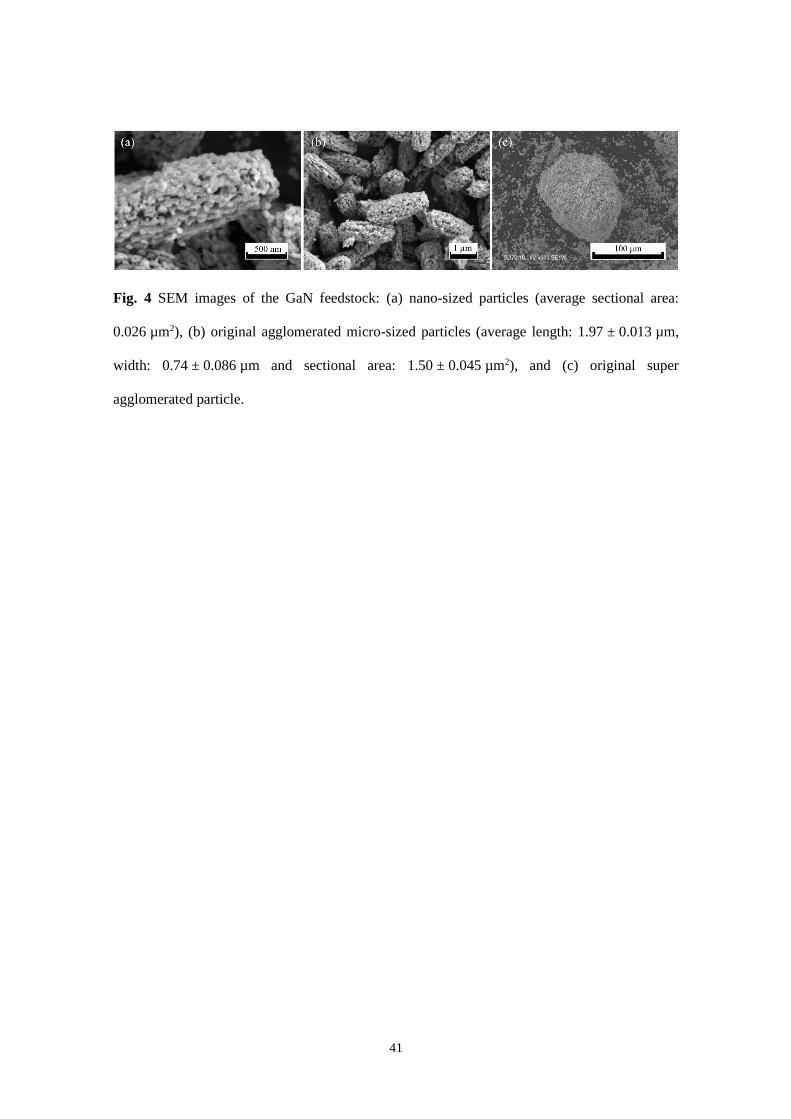
The SEM images of the feedstock powders are displayed in Fig. 4. Nano-sized particles
(Fig. 4 (a)), with an average sectional area of 0.026 µm2, were naturally agglomerated
into micro-sized particles (Fig. 4 (b)). These micro-sized particles possessed an
ellipsoidal shape. Based on the results of particle size distribution using the Rosin-
Rammler model provided by Nikkiso Co. Ltd., (Tokyo, Japan) (Ref 35), the mean

10
particle diameter was estimated to be 1.97 ± 0.013 µm, which can be considered as the
average length of the agglomerated micro-sized particles. From the SEM images, the
average width and sectional area were found to be 0.74 ± 0.086 µm and
1.50 ± 0.045 µm2, respectively. Owing to their small sizes and high surface areas, they
are also strongly affected by the electrostatic surface charge and van der Waals forces,
leading to the formation of super agglomerated particles (Fig. 4 (c)) (Ref 29). In
particular, the super agglomerated particles exhibited a porous microstructure.
3. 2 First Layer Formation
Splat tests were performed on mirror-polished stainless steel substrates to analyze the
particle deformation behavior and its bonding mechanisms with the substrate in absence
of mechanical interlocking (Ref 36). Like most ceramics, bulk GaN exhibits a brittle
behavior (Ref 37–38). However, it was demonstrated that when the material size is
reduced to the nanoscale, even diamonds can undergo plastic deformation (Ref 39).
Considering the brittle-to-ductile transition occurring at the nanoscale, the yield/fracture
strengths show a strong size effect, which increase with the decrease of the material size
(Ref 40).
During splat tests, the original super agglomerated GaN particles, composed of micro-
sized particles, would exhibit “pseudo deformation”, which attribute to the
disintegration of its inherent component micro-sized particles. Therefore, resultant
deagglomeration of the micro-sized and super agglomerated particles due to the
breakage of van der Waals bonds (Fig. 4 (a-b)). At the same time, higher extent of the
breakage of the deposited particles was attributed to the increasing changes of impact
energy by gas temperature and pressure. Therefore, the splat formation is mainly

11
derived from the rearrangement of the interlinked micro-sized particles within the
super-agglomerates.
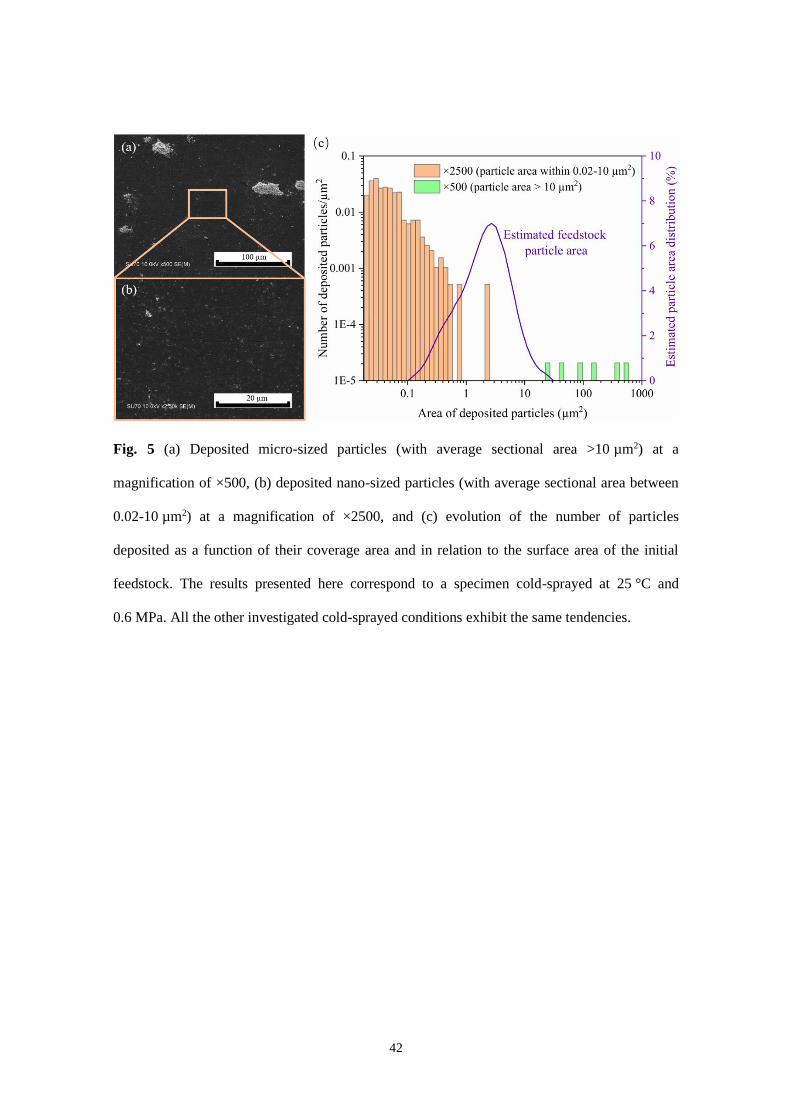
The strategy to quantify the deposition tendency by counting the deposited particles
under each impinging position is demonstrated in Fig. 5 under the spray conditions of
25 °C and 0.6 MPa. From the BSE images (Figs. 5 (a) and (b)), the number of particles
deposited was counted, correlated to their cross-sectional area, and reported in the
histogram (Fig. 5 (c)). The histogram displays the results of the deposited micro-sized
particles (with an average sectional area greater than 10 µm2) exhibited in Fig. 5 (a) (at
a magnification of ×500) and the nano-sized particles (with an average sectional area
between 0.02-10 µm2) exhibited in Fig. 5 (b) (at a magnification of ×2500) as a function
of the coverage area. Considering the initial particle size distribution and the ellipsoidal
shape of the particles, an average length to width ratio equal to 3 can be assumed. The
estimated particle area of the feedstock was compared with the area of the deposited
particles (Fig. 5 (c)). As illustrated in the histogram, a large number of nano-sized
particles are deposited on the substrate. However, the surface area of these particles do
not appear in the feedstock powder. Therefore, to account for the initial particle
feedstock, it can be assumed that the van der Waals bonds and electrostatic forces are
weakened by the impact of the particles on the substrate, leading to the deagglomeration
of the particles. Afterward, an increase revealed in the nano-sized particles being
deposited onto the substrate, while the scattered super-agglomerated particles can be
deposited. Therefore, the original micro-sized particles (Fig. 4 (b)) disintegrated into
nano-sized particles (at an average sectional area between 0.02 and 10 µm2), while the
super agglomerated particles (Fig. 4 (c)) exhibited pseudo-deformation (non-plastic
deformation but deagglomeration into new shape) to micro-sized particles (at the
12
average sectional area greater than 10 µm2), which mainly attribute to the disintegration
of its inherent component micro-sized particles
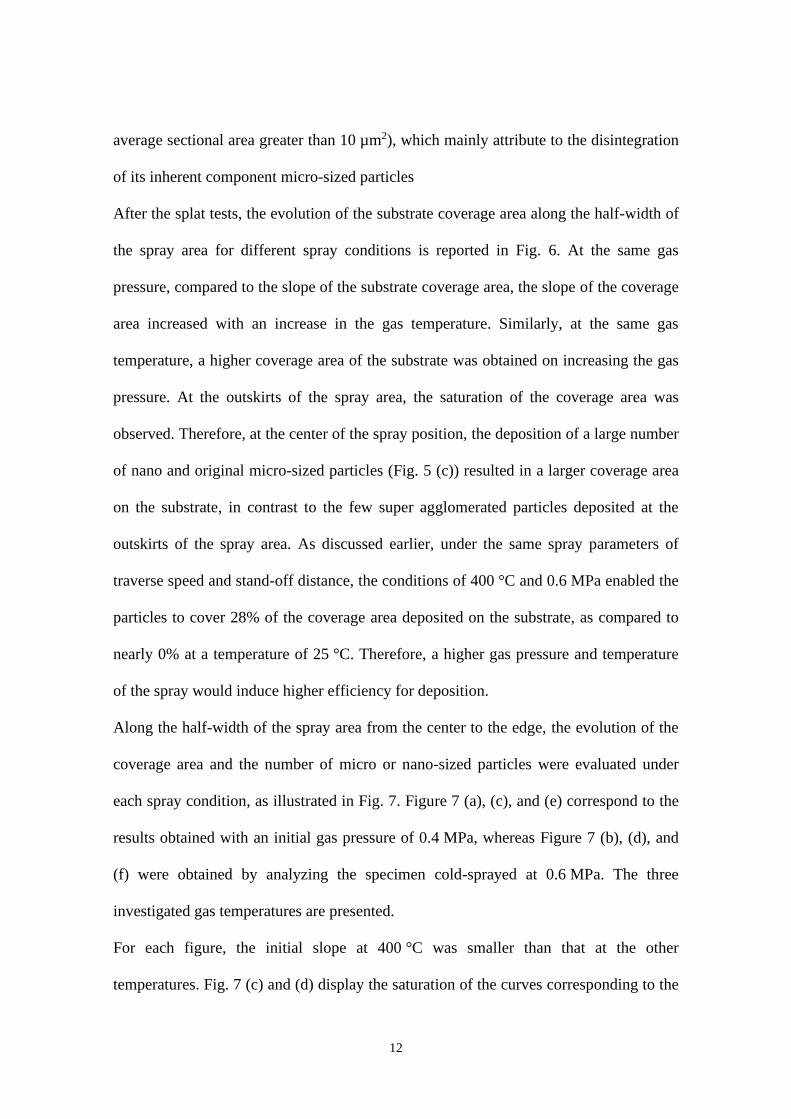
After the splat tests, the evolution of the substrate coverage area along the half-width of
the spray area for different spray conditions is reported in Fig. 6. At the same gas
pressure, compared to the slope of the substrate coverage area, the slope of the coverage
area increased with an increase in the gas temperature. Similarly, at the same gas
temperature, a higher coverage area of the substrate was obtained on increasing the gas
pressure. At the outskirts of the spray area, the saturation of the coverage area was
observed. Therefore, at the center of the spray position, the deposition of a large number
of nano and original micro-sized particles (Fig. 5 (c)) resulted in a larger coverage area
on the substrate, in contrast to the few super agglomerated particles deposited at the
outskirts of the spray area. As discussed earlier, under the same spray parameters of
traverse speed and stand-off distance, the conditions of 400 °C and 0.6 MPa enabled the
particles to cover 28% of the coverage area deposited on the substrate, as compared to
nearly 0% at a temperature of 25 °C. Therefore, a higher gas pressure and temperature
of the spray would induce higher efficiency for deposition.
Along the half-width of the spray area from the center to the edge, the evolution of the
coverage area and the number of micro or nano-sized particles were evaluated under
each spray condition, as illustrated in Fig. 7. Figure 7 (a), (c), and (e) correspond to the
results obtained with an initial gas pressure of 0.4 MPa, whereas Figure 7 (b), (d), and
(f) were obtained by analyzing the specimen cold-sprayed at 0.6 MPa. The three
investigated gas temperatures are presented.
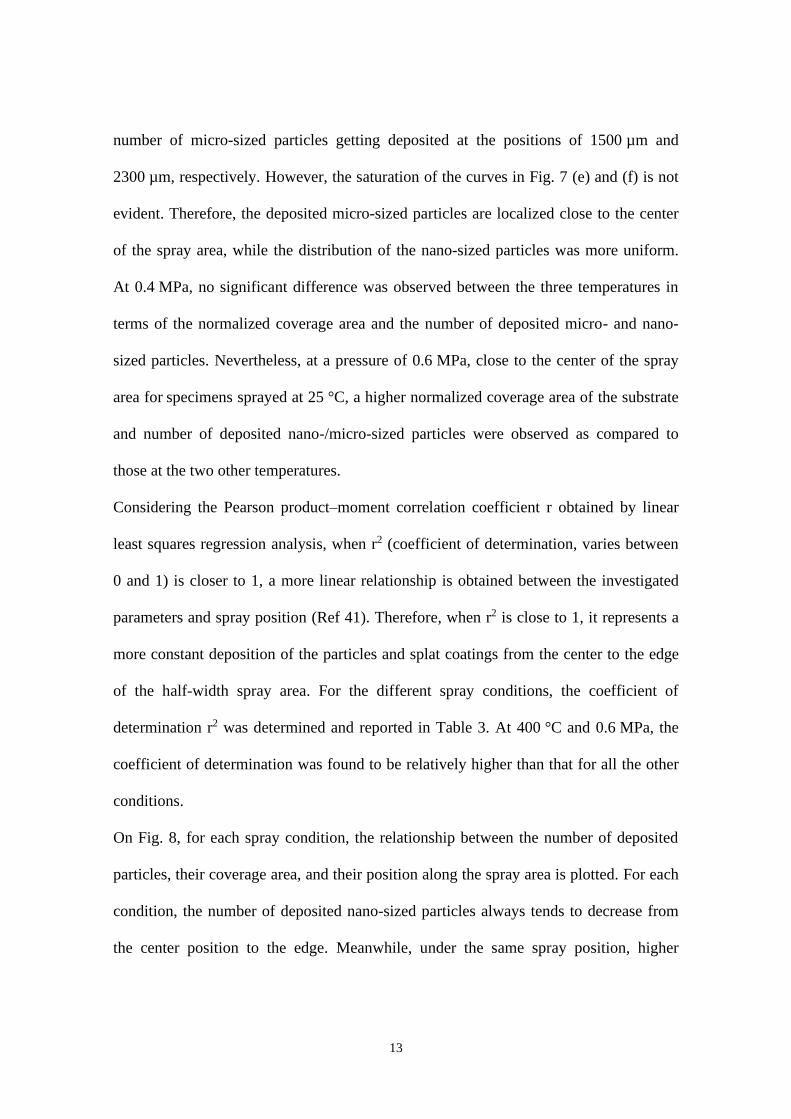
For each figure, the initial slope at 400 °C was smaller than that at the other
temperatures. Fig. 7 (c) and (d) display the saturation of the curves corresponding to the
13
number of micro-sized particles getting deposited at the positions of 1500 µm and
2300 µm, respectively. However, the saturation of the curves in Fig. 7 (e) and (f) is not
evident. Therefore, the deposited micro-sized particles are localized close to the center
of the spray area, while the distribution of the nano-sized particles was more uniform.
At 0.4 MPa, no significant difference was observed between the three temperatures in
terms of the normalized coverage area and the number of deposited micro- and nano-
sized particles. Nevertheless, at a pressure of 0.6 MPa, close to the center of the spray
area for specimens sprayed at 25 °C, a higher normalized coverage area of the substrate
and number of deposited nano-/micro-sized particles were observed as compared to
those at the two other temperatures.
Considering the Pearson product–moment correlation coefficient r obtained by linear
least squares regression analysis, when r2 (coefficient of determination, varies between
0 and 1) is closer to 1, a more linear relationship is obtained between the investigated
parameters and spray position (Ref 41). Therefore, when r2 is close to 1, it represents a
more constant deposition of the particles and splat coatings from the center to the edge
of the half-width spray area. For the different spray conditions, the coefficient of
determination r2 was determined and reported in Table 3. At 400 °C and 0.6 MPa, the
coefficient of determination was found to be relatively higher than that for all the other
conditions.
On Fig. 8, for each spray condition, the relationship between the number of deposited
particles, their coverage area, and their position along the spray area is plotted. For each
condition, the number of deposited nano-sized particles always tends to decrease from
the center position to the edge. Meanwhile, under the same spray position, higher

14
temperature or pressure conditions always resulted in deposition of a higher number of
nano-sized particles.
The average particle size (cross-sectional area) of disintegrated nano-sized particles,
sprayed at 400 °C and 300 °C, decreased distinctly from the center to the edge of the
impinging position, meaning that relatively smaller disintegrated nano-sized particles
would be preferentially deposited than the bigger particles. Moreover, it is evident that a
higher gas pressure and temperature could provide a higher energy for the particles to
disintegrate; therefore, the average area size would also be influenced by a smaller size.
For the condition of 400 °C and 0.6 MPa, the evolution of the substrate coverage area
exhibited a higher efficiency for the formation of the first layer. In addition, the
evolution of the coverage area and the number of deposited particles proved a more
constant deposition of the particles from the center to the edge of the spray area.
Therefore, 400 °C and 0.6 MPa appears to be the best spray conditions for deposition of
GaN powder on stainless steel substrate.
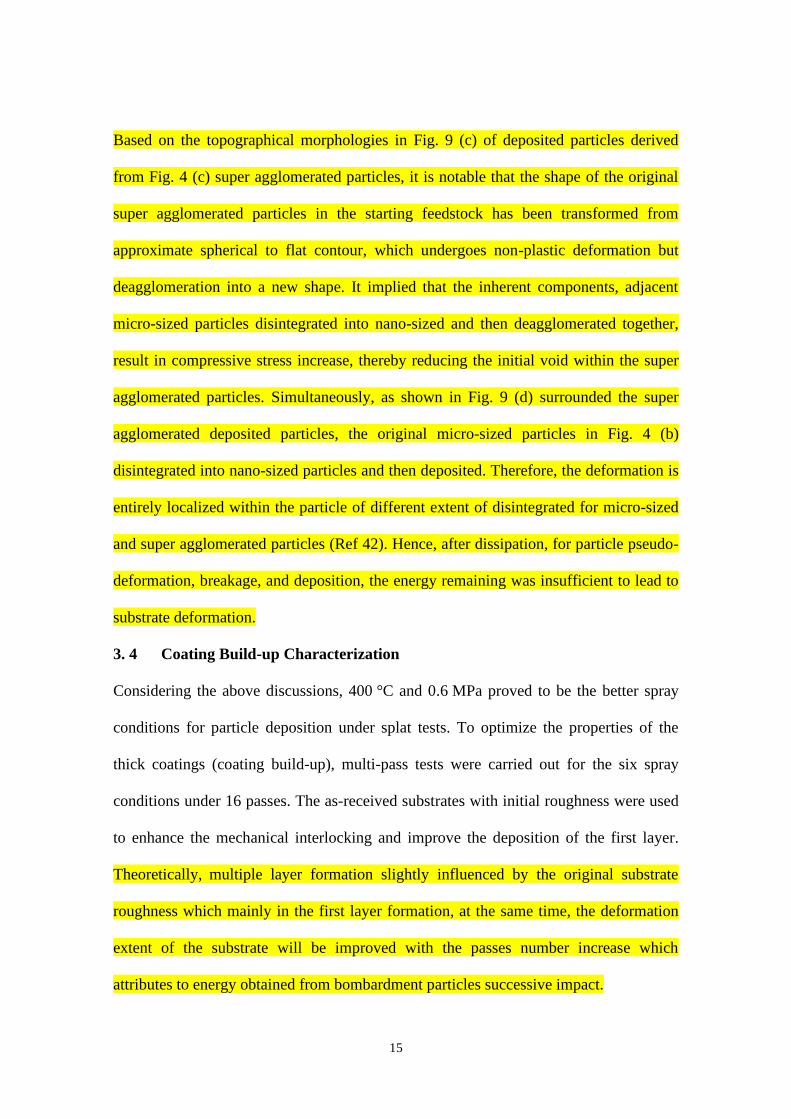
3. 3 Cross-section Observation of Single Deposited Particle Deformation
Behavior
To investigate the microstructure and deformation behavior of the particles and
substrate after the splat tests, a single deposited particle (micro-size) at 400 °C and
0.6 MPa was cut by a (focused ion beam) FIB. The SEM images of the cross-sectional
area morphology at a tilt angle of 45° are displayed in Fig. 9 (a). The deformation of the
substrate was not observed after the splat tests. In addition, the interface between the
substrate and particle did not exhibit any sign of delamination, cracks, or micro-size
porosity (Fig. 9 (b)).
15
Based on the topographical morphologies in Fig. 9 (c) of deposited particles derived
from Fig. 4 (c) super agglomerated particles, it is notable that the shape of the original
super agglomerated particles in the starting feedstock has been transformed from
approximate spherical to flat contour, which undergoes non-plastic deformation but
deagglomeration into a new shape. It implied that the inherent components, adjacent
micro-sized particles disintegrated into nano-sized and then deagglomerated together,
result in compressive stress increase, thereby reducing the initial void within the super
agglomerated particles. Simultaneously, as shown in Fig. 9 (d) surrounded the super
agglomerated deposited particles, the original micro-sized particles in Fig. 4 (b)
disintegrated into nano-sized particles and then deposited. Therefore, the deformation is
entirely localized within the particle of different extent of disintegrated for micro-sized
and super agglomerated particles (Ref 42). Hence, after dissipation, for particle pseudo-
deformation, breakage, and deposition, the energy remaining was insufficient to lead to
substrate deformation.
3. 4 Coating Build-up Characterization
Considering the above discussions, 400 °C and 0.6 MPa proved to be the better spray
conditions for particle deposition under splat tests. To optimize the properties of the
thick coatings (coating build-up), multi-pass tests were carried out for the six spray
conditions under 16 passes. The as-received substrates with initial roughness were used
to enhance the mechanical interlocking and improve the deposition of the first layer.
Theoretically, multiple layer formation slightly influenced by the original substrate
roughness which mainly in the first layer formation, at the same time, the deformation
extent of the substrate will be improved with the passes number increase which
attributes to energy obtained from bombardment particles successive impact.
16
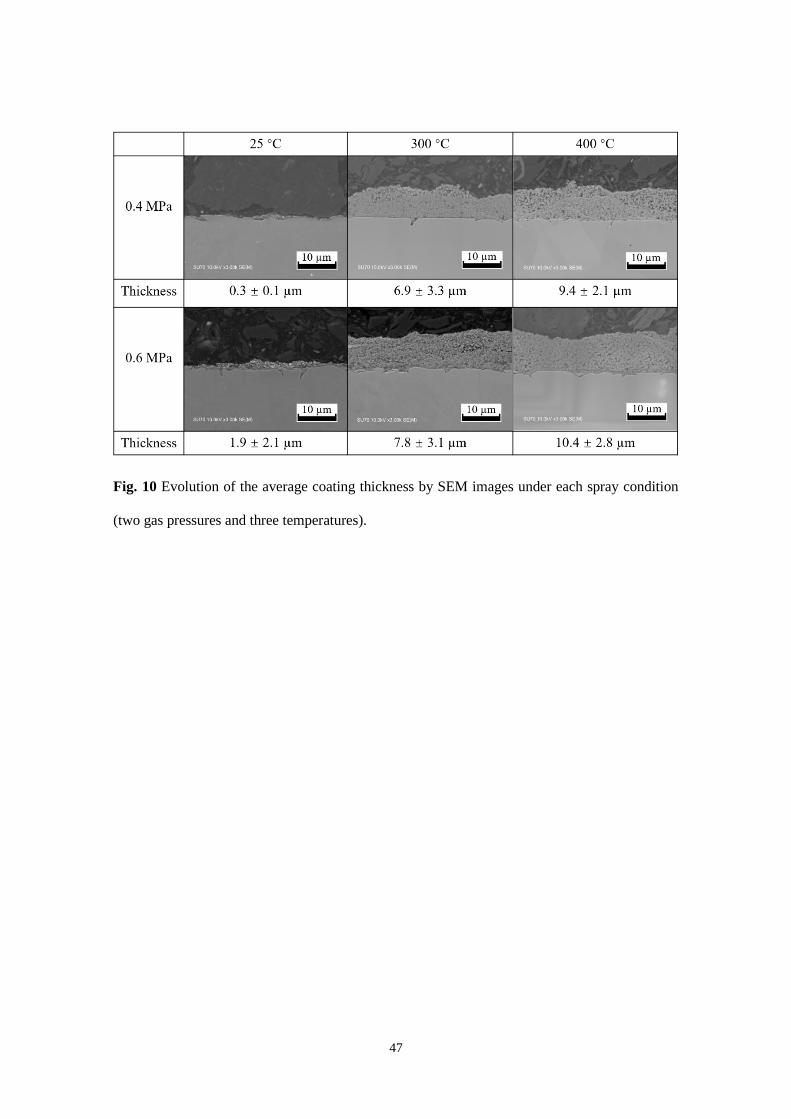
SEM images of the coating build-up after 16 passes, for each spray conditions, are
presented in Fig. 10. From these images, the thickness was measured using ImageJ
software and reported in Fig. 10. At room temperature, no thick coating was obtained
independently of the gas pressure used. Thus, the particles could not be completely
deposited onto the substrates with low kinetic energy. By increasing the gas temperature
and pressure, a thick GaN coating on stainless steel substrate was obtained. In addition,
with the increase of the gas temperature or pressure, the average thickness of the
coatings also increased. For the obtained coatings, the deposition efficiency was
calculated and reported in Fig.11. Even though it remains low, higher deposition
efficiency was reported for the spray condition of 400°C and 0.6 MPa.
Most of the deformed particles seem to be interlocked with their counterparts, creating
more stable interfaces. Higher gas temperature or pressure also increases the substrate
deformation due to the continuous particles’ bombardment on its surface, resulting in an
increase of the deposition efficiency. Therefore, upon the impact of the particles, higher
substrate roughness is induced, leading to the enhancement of the mechanical
interlocking. It also suggests that the compressive stresses induced by the impact help to
close the nano-micro pores within the particles resulting in a very dense coating.
Therefore, the particles are well packed and interlocked with each other in cold-spray
coatings (Ref 42). According to this and the former results, 400 °C and 0.6 MPa appear
to be the better spray conditions to obtain a thick coating on the stainless steel substrate.
3. 5 Evolution of the Coating Crystallite Size
XRD tests were performed before measuring their photocatalytic properties to verify the
crystalline structures of the sprayed GaN coatings and powder. The spray conditions,
roughness, and thickness for each specimen are listed in Table 4. The different GaN

17
coatings (G1–G4) were cold-sprayed under the same pass number, but different spray
conditions (gas temperature and pressure). In addition, it should be noted that G4
corresponds to the specimen sprayed under the best conditions for particle deposition
and coating build-up (400 °C and 0.6 MPa).
A comparison of the XRD patterns of the feedstock powders, stainless steel substrate,
and cold-sprayed GaN coatings on stainless steel substrates (G1, G2, G3, and G4) is
depicted in Fig. 12. The diffraction pattern of the GaN powder exhibited 11 peaks
corresponding to the different orientations of the crystalline phase. Using the pdf cards
of the hexagonal wurtzite structure GaN (JCPDS, No. 74–0243) (Ref 43), the crystalline
orientation related to each peak was identified and presented in Fig. 12.
The XRD diffraction patterns of the GaN coatings on the stainless steel substrates
exhibited the same crystalline phase of the hexagonal wurtzite structure of the GaN
powder (diffraction peak at the same position). Therefore, the cold-spray process does
not lead to anyphase transformation of the GaN powder. The photocatalytic properties
of the powder should be retained within the coating.
Compared to the GaN powder, it can be observed from Fig. 12 that the XRD spectra of
the coatings fabricated from the LPCS process exhibit broadened peaks. To understand
the evolution of the width in the diffraction peak, a simplified integral breadth method,
the Williamson-Hall method, is used. This method considers the effect of the strain-
induced XRD peak broadening and can be used for the calculation of the intrinsic strain
along with the particle size (Ref 44).
The physical line broadening of the X-ray diffraction peak occurs because of the size
and micro-strain of the nanocrystals, and the total broadening 𝛽𝑡𝑜𝑡𝑎𝑙 can be expressed

18
by size-induced peak broadening, 𝛽𝑠𝑖𝑧𝑒 , and strain-induced peak broadening, 𝛽𝑠𝑡𝑟𝑎𝑖𝑛 ,
(Ref 45):
𝛽𝑡𝑜𝑡𝑎𝑙 = 𝛽𝑠𝑖𝑧𝑒 + 𝛽𝑠𝑡𝑟𝑎𝑖𝑛. (Eq 2)
By considering the strain in all the crystallographic directions to be uniform, the
material can be considered as isotropic, i.e., its properties are independent of the
direction chosen for the measurement. Therefore, 𝛽𝑠𝑡𝑟𝑎𝑖𝑛 is related to the residual strain
ɛ by (Ref 45):
𝛽𝑠𝑡𝑟𝑎𝑖𝑛 = 4𝜀 tan 𝜃. (Eq 3)
The origin of Eq 3 may be understood by taking the differential of the Bragg equation
with respect to the d-spacing and diffraction angle.
Sample-induced peak broadening is a convolution of the effects due to both the
crystallite size and stress. The total sample broadening is usually approximated as the
sum of the terms expressed in Eqs 2 and 3:
𝛽ℎ𝑘𝑙 𝑐𝑜𝑠𝜃 =𝑘λ
𝐷+ 4𝜀 𝑠𝑖𝑛𝜃. (Eq 4)
where 𝛽ℎ𝑘𝑙 is the total broadening due to the strain and size in a particular peak having
the value ℎ𝑘𝑙, 𝐷 is the crystallite size, 𝑘 is the shape factor constant equal to 0.94, and λ
is the wavelength of the X-ray (0.1542 nm) (Ref 46).
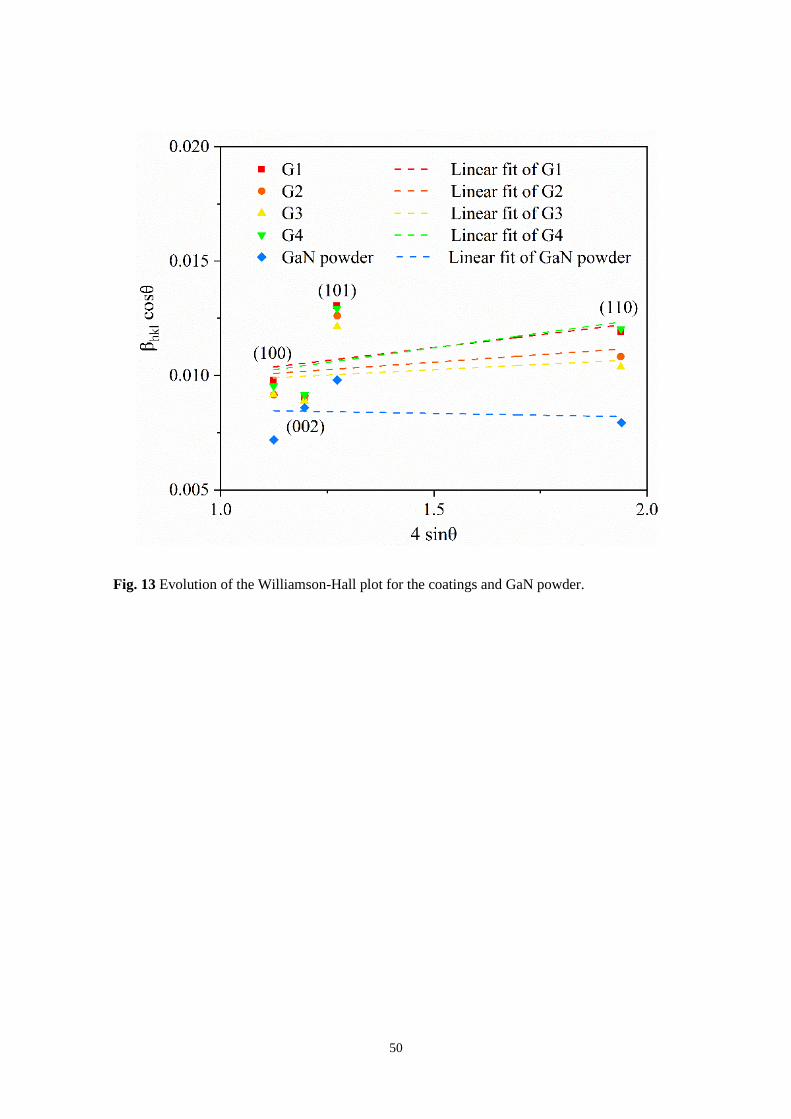
Fig. 13 presents the plot of Eq 4 for the GaN coatings and powder, with 4𝜀 𝑠𝑖𝑛𝜃 along
the X-axis and 𝛽ℎ𝑘𝑙 𝑐𝑜𝑠𝜃 along the Y-axis. Only the four main diffraction peaks were
represented, (100), (002), (101), and (110). In this case, the other peaks were not
included in the analysis because their intensities were not sufficiently strong to allow
the meaningful fitting of their peak shapes.

19
Based on the least-squares linear approximation of these four peaks, the crystallite size
and strain were approximated (Ref 47). According to Eq 4, the slope of the linear
approximation corresponds to the intrinsic strain ɛ, whereas the intercept allows the
calculation of the crystallite size D. For each specimen, based on the values for the
strain and crystallite size that reported in Table 5, tensile strains were generated under
the GaN coatings after cold spray process (Ref 48). As the average crystallite size for
the GaN powder and each coating is almost the same, the magnitude of the strain
broadening greatly exceeded the broadening due to crystal size. Therefore, the
distortions in the lattice of GaN are the main source of the broadening of the diffraction
peaks, which arise from the gradients in the micro strains induced by tensile forces.
Because the broadening of the diffraction peaks due to the changes in the crystallite size
is relatively low (Ref 45), the CS process does not involve any microstructural change
to the particle when coated.
3. 6 Photocatalytic Properties of Cold-sprayed GaN Coatings
After the identification of the crystalline structures of the prepared samples (as-sprayed
GaN coatings and powder), the photocatalytic activity was evaluated by the
decomposition of NOx gas under visible light irradiation in a continuous gas-flow
reactor. As listed in Table 4, the roughness and thickness values for each specimen were
also measured.
NOx decomposition tests were performed to evaluate the photocatalytic properties of
our specimens. As illustrated in Fig. 14, under UV light (10–400 nm), GaN proved to be
effective for the photocatalytic degradation of dyes. Among them, the photocatalytic
properties of the cold-sprayed GaN coatings were approximately 33%, which was 9%
higher than the DeNOx ratio of the GaN powder (approximately 24%).
20
As discussed earlier, the cold-sprayed GaN coatings exhibited higher photocatalytic
properties than the GaN powder. Because the coatings and powder exhibit the same
phase (Fig. 11) and crystallite size (see Table 5), it can be assumed that the
enhancement of the photocatalytic properties is related to the evolution of the coating
surface morphology.
After the LPCS process, no significant change was observed in the crystallite size, and
the coatings did not include any impurities. Only a large difference in the strain between
the powder and coatings is observed, which is induced by the tensile forces. It has been
reported that photocatalysis is a surface reaction; hence, the photocatalytic properties
are affected by the surface morphology (Ref 15). Considering the deformation or
breakdown of the feedstock powder and the average sectional area of the disintegrated
nano-sized particles (Fig. 8), the agglomerated particles tend to break into smaller parts.
The same tendency is observed for multi-pass tests. Because of the severe breakage of
the deposited particles, a decrease in the particle size and an increase in the surface area
of the deposited particles were observed in accordance with the evolution of the gas
temperature and pressure. Therefore, increasing the gas temperature and pressure led to
better photocatalytic properties of the GaN coatings compared to those of the GaN
powder.
As mentioned, photocatalysis is a surface reaction. Therefore, the DeNOx ratio is also
evaluated as a function of coating thickness and roughness (see Fig. 15) (Ref 49). The
decomposition NO conversion ratio increases with increasing thickness and roughness
of the different samples. In particular, considering that G2 shown a relatively higher
decomposition NO conversion ratio with higher roughness but lower thickness than G3.
Thus, a higher roughness of the coatings will be more helpful to increase the
21
photocatalytic activity of the GaN films manufactured by the CS process. The
enhancement of the S/V ratio of the coatings will be necessary to improve their
photocatalytic properties.
4. Conclusion
In this study, for the first time, nano-porous and photocatalytic active GaN coatings
were fabricated with GaN agglomerated powder using the LPCS system. Based on the
splat test results and quantitative analyses under different spray temperatures and
pressures, the best spray conditions were determined to be 400 °C and 0.6 MPa. Upon
the impact on the substrate, the agglomerated micrometer-sized GaN particles
disintegrated, with a large number of the deposited disintegrated particles observed at
the nozzle axis of the traversed area. Furthermore, the critical impact energy was
measured for particles subjected to the highest gas pressures and temperatures, thereby
improving the fragmentation of the agglomerated particles and the deposition efficiency
during the process. Meanwhile, no discernible permanent deformation of the substrate
was observed according to the cross-sectional observation by FIB.
Multi-pass tests were performed in a stainless steel substrate, and changes in the average
thickness were evaluated for different gas temperatures and pressures. From the XRD
patterns of the coating, powder, and substrate, no phase transformation of the material
was observed before and after spraying. In addition, the Williamson-Hall analysis
exhibited no significant changes in the crystallite size after spraying. However, a large
increase in the intrinsic strain after cold spray induced a broadening of the XRD peaks.
Finally, the NOx decomposition test was conducted to evaluate the photocatalytic
properties of the cold-sprayed GaN coatings. Higher decomposition of NO gas was

22
reported for the cold-sprayed specimen under UV light (approximately 33%) than for
the GaN powder, mainly because of the surface area enhancement after cold spraying
without any photocatalytic property degradation. Therefore, a higher thickness and
roughness would be beneficial for improving the photocatalytic properties of the GaN
coatings.
Acknowledgements
This study was partly supported by the JSPS KAKENHI Grant-in-Aid for Scientific
Research (A) 17H01235.

23
References
1. J. Ângelo, L. Andrade, L.M. Madeira, and A. Mendes, An Overview of
Photocatalysis Phenomena Applied to NOx Abatement, J. Environ. Manage.,
2013, 129, p 522–539, doi:10.1016/j.jenvman.2013.08.006.
2. F.L. Toma, G. Bertrand, S. Begin, C. Meunier, O. Barres, D. Klein, and C.
Coddet, Microstructure and Environmental Functionalities of TiO2-Supported
Photocatalysts Obtained by Suspension Plasma Spraying, Appl. Catal. B
Environ., 2006, 68(1–2), p 74–84, doi:10.1016/j.apcatb.2006.07.009.
3. A.A. Ismail and D.W. Bahnemann, Photochemical Splitting of Water for
Hydrogen Production by Photocatalysis: A Review, Sol. Energy Mater. Sol.
Cells, 2014, 128, p 85–101, doi:10.1016/j.solmat.2014.04.037.
4. M. Gardon, C. Fernández-Rodríguez, D. Garzón Sousa, J.M. Doña-Rodríguez, S.
Dosta, I.G. Cano, and J.M. Guilemany, Photocatalytic Activity of Nanostructured
Anatase Coatings Obtained by Cold Gas Spray, J. Therm. Spray Technol., 2014,
23(7), p 1135–1141, doi:10.1007/s11666-014-0087-0.
5. A. Di Mauro, M.E. Fragalà, V. Privitera, and G. Impellizzeri, ZnO for
Application in Photocatalysis: From Thin Films to Nanostructures, Mater. Sci.
Semicond. Process., 2017, 69, p 44–51, doi:10.1016/j.mssp.2017.03.029.
6. J. Fang, H. Fan, Y. Ma, Z. Wang, and Q. Chang, Surface Defects Control for
ZnO Nanorods Synthesized by Quenching and Their Anti-Recombination in
Photocatalysis, Appl. Surf. Sci., 2015, 332, p 47–54,
doi:10.1016/j.apsusc.2015.01.139.
7. X. Chen, L. Liu, P.Y. Yu, and S.S. Mao, Increasing Solar Absorption for
Photocatalysis with Black Hydrogenated Titanium Dioxide Nanocrystals,
24
Science, 2011, 331(6018), p 746–750, doi:10.1126/science.1200448.
8. X. Xi, C. Yang, H. Cao, Z. Yu, J. Li, S. Lin, Z. Ma, and L. Zhao, GaN
Nanocolumns Fabricated by Self-Assembly Ni Mask and Its Enhanced
Photocatalytic Performance in Water Splitting, Appl. Surf. Sci., 2018, 462, p
310–315, doi:10.1016/j.apsusc.2018.08.113.
9. D. Beydoun, R. Amal, G. Low, and S. McEvoy, Role of Nanoparticles in
Photocatalysis, J. Nanopart. Res., 1999, p 439–458, doi:
10.1023/A:1010044830871.
10. A. Sanchez-Martinez, C. Koop-Santa, O. Ceballos-Sanchez, E.R. López-Mena,
M.A. González, V. Rangel-Cobián, E. Orozco-Guareño, and M. García-
Guaderrama, Study of the Preparation of TiO2 Powder by Different Synthesis
Methods, Mater. Res. Express, 2019, 6(8), p 085085(1-13), doi:10.1088/2053-
1591/ab21e8:.
11. S. Fan, B. AlOtaibi, S.Y. Woo, Y. Wang, G.A. Botton, and Z. Mi, High
Efficiency Solar-to-Hydrogen Conversion on a Monolithically Integrated
InGaN/GaN/Si Adaptive Tunnel Junction Photocathode, Nano Lett., 2015, 15(4),
p 2721–2726, doi:10.1021/acs.nanolett.5b00535.
12. T. Kida, Y. Minami, G. Guan, M. Nagano, M. Akiyama, and A. Yoshida,
Photocatalytic Activity of Gallium Nitride for Producing Hydrogen from Water
under Light Irradiation, J. Mater. Sci., 2006, 41(11), p 3527–3534,
doi:10.1007/s10853-005-5655-8.
13. J.L. Yang, S.J. An, W. Il Park, G.-C. Yi, and W. Choi, Photocatalysis Using ZnO
Thin Films and Nanoneedles Grown by Metal-Organic Chemical Vapor
Deposition, Adv. Mater., 2004, 16(18), p 1661–1664,

25
doi:10.1002/adma.200306673.
14. Y. Xie and C. Yuan, Transparent TiO2 Sol Nanocrystallites Mediated
Homogeneous-like Photocatalytic Reaction and Hydrosol Recycling Process, J.
Mater. Sci., 2005, 40(24), p 6375–6383, doi:10.1007/s10853-005-1825-y.
15. H.S. Jung, Y.J. Hong, Y. Li, J. Cho, Y.J. Kim, and G.C. Yi, Photocatalysis Using
GaN Nanowires, ACS Nano, 2008, 2(4), p 637–642, doi:10.1021/nn700320y.
16. G.J. Yang, C.J. Li, F. Han, W.Y. Li, and A. Ohmori, Low Temperature
Deposition and Characterization of TiO2 Photocatalytic Film through Cold Spray,
Appl. Surf. Sci., 2008, 254(3), p 3979–3982, doi:10.1016/j.apsusc.2007.12.016.
17. A.E. Wickenden, D.D. Koleske, R.L. Henry, M.E. Twigg, and M. Fatemi,
Resistivity Control in Unintentionally Doped GaN Films Grown by MOCVD, J.
Cryst. Growth, 2004, 260(1–2), p 54–62, doi:10.1016/j.jcrysgro.2003.08.024.
18. T.D. Moustakas, E. Iliopoulos, A.V. Sampath, H.M. Ng, D. Doppalapudi, M.
Misra, D. Korakakis, and R. Singh, Growth and Device Applications of III-
Nitrides by MBE, J. Cryst. Growth, 2001, 227–228, p 13–20,
doi:10.1016/S0022-0248(01)00625-X.
19. H. Geng, H. Sunakawa, N. Sumi, K. Yamamoto, A. Atsushi Yamaguchi, and A.
Usui, Growth and Strain Characterization of High Quality GaN Crystal by
HVPE, J. Cryst. Growth, 2012, 350(1), p 44–49,
doi:10.1016/j.jcrysgro.2011.12.020.
20. M. Bideau, B. Claudel, C. Dubien, L. Faure, and H. Kazouan, On the
‘Immobilization’ of Titanium Dioxide in the Photocatalytic Oxidation of Spent
Waters, Appl. Surf. Sci., 2008, 254(3), p 3979–3982,
doi:10.1016/j.apsusc.2007.12.016.

26
21. N.J. Peill and M.R. Hoffmann, Development and Optimization of a TiO2-Coated
Fiber-Optic Cable Reactor: Photocatalytic Degradation of 4-Chlorophenol,
Environ. Sci. Technol., 1995, 29(12), p 2974–2981, doi:10.1021/es00012a013.
22. H. Hajipour, A. Abdollah-zadeh, H. Assadi, E. Taheri-Nassaj, and H. Jahed,
Effect of Feedstock Powder Morphology on Cold-Sprayed Titanium Dioxide
Coatings, J. Therm. Spray Technol., 2018, 27(8), p 1542–1550,
doi:10.1007/s11666-018-0782-3.
23. K. Ravi, Y. Ichikawa, T. Deplancke, K. Ogawa, O. Lame, and J.Y. Cavaille,
Development of Ultra-High Molecular Weight Polyethylene (UHMWPE)
Coating by Cold Spray Technique, J. Therm. Spray Technol., 2015, 24(6), p
1015–1025.
24. X. Chu, H. Che, P. Vo, R. Chakrabarty, B. Sun, J. Song, and S. Yue,
Understanding the Cold Spray Deposition Efficiencies of 316L/Fe Mixed
Powders by Performing Splat Tests onto as-Polished Coatings, Surf. Coat.
Technol., 2017, 324, p 353–360, doi: 10.1016/j.surfcoat.2017.05.083.
25. H.Y. Lee, S.H. Jung, S.Y. Lee, Y.H. You, and K.H. Ko, Correlation between
Al2O3 Particles and Interface of Al-Al2O3 Coatings by Cold Spray, Appl. Surf.
Sci., Elsevier, 2005, 252(5), p 1891–1898.
26. K. Ravi, W.L. Sulen, C. Bernard, Y. Ichikawa, and K. Ogawa, Fabrication of
Micro-/Nano-Structured Super-Hydrophobic Fluorinated Polymer Coatings by
Cold-Spray, Surf. Coatings Technol., Elsevier, 2019, 373(May), p 17–24,
doi:10.1016/j.surfcoat.2019.05.078.
27. H.X. Hu, S.L. Jiang, Y.S. Tao, T.Y. Xiong, and Y.G. Zheng, Cavitation Erosion
and Jet Impingement Erosion Mechanism of Cold Sprayed Ni-Al2O3 Coating,

27
Nucl. Eng. Des., 2011, 241(12), p 4929–4937.
28. T.H. Van Steenkiste, J.R. Smith, and R.E. Teets, Aluminum Coatings via Kinetic
Spray with Relatively Large Powder Particles, Surf. Coat. Technol., 2002, 154(2–
3), p 237–252, doi:10.1016/S0257-8972(02)00018-X.
29. D. Hanft, J. Exner, M. Schubert, T. Stöcker, P. Fuierer, and R. Moos, An
Overview of the Aerosol Deposition Method: Process Fundamentals and New
Trends in Materials Applications, J. Ceram. Sci. Technol., 2015, 6(3), p 147–181,
doi:10.4416/JCST2015-00018.
30. W. Lock Sulen, K. Ravi, C. Bernard, Y. Ichikawa, and K. Ogawa, Deposition
Mechanism Analysis of Cold-Sprayed Fluoropolymer Coatings and Its
Wettability Evaluation, J. Therm. Spray Technol., 2020, doi:10.1007/s11666-
020-01059-w.
31. Y. Ichikawa and K. Ogawa, Effect of Substrate Surface Oxide Film Thickness on
Deposition Behavior and Deposition Efficiency in the Cold Spray Process, J.
Therm. Spray Technol., 2015, 24(7), p 1269–1276, doi:10.1007/s11666-015-
0299-y.
32. N.I. Omar, S. Selvami, M. Kaisho, M. Yamada, T. Yasui, and M. Fukumoto,
Deposition of Titanium Dioxide Coating by the Cold-Spray Process on Annealed
Stainless Steel Substrate, Coatings, 2020, 10(10), p 1–13.
33. J. Wang, Y. Asakura, and S. Yin, Preparation of (Zn1+XGe)(N2Ox) Nanoparticles
with Enhanced NOx Decomposition Activity under Visible Light Irradiation by
Nitridation of Zn2GeO4 Nanoparticles Designed Precisely, Nanoscale, 2019,
11(42), p 20151–20160, doi:10.1039/C9NR05244E.
34. S. Yin, Q. Zhang, F. Saito, and T. Sato, Preparation of Visible Light-Activated

28
Titania Photocatalyst by Mechanochemical Method, Chem. Lett., 2003, 32(4), p
358–359, doi:10.1246/cl.2003.358.
35. R. Ghelichi, S. Bagherifard, D. MacDonald, I. Fernandez-Pariente, B. Jodoin,
and M. Guagliano, Experimental and Numerical Study of Residual Stress
Evolution in Cold Spray Coating, Appl. Surf. Sci., 2014, 288, p 26–33,
doi:10.1016/j.apsusc.2013.09.074.
36. S.I. Imbriglio, M. Hassani-Gangaraj, D. Veysset, M. Aghasibeig, R. Gauvin,
K.A. Nelson, C.A. Schuh, and R.R. Chromik, Adhesion Strength of Titanium
Particles to Alumina Substrates: A Combined Cold Spray and LIPIT Study, Surf.
Coatings Technol., Elsevier B.V., 2019, 361, p 403–412.
37. A. Banerjee, D. Bernoulli, H. Zhang, M.F. Yuen, J. Liu, J. Dong, F. Ding, J. Lu,
M. Dao, W. Zhang, Y. Lu, and S. Suresh, Ultralarge Elastic Deformation of
Nanoscale Diamond, Science (80-. )., American Association for the
Advancement of Science, 2018, 360(6386), p 300–302.
38. H. Zhang, J. Tersoff, S. Xu, H. Chen, Q. Zhang, K. Zhang, Y. Yang, C.S. Lee,
K.N. Tu, J. Li, and Y. Lu, Approaching the Ideal Elastic Strain Limit in Silicon
Nanowires, Sci. Adv., American Association for the Advancement of Science,
2016, 2(8).
39. A. Nie, Y. Bu, J. Huang, Y. Shao, Y. Zhang, W. Hu, J. Liu, Y. Wang, B. Xu, Z.
Liu, H. Wang, W. Yang, and Y. Tian, Direct Observation of Room-Temperature
Dislocation Plasticity in Diamond, Matter, Cell Press, 2020, 2(5), p 1222–1232.
40. S. Fan, X. Li, R. Fan, and Y. Lu, Size-Dependent Fracture Behavior of GaN
Pillars under Room Temperature Compression, Nanoscale, Royal Society of
Chemistry, 2020, 12(45), p 23241–23247.
29
41. M.T. Puth, M. Neuhäuser, and G.D. Ruxton, Effective Use of Pearson’s Product-
Moment Correlation Coefficient, Anim. Behav., 2014, 93, p 183-189,
doi:10.1016/j.anbehav.2014.05.003.
42. P.C. King, S.H. Zahiri, and M. Jahedi, Focused Ion Beam Micro-Dissection of
Cold-Sprayed Particles, Acta Mater., 2008, 56(19), p 5617–5626,
doi:10.1016/j.actamat.2008.07.034.
43. M. Zhang, Y. Liu, M. Yang, W. Zhang, J. Zhou, Z. Zhang, E. Xie, X. Pan, and S.
Li, High Performance Self-Powered Ultraviolet Photodetectors Based on
Electrospun Gallium Nitride Nanowires, Appl. Surf. Sci., 2018, 452, p 43–48,
doi:10.1016/j.apsusc.2018.04.225.
44. D. Nath, F. Singh, and R. Das, X-Ray Diffraction Analysis by Williamson-Hall,
Halder-Wagner and Size-Strain Plot Methods of CdSe Nanoparticles- a
Comparative Study, Mater. Chem. Phys., 2020, 239, p 122021,
doi:10.1016/j.matchemphys.2019.122021.
45. A.W. Burton, K. Ong, T. Rea, and I.Y. Chan, On the Estimation of Average
Crystallite Size of Zeolites from the Scherrer Equation: A Critical Evaluation of
Its Application to Zeolites with One-Dimensional Pore Systems, Microporous
Mesoporous Mater., 2009, 117(1–2), p 75–90,
doi:10.1016/j.micromeso.2008.06.010.
46. V. Mote, Y. Purushotham, and B. Dole, Williamson-Hall Analysis in Estimation
of Lattice Strain in Nanometer-Sized ZnO Particles, J. Theor. Appl. Phys., 2012,
6(1), p 6–14, doi:10.1186/2251-7235-6-6.
47. G.K. Williamson and W.H. Hall, X-Ray Broadening from Filed Aluminium
andWolfram, Acta Metall., 1953, 1(1), p 22–31, doi: 10.1016/0001-
30
6160(53)90006-6.
48. P.M. Kibasomba, S. Dhlamini, M. Maaza, C.P. Liu, M.M. Rashad, D.A. Rayan,
and B.W. Mwakikunga, Strain and Grain Size of TiO2 Nanoparticles from TEM,
Raman Spectroscopy and XRD: The Revisiting of the Williamson-Hall Plot
Method, Results Phys., Elsevier B.V., 2018, 9, p 628–635.
49. M. Yamada, H. Isago, H. Nakano, and M. Fukumoto, Cold Spraying of TiO2
Photocatalyst Coating with Nitrogen Process Gas, J. Therm. Spray Technol.,
2010, 19(6), p 1218–1223, doi:10.1007/s11666-010-9520-1.

31
Figure Captions:
Fig. 1 Schematic representation of a typical downstream injection cold spray system.
Fig. 2 Back scattered electron (BSE) observation protocol used to evaluate the relative
deposition behavior of the GaN particles on the stainless steel substrate. For the half-
width of the spray area (3 mm), 16 BSE micrographs were taken at a magnification of
×500. For each of these BSE micrographs, higher magnification (×2500) BSE images
were taken at their centers.
Fig. 3 Schematic diagram of the NOx decomposition test.
Fig. 4 SEM images of the GaN feedstock: (a) nano-sized particles (average sectional
area: 0.026 µm2), (b) original agglomerated micro-sized particles (average length: 1.97
± 0.013 µm, width: 0.74 ± 0.086 µm and sectional area: 1.50 ± 0.045 µm2), and (c)
original super agglomerated particle.
Fig. 5 (a) Deposited micro-sized particles (with average sectional area >10 µm2) at a
magnification of ×500, (b) deposited nano-sized particles (with average sectional area
between 0.02-10 µm2) at a magnification of ×2500, and (c) evolution of the number of
particles deposited as a function of their coverage area and in relation to the surface area
of the initial feedstock. The results presented here correspond to a specimen cold-
sprayed at 25 °C and 0.6 MPa. All the other investigated cold-sprayed conditions
exhibited the same tendencies.
Fig. 6 Evolution of the substrate coverage area after splat tests along the half-width of
the spray area for the two gas pressures (a) 0.4 MPa (b) 0.6 MPa, and the three
temperatures.

32
Fig. 7 Evolution of the (a)-(b) coverage area, (c)-(d) number of micro-size particles, and
(e)-(f) number of nano-sized particles along the half-width of the spray area for the two
gas pressures and the three temperatures investigated.
Fig. 8 Evolution of the number of nano-sized particles correlated with the coverage area
of substrate along the half-width of the spray area for the two gas pressures (a) 0.4 MPa
(b) 0.6 MPa, and the three temperatures.
Fig. 9 SEM images of (a) the cross-sectional area of the deposited particles at a tilt
angle of 45°, (b) interface between the deposited particles and stainless steel substrate,
(c) the topographical morphologies of deposited particles which derived from super
agglomerated particles, and (d) topographical morphologies of adjacent deposited
particles derived from micro-sized particles.
Fig. 10 Evolution of the average coating thickness by SEM images under each spray
condition (two gas pressures and three temperatures).
Fig. 11 Deposition efficiency of the GaN coatings under the spray condition in two gas
pressures and two temperatures.
Fig. 12 XRD spectra of the GaN powder, GaN coatings and stainless steel substrate.
Fig. 13 Evolution of the Williamson-Hall plot for the coatings and GaN powder.
Fig. 14 Photocatalytic properties of each cold-sprayed specimen and GaN powder
evaluated by NOx decomposition tests.
Fig. 15 Evolution of the deNOx ratio with the (a) thickness and (b) roughness of the
coatings.

33
Table 1 Material properties of GaN powder and stainless steel substrates.
GaN
Parameter Density
(g/cm3)
Melting temperature
(K)
Band gap
(eV)
Value 0.7 >1600 3.4
Stainless steel substrate
Parameter Roughness, Ra
(µm)
Roughness, Rz
(µm)
Hardness
(HV)
As-received 0.10 ± 0.012 0.83 ± 0.076
216
Mirror polishing 0.06 ± 0.012 0.39 ± 0.101
34
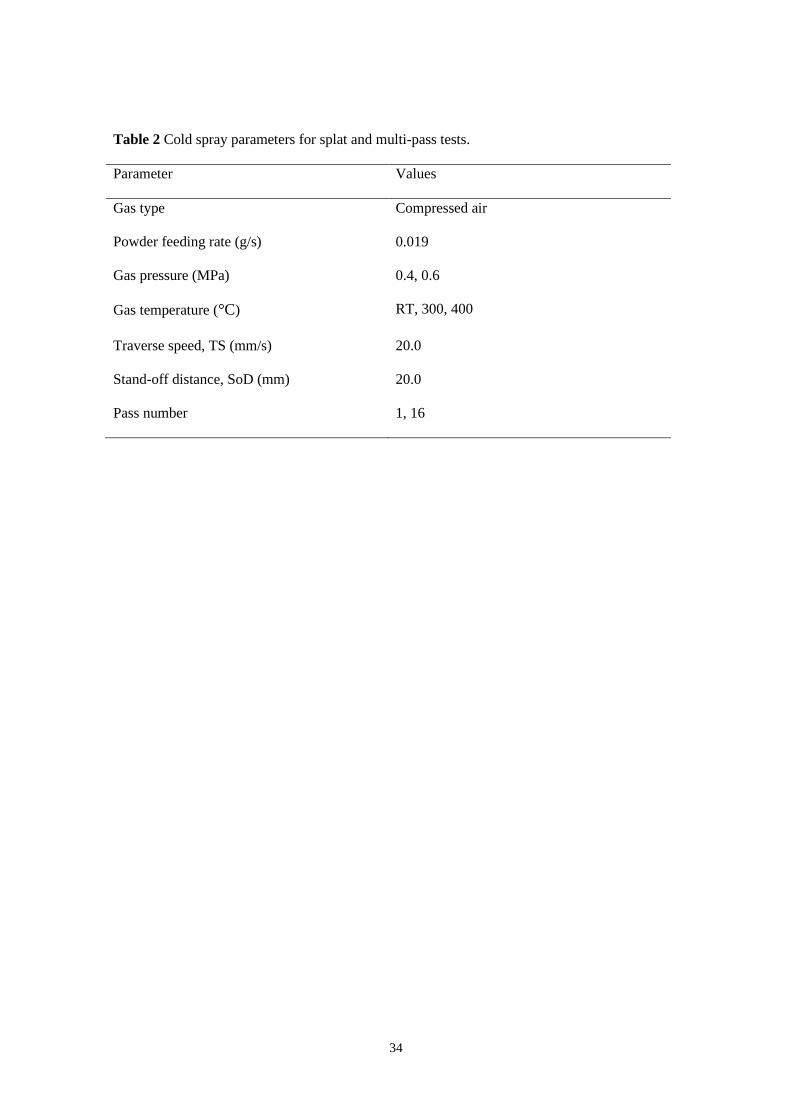
Table 2 Cold spray parameters for splat and multi-pass tests.
Parameter Values
Gas type Compressed air
Powder feeding rate (g/s) 0.019
Gas pressure (MPa) 0.4, 0.6
Gas temperature (°C) RT, 300, 400
Traverse speed, TS (mm/s) 20.0
Stand-off distance, SoD (mm) 20.0
Pass number 1, 16

35
Table 3 Evolution of r2 (coefficient of determination) under each spray condition.
Conditions r2 for substrate
coverage area
r2 for number of
micro-sized particles
r2 for number of
nano-sized particles
25 °C and 0.4 MPa 0.94 0.87 0.97
25 °C and 0.6 MPa 0.87 0.76 0.94
300 °C and 0.4 MPa 0.91 0.83 0.96
300 °C and 0.6 MPa 0.92 0.84 0.99
400 °C and 0.4 MPa 0.95 0.86 0.99
400 °C and 0.6 MPa 0.96 0.89 0.99
36
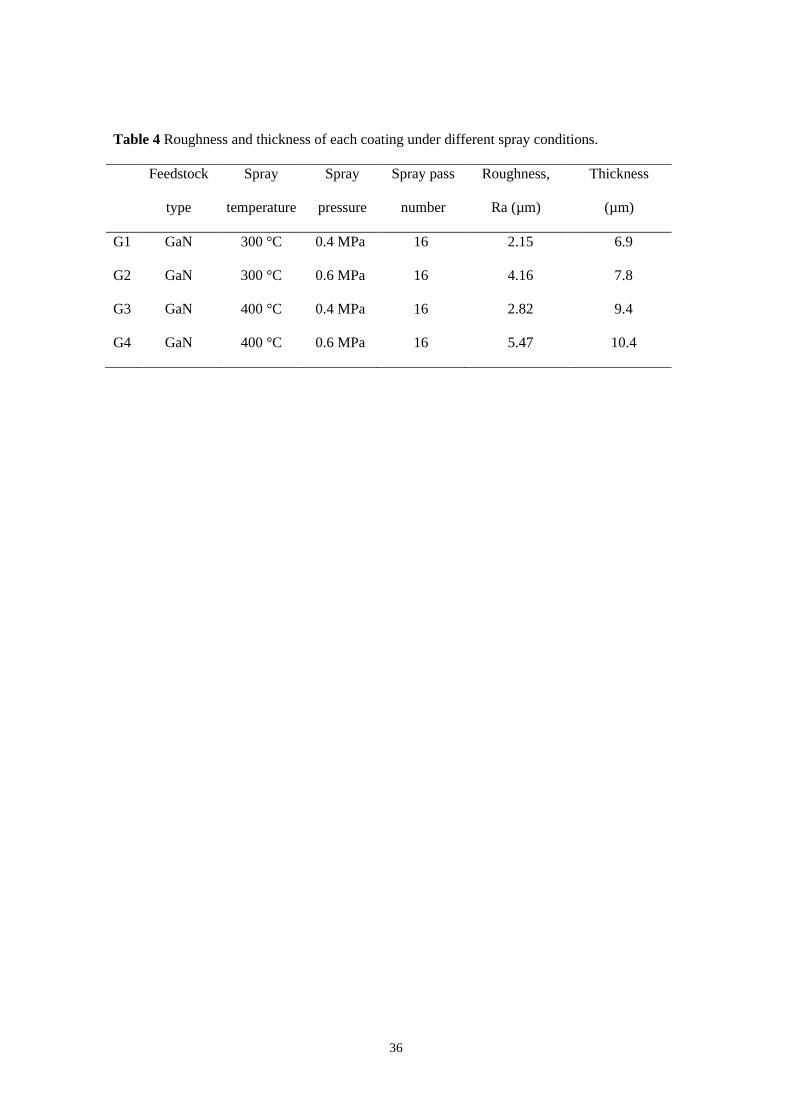
Table 4 Roughness and thickness of each coating under different spray conditions.
Feedstock
type
Spray
temperature
Spray
pressure
Spray pass
number
Roughness,
Ra (µm)
Thickness
(µm)
G1 GaN 300 °C 0.4 MPa 16 2.15 6.9
G2 GaN 300 °C 0.6 MPa 16 4.16 7.8
G3 GaN 400 °C 0.4 MPa 16 2.82 9.4
G4 GaN 400 °C 0.6 MPa 16 5.47 10.4

37
Table 5 Evolution of the strain and average crystallite size of each specimen.
G1 G2 G3 G4 GaN powder
Strain (×10-3) 3.0 1.7 1.5 2.8 0.2
Crystallite size D (nm) 22.7 18.2 18.8 18.3 19.9
38
Fig. 1 Schematic representation of a typical downstream injection cold spray system.
39
Fig. 2 Back scattered electron (BSE) observation protocol used to evaluate the relative
deposition behavior of the GaN particles on the stainless steel substrate. For the half-width of
the spray area (3 mm), 16 BSE micrographs were taken at a magnification of ×500. For each of
these BSE micrographs, higher magnification (×2500) BSE images were taken at their centers.
40
Fig. 3 Schematic diagram of the NOx decomposition test.
41
Fig. 4 SEM images of the GaN feedstock: (a) nano-sized particles (average sectional area:
0.026 µm2), (b) original agglomerated micro-sized particles (average length: 1.97 ± 0.013 µm,
width: 0.74 ± 0.086 µm and sectional area: 1.50 ± 0.045 µm2), and (c) original super
agglomerated particle.
42
Fig. 5 (a) Deposited micro-sized particles (with average sectional area >10 µm2) at a
magnification of ×500, (b) deposited nano-sized particles (with average sectional area between
0.02-10 µm2) at a magnification of ×2500, and (c) evolution of the number of particles
deposited as a function of their coverage area and in relation to the surface area of the initial
feedstock. The results presented here correspond to a specimen cold-sprayed at 25 °C and
0.6 MPa. All the other investigated cold-sprayed conditions exhibit the same tendencies.

43
Fig. 6 Evolution of the substrate coverage area after splat tests along the half-width of the spray
area for the two gas pressures (a) 0.4 MPa (b) 0.6 MPa, and the three temperatures.

44
Fig. 7 Evolution of the (a)-(b) coverage area, (c)-(d) number of micro-size particles, and (e)-(f)
number of nano-sized particles along the half-width of the spray area for the two gas pressures
and the three temperatures investigated.

45
Fig. 8 Evolution of the number of nano-sized particles correlated with the coverage area of
substrate along the half-width of the spray area for the two gas pressures (a) 0.4 MPa (b)
0.6 MPa, and the three temperatures.

46
Fig. 9 SEM images of (a) the cross-sectional area of the deposited particles at a tilt angle of 45°,
(b) interface between the deposited particles and stainless steel substrate, (c) the topographical
morphologies of deposited particles which derived from super agglomerated particles, and (d)
topographical morphologies of adjacent deposited particles derived from micro-sized particles.
47
Fig. 10 Evolution of the average coating thickness by SEM images under each spray condition
(two gas pressures and three temperatures).

48
Fig. 11 Deposition efficiency of the GaN coatings under the spray condition in two gas
pressures and two temperatures.

49
Fig. 12 XRD spectra of the GaN powder, GaN coatings and stainless steel substrate.
50
Fig. 13 Evolution of the Williamson-Hall plot for the coatings and GaN powder.

51
Fig. 14 Photocatalytic properties of each cold-sprayed specimen and GaN powder evaluated by
NOx decomposition tests.

52
Fig. 15 Evolution of the deNOx ratio with respect to the (a) thickness and (b) roughness of the
coatings.


![SYNTHESIS, CHARACTERIZATION AND PHOTOCATALYTIC ... · stability [12]. The photocatalytic activity of zinc oxide and metal doped zinc oxide nanoparticles is increased by increasing](https://img.dokumen.tips/doc/110x75/5f046a957e708231d40ddca4/synthesis-characterization-and-photocatalytic-stability-12-the-photocatalytic.jpg)