Embed Size (px)
Citation preview
DEVELOPMENT AND APPLICATION OF A
HYDROCLIMATOLOGICAL STREAM
TEMPERATURE MODEL WITHIN SWAT Darren L. Ficklin1, Yuzhou Luo2, Iris T. Stewart1, Edwin P. Maurer3
1Environmental Studies Institute, Santa Clara University, CA 95053
2Department of Land, Air and Water Resources, University of California, Davis, CA 95616
3Civil Engineering Department, Santa Clara University, Santa Clara, CA 95053
Environmental Studies Institute at Santa Clara University
1
Introduction and background
Stream temperature has direct and indirect effects
on aquatic species health
Stream temperatures reflect the combined influence
of meteorological and hydrologic factors
Stream temperature strongly correlated to air temp.
Low streamflow, lower the capacity for heat storage
Snowmelt, surface runoff, and groundwater entering the
stream have different temperature signatures
2
Introduction and background
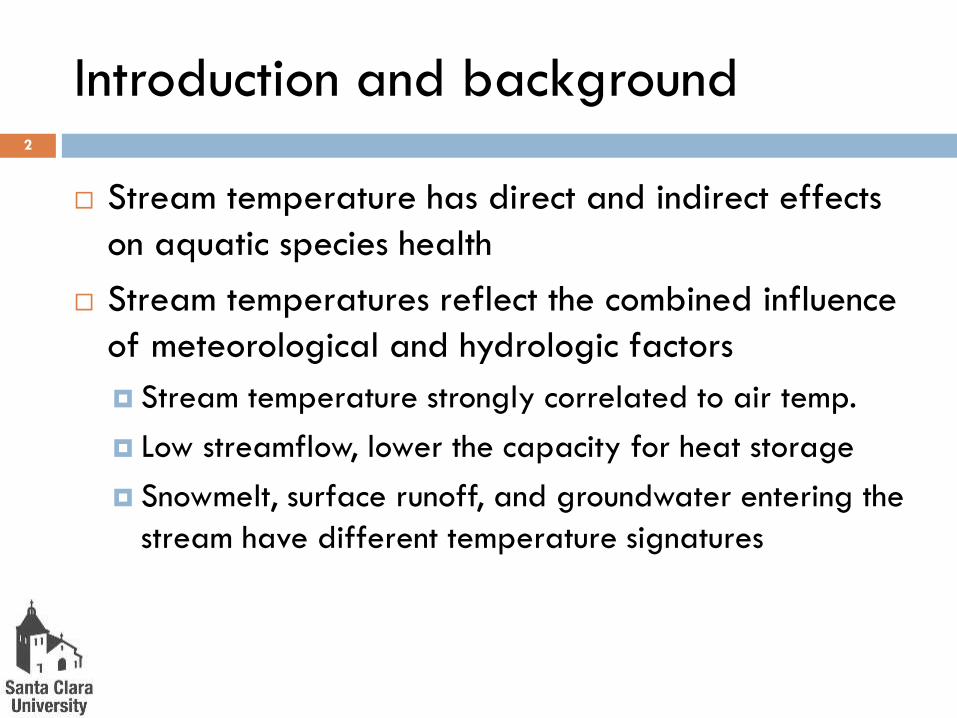
Many studies successfully model stream temp. based
solely on a relationship with air temp.
Others use a S-shaped function
3
Mohseni et al., 1998
Upper bounds
Lower bounds

Introduction and background
SWAT estimates stream temperature from relationship developed by Stefan and Prued’homme [1993]
Twater = 5.0 + 0.75 * Tair
Twater = average daily water temperature (oC)
Tair = average daily air temperature (oC)
**does not account for influence of streamflow, groundwater inflow, snowmelt
We develop a stream temp. model within SWAT that reflects the combined influence of meteorological (air temp.) and hydrological conditions (streamflow, snowmelt, groundwater, surface runoff, and lateral soil flow) on water temperature within a watershed.
4
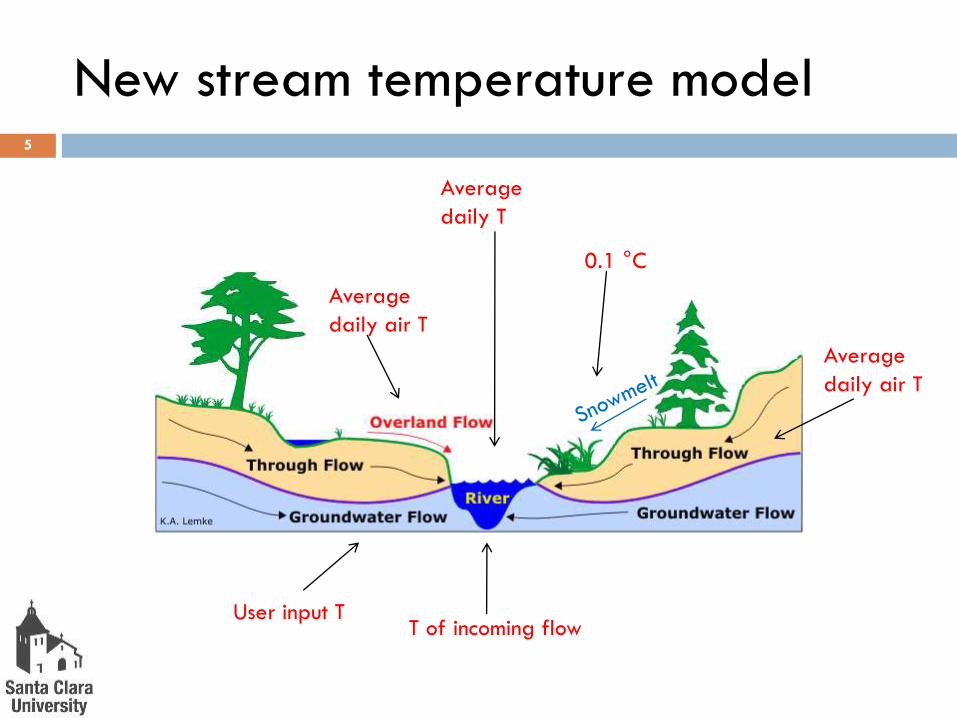
New stream temperature model 5
Average
daily T
0.1 °C
Average
daily air T
User input T T of incoming flow
Average
daily air T
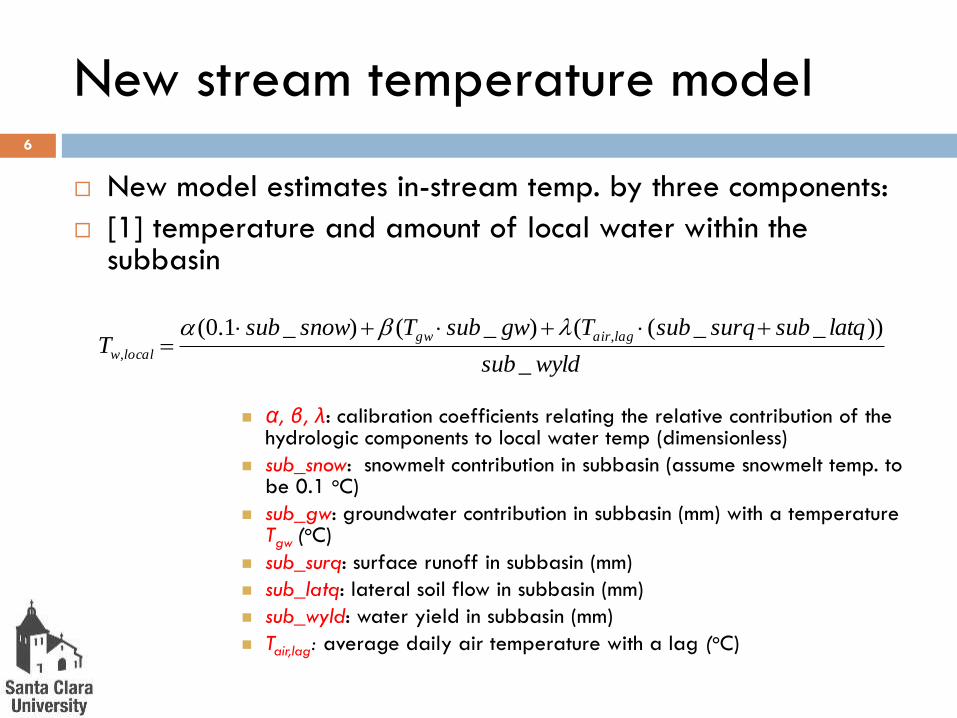
New stream temperature model
New model estimates in-stream temp. by three components:
[1] temperature and amount of local water within the subbasin
α, β, λ: calibration coefficients relating the relative contribution of the
hydrologic components to local water temp (dimensionless)
sub_snow: snowmelt contribution in subbasin (assume snowmelt temp. to be 0.1 oC)
sub_gw: groundwater contribution in subbasin (mm) with a temperature Tgw (
oC) sub_surq: surface runoff in subbasin (mm)
sub_latq: lateral soil flow in subbasin (mm)
sub_wyld: water yield in subbasin (mm)
Tair,lag: average daily air temperature with a lag (oC)
wyldsub
latqsubsurqsubTgwsubTsnowsubT
lagairgw
localw_
))__(()_()_1.0( ,
,
6

New stream temperature model
[2] temperature and inflow volume from upstream
subbasin(s)
Tw,upstream: water temperature of stream entering subbasin
(oC)
Qoutlet: streamflow discharge at the outlet of subbasin (m3/s)
Twaterinitial = Tw,local for headwater streams (oC)
Tw,local and sub_wyld previously defined
7

New stream temperature model
[3] air-water temperature transfer during the streamflow travel time in the subbasin
Twater: temperature of water (oC)
Tair: average daily air temperature (oC)
K: calibration conductivity parameter (dimensionless)
TT: travel time of water through the subbasin (hour)
ε: air temperature addition coefficient (oC)
Twaterinitial is previously defined
8
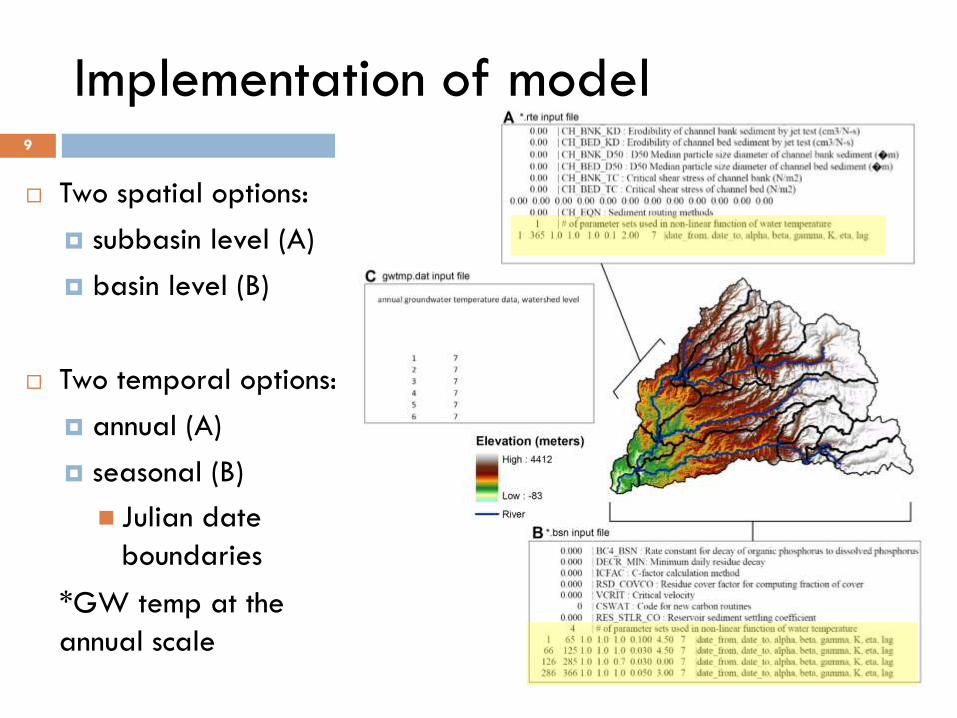
Implementation of model
Two spatial options:
subbasin level (A)
basin level (B)
Two temporal options:
annual (A)
seasonal (B)
Julian date
boundaries
*GW temp at the
annual scale
9

Model testing
7 sites
Snowmelt dominated
Differing elevations 400 m to 1,400 m
High quality stream temp. data
10

Model testing
Sites first calibrated for daily streamflow
Calibration Validation
Site Years NS MSE Years NS MSE
Entiat River 2003-2004 0.71 4.0 2005 0.60 2.9
Nookachamps Creek 2000-2003 0.68 1.2 2004-2005 0.64 1.5
North Fork Tolt River 1990-1998 0.65 6.4 1999-2005 0.57 6.4
Fir Creek 1980-1993 0.69 0.7 1994-2003 0.61 0.8
North Fork Clearwater River 1970-1990 0.64 69.3 1991-2005 0.69 60.0
North Santium River 1950-1980 0.59 15.5 1981-2005 0.64 14.1
Mill Creek 1990-1998 0.78 6.8 1999-2005 0.53 7.0
11
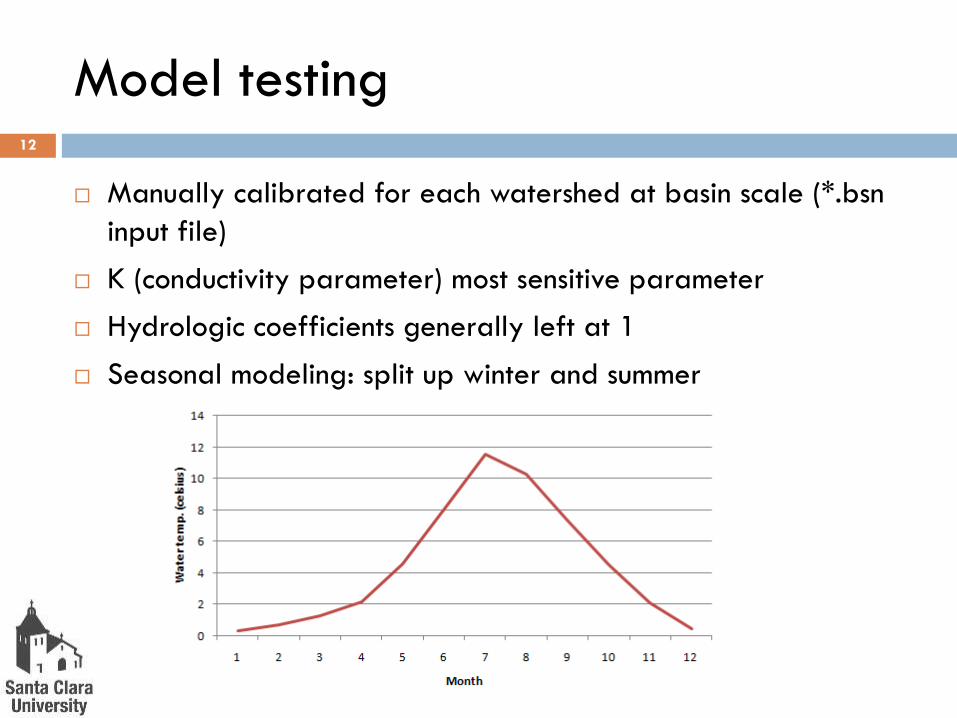
Model testing
Manually calibrated for each watershed at basin scale (*.bsn
input file)
K (conductivity parameter) most sensitive parameter
Hydrologic coefficients generally left at 1
Seasonal modeling: split up winter and summer
12

Model testing
Original SWAT stream temperature model New SWAT stream temperature model
Calibration Validation Calibration Validation
River Years NS RMSE (oC) Years NS RMSE (oC) Years NS RMSE (oC) Years NS RMSE (oC)
Entiat River 2003-2004 -0.08 3.97 2005 -0.16 4.27 2003-2004 0.89 1.26 2005 0.89 1.33
Nookachamps Creek 2000-2003 0.24 3.96 2004-2005 0.31 3.81 2000-2003 0.86 1.67 2004-2005 0.91 1.33
North Fork Tolt River 1995-2000 -1.60 4.08 2001-2003 -1.54 3.99 1995-2000 0.70 1.38 2001-2003 0.77 1.21
Fir Creek 1980-1992 -2.27 5.44 1993-2003 -2.23 5.47 1980-1992 0.75 1.50 1993-2003 0.76 1.48
North Fork Clearwater
River 1970-1990
0.80 2.72 1991-2005 0.83 2.54 1970-1990
0.87 2.19 1991-2005 0.84 2.61
North Santium River 1951-1980 0.49 2.53 1981-2005 0.59 2.58 1951-1980 0.73 2.14 1981-2005 0.70 2.24
Mill Creek 1998-2002 0.54 3.85 2003-2005 0.40 4.05 1998-2002 0.85 2.20 2003-2005 0.87 1.93
13
Calibration/Validation results
*Original SWAT stream temp: average NS of 0.27 and -0.26 for calibration and
validation period
*New SWAT stream temp: average NS of 0.81 and 0.82 for calibration and
validation period

Model sensitivity
Sensitivity to SWAT hydrology calibration
14
Entiat River
Model sensitivity
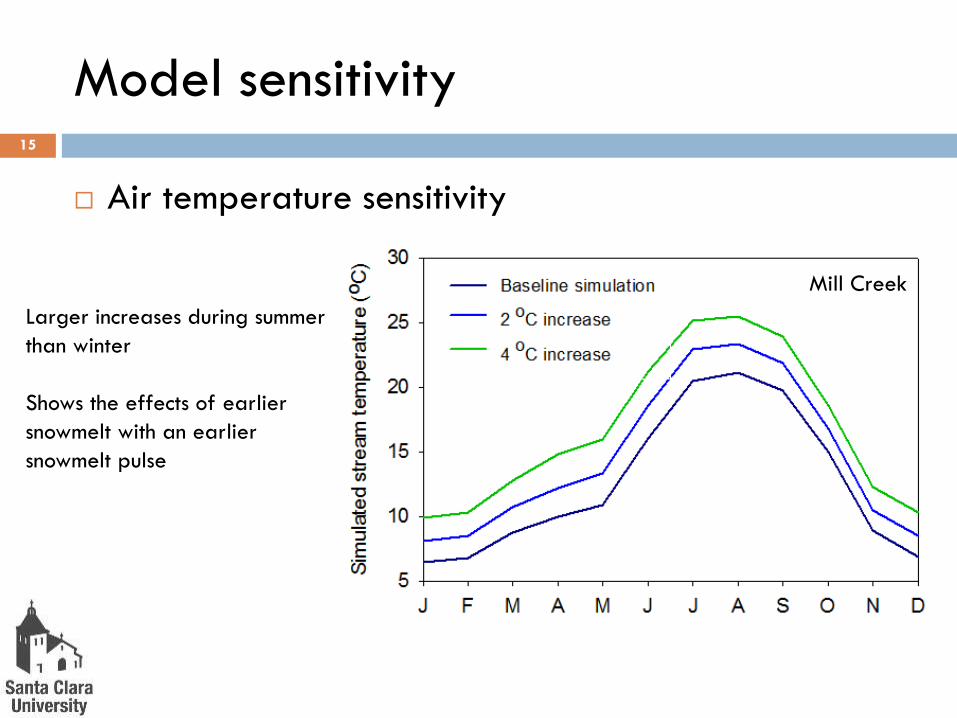
Air temperature sensitivity
15
Larger increases during summer
than winter
Shows the effects of earlier
snowmelt with an earlier
snowmelt pulse
Mill Creek
Model sensitivity
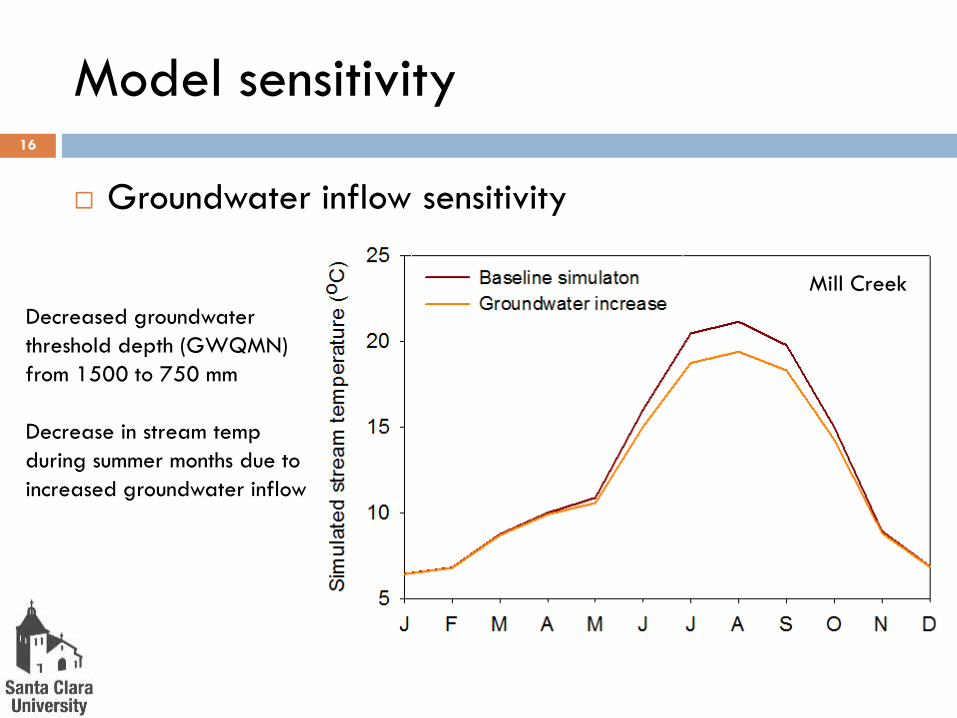
Groundwater inflow sensitivity
16
Decreased groundwater
threshold depth (GWQMN)
from 1500 to 750 mm
Decrease in stream temp
during summer months due to
increased groundwater inflow
Mill Creek
Model sensitivity
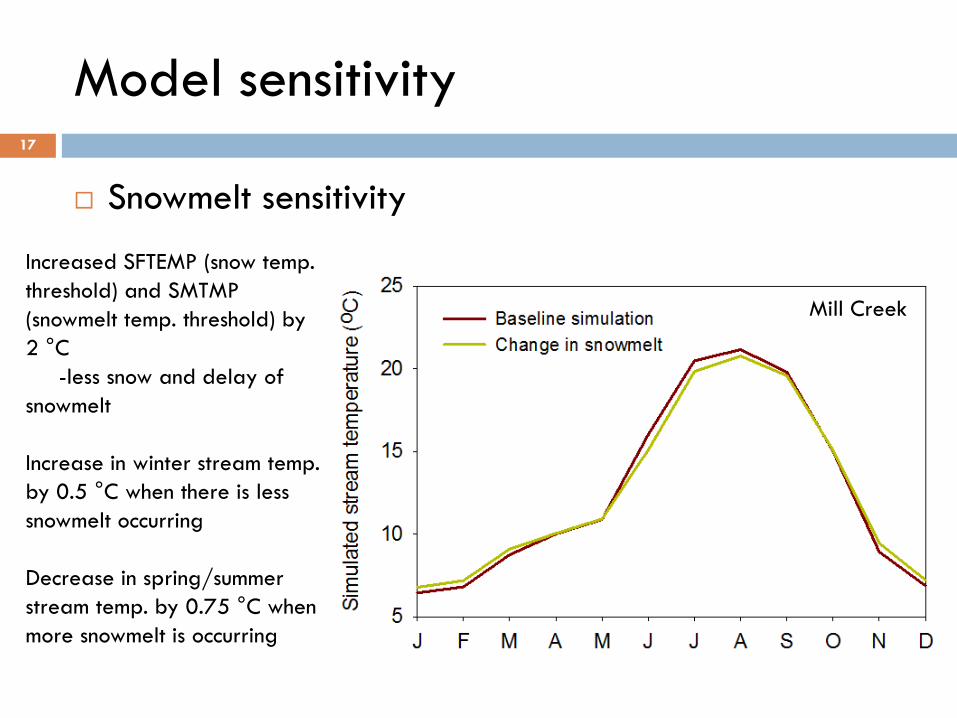
Snowmelt sensitivity
17
Increased SFTEMP (snow temp.
threshold) and SMTMP
(snowmelt temp. threshold) by
2 °C
-less snow and delay of
snowmelt
Increase in winter stream temp.
by 0.5 °C when there is less
snowmelt occurring
Decrease in spring/summer
stream temp. by 0.75 °C when
more snowmelt is occurring
Mill Creek

Conclusions
New model stream temp. is determined as a function of
inflow from the upper basins
snowmelt, surface runoff, lateral soil flow, and groundwater flow
air temperature
New model does not require more information beyond what is already provided by the user or SWAT
Calibration is achieved using few parameters
18

Conclusions
Tested on 7 mountainous watersheds throughout the Western United States
New stream temp. model performed better than original SWAT stream temp. model
Thus better able to simulate other water quality processes dependent on stream temp.
Sensitivity analyses suggest that new model is sensitive to local hydrology
19
Future work
Test the stream temp. model in various locations
throughout the world
Currently successfully able to model stream temp. in
Sierra Nevada mountains in the United States
Include irrigation parameters that includes the
effects of irrigation runoff on stream temp.
Include effects or reservoir releases on stream temp.
20

Thanks!
21