Embed Size (px)
Citation preview
Developing statistical thinking forperformance improvement in the
food industryNigel Peter Grigg
Institute of Technology and Engineering, College of Sciences,Massey University, Palmerston North, New Zealand, and
Lesley WallsUniversity of Strathclyde, Glasgow, UK
Abstract
Purpose – The paper aims to describe a recently completed research project on the use of statisticalquality control (SQC) methods in the context of food and drinks manufacturing. It discusses issuessurrounding the successful uptake of such methods, including organisational motivation, possibleapplication, costs and benefits, critical success factors and the central importance of prerequisitestatistical thinking (ST).
Design/methodology/approach – A three stage, mixed methods approach was adopted,incorporating surveys augmented by case studies and key informant interviews with industrymanagers and providers of relevant industry training. All data were combined to produce the final model.
Findings – The paper finds that SQC methods are of relevance in the industry, providing the processis appropriate and management have a basic awareness of the fundamentals of ST. Certainorganisational and external factors were found to progressively reduce the effectiveness with whichsuch methods are introduced and sustained. The paper ends with discussion of an original model,developed from the research, which illustrates the “filters” that tend to reduce the effectiveness withwhich methods are used in the industry, with a discussion of how each can be overcome.
Research limitations/implications – The research in this paper is focused on the European foodmanufacturing and legislative context, and predominantly UK. Low survey response rates numbersnecessitated a nonparametric approach to survey analysis.
Practical implications – The paper shows that the filters model is of generic applicability andinterest to current and future managers, and to other researchers in this area.
Originality/value – The paper addresses the “how to” of SQC, and examines an industry wherethere is not yet widespread literature on the benefits of SQC methods. It presents an original model ofthe barriers to effective use of statistical methods within a process knowledge and improvement cycle.
Keywords Quality control, Costs, Food industry, United Kingdom, Statistical methods
Paper type Research paper
IntroductionSince the initial appearance of statistical quality control (SQC)[1] and related methodsin UK academic literature around 1981 (Dale et al., 2001), there has been muchacademic and practitioner-oriented literature attesting to the benefits of statisticalmethods in facilitating the economic control and continuous improvement of processes,especially recently given the growing interest in the six sigma improvementmethodology. More recently, and increasingly, authors argue that these methods areonly maximally effective when they are applied by process managers or decisionmakers who understand the key components of statistical thinking (ST).
The current issue and full text archive of this journal is available at
www.emeraldinsight.com/0265-671X.htm
Performanceimprovement in
the food industry
347
Received May 2005Revised January 2006
International Journal of Quality &Reliability Management
Vol. 24 No. 4, 2007pp. 347-369
q Emerald Group Publishing Limited0265-671X
DOI 10.1108/02656710710740536

Statistical thinking (ST)ST has gained prominence in statistics literature over recent years. As Snee (1999)observed, “statistical research, practice and education are entering a new era, one thatfocuses on the development and use of (ST)”. Rather than being concerned with specificmethods and tools, ST refers to “thought processes” (Snee, 1990), which recognise thatvariation is omnipresent, and that understanding variation is the key to making gooddecisions. ST is variously defined, but of relevance to the discussion within this paperis the management-oriented definition based on the pioneering work of Shewhart(1926) and Deming (1986) comprising the following components:
. all work can be considered a process;
. organisations are systems of interconnected processes;
. variation exists in all processes; and
. understanding and reducing that variation is the key to improving performanceof processes and therefore of systems.
Purpose and aims of the researchThe research project discussed in this paper was begun in response to publishedstudies, which identified:
. a need for further studies into the practical issues involved in implementing SQCmethods within sectors of industry (Rungtusanatham et al., 1997);
. a relative lack of published research into TQM practices applied to foodindustry-related processes (Beardsell and Dale, 1999); and
. the need for food organisations in the UK require to focus upon continuousimprovement (CI) strategies and adopt best practice in order to remaincompetitive (Mann et al., 1999).
Food and drinks product processing was considered a suitable focus for such researchbecause it is the largest manufacturing sector within most developed economies (in theUK employing 13.7 per cent of the manufacturing workforce and accounting for 21 percent of consumer expenditure (FDF, 2005); and because organisations within this sectorare subject to a variety of regulatory, customer and market pressures that necessitatethe development of robust quality systems. The project sought to investigate thenature and the extent of use of SQC methods in the UK food and drinks manufacturingindustry[2], and make recommendations to enable such methods to be used moreeffectively or extensively, assuming they are considered beneficial. These aims wereencapsulated within the two main research questions shown in Figure 1, which were inturn subdivided into four thematic areas (also shown in Figure 1 with a shortdescription for each). The themes provided a framework to guide subsequent researchactivity and theory development. The following sections summarise indicative keyliterature underpinning each of the themes.
Key literature relating to the research themesTheme 1: industry applicationsDespite the fact that the foundations of SQC were partly established by one of thefathers of statistics W.S. Gosset (the student’ 1876-1937) through his work with theGuinness breweries (Kruger, 1999), there is little by way of hard evidence that over the
IJQRM24,4
348

intervening time SQC methods have pervaded the industry to the same extent as is thecase in other sectors (such as automotive or electronics). Literature applying SQCmethods to food processes is typically oriented towards generic textbooks orpractitioner journals targeting specific sectors of the industry and academic studies onthe subject are relatively scarce. However, the potential of statistical methods, and theimportance of ST in achieving this improvement within the food industry context hasbeen recently highlighted in general terms, Bjerke (2004), and published academicstudies on the subject are increasing. Table I summarises academic papers relating tothe use of SQC methods in the context of the food industry, showing themethodological and product/process focus of each paper. As shown, key qualitycriteria are safety and weight control, and common industry sectors examined includedairy, bread/biscuit and drinks processing.
Food companies worldwide must conform to national legislation governing thecontrol of food safety (in the UK the Food Safety Act, 1990) and package weights andmeasures (in the UK the Weights and Measures Act 1985). Food safety control isinternationally governed by the requirements the seven Hazard Analysis CriticalControl Point (HACCP) principles, but no official mandates exist that suggest applyingSQC to food safety assurance. In relation to mandatory weight/quantity controlrequirements, which exist in similar form in the UK and Western Europe, there is aCode of Guidance (DTI, 1979) which provides advice and technical guidance onalternative approaches to the control of packing operations that represent acceptedgood practice and due diligence. One of the recommended approaches is based uponrational sampling and use of SQC methods such as control charts for weight andquantity process monitoring and control. Evidence of a control system along therecommended lines being in operation can be used by a packer in the statutory defenceof due diligence, should a violation of the average weight legislation be detected (Grigg,1998). While this document, currently in use for a quarter of a century, providesrigorous detail on process variability analysis and the development of control charts, it
Figure 1.Research questions and
related themes
Performanceimprovement in
the food industry
349

does not discuss certain aspects central to the effective use of such methods within acontinuous improvement cycle. These include the components of ST, the rules forinterpreting chart signals beyond violation of warning and action limits, and theimportance of distinguishing between common and special cause variation as a basisfor taking action that is appropriate to the type of variation observed.
Theme 2: benefits and costsLiterature surrounding SQC methods frequently gives the impression that using themethods provides various benefits with few associated costs or downsides; there is lesspublished information on the true costs of implementation. Case studies and surveysdemonstrating SQC benefits typically follow Deming’s “chain reaction” model(Deming, 1986), which argues that as process variation is reduced, so a range of flow-onbenefits are experienced which include reduction in non conformities, wastage, scrap,cost of quality and complaints, and improved process efficiency and compliance.Summaries of literature on the typical benefits can be found in Grigg and Walls (1999),Mason and Antony (2000), and Rungtusanatham et al. (1999)
Subject Paper Industry sector
The importance of systems thinking in generalwithin the food industry
Dougherty et al. (1999) All food
The importance of converting data from foodprocesses into useful information
Gore (1994) Confectionery wrappingprocess
The role of quality circles and technology inimproving food processes (Japan)
Matsuno (1995) General
Issues in developing statistical thinking in thefood industry
Bjerke and Hersleth(2001)
General
The role of control charts in weight control Gauri (2003) Biscuit manufactureBissell andPridmore(1981)
General
The role of control charts in food safety Hayes et al. (1997) GeneralNegiz et al. (1998) GeneralSrikaeo andHourigan(2002)
Shell egg washing
Geise, 1999) General
Using food industry processes to illustrateaspects of optimal experimental design
Bjerke et al. (2000),Bjerke (2002)
Sausage production
Ellekjaer et al. (1996) Cheese productionNaes et al. (1999) Bread production
SPC application to specific product andassociated measures
Dura et al. (1998) Carcass inspection
Srikaeo et al. (2005) Biscuit manufacture
Using food industry processes to illustratemultivariate SPC
Ittzes (2001) Dairy
Using food industry processes to illustrate SPCissue (sub-optimal sample size)
Ozilgen (1998) Brewing
Table I.Food industry SPCapplications from theliterature
IJQRM24,4
350

The present study did not assume at the outset that SQC methods are universallyappropriate and beneficial to this industry. The degree of relative financial impact isdisproportionately higher for small and medium enterprises (SMEs), which compriseover 86 per cent of the food industry (FDF, 2005); one in which firms already face highcosts associated with compliance with statutory requirements (Cumbers et al., 1995).The normal major sources of cost in implementing SPC are those associated withtraining, staff time, hardware and software, production down-time while the system isdeveloped and tested, and any consultancy costs (Krumwiede and Sheu, 1996; Chengand Dawson, 1998). Additional investment in unessential SQC activity is thereforeunlikely to be seen as attractive unless the potential financial benefits make itdemonstrably worthwhile.
Theme 3: motivationsLiterature identifies two broad categories of motivation leading to the adoption ofquality management, quality systems and advanced manufacturing methods andtechniques such as those within the SQC umbrella. The first is the (proactive) desire torealise some operational benefit(s), such as quality improvement, cost reduction orefficiency improvement, which is linked to a proactive desire to improve and gain acompetitive edge in the market place. The second is as a (reactive) response to somereal or perceived threat (such as changes in competitive forces or the need to complywith legislation), where failure to do so may have some adverse effect(Brannstrom-Stenberg and Deleryd, 1999; Lascelles and Dale, 1986; Cheng andDawson, 1998; Anderson et al., 1999). Motivation is important because it is argued thatwhere motivation is defensive and reactive, then there are likely to be only short-termimprovements, and limited success in sustaining any resulting system (Mason andAntony, 2000; Brannstrom-Stenberg and Deleryd, 1999). This has implications for thefood industry, which is encouraged to adopt control charts to satisfy average quantitylegislation, as discussed previously under theme 1.
In the food industry context, Bjerke and Hersleth (2001) found from a study of 24participants of a food industry training “network” in SQC methods which theyfacilitated, that respondents participants variously cited motivations in general terms,including seeking “improvements”, obtaining “new knowledge”, and “getting more outof data”. Some organisations had recently achieved ISO 9000, which had resulted in anincreasing amount of data acquisition, and enhanced need to utilise the resulting data.The authors report that a few respondents were motivated by actual problems, and twoby exchanges of experience.
Theme 4: critical factors for success in use of the methodsRungtusanatham et al. (1997) called for research examining organisational policies andactions that make the implementation of SQC effectives and viable. Since then, anumber of papers have addressed the managerial rather than mathematical issues ofSPC implementations. Commonly cited reasons for failure include lack of managementcommitment, lack of understanding of SPC, and of the purpose of SPC; lack of trainingand education; failure to interpret control charts and take any necessary actions; lack ofknowledge of product/process characteristics to monitor/measure or inadequatemeasuring system in place (e.g. Mason and Antony, 2000; Rungasamy et al., 2002;Bjerke and Hersleth, 2001). Conversely, certain factors are have been reported as likely
Performanceimprovement in
the food industry
351

to result in successful and sustained SPC implementation; and a number of studies andpapers have proposed critical success factors for effective SPC (Xie and Goh, 1999;Mason and Antony, 2000); or developed step-by-step plans and frameworks fororganisations to follow to achieve effective implementation (Antony, 2000; Does et al.,1997; Krumwiede and Sheu, 1996, Deleryd et al., 1999). The present study integratesthese factors and models, identifies critical success factors in the food industry, andresults in a model (discussed later) showing the ways in which these factors have beenobserved to progressively reduce the effectiveness of use of SQC methods within thisindustry sector. This model is presented in the discussion section.
MethodologyThe research design for this study followed a three-stage knowledge creation processof: exploration (stage 1); theory development (stage 2); and theory extension/refinement(stage 3) (Voss et al., 2002). The approach involved a combination of surveys, casestudies and key informant interviews as summarised in Figure 2. The present papermainly discusses the findings and conclusions from the stage 3 of the project, butbefore doing so it is necessary to summarise the preceding stages both by way ofbackground and to illustrate the logical development of the hypotheses and approachadopted in stage 3.
Stage 1: explorationStage 1 comprised a survey of 200 UK food organisations, to which 71 responses werereceived, with five case studies on self-selecting respondents and interviews with threesenior Trading Standards officers each with extensive experience of advising packerson aspects of process control relating to legislation. This stage, its objectives,methodology and findings was discussed in detail in Grigg (1998),
Stage 2: theory developmentStage 2 (theory development) was discussed fully in Grigg and Walls (1999). In thisstage, the four emergent themes discussed earlier were identified as the first step. Todevelop the theory, a cognitive mapping approach (Swan, 1997) was adopted wherebycausal maps were developed relating to each of the four themes. Within these,literature, survey and interview data from stage 1 were combined into maps showingkey theoretical constructs and their interrelationships. From the resulting map relatingto theme 4 (critical success factors), 14 distinct hypotheses were inductively derived,which linked various external and internal organisational factors to the expectedresulting level of effective use of SQC methods. Table II shows: these factors; keypapers that provide evidence relating to each; and the resulting hypothesis relating toeach.
Stage 3: theory extension/refinementThe objectives of stage 3 were to validate, extend and refine the emergent body oftheory, to test and otherwise examine the hypotheses using quantitative data, and toextend and refine the theory using qualitative data. As a first step, it was decided tofocus only upon three industry sub-sectors commonly appearing in literature, whichexhibited different quality priorities that might impact on the extent to which SQCmethods were appropriate and relevant. This controlled some of the considerable
IJQRM24,4
352
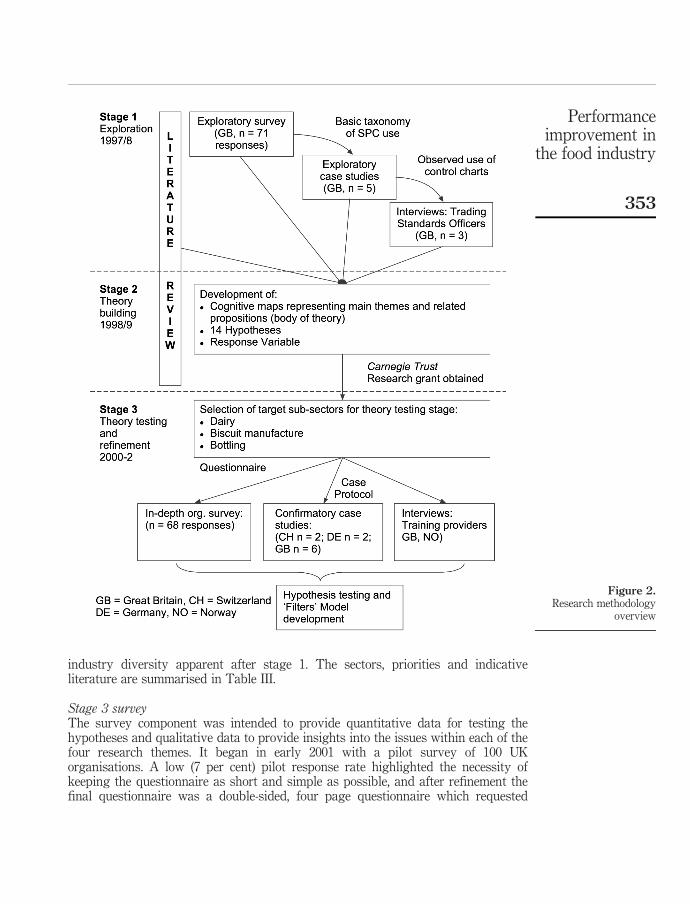
industry diversity apparent after stage 1. The sectors, priorities and indicativeliterature are summarised in Table III.
Stage 3 surveyThe survey component was intended to provide quantitative data for testing thehypotheses and qualitative data to provide insights into the issues within each of thefour research themes. It began in early 2001 with a pilot survey of 100 UKorganisations. A low (7 per cent) pilot response rate highlighted the necessity ofkeeping the questionnaire as short and simple as possible, and after refinement thefinal questionnaire was a double-sided, four page questionnaire which requested
Figure 2.Research methodology
overview
Performanceimprovement in
the food industry
353

Critical success factorExamples of key supportingliterature Hypothesis
External drivers/facilitatorsThe level of maturity in SQC will beinfluenced by:
Supportive relationship with aprime customer promote bestpractice, while dependentrelationships deter
New and Burnes (1998),Petroni (2000)
H1a Degree of reliance on a majorcustomer
H1b Manufacture of products formajor customer
A high level of perceivedexternal pressure (“exigency”)promotes uptake of AMMs
Petroni (2000) H2 Level of perceived exigency
Technology and innovationtransfer can be achievedthrough participation informal networks and industryclusters
Denmark (Hobbs et al., 1998);Sweden: (Elg and Johansson,1996); The Netherlands(Rademakers and McKnight,1998); The UK (Mann et al.,1999), Italy (Petroni, 2000);Norway (Bjerke and Hersleth,2001)
H3 Participation in a cluster ornetwork
External benchmarkingpromotes best practice withinindustry
Mann et al. (1999) H4 Use of external benchmarking
Useful sources of relevantguidance and information, e.g.trade associations, industrycontacts, official publications,inspectors/governmentofficers, codes of practice
Tielmann (1995) and Holt andHenson (2000) outline theimportance of goodinformation including thoselisted
H6 Level of relevant informationavailable
Internal drivers/facilitatorsManagement commitment andTQM/continuousimprovement philosophy
Rungasamy et al. (2002),Mason and Antony (2000),Krumwiede and Sheu (1996)
H7 Top managementcommitment to TQM/CIphilosophy
Formalised, third partyaccredited quality systems
Bjerke and Hersleth (2001) H8 Level of existing qualitysystems
A dedicated quality ortechnical manager provides afocus for knowledge andexpertise.
Holt and Henson (2000) H5 Presence of a dedicatedquality or technical manager
Self-assessment against anexcellence model promotesbest practice.
Mann et al. (1999) H11 Self-assessment against arecognised excellence model
Formalised quality trainingand education required toobtain maximum benefit frommethods
Krumwiede and Sheu (1996),Cheng and Dawson (1998),Rungasamy et al. (2002)
H9 Provision of and nature ofrelevant quality training
Formalised, qualitycircles/team approach tocontinuous improvementnecessary to ensure processlearning and improvementoccurs
Rungasamy et al. (2002) H10 Regular use of quality circles
(continued )
Table II.Critical success factorsbehind SQC interventions
IJQRM24,4
354

Technical and Quality Managers to provide data relating to: organisationaldemographics (size, structure, ownership, customer base, product range, turnover);approach to quality management, control and improvement; key quality measures;self-ratings of the extent of use of various statistical methods; software used for dataanalysis; approaches to training in improvement methods. For users of SQC methods,qualitative questions requested further details relating to each of the four themes. Thequestionnaire was mailed to 500 organisations between June 2001 and June 2002, andafter follow-up reminders were issued, 72 responses were finally received (equating to a14 per cent response rate, which is approximately half that of the stage 1 survey. Thediscrepancy is explained by the greater length and detail of the stage 3 questionnaire).
Response variables and hypothesis testing approachA response variable was developed based upon the extent to which SQC techniques(shown later in Figure 3) were used within the responding organisations. For eachlisted technique, organisations received a score of 0 for “non-use” of the technique, 1 for“infrequent use”, and 2 for use “extensive use”. The listed techniques were categorised(although not explicitly on the questionnaire) into “basic” and “advanced”, according tothe extent to which each implied a level of SQC “maturity” within the organisation.
Critical success factorExamples of key supportingliterature Hypothesis
Organisation size, structureand resourcesAvailable resources requiredto ensure success ofimplementation: includeshuman, physical/operational,knowledge, financialresources.
Rungasamy et al. (2002),Krumwiede and Sheu (1996),Mason and Antony (2000)
H13 Level oftechnology/automation inproduction and recordingsystems
Organisation size: largerorganisations arguably havemore success, small ones arehampered by lack of resources
Deleryd et al. (1999) H12a Number of employeesH12b Single- or multi-site enterpriseH12c Estimated level of market
shareAppropriate product types Dura et al. (1998), Ozilgen
(1998), Gauri (2003)H14 Product type (value, key
quality priority) Table II.
Subsector Dominant quality priority Example from literature
Dairy Predominantly safety due to perishability of productand risk of microbiological contamination
Hayes et al. (1997)
Bottling Predominantly fill level. Penalties for anyunderfilling (under weights and measureslegislation) and overfilling (under customs andexcise legislation)
Ozilgen (1998)
Bakery/biscuit Safety not critical. Product dimensions and visualcriteria, reduction of wastage though cracking,incomplete fill-out
Gauri (2003)
Table III.Chosen subsectors,
dominant priorities andexamples of relevant
literature
Performanceimprovement in
the food industry
355

Basic methods are those that are widely used in process monitoring, but do not requireor imply high statistical understanding or maturity and include summary/descriptivestatistics and basic visual techniques such as bar charts, scatterplots and time seriesplots. Additionally, as discussed later, it had been observed during stage 1 that X-bar,range and SD control charts were in widespread use, but were not always fullyunderstood. These were therefore classified under basic methods. Advanced methodsincluded more advanced SQC charting procedures, designed experimentation andcapability studies, use of which signalled a higher level of organisational SQCawareness. Each responding organisation therefore received a summated scorerepresenting their degree of use of “basic” and “advanced” techniques. The score had amaximum possible value of 16 for basic methods and of 18 for advanced methods(indicating in either case extensive use of all listed methods in the category). As avalidation measure, the follow-up case studies were used to confirm that the ratingapplied gave an accurate reflection of the level of use of techniques and statisticalknowledge observed within the facility. The summated scales were used to determinethe influence of the hypothesised organisational factors on use of statistical methods.Since the resulting hypothesis tests involved determining group differences usingrelatively small group sizes and based on ordinally-derived response variables thatwere not normally distributed (being negatively skewed), the formal hypothesis testswere carried out using the non-parametric Kruskall-Wallis test for differences betweentwo or more groups. The “groups” represented organisational characteristics under therelevant hypothesis (e.g. size, use of quality circles, etc.). In addition to the tests, the
Figure 3.Use of statistical methodswithin respondingorganisations
IJQRM24,4
356

distributions of group scores against the two response variables were visuallycompared using boxplots, which are not shown in this paper.
Stage 3 qualitative componentBecause of the shortcomings of a purely quantitative approach in attempting todevelop models to explain complex organisational behaviour, stage 3 involved aqualitative element. This included ten further (deepening) case studies withorganisations involved in the survey that had identified themselves as users ofstatistical methods within their control or improvement activities. A case protocol wasdeveloped prior to the studies to maximise case study reliability; and theoretical andliteral replication were used to maximise validity, whereby multiple cases wereselected from within each of the three subsectors (Voss et al., 2002). Six were based inthe UK (three bottlers, two biscuit manufacturers and one dairy), and by way ofcomparison, two were based in Germany (both dairies) and two more in Switzerland(biscuit and confectionery). A grant was obtained to facilitate the European casestudies, which were undertaken to establish whether better industry practice wasobserved outside the UK (as some literature had suggested). As a final method of datatriangulation to ensure the general validity of the case findings, key informantinterviews were carried out with representatives from The Industrial StatisticsResearch Unit (ISRU) at the University of Newcastle upon Tyne, and Matforsk, theNorwegian Food Research Institute (via a researcher based at ISRU on secondment) astwo major providers of statistical consultancy and training for the industry. Cognitivemaps initially developed during stage 2 were refined and extended using thequalitative data from each questionnaire, case and interview.
FindingsThe following sections present the main findings within each of the four researchthemes.
Industry applications (theme 1)In terms of the general applicability of the methods, certain labour-intensive,craft-based operations rely upon the skill and craftsmanship of the operator, and inthese cases variation is welcome and expected. Higher volume repetitive environments,where consistency is desirable are better suited to the application of SQC approachesfor control and improvement. Figure 3 shows the extent of use of various statisticalmethods among the stage 3 survey respondents, and reveals that basic methods are inrelatively extensive use, but as the methods become more advanced and specific, theyare used to a lesser extent. The stage 3 survey data confirmed the stage 1 finding(Grigg, 1998) that some form of formal SPC was used by under 50 per cent ofresponding organisations (in this case 45 per cent); and the predominant applicationwas the use of mean and range charts applied to the control of end-of-line package netweight or volume. The methods are not generally used for food safety control or formonitoring more strategic performance indicators at a higher level (e.g. customercomplaints). The case studies in stage 1 and 3 had revealed that at least some of thesepackers were observed to be using control charts primarily and solely as evidence ofgood practice in complying with weights and measures law, and to generate records forinspection by customers, TSOs and Customs inspectors. Within such organisations,
Performanceimprovement in
the food industry
357

managers were often not knowledgeable about the real purpose of control charts andhence the methods were often not proving effective in achieving genuine processunderstanding and improvement. This finding suggested a lack of underlying STawareness among process managers, which was also recognised and reported byBjerke and Hersleth (2001) in the Norwegian context. The nature of the guidance givenwithin the Code may explain the relatively high use of these particular control charts inpacking operations, and also the limitations of their use.
Benefits and costs (theme 2)There was extensive anecdotal evidence given by responding organisations of benefitsresulting from the use of statistical methods, and many cited financial savings. In onecase, detailed confidential improvement figures and associated financial data weresupplied. The empirical evidence suggested that the food organisations are benefitingfrom adopting statistical methods, and provided support for research question 1. Feworganisations formally measure the cost of quality, however, and could provide figureson the true costs of financial benefits of adopting statistical methods. A wide range ofgeneral benefits was provided on questionnaires, and these are summarised in Figure 4.As this simplified map illustrates, the benefits experienced are indeed broadly in linewith Deming’s “chain reaction”. As the diagram shows, reduction of process variationgenerally results in a range of claimed benefits including: cost savings; improvedcompetitiveness; enhanced legal compliance; improved customer satisfaction andconfidence; and improved visibility of “hidden” problems.
Figure 4.Benefits reported onquestionnaire as resultingfrom statistical methods
IJQRM24,4
358
Motivations (theme 3)The research confirmed that increasing perceptions of exigency (e.g. increasingcompetition, regulation and customer awareness, falling margins) within the industrywere creating new or renewed interest in the potential of quality and lean managementtechniques, including SQC methods, to achieve improvement and cost reduction. Ingeneral, the cases studied while motivated to adopt statistical methods to achieveimprovement (rather than compliance) were hampered in their efforts by lack ofexpertise in the relevant techniques and lack of knowledge about what techniques toadopt and develop competence in; while other companies had failed in their attempts touse the methods and subsequently given up. Many organisations were disinclined touse statistical methods because of a perception that existing systems and methodswere sufficient, a lack of perceived external exigency (strong market position), orinappropriateness of such methods to their product and process.
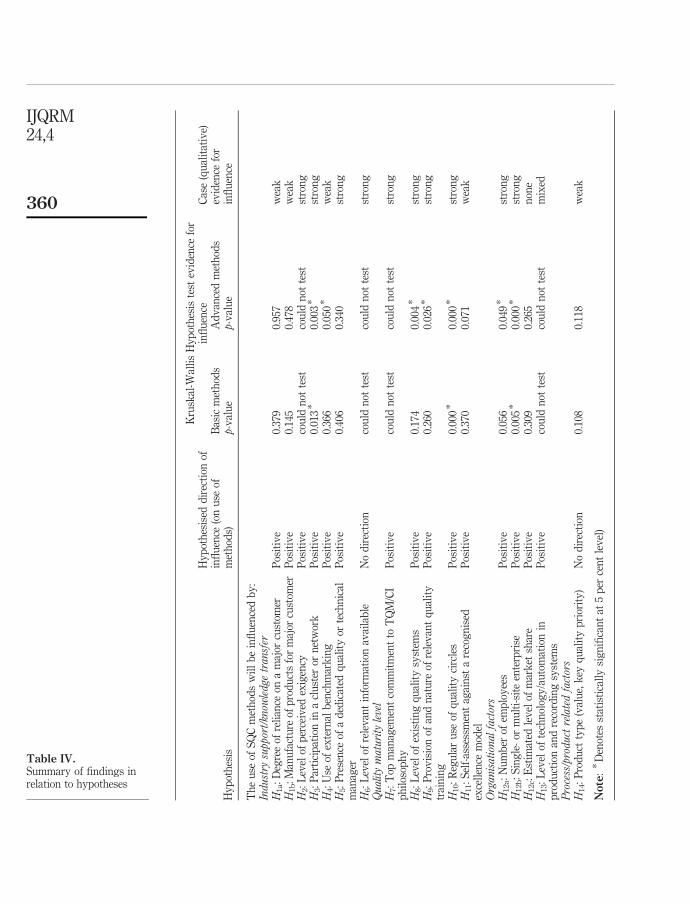
Critical success factors (theme 4)Table IV summarises the hypothesis test results and strength of case evidence inrelation to the each of the fourteen hypotheses developed during stage 2. These are nowdiscussed in relation to the degree of influence on the use of SQC methods.
Organisations that use quality circles (H10) and organisational size (in terms ofnumber of employees, H12a and number of sites, H12b) both strongly influence the takeup of SQC from both the statistical and case evidence. For example, organisations thatused quality circle approaches (by whatever given name) to improvement exhibithigher levels of use of both basic and advanced techniques. This is due to the qualitycircle being evidence in itself of an improvement culture, within the organisation, andthe analytical tools being the basis for their improvement activities. Similarly, there isevidence that organisational size and structure influenced the level of use oftechniques. Organisations were categorised into four groups according to number ofemployees (1-49, 50-99, 100-249 and 250+). The scores for the use of methods werefound to increase substantially only between the 1-49 and 50-99 categories, peaking atthe 100-249 category, and dropping slightly for the 250+ employees category. Therewas evidence therefore that very small organisations do not use the methods, probablyfor reasons of lack of constrained resource. The evidence suggested that mid sized foodmanufacturing facilities, with between 100-249 employees, are the highest users of themethods, supporting case evidence that these organisations are highly driven topreserve market share, and are often more agile in implementing new approaches thanthe very large organisations. Interestingly, the related factor, extent of market share(H12c) was found to have no significant influence.
Participation in a cluster or network (H3), level of existing quality systems (H8) andprovision and nature of relevant regular training (H9) also show strong statistical andcase evidence of positive influence. Participating in a cluster or network promotedeffective transfer of good manufacturing practice, which resulted in the use ofstatistical methods. Of still greater impact were informal networks through whichmanagers generally learned “through the grapevine” about better practices that werebeing found to work within other facilities. In some cases this information emanatedfrom friends, contacts and former colleagues working in competing organisations.
Organisations accustomed to working to formal quality systems found it easier toimplement SQC systems, since procedures for data capture and process improvement
Performanceimprovement in
the food industry
359
Kru
skal
-Wal
lis
Hy
pot
hes
iste
stev
iden
cefo
rin
flu
ence
Hy
pot
hes
is
Hy
pot
hes
ised
dir
ecti
onof
infl
uen
ce(o
nu
seof
met
hod
s)B
asic
met
hod
sp-
val
ue
Ad
van
ced
met
hod
sp-
val
ue
Cas
e(q
ual
itat
ive)
evid
ence
for
infl
uen
ce
Th
eu
seof
SQ
Cm
eth
ods
wil
lb
ein
flu
ence
db
y:
Industry
support/know
ledge
transfer
H1a:
Deg
ree
ofre
lian
ceon
am
ajor
cust
omer
Pos
itiv
e0.
379
0.95
7w
eak
H1b:M
anu
fact
ure
ofp
rod
uct
sfo
rm
ajor
cust
omer
Pos
itiv
e0.
145
0.47
8w
eak
H2:
Lev
elof
per
ceiv
edex
igen
cyP
osit
ive
cou
ldn
otte
stco
uld
not
test
stro
ng
H3:
Par
tici
pat
ion
ina
clu
ster
orn
etw
ork
Pos
itiv
e0.
013
*0.
003
*st
ron
gH
4:
Use
ofex
tern
alb
ench
mar
kin
gP
osit
ive
0.36
60.
050
*w
eak
H5:
Pre
sen
ceof
ad
edic
ated
qu
alit
yor
tech
nic
alm
anag
erP
osit
ive
0.40
60.
340
stro
ng
H6:
Lev
elof
rele
van
tin
form
atio
nav
aila
ble
No
dir
ecti
onco
uld
not
test
cou
ldn
otte
stst
ron
gQualitymaturity
level
H7:
Top
man
agem
ent
com
mit
men
tto
TQ
M/C
Ip
hil
osop
hy
Pos
itiv
eco
uld
not
test
cou
ldn
otte
stst
ron
g
H8:
Lev
elof
exis
tin
gq
ual
ity
syst
ems
Pos
itiv
e0.
174
0.00
4*
stro
ng
H9:
Pro
vis
ion
ofan
dn
atu
reof
rele
van
tq
ual
ity
trai
nin
gP
osit
ive
0.26
00.
026
*st
ron
g
H10:
Reg
ula
ru
seof
qu
alit
yci
rcle
sP
osit
ive
0.00
0*
0.00
0*
stro
ng
H11:
Sel
f-as
sess
men
tag
ain
sta
reco
gn
ised
exce
llen
cem
odel
Pos
itiv
e0.
370
0.07
1w
eak
Organisationalfactors
H12a:
Nu
mb
erof
emp
loy
ees
Pos
itiv
e0.
056
0.04
9*
stro
ng
H12b:
Sin
gle
-or
mu
lti-
site
ente
rpri
seP
osit
ive
0.00
5*
0.00
0*
stro
ng
H12c:
Est
imat
edle
vel
ofm
ark
etsh
are
Pos
itiv
e0.
309
0.26
5n
one
H13:
Lev
elof
tech
nol
ogy
/au
tom
atio
nin
pro
du
ctio
nan
dre
cord
ing
syst
ems
Pos
itiv
eco
uld
not
test
cou
ldn
otte
stm
ixed
Process/productrelatedfactors
H14:
Pro
du
ctty
pe
(val
ue,
key
qu
alit
yp
rior
ity
)N
od
irec
tion
0.10
80.
118
wea
k
Note
:*
Den
otes
stat
isti
call
ysi
gn
ifica
nt
at5
per
cen
tle
vel
)
Table IV.Summary of findings inrelation to hypotheses
IJQRM24,4
360

are generally formally documented. In the food industry, having legal minimum systemsin place for safety and weight control implies that key quality measures are generallydefined and tracked in some manner. There was evidence of the influence of higher-levelquality systems on the use of advanced techniques, although not on basic techniques,which are used, or not used, regardless of the type and level of quality system in place.
Quality training was found to significantly influence advanced methods, but notbasic methods. This conforms to the assumption made in differentiating the techniquesfor analysis, that basic methods represent simple techniques used in some caseswithout necessarily full understanding, while advanced techniques require some levelof training before they can be routinely applied.
Level of perceived exigency (H2), presence of a dedicated technical or qualitymanager (H5), level of relevant information available (e.g. in codes of practice) (H6) andtop management commitment to TQM/CI philosophy (H7) all possess strongqualitative evidence of positive influence upon use of SQC, although the statisticalevidence is weak or non-existent. For example, the level of perceived exigency couldnot be reliably tested statistically because of the difficulty of measuring the perceptionof exigency while keeping the questionnaire relatively simple. Case and qualitativequestionnaire evidence strongly indicated that where market share was under threatby overseas or domestic competitors, then new approaches were being actively soughtto cut costs and maximise quality and consistency. This included the use of SPC anddesigned experiments to control and improve processes, and also included leantechniques. Conversely, but still supporting the hypothesis, some organisationexplicitly stated that they were not using statistical techniques because they were notbeing forced or required to.
There was no strong statistical evidence that the presence of a dedicated quality ortechnical manager influenced the use of the techniques, but most respondents to thissurvey had such an individual in place, and so there was relatively little by way ofavailable contrast. Cases revealed that the quality or technical manager is generally therepository of knowledge on SQC methods and systems, and tend to drive theimprovement initiatives. Many indicated fighting constantly against an unsupportivetop management that were unconvinced by the potential of SQC.
Case evidence strongly indicated that the organisations, almost 90 per cent of whichare SME with low resources, rely heavily on available low cost information fromofficial or advisory sources. Many SPC systems had been established by tradingstandard officers who often provide advice as part of their function. The DTI code ofpractice was still the major source of advice on establishing SPC systems related topacking operations. This is likely to account for the use of control charts as primarilyevidential within many of the organisations.
Similarly, case evidence strongly indicated that management required to activelydrive the use of SQC techniques for them to be adopted and sustained across all levelsof the organisation. Conversely, the detrimental effect of lack of support from topmanagement could be clearly seen in comments received on questionnaires frommiddle managers attempting to implement the methods and systems, as mentionedabove.
The remaining hypotheses were either weak or non-existent. For example, the use ofbenchmarking (H14 – ) appeared to have an influence only on the use of advancedmethods. However, the extent of formalised benchmarking was itself a covariate of
Performanceimprovement in
the food industry
361

organisation size, and examining only the larger organisations (to eliminate the sizeeffect) removed the significance of the effect. There was no strong statistical evidencethat formally self-assessing performance against an excellence model (H11) influencesthe use, or level, of statistical techniques. Case evidence confirmed that this activity,where undertaken, was associated with larger organisations but was unrelated to thelevel of statistical expertise in facilities. There was no evidence of significantly higheruse of methods in any of the three chosen sectors of the industry and hence weconclude no influence due to product type (H14). One reason is that the methods willapply generally to generic industry processes (such as filling and packaging orincoming ingredients inspection) and not products. Some products are, however, bettersuited to the methods than others due to production volume and desired productconsistency.
Despite the enormous power and influence of the major UK retailers over foodindustry supply chains and upstream producers, there is no statistical evidence linkingthe level of dependence on a major customer (H1a,b) to resulting use of statisticalmethods, and the case evidence did not suggest that the presence of large retailcustomers in the supply chain was influential in an organisation’s improvementactivities. Further upstream within the supply chain there was more evidence ofco-operation between some large food manufacturers and their suppliers, which didinfluence the extent and nature of improvement methods used by suppliers. Awayfrom the UK situation, however, some companies supplying markets in East Asiancountries (such as Japan or Korea) were finding themselves required by thosecustomers to develop rigorous, statistically based quality control procedures. This wasbeing facilitated through exchange programmes and customer visits.
Finally, the level of technology (H13) in data capture and analysis within firms couldnot be quantitatively measured on questionnaires. However, case evidence suggestedthat some smaller organisations could operate effective continuous improvementsystems based upon manual control charts without the need for specialist analyticalsoftware (Grigg et al., 1998), while some large organisations with quite sophisticatedSCADA data capture and analysis systems, which were capable of producing on-lineprocess statistics and charts, were unable to derive and share the necessaryinformation and therefore benefit from the mass of resulting data. Evidence suggestedthat technology is helpful, but is not an absolute requirement for effective use of SQCwithin the improvement cycle, providing motivation is strong and awareness of themethods is present.
Discussion: overcoming the filters to effective use of statistical methods inthe food industryBased upon an integration of the data from stages 1 and 3, including the hypothesistest results and case data, one of the key outcomes from the study was the conceptualmodel shown below as Figure 5. This model is based on the premise that a number oforganisational factors that act as “filters”, tending to progressively reduce theorganisation’s ability to effectively use SQC methods within a context of genuinesystems understanding and ST, aimed at achieving objective, informed and sustainedprocess knowledge and improvement. The filters range from lack of knowledge andawareness of ST and methods to lack of feedback and learning. The filters are notnecessarily absolute barriers in all cases, but each may further reduce the likelihood of
IJQRM24,4
362

Figure 5.Overcoming the
organisational “filters” toeffective use of statistical
methods
Performanceimprovement in
the food industry
363

SQC methods being used in a fully effective manner. The extent of the influence thateach exerts is contingent on certain other factors, and will naturally vary from case tocase.
In addition to showing the filters, Figure 5 presents various critical success factorsthat help each of them to be overcome. This model complements those summarisedearlier under the theme 4 literature discussion and the factors include those found to beinfluential in the use of SQC through our empirical research. It places more emphasison the mechanisms by which ST can penetrate the organisation as a necessaryprerequisite to the methods themselves.
Filter 1: lack of knowledge and understanding of the methodsFilter 1 is the lack of prerequisite knowledge and awareness among management of thereal purpose of using SQC methods, which equates to ST. Without this, organisationscannot use SQC methods with maximum effectiveness. Overcoming this requires theprovision to Senior and Technical Managers of information to create awareness of themethods themselves, the fundamental principles of their effective use and integration,and the benefits and costs likely to be involved. This may lead to firm commitment onthe part of top management to the adoption and use of statistically-based approachesfor process analysis, backed up with the allocation of necessary resources to anyresulting improvement efforts. It is only when management are committed to usingstatistical methods within an improvement cycle, and relevant plant personnel haveacquired some awareness of how to use the methods to guide the improvement efforts,that the other organisational filters begin to become relevant. Some recommendationsfor developing awareness are provided at the end of the paper.
Filter 2: organisational resource baseFilter 2 relates to the resource base of the organisation (namely the financial, human,technological, physical resources, as well as the internal knowledge resource). First,successful sustained implementation of the methods will depend on how much of thefinancial and human resource that management is prepared to free up and dedicate toimprovement projects and activities. Second, the organisation will achieve moresuccess if there is suitable hardware that allows accurate data measurement andrecording. The accuracy and reliability of the process data will influence theappropriateness of subsequent decision-making based upon it. For statistical analysisto be effective, software will normally be required, and often this will require thepurchase of some IT with mathematical processing capability. The resource filterbecomes an important issue in an industry such as the food industry, which contains alarge proportion of small and medium enterprises.
Filter 3: level of organisational quality maturityFilter 3 relates to organisational quality maturity and overcoming this requires that theorganisation adopt some of the established mechanisms and practices of TQM,summarised as follows. The organisation should first, identify key measures that relateto its priorities for improvement. As an example, if the key performance concern is highscrap level, then this should be addressed first: it should be accurately measured, and ifpossible expressed in cost terms, to enable the organisation to assess the net effect ofany improvement intervention. Other indicators of quality maturity include the extent
IJQRM24,4
364

to which a CI culture is in place, the presence of quality systems, the existence of achampion or co-ordinator for the implementation of statistically-based approaches, theuse of improvement teams and the nature and extent of training provided. The absenceof any of the above will reduce the effectiveness of the statistical methods used inachieving the necessary improvement.
Filter 4: effectiveness of the process measurement and reporting systemIf all other components are to some extent in place, then the measurement andreporting system represents filter 4. The measurement system needs to guard againsterror and be as robust as possible. The application of statistical methods and anysubsequent decision making based on statistical analysis will have reducedeffectiveness if the data exhibit excessive “noise”. Awareness of the accuracy ofdata, and of their components of variation, will follow from awareness of the statisticalmethods and their purpose. Therefore this filter cannot be truly overcome until there issome ST within the organisation and dissemination of the principles through extensivetraining. Good statistical knowledge will also be required for the effective design andanalysis of repeatability and reproducibility (R&R) studies that enable measurementprocess variation to be properly understood.
Filter 5: data analytic skills and technologyIf the measuring system is sufficient, then filter 5 is the extent to which theorganisation is able to accurately and appropriately analyse the resulting process data.This requires knowledge within the organisation of methods of analysis, ability tooperate any technology required in order to conduct the analysis, and ability tointerpret the information within the resulting analysis and take appropriate action.Effective contextual analysis presupposes the presence of ST, widely understood andtherefore disseminated through training and education programmes.
Filter 6: feedback and learning mechanismFilter 6, crucial in this particular industry and study, relates to the lack of a mechanismto continuously learn from the information being generated by the process. Establish aknowledge development cycle requires a mechanism whereby process data areregularly reviewed and acted upon, and the knowledge that results from thoseresulting actions and interventions is communicated within the facility to generateorganisational learning. This learning derives from both successes and failures. Thefinal feedback loop in Figure 5 represents the management of organisational learningfrom experience and reflection.
Conclusions and recommendationsIn relation to research question 1, there is strong empirical evidence that SQC methodscan be as beneficial to food organisations as they have been within other sectors,provided they are appropriate to the product/process context, and are understood andused in an appropriate way. This requires an understanding by managers of thecomponents of ST. The methods are observed not to be successfully adopted, used orsustained where there is an absence of such prerequisite understanding, or wheremotivation is primarily defensive reaction to pressure or legislation rather than a desireto truly control and continually improve a process. A key source of information for the
Performanceimprovement in
the food industry
365

industry in the use of control charts derives from the code of guidance for packingoperations. There is a need for this document to be updated to reflect the conceptualdevelopments in control chart use over the years since its development, and to reflect thegeneral movement from quality control and assurance to continuous improvement. Thiswill enable maximum benefit to be gained from charts already in use in many cases.
In relation to research question 2, we have presented a model that illustrates asequential approach to developing ST in the industry. A main related contributionresulting from this research is the evidence that all that lacks in many foodorganisations, and which prevents them from making effective use of the data whichthey already routinely collect, is in many cases not the appropriate statistical tools oranalytical software, but merely prerequisite awareness of the core ST principles,including how to interpret and use methods such as control charts within animprovement cycle. The model of Figure 5 differs from those developed in similarstudies by emphasising the importance of ST coupled with appropriate managementmotivation in effective use of SQC methods. Motivation will create willingness on thepart of management to invest time, effort and resources to the endeavour; however forsome organisations, compliance-based and defensive motivation may result in onlysuperficial use of the methods, and for others motivation may be entirely lacking duethe perceived irrelevance or complexity of the methods.
Recommendations for enabling knowledge transfer into the industry include thefollowing: technology transfer from universities and research institutions via (e.g.Knowledge Transfer Schemes, applied research and consultancy); the presence ofhelpful, digestible advisory material from central sources (trade bodies, governmentsupport agencies); provision of effective training courses to develop knowledgeablemanagers; development of relevant skills and understanding within local governmentinspectors; and input from trade and professional bodies. Enablers of knowledgetransference throughout the industry include: formal and informal networks such asbenchmarking clubs, clusters and regional industry associations and guidance frommajor trading partners, customers and auditors. The research discovered for examplethat informal networks are an extremely powerful vehicle for facilitating knowledgetransfer in the industry.
Finally, while derived from food industry data, the filters model of Figure 5 haswider, generic applicability. Further research is recommended that tests or validatesthe model within different industrial contexts, to establish the extent to which it istransferable.
Notes
1. In this paper, the acronym SQC is used throughout and refers to statistical methods used tocontrol/improve process quality.
2. This study focuses upon the manufacture of food and drinks products, hereafter referred toas “the industry”. This term in this paper does not encompass downstream issues such assupply, distribution, retailing or catering of food products.
References
Anderson, S.W., Daly, J.D. and Johnson, M.F. (1999), “Why firms seek ISO 9000 registration:regulatory compliance or competitive advantage”, Production and OperationsManagement, Vol. 8 No. 1, pp. 28-43.
IJQRM24,4
366

Antony, J. (2000), “Ten key ingredients for making SPC successful in organisations measuringbusiness excellence”, Measuring Business Excellence, Vol. 4 No. 4, pp. 7-10.
Beardsell, M.L. and Dale, B.G. (1999), “The relevance of total quality management in the foodsupply and distribution industry: a study”, British Food Journal, Vol. 101 No. 3,pp. 190-200.
Bissell, A.F. and Pridmore, W.A. (1981), “The UK average quantity system and its statisticalimplications”, Journal of the Royal Statistical Society, Vol. 144 No. 4, pp. 389-418.
Bjerke, F. (2002), “Statistical thinking in practice: handling variability in experimentalsituations”, Total Quality Management, Vol. 13 No. 7, pp. 1001-14.
Bjerke, F. (2004), “Design of experiments in an industrial setting”, PhD thesis, Dept. of Chemistry,Biotechnology and Food Science, Agricultural University of Norway, Osloveien, p. 125.
Bjerke, F. and Hersleth, M. (2001), “Introducing statistical thinking to the food industry –facilitating and inhibiting factors”, Quality Management Journal, Vol. 8 No. 3, pp. 49-60.
Bjerke, F., Naes, T. and Ellekjaer, M.R. (2000), “An application of projection design in productdevelopment”, Chemometrics and Intelligent Laboratory Systems, Vol. 51, pp. 23-6.
Brannstrom-Stenberg, A. and Deleryd, M. (1999), “Implementation of statistical process controland process capability studies: requirements or free will?”, Total Quality Management,Vol. 10 Nos 4/5, pp. 439-46.
Cheng, P.C.-H. and Dawson, S.D. (1998), “A study of statistical process control: practice, problemsand training needs”, Total Quality Management, Vol. 9 No. 1, pp. 3-20.
Cumbers, A., Leigh, R. and Smallbone, D. (1995), “The single European market and the newregulatory regime in the food sector: the impact on small and medium-sized manufacturingfirms”, British Food Journal, Vol. 97 No. 4, pp. 13-18.
DTI (1979), Code of Practical Guidance for Packers and Importers, HMSO, London.
Dale, B.G., Elkjaer, M.B.F., van der Wiele, A. and Williams, A.R.T. (2001), “Fad, fashion and fit:an examination of quality circles, business process re-engineering and statistical processcontrol”, International Journal of Production Economics, Vol. 73, pp. 137-52.
Deleryd, M., Garvare, R. and Klefsjo, B. (1999), “Experiences of implementing statistical methodsin small enterprises”, The TQM Magazine, Vol. 11 No. 5, pp. 341-50.
Deming, W.E. (1986), Out of the Crisis, Massachusetts Institute of Technology Press, Cambridge,MA.
Does, R.J.M.M., Schippers, W.A.J. and Trip, A. (1997), “A framework for implementation ofstatistical process control”, International Journal of Quality Science, Vol. 2 No. 3, pp. 181-98.
Dougherty, R.A., Pugliese, B.P. and Thomas, J. (1999), The Systems Approach and its IncreasingImportance to Food Production, Processing and Trade, National Seminar on Quality forLeadership – Challenges before Indian Food processing Industry, New Delhi.
Dura, U., Meyer, K. and Untermann, F. (1998), “Microbiological examinations of carcasses as apilot test for statistical process control within the scope of own checks”, Fleischwirtschaft,Vol. 78, pp. 1250-3.
Elg, U. and Johansson, U. (1996), “Networking when national boundaries dissolve: the Swedishfood sector”, European Journal of Marketing, Vol. 30 No. 2, pp. 6-20.
Ellekjaer, M.R., Ilseng, M.A. and Naes, T. (1996), “A case study of the use of experimental designand multivariate analysis in product improvement”, Food Quality and Preference, Vol. 7No. 1, pp. 29-36.
FDF (2005), Industry Statistics, Food and Drinks Federation, available at: www.fdf.org.uk/industrystats.aspx
Performanceimprovement in
the food industry
367

Gauri, S.K. (2003), “Statistical process control procedures for controlling the weight of packets ofbiscuits”, Total Quality Management and Business Excellence, Vol. 14 No. 5, pp. 525-35.
Geise, J. (1999), “All things HACCP and SPC considered”, Food Technology, Vol. 53 No. 1, p. 85.
Gore, R. (1994), “How to turn data into information”, Food Technology International, pp. 73-6.
Grigg, N. (1998), “Statistical process control in UK food production: an overview”, InternationalJournal of Quality and Reliability Management, Vol. 15 No. 2, pp. 223-38.
Grigg, N. and Walls, L. (1999), “The use of statistical process control in food packaging:preliminary findings and future research agenda”, British Food Journal, Vol. 101 No. 9,pp. 763-84.
Grigg, N., Daly, J. and Stewart, M. (1998), “Case Study: the use of statistical process control in fishproduct packaging”, Food Control, Vol. 9 No. 5, pp. 289-97.
Hayes, G.D., Scallan, A.J. and Wong, J.H.F. (1997), “Applying statistical process control tomonitor and evaluate the hazard analysis critical control point hygiene data”, FoodControl, Vol. 8 No. 4, pp. 173-6.
Hobbs, J.E., Kerr, W.A. and Klein, K.K. (1998), “Creating competitiveness through supply chainmanagement: Danish pork”, Supply Chain Management: An International Journal, Vol. 3No. 4, pp. 68-78.
Holt, G. and Henson, S.J. (2000), “Information for good hygiene practices in small business”,British Food Journal, Vol. 102 No. 4, pp. 320-37.
Ittzes, A. (2001), “Statistical process control with several variance components in the dairyindustry”, Food Control, Vol. 12 No. 2, pp. 119-25.
Krumwiede, D. and Sheu, C. (1996), “Implementing SPC in a small organization: a TQMapproach”, Integrated Manufacturing Systems, Vol. 7 No. 1, pp. 45-51.
Kruger, V. (1999), “Towards a European definition of TQM – a historical review”, The TQMMagazine, Vol. 11 No. 4, pp. 257-63.
Lascelles, D. and Dale, B.G. (1986), Proceedings of the Second National Conference for ProductionResearch, Napier College, Edinburgh, pp. 132-45.
Mann, R., Adebanjo, D. and Kehoe, D. (1999), “An assessment of management systems andbusiness performance in the UK food and drinks industry”, British Food Journal, Vol. 101No. 1, pp. 5-21.
Mason, B. and Antony, J. (2000), “Statistical process control: an essential ingredient forimproving service and manufacturing quality”, Managing Service Quality, Vol. 10 No. 4,pp. 233-8.
Matsuno, R. (1995), “The Japanese overview: quality control and its supporting technology”,Food Control, Vol. 6 No. 2, pp. 115-20.
Naes, T., Bjerke, F. and Faergestad, E.M. (1999), “A comparison of design and analysistechniques for mixtures”, Food Quality and Preference, Vol. 10, pp. 209-17.
Negiz, A., Ramanauskas, P., Cinar, A., Schlesser, J.E. and Armstrong, D.J. (1998), “Modelling,monitoring and control strategies for high temperature short time pasteurization systems 3.Statistical monitoring of product lethality and process sensor reliability”,Food Control, Vol. 9No. 1, pp. 29-47.
New, S. and Burnes, B. (1998), “Developing effective customer-supplier relationships: more thanone way to skin a cat”, International Journal of Quality and Reliability Management, Vol. 15No. 4, pp. 377-88.
Ozilgen, M. (1998), “Construction of quality control charts with sub-optimal size samples”, FoodControl, Vol. 9 No. 1, pp. 57-60.
IJQRM24,4
368

Petroni, A. (2000), “Patterns of technological innovation in subcontracting firms: an empiricalstudy in the food machinery industry”, European Journal of Innovation Management,Vol. 3 No. 1, pp. 15-26.
Rademakers, M.F.J. and McKnight, P.J. (1998), “Concentration and inter-firm co-operation withinthe Dutch potato supply chain”, Supply Chain Management: An International Journal,Vol. 3 No. 4, pp. 203-13.
Rungasamy, S., Antony, J. and Ghosh, S. (2002), “Critical success factors for SPC implementationin UK small and medium enterprises: some key findings from a survey”, The TQMMagazine, Vol. 14 No. 4, pp. 217-24.
Rungtusanatham, M., Anderson, J.C. and Dooley, K.J. (1997), “Conceptualizing organizationalimplementation and practice of statistical process control”, Journal of QualityManagement, Vol. 2 No. 1, pp. 113-37.
Rungtusanatham, M., Anderson, J.C. and Dooley, K.J. (1999), “Towards measuring the ‘SPCimplementation/practice’ construct: some evidence of measurement quality”, InternationalJournal of Quality and Reliability Management, Vol. 16 No. 4, pp. 301-29.
Shewhart, W.A. (1926), “Quality control charts”, Bell SystemTechnical Journal, Vol. 5, pp. 593-602.
Snee, R.D. (1990), “Statistical thinking and its contribution to total quality”, The AmericanStatistician, Vol. 44 No. 2, pp. 116-21.
Snee, R.D. (1999), “Discussion: development and use of statistical thinking: a new era”,International Statistical Review, Vol. 67, pp. 255-8.
Srikaeo, K. and Hourigan, J.A. (2002), “The use of statistical process control (SPC) to enhance thevalidation of critical control points (CCPs) in egg shell washing”, Food Control, Vol. 13,pp. 263-73.
Srikaeo, K., Furst, J.E. and Ashton, J. (2005), “Characterization of wheat-based biscuit cookingprocess by statistical process control techniques”, Food Control, Vol. 16, pp. 309-17.
Swan, J. (1997), “Using cognitive mapping in management research: decisions about technicalinnovation”, British Journal of Management, Vol. 8 No. 2, pp. 183-99.
Tielmann, J. (1995), “Constructing and introducing quality management systems – outsideadvice has its advantages”, Fleischwirtschaft, Vol. 75 No. 2, pp. 155-7.
Voss, C., Tsikritsis, N. and Frohlich, M. (2002), “Case research in operations management”,International Journal of Operations and Production Management, Vol. 22 No. 2,pp. 195-219.
Xie, M. and Goh, T.N. (1999), “Statistical techniques for quality”, The TQM Magazine, Vol. 11No. 4, pp. 238-41.
Corresponding authorNigel Peter Grigg can be contacted at: [email protected]
Performanceimprovement in
the food industry
369
To purchase reprints of this article please e-mail: [email protected] visit our web site for further details: www.emeraldinsight.com/reprints


![IMPROVEMENT OF CLASSICAL EVOLUTIONARY ...IMPROVEMENT OF CLASSICAL EVOLUTIONARY PROGRAMMING 1415 Many variants of EP have attempted to boost performance of the CEP [8-13]. They have](https://img.dokumen.tips/doc/110x75/6079fa343fd77612471a3814/improvement-of-classical-evolutionary-improvement-of-classical-evolutionary.jpg)